Abstract
Under the context of global change, forest cover, as a critical component of terrestrial ecosystems, exerts a profound influence on regional ecological security and sustainable development through its spatiotemporal evolution. Current research on forest cover change primarily focuses on pattern description and single-factor driver analysis, with insufficient in-depth exploration of the interactions among multiple factors and their associated nonlinear mechanisms. To address this gap, this study focuses on the Wumeng Mountain area, a typical ecologically fragile karst region in Southwest China. By comprehensively employing methods such as Theil–Sen Median trend analysis, land use transfer matrix, standard deviation ellipse, and spatial autocorrelation analysis, this study systematically reveals the spatiotemporal evolution characteristics of forest cover from 1985 to 2024. On this basis, an integrated eXtreme Gradient Boosting–SHapley Additive exPlanations (XGBoost-SHAP) model is introduced to construct an indicator system comprising 16 driving variables, including elevation, slope, aspect, temperature, precipitation, soil type, soil pH, soil thickness, soil organic matter, soil moisture content, GDP, population, distance from water, distance from railway, distance from grade highway, and distance from government. This model quantifies the influence intensity of each driving factor on forest change. The main findings are as follows: (1) From 1985 to 2024, the forest cover rate in the Wumeng Mountain area significantly increased from 54.7% to 60.2%, exhibiting a “high-low-high” heterogeneous spatial distribution pattern along the northeast-southwest axis; (2) Forest increase primarily originated from the conversion of cropland and grassland, with contribution rates reaching 93.58% and 5.9%, respectively, indicating an overall trend of “increase in low-value areas and decrease in high-value areas”; (3) Forest cover change is driven by both natural and anthropogenic factors, with dominant driving factors exhibiting phased replacement over time. Overall, this is manifested as long-term stable constraints exerted by natural background factors, alongside strong disturbances from anthropogenic factors such as social-economic, and transportation-related activities. Natural factors remain the primary driving force behind changes in forest cover. The core findings of this study elucidate the complex driving factors of forest change in karst mountainous areas, thereby providing scientific support for the precise management of regional forest resources, the planning of ecological restoration projects, and the implementation of sustainable development strategies.
1. Introduction
Against the backdrop of global change and escalating human activities, forest cover, as a crucial indicator of the structure and function of terrestrial ecosystems, has become a core parameter in regional ecological management and environmental monitoring systems [1]. The status of forest cover not only directly affects regional water conservation, carbon sink functionality, and biodiversity maintenance capacity but also plays a key role in regional climate regulation and the construction of ecological security patterns by modulating surface energy exchange and material cycling processes. Particularly in mountainous and ecologically sensitive areas, the dynamic changes in forest cover often exhibit marked spatial heterogeneity and distinct phased characteristics. Consequently, refined monitoring and mechanistic analysis of these changes have become a vital scientific foundation for supporting high-quality regional development and the advancement of ecological civilization [2]. Due to natural constraints such as well-developed surface karst features, shallow and thin soils, weak soil conservation capacity, and uneven spatiotemporal distribution of water resources, karst regions typically possess relatively simple ecosystem structures and low resistance to disturbance. Vegetation restoration and maintenance face considerable challenges, rendering these areas quintessential ecologically fragile zones. In such regions, the state of forest cover is directly linked to the stability of critical functions such as rocky desertification control, soil and water conservation, and ecological barrier services, thereby holding fundamental significance for maintaining regional ecological health and ensuring sustainable socio-economic development. In recent years, driven by accelerated urbanization and population concentration, the expansion of transportation infrastructure, mineral resource extraction, and construction land has intensified pressure on this fragile ecological environment [3]. This has led to increased forest fragmentation in certain areas, reduced ecological connectivity, and a cascade of eco-environmental issues, including the exacerbation of urban heat island effects, declining air quality, worsening soil erosion, and habitat degradation. Therefore, conducting long-term remote sensing monitoring and driver factors analysis of forest cover in karst regions is not only crucial for accurately understanding ecosystem evolution patterns but also provides scientific support for regional ecological restoration and territorial spatial optimization.
Currently, research on forest cover change has established a relatively systematic technical framework both domestically and internationally. In terms of monitoring methods, researchers widely utilize multi-source remote sensing data (e.g., Landsat, MODIS, Sentinel) for forest cover extraction and dynamic change analysis [4,5]. They employ techniques such as supervised classification, object-oriented classification, change detection, and index construction to obtain forest distribution information at different scales, often combined with landscape pattern indices to analyze the evolution of spatial structure. In recent years, with the continuous accumulation of long-time-series remote sensing data and the development of cloud platforms such as Google Earth Engine, the capacity for monitoring forest cover changes across multiple scales and time periods has significantly improved, thereby providing a robust data foundation for revealing ecological change trends over decadal timescales [6]. In terms of driver factor analysis, traditional research has frequently employed methods such as correlation analysis, multiple linear regression, geographically weighted regression (GWR), and Geodetector to explore the influence and spatial differentiation of climatic factors, topographic conditions, socio-economic variables, and policy factors on forest cover change [7,8,9]. While these methods have, to some extent, revealed the dominant factors and spatial differentiation patterns of forest change, they possess inherent limitations in handling high-dimensional, multi-factor coupling and nonlinear relationships, making it difficult to comprehensively characterize the complex multi-interaction results within intricate ecosystems [10,11].
With the advancement of artificial intelligence and big data technologies, machine learning methods are progressively being introduced into land use and ecological environment research. Among these, the eXtreme Gradient Boosting (XGBoost) model, leveraging its advantages in nonlinear fitting capability, feature selection efficiency, and generalization performance, has been widely applied in studies on land cover classification, ecological sensitivity assessment, and driver factor identification [12]. However, traditional machine learning models are often treated as “black boxes.” While they may achieve high prediction accuracy, they struggle to provide clear explanations of variable contributions and the direction of their effects, thereby limiting their in-depth application in ecological research. To address this issue, the SHapley Additive exPlanations (SHAP) method, grounded in game theory, calculates Shapley values for features to achieve an additive decomposition of model outputs [13,14]. This approach not only quantifies the relative contributions of each driving factor but also reveals the direction of variable influence and potential threshold ranges, thereby enhancing model interpretability and its capacity to support scientific decision-making. In recent years, the integrated XGBoost-SHAP model has gradually been applied in the ecological and environmental fields, demonstrating promising results in studies on vegetation cover change, land use transition, and ecological risk assessment [15,16].
A growing body of research has focused on vegetation dynamics and their driving factors in karst regions, primarily employing traditional statistical methods such as residual analysis, partial correlation analysis, principal component analysis (PCA), Geodetector, and GWR [17,18,19,20]. For instance, Zhang et al. utilized Ensemble Empirical Mode Decomposition (EEMD) and Partial Least Squares Regression (PLSR) to reveal the nonlinear, multi-timescale characteristics of vegetation change and its response to climate in the karst region of Southwest China. Liu and Zhang employed trend analysis, residual analysis, and PCA to quantify the effects of human activities, including economic development, labor migration, and urbanization, on vegetation cover change. Yang et al. combined PCA, an optimal parameters-based geodetector (OPGD), and GWR to assess the explanatory power of natural and anthropogenic factors on the spatial differentiation of vegetation change. Yu et al. applied the Mann–Kendall test, time-lag effect analysis, and residual analysis to distinguish the roles of climate change and human activities on vegetation landscape changes at a fine spatial scale. However, most of these studies rely on linear or spatially stationary assumptions, and few have begun to address this limitation by integrating machine learning models with interpretable methods in karst regions. For example, Zhou et al. [21] used the XGBoost-SHAP model to reveal nonlinear impacts of climate change and human activities on ecosystem services in southeastern Yunnan. Zhao et al. [22] used the XGBoost-SHAP model to quantify driving factors and interaction effects of ecological quality in a Guizhou karst watershed. While these studies have advanced the application of interpretable machine learning in karst regions, they have primarily focused on ecosystem services or ecological quality, but have not systematically revealed the complex nonlinear driving factors and interactive effects of forest cover change specifically in karst mountainous areas. Therefore, to address this methodological gap, the present study introduces an XGBoost-SHAP-integrated framework to quantify the influence intensity and direction of natural and anthropogenic factors on forest cover change in the Wumeng Mountain area, a typical ecologically fragile karst region. This area serves as a crucial ecological barrier for the upper reaches of the Yangtze and Pearl Rivers. It is characterized by significant topographic relief, well-developed karst landforms, and pronounced rocky desertification issues. Combined with factors such as mineral resource exploitation, population pressure, and industrial structure transformation, the ecological environment here has long been in a state where recovery and disturbance coexist. Although recent initiatives like the Grain for Green program, rocky desertification control, and ecological restoration projects have led to an overall improvement trend in regional vegetation conditions, several questions remain to be systematically addressed: Does forest cover change in this area exhibit phased characteristics? Are there significant interaction effects between natural and anthropogenic factors? Do key driving factors have thresholds and saturation effects? To address the existing research gaps concerning “insufficient long-term forest cover monitoring in typical karst mountainous areas” and “relatively homogeneous analytical methods for driver mechanism interpretation,” this study takes the Wumeng Mountain area as the research object. It constructs a multi-source geospatial database integrating remote sensing imagery, climatic data, topographic factors, and socio-economic variables. Firstly, long-time-series remote sensing datasets are used to conduct dynamic monitoring and spatiotemporal evolution analysis of forest cover from 1985 to 2024, revealing its phased change trends and spatial pattern characteristics. Secondly, an integrated “natural-anthropogenic” driver indicator system is constructed, and the XGBoost model is introduced to establish a forest cover change prediction framework. The SHAP method is then combined with the model outputs to perform an interpretable analysis, quantifying the contributions, directions of influence, and potential threshold ranges of key driving factors, thereby systematically elucidating the underlying mechanisms of forest cover change. This study is expected to provide a more refined and interpretable theoretical basis for the scientific management of forest resources and decision-making regarding ecological restoration in typical karst mountainous areas.
2. Materials and Methods
2.1. Study Area
The Wumeng Mountain Area (WMA) refers to the “contiguous destitute area of the Wumeng Mountains.” Located in the transitional zone between the Yunnan-Guizhou Plateau and the Sichuan Basin in southwestern China, it serves as a crucial ecological security barrier for the upper reaches of the Yangtze and Pearl Rivers. Spanning the intersection of Yunnan, Guizhou, and Sichuan provinces, it encompasses 38 county-level administrative divisions, extending from 25.3° N to 29.3° N latitude and 101.9° E to 107.3° E longitude, and covers a total area of 105,900 km2 (Figure 1).
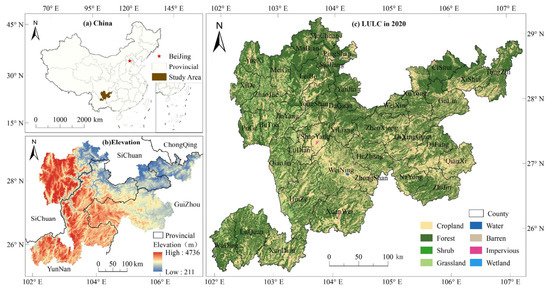
Figure 1.
Study area map. (a) Location of the research area in China; (b) Elevation of the research area; (c) LULC of the research area in 2020.
The WMA lies at the junction of the Tethys–Himalayan and Circum–Pacific tectonic belts, exhibiting a northeast–southwest orientation and extending over 600 km in length. It is a typical plateau–mountain tectonic karst region, where karst areas account for 52.75% of the total area. The karst landforms within the region are complex and diverse, characterized by high rock exposure. Soil types are predominantly red soil and limestone soil, with thin soil layers and low fertility. The climate is a combination of mid-subtropical plateau monsoon climate and a warm-temperate humid monsoon climate, with substantial variation in mean annual temperature and annual precipitation exceeding 1100 mm, though precipitation exhibits notable spatiotemporal heterogeneity. Vegetation types are diverse and display distinct vertical differentiation. The region experiences severe rocky desertification and possesses an extremely sensitive ecological environment. According to the Seventh National Population Census, the region has a total population of 19.38 million and is characterized by a multi-ethnic settlement pattern [23]. Multiple expressways and high-speed railways traverse the area, forming a modern transportation network of considerable scale.
2.2. Data Sources
The data used in this study encompass the following 11 categories, with detailed information provided in Table 1.

Table 1.
Used datasets, sources, and brief descriptions.
Based on Table 1, the detailed information of the data is as follows: (1) LULC data: The China Land Cover Dataset (CLCD) for the years 1985, 1995, 2005, 2015, and 2024 was used, with a spatial resolution of 30 m and an overall accuracy exceeding 80%. This dataset includes nine land use types: cropland, forest, shrub, grassland, water, snow/ice, barren land, impervious surface, and wetland [24]; (2) Elevation data: Derived from the ASTER GDEM dataset [25] obtained from the Geospatial Data Cloud platform. Slope and aspect data for the study area were subsequently generated using slope and aspect calculation tools; (3) Temperature data: Sourced from the China 1 km resolution monthly average temperature dataset [26] provided by the National Tibetan Plateau/Third Pole Environment Data Center. Annual average temperature data for the years 1999, 2000, 2010, and 2020 were obtained through grid calculation; (4) Precipitation data: Sourced from the 1 km resolution annual precipitation dataset of China [27] provided by the Global Resource Data Cloud platform. Annual average precipitation data for the years 1990, 2000, 2010, and 2020 were obtained through raster clipping; (5) Soil type data: Derived from the National Soil Type Dataset [28] provided by the National Earth System Science Data Center; (6) Soil property data: Derived from the Harmonized World Soil Database (HWSD) [29] provided by the National Tibetan Plateau/Third Pole Environment Data Center; (7) GDP data: Sourced from the China GDP Spatial Distribution Dataset [30] provided by the National Tibetan Plateau/Third Pole Environment Data Center; (8) Population data: Sourced from the GHS population grid (R2023) dataset provided by the Joint Research Center of the European Commission [31]; (9) Basic geographic information: Data on roads, railways, water bodies, and government locations were derived from the Basic Geographic Information Dataset of the National Geographic Information Resources Catalog Service System. Euclidean distance tools were subsequently used to generate transportation location factors, including distances to graded roads, railways, water bodies, and county-level government seats; (10) Statistical yearbook data: Derived from the regional statistical yearbooks of the National Bureau of Statistics of China, primarily used to compile information on the completion dates of highways and railways; (11) Administrative division data: Sourced from the National Basic Geospatial Information Service Platform.
To ensure data consistency throughout the research process, all datasets were uniformly resampled to a spatial resolution of 30 m using ArcGIS Pro 3.1 software (Esri, Redlands, CA, USA). The preprocessed data were employed in all subsequent analytical procedures and investigations. The nearest neighbor resampling method was applied to discrete datasets, whereas bilinear interpolation and cubic convolution interpolation methods were applied to continuous datasets.
2.3. Methods
The methodology of this study consists of the following three main components: (1) spatiotemporal change analysis of forest cover; (2) spatial autocorrelation analysis of forest cover; and (3) analysis of the driving factors of forest cover change.
2.3.1. Spatiotemporal Change Analysis of Forest Cover
(1) Theil-Sen Median Trend Analysis: The Theil–Sen median trend analysis is a robust non-parametric statistical method for analyzing time series trends. Owing to its insensitivity to outliers and high computational efficiency, it is widely employed in studies on vegetation change trends [32,33]. This study applies this method to analyze the trend of forest cover change in the study area from 1985 to 2024. The calculation formula is as follows:
where represents the change trend of forest cover between year i and year j; is the forest cover in year i; is the forest cover in year j; and is the median function. When , it indicates an increasing trend in forest cover; when , it indicates a decreasing trend. The significance test of the trend is performed using the Mann–Kendall test, with the following calculation formula:
where denotes the defined sign function; is the test statistic; and represent the forest cover rates of the corresponding years in the study area, respectively; is the total number of forest cover rate observations in the time series; is the corrected variance of the test statistic; is the total number of tied groups (i.e., groups with identical forest cover rate values) in the time series; and is the -th tied group; is the standardized test statistic; denotes the significance value; and represents the cumulative distribution function of the standard normal distribution. In this study, a significance level of or is adopted to evaluate the significance of the observed trend in forest cover rate.
(2) Land Use Transfer Matrix: The land use transfer matrix is employed to quantitatively analyze the direction and magnitude of mutual transformations among different land use types. It not only reflects the specific transfer pathways between distinct land categories but also reveals the structural characteristics of land use change [34,35], thereby enabling a detailed analysis of forest land inflow and outflow. The mathematical form of the land use transfer matrix is as follows:
where M represents the land use area (unit: km2); n is the number of land use types; i and j denote the land use types before and after the study period, respectively; and represents the total area transferred from land use type i to j during the study period.
Based on the land use transfer matrix, the contribution of other land types to forest land inflow and outflow processes can be assessed by calculating the percentage of net change in forest land area attributed to “loss via outflow” or “gain via inflow” across different periods. The formulas for calculating the contribution rates are as follows:
where represents the proportion of the area transferred from land use type i to type j relative to the net decrease in area of row i in the transfer matrix, i.e., the transfer-out contribution rate; represents the proportion of the area transferred from land use type i to j relative to the net increase in area of row i; and and denote the corresponding entries in the transfer matrix located at the i-th row, j-th column and the j-th row, i-th column, respectively.
(3) Standard Deviational Ellipse Analysis: Standard deviational ellipse analysis is a spatial statistical method employed to characterize the spatial distribution patterns of geographic features. It enables the analysis of spatiotemporal distribution characteristics of forest cover in the study area at the county level through parameters including the center point, azimuth angle, and standard deviations along the major and minor axes [36,37]. The semi-major axis reflects the directional trend of forest cover distribution, whereas the semi-minor axis indicates its degree of concentration. The azimuth angle captures the primary directional orientation of the distribution, and the center point denotes the central tendency and spatial clustering characteristics of forest cover. The relevant formulas for calculating the standard deviational ellipse parameters are as follows:
where denotes the weighted mean center coordinates of forest cover at the county level in the study area; and are the standard deviations along the x and y axes, respectively; is the azimuth angle of the generated ellipse; and represent the horizontal and vertical coordinates of the centroid of the i-th county-level object ; and is the forest cover weight assigned to the i-th county.
2.3.2. Spatial Autocorrelation Analysis of Forest Cover
Spatial autocorrelation analysis is employed to characterize and test the spatial distribution patterns of geographic features, encompassing both global spatial autocorrelation and local spatial autocorrelation [38,39].
(1) Global Spatial Autocorrelation Analysis: This study employs the global Moran’s I index to analyze the spatial clustering characteristics of forest cover change at the kilometer grid scale. The formulas for calculating the Moran’s I statistic and the corresponding standardized Z-score are as follows:
where n is the total number of kilometer grids; and are the forest cover change values of kilometer grids i and j, respectively; denotes the mean forest cover change across all kilometer grids; is the spatial weight; is the expected value of the Moran’s I statistic; and denotes the variance of the Moran’s I statistic.
(2) Local Spatial Autocorrelation Analysis: This study employs the Getis-Ord Gi* index to analyze the local spatial clustering patterns of forest cover change at the kilometer grid scale. The calculation formula is as follows:
where and are the forest cover change values for kilometer grids i and j, respectively; n is the total number of kilometer grids; and denotes the distance-based spatial weight.
2.3.3. Analysis of the Driving Factors of Forest Cover Change
(1) XGBoost Model: The eXtreme Gradient Boosting (XGBoost) algorithm is an efficient gradient boosting machine learning method proposed by Chen and Guestrin [40] in 2016. This algorithm constructs a series of decision trees and leverages an ensemble learning framework to optimize computational speed and efficiency. By incorporating regularization techniques and parallel computing strategies, it enhances the accuracy of regression and driving factor prediction while effectively mitigating overfitting, thereby ensuring robust generalization capability [41]. In this study, the XGBoost algorithm is employed with kilometer grid sampling to investigate the simulation and prediction of the effects of natural and anthropogenic independent variables on the dependent variable (i.e., forest cover change). The expression for the minimized objective function is as follows:
where denotes the loss term, which quantifies the discrepancy between the predicted and observed values of forest cover change; and is the regularization penalty term, which constrains the complexity of each regression tree to mitigate overfitting.
(2) SHAP Model: The SHapley Additive exPlanations (SHAP) model is a machine learning interpretability framework based on the Shapley value from cooperative game theory, proposed by Lundberg and Lee [42] in 2017. By calculating the average marginal contribution of each feature across all possible feature coalitions, this model fairly allocates the contribution of each feature to the final model prediction. While ensuring mathematical consistency in contribution attribution, it also satisfies desirable properties including local accuracy, missingness, and consistency, and is widely employed for interpreting complex machine learning models. Although the XGBoost model exhibits excellent simulation and predictive performance, its internal decision-making process remains largely opaque [43]. In this study, the SHAP model is utilized to interpret both the global and local outputs of the XGBoost model, and the contribution of independent variable features to forest cover change is elucidated through visualization of SHAP values, thereby revealing the driving factors underlying spatiotemporal forest cover change in the study area. The formula for calculating the SHAP value is as follows:
where N denotes the set of all features; S is a subset of features that excludes feature i; and represents the model prediction when only the features in subset S are present.
(3) Driving Factor Analysis Framework: Based on the “nature-human activity” conceptual framework, this study selected a total of 16 driving factors: elevation (, slope (), aspect (, temperature , precipitation (), soil type (), soil pH ), soil thickness (, soil organic matter (, soil moisture content (), GDP (), population (), distance from water (), distance from railway (), distance from grade highway (), and distance from government(defined as the nearest distance from county-level or higher government locations) () (Figure 2). With respect to temporal consistency between the driving factor data and the forest cover change data, the following procedures were implemented. For the mean annual temperature, precipitation, GDP density, population density, distance from railways, and distance from registered highways, averaged data corresponding to the periods 1990, 2000, 2010, 2020, and 1990–2020 were used to align with the forest cover change intervals of 1985–1995, 1995–2005, 2005–2015, 2015–2024, and 1985–2024, respectively. For elevation, slope, aspect, soil type, soil pH, soil thickness, soil organic matter, soil moisture content, distance from water bodies, and distance from government locations, temporal variations are considered negligible over the study period. Any changes that may occur within the timeframe of this research are assumed to have minimal influence on the driving factor analysis; therefore, static (time-invariant) data were employed.
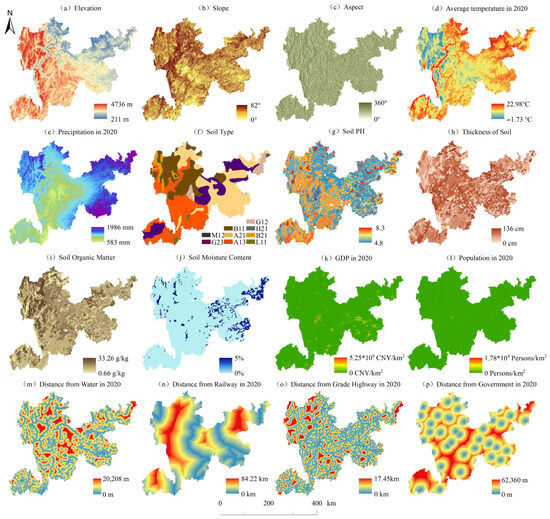
Figure 2.
Spatial distribution of driving factors. (a) Elevation; (b) Slope; (c) Aspect; (d) Average Temperature in 2020; (e) Precipitation in 2020; (f) Soil Type; (g) soil pH; (h) Thickness of Soil; (i) Soil Organic Matter; (j) Soil Moisture Content; (k) GDP in 2020; (l) Population in 2020; (m) Distance from Water in 2020; (n) Distance from Railway in 2020; (o) Distance from Grade Highway in 2020; (p) Distance from Government in 2020.
The XGBoost and SHAP packages in Python version 3.9 (Python Software Foundation, Wilmington, DE, USA) were utilized to analyze the driving factors of spatiotemporal forest cover change in the study area. During model construction and validation, the raw data were first preprocessed by removing samples with missing values and trimming the target variable to the 1st to 99th percentiles to mitigate the influence pf extreme outliers. Subsequently, the dataset was randomly partitioned into training and test sets at an 8:2 ratio, with the ‘random_state’ parameter fixed at 42 to ensure reproducibility. Hyperparameter optimization was conducted using the Optuna framework for Bayesian optimization, with a total of 200 trials. Each trial was constrained to a maximum duration of 7200 s and employed maximization-oriented 5-fold cross-validation, with ‘random_state’ set to 42. The optimization objective was to maximize the mean coefficient of determination (R2). The search ranges for the hyperparameters were specified as follows: ‘n_estimators’ between 500 and 2000; ‘learning_rate’ between 0.001 and 0.2, sampled log-unifromly; ‘max_depth’ between 5 and 20; ‘subsample’ between 0.6 and 1.0; ‘colsample_bytree’ between 0.6 and 1.0; ‘gamma’ (minimum loss reduction required for a split) between 0 and 5; ‘min_child_weight’ between 1 and 15; and the L1 and L2 regularization coefficients (reg_alpha and reg_lambda) between 0 and 5. The model was subsequently retrained on the entire training set using the optimal hyperparameter combination identified through the search procedure. To prevent overfitting during the training, an ‘early_stopping_rounds’ mechanism was implemented. In addition, model performance was evaluated on the independent test set using mean squared error (MSE), root mean squared error (RMSE), mean absolute error (MAE), and mean absolute percentage error (MAPE) to ensure the scientific robustness of the analytical results.
3. Results
3.1. Spatiotemporal Change Characteristics of Forest Cover
3.1.1. Overall Spatiotemporal Change Characteristics of Forest Cover
Based on land use data, a statistical analysis of forest cover in the study area was conducted (Figure 3). From 1985 to 2024, the forest cover rate in the WMA increased progressively from 54.7% to 60.2%, corresponding to a net increase of 5.5% over the 40-year period and an average annual growth rate of 0.14%·a−1. The mean forest cover rate over this interval was 57.55%. Specifically, the forest cover rate reached 56.94% in 1995, representing an increase of 2.24% relative to 1985. The growth rate during 1985–1995 was the highest recorded within the 40-year period, with an average annual growth rate of 0.45%·a−1, more than three times the overall average annual growth rate. In contrast, forest cover expansion was slowest during 1995–2005, with an increase of only 0.28% in 2005 compared with 1995, corresponding to an average annual growth rate of merely 0.057%·a−1, less than half of the overall average annual growth rate. From 1985 to 2024, forest cover in the WMA exhibited pronounced spatial heterogeneity, generally displaying a “high-low-high” distribution pattern along the northeast-southwest axis. Notably, this heterogeneity exhibited a weakening trend over time, which was particularly evident during the period 2005–2024. Areas of high forest cover were predominantly concentrated in Chishui, Xishui, Xuyong, and Gulin in the northeastern part of the WMA; Mabian, Leibo, Pingshan, Suijiang, and Yanjin in the northern part; and Wuding and Luquan in the southwestern part. In contrast, persistently low forest cover was observed in the central counties of Shaoyang and Weining. Although localized decreases in forest cover occurred spatially during the study period, the overall trend was dominated by a net increase. Regions exhibiting forest cover gain were primarily distributed across the northwestern, central, and southern portions of the WMA, whereas scattered areas of decrease were mainly situated in the northern part.
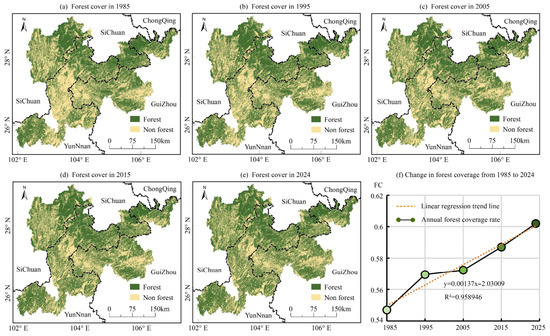
Figure 3.
Spatial distribution of forest cover and forest cover rate statistics in the WMA from 1985 to 2024. (a) WMA’s forest cover in 1985; (b) WMA’s forest cover in 1995; (c) WMA’s forest cover in 2005; (d) WMA’s forest cover in 2015; (e) WMA’s forest cover in 2024; (f) Changes in forest coverage of WMA from 1985 to 2024.
The Theil-Sen median trend analysis of forest cover rate data in the WMA from 1985 to 2024 yielded a Sen’s slope estimate of 0.00137 (>0), indicating an increasing trend in forest cover rate over the study period. Further evaluation using the Mann–Kendall significance test produced the following statistics: S = 10, = 16.67, Z = 2.2045, and p = 0.0275. Given that , the observed change in forest cover rate is characterized by a significant monotonic upward trend. Collectively, the results of the Theil-Sen median trend analysis and the associated significance testing indicate that forest cover in the WMA exhibited a sustained and stable increasing trend from 1985 to 2024.
3.1.2. Characteristics of Forest Cover Transfer
Forest was the dominant land use type in the WMA, followed by cropland, grassland, water bodies, impervious surfaces, barren land, and wetland (Table 2). In 1985, the forest area in the WMA was 57,933.53 km2, accounting for 54.7% of the total area. By 2024, the forest area had expanded to 63,754.89 km2, representing a net increase of 7819.96 km2, representing 7.38% of the total area. From 1985 to 2024, the areas of forest, water bodies, and impervious surfaces increased by 5821.36 km2, 228.55 km2, and 261.58 km2, respectively. Conversely, the areas of cropland, grassland, barren land, and wetland decreased by 1749.11 km2, 4555.37 km2, 6.98 km2, and 0.02 km2, respectively. Over this period, a total of 26,546.26 km2 of land underwent land use conversion. Forest experienced the largest absolute change in area, whereas impervious surfaces exhibited the greatest proportional change relative to their initial extent. With respect to specific land use transfers, the primary source of forest gain was cropland, contributing a converted area of 6539.93 km2 and accounting for 93.58% of the total forest increase. Grassland, water bodies, and impervious surfaces contributed 5.9%, 0.28%, and 0.24%, corresponding to conversion areas of 412.08 km2, 19.81 km2, and 16.67 km2, respectively. The principal destinations for forest loss were cropland and grassland, with areas converted to these two categories totaling 8525.92 km2 and 4276.67 km2, representing transfer-out contribution rates of 66.56% and 33.39%, respectively. Conversions to water bodies, barren land, impervious surfaces, and wetland were negligible, with a combined contribution rate of less than 0.1%. Irrespective of whether forest outflow or inflow is considered, transfers involving cropland accounted for the largest area and highest contribution rate, followed by grassland. The combined contribution of transfers involving water bodies, impervious surfaces, barren land, and wetland remained below 1%.
Table 2.
Land use transfer matrix in the WMA from 1985 to 2024.
3.1.3. Spatiotemporal Change Characteristics of Forest Cover at the County Level
Statistical analysis of forest cover rate at the county level in the WMA revealed pronounced spatiotemporal heterogeneity from 1985 to 2024 (Figure 4). Spatially, the overall pattern was characterized by a “high in the north, low in the south” distribution. The temporal change in forest cover rate generally exhibited a trend of “increase in low-value areas and decrease in high-value areas,” resulting in a progressive attenuation of county-level spatial heterogeneity over time. Moreover, a distinct demarcation line for county-level forest cover rates was identified, extending from Meigu to Zhijin in a roughly northwest–southeast orientation, which closely mirrors the altitudinal gradient of counties across the region. Forest cover rates in the low-altitude eastern and northern areas were generally higher than those in the predominantly high-altitude western and southern areas. However, Wuding and Luquan, situated in the high-altitude southwestern corner, displayed elevated forest cover rates, thereby deviating partially from the spatial pattern of “high forest cover rate in low-altitude areas and low forest cover rate in high-altitude areas.”
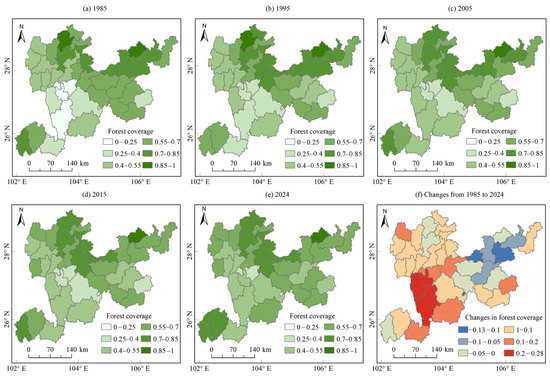
Figure 4.
Forest cover rate and its change magnitude at the county level in the WMA from 1985 to 2024. (a) Forest cover rate in 1985 at the county level; (b) Forest cover rate in 1995 at the county level; (c) Forest cover rate in 2005 at the county level; (d) Forest cover rate in 2015 at the county level; (e) Forest cover rate in 2024 at the county level; (f) Forest cover rate’s changes from 1985 to 2024 at the county level.
With respect to the magnitude of change, Chishui County consistently maintained the highest forest cover rate from 1985 to 2024, although this rate declined from 91.34% to 88.68%, representing a decrease of 2.66 percentage points and a corresponding area reduction of 49.25 km2. From 1985 to 1995, Ludian County, which recorded the lowest forest cover rate, experienced an increase from 17.88% to 26.43%, corresponding to a gain of 8.55 percentage points and an area expansion of 126.75 km2. During the period 2005–2024, Zhongshan County, which exhibited the lowest forest cover rate, underwent a decrease of 3.9 percentage points, equivalent to an area loss of 3.67 km2. Spatially, between 1985 and 2024, a total of 26 counties—including Huize, Ludian, Qiaojia, Qianxi, and Xundian—experienced net increases in forest cover rate, whereas 13 counties—including Gulin, Zhongshan, Weixin, Xuyong, and Qixingguan—recorded net decreases. Counties with declining forest cover rates were predominantly located in low-altitude areas. Among these, Huize County exhibited the largest absolute increase (28.29 percentage points, corresponding to an area gain of 1664.36 km2), while Gulin County displayed the most substantial decrease (−12.87 percentage points, corresponding to an area reduction of 409.48 km2).
Using the spatial statistics tools in ArcGIS Pro 3.1, standard deviational ellipses for county-level forest cover rates in the WMA from 1985 to 2024 were generated, with forest cover rate serving as the weighting variable. The corresponding ellipse parameters were subsequently calculated (Table 3, Figure 5). From 1985 to 2024, the spatial configuration of the standard deviational ellipses exhibited minimal variation, with ellipses consistently located in the north-central portion of the WMA. The ellipse center migrated progressively southwestward, with a cumulative displacement of 9.55 km between 1985 and 2015, followed by a 1.68 km shift in the north-northeast direction from 2015 to 2024. Overall, the magnitude of center displacement remained small, and the ellipse center consistently resided within Yiliang County, in proximity to Weining—the geometric center of the WMA. This spatial pattern indicates an imbalanced distribution of forest cover rates across the WMA, characterized by higher values in the northeast relative to the southwest.
Table 3.
Standard deviational ellipse parameters for county-level forest cover rates in the WMA from 1985 to 2024.
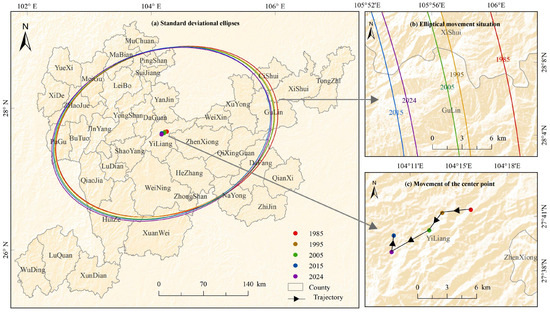
Figure 5.
Standard deviational ellipses for county-level forest cover rates and spatial distribution of center movements in the WMA from 1985 to 2024. (a) Standard deviational ellipses in 1985, 1995, 2005, 2015, and 2024; (b) Ellipses movements from 1985 to 2024; (c) Movements of the center point from 1985 to 2024.
The azimuth angle of the ellipse fluctuated around 71°, signifying a northwest–southeast directional orientation of county-level forest cover rates in the WMA, although this directional tendency weakened over time. The length of the ellipse along the X-axis decreased slightly, whereas the length along the Y-axis increased marginally, suggesting that from 1985 to 2024, the spatial distribution of county-level forest cover rates became more concentrated along the northeast–southwest direction and more dispersed along the northwest–southeast direction. Nevertheless, the overall changes were minor and did not fundamentally alter the established spatial differentiation pattern.
3.2. Spatial Autocorrelation Characteristics of Forest Cover
The spatial autocorrelation analysis of forest cover change in the WMA at the kilometer grid scale from 1985 to 2024 revealed that the global Moran’s I values were greater than 0 for both the entire study period and each sub-period. The corresponding Z-scores were substantially greater than 2.58, and all p-values were considerably less than 0.01. These results indicate that the probability of the observed spatial distribution of forest cover change arising from random chance is less than 1%, and the likelihood of a spatially clustered pattern is markedly higher than that of a random distribution. Consequently, the null hypothesis of spatial randomness can be confidently rejected, demonstrating that forest cover change in the WMA from 1985 to 2024 exhibited a significant positive spatial autocorrelation clustering pattern at the kilometer grid scale.
The results of the local spatial autocorrelation analysis using the Getis-Ord Gi* statistic further revealed the heterogeneity of spatial clustering types for forest cover change in the WMA at the kilometer grid scale from 1985 to 2024 (Figure 6). Based on significance levels, the analysis results were reclassified into seven categories: hot spots at the 99%, 95%, and 90% confidence levels; cold spots at the 99%, 95%, and 90% confidence levels; and non-significant areas. Among these, non-significant areas accounted for the largest proportion and exhibited an increasing trend over time. Hot spots at the 99% confidence level were predominantly distributed in the eastern, northern, northeastern, and central-western portions of the region. Their proportion decreased progressively over time, from 19.28% during 1985–1995 to 13.36% during 2015–2024, with an overall proportion of 13.31% for the entire period 1985–2024. Cold spots at the 99% confidence level were mainly concentrated in localized areas of the northwestern, southern, and northeastern parts of the WMA. Their proportion also declined over time, from 21.88% during 1985–1995 to 12.93% during 2015–2024, with an overall proportion of 14.69% for the period 1985–2024. At each confidence level, the spatial extent of cold spots exceeded that of the corresponding hot spots. Furthermore, the areal coverage of both cold spots and hot spots diminished over time, while their spatial distributions became increasingly clustered. These patterns indicate that from 1985 to 2024, forest cover change in the WMA transitioned from a phase characterized by “localized dramatic changes” to one of “overall gradual evolution,” with the spatial structure of forest cover attaining a relatively stable configuration.
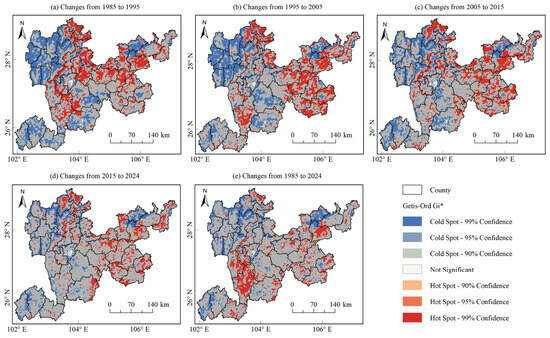
Figure 6.
Spatial distribution of cold and hot spots of forest cover changes in the WMA from 1985 to 2024. (a) Cold and hot spots of forest cover changes from 1985 to 1995; (b) Cold and hot spots of forest cover changes from 1995 to 2005; (c) Cold and hot spots of forest cover changes from 2005 to 2015; (d) Cold and hot spots of forest cover changes from 2015 to 2024; (e) Cold and hot spots of forest cover changes from 1985 to 2024.
3.3. Driving Factors of Spatiotemporal Forest Cover Change
3.3.1. Driving Factors of Forest Cover Change from 1985 to 1995
Figure 7 illustrates the importance, direction of influence, and partial dependence characteristics of the explanatory variables with respect to forest cover change in the WMA, based on 1 km grid sampling data for the period 1985–1995. In terms of variable importance (Figure 7a), precipitation, distance to railways, and GDP emerged as the three most influential driving factors, with mean absolute SHAP values substantially exceeding those of other natural and socioeconomic variables, including slope, aspect, and soil properties. This finding indicates that hydroclimatic conditions, transportation infrastructure development, and economic activity constituted the dominant forces driving the dynamic evolution of regional forest cover in the WMA during 1985–1995. The color gradient of the feature points and the horizontal distribution of SHAP values further reveal that variations in precipitation, distance to railways, and GDP can induce both positive and negative perturbations in model-predicted forest cover change over a broad range, reflecting pronounced intra-factor effect heterogeneity.
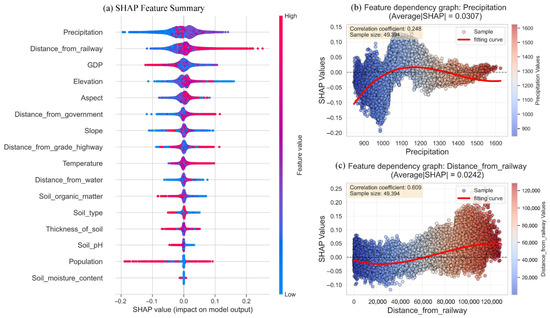
Figure 7.
SHAP feature importance and dependence plots for forest cover change in the WMA from 1985 to 1995. (a) SHAP feature summary; (b) Feature dependency graph of the precipitation; (c) Feature dependency graph of the distance from railway.
With respect to local dependence (Figure 7b), precipitation exhibits a nonlinear positive correlation with SHAP values, yielding a correlation coefficient of 0.248. Overall, increased precipitation markedly enhances the positive contribution to forest cover maintenance and expansion, suggesting that adequate precipitation improves hydrological conditions for vegetation growth and thereby facilitates forest conservation. However, this promoting effect plateaus and exhibits a slight decline when annual precipitation exceeds 1300 mm·a−1, implying that excessive precipitation may exert adverse effects on forest growth. As shown in Figure 7c, distance to railways displays a strong positive correlation with SHAP values, with a correlation coefficient reaching 0.609. With increasing distance from railway infrastructure, SHAP values transition from negative to positive and rise progressively, demonstrating that proximity to railways intensifies negative impacts—such as anthropogenic disturbance, construction land expansion, and forest land encroachment—which substantially inhibit forest vegetation retention. In areas situated farther from railways, human disturbance diminishes markedly, anthropogenic pressure on forest ecosystems is alleviated, and the capacity for forest cover maintenance and restoration is correspondingly enhanced.
3.3.2. Driving Factors of Forest Cover Change from 1995 to 2005
Figure 8 illustrates the importance, directional effects, and partial dependence of the explanatory variables with respect to forest cover change in the WMA from 1995 to 2005, derived from 1 km grid sampling data. In terms of overall variable importance (Figure 8a), elevation, GDP, and precipitation emerged as the dominant drivers of forest cover dynamics, with their mean absolute SHAP values ranking highest among all factors. The overall contributions of these three variables substantially exceeded those of aspect, slope, transportation-related location factors, soil properties, population, and temperature, underscoring the central regulatory role of mountainous topography, macroeconomic conditions, and hydroclimatic factors in forest cover change during this period. The scatter distribution and color gradient further reveal a distinct divergence in the relationship between feature values and SHAP values for these dominant factors: high-value ranges of elevation and GDP predominantly correspond to positive contributions to the model output, whereas low-value ranges tend to exert negative inhibitory effects, with considerable dispersion of intra-factor effects and pronounced driving heterogeneity.
With respect to local feature dependence (Figure 8b), elevation exhibits a markedly strong linear positive correlation with SHAP values, yielding a correlation coefficient of 0.757, and the fitted curve rises steadily with increasing elevation. SHAP values are predominantly negative in low-elevation zones, indicating a substantial constraint on forest cover expansion. As elevation increases, SHAP values transition to positive and continue to ascend, with high-elevation areas exerting a strong positive driving effect on forest cover maintenance and expansion. The underlying mechanism may be attributed to the more intensive human development and land use encroachment on forest land in low-elevation regions, whereas high-elevation areas experience sharply reduced anthropogenic disturbance, and the native mountainous climate and site conditions are more conducive to the development of arbor vegetation communities and the persistence of forest ecosystems.
As shown in Figure 8c, the nonlinear dependence of GDP on forest cover change follows a complex three-stage pattern—rise, decline, and sharp increase—yielding a correlation coefficient of 0.419. In the low-GDP range, modest economic growth is associated with a transient increase in forest cover. With further GDP growth, the fitted curve declines rapidly and SHAP values become distinctly negative, suggesting that intermediate stages of economic development may be accompanied by intensified urbanization, industrialization, and forest land exploitation, thereby exerting strong negative pressure on forest cover. When GDP surpasses a higher threshold, SHAP values rebound swiftly to positive and rise sharply, likely reflecting the enhanced capacity of societies with advanced economic development to invest in ecological protection, restoration, and forest land conservation. This generates a significant positive effect on forest cover recovery and expansion—a pattern characteristic of the Environmental Kuznets Curve (EKC) effect.
3.3.3. Driving Factors of Forest Cover Change from 2005 to 2015
Figure 9 illustrates the importance, directional effects, and partial dependence of the explanatory variables with respect to forest cover change in the WMA from 2005 to 2015, derived from 1 km grid sampling data. In terms of variable importance (Figure 9a), elevation, GDP, and distance to graded highways emerged as the three most influential driving factors, with mean absolute SHAP values substantially exceeding those of aspect, distance to railways, precipitation, temperature, and other natural and socioeconomic variables. This finding confirms that regional topography, macroeconomic development, and the graded highway network collectively dominated forest cover dynamics in the WMA during 2005–2015. The color gradient of the feature distribution and the corresponding SHAP patterns reveal a pronounced divergence between feature values and model output: high-value ranges predominantly correspond to positive contributions, whereas low-value ranges are primarily associated with negative inhibitory effects, with considerable intra-factor dispersion and heterogeneous driving effects across different value levels.

Figure 8.
SHAP feature importance and dependence plots for forest cover change in the WMA from 1995 to 2005. (a) SHAP feature summary; (b) Feature dependency graph of the elevation; (c) Feature dependency graph of the GDP.

A fine-grained analysis of local dependence (Figure 9b) reveals that elevation exhibits a strong positive correlation with SHAP values, yielding a correlation coefficient of 0.669, and the fitted curve rises progressively with increasing elevation. SHAP values are predominantly negative in low-elevation areas (<1000 m), reflecting the intensive anthropogenic disturbances—such as dense human activities, construction land expansion, and forest land encroachment—that strongly constrain forest cover expansion. As elevation increases, SHAP values transition to positive and continue to rise, with high-elevation areas (>2500 m) exerting a pronounced positive driving effect on forest cover. This pattern likely arises because high-elevation zones experience substantially reduced anthropogenic disturbance, and the native mountainous hydrothermal and site conditions are more compatible with forest vegetation growth. Moreover, these areas are less exposed to development pressures emanating from lowland regions, thereby serving as core zones for forest conservation and restoration.
As shown in Figure 9c, the nonlinear dependence of GDP on forest cover change follows a typical inverted U-shaped trajectory (rise followed by decline), yielding a correlation coefficient of 0.579. In the low-GDP stage, infrastructure development associated with early economic growth provides a transient boost to forest cover. As GDP rises to intermediate levels, SHAP values peak and subsequently decline rapidly to distinctly negative values, likely reflecting the acceleration of industrialization and urbanization, which drives the conversion of forest land to construction and agricultural uses, thereby imposing severe pressure on forest ecosystems. When GDP surpasses a higher threshold, SHAP values decline only slightly and remain positive, indicating that advanced economic development affords sufficient investment in ecological protection, forest restoration technologies, and regulatory capacity to effectively mitigate anthropogenic disturbance and sustain forest cover recovery and maintenance.

Figure 9.
SHAP feature importance and dependence plots for forest cover change in the WMA from 2005 to 2015. (a) SHAP feature summary; (b) Feature dependency graph of the elevation; (c) Feature dependency graph of the GDP.

3.3.4. Driving Factors of Forest Cover Change from 2015 to 2024
Figure 10 illustrates the importance, directional effects, and partial dependence of the explanatory variables with respect to forest cover change in the WMA from 2015 to 2024, derived from 1 km grid sampling data. In terms of variable importance (Figure 10a), elevation, precipitation, and distance to railways emerged as the three dominant drivers of forest cover dynamics, with mean absolute SHAP values substantially exceeding those of aspect, slope, temperature, soil properties, socioeconomic factors, and location accessibility metrics. This finding demonstrates that topographic configuration, hydroclimatic conditions, and anthropogenic disturbance associated with railway infrastructure constituted the key controlling factors shaping the spatial pattern and temporal dynamics of regional forest cover during this period. The color gradient of the feature points and the horizontal distribution of SHAP values directly reflect a pronounced divergence in effects between core factor values and model predictions: high values of elevation and precipitation generally correspond to positive contributions to forest maintenance and expansion, whereas low values are predominantly associated with negative inhibitory effects, with a broad distribution of intra-factor effects and remarkably pronounced spatial heterogeneity.
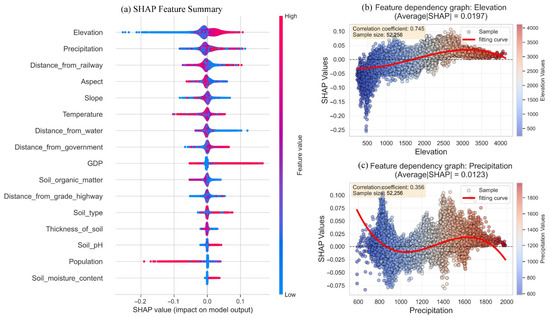
Figure 10.
SHAP feature importance and dependence plots for forest cover change in the WMA from 2015 to 2024. (a) SHAP feature summary; (b) Feature dependency graph of the elevation; (c) Feature dependency graph of the precipitation.
Focusing on local feature dependence (Figure 10b), elevation exhibits an exceptionally strong linear positive correlation with SHAP values, yielding a correlation coefficient of 0.745, and the fitted curve rises steadily with increasing elevation. SHAP values are distinctly negative in low-elevation zones, where flat terrain facilitates the concentration of human settlement and development activities. Intensive anthropogenic disturbances—including urban construction, agricultural reclamation, and forest land encroachment—exert strong suppressive effects on forest cover. With progressive increases in elevation, SHAP values transition from negative to positive and exhibit steady growth. High-elevation areas experience substantially reduced human activity, and the native mountainous hydrothermal and edaphic conditions are more conducive to the development of forest communities and the persistence of forest ecosystems. Consequently, higher elevation reinforces the positive driving effects on forest conservation and areal expansion, with only a slight attenuation of the positive gain observed above 3000 m, while the overall driving contribution remains high.
As illustrated in Figure 10c, precipitation exhibits a complex nonlinear U-shaped relationship with SHAP values, yielding a correlation coefficient of 0.356. In the low-precipitation range (600–900 mm), water availability constitutes a limiting factor for vegetation growth; increasing precipitation rapidly alleviates water stress and markedly promotes forest cover expansion. In the intermediate-precipitation range (900–1300 mm·a−1), the fitted curve descends to relatively low SHAP values, indicating a substantial weakening of the positive driving effect on forest cover. When precipitation increases to 1300–1700 mm·a−1, the combination of adequate water supply and favorable hydrothermal conditions optimizes forest vegetation growth, and the positive contribution rebounds and remains elevated. Beyond 1700 mm·a−1, excessive precipitation may trigger adverse ecological disturbances—such as accelerated soil erosion, increased geological hazard susceptibility, and reduced solar insolation—thereby attenuating the promoting effect on forest cover once again.
3.3.5. Driving Factors of Forest Cover Change from 1985 to 2024
Figure 11 illustrates the importance, directional effects, and partial dependence of the explanatory variables with respect to long-term forest cover change in the WMA from 1985 to 2024, derived from 1 km grid sampling data. In terms of overall variable importance (Figure 11a), elevation, GDP, and temperature emerged as the three core driving factors, with mean absolute SHAP values substantially exceeding those of distance to railways, aspect, slope, precipitation, soil properties, population, and various distance-based location factors. This finding clearly indicates that topographic background conditions and regional socioeconomic development constituted the dominant forces shaping the evolution of forest patterns over this period, with climatic factors such as temperature also playing a key auxiliary regulatory role. The color gradient of the feature scatter points and the distribution of SHAP values reveal pronounced heterogeneity in the effects of the dominant factors. High-value samples of elevation and GDP predominantly correspond to positive contributions to forest conservation, whereas low-value samples are generally associated with significant negative inhibitory effects, exhibiting distinct driving influences across different feature ranges.
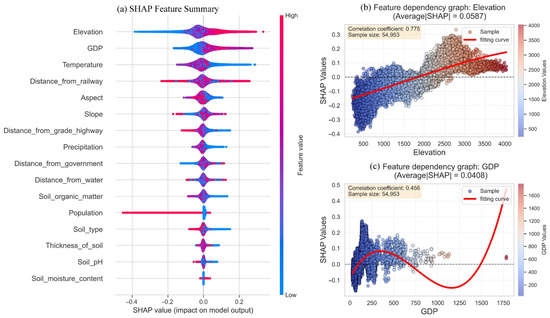
Figure 11.
SHAP feature importance and dependence plots for forest cover change in the WMA from 1985 to 2024. (a) SHAP feature summary; (b) Feature dependency graph of the elevation; (c) Feature dependency graph of the GDP.
With respect to local feature dependence (Figure 11b), elevation displays an exceptionally strong positive linear correlation with SHAP values, yielding a correlation coefficient of 0.775, and the fitted curve exhibits a stable monotonic increase with rising elevation. SHAP values are distinctly negative in low-elevation zones, where flat terrain facilitates the concentration of human production and settlement activities. Intensive anthropogenic disturbances—such as urban expansion, agricultural reclamation, and forest land occupation—exert strong suppressive effects on forest persistence and expansion. With progressive increases in elevation, SHAP values transition to positive and rise steadily. High-elevation areas experience substantially reduced human activity, and greater elevation reinforces the positive driving effects on forest cover.
As shown in Figure 11c, the SHAP dependence curve for GDP follows a typical nonlinear inverted U-shaped pattern characteristic of the Environmental Kuznets Curve, yielding a correlation coefficient of 0.456. In the low-GDP range, modest economic growth is associated with a weak positive effect on forest cover, reflected by a brief rise in SHAP values. During the intermediate stage of economic development, rapid industrialization and urbanization intensify land development pressure, leading to the extensive conversion of forest land to construction and productive uses. This imposes severe stress on forest ecosystems and causes SHAP values to decline sharply to strongly negative values, indicating that this stage represents a period of elevated risk for forest ecological degradation. When economic development surpasses a critical threshold and enters the high-GDP range, the fitted curve rebounds markedly, and SHAP values become strongly positive and rise rapidly. This pattern reflects the capacity of advanced economic development to increase regional investment in ecological protection, enhance forest restoration capabilities, and strengthen ecological regulatory policies. Such developments effectively reverse forest degradation and promote the recovery and qualitative improvement of forest resources, exemplifying the compensatory ecological dividend that may emerge at a certain stage of economic development.
4. Discussion
4.1. Identification of Dominant Driving Forces of Forest Cover Change in the Wumeng Mountain Area
The WMA is situated on the Yunnan–Guizhou Plateau and constitutes a typical plateau–mountain tectonic karst region. Under the combined influence of natural factors—including climate, soil conditions, and the distinctive dualistic hydrological and geological structure characteristic of karst terrains—and anthropogenic factors such as traditional agricultural practices, unregulated mineral resource extraction, and rapid urbanization, the forest resources in this area are particularly valuable. Statistical analysis of forest cover data from 1985 to 2024 reveals that the forest cover rate increased progressively from 54.7% to 60.2%, exhibiting a pronounced and sustained increasing trend. This finding is consistent with the results reported by Feng et al. [44]. Analysis of the spatial distribution characteristics indicates that forest cover displays marked spatial heterogeneity. With the exception of a few localized areas in the southwestern part of the WMA, forest cover is predominantly concentrated in low-altitude zones of the northern and northeastern regions. Statistical examination of county-level forest cover rates further reveals a distinct demarcation line oriented approximately northwest–southeast. Forest cover rates in the low-altitude eastern and northern areas are generally higher than those observed in the high-altitude western and southern areas (excluding several areas in the southwestern corner). This distribution pattern exhibits a significant correlation with regional elevation, thereby corroborating the close relationship between the spatial configuration of forest cover and altitude [45].
The results derived from the XGBoost–SHAP-integrated model reveal that the dominant driving factors governing spatiotemporal changes in forest cover in the WMA from 1985 to 2024 exhibited a pattern of phased replacement and progressive stabilization, concomitant with socioeconomic development and ecological environmental change. During the period 1985–1995, precipitation, distance to railways, and GDP emerged as the key drivers of forest cover change, reflecting the predominant influence of hydroclimatic conditions, early-stage transportation infrastructure, and economic activities. From 1995 to 2005, the driving forces shifted toward elevation, GDP, and precipitation, indicating that the coupled effects of topographic background conditions, socioeconomic factors, and climatic variables began to assume greater prominence. Between 2005 and 2015, elevation, GDP, and distance to graded highways constituted the core drivers, as the expansion of graded transportation networks, in conjunction with accelerating urbanization and industrialization, exerted substantial pressure on forest cover dynamics. From 2015 to 2024, the dominant drivers were elevation, precipitation, and distance to railways, signifying that the constraints imposed by topographic and climatic conditions were once again reinforced, while the impacts of anthropogenic disturbance associated with transportation infrastructure persisted.
Comprehensive analysis of the long-term time series spanning 1985–2024 demonstrates that elevation represents the most stable and persistent core driving factor throughout the entire study period, exhibiting a significant linear positive correlation with forest cover. Low-elevation areas are characterized by pronounced negative effects attributable to high-intensity human development, whereas high-elevation areas benefit from positive driving effects resulting from reduced anthropogenic disturbance and enhanced habitat suitability. GDP exhibits a pattern consistent with the Environmental Kuznets Curve (EKC) effect: during intermediate stages of economic development, forest land experiences substantial negative pressure, whereas at advanced stages of economic development, forest restoration and expansion are facilitated by increased investment in ecological protection and enhanced regulatory capacity. Climatic factors, including precipitation and temperature, along with transportation network variables, alternate in prominence and exert important influences at different stages. Collectively, these findings indicate that both natural and anthropogenic factors jointly drove forest cover change in the WMA from 1985 to 2024. Overall, the observed dynamics are characterized by long-term, stable constraints exerted by natural background factors, punctuated by strong disturbance pulses from socioeconomic and transportation-related activities.
4.2. Implications of Forest Cover Change for Precise Forest Management in Karst Mountainous Areas
Karst ecosystems are among the most significant ecosystems on Earth; however, owing to their distinctive geological, geomorphological, and hydrological characteristics, they are also among the most fragile natural ecosystems globally [46]. Land serves as the environmental foundation for human survival and development, and land use change directly influences ecological processes, thereby inducing shifts in ecosystem service functions [47]. As a critical component of ecosystems in karst mountainous areas, analysis of forest cover change can indirectly elucidate the evolutionary trajectories of forest ecosystems in these regions, thereby contributing positively to the sustainable management of forest resources and ecosystem regulation [48].
From 1985 to 2024, forest cover in the WMA exhibited a pronounced overall increasing trend. The expansion of forest area has exerted positive effects on ecosystem services, including regional climate regulation, hydrological cycling, soil conservation, and habitat quality enhancement [49]. Approximately 99% of the forest increase originated from the conversion of cropland and grassland, with areas transferred to forest reaching 8525.92 km2 and 4276.67 km2, respectively. The total transferred area exceeded 22% of the forest cover extent recorded in 1985. Since 1978, several nature reserves—including Dafengding, Shizishan, Yunnan Wumengshan, Suoluo, and Mamize—have been established in counties such as Mabian, Wuding, Chishui, Daguan, and Leibo. The enforcement of stringent area closure policies within these reserves has effectively stabilized existing forest resources. For dominant and ecologically significant forest resources exhibiting concentrated spatial distributions, the designation of nature reserves coupled with rigorous closure measures constitutes a critical strategy for ensuring the stable development of forest resources in key ecological zones. Since the implementation of the Grain for Green Program in 1999, local governments in the WMA have undertaken extensive conversion of cropland to forest on steep slopes and in areas severely affected by rocky desertification. The analytical results presented herein corroborate the substantial effectiveness of this policy. Furthermore, the execution of afforestation and reforestation initiatives has facilitated the conversion of considerable grassland areas to forest, thereby further augmenting forest cover. In 2018, the WMA pilot ecological restoration project encompassing mountains, rivers, forests, farmlands, lakes, and grasslands was launched. This systematic ecological protection and restoration program not only further increased regional forest cover but also optimized the spatial configuration of forest distribution, attenuating the northwest–southeast spatial differentiation induced by factors such as elevation and markedly improving the overall quality of the regional ecological environment. Relevant studies indicate that systematic ecological protection and restoration projects are more effective in addressing regional ecological and environmental challenges and in enhancing ecosystem service capacity [50]. The implementation of ecological protection and restoration initiatives—including natural forest conservation, the Grain for Green Program, afforestation and greening campaigns, area closure management, and the establishment of nature reserves—has likely exerted a positive influence on forest cover change in the WMA from 1985 to 2024.
Given the distinctive characteristics of karst mountainous ecosystems, forest resources in such regions are particularly valuable. Forest cover exhibits pronounced spatial heterogeneity, with concentrated distributions in certain areas, and forest change is driven by the interplay of both natural and anthropogenic factors. Accordingly, for spatially concentrated or ecologically significant forest resources, core protection zones should be designated to implement area closure measures, thereby effectively preventing human-induced degradation. In areas affected by rocky desertification, steep-slope cultivation, or forest degradation, ecological restoration zones should be delineated, and systematic engineering-based restoration measures should be implemented in a manner tailored to the principal ecological and environmental challenges present. The deployment of area closure protection and engineering restoration interventions should be planned in a holistic and systematic manner, with due consideration given to the influence thresholds, saturation effects, and synergistic and antagonistic interactions among the various driving factors that govern forest change. Integrating field surveys with remote sensing technologies, regular monitoring and assessment should be conducted, enabling timely responses to emerging issues. The integrated management framework of “area closure protection + engineering restoration + monitoring and evaluation” constitutes a critical strategy for ensuring the stability of forest resources in key ecological zones and for achieving the sustainable development of forest resources in karst mountainous regions.
4.3. Limitations and Prospects
This study is subject to certain limitations concerning data, methodology, and spatiotemporal scales. Future research may be advanced along the following directions.
Regarding data, although the land use information was derived from the CLCD dataset, there remains scope for improving classification accuracy, particularly for earlier time periods, which may be constrained by the quality of available remote sensing imagery and the limitations of interpretation techniques. Future work could incorporate higher-resolution remote sensing data and ground-based survey information to enhance classification precision and dynamic monitoring capabilities. Furthermore, several driving factors (e.g., soil properties and spatially explicit GDP data) exhibit inherent spatiotemporal lags; future studies would benefit from the integration of dynamic datasets with finer spatiotemporal resolution. Regarding methodology, while the XGBoost–SHAP-integrated framework effectively quantifies feature contributions, its capacity to elucidate interactions among features remains somewhat implicit. Future investigations could couple this approach with locally interpretable models or structural equation modeling to further disentangle the nonlinear and interactive effects operating among multiple drivers. In addition, the present study did not incorporate qualitative information such as policy documents or social survey data; future work could integrate mixed-methods research designs to strengthen the human-dimension analysis of driving factors. Regarding spatiotemporal scales, this study employed counties and kilometer grids as the fundamental analytical units, which may not fully resolve micro-topographic variations and localized anthropogenic activity patterns. Future research could integrate unmanned aerial vehicle (UAV) remote sensing with field-based monitoring to conduct high-precision process studies within representative sample areas. Moreover, the influence of climate change and extreme weather events on forest dynamics has yet to be explored in depth. Future studies could couple climate models with ecological process models to facilitate multi-scenario simulations and predictive assessments.
5. Conclusions
This study aimed to elucidate the spatiotemporal evolution characteristics and driving factors of forest cover in the Wumeng Mountain Area. By comprehensively employing spatial analysis techniques and the XGBoost–SHAP-integrated modeling framework, the dynamic changes in forest cover across this region from 1985 to 2024 were systematically examined. The principal findings are summarized as follows: (1) From 1985 to 2024, the forest cover rate in the Wumeng Mountain Area increased significantly from 54.7% to 60.2%, exhibiting a pronounced upward trend. Spatially, forest cover displayed a significant positive spatial autocorrelation clustering pattern, forming a “high–low–high” heterogeneous distribution along the northeast–southwest axis. Nevertheless, the degree of spatial differentiation attenuated progressively over time. (2) The increase in forest cover was primarily attributable to the conversion of cropland and grassland, with cropland conversion accounting for 93.58% of the total forest gain, thereby reflecting the substantial effectiveness of ecological restoration initiatives such as the Grain for Green Program. Forest cover loss was predominantly directed toward cropland and grassland, indicating a discernible process of forest–farmland dynamics, and this transfer process exhibited distinct spatial clustering characteristics. Overall, the change in forest cover rate conformed to a pattern of “increase in low-value areas and decrease in high-value areas.” (3) Forest cover change in the study area is jointly driven by both natural and anthropogenic factors, with the dominant driving factors undergoing phased replacement over the study period. The overall pattern is characterized by persistent, long-term constraints imposed by natural background factors, alongside pronounced disturbances emanating from socioeconomic and transportation-related activities. Elevation emerged as the most stable core driving factor throughout the entire period and exhibited a significant positive correlation with forest cover. GDP displayed a pattern consistent with the Environmental Kuznets Curve effect: intermediate stages of economic development exerted suppressive pressure on forest cover, whereas advanced stages facilitated forest recovery and expansion. Climatic factors and transportation-related variables alternated in prominence, playing critical regulatory roles during different phases of the study period.
Author Contributions
Conceptualization, L.Y., H.C. and Y.Z.; methodology, L.Y., J.J., Y.H. and H.C.; software, L.Y. and J.J.; validation, J.J.; formal analysis, L.Y., X.Z., H.C., L.Z. and Y.Z.; investigation, Y.H.; resources, L.Y.; data curation, L.Y., Y.H., X.Z. and L.Z.; writing—original draft preparation, L.Y.; writing—review and editing, J.J.; visualization, L.Y.; supervision, J.J.; project administration, L.Y.; funding acquisition, L.Y. All authors have read and agreed to the published version of the manuscript.
Funding
This research was funded by the Science and Technology Support Project of Guizhou Bureau of Geology and Mineral Resources (No. Qian Di Kuang Ke He [2024] 19, 20, and No. Qian Di Zhi Ke He [2025] 23, 24), Guizhou Provincial Science and Technology Program (No. QianKeHe Support [2023] General 169), and National Natural Science Foundation of China (No. 42501397).
Institutional Review Board Statement
Not applicable.
Informed Consent Statement
Not applicable.
Data Availability Statement
The data presented in this study are available on request from the corresponding author.
Acknowledgments
We thank all data providers and platforms for providing the administrative division data and geospatial products. We thank Deepseek AI tool (version: DeepSeek-V3, DeepSeek, Hangzhou, China) for improving the English writing and checking grammar errors.
Conflicts of Interest
The authors declare no conflicts of interest.
References
- Zhang, W.; Chen, A. Forest Carbon Dynamics as a Constraint on Future Land-Use and Land-Cover Change. Glob. Change Biol. 2025, 31, e70628. [Google Scholar] [CrossRef]
- Duan, R.; Zhao, Y.; Tang, R.; Wang, Z. Impacts of Landscape Lighting on Karst Ecosystems and Sustainable Lighting Strategies: A Case Study of Zhangguan Cave, Southwestern China. Geoheritage 2025, 17, 107. [Google Scholar] [CrossRef]
- Tao, S.; Peng, W.; Xiang, J. Spatiotemporal variations and driving mechanisms of vegetation coverage in the Wumeng Mountainous Area, China. Ecol. Inform. 2022, 70, 101737. [Google Scholar] [CrossRef]
- Mishkin, M.; Pacheco, J.A.N. Rapid assessment remote sensing of forest cover change to inform forest management: Case of the Monarch reserve. Ecol. Indic. 2022, 137, 108729. [Google Scholar] [CrossRef]
- Aziz, G.; Minallah, N.; Saeed, A.; Frnda, J.; Khan, W. Remote sensing based forest cover classification using machine learning. Sci. Rep. 2024, 14, 69. [Google Scholar] [CrossRef] [PubMed]
- Kaur, H.; Tyagi, S.; Mehta, M.; Singh, D. Time series (2001/2002–2021) analysis of Earth observation data using Google Earth Engine (GEE) for detecting changes in land use land cover (LULC) with specific reference to forest cover in East Godavari Region, Andhra Pradesh, India. J. Earth Syst. Sci. 2023, 132, 20. [Google Scholar] [CrossRef]
- Wahelo, T.T.; Mengistu, D.A.; Merawi, T.M. Spatiotemporal trends and drivers of forest cover change in Metekel Zone forest areas, Northwest Ethiopia. Environ. Monit. Assess. 2024, 196, 1170. [Google Scholar] [CrossRef]
- Bongasie, A.; Dhakal, T.; Ayalew, A.; Kim, T.-S.; Lee, Y.; Jang, G.-S. Analysis of forest cover change and its driving factors in Senan district, Amhara Region, Ethiopia. Environ. Monit. Assess. 2024, 196, 339. [Google Scholar] [CrossRef]
- Loran, C.; Kienast, F.; Bürgi, M. Change and persistence: Exploring the driving forces of long-term forest cover dynamics in the Swiss lowlands. Eur. J. For. Res. 2018, 137, 693–706. [Google Scholar] [CrossRef]
- Liu, R.; Wang, Q.; Kong, H.; Li, Y. Priority protected areas for mangrove conservation in coastal Guangdong, China: Addressing climate and land cover changes. Ocean Coast. Manag. 2025, 267, 107707. [Google Scholar] [CrossRef]
- Rodman, C.K.; Crouse, E.J.; Donager, J.J.; Huffman, D.W.; Meador, A.J.S. Patterns and drivers of recent land cover change on two trailing-edge forest landscapes. For. Ecol. Manag. 2022, 521, 120449. [Google Scholar] [CrossRef]
- Akinci, A.H.; Akinci, H.; Zeybek, M. Comparison of diverse machine learning algorithms for forest fire susceptibility mapping in Antalya, Türkiye. Adv. Space Res. 2024, 74, 647–667. [Google Scholar] [CrossRef]
- Takefuji, Y. Beyond the black box: Enhancing feature explainability in machine learning with SHAP and complementary approaches. Comput. Electron. Agric. 2026, 240, 111226. [Google Scholar] [CrossRef]
- Yu, D.; Zhou, Z.; Chen, M.; Liu, J.; Wang, N.; Zhu, B.; Cao, Y. Identifying the driving mechanisms of ecosystem health in a typical ecologically fragile region: A study based on the XGBoost–SHAP model. Ecol. Indic. 2025, 181, 114472. [Google Scholar] [CrossRef]
- Liu, Y.; Samat, A.; Du, P.; Chen, J.; Abuduwaili, J.; Luo, K.; Zhu, E.; Shokparova, D. High-resolution spatiotemporal analysis and driver attribution of floods in Kazakhstan using SHAP and remote sensing integration. Clim. Risk Manag. 2025, 51, 100783. [Google Scholar] [CrossRef]
- Mohammed, K.; Kpienbaareh, D.; Kerr, R.B.; Wang, J.; Luginaah, I.; Lupafya, E.; Dakishoni, L.; Mkandawire, M. Integrating participatory GIS, remote sensing, and explainable machine learning to assess forest provisioning services. Environ. Impact Assess. Rev. 2025, 117, 108245. [Google Scholar] [CrossRef]
- Zhang, M.; Deng, Z.; Yue, Y.; Wang, K.; Liu, H.; Zhang, C.; Qi, X. Nonlinear characteristics of the vegetation change and its response to climate change in the karst region of southwest China. Prog. Phys. Geogr. 2022, 46, 497–514. [Google Scholar] [CrossRef]
- Liu, Z.; Zhang, Y. Vegetation cover change and its response to human activities in the southwestern karst region of China. Front. Ecol. Evol. 2024, 12, 1326601. [Google Scholar] [CrossRef]
- Yang, S.; Zhao, Y.; Yang, D.; Lan, A. Analysis of Vegetation NDVI Changes and Driving Factors in the Karst Concentration Distribution Area of Asia. Forests 2024, 15, 398. [Google Scholar] [CrossRef]
- Yu, M.; Song, S.; He, G.; Shi, Y. Vegetation Landscape Changes and Driving Factors of Typical Karst Region in the Anthropocene. Remote Sens. 2022, 14, 5391. [Google Scholar] [CrossRef]
- Zhou, B.; Chen, G.; Yu, H.; Zhao, J.; Yin, Y. Revealing the Nonlinear Impact of Human Activities and Climate Change on Ecosystem Services in the Karst Region of Southeastern Yunnan Using the XGBoost–SHAP Model. Forests 2024, 15, 1420. [Google Scholar] [CrossRef]
- Zhao, Z.; Lei, Y.; Jiang, X.; Leng, Y.; Li, W.; Zhao, W. Explainable machine learning reveals drivers of ecological quality in a karst watershed: Implications for sustainable management of the Mawei river basin, China. Int. J. Digit. Earth 2025, 26, 876. [Google Scholar] [CrossRef]
- Zhang, Y.H.; Hou, H.L.; Shen, Y.; Dong, Y. Study on the functional division of mineral resources development and poverty alleviation policy in Wumeng Mountain Area. Resour. Sci. 2018, 40, 1716–1729. [Google Scholar]
- Yang, J.; Huang, X. The 30 m annual land cover dataset and its dynamics in China from 1990 to 2019. Earth Syst. Sci. Data 2021, 13, 3907–3925. [Google Scholar] [CrossRef]
- Abrams, M.; Crippen, R.; Fujisada, H. ASTER Global Digital Elevation Model (GDEM) and ASTER Global Water Body Dataset (ASTWBD). Remote Sens. 2020, 12, 1156. [Google Scholar] [CrossRef]
- Peng, S.Z.; Ding, Y.; Liu, W.; Li, Z. 1 km monthly temperature and precipitation dataset for China from 1901 to 2017. Earth Syst. Sci. Data 2019, 11, 1931–1946. [Google Scholar] [CrossRef]
- Global Resource Data Cloud. 1-Km Resolution Annual Precipitation Dataset of China (1901–2022). Available online: https://www.gis5g.com/dataResourceDetail?resourcesId=243 (accessed on 15 October 2025).
- Wei, S.; Dai, Y.; Liu, B.; Zhu, A.; Duan, Q.; Wu, L.; Ji, D.; Ye, A.; Yuan, H.; Zhang, Q.; et al. A China Dataset of Soil Properties for Land Surface Modeling. J. Adv. Model. Earth Syst. 2022, 5, 212–224. [Google Scholar]
- Meng, X.; Wang, H. Siol Map Based Harmonized World Soil Database; National Tibetan Plateau/Third Pole Environment Data Center: Beijing, China, 2023. [Google Scholar]
- Yi, L.; Xiong, L.; Yang, X. Method of pixelizing GDP data based on the GIS. J. Gansu Sci. 2006, 18, 54–58. [Google Scholar]
- Joint Research Centre of the European Commission. GHS Population Grid (R2023); Joint Research Centre of the European Commission: Ispra, Italy, 2023. [Google Scholar]
- Tran, D.X.; Tran, T.V.; Pearson, D.; Myint, S.W.; Lowry, J.; Nguyen, T.T. Spatiotemporal analysis of forest cover change and associated environmental challenges: A case study in the Central Highlands of Vietnam. Geocarto Int. 2021, 37, 9277–9297. [Google Scholar] [CrossRef]
- Huang, L.; Huang, Z.; Li, X.; Mao, F.; Song, M.; Zhao, Y.; Ye, F.; Lv, L.; Yu, J.; Du, H. Centennial spatiotemporal evolution of AGC in subtropical forests and key driving factors—based on process modeling and geography detector. Ecol. Indic. 2025, 178, 114040. [Google Scholar] [CrossRef]
- Wu, C.; Chen, B.; Huang, X.; Wei, Y.D. Effect of land-use change and optimization on the ecosystem service values of Jiangsu province, China. Ecol. Indic. 2020, 117, 106507. [Google Scholar] [CrossRef]
- Ji, Z.; Ren, H.; Zha, C.; Adem, E.S. Monitoring Spatio-Temporal variations of ponds in typical rural area in the Huai River basin of China. Remote Sens. 2023, 16, 39. [Google Scholar] [CrossRef]
- Berdimbetov, T.; Shelton, S.; Pushpawela, B.; Rathnayake, U.; Koshim, A.G.; Yegizbayeva, A.; Nietullaeva, S. Use of intensity analysis and transfer matrix to characterize land conversion in the Aral Sea Basin under changing climate. Model. Earth Syst. Environ. 2024, 10, 4717–4729. [Google Scholar] [CrossRef]
- Chen, Z.; Zhu, H.; Zhao, W.; Zhao, M.; Zhang, Y. Spatial agglomeration of China’s forest products manufacturing industry: Measurement, characteristics and determinants. Forests 2021, 12, 1006. [Google Scholar] [CrossRef]
- Zhou, J.; Feng, B.; Wu, H.; Zhang, Z.; Chen, L.; Li, J.; Chen, X.; Kong, Y.; Meng, Z.; Kong, X. Spatio-temporal distribution characteristics and driving factors of forest land in the Da-Xiao Liangshan mountains based on topographic gradient. Sci. Rep. 2025, 15, 7501. [Google Scholar] [CrossRef]
- Song, C.; Yu, Q.; Jin, K. Forest resource Quality and human activity intensity change and spatial autocorrelation analysis in Yulin City, China. Forests 2023, 14, 1929. [Google Scholar] [CrossRef]
- Chen, T.; Guestrin, C. XGBoost: A scalable tree boosting system. In Proceedings of the 22nd ACM SIGKDD International Conference on Knowledge Discovery and Data Mining, San Francisco, CA, USA, 13–17 August 2016; pp. 785–794. [Google Scholar]
- Jin, G.; Zhang, J.; Gong, Y.; Yang, K.; Quan, W.; Li, L.; Wu, Y.; Wang, R.; Cheng, H. A robust soil quality index for mountain ecosystems driven by XGBoost and network analysis. Geoderma 2025, 463, 117558. [Google Scholar] [CrossRef]
- Lundberg, S.M.; Lee, S.I. A unified approach to interpreting model predictions. In Proceedings of the 31st International Conference on Neural Information Processing Systems, Long Beach, CA, USA, 4–9 December 2017; pp. 4768–4777. [Google Scholar]
- Ansari, M.G.I.; Safiullah, D.; Cao, J.; Wu, S. Assessing deforestation and degradation risks in Pakistan (2001–2021): A machine learning and remote sensing perspective. Environ. Technol. Innov. 2025, 40, 104539. [Google Scholar] [CrossRef]
- Feng, D.; Wang, S.; Zhao, Y.; Feng, Z. Analysis of Changes in China’s Forest Resources and Age Group Optimization. J. Southwest For. Univ. 2023, 43, 122–131. [Google Scholar] [CrossRef]
- Zhang, J.; Xin, R.; Wang, H. The impact of urban expansion and terrain factors on plant species diversity in urban wilderness woodlands of mountain cities: A case study of central Chongqing. Acta Ecol. Sin. 2026, 46, 3764–3776. [Google Scholar] [CrossRef]
- Shen, W.; Sun, Y.; Li, J.; Zhang, H.; Ding, Z.; Tang, X. Monitoring spatio-temporal dynamics of multi-dimensional karst ecosystem quality in Southwest China by integrating multi-source data. Int. J. Digit. Earth 2024, 17, 2356119. [Google Scholar] [CrossRef]
- Schirpke, U.; Tasser, E.; Borsky, S.; Braun, M.; Eitzinger, J.; Gaube, V.; Getzner, M.; Glatzel, S.; Gschwantner, T.; Kirchner, M.; et al. Past and future impacts of land-use changes on ecosystem services in Austria. J. Environ. Manag. 2023, 345, 118571. [Google Scholar] [CrossRef]
- Fu, B.; Deng, L.; Sun, W.; He, H.; Li, H.; Wang, Y.; Wang, Y. Quantifying vegetation species functional traits along hydrologic gradients in karst wetland based on 3D mapping with UAV hyperspectral point cloud. Remote Sens. Environ. 2024, 307, 114139. [Google Scholar] [CrossRef]
- Feng, Q.; Yang, H.; Liu, Y.; Liu, Z.; Xia, S.; Wu, Z.; Zhang, Y. Interdisciplinary perspectives on forest ecosystems and climate interplay: A review. Environ. Rev. 2025, 33, 1–21. [Google Scholar] [CrossRef]
- Yin, R.; Wang, Z.; Chai, J.; Gao, Y.; Li, H.; Hu, H. An integrated protection and systemic governance framework for mountains, rivers, forests, fields, lakes, grasses, and sands based on the perception of “Resources” and “Assets”. Acta Ecol. Sin. 2026, 46, 2441–2454. [Google Scholar] [CrossRef]


Disclaimer/Publisher’s Note: The statements, opinions and data contained in all publications are solely those of the individual author(s) and contributor(s) and not of MDPI and/or the editor(s). MDPI and/or the editor(s) disclaim responsibility for any injury to people or property resulting from any ideas, methods, instructions or products referred to in the content. |
© 2026 by the authors. Licensee MDPI, Basel, Switzerland. This article is an open access article distributed under the terms and conditions of the Creative Commons Attribution (CC BY) license.