Article

Soils Carbon Stocks and Litterfall Fluxes from the Bornean Tropical Montane Forests, Sabah, Malaysia

1
Faculty of Tropical Forestry, Universiti Malaysia Sabah, Kota Kinabalu 88400, Sabah, Malaysia
2
Faculty of Sustainable Agriculture, Universiti Malaysia Sabah, Sandakan Branch, Locked Bag No. 3, Sandakan 90509, Sabah, Malaysia
*
Authors to whom correspondence should be addressed.
Forests 2021, 12(12), 1621; https://doi.org/10.3390/f12121621
Submission received: 22 October 2021 / Revised: 13 November 2021 / Accepted: 17 November 2021 / Published: 24 November 2021
(This article belongs to the Section Forest Soil)

Abstract

:
Tropical forests play an important role in carbon storage, accumulating large amounts of carbon in their aboveground and belowground components. However, anthropogenic land-use activities have increasingly threatened tropical forests, resulting in accelerated global greenhouse gas emissions. This research aimed to estimate the carbon stocks in soil, organic layer, and litterfall in tropical montane forests under three different land uses (intact forest, logged-over forest, and plantation forest) at Long Mio, Sabah, Malaysia. Field data were collected in a total of 25 plots from which soil was randomly sampled at three depths. Litterfalls were collected monthly from November 2018 to October 2019. The results showed that the soil in the study area is Gleyic Acrisol, having pH values ranging between 4.21 and 5.71, and high soil organic matter contents. The results also showed that the total soil carbon stock, organic layer, and litterfall is higher in the intact forest (101.62 Mg C ha−1), followed by the logged-over forest (95.61 Mg C ha−1) and the plantation forest (93.30 Mg C ha−1). This study highlights the importance of conserving intact forests as a strategy to sequester carbon and climate change mitigation.

1. Introduction

Carbon makes up around 0.03 percent of the Earth’s lithosphere and moves along its reservoir through a process called the global carbon cycle [1,2]. The terrestrial biosphere is one of the major carbon pools in the carbon cycle, with a total carbon stock of 1700 PgC [3]. The terrestrial biosphere is mainly dominated by forest ecosystems, which cover about 4.06 billion hectares or approximately 31 percent of the world’s total land area [4]. The tropical rainforest biome occupies the largest forested area, about 45 percent, compared to other biomes such as boreal, temperate, and subtropical [5]. Almost 25%–50% of tropical rainforest areas are lost and degraded due to land use activities such as mining, conversion to agricultural lands, pastures, and housing areas [6]. As the terrestrial ecosystem stores most of its carbon inside its living biomass and soil, these changes directly affect its role in carbon sequestration and climate change mitigation [7,8,9,10].
Deforestation and conversion of natural forests to agricultural lands are prime examples of land use activities that have the most severe impact on carbon sequestration in tropical rainforests [11]. Owing to these anthropogenic activities, the world’s forests become a net source of carbon, which was estimated at approximately 1.8 Gt C per year while 20 percent of it comes from tropical deforestation [12].
Besides reduction in forest carbon stock, anthropogenic activities also adversely affect the soil ecosystem functions. Soil is the gene’s pool core and habitat for living creatures. It also acts as a filter, storage, and transformation site for substances such as water, nutrients for plant growth. In addition, soil also could store an enormous amount of carbon inside [13,14,15]. The soil can store 3.3 times more carbon than the atmospheric carbon pools and 4.5 times higher than the biotic carbon pools such as microorganisms and the living vegetations [16]. This huge value just shows how important it is to conserve and protect the soil ecosystem from being disturbed by human activity. Nevertheless, soil ecosystems have been increasingly threatened around the world.
Ten soil threats have been listed in the Status of the World’s Soil Resources [17]. The three most severe threats are soil erosion, soil organic carbon changes, and nutrient imbalance [18]. The main causes affecting soil organic carbon stocks are unsupervised logging management and conversion of natural forests to agricultural land. The forest-to-agriculture activities completely remove the forest vegetation while logging activities create numerous canopy openings in the forest. Loss of forest vegetation leads to increased soil temperature that causes the organic matter from forest vegetation (leaf litter, tree branches, and deadwood) to decay more rapidly and eventually reduces the amount stored in the soil [13]. As a result, the carbon stored in the soil is reduced and released into the atmosphere [19]. Globally, soil organic carbon loss due to anthropogenic land use activities ranges from 0.7 to 2.1 Gt C per year and these values are equivalent to 10 to 20 percent of total global carbon dioxide emissions [20,21].
In Borneo, lowland rainforests have been intensively logged and converted to agricultural plantations [22]. Even the mangrove forests are increasingly threatened by deforestation activities [23]. The anthropogenic disturbances have extended to the montane rainforests near the international borders between Malaysia and Indonesia [24]. These activities have adversely affected biodiversity [11] and resulted in aboveground biomass or carbon losses in montane rainforests [25]. Nevertheless, the impacts of anthropogenic activities on the soil carbon stocks of the montane rainforest ecosystem remain largely unknown.
Typically, forest and grassland areas are among the land covers that possess a high amount of soil organic carbon [26]. Tropical forests, in particular, store 56% of carbon in their biomass and 32% in the soil [27]. According to Abdullahi et al. [28], the soil carbon pool accounts for 36%–46% of the total carbon in the forest ecosystem. The soil carbon stocks of forest ecosystems depend on the type of forest, forest land use, and depth of sampling, climate, the type of dominant species, topography, and soil texture such as clay [29,30,31]. While constant exposure to wind, water erosion, and oxidation caused by tillage are some of the reasons why soil organic carbon is lost from its pool [28].
Understanding the role of soil as the carbon reservoir in a forest ecosystem is important for planning a better management scheme in combating climate change. Knowing the fact that anthropogenic disturbance on the aboveground carbon pools gives impact to the soil carbon stocks, this study examined the influence of land use activities on the soil carbon in a tropical montane forest in northern Borneo. Specifically, the soil organic carbon, organic layer carbon, and litterfall carbon stock in intact forest, logged-over forest, and plantation forest at Long Mio, Sabah, Malaysia were quantified. For litterfall, the monthly production patterns across the different land uses were examined because the carbon input for soil carbon stock is highly dependent on litterfall production.

2. Materials and Methods
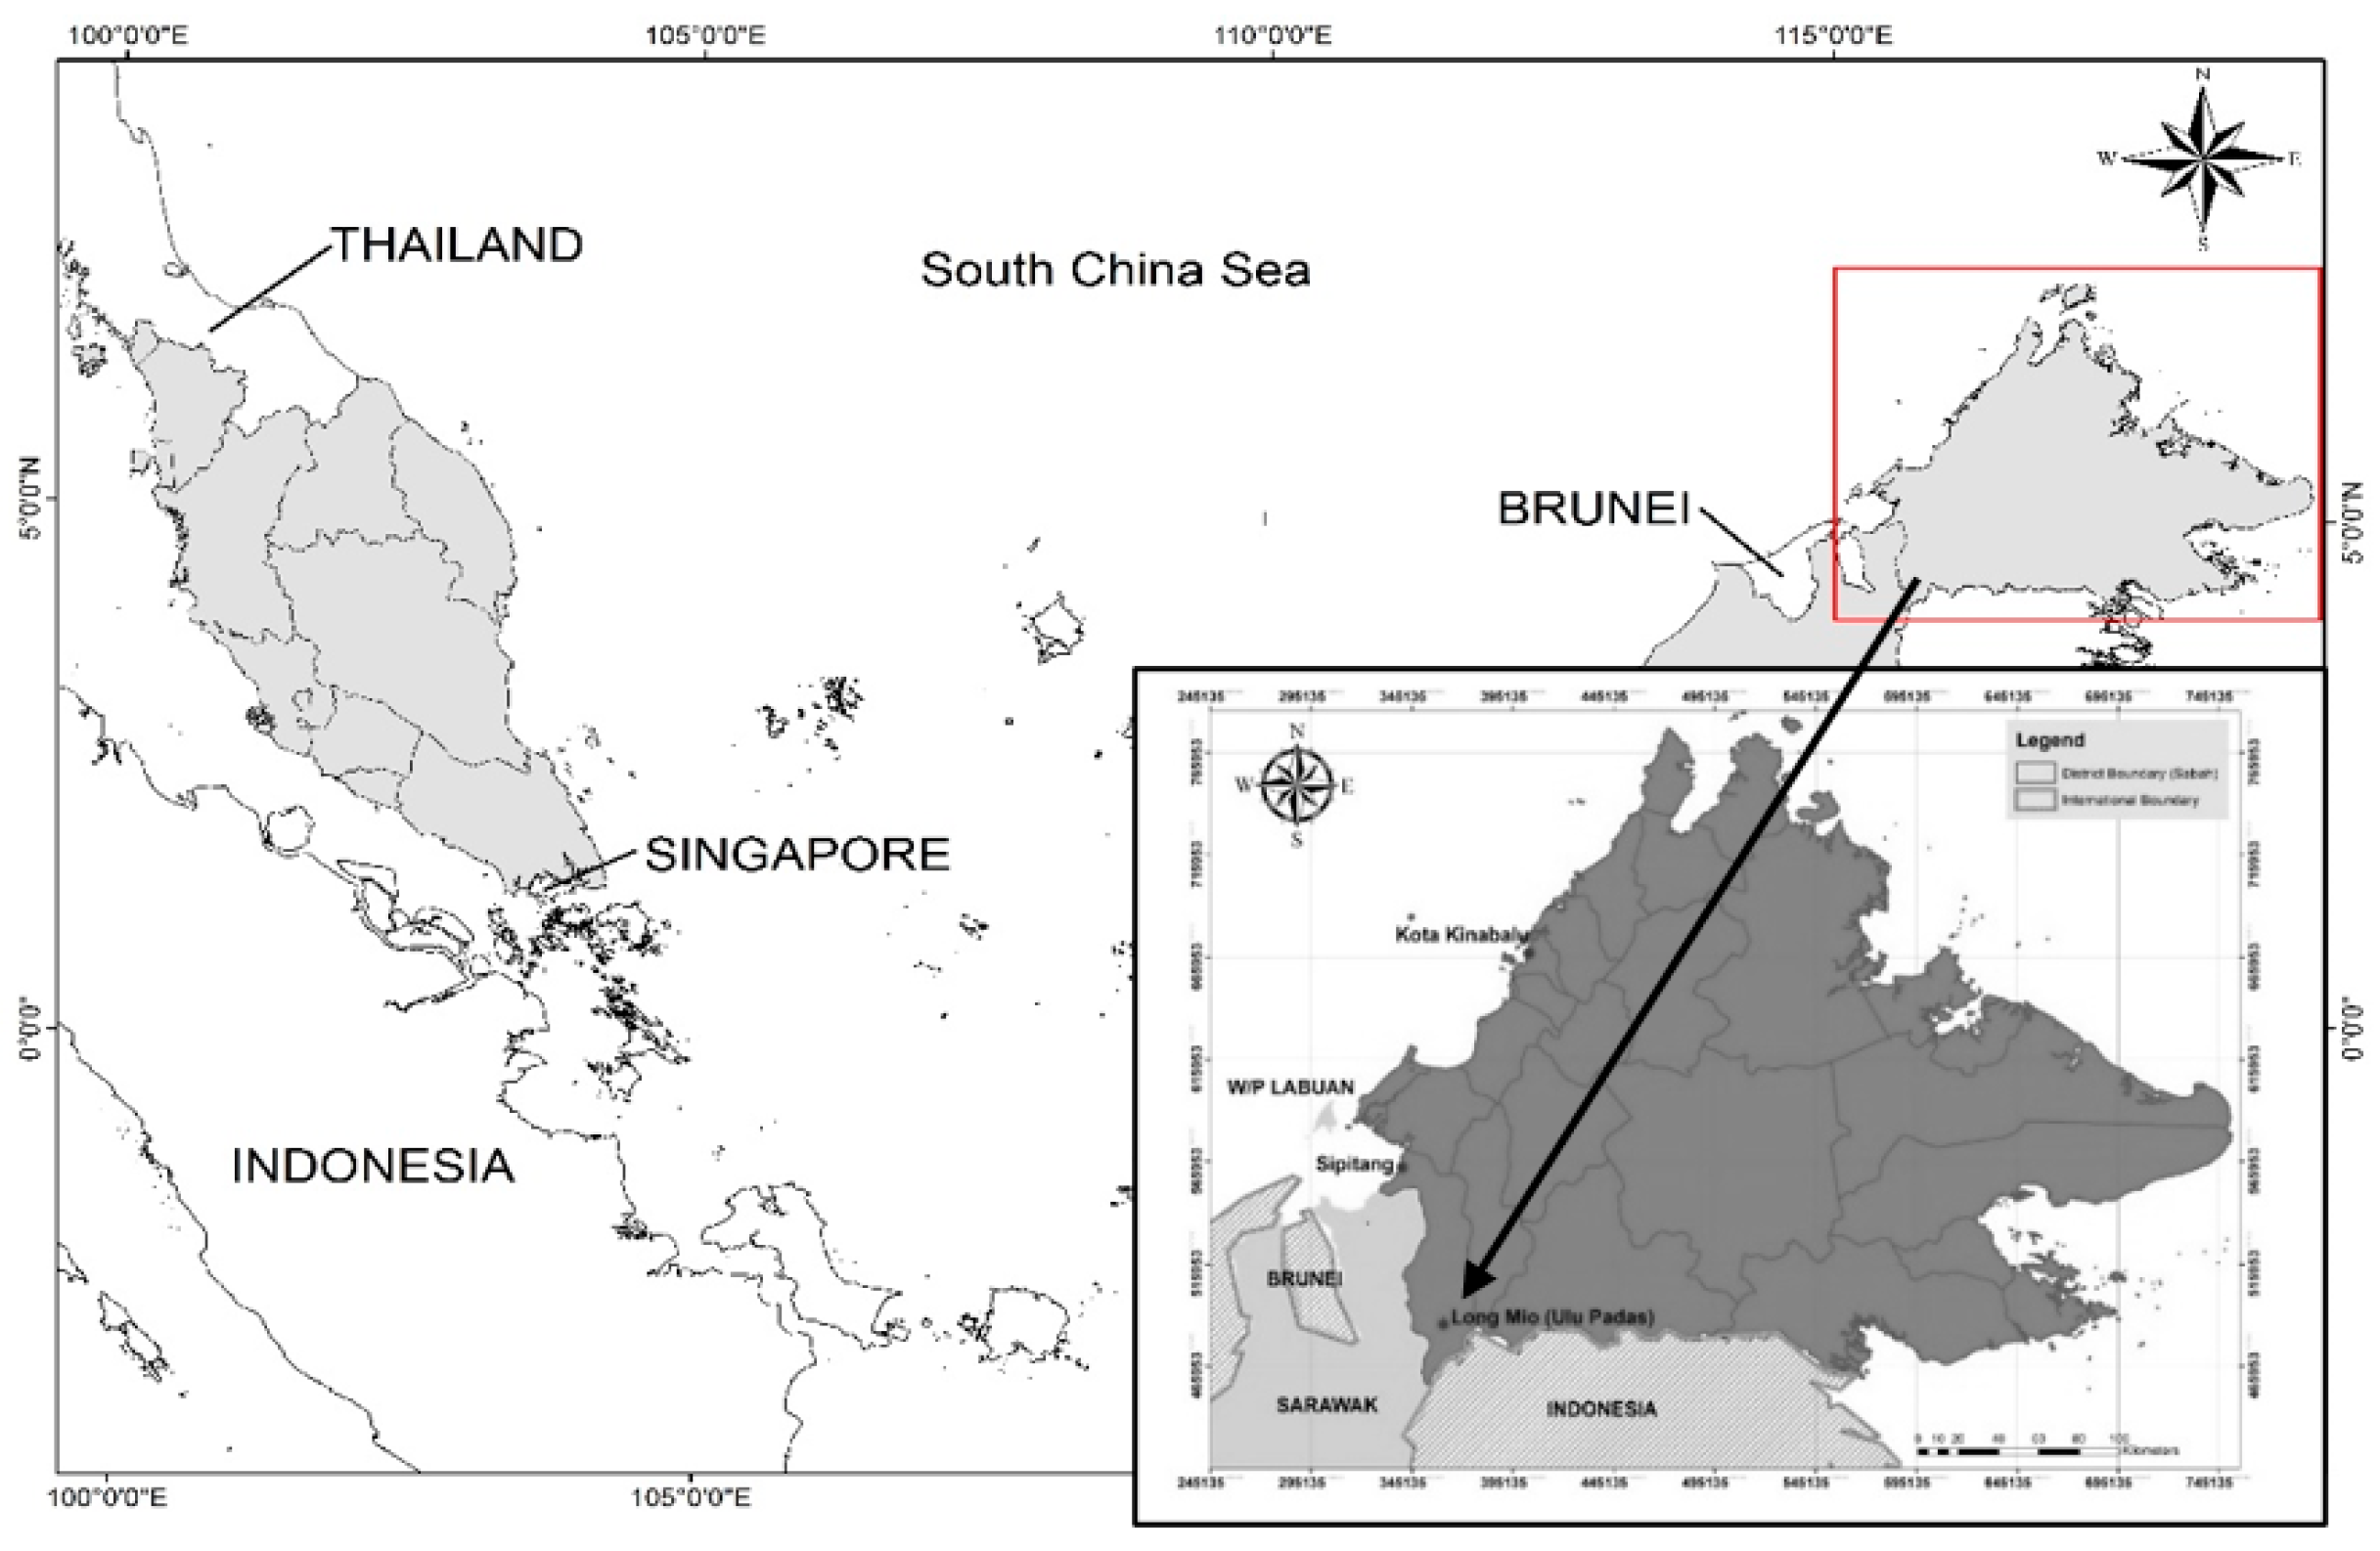
2.1. Study Area

This study was conducted at a montane forest located in the Ulu Padas area (between 4°24′28″ N and 115°43′19″ E), Sabah, Malaysia. The study area is located next to the border of Sabah-Sarawak, Malaysia, and Sabah-Kalimantan, Indonesia. The elevation ranges from approximately 1000 to 1600 m above mean sea level. The highest points within the study area include the peaks of Muruk Miau which is 2083 m (6835 ft) high and Bukit Rimau (locally known as Bukit Senipong) which is 1908 m (6260 ft) high. This area has a high mean annual rainfall, ranging from 2937 to 3960 mm per year, while its mean annual temperature is between 21 and 33 °C per year [32,33]. Based on the rainfall from 2019, the area experiences high rainfall in the middle (497.62 mm) and end (483.60 mm) of the year. The lowest (172.614 mm) rainfall was observed in the first month of 2019.
Approximately 80% of the Ulu Padas area in Long Mio is managed by Sabah Forest Industry Sdn. Bhd. (SFI), and the remaining land area is owned by the state of Sabah (Figure 1). The study was focused on the northern part of the Ulu Padas area, which has been affected by selected logging and shifting cultivations in the past, but some parts consist of intact forests. Within the study site, the managed forests under SFI are divided into a few compartments. A previous study categorized the history of disturbance in this site as shifting cultivation, logged-clear cut (operational, burnt) in 1999–2000, selectively logged in 1999–2000 and 2005–2006, and undisturbed or intact forest [9]. In the clear-cut areas, Eucalyptus sp. trees were planted around 2003–2004 to reforest the areas. Field samplings of soil, organic layer, and litterfall were done in the selectively logged (logged-over forest), the undisturbed (intact forest) area, and the plantation (Eucalytups sp.) area.

2.2. Field Data Collection

Field data were collected in 25 square plots sized 900 m2 each throughout the study area. The replications of plots were 15 for the intact forest, 6 for the logged-over forest, and 4 for the plantation forest. The samples for soil and the organic layer were collected at the same time in June 2017 and June–August 2018. Soil sampling was conducted at three random points within each plot at three different depths, which are 0–5 cm, 5–10 cm, and 10–30 cm. Two types of soil samples were taken at each point, including mixed soil samples for soil physical and chemical properties, and undisturbed soil for determination of soil bulk density. A hoe was used to make a small pit with 30 cm depth to collect the sample. All samples collected from each layer were stored inside a sealed plastic bag before being brought to a laboratory for further analysis. Five sets of bulk density rings with a volume of 98.125 cm3 were used to collect the undisturbed soil in each layer. Each ring was wrapped with plastic and stored inside a labelled plastic bag before transportation to the Soil Science laboratory at Faculty of Tropical Forestry, Universiti Malaysia Sabah for analysis. For the organic layer, samples were collected at five random points in the plots. All organic debris such as leaf litter, fruits, and small branches within a frame size of 0.5 m × 0.5 m were collected and stored inside a big plastic bag before being oven-dried at the laboratory for the determination of biomass and grinded for the carbon content analysis.
Thirteen of the sampling plots were used for litterfall sampling for one year (November 2018–October 2019). A trap was built using a 0.5 m × 0.5 m green PVC coated wire mesh and was installed 0.5 m above ground level. Five litterfall traps were installed in each plot in which samples were collected monthly for twelve months. All tree debris such as the leaves, fruits, and wood were collected from the traps and brought to the laboratory for biomass determination and carbon analysis.

2.3. Laboratory Analysis

2.3.1. Soil Analysis

The mixed soil samples were air-dried at room temperature before being grinded using a grinding machine. Some of the fresh samples were used to determine the soil moisture content using the Gravimetric method, i.e., by weighing the samples after being oven-dried at 105 °C for 24 h [34]. The pipette method as described in Day, [35], was used for determining soil texture. This included the use of 30% hydrogen peroxide for removing the organic matter in soil samples, followed by sodium hexametaphosphate for dispersing the soil particles (silt, clay, and sand). Then, the USDA Textural Triangle was used to determine the soil texture class.
Loss-In-Ignition (LOI) method that was introduced by Walkey and Black [36], was used to determine the percentage of soil organic matter. The calculation was done after heating the soil at 500 °C for 24 h using a furnace. Soil pH was determined using a 1:2.5 (soil: water suspension) ratio method [37]. The pH was then measured using a Mettler Toledo-FiveEasy (FE20) pH meter (Ohaus Corporation, Parsippany, NJ, USA) that was calibrated using pH buffer solutions (pH 4.0, pH 7.0, and pH 9.0). A Vario Macro Cube CHNS elemental analyzer (Elementar Analysensysteme, Langenselbold, Germany) was used to determine carbon (C), hydrogen (H), and nitrogen (N), while an Inductively Coupled Plasma-Optical Emission Spectrometry (ICP-OES) analyzer (PerkinElmer, Waltham, MA, USA) was used to determine the aluminum (Al), magnesium (Mg), calcium (Ca), sodium (Na), potassium (K), and phosphorus (P) contents. These data were used to estimate the total cation exchange capacity (CEC) by summing all the base cations, which included calcium, magnesium, potassium, and sodium with the acid cations (hydrogen and aluminum) [38].
For soil bulk density, the undisturbed soil samples were oven-dried at 105 °C for 24 h or until a constant weight was achieved. The dry mass of soil was then divided with its volume to obtain the soil bulk density.

2.3.2. Plant Samples Analysis

The plant samples for both organic layer and litterfall were oven-dried at 70 °C for 72 h or until they achieved a constant weight. The weight of the oven-dried plant samples was measured using a digital balance for determining their biomass. The samples were then grinded before being analyzed using a Vario Macro Cube CHNS elemental analyzer (Elementar Analysensysteme, Langenselbold, Germany) for their carbon and nitrogen contents.

2.3.3. Carbon Analysis

The soil carbon stock (Csoil) was estimated using soil bulk density (BD), soil depth interval (SDI), and soil carbon concentration (C) data [39]. Equation (1) was used to calculate the soil carbon stock at various soil depth intervals. Total soil carbon stock was then estimated by summing all soil carbon stocks for all depths from 0 to 30 cm.
Csoil (Mg C ha−1) = BD (g cm−3) × SDI (cm) × C (%) × 100
Meanwhile, the carbon stock values for both organic layer and litterfall samples were estimated using the following equation:
CPlant (Mg C ha−1) = C% × (Biomass/Area) × 100
where C% = carbon concentration (%), biomass = plant biomass (Mg C ha−1), and area = sampling size. The carbon stock in different land-use settings was calculated by summing all carbon pools (soil, organic layer, and litterfall) that were determined in the laboratory analyses. The stock values were then used to estimate the carbon dioxide equivalents (CO2e) by multiplying with a factor of 3.67 [40].

2.4. Statistical Analysis

One-way analysis of variance (ANOVA) with a post hoc test using Tukey’s test (p < 0.05) was used to examine the statistical difference between the groups. Normality tests using Shapiro–Wilk statistics and homogeneity of variance by Levene’s test were carried out before doing the ANOVA. This was to make sure that the data has satisfied at least these two assumptions of parametric tests which are: (1) the data are normally distributed, (2) the sample has an equal variance [41]. The relationship between soil C and soil N was determined using Pearson’s Correlation analysis.

3. Results

3.1. Soil Physicochemical Properties

These three different land-use types have different soil textures which are clay loam, clay, sandy clay loam, and sandy loam (Table 1). Sand and clay dominated the soil texture elements in all plots while silt content was ≤20% compared to other elements.
All land uses showed a similar trend for percentage soil moisture content (Table 2) whereby the moisture content decreased as the soil depth increased. The highest moisture content of 8% was recorded at the 0–5 cm depth of the logged-over forest soil profile. The lowest soil moisture content of 1.35% was recorded at the 10–30 cm depth of the plantation forest soil profile. The soil moisture content at the 10–30 cm soil depth of the logged-over forest and plantation forest was significantly different with a value of 3.75% and 1.35%, respectively. There were no significant differences (p > 0.05) in the soil bulk density between the land uses for each soil layer. The soil bulk density increased with depth where in the 10–30 cm soil layer showed the highest bulk density. The plantation forest soil bulk density ranged from 0.87 to 1.32 g cm−3, while that for the intact forest ranged from 0.90 to 1.33 g cm−3. The logged-over forest had the lowest soil bulk density which ranged between 0.83 and 1.14 g cm−3.
Table 3 shows the soil chemical properties in the intact forest, logged-over forest, and plantation forest. All the land use types exhibited acidic soil characteristics. The logged-over forest and intact forest had the most acidic soils with pH ranging from 4.31 to 4.69 and 4.21 to 4.68, respectively, compared to plantation forest with pH ranging from 4.54 to 5.71. The results show that the soil pH in the third layer (10–30 cm) of plantation forest (5.71) was significantly different from the pH in logged-over forest (4.68) and intact forest (4.69). There were no significant differences observed for the other layers.
The soil organic matter (SOM) content, which is an important component of carbon sequestration in soil [42] ranged between 3.34% and 14.62% in the three land uses. The results showed that the surface layer of all land uses had the highest percentage of SOM, which ranged from 13.48% to 14.26%. The percentage SOM decreased with increasing depth, with mean values ranging between 6.72% to 8.53% and 3.34% to 5.99% for the second (5–10 cm) and third layers (10–30 cm), respectively. The total soil phosphorus in the study area ranged widely from 0.02 to 0.86 meq/100 g of soil. The highest total soil P result was found in the 5–10 cm depth layer of the intact forest while the lowest results were from the 10–30 cm depth layer of the plantation forest soil.
The mean soil cation exchange capacity (CEC) in the intact forest was the highest among the land uses, ranging from 10.75 to 14.43 meq/100 g (Table 4). This was followed by the logged-over forest which ranged from 9.63 to 17.84 meq/100 g and the plantation forest which ranged from 4.58 to 10.72 meq/100 g. Aluminum from acid cations and calcium from base cations contribute the most to CEC in all land-use changes. The highest mean aluminum content was from the 10–30 cm depth of the logged-over forest soil with a mean of 10.68 meq/100 g, while the lowest was from the 5–10 cm depth of plantation forest soil with a value of 0.87 meq/100 g. Meanwhile, for calcium, the highest value was obtained from the third layer (10–30 cm) of intact forest with a mean of 4.23 meq/100 g and the lowest was from the third layer (10–30 cm) of the logged-over forest soil with a mean of 1.35 meq/100 g. Compared to other elements, soil magnesium content was relatively low for all land uses. The mean values ranged from 0.25 to 0.97 meq/100 g.
The soil carbon content (Table 5) in all land use types decreased with depth but there were no significant differences between the land uses. The logged-over forest showed the highest soil carbon content on its surface layer with a value of 6.30%. On the other hand, the intact forest and the plantation forest had similar soil carbon contents on the surface layer, which were 5.38% and 5.26%, respectively. The lowest soil carbon content was found in the third layer (10–30 cm) of the plantation forest with a mean of 1.86%. A decreasing trend was also observed for soil nitrogen content. The mean value decreased by depth, but there were no significant differences between the land uses at any particular depth. The soil nitrogen content on the surface layer of all land uses ranged from 0.44% to 0.37%. The soil nitrogen results were lower in the second (5–10 cm) and third (10–30 cm) soil layers for the land uses with values ranging from 0.23% to 0.29% and at 0.11% to 0.20%, respectively. The highest results were obtained from the first layer (0–5 cm) of the plantation forest, while the lowest result was from the third layer (10–30 cm) of the logged-over forest. Figure 2 shows that the soil nitrogen content was positively correlated with the soil carbon content (r = 0.614, p < 0.01) for the study area.

3.2. Organic Layer

Table 6 shows the biomass, carbon and nitrogen contents, and C:N ratio in the organic layers of the three land uses. There was a significant difference (p < 0.05) between the biomass in the intact forest and the plantation forest. Intact forest produced a relatively large amount of biomass with a mean of 4.46 Mg ha−1, followed by the logged-over forest with 3.02 Mg ha−1. Plantation forest, which was logged-clear cut in the past, had the lowest mean biomass in its organic layer (1.92 Mg ha−1). The biomass reduced by almost 50% compared to intact forests. The carbon and nitrogen contents did not show similar results as that for the biomass, with no significant differences (p > 0.05) between the means of different land uses. The range for carbon content was between 38.79% and 41.40%, while the range for nitrogen content was from 0.95% to 1.31%.

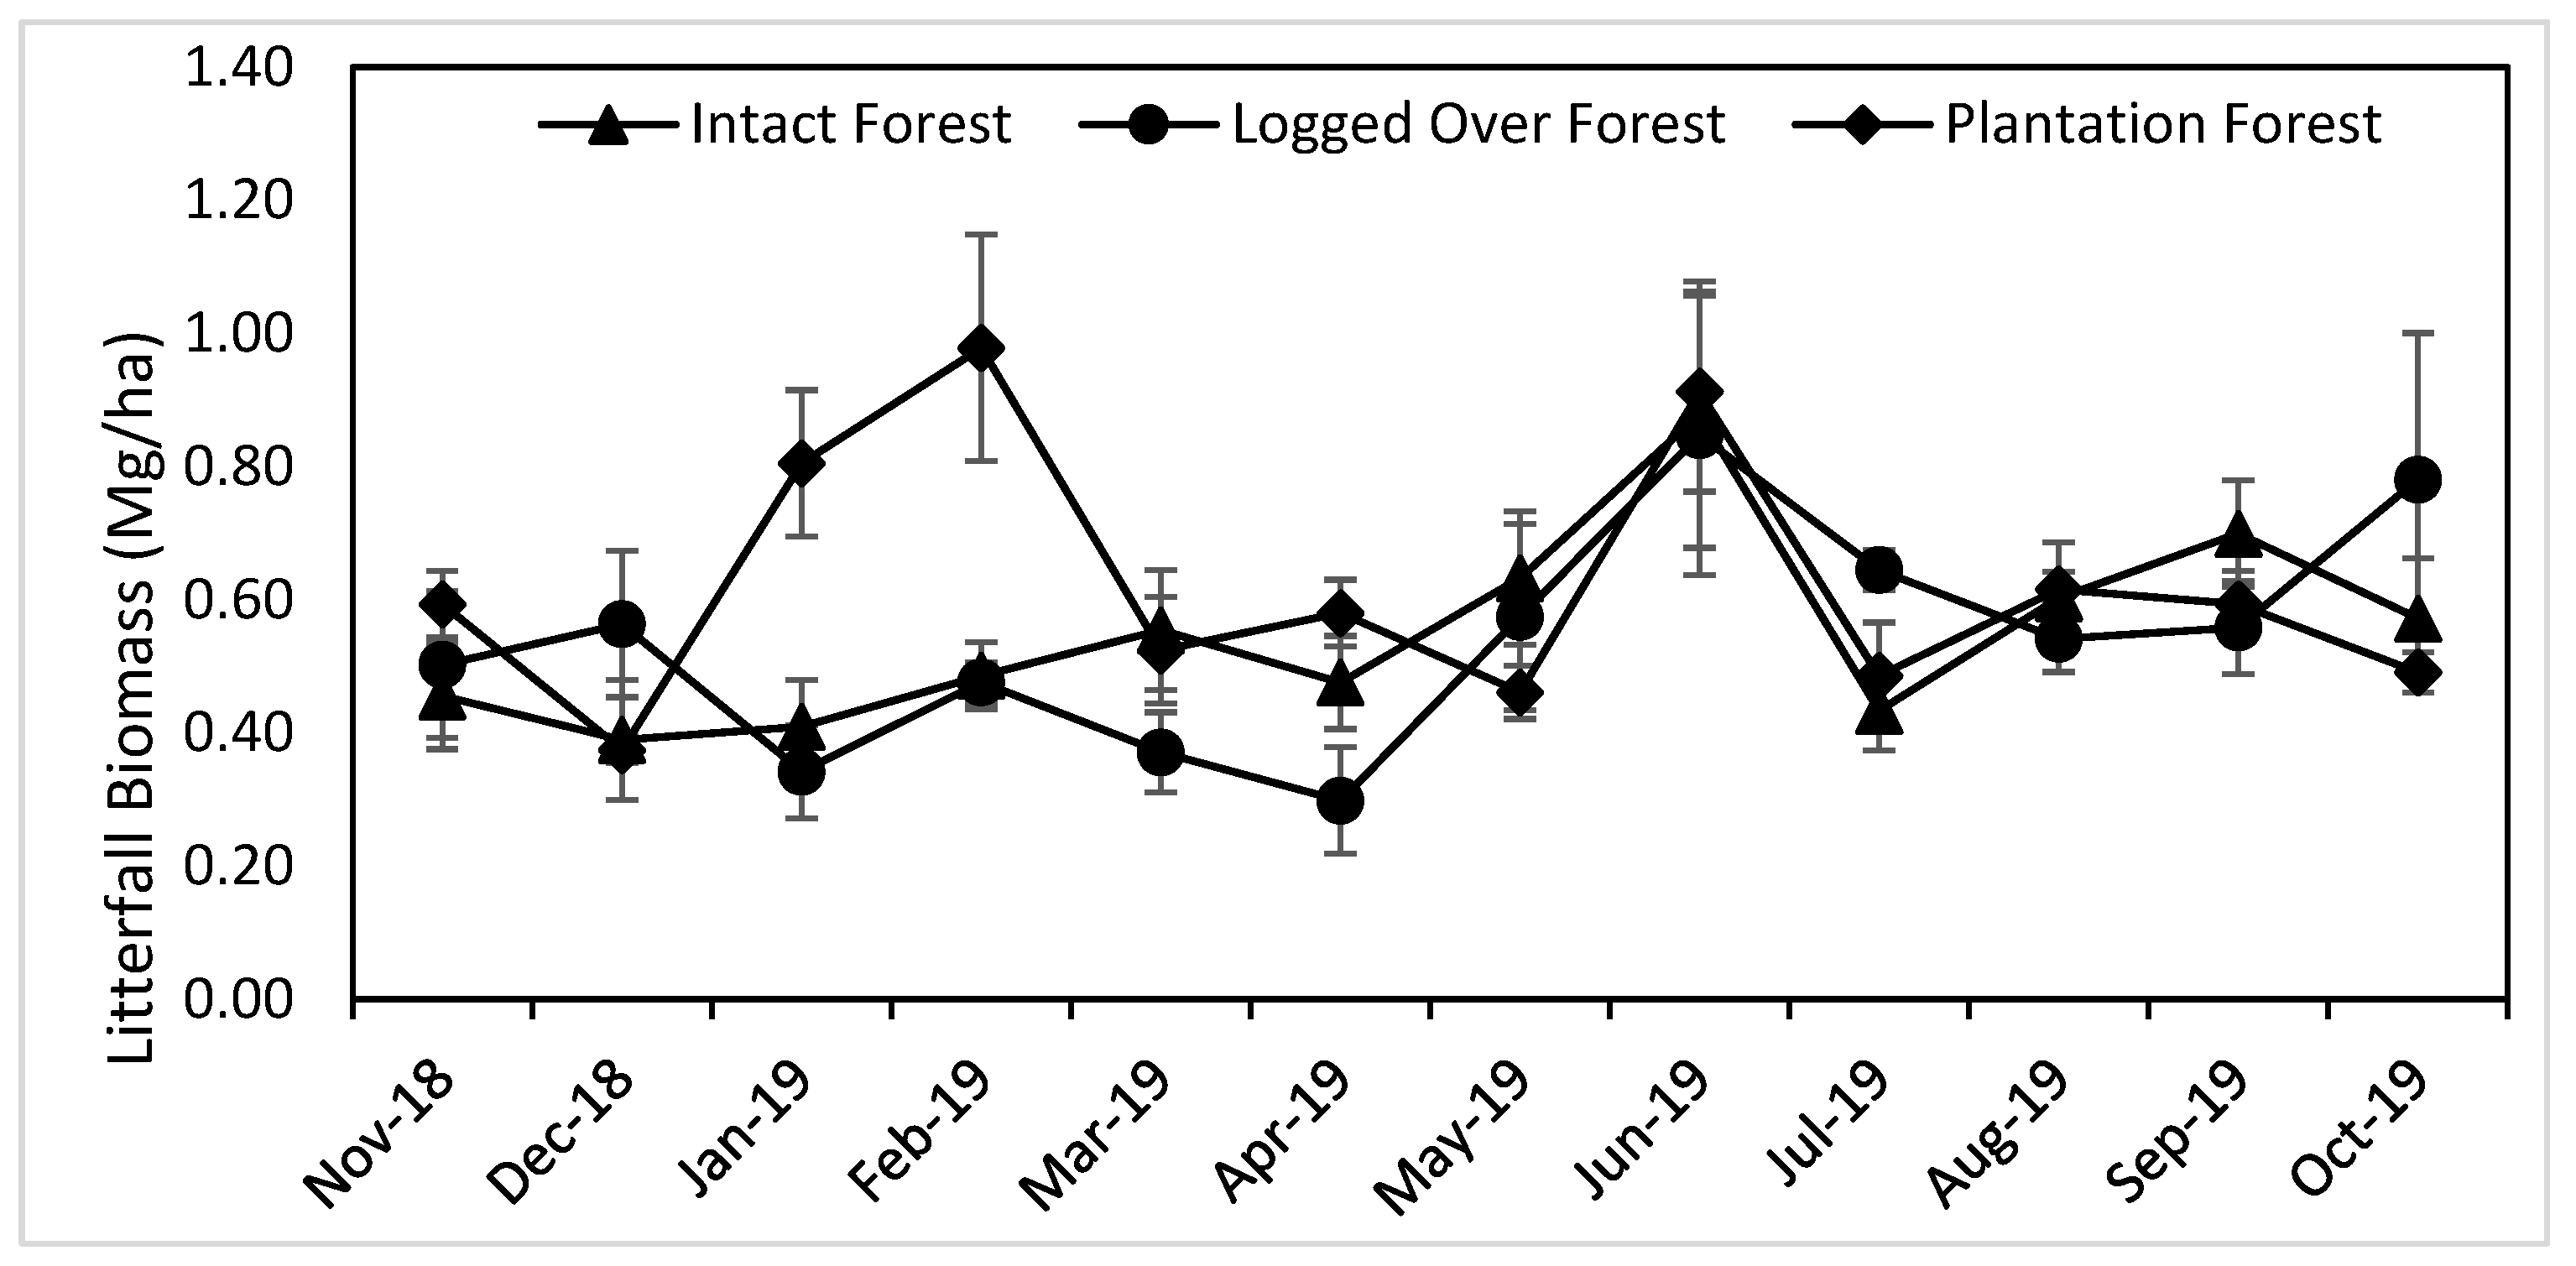
3.3. Litterfall Production

Figure 3 shows the monthly variation of litterfall production over one year in the study area, which ranged between 0.30 and 0.98 Mg ha−1. The intact forest and the logged-over forest showed a similar production pattern throughout the year. The productions for both land uses were consistent from November 2018 to May 2019 which are 0.39 Mg ha−1 to 0.63 Mg C ha−1 and 0.34 Mg ha−1 to 0.57 Mg ha−1, respectively. It then rose significantly to 0.88 Mg ha−1 and 0.85 Mg ha−1 in Jun 2019 before falling again to its usual range in July 2019 until the end of sampling which is in October 2019. The monthly production pattern at the plantation forest on the other hand was quite different with a significant increase in production from 0.37 Mg ha−1 in December 2018 to 0.98 Mg ha−1 in February 2019. The plantation forest also showed a higher range of monthly litterfall production (0.37 Mg ha−1 to 0.98 Mg ha−1) compared to the other land uses.
The intact forest produced monthly litterfall biomass of 0.39 Mg ha−1 to 0.88 Mg ha−1, while the logged-over forest produced slightly lower monthly litterfall biomass (0.30 Mg ha−1 to 0.85 Mg ha−1). The results shown in Table 7 indicate that the accumulated litterfall biomass was not statistically different between the land uses (p > 0.05). The plantation forest showed the highest amount of accumulated litterfall biomass production among the study sites with 7.41 Mg ha−1 yr−1. This was followed by the intact forest with 6.59 Mg ha−1 yr−1 and then, the logged-over forest with 6.50 Mg ha−1 yr−1.
Carbon and nitrogen content, as well as C:N ratio, were not significantly different between the land uses (p > 0.05). The litterfall carbon content ranged between 44.20% and 47.53%, with the logged-over forest having the lowest C content and the intact forest having the highest C content. For the nitrogen content, the lowest value was obtained from the plantation forest with a mean of 1.03% while the highest was from the intact forest with a mean of 1.19%.

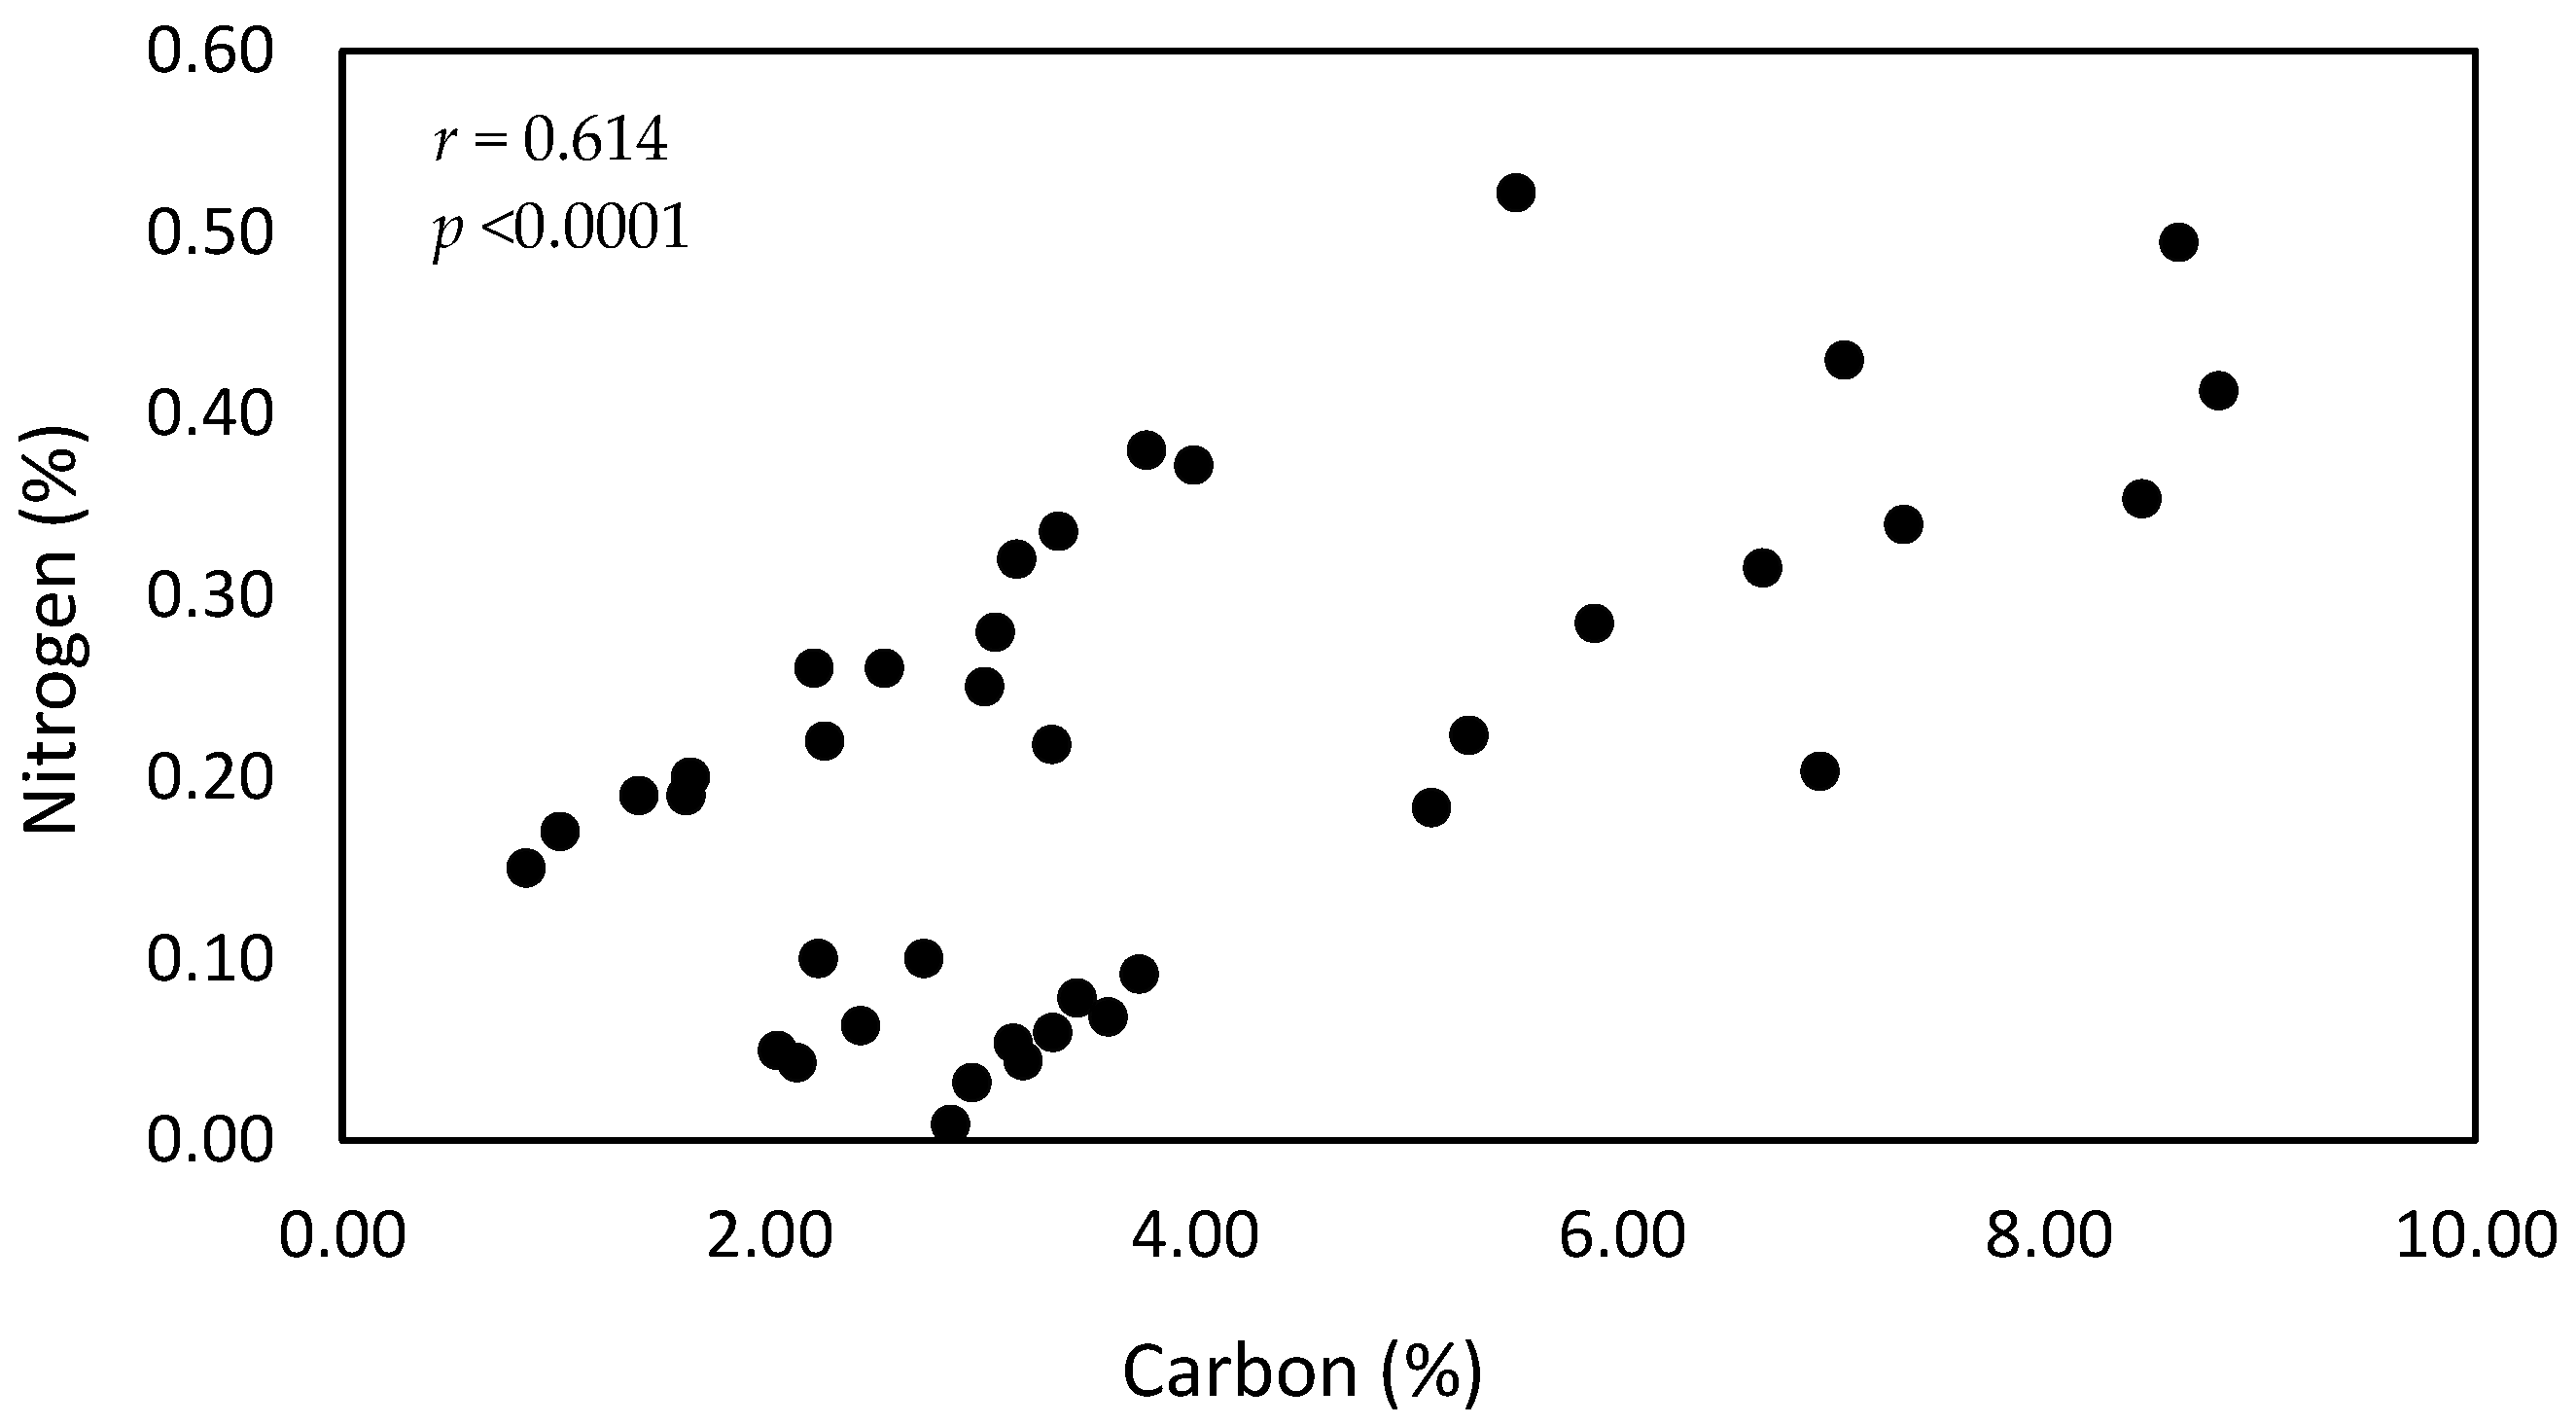
3.4. Soil Carbon Stock

Table 8 shows soil carbon stocks of the land uses in the study area. Intact forest showed the highest total soil carbon stock with a mean of 96.42 Mg C ha−1. The soil carbon stock in the logged-over forest, which was 91.14 Mg C ha−1, was slightly higher than plantation forest, (88.92 Mg C ha−1). Soil carbon stock on the topsoil of each land use was statistically similar with a range of 23.31 to 26.15 Mg C ha−1. In all land uses, the third soil layer (10–30 cm) stored most of the carbon with a range of 50.85 to 56.64 Mg C ha−1. It is worth noting that the depth for this sampling layer was 20 cm compared to other two layers, which were only 5 cm deep. No significant difference resulted in the soil carbon stocks for each soil layer between the land uses (p > 0.05) (Table 8).

3.5. Total Carbon Stock (Organic Layer, Litterfall, and Soil Carbon Stock)

Among the carbon pools examined in this study, the soil stored the highest carbon stock which ranged between 88.92 to 96.42 Mg C ha−1. This was followed by litterfall with a range of 3.05 to 3.48 Mg C ha−1, and last, the organic layer, which ranged from 0.90 to 2.10 Mg C ha−1 (Table 9). There was no significant difference between the carbon pools for all the land uses, except for the organic layer in which the intact forest (2.10 Mg C ha−1) was significantly different from the plantation forest (0.90 Mg C ha−1).
In terms of total carbon stock, it was revealed that the intact forest had the highest capability to store more carbon. At 101.62 Mg C ha−1, it was higher than the logged-over and the plantation forests, which had means of 95.61 Mg C ha−1 and 93.30 Mg C ha−1, respectively. Since the total carbon stock has a positive correlation with the carbon dioxide absorption in an ecosystem [43,44], translating this to carbon dioxide equivalent (CO2e), it was found that the intact forest had the potential of emitting up to 372.95 Mg C ha−1 CO2e, compared to 350.89 Mg C ha−1 and 342.41 Mg C ha−1 CO2e for the logged-over forest and the plantation forest, respectively.

4. Discussion

4.1. Soil Physicochemical Properties

Forests in all the land uses had acidic soil with a mean pH of 4.21 to 5.71. The soil pH is positively related to the concentration of hydrogen ions in soil [45]. Tropical forest soils are usually acidic as they have more vegetation litters on the forest floor compared to other biomes. Soil organic matter content influences both physical and chemical properties of soils. It acts as the reservoir for plant nutrients and organic carbon [46]. The surface layer of soil had the highest organic matter content in all study plots, and the organic matter decreased with increasing depth. This is because the decomposition rate of organic matter is much higher on the topsoil compared to the lower layers. Moreover, canopy opening could reduce the amount of soil organic matter due to the increase in solar radiation that reaches the forest floor. This causes soil temperature to increase, which could accelerate the breakdown of organic matter and accelerates the release of carbon dioxide into the atmosphere [47]. As carbon and nitrogen are positively correlated to each other, the losses of soil carbon inputs also affect the amount of nitrogen needed for tree growth in the forest [48]. For this reason, it is important to conserve the source of soil organic matter in the forest, especially the standing trees so that soil carbon degradation could be avoided, and more carbon could be stored by various carbon pools of a forest ecosystem.
Most of the soil textures found in the study area are clayish types of soil. Clayish soil tends to hold more moisture compared to sandy soil [49]. The same type of soil texture also was recorded in Jeyanny et al. [50] and Besar et al. [51] study areas. Nutrient availability in soil was influenced by the percentage of sand and clay elements in the soil. A sandy soil contained lesser nutrients as compared to clayish soil due to the low amount of Cation Exchange Capacity (CEC) [52]. Phosphorus, one of the essential micronutrients required by plants to grow, was lowest in plantation forest soil [53]. Our finding also shows plantation forest has the lowest CEC value while intact forest has the highest value. These data illustrate the intact forest soil’s capability to hold more positively charged ions compared to a plantation forest. A study on CEC conducted by Perumal et al. [54] in a reforestation site of Sempadi Forest Reserve, Sarawak recorded a similar range of CEC with this study, which is 8.4 cmol/kg to 11.8 cmol/kg.

4.2. Litterfall and the Organic Layer

Intact forests store a relatively high amount of carbon in litterfalls [55]. Rainfall distribution could affect the production of litterfall. The biomass of litterfall decreases with the presence of abundant water. During the rainy season or when the forest environmental condition is wet for the study area (March to May), the production of litterfall is relatively low because no water shortage or drought stress affects the plants. Salts in groundwater and the available water in the forest environment could lower the air temperature, which could also reduce the litterfall during wet weather conditions [56,57].
Nevertheless, the plantation forest had a higher amount of litterfall biomass and carbon compared to the intact forest and the logged-over forest. The biomass ranged from 6.50 to 7.41 Mg ha−1 yr−1, while carbon ranged from 3.05 to 3.48 Mg C ha−1. Litterfall production by an old-growth forest could be lesser compared to a young stand that produces more litter during the stand development, but the production becomes stable and might be lower as the trees become older [58]. The intact forest in our study area produced on average about 6.59 Mg ha−1 yr−1 litterfall, while the logged-over forest produced about 6.50 Mg ha−1 yr−1. These values are comparable to the annual litterfall of a montane forest (6.73 Mg ha−1 yr−1) in Sulawesi, Indonesia [59].
For the organic layer, the carbon stock of the intact forest (2.10 Mg C ha−1) was lower than a dipterocarp forest in Pahang, Malaysia, which is 2.71 Mg C ha−1, but higher than a hill dipterocarp forest in Tawau Hill Park, Sabah, Malaysia with a mean of 1.02 Mg C ha−1 [50,51]. In terms of land use, the undisturbed forest contained the highest carbon stock in the organic layer compared to the logged or degraded forest and plantation forest. The logged-over forest and plantation forest would have more canopy openings that allow a higher amount of solar radiation to reach the floor; thus, higher organic matter decomposition rates [47]. This is one major factor that influences the amount of soil organic layer in a forest [60].

4.3. Soil Carbon Stock

Although we found no statistically significant difference in the soil organic carbon content between the land uses in the study area, it has been reported that anthropogenic activities such as logging could reduce the amount of soil carbon stock. In a dipterocarps forest of Negeri Sembilan, Malaysia, the total soil carbon (0–30 cm) of the intact forest is 34.12 Mg C ha−1 compared to 18.9 Mg C ha−1 in the logged-over forest [31]. The soil carbon stock of the intact forest in the study area was higher than the intact dipterocarp forest reported by Abdullahi et al. [28] and Besar et al. [51]. Nevertheless, the differences between our study and others could be due to differences in bulk density, depth sampling, and soil type. However, the results of this study are similar to the findings for a montane forest at Sungai Kial Forest Reserve, Pahang, Malaysia [50]. They found that the soil carbon stock ranged between 77.29 and 99.30 Mg C ha−1, depending on elevation because the soil carbon at the upper montane forest was significantly higher than the forests at the lower elevations [50].

4.4. Total Carbon Stock of Litterfall, Organic Layer, and Soil Carbon Pools

The total carbon stock examined in this study comprised litterfall, organic layer, and soil. Among the three carbon pools, it was found that soil carbon is the main contributor to the total carbon stock of the tropical montane forests in northern Borneo. Soils can store a significant amount of carbon, which is between 36% and 46% of the total carbon in a forest ecosystem [28]. Moreover, the total carbon stocks of the three pools varied in the different land uses. Intact forest had the highest carbon stock with 101.62 Mg C ha−1, compared to the logged-over forest, which was 6% lower (95.61 Mg C ha−1). Converting natural forest to plantation forest yielded a total stock of 93.30 Mg C ha−1, which is 8% lower than the intact forest. Although the natural forests in the plantation forest had been cleared approximately 18 years ago, replanting it with fast-growing species i.e., Eucalyptus sp. seems to be able to continue contributing to the three carbon pools. Carbon sequestration and the accumulation by soil on the bare ground could increase over time if there are continuous inputs from the plants and its root [61]. Besides, litterfall and organic litter production also play an important role in increasing the accumulation of carbon in a forest ecosystem. Although the organic litter was higher in the intact forest, we found more litterfall production in the plantation forest. This high litterfall production rate would continuously contribute to the carbon accumulation in the plantation forest through the nutrients cycle and the inputs of organic litter.

5. Conclusions

The intact forest contained the highest total carbon stock, followed by the logged-over forest and plantation forest. The amount of total carbon stock in the three different land-use types was 101.62 Mg C ha−1, 95.61 Mg C ha−1, and 93.30 Mg C ha−1, respectively. For the soil, the intact forest had higher soil carbon as compared to the logged-over forest and plantation forest. In general, for component C stock, it was found that soil contributed the highest (95%), followed by litterfall (3%) and the organic layer (2%) for all three different land-use types. As the intact forest has the highest capability to store carbon, therefore, this study highlights the importance of preserving the intact forest to enhance C sequestration and mitigate greenhouse gas emissions. The findings for the plantation forest also suggest that replanting the logged area with fast-growing species such as Eucalyptus sp. seems to be able to continue contributing carbon to the soil, organic layer, and litterfall pools. In addition, both the carbon and nitrogen contents in soil have crucial roles in mitigating climate change and land degradation and improving food security and crop production. Thus, it is essential to balance the release of these gases into the atmosphere by implementing a proper land management scheme. Finally, the information from this study could be convenient as the guidelines and references for further studies on similar areas from around the world.

Author Contributions

Conceptualization, N.A.B. and M.-H.P.; methodology, N.A.B. and N.S.S., S.M.H.; software, D.J. and N.S.S.; validation, N.A.B., N.S.S., M.-H.P. and D.J.; formal analysis, N.A.B., D.J. and S.M.H. investigation, N.A.B.; resources, N.A.B., A.H.; data curation, N.A.B.; A.H., M.B.J. writing—original draft preparation, N.A.B., N.S.S. and S.M.H.; writing—review and editing, M.-H.P. and M.B.J.; visualization, D.J. and N.S.S.; supervision, N.A.B. and M.-H.P.; project administration, N.A.B. and M.-H.P.; funding acquisition, N.A.B. and M.-H.P. All authors have read and agreed to the published version of the manuscript.

Funding

This study was conducted with a research grant SBK0438-2018 and GKP0005-STWN-2016 from Universiti Malaysia Sabah.

Acknowledgments

The authors would like to thank Sabah Forestry Department (SFD) and Sabah Forest Industry Sdn. Bhd. (SFI) for giving us the permission to do our research in the study areas. All authors also would like to thank Long Mio villagers, UMS staff, and the final year students (Uzair Matamin, Nurul Fazleeayu Fazeela, Rickardo Suryanto, Umi Umairah Osaman, Brandon James, Mohd. Hafiz Sayudi, and Rino Flemino Hendrikus) for their help throughout the research.

Conflicts of Interest

The authors declare no conflict of interest.

References

  1. Green, C.; Byrne, K.A. Biomass: Impact on carbon cycle and greenhouse gas emissions. In Encyclopedia of Energy; Cleveland, C.J., Ed.; Elsevier: Amsterdam, The Netherlands, 2004; pp. 223–236. [Google Scholar]
  2. Live Science. Available online: https://www.livescience.com/28698-facts-about-carbon.html (accessed on 23 March 2021).
  3. Reichle, D.E. The global carbon cycle and the biosphere. In The Global Carbon Cycle and Climate Change; Reichle, D.E., Ed.; Elsevier: Amsterdam, The Netherlands, 2020; pp. 183–208. [Google Scholar]
  4. Food and Agriculture Organization of the United Nations (FAO). Global Forest Resources Assessment 2020: Main Report; FAO: Rome, Italy, 2020. [Google Scholar] [CrossRef]
  5. FAO; UNEP. The State of the World’s Forest 2020. Forests, Biodiversity and People; FAO: Rome, Italy; UNEP: Nairobi, Kenya, 2020. [Google Scholar] [CrossRef]
  6. Zakaria, M.; Rajpar, M.N.; Ozdemir, I.; Rosli, Z. Fauna Diversity in Tropical Rainforest: Threats from Land-Use Change. In Tropical Forest–The Challenges of Maintaining Ecosystem Services While Managing Landscape; Blanco, J.A., Chang, S.C., Lo, Y.H., Eds.; IntechOpen: London, UK, 2016. [Google Scholar]
  7. Houghton, R.A. The Contemporary Carbon Cycle. In Treatise on Geochemistry, 2nd ed.; Holland, H.D., Turekian, K.K., Eds.; Elsevier: Amsterdam, The Netherlands, 2014; pp. 399–435. [Google Scholar] [CrossRef]
  8. Sadono, R.; Pujiono, E.; Lestari, L. Land Cover Changes and Carbon Storage Before and After Community Forestry Program in Bleberan village, Gunungkidul, Indonesia, 1999–2018. Forest Sci. Technol 2020, 16, 134–144. [Google Scholar] [CrossRef]
  9. Leifeld, J.; Bassin, S.; Fuhrer, J. Carbon Stock in Swiss Agricultural Soils Predicted by Land use, Soil Characteristics and Altitude. Agric. Ecosyst. Environ. 2005, 105, 255–266. [Google Scholar] [CrossRef]
  10. Xiao, C. Soil Organic Carbon Storage (Sequestration) Principles and Management: Potential Role for Recycled Organic Materials in Agricultural Soils of Washington State; Washington State Department of Ecology: Olympia, WA, USA, 2015.
  11. Ioki, K.; Tsuyuki, T.; Phua, M.H.; Wong, W.V.C.; Johari, S.A.; Korom, A.; James, D.; Saito, H.; Takao, G. Evaluation of the similarity in tree community composition in a tropical rainforest using airborne LiDAR data. Remove Sens. Environ. 2016, 173, 304–313. [Google Scholar] [CrossRef]
  12. Raihan, A.; Said, M.N.M.; Abdullah, S.M.S. Climate change mitigation options in the Forestry Sector of Malaysia. J. Kejuruter. 2018, 1, 89–98. [Google Scholar] [CrossRef]
  13. EC. Thematic Strategy for Soil Protection (COM 2006, 231 Final). Available online: https://eur-lex.europa.eu/legal-content/EN/TXT/?uri=CELEX:52006DC0231 (accessed on 10 March 2021).
  14. Greiner, L.; Keller, A.; Gret-Regamey, A.; Papritz, A. Soil function assessment: Review of methods for quantifying the contributions of soil to ecosystem services. Land Use Policy 2017, 69, 224–237. [Google Scholar] [CrossRef]
  15. Jónsson, J.Ö.G.; Davíðsdóttir, B.; Nikolaidis, N.P. Valuation of soil ecosystem services. In Advances in Agronomy; Banwart, S.A., Sparks, D.L., Eds.; Academic Press: Cambridge, MA, USA, 2017; Volume 142, pp. 353–384. [Google Scholar]
  16. Gaudel, G.; Zhang, W.H.; Dang, Q.H.; Le, T.H. The global terrestrial carbon stocks, status of carbon in forest and shrubland of Nepal, and relationship between carbon stock and diversity. Int. J. Res. 2016, 31, 620–634. [Google Scholar]
  17. FAO; ITPS. Status of the World’s Soil resources–Main Report; Food and Agriculture Organization of the United Nations and Intergovernmental Technical Panel on Soils: Rome, Italy, 2015. [Google Scholar]
  18. Ronald, V. Threats to Soils: Global Trends and Perspective; Global Soil Partnership Food and Agriculture Organization of the United Nations: Bonn, Germany, 2017; pp. 1–27. [Google Scholar]
  19. Ontl, T.A.; Schulte, L.A. Soil carbon storage. Nat. Educ. Knowl. 2012, 3, 35–47. [Google Scholar]
  20. Trivedi, P.; Singh, B.P.; Singh, B.K. Soil Carbon: Introduction, Importance, Status, Threat, and Mitigation. In Soil Carbon Storage; Singh, B.K., Ed.; Academic Press: Cambridge, MA, USA, 2018; pp. 1–28. [Google Scholar]
  21. FAO; ITPS; GSBI; CBD; EC. State of Knowledge of Soil Biodiversity. Status, Challenges, and Potentialities, Report 2020; FAO: Rome, Italy, 2020. [Google Scholar] [CrossRef]
  22. Langer, A.; Samejima, H.; Ong, R.C.; Titin, J.; Kitayama, K. Integration of Carbon Conservation Into Sustainable Forest Management Using High Resolution Satellite ImageneryL: A Case Study in Sabah, Malaysian Borneo. Int. J. Appl. Earth Obs. Geoinf. 2012, 18, 305–312. [Google Scholar] [CrossRef]
  23. Wong, C.J.; James, D.; Besar, N.A.; Kamlun, K.U.; Tangah, J.; Tsuyuki, S.; Phua, M.H. Estimating Mangrove Above-Ground Biomass Loss Due to Deforestation in Malaysian Northern Borneo Between 2000 and 2015 Using SRTM and Landsat Images. Forests 2020, 11, 1018. [Google Scholar] [CrossRef]
  24. Broich, M.; Hansen, M.; Potapov, P.V.; Wimberly, M.C. Patterns of Tree-Cover Loss Along the Indonesia-Malaysia Border on Borneo. Int. J. Remote Sens. 2013, 34, 5748–5760. [Google Scholar] [CrossRef]
  25. Loh, H.Y.; James, D.; Ioki, K.; Wong, W.V.C.; Tsuyuki, S.; Phua, M.H. Aboveground Biomass Changes in Tropical Montane Forest of Northern Borneo Estimated Using Spaceborne and Airborne Digital Elevation Data. Forests 2020, 12, 3677. [Google Scholar] [CrossRef]
  26. Chen, S.; Arrouays, D.; Angers, D.A.; Martin, M.P.; Walter, C. Soil Carbon Stocks Under Different Land Uses and the Applicability of the Carbon Saturation Concept. Soil Tillage Res. 2019, 188, 53–58. [Google Scholar] [CrossRef]
  27. Pan, Y.; Birdsey, R.A.; Fang, J.; Houghton, R.; Kauppi, P.E.; Kurz, W.A.; Phillips, O.L.; Shvidenko, A.; Lewis, S.L.; Canadell, J.G.; et al. A Large and Persistent Carbon Sink in the World’s Forests. Science 2011, 333, 988–994. [Google Scholar] [CrossRef] [PubMed] [Green Version]
  28. Abdullahi, A.A.; Siwar, C.; Ismail, S.M.; Isahak, A. A Review on Carbon Sequestration in Malaysian Forest Soils: Opportunities and Barriers. Int. J. Soil Sci. 2015, 10, 17–27. [Google Scholar] [CrossRef]
  29. Poeplau, C.; Don, A. Sensitivity of Soil Organic Carbon Stocks and Fractions to Different Land-use Changes Across Europe. Geoderma 2013, 192, 189–201. [Google Scholar] [CrossRef]
  30. Ngo, K.M.; Turner, B.L.; Muller-Landau, H.C.; Davies, S.J.; Larjavaara, M.; Hassa, N.F.; Lum, S. Carbon Stocks in primary and Secondary Tropical Forests in Singapore. For. Ecol. Manag. 2013, 296, 81–89. [Google Scholar] [CrossRef]
  31. Abdullahi, A.C.; Siwar, C.; Shaharudin, M.I.; Anizan, I. The Effects of Forest Type and Land Use on Soil Carbon Stock in Malaysian Dipterocarps Forests. Int. J. Adv. Appl. Sci. 2018, 5, 11–17. [Google Scholar] [CrossRef]
  32. Malaysian Meterological Department. (Selangor, Malaysia). Weather forecast (2018–2019). Unpublished Report.
  33. World Weather Online. Long Miau Monthly Climate Average. Available online: https://www.worldweatheronline.com/long-miau-weather/sabah/my.aspx (accessed on 28 April 2021).
  34. Shukla, A.; Panchal, H.; Mishra, M.; Patel, P. Soil moisture estimation using Gravimetric Technique and FDR Probe Technique: A comparative analysis. Am. Int. J. Res. Form. Appl. Nat. Sci. 2014, 8, 89–92. [Google Scholar]
  35. Day, R.P. Particle Fractionation and Particle-Size Analysis. In Methods of Soil Analysis; Black, C.A., Ed.; Agronomy: Madison, WI, USA, 1965; pp. 545–567. [Google Scholar]
  36. Allison, L.E. Organic Carbon. In Methods of Soil Analysis; Agronomy: Madison, WI, USA, 1965; pp. 1367–1378. [Google Scholar]
  37. Hossain, M.; Aziz, C.; Saha, M. Relationship between soil physic-chemical properties and total viable bacterial counts in Sunderban mangrove forest, Bangladesh. Dhaka Univ. J. Biol. Sci. 2012, 21, 169–175. [Google Scholar] [CrossRef] [Green Version]
  38. Culman, S.; Mann, M.; Brown, C. Calculating cation exchange capacity, base saturation, and calcium saturation. Agric. Nat. Resour. 2019, 81, 6. Available online: https://ohioline.osu.edu/factsheet/anr-81 (accessed on 28 April 2021).
  39. Kueh, R.J.H.; Majid, N.M.; Ahmed, O.H.; Gandaseca, S. Assessment of carbon stock in chronosequence rehabilitated tropical forest stands in Malaysia. J. For. Environ. Sci. 2016, 32, 302–310. [Google Scholar] [CrossRef]
  40. Hong, L.C.; Hemati, Z.H.; Zakaria, R.M. Carbon Stock Evaluation of Selected mangrove Forests in Peninsular Malaysia and its potential Market Value. J. Environ. Sci. Manag. 2017, 20, 77–87. [Google Scholar]
  41. Hazra, A.; Gogtay, N. Biostatistics series module 3: Comparing groups: Numerical variables. Indian J. Dermatol. 2016, 61, 251–260. [Google Scholar] [CrossRef] [PubMed]
  42. Voltr, V.; Menšík, L.; Hlisnikovský, E.; Pospíšilová, L. The soil Organic Matter in Connection with Soil Properties and Soil Inputs. Agronomy 2021, 11, 779. [Google Scholar] [CrossRef]
  43. Martuti, N.K.T.; Setyowati, D.L.; Nugraha, S.B.; Mutiatari, D.P. Carbon stock potency of mangrove ecosystem at Tapak Sub-village Semarang, Indonesia. AACL Bioflux 2017, 10, 1524–1533. [Google Scholar]
  44. Suhaili, N.S.; Fei, J.L.J.; Sha’ari, F.W.; Idris, M.I.; Hatta, S.M.; Kodoh, J.; Besar, N.A. Carbon stock estimation of mangrove forest in Sulaman Lake Forest Reserve, Sabah, Malaysia. Biodiversitas J. Biol. Divers. 2020, 21, 5657–5664. [Google Scholar]
  45. Zhang, Y.-Y.; Wu, W.; Liu, H. Factors affecting variations of soil pH in different horizons in hilly regions. PLoS ONE 2019, 14, e0218563. [Google Scholar] [CrossRef]
  46. Keen, Y.C.; Jalloh, M.B.; Ahmed, O.H.; Sudin, M.; Besar, N.A. Soil organic matter and related soil properties in forest, grassland, and cultivated land use types. Int. J. Phys. Sci. 2011, 6, 7410–7415. [Google Scholar] [CrossRef]
  47. Navarro-Pedreño, J.; Almendro-Candel, M.B.; Zorpas, A.A. The increase of Soil Organic Matter Reduces Global Warming, Myth or Reality? Sci 2021, 3, 18. [Google Scholar] [CrossRef]
  48. Rennenberg, H.; Dannenmann, M. Nitrogen Nutritionof Trees in Temperate Forests-The Significance of Nitrogen Availability in the Pedosphere and Atmosphere. Forests 2015, 6, 2820–2835. [Google Scholar] [CrossRef]
  49. Amooh, M.K.; Bonsu, M. Effects of Soil Texture and Organic Matter on Evaporative Loss of Soil. J. Gl. Agric. Ecol. 2015, 3, 152–161. [Google Scholar]
  50. Jeyanny, V.; Husni, M.H.A.; Wan Rasidah, K.; Siva Kumar, B.; Arifin, A.; Kamarul Hisyam, M. Carbon Stocks in Different Carbon Pools of a tropical Lowland Forest and a Montane Forest with Varying Topography. J. Trop. For. Sci. 2014, 26, 560–571. [Google Scholar]
  51. Besar, N.B.; Suardi, H.; Phua, M.H.; James, D.; Mokhtar, M.B.; Ahmed, M.F. Carbon stock and sequestration potential of an agroforestry system in Sabah, Malaysia. Forests 2020, 11, 210. [Google Scholar] [CrossRef] [Green Version]
  52. Soewandita, H. Studi Kesuburan Tanah dan Analisis Kesesuaian Lahan Untuk Tanaman Perkebunan di Kabupaten Bengkalis. J. Sains Dan Teknol. Indones. 2008, 10, 128–133. [Google Scholar]
  53. Millar, N.; Baggs, E.M. Chemical Composition, or Quality, of Agroforestry Residues Influences N2O Emissions After Their Addition to Soil. Soil Biol. Biochem. 2004, 36, 935–943. [Google Scholar] [CrossRef]
  54. Perumal, M.; Wasli, M.E.; Lat, J. Effects of Enrichment Planting on the Soil Physicochemical Properties at Reforestation Sites Planted with Shorea macrophylla de Vriese in Sempadi Forest Reserve, Sarawak, Malaysia. In Proceedings of the International Symposium on Frontier in Tropical Forest Research: Progress in Joints Projects between Forest Department Sarawak and the Japan Research Consortium for Tropical Forests in Sarawak, Kuching, Sarawak, Malaysia, 21 September 2015; Forest Department Sarawak (FDS) and Japan Research Consortium for Tropical Forest in Sarawak (JRCTS): Kuching, Sarawak, Malaysia, June 2016; pp. 19–29. [Google Scholar]
  55. Harris, N.; Gibbes, S.; Potapov, P. Intact Forest Landscapes Matter for Climate Change. Here Are 3 Reasons Why. Available online: https://www.wri.org/blog/2017/01/intact-forest-landscapes-matter-climate-change-here-are-3-reasons-why (accessed on 11 September 2021).
  56. Ndakara, O.E. Litterfall and Nutrient Returns in Isolated Stands of Persea gratissima (Avocado Pear) in the Rainforest Zone of Southern Nigeria. Ethiopian J. Environ. Stud. Mngmt. 2011, 4, 42–50. [Google Scholar] [CrossRef]
  57. Köhler, L.; Hölscher, D.; Leuschner, C. High Litterfall in Old-growth and Secondary Upper Montane Forest of Costa Rica. Plant Ecol. 2008, 199, 163–173. [Google Scholar] [CrossRef] [Green Version]
  58. Park, B.B.; Rahman, A.; Han, S.H.; Youn, W.B.; Hyun, H.J.; Hernandez, J.; An, J.Y. Carbon and Nutrients Inputs by Litterfall in Evergreen and Deciduous Forests in Korea. Forests 2020, 11, 143. [Google Scholar] [CrossRef] [Green Version]
  59. Hertel, D.; Moser, G.; Culmsee, H.; Erasmi, S.; Horna, V.; Schuldt, B.; Leuschner, C. Below- and Above-ground Biomass and Net Primary Production in a Paleotropical Natural Forest (Sulawesi, Indonesia) as compared to Neotropical Forests. For. Ecol. Manag. 2009, 258, 1904–1912. [Google Scholar] [CrossRef]
  60. Jafarov, E.; Schaefer, K. The Importance of a Surface Organic Layer in Simulating Permafrost Thermal and Carbon Dynamics. Cryosphere 2016, 10, 465–475. [Google Scholar] [CrossRef] [Green Version]
  61. Xiao, S.; Zhang, J.; Duan, J.; Liu, H.; Wang, C.; Tang, C. Soil Organic Carbon Sequestration and Active Carbon Component Changes Following Different Vegetation Restoration Ages on Severely Eroded Red Soils in Subtropical China. Forests 2020, 11, 1304. [Google Scholar] [CrossRef]
Figure 1. The study area (Long Mio, Sabah, Malaysia) located on the south side of northern Sabah, near the border of Sabah-Sarawak, Malaysia and Sabah-Kalimantan, Indonesia. Reprinted from [11].
Forests 12 01621 g001
Figure 2. The relationship between carbon and nitrogen contents in the soils of Long Mio, Sabah, Malaysia.
Forests 12 01621 g002
Figure 3. Mean monthly litterfall (Mg ha−1) in intact forest, logged-over forest, and plantation forest at Long Mio, Sabah, Malaysia for November 2018–October 2019.
Forests 12 01621 g003
Table 1. Soil texture at three different depths (0–30 cm) of intact forest, logged-over forest, and plantation forest in Long Mio, Sabah, Malaysia.
Land UseDepth (cm)Sand (%)Silt (%)Clay (%)Texture
Intact Forest0–544 ± 4.3520 ± 2.0635 ± 4.11Clay Loam
5–1044 ± 3.8619 ± 1.1737 ± 5.26Clay Loam
10–3043 ± 3.4018 ± 3.0838 ± 4.10Clay Loam
Logged-Over Forest0–541 ± 7.9018 ± 2.0142 ± 9.04Clay
5–1044 ± 7.6912 ± 3.7643 ± 11.06Clay
10–3044 ± 8.6916 ± 3.2240 ± 9.02Clay
Plantation Forest0–556 ± 4.8119 ± 4.6324 ± 1.46Sandy Clay Loam
5–1067 ± 2.9711 ± 2.2221 ± 2.75Sandy Clay Loam
10–3069 ± 2.6215 ± 1.7715 ± 2.86Sandy Loam
Note: Values represent mean ± standard error of the measurements.
Table 2. Soil physical properties at three different depths (0–30 cm) of intact forest, logged-over forest, and plantation forest in Long Mio, Sabah, Malaysia.
Soil PropertiesDepth (cm)Land Use
Intact ForestLogged-Over ForestPlantation Forest
Moisture content (%)0–56.00 ± 0.62a8.00 ± 1.81a7.25 ± 2.28a
5–103.27 ± 0.31a4.84 ± 0.66a3.13 ± 0.90a
10–302.71 ± 0.34ab3.75 ± 0.40a1.35 ± 0.53b
Bulk Density (g cm−3)0–50.90 ± 0.04a0.83 ± 0.08a0.87 ± 0.05a
5–100.99 ± 0.06a0.91 ± 0.13a1.15 ± 0.12a
10–301.33 ± 0.04a1.14 ± 0.11a1.32 ± 0.10a
Notes: Values represent mean ± standard error of the measurements. Means with different letters within the same row indicate significant differences (p < 0.05) between the mean for the land uses based on the Tukey’s test.
Table 3. Soil chemical properties at three different depths (0–30 cm) of intact forest, logged-over forest, and plantation forest in Long Mio, Sabah, Malaysia.
Soil PropertiesDepth (cm)Land Use
Intact ForestLogged-Over ForestPlantation Forest
pH0–54.31 ± 0.14a4.21 ± 0.18a4.54 ± 0.09a
5–104.67 ± 0.16a4.50 ± 0.12a5.11 ± 0.38a
10–304.69 ± 0.14a4.68 ± 0.11a5.71 ± 0.48b
Organic matter (%)0–513.48 ± 1.27a14.62 ± 2.20a14.26 ± 4.30a
5–106.72 ± 0.40a8.53 ± 0.97a7.87 ± 1.24a
10–305.22 ± 0.40ab5.99 ± 0.53a3.34 ± 0.83b
Total Phosphorus (meq/100 g)0–50.29 ± 0.03a0.17 ± 0.07a0.27 ± 0.14a
5–100.86 ± 0.43a0.49 ± 0.24a0.16 ± 0.02a
10–300.26 ± 0.02a0.31 ± 0.21a0.02 ± 0.01a
Notes: Values represent mean ± standard error of the measurements. Mean values with different letters within the same row significant differences (p < 0.05) between the means for the land uses based on the Tukey’s test.
Table 4. Acid and base cations contents and cation exchange capacity at 3 soil depths for the various land uses in Long Mio, Sabah, Malaysia.
Land UseDepth (cm)Acid Cations (meq/100 g)Base Cations (meq/100 g)CEC (meq/100 g)
H+Al3+Mg2+Ca2+Na+K+
Intact Forest0–51.04 ± 0.183.97 ± 1.280.58 ± 0.122.47 ± 0.511.56 ± 0.371.12 ± 0.1810.75 ± 1.73
5–100.89 ± 0.125.99 ± 1.160.97 ± 0.332.47 ± 0.651.26 ± 0.251.50 ± 0.2713.09 ± 2.01
10–300.72 ± 0.145.71 ± 0.890.93 ± 0.254.23 ± 0.931.03 ± 0.121.80 ± 0.3414.43 ± 1.48
Logged-Over Forest0–51.47 ± 0.4110.28 ± 3.910.77 ± 0.242.33 ± 1.071.43 ± 0.491.55 ± 0.4617.84 ± 5.31
5–101.00 ± 0.284.86 ± 1.050.45 ± 0.061.60 ± 0.061.01 ± 0.390.70 ± 0.179.63 ± 1.37
10–300.91 ± 0.2510.68 ± 3.940.58 ± 0.181.35 ± 0.480.87 ± 0.110.75 ± 0.1814.63 ± 4.82
Plantation Forest 0–52.54 ± 0.392.91 ± 1.770.59 ± 0.242.95 ± 0.720.86 ± 0.050.87 ± 0.2510.72 ± 3.32
5–100.73 ± 0.110.87 ± 0.470.28 ± 0.031.47 ± 0.030.54 ± 0.021.30 ± 1.06 5.18 ± 1.43
10–300.46 ± 0.161.25 ± 0.650.25 ± 0.031.75 ± 0.460.57 ± 0.090.30 ± 0.044.58 ± 1.10
Note: Values represent mean ± standard error of the measurements.
Table 5. The carbon and nitrogen content and C:N ratio at three different depths (0–30 cm) of intact forest, logged-over forest, and plantation forest in Long Mio, Sabah, Malaysia.
Soil PropertiesDepth (cm)Land Use
Intact ForestLogged-Over ForestPlantation Forest
Carbon (%)0–55.38 ± 1.16a6.30 ± 1.70a5.26 ± 1.16a
5–102.91 ± 0.23a3.28 ± 1.07a3.75 ± 1.16a
10–302.23 ± 0.28a2.34 ± 0.77a1.86 ± 0.62a
Nitrogen (%)0–50.41 ± 0.09a0.37 ± 0.08a0.44 ± 0.12a
5–100.23 ± 0.06a0.24 ± 0.05a0.29 ± 0.12a
10–300.20 ± 0.03a0.11 ± 0.02a0.14 ± 0.08a
C:N0–516.81 ± 2.1517.03 ± 4.3811.95 ± 1.91
5–1024.25 ± 8.8513.67 ± 6.4512.93 ± 1.67
10–3020.27 ± 4.8121.27 ± 11.0413.29 ± 1.58
Notes: Values represent mean ± standard error of the measurements. Means with different letters within the same row indicate significant differences (p < 0.05) between the means for the land uses based on the Tukey’s test.
Table 6. Accumulated biomass, carbon and nitrogen content, and C:N ratio of the organic layer in intact forest, logged-over forest, and plantation forest at Long Mio, Sabah, Malaysia.
Land UseBiomass (Mg ha−1)Carbon (%)Nitrogen (%)C:N
Intact Forest4.46 ± 0.13a41.40 ± 0.68a1.31 ± 0.08a31.60 ± 2.16
Logged-Over Forest3.02 ± 0.13ab40.10 ± 1.33a1.19 ± 0.11a33.70 ± 4.11
Plantation Forest1.92 ± 0.09b38.79 ± 4.31a0.95 ± 0.04a40.83 ± 3.95
Notes: Values represent mean ± standard error of the measurements. Mean values with different letters within the same column indicate significant differences (p < 0.05) between the means for the land uses based on the Tukey’s test.
Table 7. Accumulated biomass, carbon and nitrogen contents, and C:N ratio of litterfall produced in intact forest, logged-over forest, and plantation forest at Long Mio, Sabah, Malaysia.
Land UseBiomass (Mg ha−1)Carbon (%)Nitrogen (%)C:N
Intact Forest6.59 ± 0.05a47.53 ± 0.90a1.19 ± 0.15a43.63 ± 5.71a
Logged-Over Forest6.50 ± 0.05a44.20 ± 2.46a1.40 ± 0.04a32.25 ± 1.71a
Plantation Forest7.41 ± 0.07a46.73 ± 0.27a1.03 ± 0.12a48.58 ± 5.31a
Notes: Values represent mean ± standard error of the measurements. Means with the same letters within the same column indicate no significant differences (p < 0.05) between the means for the land uses based on the Tukey’s test.
Table 8. Soil carbon stock for three different depths of soils at the intact forest, logged-over forest, and plantation forest at Long Mio, Sabah, Malaysia.
Land UseSoil Carbon Stock (Mg C ha−1)Total Soil Carbon Stock (Mg C ha−1)
0–5 cm5–10 cm10–30 cm
Intact Forest23.43 ± 3.03a16.35 ± 1.45a56.64 ± 5.58a96.42
Logged-Over Forest26.15 ± 8.06a14.14 ± 4.35a50.85 ± 16.24a91.14
Plantation Forest23.31 ± 6.20a13.70 ± 1.44a51.91 ± 18.93a88.92
Notes: Values represent mean ± standard error of the measurements. Means with the same letters within the same column indicate no significant differences (p < 0.05) between the means for the land uses based on the Tukey’s test.
Table 9. Total carbon stock (organic layer, litterfall, and soil) and carbon dioxide equivalent at the intact forest, logged-over forest, and plantation forest at Long Mio, Sabah, Malaysia.
Land UseCarbon Pools (Mg C ha−1)Total Carbon Stock (Mg C ha−1)CO2 Equivalent (Mg C ha−1)
Organic LayerLitterfallSoil
Intact Forest2.10 ± 0.23a3.10 ± 0.09a96.42 ± 4.21a101.62372.95
Logged-Over Forest1.42 ± 0.23ab3.05 ± 0.13a91.14 ± 7.23a95.61350.89
Plantation Forest0.90 ± 0.02b3.48 ± 0.09a88.92 ± 8.35a93.30342.41
Notes: Values represent mean ± standard error of the measurements. Means with the same letters within the same column indicate no significant differences (p < 0.05) between the means for the land uses based on the Tukey’s test.
Publisher’s Note: MDPI stays neutral with regard to jurisdictional claims in published maps and institutional affiliations.

