Feasibility of Species Origin Traceability by Hydrogen Stable Isotopes: Sample Case of Lymantria dispar L. (Lepidoptera: Erebidae)


Sino-French Joint Laboratory for Invasive Forest Pests in Eurasia, College of Forestry, Beijing Forestry University, Beijing 100083, China
*
Author to whom correspondence should be addressed.
Forests 2020, 11(11), 1209; https://doi.org/10.3390/f11111209
Submission received: 7 October 2020
/
Revised: 6 November 2020
/
Accepted: 13 November 2020
/
Published: 17 November 2020
Abstract
:Lymantria dispar L. (Lepidoptera: Erebidae) is an international quarantine pest with many hosts, widely distributed in Asia, Europe, and America. L. dispar is distributed mainly in the Eastern Monsoon Region of China. Currently, the most effective means of prevention and control of this pest are timely monitoring and early warning. However, their implementation is usually hampered by the lack of feasible methods and tools for fast tracking and traceability. Stable isotope technology can be used for material traceability, but in China, it is rarely employed for insect traceability. Therefore, using L. dispar as an example, we conducted a case study to explore the feasibility of using hydrogen stable isotopes for pest-source traceability. The grid data of hydrogen stable isotopes of global precipitation were downloaded from the Online Isotopes in Precipitation Calculator (OIPC; Bowen and Revenaugh, 2003, Bowen, 2017), and then, a zoning map of hydrogen stable isotopes of precipitation in mainland China was constructed using ArcGIS 10.4.1 (Esri, Redlands, CA, USA). The wings of 284 L. dispar adults captured in five regions in China were selected as experimental samples. A Finnigan Delta V Advantage Isotope Ratio Mass Spectrometer (Thermo Fisher Scientific, Inc., Waltham, Massachusetts, U.S.) and a Flash 2000 HT Elemental Analyzer (Thermo Fisher Scientific, Inc., Waltham, Massachusetts, U.S.) were used to measure the hydrogen stable isotope (δ2H) value of the samples. Then, using the recorded local precipitation hydrogen stable isotope of the sampling site, we performed a data simulation using R software (v.3.2.1; R Development Core Team, Vienna, Austria). A linear regression equation was next established: y = 1.186x − 13.247, where x represents the hydrogen stable isotope ratio of precipitation and y denotes the hydrogen stable isotope ratio of L. dispar. The t-test, F-test, and R2 test results confirmed the high significance and matching with the simulation data used in the model. To further verify the accuracy of the model, L. dispar samples from Chengdu in Sichuan Province were collected for model back-testing. The verification results also evidenced that the actual source of the L. dispar sample can be obtained based on the method applied and the model developed in this paper.
1. Introduction
1.1. Harm and Distribution of Lymantria Dispar
Lymantria dispar has a wide variety of host plants. The larvae feed on more than 500 species, including Populus spp., Salix spp., Pinus tabulaeformis, and Picea spp. Due to the variety of host species and abundant food sources of L. dispar, it is widely distributed in many areas, which hampers the effectiveness of control measures. L. dispar is distributed in Asia (mainly in China, North Korea, and Japan), Europe, and America [1]. Based on the morphological and biological characteristics and the distribution area of L. dispar, the population of the pest is divided into two subspecies: the European gypsy moth and the Asian gypsy moth [2]. The latter is further sub-divided into L. dispar asiatica and L. dispar japonica [3]. The Asian gypsy moth spreads faster and is more harmful than the European gypsy moth due to its stronger flying ability and wider range of host plant species [4].
Based on the climatic characteristics, the territory of China can be classified into three natural geo-regions: the Eastern Monsoon Region of China, the Arid and Semi-arid Region in Western China, and the Tibetan Plateau Region in China [5]. According to relevant domestic evidence, L. dispar is distributed mainly in northeast and northwest China, North China, South China, and Central China [6], a range that basically coincides with the Eastern Monsoon Region. Our experience with laboratory research on L. dispar has shown that L. dispar is rarely found in high-altitude and arid areas. The abundant precipitation in the eastern monsoon area and the concentration of a large number of cities and human populations provide favorable conditions for L. dispar survival and spread.
1.2. Common Insect Traceability Methods
The negative ecological and economic impacts of quarantine insects can be devastating. The identification and knowledge of the origin of invasive insects is essential not only for their effective monitoring and early warning but also for the establishment and implementation of relevant quarantine policies. The main reason for the current lack of attainable methods for research on the traceability and determination of the dissemination routes of insects is their small sizes and naturally large numbers, although certain physical marking methods have been used with low effectiveness. Other, more recent approaches, such as the use of implanted chips and radar tracking, can achieve ideal results but are complicated and costly. At this stage, the following main methods are implemented for insect tracking and tracing.
- A.
- Literature traceability
Literature traceability is based on information from the following sources: published papers; reports of forestry bureaus and forest protection stations in various provinces, cities, counties, and districts; and quarantine reports issued by airports and ports. Data are reviewed and sorted out according to the time and place of the report issuance, and the general diffusion route of a specific research object is analyzed. Literature provides authentic and reliable information that is more convincing than that obtained by other traceability methods. However, the completeness of document traceability records has certain limitations. Thus, document traceability is often combined with other traceability methods for analysis [7].
- B.
- Trajectory analysis
This method analyzes data of the specific trajectory of objects moving in the air (as a mass point). Trajectory analysis was first applied in the field of meteorology, mainly to analyze the path of the movement of gas masses in the atmosphere. Afterwards, the range of its research objects gradually expanded and included pollen, fungal spores, insects, etc. This approach relies on long-term observation and data recording [8].
- C.
- Traceability by pollen markers
The method of pollen marker traceability is applicable mainly to insects with flower-visiting habits. The source and transit area of an insect can be determined by identifying the pollen species carried by the insect and assessment of the data of the distribution area of the pollen plant [9,10]. The application of this method is limited only to insects-pollinators. Pollen identification is relatively difficult, but the introduction of and advances in scanning electron microscopy and DNA barcode technology have currently facilitated overcoming this obstacle. Moreover, the effectiveness of traceability depends on the distribution map of the pollen, making the entire research process relatively difficult.
1.3. Theoretical Basis of Stable Isotope Technology
Isotopes are nuclides that have the same atomic number but different mass numbers. Each nuclide has the same number of protons but a different number of neutrons. The relative ratio of the stable isotopes contained in a substance can be detected by gas chromatography–mass spectrometry (GC-MS) or liquid chromatography–mass spectrometry (LC-MS). Stable isotope analyses (primarily δ2H, δ13C, δ87Sr, δ15N, and δ34S) are most frequently used in ecology and related fields. We chose to use the stable isotope ratios of hydrogen in this experiment because this element is a constituent of water molecules, and since water is a substance essential for life, hydrogen can effectively be utilized as a natural marker element. Meanwhile, there is also a special precipitation hydrogen isotope database (https://wateriso.utah.edu/waterisotopes/pages/data_access/oipc.html), which is a reliable data source that we used in the experiment.
The isotopic composition of organisms is closely related to factors such as their metabolic mode and life cycle and the utilization of substances and elements. Each organism exchanges substances with the environment in which it lives through a range of physiological activities, such as breathing and eating. In nature, the distribution of stable isotopes in inorganic and organic substances often forms a specific temporal and spatial pattern. Through the material exchange between organisms and the environment, this geographical distribution pattern of stable isotopes can be transferred to organism tissues that move between regions with different isotope gradients. Therefore, the isotope composition of biological tissues is a specific natural attribute, and using stable isotopes utilizes this natural specificity for distinction among organisms from different geographical sources [11]. The duration of isotope information storage in the tissue depends on the element turnover rate in each specific tissue [12]. For example, some keratinous tissues, such as human hair and nails, bird feathers, and insect exoskeleton, are metabolically inert after their synthesis and, thus, they can retain, for a long time, the isotopic information of the location where they have been synthesized [13,14].
Stable isotope traceability involves the integrated application of multiple scientific fields, such as ecology and earth sciences. Currently, stable isotope technology has been well developed and used in ecology to establish the geographic origin of individual organisms or populations. For instance, Hobson (1999) used stable isotope technology to track the migration pattern of the North American monarch butterfly (Danaus plexippus) [15]. Additionally, Zhihua et al. (2018) used stable hydrogen isotope technology to find that Bactrocera dorsalis caught in Xinfadi Market and Bolong Fort in Beijing, China, had come from the Fujian region in southern China [16]. In China, few studies have been conducted on the use of stable isotope technology for insect traceability.
2. Materials and Methods
2.1. Sample Collection
In this experiment, from May 2016 to June 2019, a total number of 284 L. dispar adults were captured in five geographic regions: Luobei in Heilongjiang, Charisu in Neimenggu, Tangquan in Hebei, Lu’an in Anhui, and Nujiangzhou in Yunnan. The following specific method for sample collection was used. For insect trapping, in the early stage of L. dispar emergence, we used triangular traps (Beijing Zhongjie Sifang Biology Co. Ltd., Beijing, China) with an inner lure core containing a L. dispar attractant (Beijing Zhongjie Sifang Biology Co. Ltd., Beijing, China). The distance between each trap was at least 10 m. Three traps were placed at each sample collection site. The captured L. dispar individuals were put into 6 × 6 cm sulfuric acid paper bags, and the latitude, longitude, and altitude of all sampling points were recorded. Finally, L. dispar samples were transported to the laboratory, where they were stored in a refrigerator at −20 °C for further use in subsequent experiments.
2.2. Obtaining Precipitation Hydrogen Isotope Data of the Sample Plots
In the early 1960s, the Global Network for Isotopes in Precipitation (GNIP) was established by the International Atomic Energy Association (IAEA) and the World Meteorological Organization (WMO). This global network of precipitation monitoring stations still exists and is constantly evolving. It collects precipitation stable isotope data at a monthly time resolution from almost 400 stations, providing an incredibly reliable and extensive resource for temporal, climatic, and geospatial research on precipitation isotope ratios [17]. The Online Isotopes in Precipitation Calculator (OIPC, https://wateriso.utah.edu/waterisotopes/pages/data_access/oipc.html) is a website that can be accessed directly. The OIPC consists of a simple HTML form that allows user entry of a site location and elevation parameters and returns estimated δ2H values for the specified location, entering the latitude and longitude in decimal degrees, with East and North positive and West and South negative. Altitude should be entered in meters above sea level. We downloaded the annual average value of the δ2H values of precipitation at each sample collection location from the database.
2.3. Acquisition of Sample Hydrogen Isotope Data
In this study, 10 L. dispar adults were selected as the test sample in each trap. We used scissors to separate the lepidopteran from the chest cavity. The lepidopteran samples were then thoroughly immersed in deionized water for 30 min. Next, we soaked the sample in a methanol: chloroform (2:1) mixture for two hours to degrease it. Further, we discarded the used waste liquid and thoroughly cleaned the lepidopteran twice with deionized water, followed by soaking for 30 min. Then, the sample was, again, soaked in a mixture of methanol: chloroform (2:1) for two hours, followed by its rinsing with deionized water three times. Then, the lepidopteran specimens were placed in a drying tube and dried in an oven at a constant temperature of 60 °C for 48 h. The dried lepidopteran samples were ground with a grinder (grinding time: 10 min), and the sample was weighed using a microbalance with an accuracy of 0.001 g. Next, the weighed sample powder was wrapped in tin foil and left undisturbed at room temperature for 2–3 days to equilibrate before examination by a spectrometer. Isotope ratio measurements were performed at the Stable Isotope Geosciences Facility at Tsinghua University (Shenzhen, Guangdong Province, China). A Finnigan Delta V Advantage Isotope Ratio Mass Spectrometer (Thermo Fisher Scientific, Inc., Waltham, Massachusetts, U.S.) and a Flash 2000 HT Elemental Analyzer (Thermo Fisher Scientific, Inc., Waltham, Massachusetts, U.S.) were used to measure the hydrogen stable isotope (δ2H) value of the samples. We used keratin standard in each group of lepidopteran samples analyzed, allowing us to estimate exchangeable hydrogen using the comparative equilibration method [18].
2.4. Test Data Analysis
δ2H is shown in parts per thousand (‰) deviation from a standard (Vienna Standard Mean Ocean Water (VSMOW)) [19]. We employed the following Formula:
where δ2H is the thousandth difference between the isotope ratio of the sample and the isotope ratio of the standard material; Isotope ratiosample is the ratio of the abundance of heavy hydrogen to light hydrogen in L. dispar, and Isotope ratiostandard is the isotopic ratio of the international standard VSMOW (as a constant: 1.5575 × 10⁻⁴).
A regression model was then used to fit the relationship between the δ2H value of L. dispar and the δ2H value of precipitation. To test the significance of the explanatory variables of the regression model, we used a t-test, whereas an F-test was utilized to analyze the overall significance of the regression model. Finally, an R2 test and residual test were implemented to assess the fitness of the model.
All statistical analyses were performed by R 3.6.1 software. The δ2H value data of precipitation were obtained by precipitation isotope content query on a website jointly established by IAEA and WMO. Next, we used ArcGIS 10.4.1 software to draw a regional map of the precipitation isotope in mainland China. Further, Origin 9.0 software was utilized to draw the standard curve equation of the relationship between L. dispar and precipitation, based on δ2H stable isotope data and the residual diagram for test analysis.
3. Results
3.1. Distribution of Stable Hydrogen Isotope in Precipitation in Mainland China
We downloaded raster data of the global precipitation δ2H average value from the global precipitation isotope database [20,21]. A zoning map of hydrogen stable isotopes in the precipitation in mainland China was constructed using ArcGIS 10.4.1 (Figure 1, Beijing Coordinate System 1954). It can be clearly seen from Figure 1 that the δ2H value of precipitation had regular changes in the Eastern Monsoon Region in of China, with a slight decreasing gradient from south to north. This isotope base map was later used as the basis for L. dispar source determination. The isotope values of the test insects were utilized to calculate the isotope values of the precipitation in the theoretically corresponding environment to establish the source location of the test insects.
3.2. δ2H of L. dispar Populations in the Five Studied Geographical Locations in China
We imported the latitude, longitude, and altitude data of the L. dispar sampling site into the OIPC to obtain the theoretical value of precipitation δ2H at the corresponding location. The value of δ2H of L. dispar was measured by an isotope experiment (Table 1). As can be seen in Table 1, the following results were obtained. In Luobei in Heilongjiang, Charisu in Neimenggu, Tangquan in Hebei, and Lu’an in Anhui, where the altitude difference is small, the δ2H value of precipitation increased with the decrease in the latitude. The sampling site in Nujiangzhou in Yunnan is located at the lowest latitude among these five regions (the δ2H value in precipitation rises with a decrease in latitude). However, due to its very high altitude (the δ2H value in precipitation decreases with an increase in altitude), the superimposed effect of the two values led to obtaining a lower δ2H value of precipitation in this area than the ones in Charisu in Neimenggu, Tangquan in Hebei, and Lu’an in Anhui.
3.3. Use of Software R to Model and Test L. dispar Data
Based on the data analysis process presented in Table 2 and Table 3, we performed a regression analysis using the following equation: y = 1.186x − 13.247. The results of the t-test showed high statistical significance of the explanatory model variables. Additionally, the F-test data also revealed that the overall model was highly significant. The value obtained by the R2 test was 0.990, which is close to 1, indicating that the model fits well to the empirical data analyzed.
3.4. Use of Origin Software to Test the L. dispar Model
We imported the data into Origin 9.0 and performed linear fitting to obtain the standard curve equation (Figure 2a) and the residual diagram (Figure 2b–d). The linear regression equation obtained is y = 1.186x − 13.247, p < 0.001; *** indicates a high degree of model matching by t-test; r2 = 0.990 indicates a high degree of fit by R2 test.
In the histogram (Figure 2b), the x-axis is the residual value and the y-axis is the frequency of the residual. The normal distribution curve in the graph represents the state of the data when the residuals obey the normal distribution. As can be seen from Figure 2b, the style of the histogram roughly conforms to the curve, which means that the data residuals follow a normal distribution. A normal probability plot is a kind of scatter plot (Figure 2c). The x-axis is the cumulative frequency distribution of residuals and the y-axis is the cumulative probability of theoretical normal distribution. The straight lines in the graph represent the state of the data when the residuals obey the normal distribution. As shown in Figure 2c, the points are approximately uniformly distributed around the line, which proves that the residuals obey the normal distribution. The data points in Figure 2d are randomly and uniformly distributed on both sides of y = 0, indicating good performance of the residual data. The aforementioned test results confirm the effectiveness of the linear model developed in our study.
3.5. Model Checking
The L. dispar samples from Chengdu in Sichuan were selected for model testing. First, the sample was processed following the test procedure, and the isotope determination was performed. Then, based on the L. dispar regression model equation y = 1.186x − 13.247 developed in this paper, the δ2H measurement value of L. dispar in the Chengdu area was used to calculate the precipitation δ2H value of its theoretical corresponding location. Next, we analyzed the geographical area in combination with the zoning map to test whether it could indicate the actual source, Chengdu.
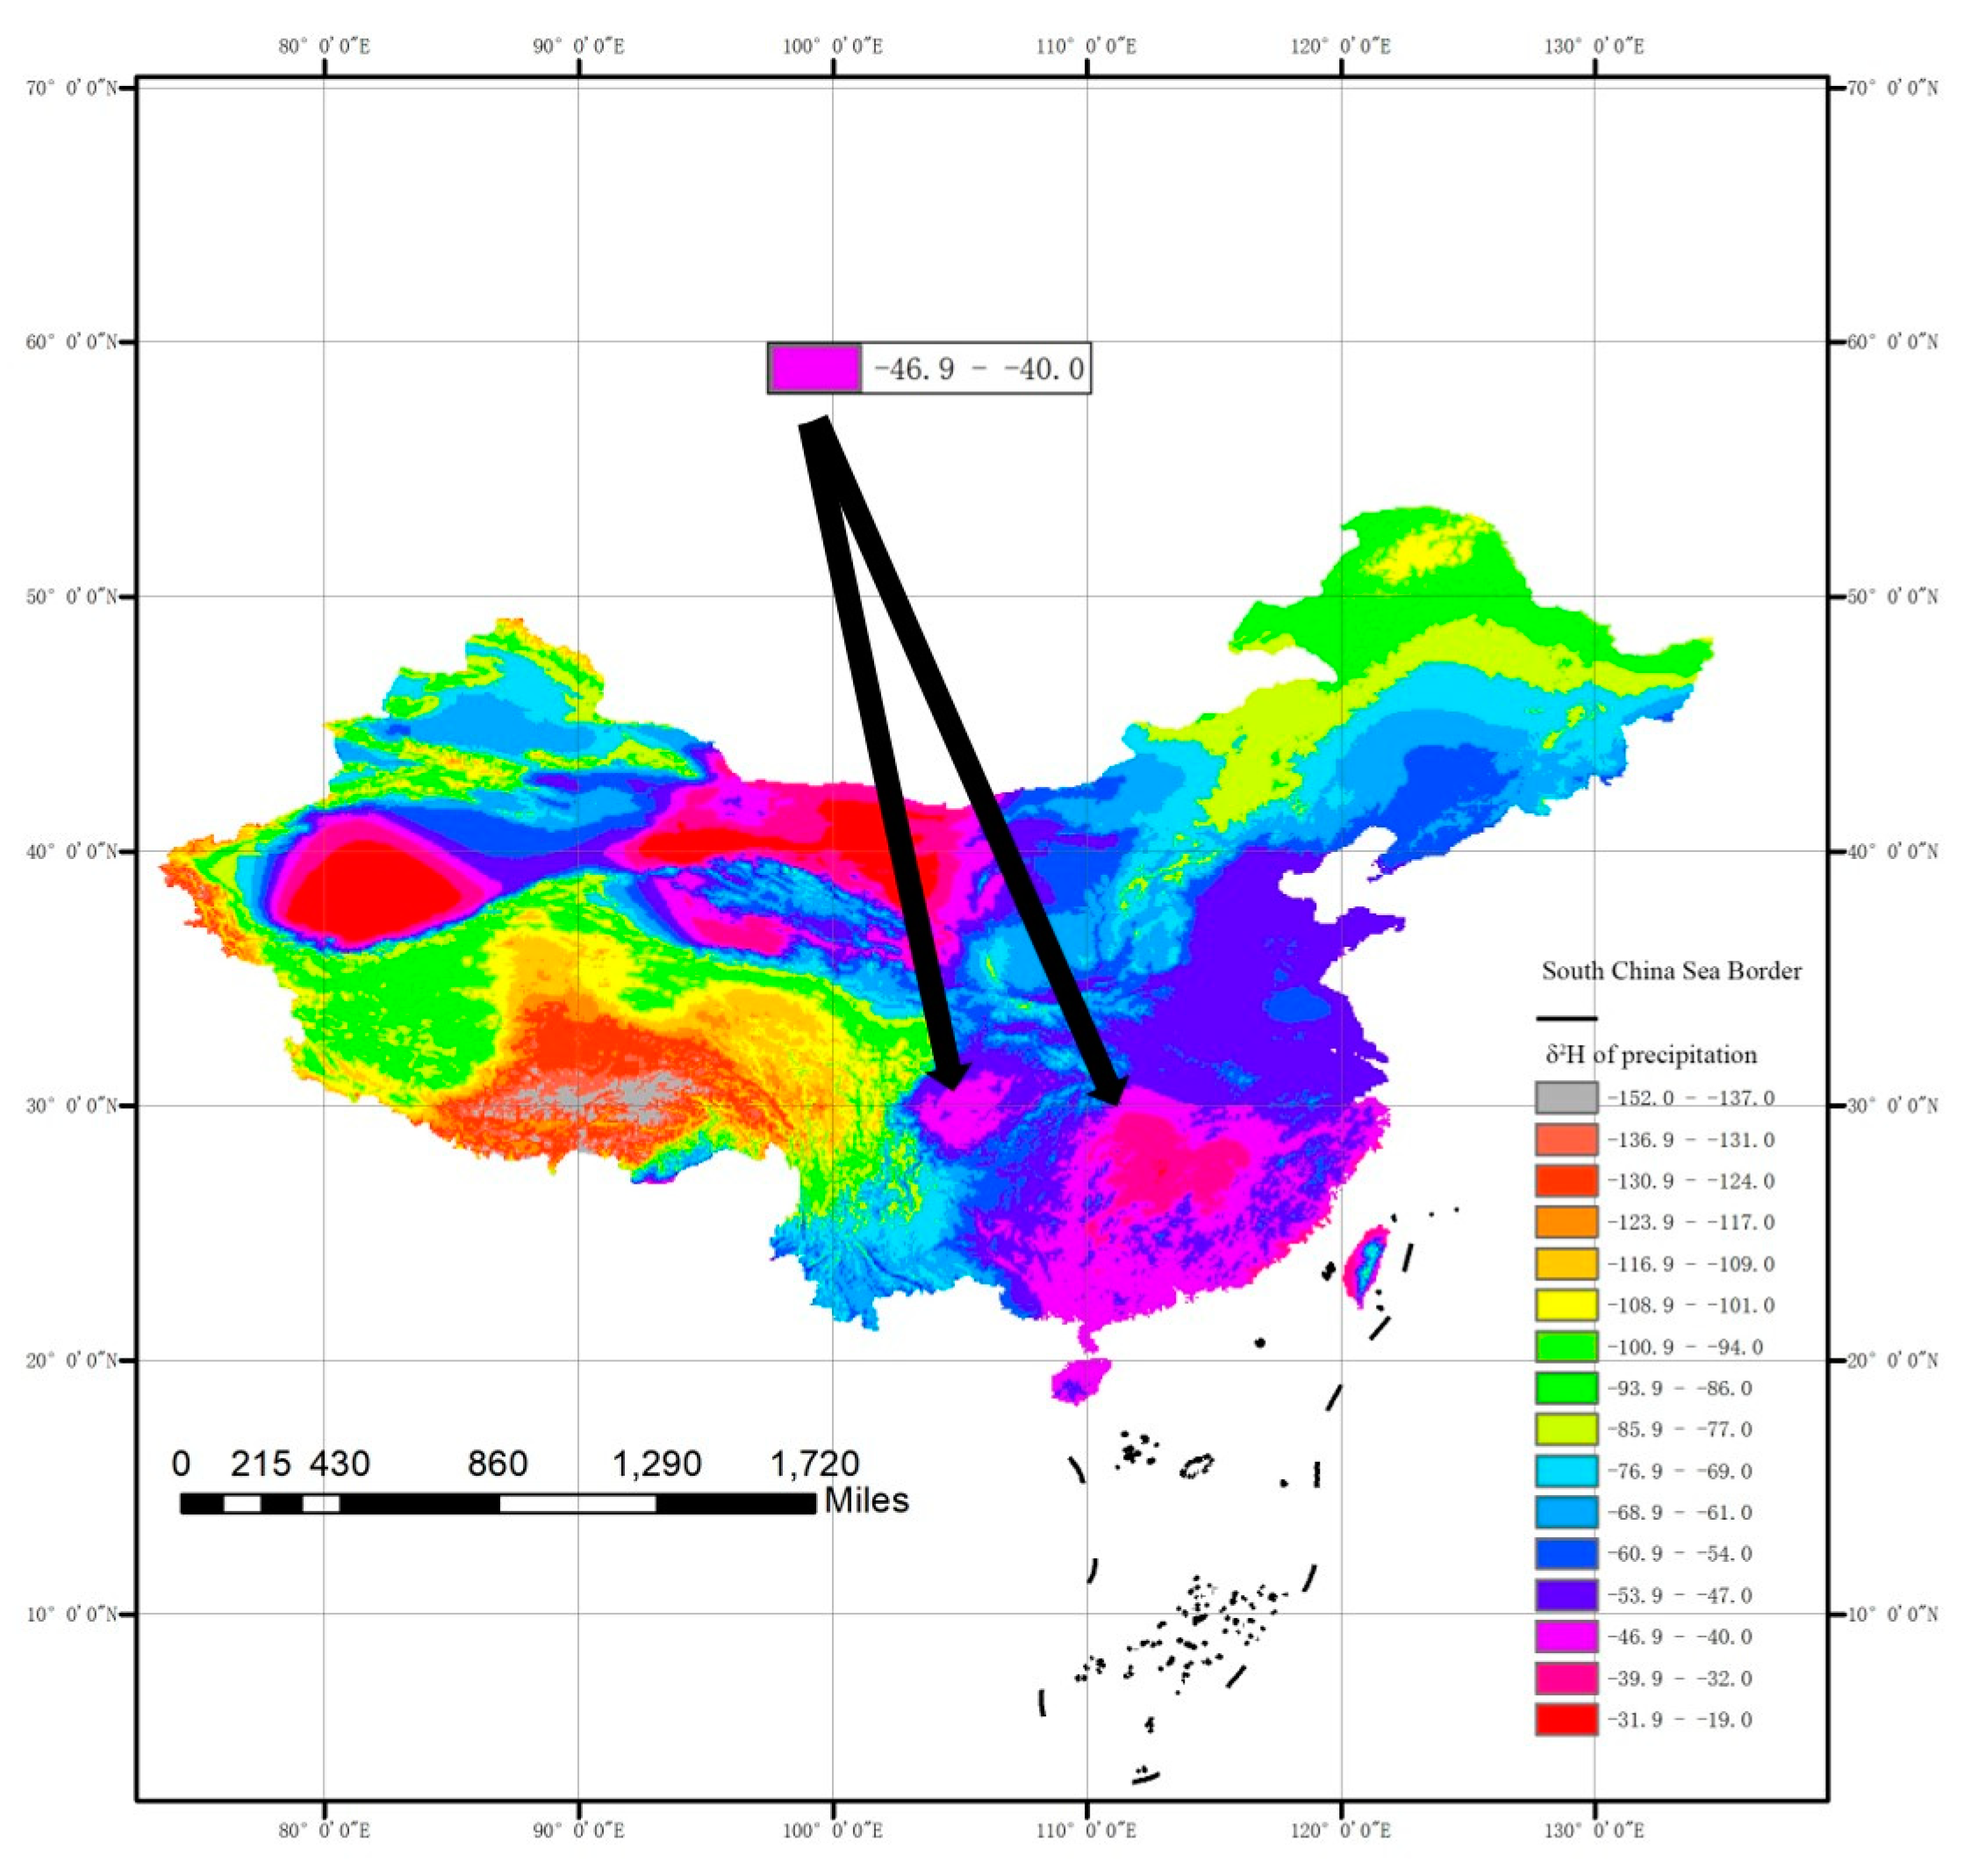
As can be seen in Table 4, based on the δ2H measurement value of two batches of L. dispar samples, the δ2H value of precipitation at the corresponding location was between −43.04 ‰ and −43.80 ‰. Further, we found the color block corresponding to this value in Figure 3 and established the two areas, the Sichuan Basin and Central China, where a ring-like distribution was observed. The actual source of this sample was Chengdu in the Sichuan Basin, indicating that the model constructed in this paper successfully detected its source on the basis of the obtained information.
4. Discussion
The results of our model verification show that geographic information, including the true origin of the L. dispar, was obtained in the zoning map using stable H-isotope technology. However, our results indicated not only the Sichuan Basin but also a ring-like area in Central China. This outcome reveals that this was a range indication in the zoning map which could be distinguished only in the large-scale range of ground sources, such as Central, North, and northeast China. The accuracy of the data in the northeast region was the highest, and the division of the regions was the most detailed. Therefore, to improve the accuracy of traceability, it is necessary to superimpose other discrimination conditions to further restrict the indication area. It was mentioned in the preface that other elements, such as C, N, S, and Sr, can also be used in stable isotope traceability technology; these elements have different geographic distribution patterns. If many stable isotopes, such as C and N, are combined as markers for population tracking, each element would characterize a corresponding indicator area. The combined analysis of these different indicator areas can further improve the accuracy and reliability of stable isotope technology traceability [22]. Different research objects can also be subjected to other traceability methods for analysis. The pollen tracing method can be selected when a research object (particularly insects) has the behavior of visiting flowers. On the other hand, the trajectory analysis method can be selected if an object has a migration behavior. The choice of a larger number of methods improves different aspects of the accuracy of traceability.
Currently, the main problems with the traceability of most alien invasive or quarantine insects that need to be studied and resolved are as follows.
- No effective traceability index system of different species and different geographical sources of insects has been fully established;
- The influence of climate, topography, geology, and other factors on the isotope composition of insects is not completely clear, and little research has been conducted on the isotope composition of insect tissues;
- The research objects for which stable isotope technology is applied for insect traceability are still limited to adults. Therefore, the significance of the traceability of other insect stages, such as eggs, larvae, and pupae, as well as the isotope conversion ratio at each insect stage, need to be further explored. The research and application of stable isotope traceability in insects is conducive to the establishment and improvement of rapid quarantine systems and has practical significance for effective quarantine measures against invasive insects.
5. Conclusions
The results of this experiment revealed a linear correlation between the δ2H value of L. dispar and the δ2H value of precipitation. The zoning map of precipitation isotopes in mainland China provides a certain degree of geographical indication. The combined application of the unary regression model and the precipitation zoning map can be used for large-scale traceability of L. dispar from a number of unknown sources. This is a novel approach to traceability in the field of animal and plant quarantine.
Author Contributions
Z.Q. and J.S. conceived and designed the experiments; Z.Q. performed the experiments and analyzed the data. Z.Q. wrote the paper and it was checked by J.S. All authors have read and agreed to the published version of the manuscript.
Funding
This research was funded by the Fundamental Research Funds for the Central Universities (No. 2016ZCQ07) and General Program of National Natural Science Foundation of China (31770687).
Acknowledgments
We would like to thank Yifan Zuo for assisting with the field sample collection. We also would like to thank the Stable Isotope Geosciences Facility at Tsinghua University for sample analysis. This work was funded by the Fundamental Research Funds for the Central Universities (No. 2016ZCQ07) and General Program of National Natural Science Foundation of China (31770687).
Conflicts of Interest
The authors declare no conflict of interest.
References
- Lu, X.Y.; Chen, H.J.; Chen, N.Z.; Li, Z.H.; Wan, F.H.; Wang, Z.L. Potential geographic distribution of Asian gypsy moth, Lymantria dispar, in North America. Insect Knowl. 2009, 46, 398–402. [Google Scholar]
- Zeng, J.-Y.; Vuong, T.-M.-D.; Shi, J.-H.; Shi, Z.-B.; Guo, J.-X.; Zhang, G.; Bi, B. Avermectin stress varied structure and function of gut microbial community in Lymantria dispar asiatica (Lepidoptera: Lymantriidae) larvae. Pestic. Biochem. Physiol. 2020, 164, 196–202. [Google Scholar] [CrossRef] [PubMed]
- Zhou, X.; Chen, Y.; Yang, D.; Chen, N.Z. A molecular phylogeny of gypsy moth population inferred from DNA sequence of COI gene. Phytosanitary 2009, 23, 7–9. [Google Scholar]
- Huang, P.F.; Yin, Y.S. Interpretation of Canada’s new policy on plant quarantine for incoming marine vessels. China Insp. Quar. 2010, 12, 39–40. [Google Scholar]
- Xia, J.; Duan, Q.Y.; Luo, Y.; Xie, Z.H.; Liu, Z.Y.; Mo, X.G. Climate change and water resources: Case study of Eastern Monsoon Region of China. Adv. Clim. Chang. Res. 2017, 8, 63–67. [Google Scholar] [CrossRef]
- Xu, N.; Sun, B.L. Occurrence and control of gypsy moth. Mod. Agric. Technol. 2009, 17, 172–173. [Google Scholar]
- Wan, X. Inference on the Origin, Colonization Routes and Dispersal Patterns of the Oriental Friut Fly, Bactrocera dorsalis (Hendel), Based on Molecular Markers. Ph.D. Thesis, Southwest University, Chongqing, China, 2012. [Google Scholar]
- Xiaoyue, D.; Xueyan, Z.; Chunxian, J.; Yue, Z.; Qing, L.; Rulin, W.; Chuanhong, F.; Li, M.; Xuanwu, W.; Hui, T. Source Analysis of fall armyworm Spodoptera frugiperda (J. E. Smith) invaded Western Sichuan Plateau. Plant Prot. 2020, 46, 78–84. [Google Scholar]
- Hendrix, W.H.; Showers, W.B. Tracing Black Cutworm and Armyworm (Lepidoptera: Noctuidae) Northward Migration Using Pithecellobium and Calliandra Pollen. Environ. Entomol. 1992, 21, 1092–1096. [Google Scholar] [CrossRef]
- Lingren, P.D.; Bryant, V.M., Jr.; Raulston, J.R.; Pendleton, M.; Westbrook, J.; Jones, G.D. Adult Feeding Host Range and Migratory Activities of Com Earworm, Cabbage Looper, and Celery Looper (Lepidoptera: Noctuidae) Moths as Evidenced by Attached Pollen. J. Econ. Entomol. 1993, 86, 1429–1439. [Google Scholar] [CrossRef]
- Guo, B.L.; Wei, Y.M.; Pan, J.R. Progress in the application of isotopic fingerprint analysis to food origin traceability. J. Agric. Eng. 2007, 3, 294–299. [Google Scholar]
- Hobson, K.A.; Clark, R.W. Assessing Avian Diets Using Stable Isotopes I: Turnover of 13C in Tissues. Condor 1992, 94, 181–188. [Google Scholar]
- Schell, D.M.; Saupe, S.M.; Haubenstock, N. Bowhead Whale (Balaena mysticetus) growth and feeding as estimated by δ13C techniques. Mar. Biol. 1989, 103, 433–443. [Google Scholar] [CrossRef]
- Mizutani, H.; Fukuda, M.; Kabaya, Y.; Wada, E. Carbon isotope ratio of feathers reveals feeding behavior of cormorants. Auk 1990, 107, 400–403. [Google Scholar] [CrossRef]
- Hobson, K.A.; Taylor, W.O.R. Stable Isotopes (δD and δ13C) Are Geographic Indicators of Natal Origins of Monarch Butterflies in Eastern North America. Oecologia 1999, 120, 397–404. [Google Scholar] [CrossRef] [PubMed]
- Zhao, Z.; Lu, Z.; Reddy, G.V.; Zhao, S.; Lin, G.; Ding, J.; Wu, J.; Li, Z. Using Hydrogen Stable Isotope Ratios to Trace the Geographic Origin of the Population of Bactrocera dorsalis (Diptera: Tephritidae) Trapped in Northern China. Fla. Entomol. 2018, 101, 244–248. [Google Scholar] [CrossRef]
- Bowen, G.J.; Wilkinson, B. Spatial distribution of δ18O in meteoric precipitation. Geology 2002, 30, 315–318. [Google Scholar]
- Wassenaar, L.I.; Hobson, K.A. Comparative equilibration and online technique for determination of non-exchangeable hydrogen of keratins for use in animal migration studies. Isot. Environ. Health Stud. 2003, 39, 211–217. [Google Scholar] [CrossRef] [PubMed]
- Tanaka, R.; Nakamura, E. Determination of 17O excess of terrestrial silicate/oxide minerals with respect to Vienna Standard Mean Ocean Water (VSMOW). Rapid Commun. Mass Spectrom. 2013, 27, 285–297. [Google Scholar] [CrossRef]
- Bowen, G.J.; Wassenaar, L.I.; Hobson, K.A. Global application of stable hydrogen and oxygen isotopes to wildlife forensics. Oecologia 2005, 143, 337–348. [Google Scholar] [PubMed]
- Bowen, G.J. Gridded Maps of the Isotopic Composition of Meteoric Waters. 2011. Available online: http://www.waterisotopes.org (accessed on 26 October 2019).
- Murray, I.W.; Lease, H.M.; Hetem, R.S.; Mitchell, D.; Fuller, A.; Woodborne, S. Stable isotope analysis of diet confirms niche separation of two sympatric species of Namib Desert lizard. Integr. Zool. 2016, 11, 60–75. [Google Scholar] [CrossRef] [PubMed] [Green Version]
Figure 1.
Zoning map of hydrogen stable isotopes during precipitation in mainland China.
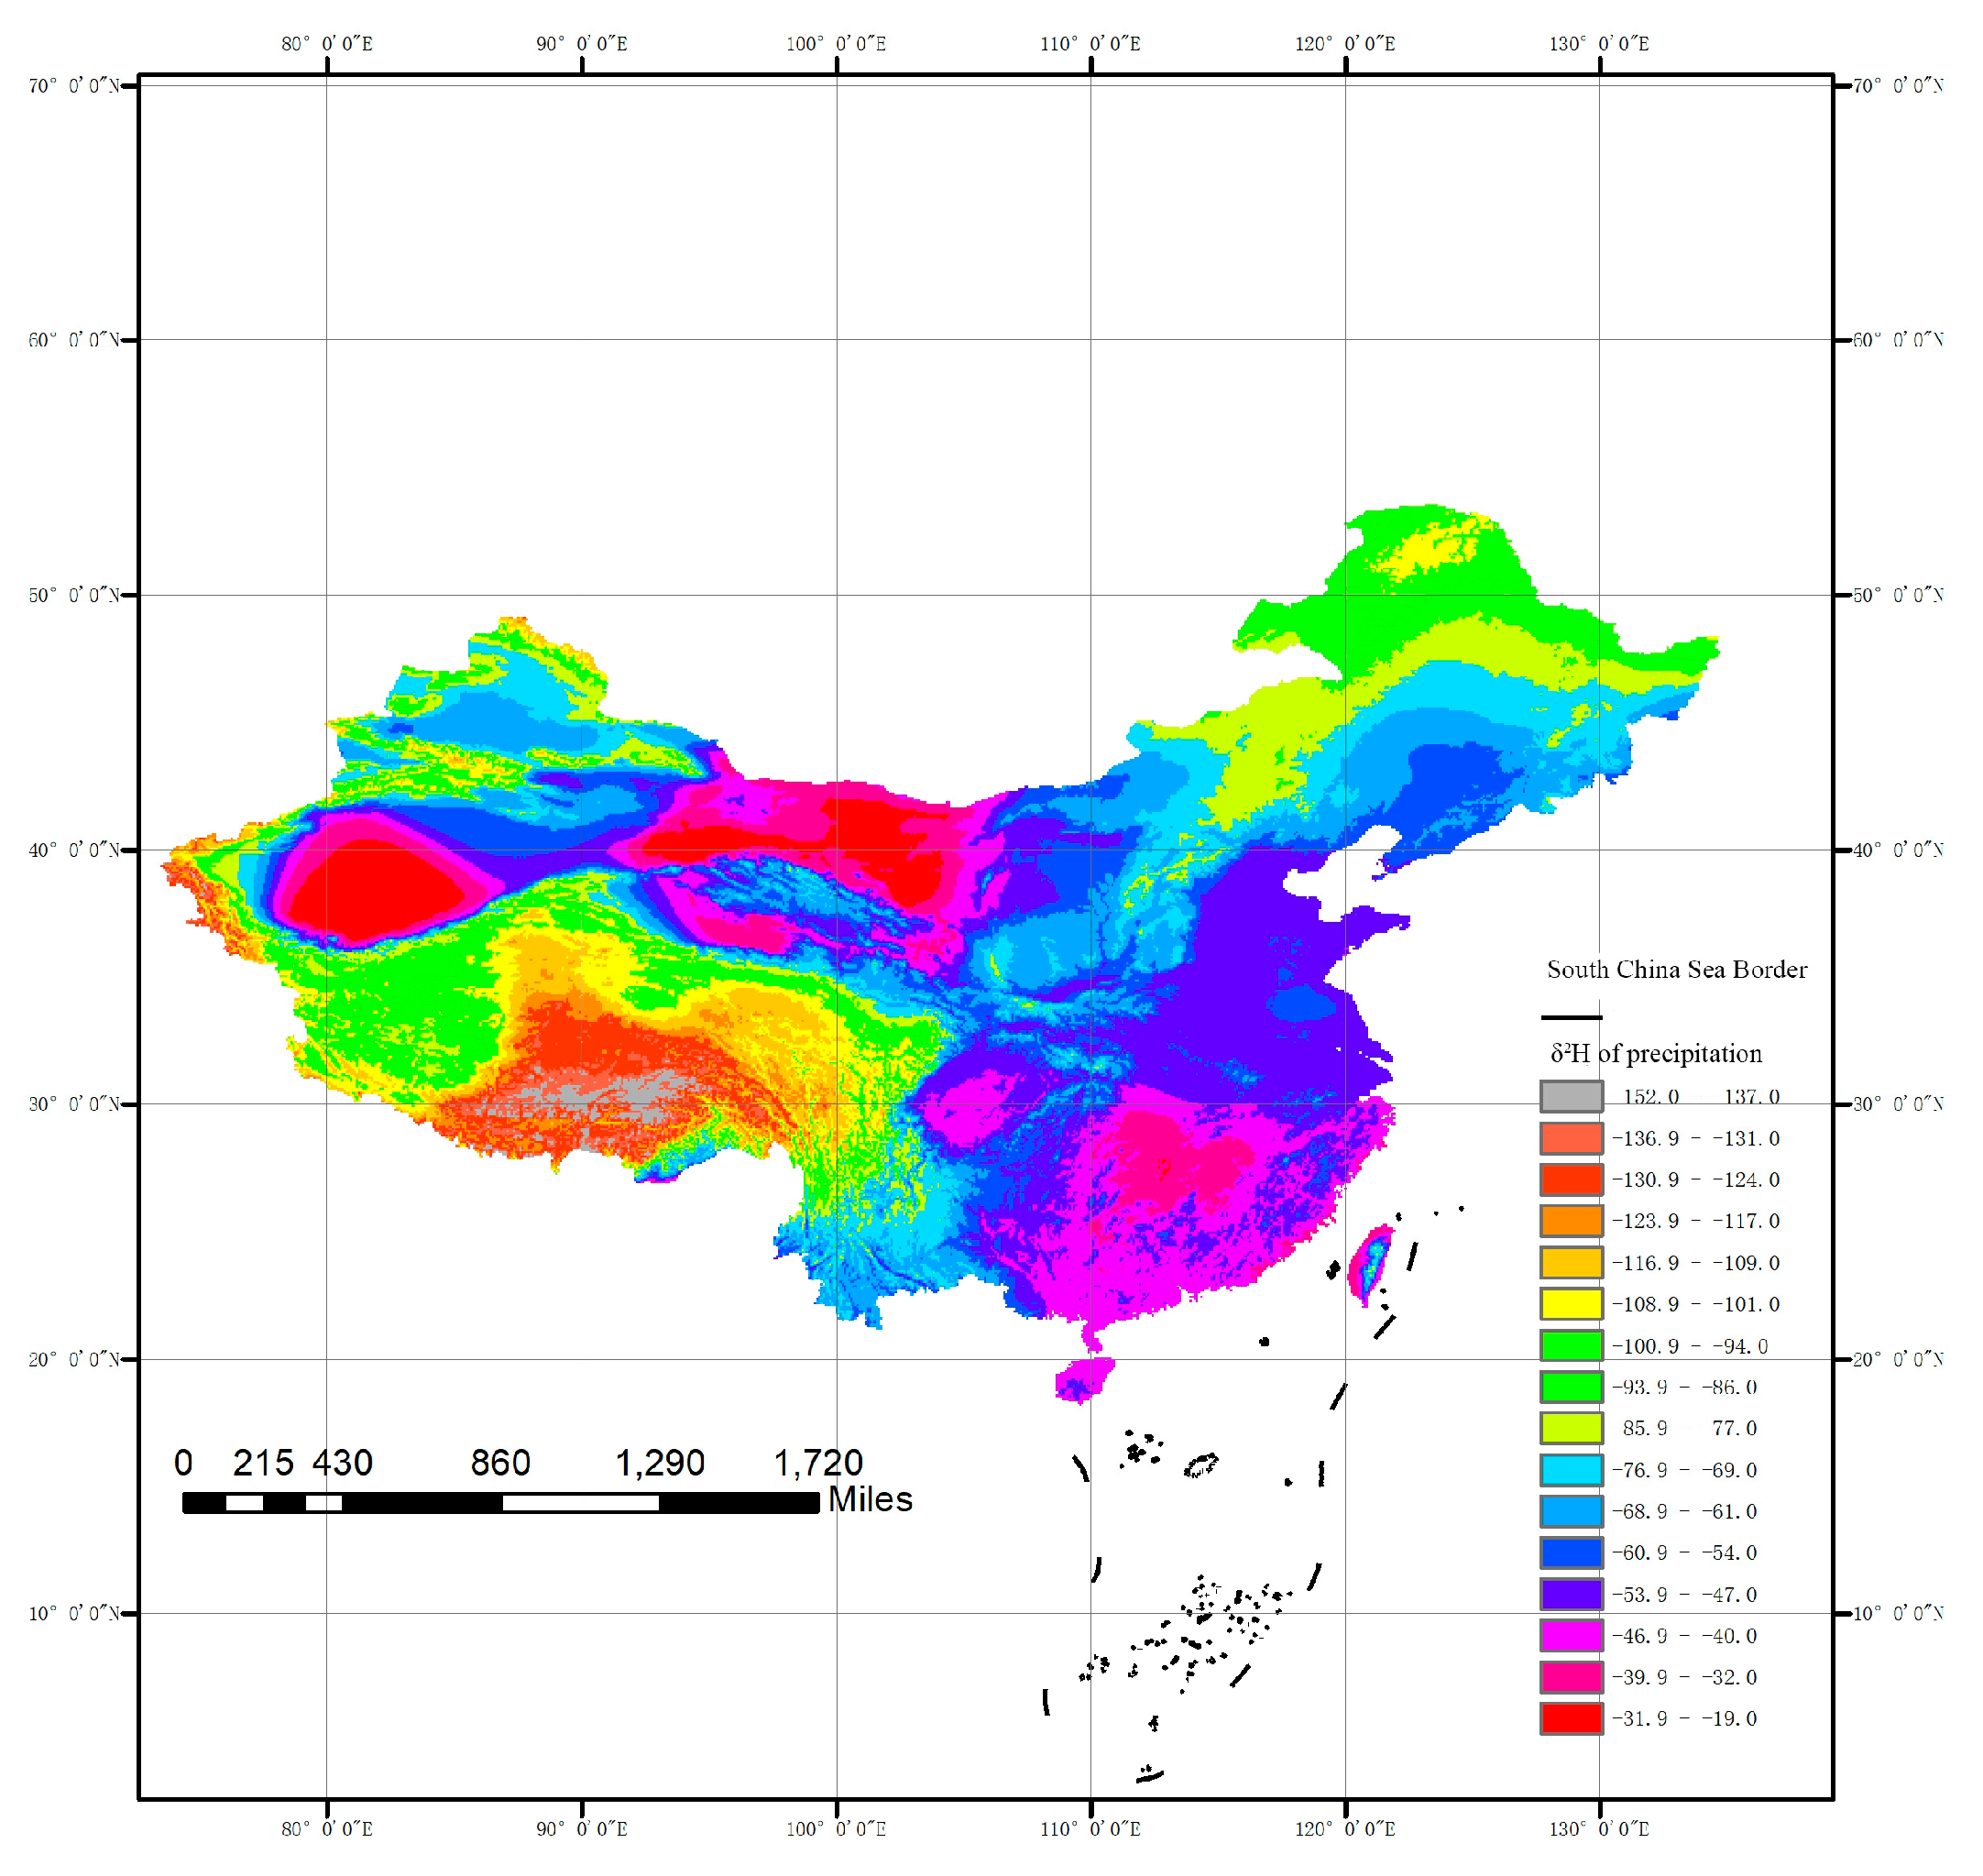
Figure 2.
Results of L. dispar model testing by Origin software. (a) The standard curve equation describing the relationship between L. dispar and precipitation based on δ2H value (the solid line indicates linear regression; the dotted line represents the 95% confidence interval); (b) Data residual histogram with a normal curve; (c) Normal probability plot; (d) Independent variable residual plot.
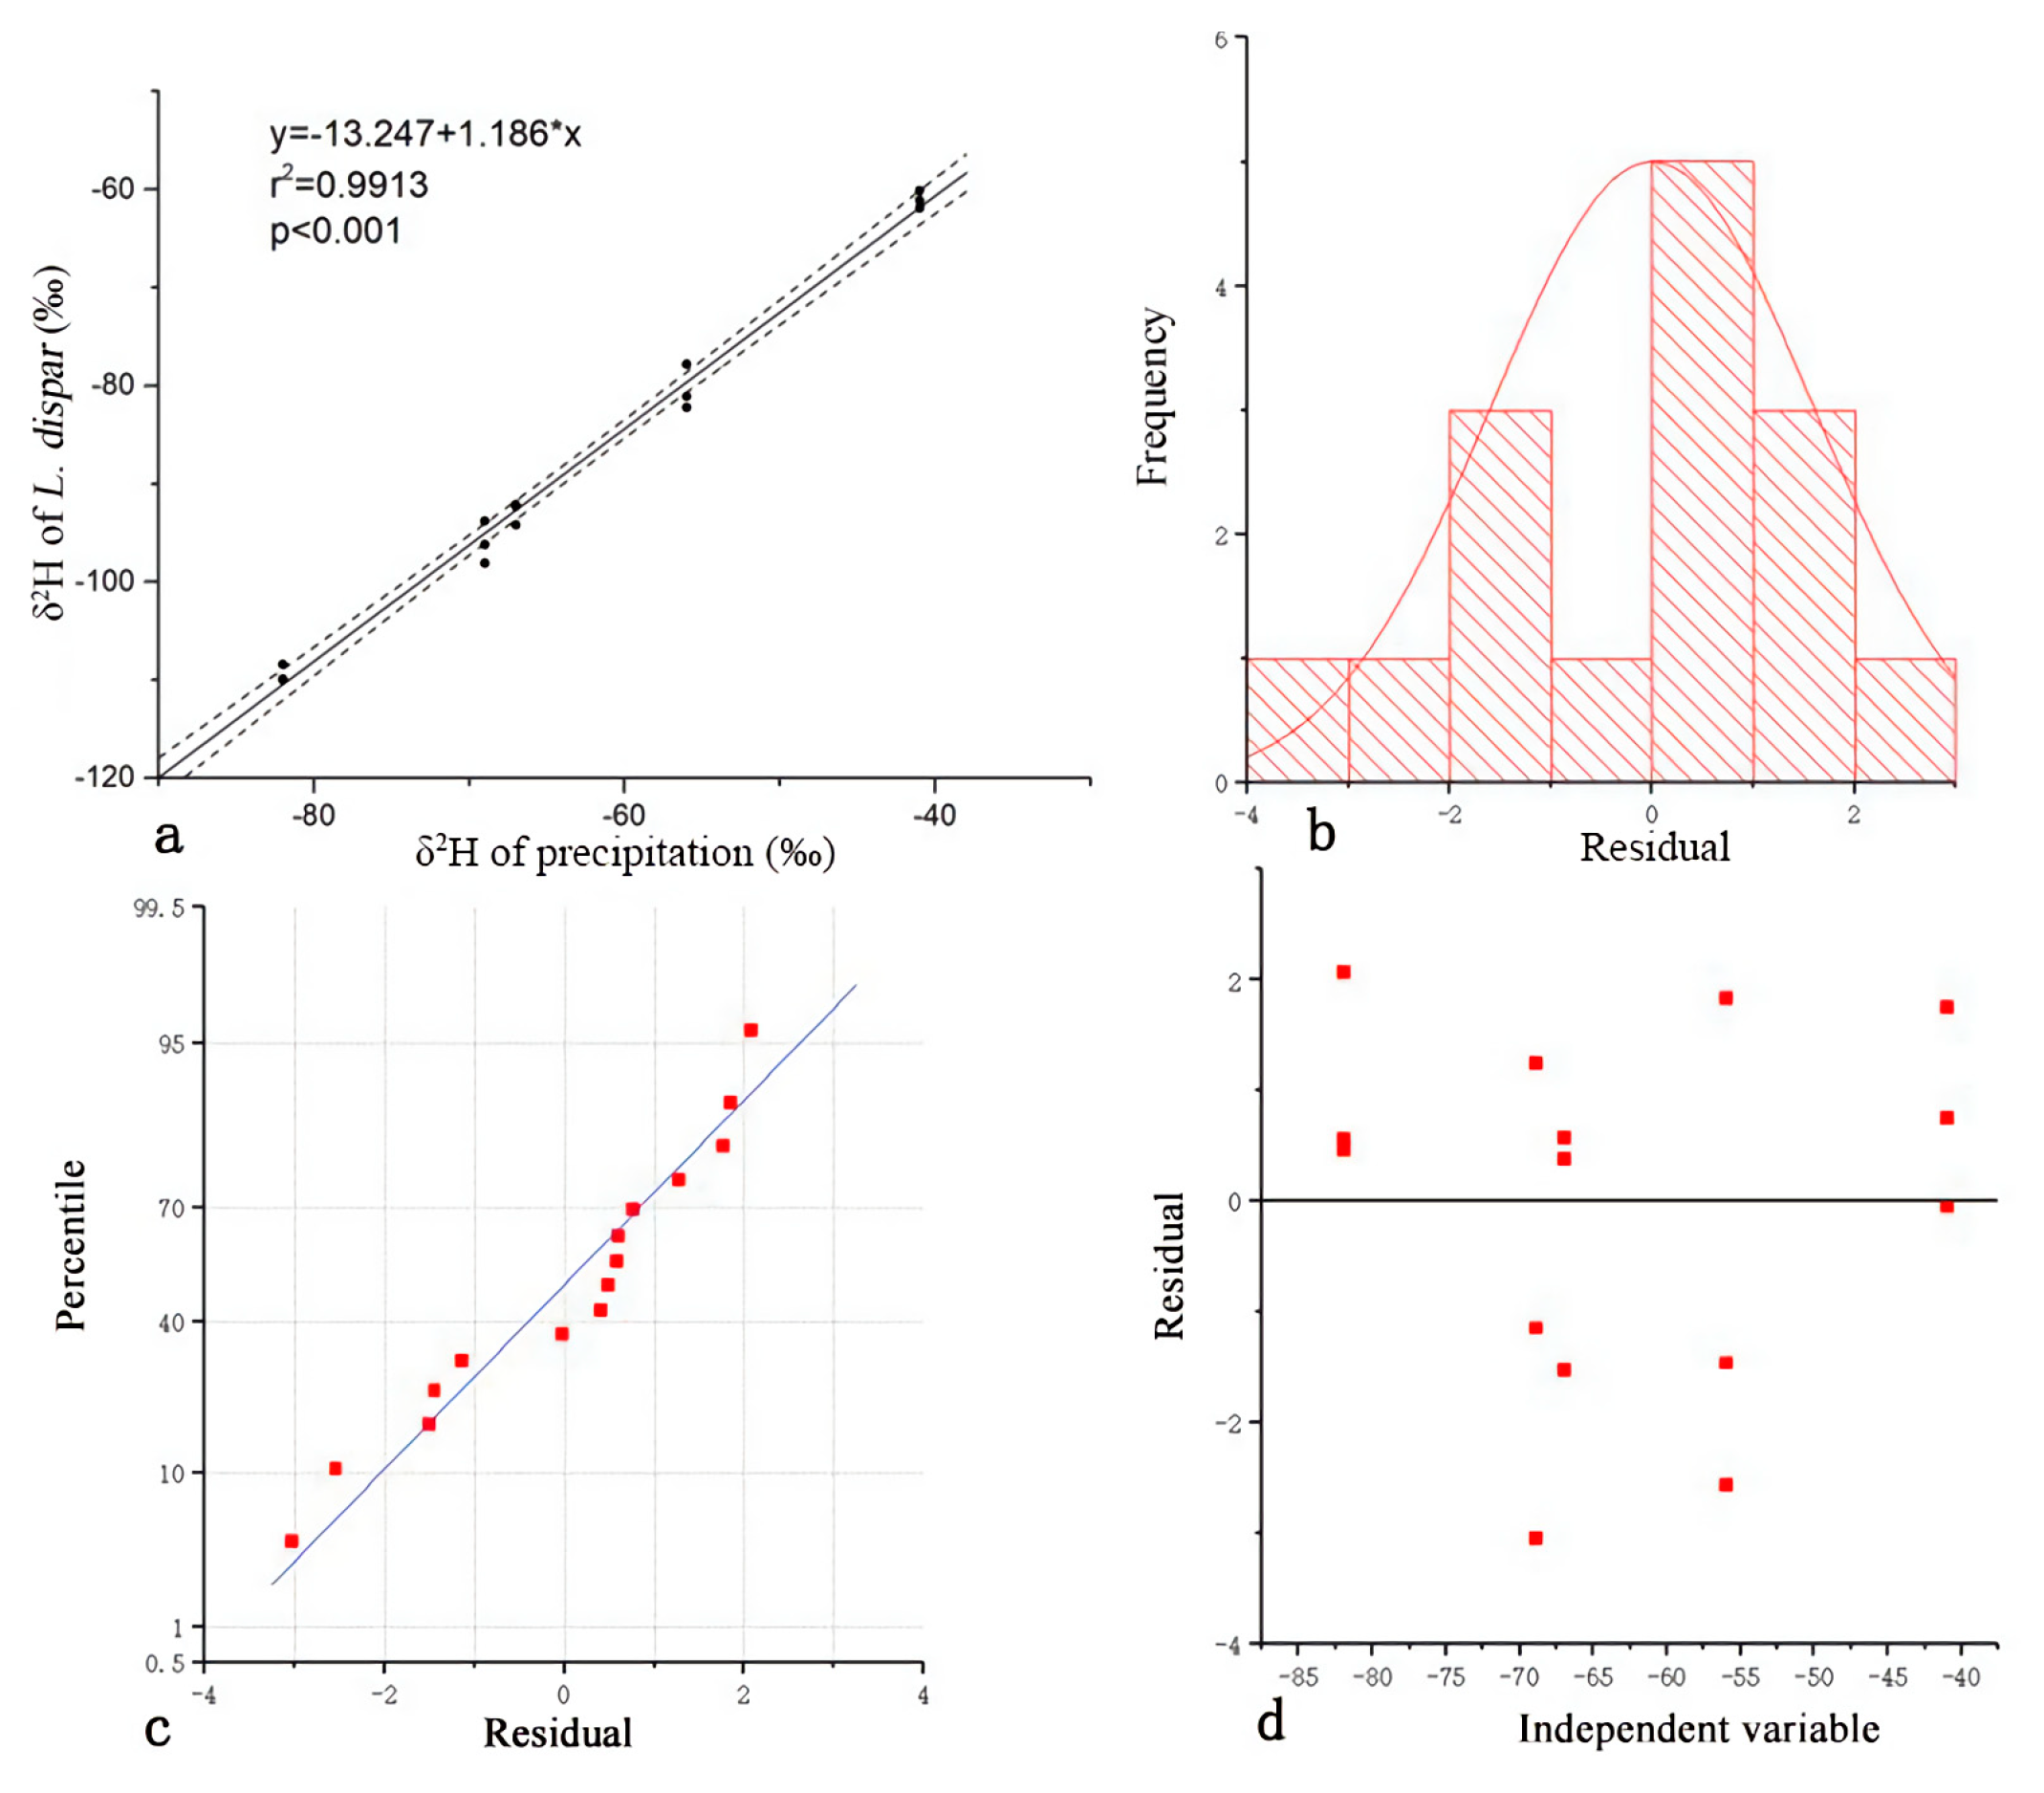
Figure 3.
Traceability result indication.


Table 1.
δ2H value of L. dispar in the five studied geographical locations in China. Measured data are mean ± SD. n = 3 biological replicates.
Table 1.
δ2H value of L. dispar in the five studied geographical locations in China. Measured data are mean ± SD. n = 3 biological replicates.
| Place (Regions) | Longitude (East) | Latitude (North) | Height (m) | δ2H (‰) of L. dispar (Measured Value) | δ2H (‰) of Precipitation (Theoretical Value) |
|---|---|---|---|---|---|
| Heilongjiang Province (Luobei, n = 3) | 130.83 | 47.58 | 83 | −109.4 ± 0.70 | −82 |
| Yunnan Province (Nujiangzhou, n = 3) | 98.77 | 25.86 | 2057 | −96.0 ± 1.75 | −69 |
| Neimenggu Province (Charisu, n = 3) | 123.47 | 43.13 | 121 | −92.9 ± 0.93 | −67 |
| Hebei Province (Tangquan, n = 3) | 117.96 | 40.95 | 135 | −80.4 ± 1.87 | −58 |
| Anhui Province (Lu’an, n = 3) | 116.52 | 31.73 | 75 | −61.0 ± 0.72 | −41 |
Table 2.
The calculation results of parameter estimation of L. dispar equation (lm (formula = y ~ 1 + x), where x is the δ2H value of L. dispar and y is the δ2H value in precipitation). *** represents the highest level of significance.
Table 2.
The calculation results of parameter estimation of L. dispar equation (lm (formula = y ~ 1 + x), where x is the δ2H value of L. dispar and y is the δ2H value in precipitation). *** represents the highest level of significance.
| Coefficients | Estimate | Std. Error | t Value | Pr (|t|) | Signif. Codes |
|---|---|---|---|---|---|
| Intercept | −13.24726 | 1.99155 | −6.652 | 1.58 × 10⁻⁵ | *** |
| x | 1.18577 | 0.03088 | 38.394 | 9.09 × 10⁻¹⁵ | *** |
Table 3.
Test results of equation fitting.
| Items | Value |
|---|---|
| Residual (Min) | −3.0324 |
| Residual (1Q) | −1.2814 |
| Residual (Median) | 0.4983 |
| Residual (3Q) | 1.0284 |
| Residual (Max) | 2.0313 |
| Residual standard error | 1.645 on 13 degrees of freedom |
| Multiple R-squared | 0.9913 |
| Adjusted R-squared | 0.9906 |
| F-statistic | 1474 on 1 and 13 DF |
| p-value | 9.09 × 10⁻¹⁵ |
Table 4.
L. dispar model validation.
| Place (Regions) | Longitude (East) | Latitude (North) | Height (m) | δ2H (‰) of L. dispar (Measured Value) | δ2H (‰) of Theoretical Place (Estimated Value) |
|---|---|---|---|---|---|
| Chengdu Sichuan Province | 104.05 | 30.57 | 488 | −65.2 | −43.80 |
| −64.3 | −43.04 |
Publisher’s Note: MDPI stays neutral with regard to jurisdictional claims in published maps and institutional affiliations. |
© 2020 by the authors. Licensee MDPI, Basel, Switzerland. This article is an open access article distributed under the terms and conditions of the Creative Commons Attribution (CC BY) license (http://creativecommons.org/licenses/by/4.0/).
Share and Cite
MDPI and ACS Style
Qin, Z.; Shi, J. Feasibility of Species Origin Traceability by Hydrogen Stable Isotopes: Sample Case of Lymantria dispar L. (Lepidoptera: Erebidae). Forests 2020, 11, 1209. https://doi.org/10.3390/f11111209
AMA Style
Qin Z, Shi J. Feasibility of Species Origin Traceability by Hydrogen Stable Isotopes: Sample Case of Lymantria dispar L. (Lepidoptera: Erebidae). Forests. 2020; 11(11):1209. https://doi.org/10.3390/f11111209
Chicago/Turabian StyleQin, Zeshi, and Juan Shi. 2020. "Feasibility of Species Origin Traceability by Hydrogen Stable Isotopes: Sample Case of Lymantria dispar L. (Lepidoptera: Erebidae)" Forests 11, no. 11: 1209. https://doi.org/10.3390/f11111209
Note that from the first issue of 2016, this journal uses article numbers instead of page numbers. See further details here.