Arbuscular Mycorrhizal Fungal Communities Are Influenced by Host Tree Species on the Loess Plateau, Northwest China

1
State Key Laboratory of Conservation and Utilization of Subtropical Agro-bioresources, Guangdong Key Laboratory for Innovative Development and Utilization of Forest Plant Germplasm, College of Forestry and Landscape Architecture, South China Agricultural University, Guangzhou 510642, China
2
School of Modern Agriculture & Biotechnology, Ankang University, Ankang 725000, China
*
Author to whom correspondence should be addressed.
Forests 2019, 10(10), 930; https://doi.org/10.3390/f10100930
Submission received: 6 August 2019
/
Revised: 10 October 2019
/
Accepted: 16 October 2019
/
Published: 21 October 2019
(This article belongs to the Section Forest Ecophysiology and Biology)
Abstract
:Arbuscular mycorrhizal (AM) fungi can establish mutualistic symbioses with most terrestrial plants and therefore play a crucial role in the re-vegetation and rehabilitation of degraded ecosystems. Yet, little information is available on AM fungal communities associated with dominant tree species in the semi-arid region of the Loess Plateau, Northwest China. In this study, topsoil (0–20 cm) and subsoil (20–40 cm) samples were collected from the rhizosphere of five dominant tree species in northern Shaanxi Province, to investigate the distribution and diversity of their associated AM fungi. The tree species were Hippophae rhamnoides Linn., Juniperus communis L., Populus cathayana Rehd., Robinia pseudoacacia L., and Salix matsudana Koidz. In total, 24 AM fungal species of eight genera were isolated from the rhizosphere soil samples and identified based on their spore morphology. Funneliformis and Funneliformis monosporum were respectively the most abundant genus and species of AM fungi. The distribution and diversity of AM fungi differed among the five tree species and also between the two soil depths. Across different tree species, the spore density of AM fungi varied from 2.85 to 15.32 spores g−1 fresh soil, with a species richness of 3–7, Shannon–Wiener index of 0.81–1.08, and evenness index of 0.30–0.53. The mycorrhizal colonization rate had a significant negative correlation with both the Shannon-Wiener index and species richness, whereas it was positively correlated with the evenness index. Permutational multivariate analysis of variance, non-metric multidimensional scaling, and structural equation modeling revealed that tree species, rather than soil depth or its interactions with tree species, had significant effects on the composition of AM fungal communities. In conclusion, the distribution and diversity of AM fungi associated with the dominant tree species were mainly affected by host tree species identity in the semi-arid ecosystem. Claroideoglomus etunicatum (W.N. Becker & Gerdemann) C. Walker & A. Schüßler and Glomus reticulatum Bhattacharjee & Mukerji appeared to be promising candidates for ecological restoration in the Loess Plateau region because of their adaptation to its semi-arid conditions with a broad spectrum of host tree species.
1. Introduction
The semi-arid Loess Plateau (Shaanxi Province, northwest China) is a natural mountainous region characterized by complex topographical and geological conditions. The region has suffered from severe soil loss, desertification, and vegetation deterioration, partly attributed to industrial pollution, agricultural activity, and extreme weather [1]. When trying to improve its ecological environment, water is a crucial factor affecting vegetation restoration and environmental reconstruction in the Loess Plateau region. Drought stress is a pervasive phenomenon throughout this region, which often negatively impacts vegetation restoration projects [1,2]. In such arid and semi-arid areas, the availability of soil nutrients and water for plants is largely limited under drought stress conditions [3].
Arbuscular mycorrhizal (AM) fungi may play a vital role in the revegetation and rehabilitation of degraded ecosystems, because they are able to establish mutualistic symbioses with most terrestrial plants [4,5,6]. Colonization by AM fungi can increase plant survival and growth in adverse environments by not only delivering mineral nutrients (especially phosphate) from soil to the host plant, but also enhancing plant resistance to biotic (e.g., pathogens and nematodes) and abiotic stresses (e.g., drought, salinity, and heavy metals) [7]. Conversely, the host plant delivers a portion of its photosynthates to AM fungi to support the development of these beneficial symbionts [8]. The two-way exchange of nutrients between AM fungi and plants is a mutualism, bringing about nutritional benefits for both partners. Therefore, the symbiosis between AM fungi and particular tree species could be a key ecological factor determining trees’ survival and adaptation under drought stress [9].
The diversity of AM fungi is inevitably affected by various local environmental factors, such as climate, soil type, and soil depth [10,11,12]. The effects of certain environmental factors including aridity [13], soil metals [14], and elevation gradient [15] have been examined by quantifying the fungal colonization, spore density, or community composition of AM fungi across different spatiotemporal scales. For instance, Faggioli et al. [14] found that Pb pollution altered the structure of AM fungal communities due to taxon-specific differences in microbial tolerance to Pb. Work by Gai et al. [15] demonstrated that mycorrhizal colonization and sporulation rates of herbaceous plants increased with decreasing elevation on the Segrila Mountain in Nyingchi, China. Both the depth of soil layers (e.g., 0–10, 10–20, 20–30, 30–40, and 40–50 cm) and the identity of host plant species’ (e.g., the shrub Hedysarum laeve, Maxim. and the herb Psammochloa villosa (Trin.) Bor.) were reportedly key factors influencing AM fungal community composition in the Mu Us desert of northwest China [11].
In addition to shrubs and herbs, the occurrence and diversity of AM fungi are also affected by individual tree species through differential effects on fungal sporulation and hyphal growth [16]. Mounting evidence indicates that host tree species may alter the diversity and composition of AM fungal communities by altering the reproduction or survival rates of distinct AM fungal taxa, even by changing the plant allocation of carbon to roots or by regulating soil conditions [16,17]. Tree species identity is therefore perhaps one of the most critical determinants of AM fungal community composition, since the life cycle of AM fungi is strongly affected by the tree roots they colonize [16]. Research into the composition and diversity of AM fungal communities is valuable for understanding their relations with soil microbial communities and plants, and is needed for their effective utilization in environmental protection projects.
Currently, fast-growing species such as Hippophae rhamnoides Linn., Populus cathayana Rehd., and Robinia pseudoacacia L. are the dominant woody trees found on the Loess Plateau. As the foremost species used for ecological restoration, these trees have been cultivated widely in a massive forestation program throughout the Plateau region [10,13,18]. It has been found that dual inoculation with Glomus mosseae and Rhizobium sp. NWYC129 promotes the growth of R. pseudoacacia seedlings and improves the quality of the Plateau’s weathered soft rock soils [9]. Surprisingly, however, few studies are available regarding the diversity of AM fungi associated with these dominant tree species, as they could govern the structure and function of forest ecosystems on the Loess Plateau.
This study investigated the effects of host tree species and soil depth on AM fungal communities by detecting their species composition in rhizosphere soils obtained from five dominant tree species in the semi-arid region of the Loess Plateau. The results will provide useful data for supporting the scientific utilization of AM fungi and mycorrhizal trees in vegetation restoration across this region.
2. Materials and Methods
2.1. Study Site
The study site is part of the Songhongwan state forest (110°29′ E 39°19′ N) on the Loess Plateau, located in Fugu County, Shaanxi Province, northwest China. It has a semi-arid continental monsoon climate with an average annual precipitation of 453.5 mm. The soil texture is silty clay loam in the 0–1000 cm profile (FAO-UNESCO, 1988). The study site has undergone severe soil loss along with large areas of vegetation destroyed by mining, forming a typical loess and sandy landform in this semi-arid region [1].
Presently, the dominant forest tree species here are Hippophae rhamnoides (H. rha), Juniperus communis (J. com), Populus cathayana (P. cat), Robinia pseudoacacia (R. pse), and Salix matsudana (S. mat). The abundance and composition of plants in the understorey of the five tree species differ among their monodominant stands. The dominant understory plant species are Achnatherum splendens (Trin.) Nevski and Incarvillea sinensis Lam. under R. pse forest stands, Thalictrum squarrosum Steph. and Silene jenisseensis Willd. under J. com forest stands, Glycyrrhiza uralensis Fisch and Stellera chamaejasme L. under P. cat forest stands, Artemisia giraldii Pamp. and Artemisia capillaries Thunb. under H. rha forest stands, and Artemisia desertorum Spreng. and Agropyron cristatum L. under S. mat forest stands. Additionally, there are herbaceous plant species, such as Artemisia sacrorum Ledeb. and Setaria viridis L., that occur under the monodominant stands of the five target tree species.
2.2. Sampling Design
The sampling was carried out in October 2014, using six random plots (20 m × 20 m, spaced 30–300 m apart) per tree species. Within each plot, three trees of similar size were selected randomly for a given species, with topsoil (0–20 cm) and subsoil (20–40 cm) samples collected from the rhizosphere of each tree. The topsoil or subsoil samples from the three trees of each species were then mixed in the laboratory to form a composite sample (~1 kg). In total, 60 samples were obtained: six plots × five tree species × two soil depths (Figure S1).
Briefly, soil was sampled from the base of the tree (≤30 cm from the trunk) in four directions after scraping the soil and litter on the top by 1–5 mm of the ground surface. First, a hole (60 cm in diameter, 40 cm in depth) was excavated to collect tree roots. The hole was situated within 60 cm of the tree’s trunk to ensure that the root fragments collected there belonged to that target tree species. Then, any soil tightly and loosely adhering to the surface of tree roots (rhizosphere soil) was removed with sterilized clean tweezers and used for the analyses of fungal spore density and soil properties [19].
After their collection from the forest stands, the soil samples were packed into Zip-lock bags and transported to the laboratory. There, each soil sample was split into two subsamples: one was stored at 4 °C and used for a spore analysis done as soon as possible, whereas the other was air-dried at 15–25 °C, sieved (< 2 mm), and stored at 4 °C until used for the soil analysis. In addition, fibrous roots were collected and washed with running water, then fixed in FAA solution (formalin: glacial acetic acid: 70% ethanol = 1:1:18, v/v) and stored at 4 °C before examining them for AM fungal colonization.
2.3. Evaluation of Mycorrhizal Colonization
Root colonization by AM fungi was evaluated using the method of Phillips & Hayman [20], with slight modifications. The fibrous roots were first washed with running water to remove the FAA and then cut into ca. 1 cm segments. These were immersed in 10% KOH at 90 °C for 1 h, intenerated with alkalized H2O2 for 20 min, and acidified with 1% HCl at 25 °C for 24 h. Nextly, the root segments were stained with a trypan blue solution at 90 °C for 3 min and then destained with lactic acid–glycerin (1:1, v/v) at 25 °C for 2 days. The destained root samples were mounted on glass slides for the microscopic examination of mycorrhizal colonization at 10 × 10 magnification (Model BX51; Olympus, Tokyo, Japan), by using the grid-line intersection method [21]. The mycorrhizal colonization rate was expressed as a proportion (%) of root segments colonized by AM fungi.
2.4. Quantification and Identification of AM Fungal Spores
The AM fungal spores were obtained from 100-g subsamples of fresh soil using a wet-sieving and decanting method, and then quantified using the grid-line method under an Olympus Bx51 compound microscope at 10 × 10 magnification [22]. The spores were mounted on glass slides using polyvinyl alcohol with Melzer’s reagent [23]. Spore identification was performed based on morphological characteristics including wall, hyphae, and germination structures according to the taxonomic criteria from Oehl et al. [24,25,26] and Redecker et al. [27], as well as the Manual for the Identification of VA Mycorrhizal Fungi [28], and data from INVAM (http://www.invam.caf.wvu.edu/taxonomy).
For each soil sample, the following AM fungi-related indices were calculated: (i) spore density, which indicates the total population size (or number) of AM fungal spores in 1 g of fresh soil; (ii) species richness, which is defined as the average number of AM fungal taxa found in the six plots; and (iii) the Shannon–Wiener diversity index (H’) was calculated as follows [29]:
where ni is the number of spores for the AM fungal species i, and N is the total number of spores for all the AM fungal species.
(iv) The Pielou evenness (E) was calculated using the following equation [30]:
where H’ and lnS are the Shannon–Wiener index and the natural logarithm of the number of AM fungal species, respectively.
(v) The relative spore density was calculated as follows [31]:
2.5. Analysis of Soil Physicochemical Properties
Soil water content (SWC) was determined gravimetrically by oven-drying the soil at 105 °C for 24 h [32]. Soil pH was measured using a digital pH meter (PHS-3D, Leici, Shanghai, China) with a 1:5 soil/water suspension [33]. Total soil organic carbon (SOC) was determined via oxidization with K2Cr2O7 using concentrated H2SO4 [34]. Soil total nitrogen (TN) was estimated according to the semi-micro Kjeldahl method [35]. Soil NO3-N and NH4-N were extracted with a 2 M KCl solution and quantified using a flow injection analyzer (FIAStar 5000, Tecator, Hoganas, Sweden) [36]. Soil total phosphorus (TP) was determined colorimetrically after digesting with HF-HClO4 [37]. After extraction with 0.5 M of NaHCO3 (pH 8.5) for 30 min, soil available phosphorus (AP) was determined colorimetrically with a UV-visible spectrophotometer (Model UV2300, Hitachi, Tokyo, Japan) [38]. Soil total potassium (TK) was determined using sodium hydroxide alkali fusion-flame photometry [37]. Finally, soil available potassium (AK) was extracted with 1 M of CH3COONH4 (pH 7) and analyzed with a flame photometer (Perkin-Elmer, Waltham, MA, USA) [37].
2.6. Statistical Analysis
Pearson correlations were used to assess the relationships between soil properties and AM fungal community characteristics. In addition, a regression analysis was used to assess the influence of soil properties and AM fungi-related indices upon AM fungal community composition. The effects of soil depth (two levels) and tree species (five levels) on each soil property and the species diversity indices of AM fungi were tested by two-way analysis of variance (ANOVA), for which multiple comparisons among group-level means were performed using the Tukey’s honest significant difference tests. All these analyses were performed using SPSS v17.0 software program (SPSS Inc., Chicago, IL, USA).
To further evaluate the significance of variation in AM fungal species composition between tree species and soil depths, a permutational multivariate analysis of variance (PerMANOVA) was performed, with 100 permutations and the Bray–Curtis dissimilarity, by using the BIODIVERSITYR package of R v3.2.2 [39]. Variation in AM fungal community composition was visualized by nonmetric multidimensional scaling (NMDS) and treatments were plotted over this using the “envfit” tool from the ‘vegan’ package in R v3.2.2 [40]. Structural equation modeling (SEM) was performed to evaluate the effects of soil depth, soil properties, and tree species on AM fungal community composition using R v3.2.2 and AMOS v21.0 (AMOS Development Corporation, USA), for which the standardized regression weights were estimated based on the Mantel test [41].
All results were considered statistically significant at p < 0.05. Graphs were drawn using SigmaPlot v10.0 (Systat Software Inc., San Jose, CA, USA).
3. Results
3.1. Rhizosphere Soil Properties
Soil properties in the rhizosphere of the five tree species at two soil depths are summarized in Table 1. All rhizosphere soil samples were slightly alkaline, having pH values ranging from 7.40 to 7.67. Soil samples collected from the rhizosphere of H. rha had the highest SWC (15.4%) and NO3-N concentration (10.71 mg∙kg−1), while the highest SOC (13.77 g∙kg−1), NH4-N (10.79 mg∙kg−1), TN (0.84 g∙kg−1), and TP (1.57 g∙kg−1) concentrations were found in the rhizosphere of J. com. Soil samples collected from the rhizosphere of R. pse had the highest AK (12.97 mg∙kg−1) and TK (16.83 g∙kg−1) concentrations at the 0–20 cm soil depth, whereas the highest AP (10.06 mg∙kg−1) concentration occurred in the rhizosphere of S. mat at the same soil depth. Two-way ANOVA revealed significant effects of tree species on SWC, pH, SOC, AP, TP, AK, TK, and TN levels, as well as soil depth on SWC, pH, SOC, AK, TK, NH4-N, and TN levels (all p-values < 0.05).
3.2. Mycorrhizal Colonization and Spore Density
The roots of all five tree species were colonized by AM fungi (Figure 1A). The highest mycorrhizal colonization rate was found under R. pse (mean = 83.1%) at the 0–20 cm soil depth, while the lowest rate was observed under S. mat (mean = 51.1%) at the 20–40 cm depth. Spore density ranged from 2.85 to 15.32 spores g-1 soil under the different tree species. At the 0–20 cm depth, spore density was ranked in this order: R. pse < P. cat < S. mat < H. rha < J. com, whereas at the 20–40 cm depth, the order shifted to R. pse < H. rha < S. mat < J. com < P. cat (Figure 1B). The two-way ANOVA revealed significant effects of soil depth, tree species, and their interactions on both mycorrhizal colonization rate and spore density (p-values < 0.001).
3.3. Composition of AM Fungal Communities
A total of 24 AM fungal species were isolated from the rhizosphere of the five dominant tree species and identified based on their characteristic spore morphology (Figure 2). These species were classified to eight genera: Funneliformis, Rhizophagus, Glomus, Claroideoglomus, Septoglomus, Fuscutata, Ambispora, and Acaulospora. The spores of Funneliformis, Rhizophagus, and Glomus accounted for more than 75% of the total spores (eight genera pooled). Rhizophagus accounted for 0%–8.3% of the total spores, but this genus was absent from the rhizosphere of H. rha. Other genera, such as Septoglomus, Ambispora, and Acaulospora, were extremely rare and only discovered under particular tree species.
The species composition of AM fungal communities from different tree species and soil depths varied greatly (Figure 2). Seven fungal species were collected from the rhizosphere soil of H. rha; likewise, 11 from S. mat, 14 from J. com, nine from P. cat, and five species from R. pse. Both Ambispora leptoticha and Claroideoglomus claroideum were only found under H. rha, while Funneliformis caledonium and Rhizophagus diaphanum were only discovered under P. cat at the 0–20 cm soil depth, and Septoglomus constrictum only observed under J. com at the 0–20 cm depth. Based on the proportion of fungal spores, Funneliformis monosporum was the most abundant species, followed by Claroideoglomus etunicatum.
The perMANOVA results revealed significant differences in the AM fungal community composition among the five tree species (pseudo-F = 4.6122, p = 0.0001), but not between the two soil depths (pseudo-F = 1.2025, p = 0.252) or for their interaction (pseudo-F = 1.04, p = 0.3895). Similarly, the NMDS analysis showed that the AM fungal communities were clearly separated by the five tree species (Figure 3).
3.4. Diversity of AM Fungal Communities
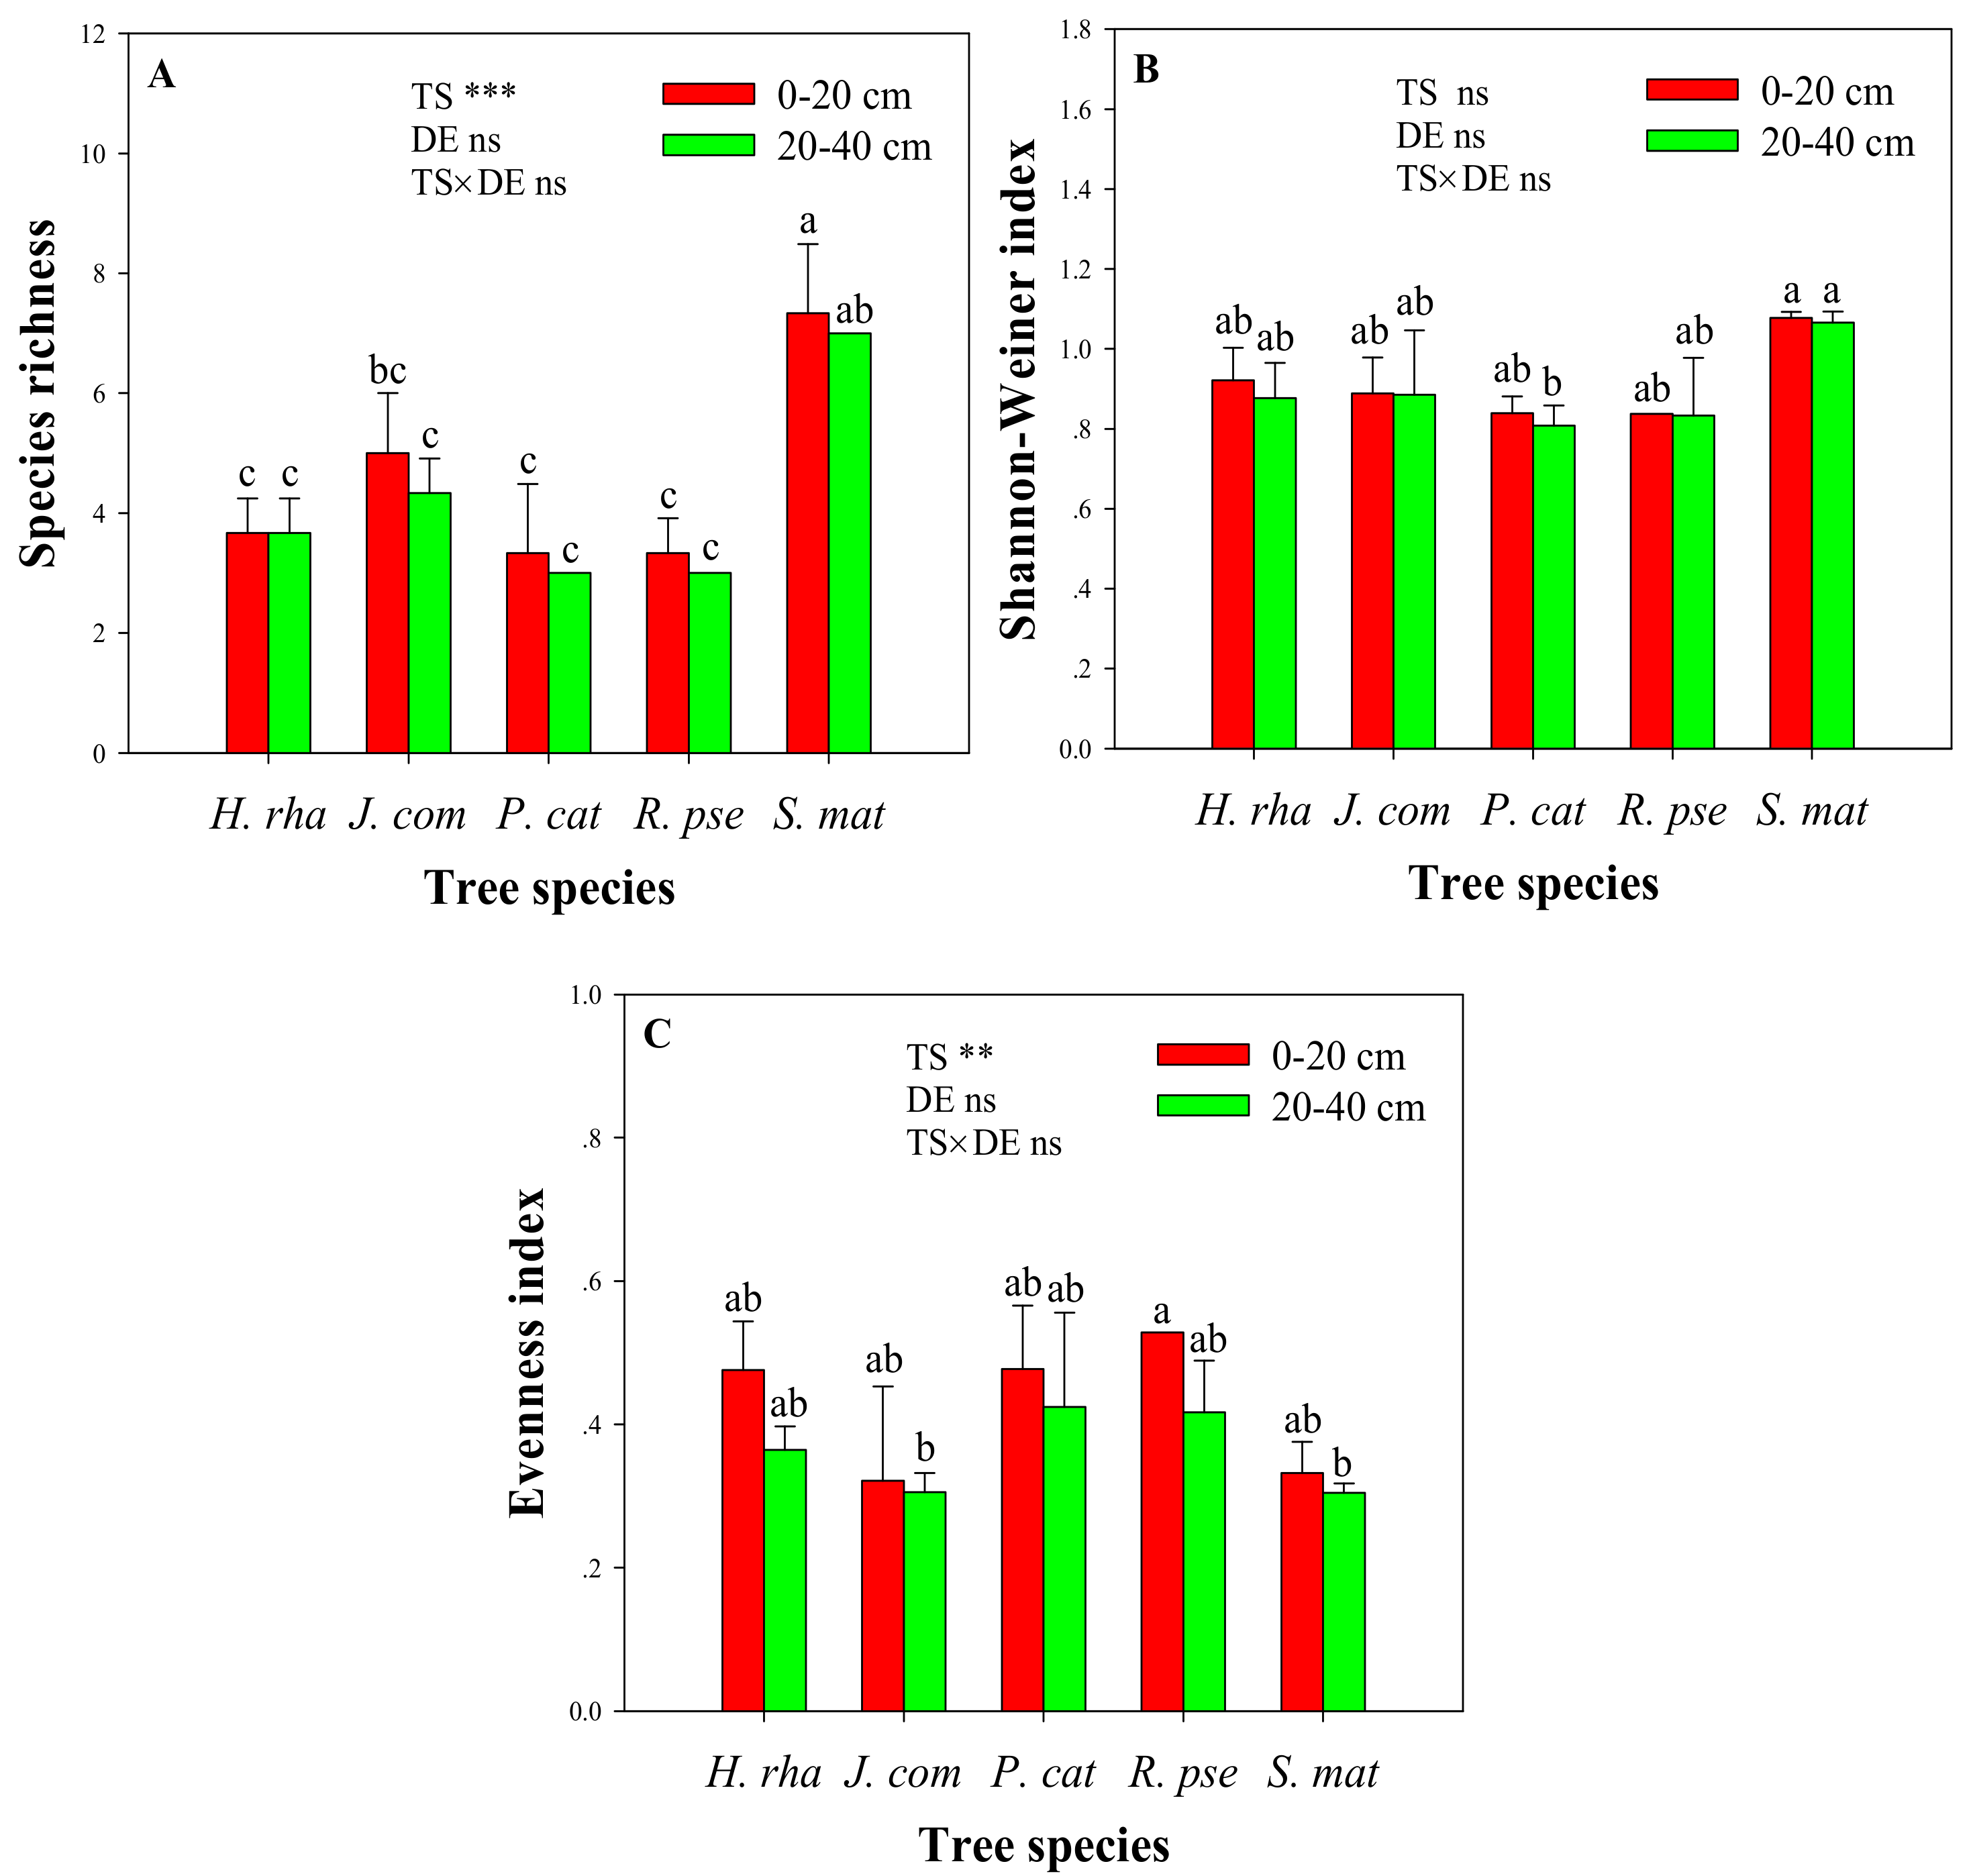
The diversity indices of AM fungi under different tree species are shown in Figure 4. At the same soil depth, the species richness of AM fungi was substantially higher under S. mat than the other tree species (p < 0.05). By contrast, there were no significant differences in species richness across H. rha, J. com, P. cat, and R. pse at each soil depth. Similarly, the Shannon–Wiener index of AM fungi was similar across the tree species at the 0–20 cm soil depth, and there was no obvious discrepancy in the evenness index of AM fungi at the same soil depth among the five tree species. Two-way ANOVA revealed significant effects of tree species on the species richness and the evenness index of AM fungi (p-values < 0.01). However, the effect of tree species did not depend on soil depth (i.e., no significant interactions) for any of the diversity indices.
3.5. Relations between AM Fungal Diversity and Soil Properties
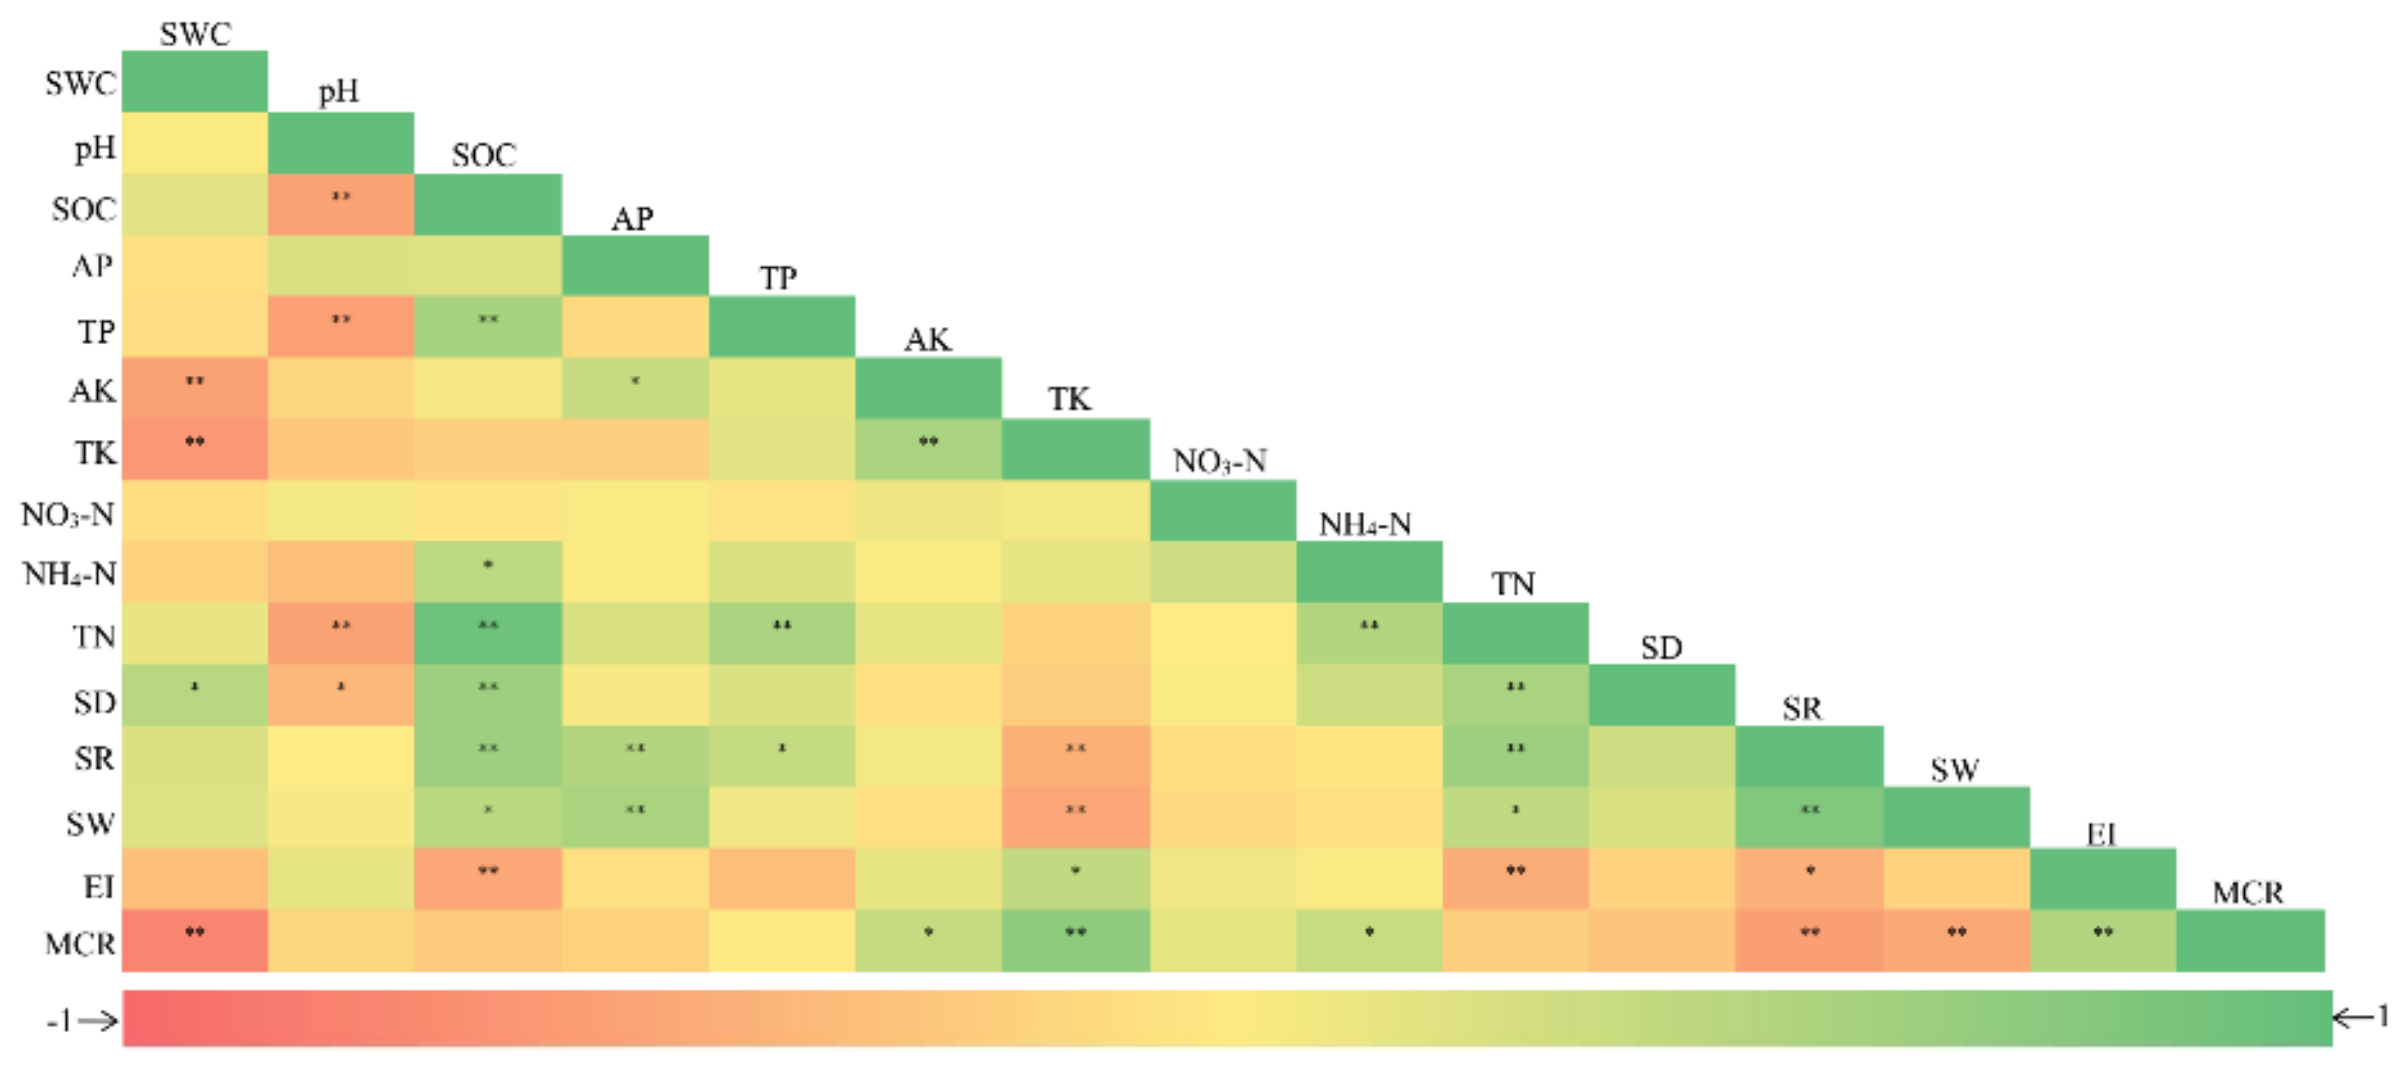
Negative and positive correlations were detected between AM fungal community characteristics (especially diversity indices) and rhizosphere soil properties (Figure 5). Both fungal species richness and Shannon–Wiener index had significant positive correlations with SOC (r = 0.64 and 0.44, p < 0.05), TN (r = 0.63 and 0.40, p < 0.05), and AP (r = 0.49 and 0.55, p < 0.01), whereas both had negative correlations with TK (r = −0.45 and −0.52, p < 0.01), respectively. Spore density was positively correlated with SWC (r = 0.46, p < 0.05), SOC (r = 0.63, p < 0.01), and TN (r = 0.55, p < 0.01). While the mycorrhizal colonization rate had a significant positive correlation with AK (r = 0.37, p < 0.05) and TK (r = 0.73, p < 0.01), it was negatively correlated with SWC (r = −0.79, p < 0.01), species richness (r = –0.58, p < 0.01), and Shannon–Wiener index (r = –0.51, p < 0.01).
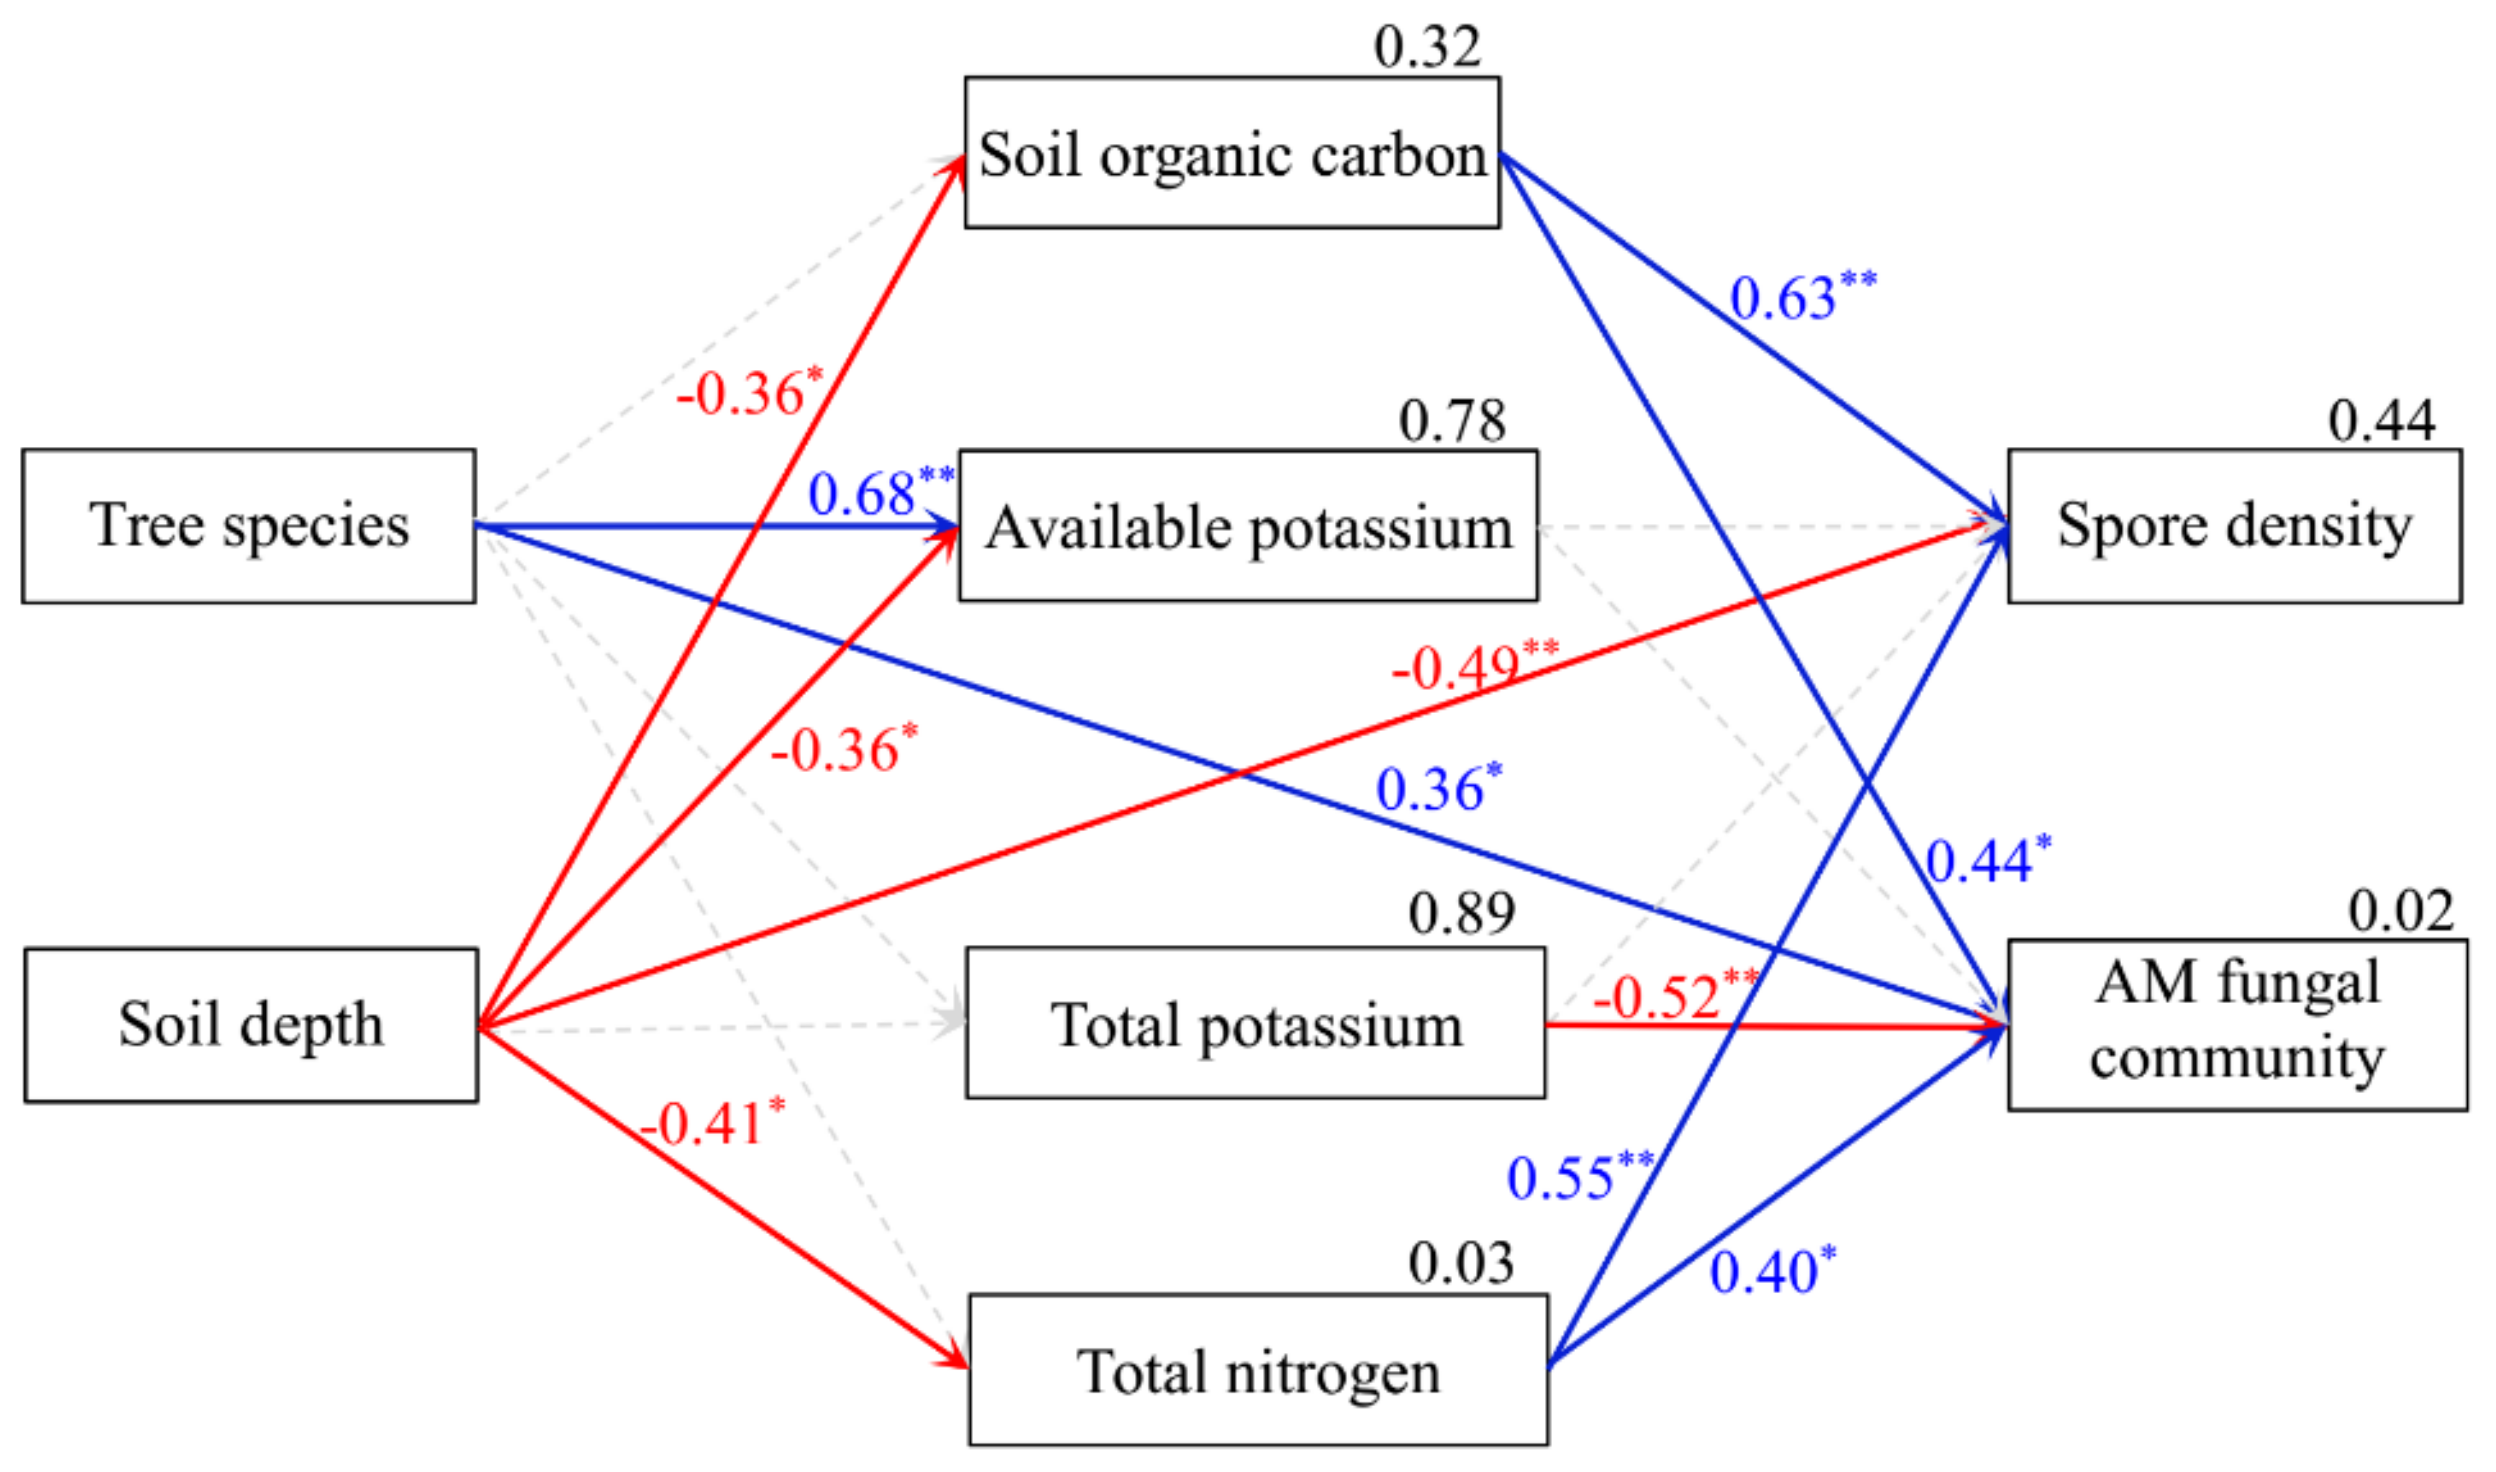
Regression analysis uncovered significant relationships between SOC, AK, TK, TN, spore density, and the AM fungal community composition (Table 2). The SEM results further indicated that soil AK and AM fungal community composition differed among host tree species, whereas soil AK, SOC, TN, and spore density differed between the two soil depths. Spore density increased with increasing SOC and TN but decreased with increasing soil depth. AM fungal community composition was positively correlated with SOC and TN, yet it was negatively correlated with TK (Figure 6). Based on these results, soil properties, especially SOC and TN, were evidently the key factors affecting the AM fungal community composition.
4. Discussion
In this study, the high spore density and mycorrhizal colonization rate indicated that well-established mutualistic symbioses exist between AM fungi and the dominant tree species found on the Loess Plateau. Mutualistic relationships have been reported before for AM fungi with R. pseudoacacia [9,13], H. rhamnoides [10], P. cathayana [42], and J. communis [43], but not yet for S. matsudana. Many studies have demonstrated that AM fungi protect their host plants against the adverse effects of drought stress and soil nutrient depletion [3,9]. Therefore, these mycorrhizal associations could have great significance for the establishment of dominant tree species across arid and semi-arid areas.
4.1. Effects of Tree Species on AM Fungi
In total, 24 AM fungal species were isolated from the rhizosphere of H. rhamnoides, R. pseudoacacia, P. cathayana, J. communis, and S. matsudana in the present study. The NMDS, PerMANOVA, and SEM results indicated that there were substantial differences in AM fungal community composition between the five host tree species. Mycorrhizal colonization rate, species richness, and spore density were dependent on the identity of tree species’. This finding concurs with other studies reporting that the host plant affects the composition and diversity of AM fungal communities across various ecosystems, including deserts, tropical zones, and peatlands [11,16,44]. Such effects may arise from differences in fundamental traits of host plants, such as the root morphology and structure of tree species [45,46], which could have affected the likelihood of mycorrhizal formation among fungal taxa.
The five host tree species tested in this study belong to different genera. For example, R. pseudoacacia is a nitrogen-fixing leguminous tree of the Fabaceae plant family, and nitrogen fixation by such legumes is considered a key factor affecting the physiological processes of AM fungal colonization [47]. Although H. rhamnoides is a non-legume nitrogen-fixing tree of the family Elaeagnaceae, nodules and mycorrhizae coexist in the roots of this species [48]. These host tree species may affect mycorrhizal growth and thereby alter AM fungal communities through specific functional morphological traits, such as their root exudation and leaf photosynthesis [49,50].
In this study, the genera Funneliformis, Glomus, and Rhizophagus predominated among the AM fungal communities (>75% of total spores) in the rhizosphere of the target tree species. In particular, Funneliformis was frequently isolated from almost all soil samples of the five tree species; hence, more spores if its members are likely produced in less time than those of other species such as Ambispora [51]. By contrast, Ambispora species were most common under H. rhamnoides, whereas Septoglomus species were only detected in the rhizosphere of J. communis. These results agree with Garbeva et al. [52], who revealed that host plant species exerted a selective effect on AM fungal communities, possibly through root exudation. Another explanation might be the regulation of AM fungal colonization by different tree species via specific root traits, such as their dry mass and C: N ratio [53].
It is worth noting that both C. etunicatum and G. reticulatum were discovered across almost all rhizosphere soil samples of the five dominant tree species. This result suggests these two species of AM fungal spores are better adapted to semi-arid conditions and have developed a broad spectrum of host tree species. Accordingly, C. etunicatum and G. reticulatum are promising candidates for use in the ecological restoration of the Loess Plateau region, because they may readily colonize and form symbiotic relationships with the dominant tree species, enabling the latter to thrive in this semi-arid environment.
4.2. Effects of Soil Depth on AM Fungi
Here we found the highest mycorrhizal colonization rate and spore density in the topsoil (0–20 cm). Similarly, Shukla et al. [54] reported that AM fungal spore density decreased with increasing soil depth under Indian medicinal herbs Withania somnifera and Ocimum sanctum in Jaitpur and Karaiya. This trend may be attributed to the low SOC content or oxygen availability in the subsoil compared with topsoil, as AM fungi are sensitive to low oxygen pressure in deeper soil [55,56]. Interestingly, some AM fungal species prevailed in both topsoil and subsoil, whereas individual species such as A. leptoticha occurred only in the subsoil in the present study. Hence, A. leptoticha seems to be more specialized to the subsoil environment, at least with respect to spore production, perhaps because of its less oxygen pressure, low carbon content, or other unknown factors.
The study site is located in a loessial semi-arid region where the topsoil is loose and aerated, which may have provided space resources for AM fungal sporulation; in contrast, the dense subsoil here could have inhibited root development or AM fungal sporulation [57]. Moreover, the reduced spore density in deeper soil could be explained by the distribution of fewer roots in the subsoil [57]. For instance, the root system of R. pseudoacacia is generally distributed in the topsoil within 30 cm of the tree’s trunk, and its root biomass markedly decreases with increasing soil depth [58]. This suggests the distribution of AM fungi in soil could be affected by morphology and biological characteristics of tree roots.
Despite the significant difference were found in spore density between soil depths, the AM fungal community composition was not clearly affected by soil depth. This result is partly in line with the findings of Higo et al. [59], especially under semi-arid desert conditions [60]. Given the different calculation method and evaluation criteria for spore density and AM fungal community composition, it is not surprising that the AM fungal community composition was substantially affected by host tree species, rather than soil depth or their interaction.
4.3. Effects of Soil Properties on AM Fungi
The AM fungal community characteristics had close relationships with soil properties. The SOC pool, a vital component of natural terrestrial ecosystems, is an important factor controlling the cycling of carbon between the atmosphere and biosphere [8,61]. Here, a positive correlation was shown between SOC content and spore density, which is consistent with the study of Guo et al. [61] conducted in the semi-arid area of Otindag sandy land in China. Higher SOC content can enhance the soil’s water-holding capacity, thereby creating a more favorable soil water status for mycorrhizal sporulation [61].
Nitrogen is another key factor affecting the spore production of AM fungi, possibly by changing soil pH and stimulating or suppressing mycorrhizal colonization and spore formation [62]. In the present study, however, soil TN content in the rhizosphere of all the five tree species was low. The TN was positively associated with spore density and AM fungal community composition, and perhaps negatively (albeit non-significantly) associated with mycorrhizal colonization rate. However, Khade & Rodrigues [63] reported a significant positive correlation between soil TN and mycorrhizal colonization rate in the rhizosphere of Carica papaya tree stands in India. Such reports have revealed the effects of TN on mycorrhiza with substantially diverse outcomes, illustrating the possible varied responses of AM fungi and trees to soil nutrients.
5. Conclusions
A total of 24 AM fungal species were isolated from the rhizosphere of five dominant tree species (H. rhamnoides, J. communis, P. cathayana, R. pseudoacacia, S. matsudana) in a semi-arid part of the Loess Plateau. These fungal species were reliably identified based on their spore morphology, among which Funneliformis and Funneliformis monosporum were the most abundant genus and species, respectively. Compositional differences in AM fungal communities were driven by host tree species, rather than soil depth or its interaction with tree species. Tree species identity had positive effects on soil AK and AM fungal community composition, whereas soil depth negatively affected SOC, AK, TN, and spore density. Due to their apparently generalized adaptation to semi-arid conditions with a broad spectrum of host tree species, C. etunicatum and G. reticulatum AM fungi are promising candidates for ecological restoration of the Loess Plateau region.
Supplementary Materials
The following are available online at https://www.mdpi.com/1999-4907/10/10/930/s1, Figure S1: Plot design (A) and soil sampling (B).
Author Contributions
Experimental design and execution, data analysis and manuscript written were performed by F.H. Experimental materials were contributed by H.C. and M.T.
Funding
This research was supported by the National Natural Science Foundation of China (41671268, 31901468), the High-Level Personnel Research Projects of Ankang University (2017AYQDZR06), the Youth Talent Promotion Project of Shaanxi Association for Science and Technology (20170210) and the Special Fund of the Natural Science of Shaanxi Province Education Department, China (17JK0016).
Acknowledgments
We want to thank Shaolin Zhong, Ren Yang, and Li Huang for their assistance in the collection of soil and root samples.
Conflicts of Interest
The authors confirm they have no conflicts of interest.
References
- Zhang, J.; Wang, L.; Su, J.Y. The soil water condition of a typical agroforestry system under the policy of northwest China. Forests 2018, 9, 730. [Google Scholar] [CrossRef]
- Yang, Y.T.; Guan, H.D.; Okke, B.; Mcvicar, T.R.; Long, D.; Shilong, P.; Wei, L.; Liu, B.; Zhao, J.; Craig, T.S. Contrasting responses of water use efficiency to drought across global terrestrial ecosystems. Sci. Rep. 2016, 6, 23284. [Google Scholar] [CrossRef] [Green Version]
- Zhao, D.Q.; Zhang, X.Y.; Fang, Z.W.; Wu, Y.Q.; Tao, J. Physiological and transcriptomic analysis of tree peony (Paeonia section Moutan DC.) in response to drought stress. Forests 2019, 10, 135. [Google Scholar] [CrossRef]
- Guo, W.; Zhao, R.X.; Yang, H.J.; Zhao, J.; Zhang, J. Using native plants to evaluate the effect of arbuscular mycorrhizal fungi on revegetation of iron tailings in grasslands. Biol. Fert. Soils 2013, 49, 617–626. [Google Scholar] [CrossRef]
- Kimura, A.C.; Scotti, M.R. Soil aggregation and arbuscular mycorrhizal fungi as indicators of slope rehabilitation in the São Francisco river basin (Brazil). Soil Water Res. 2016, 11, 114–123. [Google Scholar] [CrossRef]
- Fisseha, A.; Tamrat, B.; Emiru, B. The potential role of arbuscular mycorrhizal fungi in the restoration of degraded lands. Front. Microbiol. 2016, 7, 1095. [Google Scholar]
- Mukerji, K.G.; Chamola, B.P.; Singh, J. Mycorrhizal Biology; Kluwer Academic: Dordrecht, The Netherlands; Plenum Publishers: New York, NY, USA, 2000. [Google Scholar]
- Smith, S.E.; Read, D.J. Mycorrhizal Symbiosis, 3rd ed.; Academic Press: London, UK; New York, NY, USA, 2008; pp. 1–145. [Google Scholar]
- Gong, M.G.; Tang, M.; Chen, H.; Zhang, Q.M.; Xu, H.; Zheng, C.L. Effects of Glomus mosseae and Rhizobium on the growth of black locust seedlings and the quality of weathered soft rock soils in the Loess Plateau, China. Ann. Microbiol. 2012, 62, 1579–1586. [Google Scholar] [CrossRef]
- Gong, M.G.; Tang, M.; Zhang, Q.M.; Feng, X.X. Effects of climatic and edaphic factors on arbuscular mycorrhizal fungi in the rhizosphere of Hippophae rhamnoides in the Loess Plateau, China. Acta Ecol. Sin. 2012, 32, 62–67. [Google Scholar] [CrossRef]
- Wang, K.; He, X.L.; Xie, L.L.; Zhao, L.L. Arbuscular mycorrhizal fungal community structure and diversity are affected by host plant species and soil depth in the Mu Us Desert, northwest China. Arid Land Res. Manag. 2018, 32, 198–211. [Google Scholar] [CrossRef]
- Peña-Venegas, C.P.; Kuyper, T.W.; Davison, J.; Jairus, T.; Vasar, M.; Stomph, T.J.; Struik, P.C.; Öpik, M. Distinct arbuscular mycorrhizal fungal communities associate with different manioc landraces and Amazonian soils. Mycorrhiza 2019, 29, 263–275. [Google Scholar] [CrossRef] [Green Version]
- He, F.; Tang, M.; Zhong, S.L.; Yang, R.; Huang, L.; Zhang, H.Q. Effects of soil and climatic factors on arbuscular mycorrhizal fungi in rhizosphere soil under Robinia pseudoacacia in the Loess Plateau, China. Eur. J. Soil Sci. 2016, 67, 847–856. [Google Scholar] [CrossRef]
- Faggioli, V.; Menoyo, E.; József, G.; Kemppainen, M.; Pardo, A.; Salazar, M.J.; Becerra, A.G. Soil lead pollution modifies the structure of arbuscular mycorrhizal fungal communities. Mycorrhiza. 2019, 29, 363–373. [Google Scholar] [CrossRef]
- Gai, J.P.; Tian, H.; Yang, F.Y.; Christie, P.; Li, X.L.; Klironomos, J.N. Arbuscular mycorrhizal fungal diversity along a Tibetan elevation gradient. Pedobiologia 2012, 55, 145–151. [Google Scholar] [CrossRef]
- Lovelock, C.E.; Andersen, K.; Morton, J.B. Arbuscular mycorrhizal communities in tropical forests are affected by host tree species and environment. Oecologia 2003, 135, 268–279. [Google Scholar] [CrossRef]
- Jian, S.Q.; Wu, Z.N.; Hu, C.H.; Zhang, X.L. Sap flow in response to rainfall pulses for two shrub species in the semiarid Chinese Loess Plateau. J. Hydrol. Hydromec. 2016, 64, 121–132. [Google Scholar] [CrossRef] [Green Version]
- Liu, Y.; Miao, H.T.; Huang, Z.; Cui, Z.; He, H.H.; Zheng, J.Y.; Han, F.P.; Chang, X.F.; Wu, G.L. Soil water depletion patterns of artificial forest species and ages on the Loess Plateau (China). For. Ecol. Manag. 2018, 417, 137–143. [Google Scholar] [CrossRef]
- Yang, Y.R.; Song, Y.Y.; Scheller, H.V.; Ghosh, A.; Ban, Y.H.; Chen, H.; Tang, M. Community structure of arbuscular mycorrhizal fungi associated with Robinia pseudoacacia in uncontaminated and heavy metal contaminated soils. Soil Biol. Biochem. 2015, 86, 146–158. [Google Scholar] [CrossRef]
- Phillips, J.M.; Hayman, D.S. Improved procedures for clearing roots and staining parasitic and vesicular arbuscular mycorrhizal fungi for rapid assessment of infection. Trans. Br. Mycol. Soc. 1970, 55, 158–161. [Google Scholar] [CrossRef]
- Giovannetti, M.; Mosse, B. An evaluation of techniques for measuring vesicular arbuscular mycorrhizal infection in roots. New Phytol. 1980, 84, 489–500. [Google Scholar] [CrossRef]
- Gerdemann, J.W.; Nicolson, T.H. Spores of mycorrhizal Endogone species extracted from soil by wet sieving and decanting. Trans. Br. Mycol. Soc. 1963, 46, 235–244. [Google Scholar] [CrossRef]
- Morton, J.B. Taxonomy of VA mycorrhizal fungi: Classification, nomenclature, and identification. Mycotaxon 1988, 32, 267–324. [Google Scholar]
- Oehl, F.; Sieverding, E.; Palenzuela, J.; Ineichen, K.; Silva, G.A. Advances in Glomeromycota taxonomy and classification. IMA Fungus 2011, 2, 191–199. [Google Scholar] [CrossRef] [PubMed]
- Oehl, F.; Silva, G.A.; Goto, B.T.; Maia, L.C.; Sieverding, E. Glomeromycota: Two new classes and a new order. Mycotaxon 2011, 116, 365–379. [Google Scholar] [CrossRef]
- Oehl, F.; Silva, G.A.; Goto, B.T.; Sieverding, E. Glomeromycetes: Three new genera and glomoid species reorganized. Mycotaxon 2011, 116, 75–120. [Google Scholar] [CrossRef]
- Redecker, D.; Schüßler, A.; Stockinger, H.; Stürmer, S.L.; Morton, J.B.; Walker, C. An evidence-based consensus for the classification of arbuscular mycorrhizal fungi (Glomeromyota). Mycorrhiza 2013, 23, 515–531. [Google Scholar] [CrossRef]
- Schenck, N.C.; Pérez, Y. Manual for the Identification of VA Mycorrhizal Fungi; Synergistic Publications: Gainesville, FL, USA, 1990. [Google Scholar]
- Shannon, C.E. The Mathematical Theory of Communication; University of Illinois Press: Urbana, IL, USA, 1949; pp. 10–14. [Google Scholar]
- Pielou, E.C. The measurement of diversity in different types of biological collections. J. Theor. Biol. 1966, 13, 131–144. [Google Scholar] [CrossRef]
- Abdelhalim, T.S.; Finckh, M.R.; Babiker, A.G.; Oehl, F. Species composition and diversity of arbuscular mycorrhizal fungi in White Nile state, Central Sudan. Arch. Agron. Soil Sci. 2013, 60, 377–391. [Google Scholar] [CrossRef]
- Gardner, W.H.; Klute, A. Water content. In Methods of Soil Analysis; Klute, A., Ed.; American Society of Agronomy: Madison, WI, USA, 1986; pp. 493–544. [Google Scholar]
- Peech, M. Hydrogen-ion activity. In Methods of Soil Analysis; Black, C.A., Ed.; American Society of Agronomy: Madison, WI, USA, 1965; pp. 914–926. [Google Scholar]
- Nelson, D.W.; Sommers, L.E. Total carbon, organic carbon and organic matter. In Methods of Soil Analysis; Page, A.L., Ed.; American Society of Agronomy and Soil Science Society of America: Madison, WI, USA, 1982; pp. 539–579. [Google Scholar]
- Bremner, J.M.; Mulvaney, C.S. Total nitrogen. In Methods of Soil Analysis; Page, A.L., Ed.; American Society of Agronomy and Soil Science Society of America: Madison, WI, USA, 1982; pp. 595–624. [Google Scholar]
- Raave, H.; Keres, I.; Kauer, K.; Nõges, M.; Rebane, J.; Tampere, M.; Loit, E. The impact of activated carbon on NO3−-N, NH4+-N, P and K leaching in relation to fertilizer use. Eur. J. Soil Sci. 2014, 65, 120–127. [Google Scholar] [CrossRef]
- Jackson, M.L. Soil Chemical Analysis; Prentice-Hall, Inc.: Englewood Cliffs, NJ, USA, 1958. [Google Scholar]
- Page, A.L. Chemical and microbiological properties. In Methods of Soil Analysis; Page, A.L., Ed.; American Society of Agronomy, Soil Science Society of America: Madison, WI, USA, 1982; pp. 625–641. [Google Scholar]
- Kindt, R.; Coe, R. Tree Diversity Analysis: A Manual and Software for Common Statistical Methods for Ecological and Biodiversity Studies; World Agroforestry Centre: Nairobi, Kenya, 2005. [Google Scholar]
- Oksanen, J.; Blanchet, F.G.; Kindt, R.; Legendre, P.; Minchin, P.R.; O’Hara, R.B. Vegan: Community ecology Package. R package Version 2.0–10. Available online: http://CRAN.R-project.org/package=vegan (accessed on 20 September 2013).
- Zheng, Y.; Chen, L.; Luo, C.Y.; Zhang, Z.H.; Wang, S.P.; Guo, L.D. Plant identity exerts stronger effect than fertilization on soil arbuscular mycorrhizal fungi in a sown pasture. Microb. Ecol. 2016, 72, 647–658. [Google Scholar] [CrossRef]
- Chen, L.H.; Hu, X.W.; Yang, W.Q.; Xu, Z.F.; Zhang, D.J.; Gao, S. The effects of arbuscular mycorrhizal fungi on sex-specific responses to Pb pollution in Populus Cathayana. Ecotox. Environ. Saf. 2015, 113, 460–468. [Google Scholar] [CrossRef]
- Wang, B.; Qiu, Y.L. Phylogenetic distribution and evolution of mycorrhizas in land plants. Mycorrhiza 2006, 16, 299–363. [Google Scholar] [CrossRef] [PubMed]
- Kennedy, P.G.; Mielke, L.A.; Nguyen, N.H. Ecological responses to forest age, habitat, and host vary by mycorrhizal type in boreal peatlands. Mycorrhiza 2018, 28, 315–328. [Google Scholar] [CrossRef] [PubMed]
- Chagnon, P.L.; Bradley, R.L.; Klironomos, J.N. Trait-based partner selection drives mycorrhizal network assembly. Oikos 2015, 124, 1609–1616. [Google Scholar] [CrossRef]
- Kubisch, P.; Hertel, D.; Leuschner, C. Do ectomycorrhizal and arbuscular mycorrhizal temperate tree species systematically differ in root order-related fine root morphology and biomass? Front. Plant Sci. 2015, 6, 64. [Google Scholar] [CrossRef]
- Soudzilovskaia, N.A.; Aksenova, A.A.; Makarov, M.I.; Onipchenko, V.; Logvinenko, O.A.; Ter Braak, C.; Cornelissen, J.H.C. Legumes affect alpine tundra community composition via multiple biotic interactions. Ecosphere 2012, 3, 1–15. [Google Scholar] [CrossRef]
- Zhou, X.; Tian, L.; Zhang, J.F.; Ma, L.N.; Li, X.J.; Tian, C.J. Rhizospheric fungi and their link with the nitrogen-fixing Frankia harbored in host plant Hippophae rhamnoides L. J. Basic Microb. 2017, 57, 1–10. [Google Scholar] [CrossRef]
- Alguacil, M.M.; Díaz, G.; Torres, P.; Rodríguez-Caballero, G.; Roldán, A. Host identity and functional traits determine the community composition of the arbuscular mycorrhizal fungi in facultative epiphytic plant species. Fungal Ecol. 2019, 39, 307–315. [Google Scholar] [CrossRef]
- Engelmoer, D.J.P.; Kiers, E.T. Host diversity affects the abundance of the extraradical arbuscular mycorrhizal network. New Phytol. 2015, 205, 1485–1491. [Google Scholar] [CrossRef]
- Belay, Z.; Vestberg, M.; Assefa, F. Diversty and abundance of arbuscular mycorrhizal fungi across different land use types in a humid low land area of Ethiopia. Trop. Subtrop. Agroeco. 2015, 18, 47–69. [Google Scholar]
- Garbeva, J.A.; van Veen, J.A.; van Elsas, J.D. Microbial diversity in soil: Selection of microbial populations by plant and soil type and implications for disease suppressiveness. Ann. Rev. Phytopathol. 2004, 42, 243–270. [Google Scholar] [CrossRef]
- Legay, N.; Grassein, F.; Binet, M.N.; Arnoldi, C.; Personeni, E.; Perigon, S.; Polyd, F.; Pommierd, T.; Puissanta, J.; Clémenta, J.C.; et al. Plant species identities and fertilization influence on arbuscular mycorrhizal fungal colonisation and soil bacterial activities. Appl. Soil Ecol. 2016, 98, 132–139. [Google Scholar] [CrossRef]
- Shukla, A.; Vyas, D.; Anuradha, J. Soil depth: An overriding factor for distribution of arbuscular mycorrhizal fungi. J. Soil Sci. Plant. Nut. 2013, 13, 23–33. [Google Scholar] [CrossRef]
- Brady, N.C.; Weil, R.R. The Nature and Properties of Soils; Prentice-Hall Inc.: Upper Saddle River, NJ, USA, 1996. [Google Scholar]
- Verbruggen, E.; Röling, W.F.; Gamper, H.A.; Kowalchuk, G.A.; Verhoef, H.A.; van der Heijden, M.G. Positive effects of organic farming on below-ground mutualists: Large-scale comparison of mycorrhizal fungal communities in agricultural soils. New Phytol. 2010, 186, 968–979. [Google Scholar] [CrossRef] [PubMed]
- Cuenca, G.; Lovera, M. Seasonal variation anddistribution at different soil depths of arbuscular mycorrhizal fungi spores in a tropical sclerophyllous shrubland. Botany 2010, 88, 54–64. [Google Scholar] [CrossRef]
- Li, P.; Zhao, Z.; Li, Z.B.; Zhan, T.T. Characters of root biomass spatial distribution of Robinia pseudoacacia in Weibei loess areas. Ecol. Environ. 2005, 14, 405–409. [Google Scholar]
- Higo, M.; Isobe, K.; Yamaguchi, M.; Drijber, R.A.; Jeske, E.S.; Ishii, R. Diversity and vertical distribution of indigenous arbuscular mycorrhizal fungi under two soybean rotational systems. Biol. Fert. Soils 2013, 49, 1085–1096. [Google Scholar] [CrossRef]
- Taniguchi, T.; Usuki, H.; Kikuchi, J.; Hirobe, M.; Miki, N.; Fukuda, K.; Zhang, G.S.; Wang, L.H.; Yoshikawa, K.; Yamanaka, N. Colonization and community structure of root-associated microorganisms of Sabina vulgaris with soil depth in a semiarid desert ecosystem with shallow groundwater. Mycorrhiza 2012, 22, 419–428. [Google Scholar] [CrossRef]
- Guo, H.J.; He, X.L.; Li, Y.P. Spatial distribution of arbuscular mycorrhiza and glomalin in the rhizosphere of Caragana korshinskii Kom. in the Otindag sandy land, China. Afr. J. Microbiol. Res. 2012, 6, 5745–5753. [Google Scholar]
- Syliva, D.M.; Neal, L.H. Nitrogen affects the phosphorous response of VA mycorrhizae. New Phytol. 1990, 115, 303–310. [Google Scholar] [CrossRef]
- Khade, S.W.; Rodrigues, B.F. Spatial variations in arbuscular mycorrhizal (AM) fungi associated with Carica papaya L. in a tropical agro-based ecosystem. Biol. Agric. Hortic. 2008, 26, 149–174. [Google Scholar] [CrossRef]
Figure 1.
Root colonization (A) and spore density (B) of arbuscular mycorrhizal fungi in the rhizosphere of five dominant tree species. Two-way ANOVA revealed the effects of soil depth (DE), tree species (TS), and their interactions (TS × DE) on mycorrhizal colonization rate and spore density (*** p < 0.001). Bars represent standard deviation and different letters on the bars indicate significant differences among the five tree species or between the two soil depths (p-values < 0.05). Tree species: H. rha, Hippophae rhamnoides; J. com, Juniperus communis; P. cat, Populus cathayana; R. pse, Robinia pseudoacacia; and S. mat, Salix matsudana.
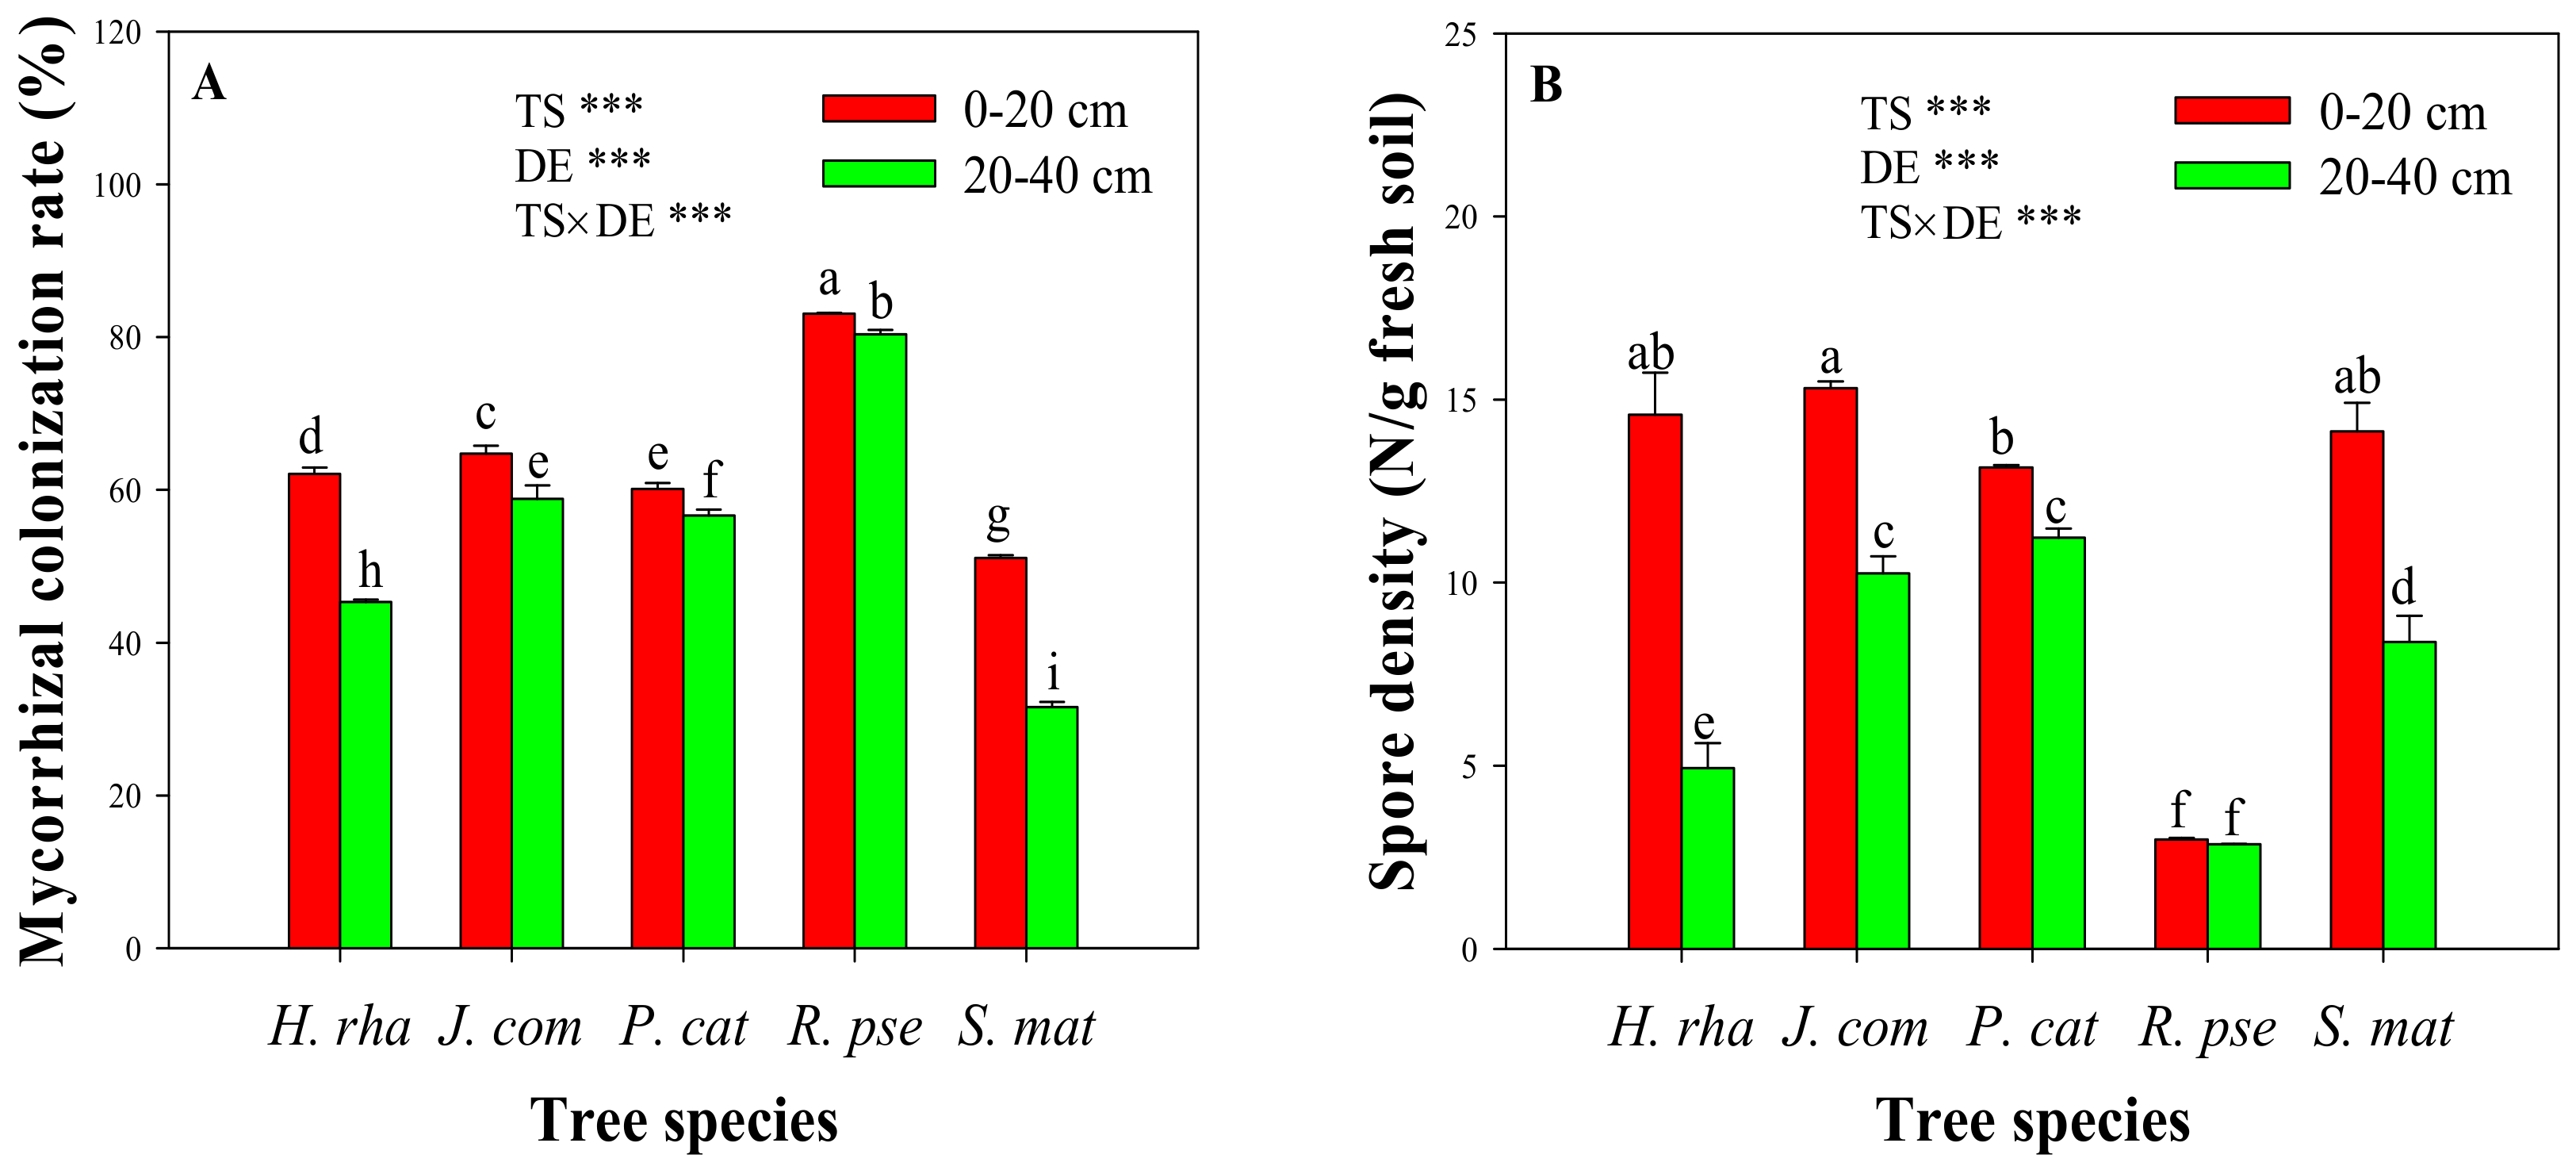
Figure 2.
Proportion of arbuscular mycorrhizal (AM) fungal spores in the rhizosphere of five dominant tree species. Tree species: H. rha, Hippophae rhamnoides; J. com, Juniperus communis; P. cat, Populus cathayana; R. pse, Robinia pseudoacacia; and S. mat, Salix matsudana. Soil depths: 1, 0–20 cm and 2, 20–40 cm.
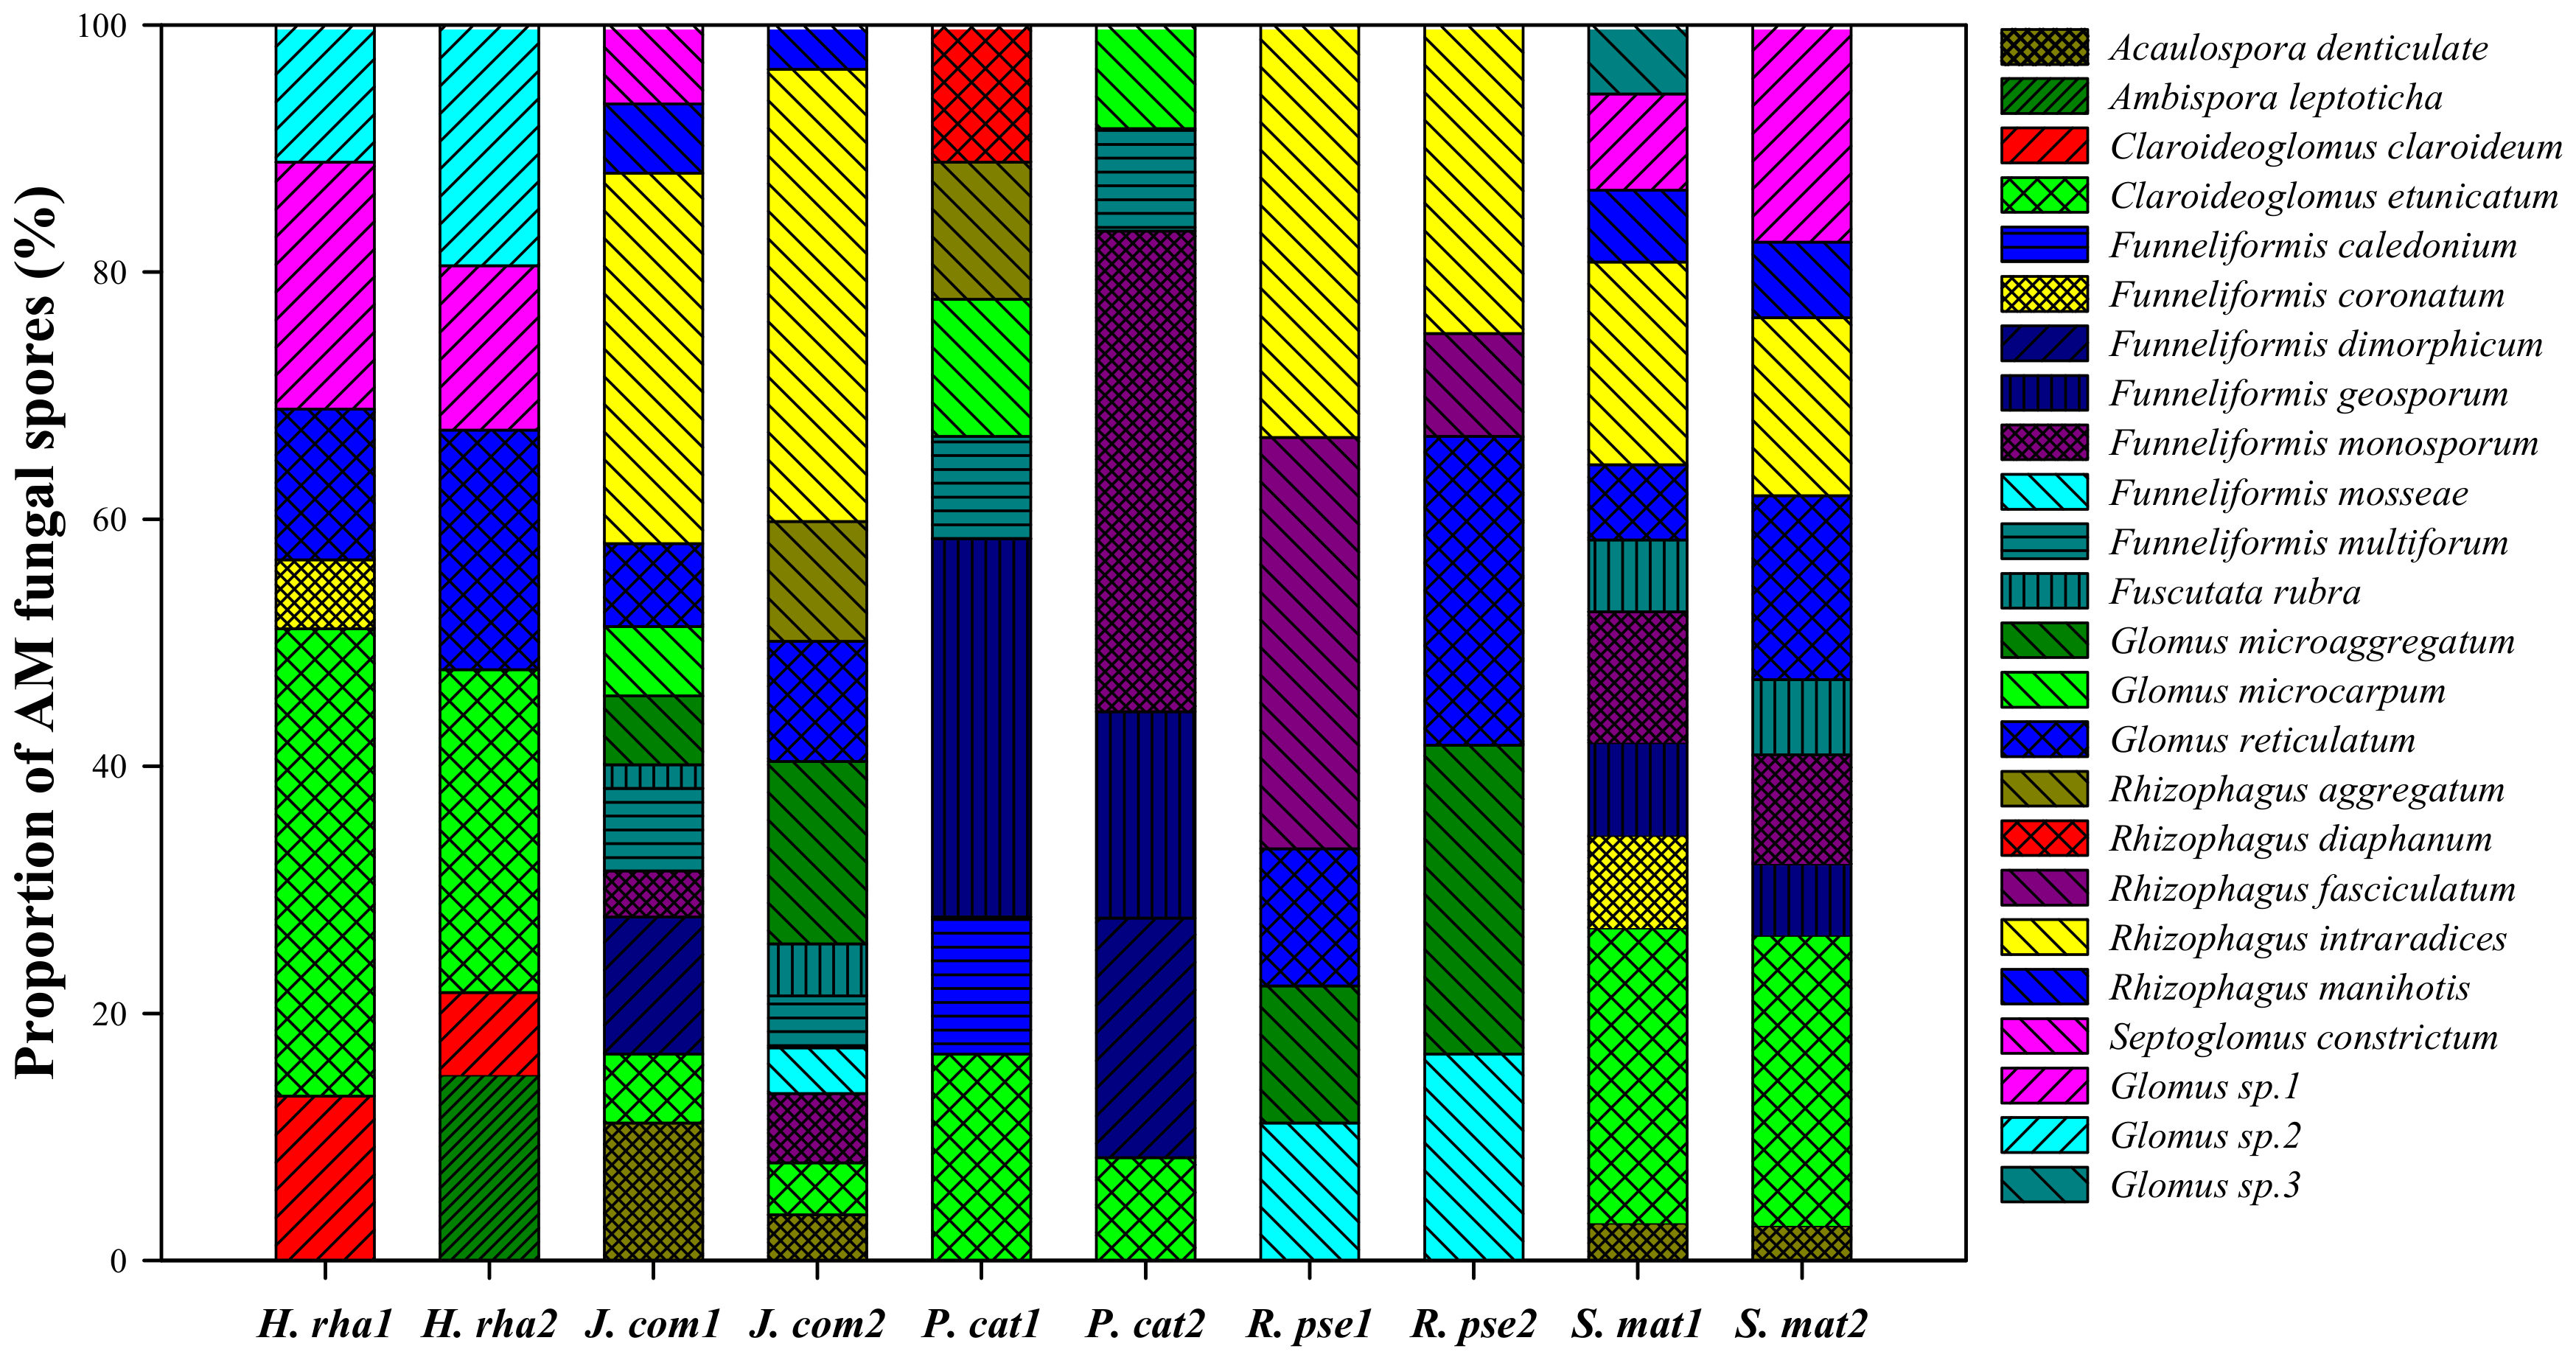
Figure 3.
Non-metric multidimensional scaling (NMDS) analysis of the variation in arbuscular mycorrhizal fungal community composition based on the proportion of fungal species (stress = 0.141). Sixty marks are presented in the NMDS plot, corresponding to the 60 soil samples. Tree species: H. rha, Hippophae rhamnoides; J. com, Juniperus communis; P. cat, Populus cathayana; R. pse, Robinia pseudoacacia; and S. mat, Salix matsudana.
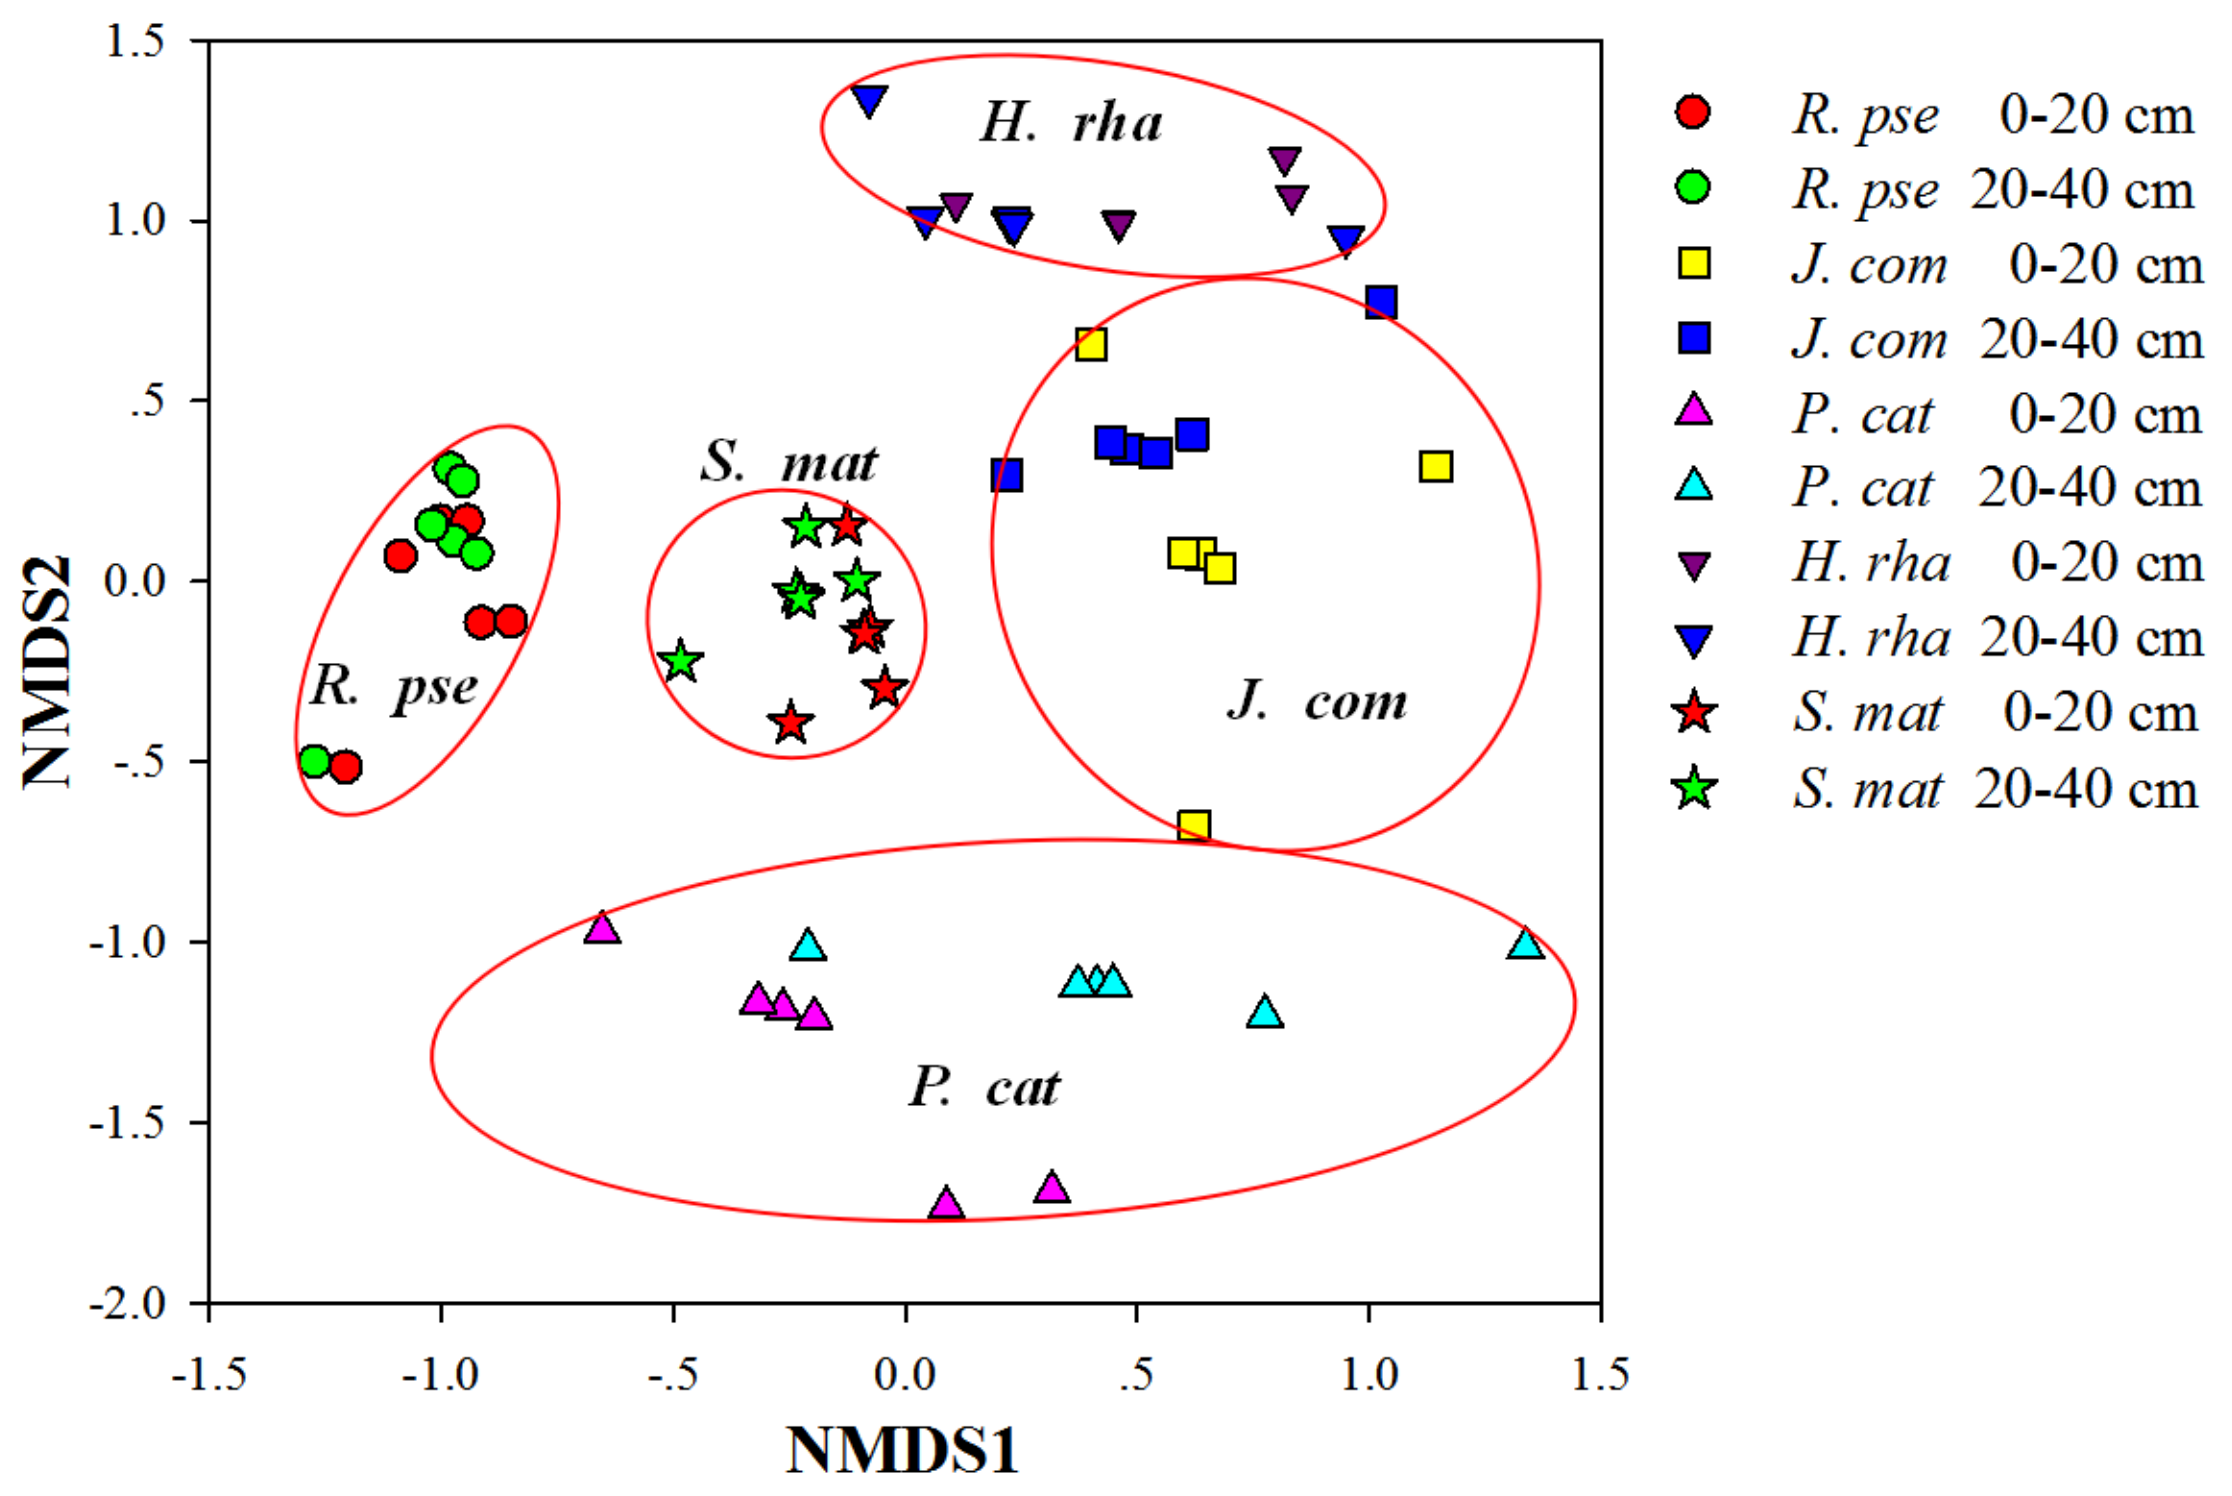
Figure 4.
Differences in species richness (A), Shannon–Wiener index (B) and evenness index (C) of arbuscular mycorrhizal fungal communities in the rhizosphere of five dominant tree species at two soil depths. Two-way ANOVA displayed the effect of soil depth (DE), tree species (TS), and the interaction effect (TS × DE) on species richness, Shannon-Wiener and Evenness indices (ns, non-significant; ** p < 0.01; *** p < 0.001). Deviation bars mean standard deviation. Bars followed by lowercase letters are significantly different between two soil depths and among five tree species (p < 0.05). Tree species: H. rha, Hippophae rhamnoides; J. com, Juniperus communis; P. cat, Populus cathayana; R. pse, Robinia pseudoacacia; and S. mat, Salix matsudana.

Figure 5.
Pearson’s correlations between arbuscular mycorrhizal community characteristics and soil properties. Soil properties: SWC, soil water content; SOC, soil organic carbon; AP, available phosphorus; TP, total phosphorus; AK, available potassium; TK, total potassium; NO3-N, nitrate nitrogen; NH4-N, ammonium nitrogen; and TN, total nitrogen. Arbuscular mycorrhizal community characteristics: SD, spore density; SR, species richness; SW, Shannon–Wiener index; EI, evenness index; and MCR, mycorrhizal colonization rate. *p < 0.05; and **p < 0.01.

Figure 6.
Structural equation modeling of the relationships between arbuscular mycorrhizal (AM) fungal community characteristics and soil properties, based upon the results of Mantel tests (goodness-of-fit index = 0.908, p = 0.051). Dashed lines, red, and blue lines represent non-significant, negative, and positive standardized regression weights, respectively. Numbers at the upper right corner of parameter boxes are the squared multiple correlation. All numbers on each line between boxes are the standardized regression weights (*p < 0.05, **p < 0.01).


Table 1.
Soil properties in the rhizosphere of five dominant tree species at two soil depths.
| Tree Species | Depth | SWC (%) | pH | SOC (g kg−1) | AP (mg kg−1) | TP (g kg−1) | AK (mg kg−1) | TK (g kg−1) | NO3-N (mg kg−1) | NH4-N (mg kg−1) | TN (g kg−1) |
|---|---|---|---|---|---|---|---|---|---|---|---|
| H. rha | 0–20 | 14.0 ± 0.8 b | 7.65 ± 0.1 a | 5.23 ± 1.70 cd | 7.40 ± 1.22 ab | 1.01 ± 0.05 ab | 11.59 ± 0.27 c | 11.14 ± 0.89 bc | 10.71 ± 0.82 a | 9.65 ± 1.28 ab | 0.24 ± 0.03 e |
| 20–40 | 15.4 ± 1.1 a | 7.66 ± 0.1 a | 4.12 ± 1.20 de | 6.38 ± 0.98 ab | 1.04 ± 0.12 ab | 11.52 ± 0.64 c | 10.63 ± 0.50 c | 10.57 ± 2.75 a | 7.07 ± 0.74 b | 0.22 ± 0.01 efg | |
| J. com | 0–20 | 11.5 ± 1.3 cd | 7.40 ± 0.1 c | 13.77 ± 2.38 a | 6.94 ± 1.96 ab | 1.55 ± 0.41 a | 12.52 ± 0.07 ab | 14.58 ± 1.13 ab | 10.48 ± 0.66 a | 10.79 ± 1.14 a | 0.84 ±0.04 a |
| 20–40 | 11.6 ± 0.2 cd | 7.51 ± 0.1 bc | 12.10 ± 1.45 ab | 5.85 ± 0.68 b | 1.57 ± 0.35 a | 11.97 ± 0.12 bc | 13.52 ± 0.83 abc | 9.43 ± 0.55 a | 6.93 ± 0.29 b | 0.77 ± 0.01 b | |
| P. cat | 0–20 | 10.3 ± 0.5 d | 7.60 ± 0.1 ab | 4.09 ± 1.05 de | 7.59 ± 0.17 ab | 1.13 ± 0.12 ab | 12.83 ± 0.05 a | 16.02 ± 3.49 a | 10.64 ± 0.37 a | 7.26 ± 1.62 b | 0.18 ± 0.01 fgh |
| 20–40 | 11.0 ± 0.3 d | 7.64 ± 0.1 ab | 3.53 ± 0.40 de | 6.36 ± 0.26 ab | 0.87 ± 0.18 b | 12.32 ± 0.24 ab | 13.04 ± 0.75 abc | 10.18 ± 0.40 a | 7.15 ± 0.58 b | 0.16 ± 0.03 gh | |
| R. pse | 0–20 | 4.5 ± 0.3 e | 7.62 ± 0.1 ab | 2.66 ± 0.28 de | 8.00 ± 0.87 ab | 1.17 ± 0.07 ab | 12.97 ± 0.05 a | 16.83 ± 0.03 a | 10.62 ± 0.43 a | 8.63 ± 0.87 ab | 0.22 ± 0.01 ef |
| 20–40 | 4.9 ± 0.8 e | 7.67 ± 0.1 a | 2.53 ± 0.62 e | 7.49 ± 2.86 ab | 1.04 ± 0.06 ab | 12.56 ± 0.04 ab | 15.15 ± 0.97 a | 10.24 ± 0.01 a | 7.96 ± 0.03 ab | 0.12 ± 0.01 h | |
| S. mat | 0–20 | 11.3 ± 0.8 cd | 7.65 ± 0.1 a | 10.44 ± 2.14 b | 10.06 ± 1.67 a | 1.29 ± 0.21 ab | 12.67 ± 0.03 ab | 10.83 ± 0.32 bc | 10.60 ± 1.08 a | 8.17 ± 0.52 ab | 0.62 ± 0.01 c |
| 20–40 | 12.6 ± 0.9 c | 7.67 ± 0.1 a | 6.69 ± 1.57 c | 9.45 ± 1.27 ab | 1.19 ± 0.10 ab | 12.36 ± 0.24 ab | 10.60 ± 0.95 c | 9.55 ± 0.77 a | 6.78 ± 2.12 b | 0.50 ± 0.01 d | |
| TS | *** | *** | *** | ** | *** | *** | *** | ns | ns | *** | |
| DE | ** | * | ** | ns | ns | *** | * | ns | *** | *** | |
| TS × DE | ns | ns | ns | ns | ns | ns | ns | ns | ns | *** | |
Values are means of six replicates ± standard deviation. Different letters indicate significant differences between the two soil depths or among the five tree species (p < 0.05). Two-way ANOVA revealed the effects of tree species (TS), soil depth (DE), and their interactions (TS × DE) on soil parameters (* p < 0.05; ** p < 0.01; and *** p < 0.001). Soil properties: SWC, soil water content; SOC, soil organic carbon; AP, available phosphorus; TP, total phosphorus; AK, available potassium; TK, total potassium; NO3-N, nitrate nitrogen; NH4-N, ammonium nitrogen; and TN, total nitrogen. Tree species: H. rha, Hippophae rhamnoides; J. com, Juniperus communis; P. cat, Populus cathayana; R. pse, Robinia pseudoacacia; and S. mat, Salix matsudana.
Table 2.
Regression analysis of arbuscular mycorrhizal fungal community composition versus soil properties, spore density, mycorrhizal colonization rate, and diversity indices.
Table 2.
Regression analysis of arbuscular mycorrhizal fungal community composition versus soil properties, spore density, mycorrhizal colonization rate, and diversity indices.
| Variable | R2 | F | p |
|---|---|---|---|
| SWC | 0.922 | 3.070 | 0.083 |
| pH | 0.881 | 1.932 | 0.211 |
| SOC | 0.979 | 11.952 | 0.003** |
| AP | 0.832 | 1.295 | 0.400 |
| TP | 0.934 | 3.694 | 0.055 |
| AK | 0.962 | 6.671 | 0.013* |
| TK | 0.958 | 6.950 | 0.012* |
| NO3-N | 0.686 | 0.569 | 0.847 |
| NH4-N | 0.919 | 2.953 | 0.091 |
| TN | 0.960 | 6.263 | 0.015* |
| SD | 0.951 | 5.097 | 0.025* |
| MCR | 0.920 | 3.011 | 0.087 |
| SR | 0.891 | 2.130 | 0.176 |
| SW | 0.789 | 0.974 | 0.567 |
| EI | 0.909 | 2.608 | 0.118 |
Soil properties: SWC, soil water content; SOC, soil organic carbon; AP, available phosphorus; TP, total phosphorus; AK, available potassium; TK, total potassium; NO3-N, nitrate nitrogen; NH4-N, ammonium nitrogen; and TN, total nitrogen. Fungal community characteristics: SD, spore density; MCR, mycorrhizal colonization rate; SR, species richness; SW, Shannon–Wiener index; and EI, evenness index. Fungal community composition: the matrix of the spore numbers of each species. * p < 0.05; ** p < 0.01.
© 2019 by the authors. Licensee MDPI, Basel, Switzerland. This article is an open access article distributed under the terms and conditions of the Creative Commons Attribution (CC BY) license (http://creativecommons.org/licenses/by/4.0/).
Share and Cite
MDPI and ACS Style
He, F.; Chen, H.; Tang, M. Arbuscular Mycorrhizal Fungal Communities Are Influenced by Host Tree Species on the Loess Plateau, Northwest China. Forests 2019, 10, 930. https://doi.org/10.3390/f10100930
AMA Style
He F, Chen H, Tang M. Arbuscular Mycorrhizal Fungal Communities Are Influenced by Host Tree Species on the Loess Plateau, Northwest China. Forests. 2019; 10(10):930. https://doi.org/10.3390/f10100930
Chicago/Turabian StyleHe, Fei, Hui Chen, and Ming Tang. 2019. "Arbuscular Mycorrhizal Fungal Communities Are Influenced by Host Tree Species on the Loess Plateau, Northwest China" Forests 10, no. 10: 930. https://doi.org/10.3390/f10100930
Note that from the first issue of 2016, this journal uses article numbers instead of page numbers. See further details here.