Factors Affecting Spatial Variation in Vegetation Carbon Density in Pinus massoniana Lamb. Forest in Subtropical China


1
College of Forestry, Beijing Forestry University, Beijing 100083, China
2
Key Laboratory of National Forestry and Grassland Administration on Forest Ecosystem Protection and Restoration in Poyang Lake Watershed, Jiangxi Agricultural University, Nanchang 330045, China
3
College of Forestry, Jiangxi Agricultural University, Nanchang 330045, China
*
Author to whom correspondence should be addressed.
Forests 2019, 10(10), 880; https://doi.org/10.3390/f10100880
Submission received: 19 July 2019
/
Revised: 20 September 2019
/
Accepted: 29 September 2019
/
Published: 6 October 2019
(This article belongs to the Section Forest Ecology and Management)
Abstract
:Carbon density is an important indicator of carbon sequestration capacity in forest ecosystems. We investigated the vegetation carbon density of Pinus massoniana Lamb. forest in the Jiangxi Province. Based on plots investigation and measurement of the carbon content of the samples, the influencing factors and spatial variation of vegetation carbon density (including the tree layer, understory vegetation layer and litter layer) were analysed. The results showed that the average vegetation carbon density value of P. massoniana forest was 52 Mg·ha−1. The vegetation carbon density was significantly (p < 0.01) and positively correlated with the stand age, mean annual precipitation, elevation and stand density and negatively correlated with the slope and mean annual temperature. Forest management had a significant impact on vegetation carbon density. To manage P. massoniana forest for carbon sequestration as the primary objective, near-natural forest management theory should be followed, e.g., replanting broadleaf trees. These measures would promote positive succession and improve the vegetation carbon sequestration capacity of forests. The results from the global Moran’s I showed that the vegetation carbon density of P. massoniana forest had significant positive spatial autocorrelation. The results of local Moran’s I showed that the high-high spatial clusters were mainly distributed in the southern, western and eastern parts of the province. The low-low spatial clusters were distributed in the Yushan Mountains and in the northern part of the province. The fitting results of the semivariogram models showed that the spherical model was the best fitting model for vegetation carbon density. The ratio of nugget to sill was 0.45, indicating a moderate spatial correlation of carbon density. The vegetation carbon density based on kriging spatial interpolation was mainly concentrated in the range of 32.5–69.8 Mg·ha−1. The spatial distribution of vegetation carbon density regularity was generally low in the middle region and high in the peripheral region, which was consistent with the terrain characteristics of the study area.
1. Introduction
In recent years, the concentration of atmospheric carbon dioxide (CO2) has been increasing due to the massive combustion of fossil fuels and changes in land use [1]. Global warming caused by increasing atmospheric CO2 concentrations has become a major concern in China and worldwide [2,3]. Mitigation methods mainly include reducing anthropogenic CO2 emissions and enhancing the potential for carbon sequestration by terrestrial ecosystems [4,5]. Forest ecosystems play an important role in regulating the global carbon balance and mitigating climate warming because forests store approximately 2/3 of all carbon stored in terrestrial ecosystems [6,7,8]. Therefore, carbon sequestration in forest ecosystems is identified as an effective and economical approach for mitigating atmosphere CO2 concentrations and global warming [9]. Carbon density is the carbon stock per unit area and is an important indicator of the carbon sequestration capacity of forest ecosystems [10,11]. Estimating forest carbon density is helpful for understanding the global and regional forest carbon source/sink distributions and the carbon sequestration capacity of forests. Additionally, this information provides a scientific basis for the management of forest carbon sinks.
A great deal of research has been conducted to study forest carbon density and the forest carbon sequestration potential at the regional level. For example, Saatchi et al. [12] estimated forest carbon density in tropical regions across three continents and drew a benchmark map. Thurner et al. [13] studied temperate forest carbon density and its spatial distribution. However, subtropical forests have received comparatively less attention regarding their roles in the carbon cycle of terrestrial ecosystems. Influenced by the monsoon circulation and the Tibetan Plateau, the rainy season and the hot season are synchronized in the subtropical regions of China, which also features suitable climates and abundant forest resources, occupying a unique position in the world. Pinus massoniana Lamb. is a typical native coniferous tree species in subtropical China and is also a pioneer tree species for vegetation restoration. It exhibits strong adaptability and tolerance of drought and poor soil, and it has a large distribution area. P. massoniana forest is one of the main forest types in the Jiangxi Province. The area is 2,394,000 ha, accounting for 29% of the province’s forest land area [14]. It plays an important role in regulating the regional carbon cycle and climate change. The main objectives of this study were to (1) characterize the spatial variation in vegetation carbon density in P. massoniana forest and (2) analyse the spatial patterns of carbon density and the influencing factors. The results will provide a scientific reference for the management of P. massoniana forest to improve the vegetation carbon sequestration in the study area. It will also provide a reference for the spatial variation analysis and the assessment of vegetation carbon density on a large scale.
2. Materials and Methods
2.1. Study Area
The study area was located in Jiangxi Province of southeast China (24°29′–30°04′ N, 113°34′–118°28′ E). The total land area is 166,900 km2. This region is characterized by a mid-subtropical warm and humid climate. The mean annual temperature ranges from 16.3 °C to 19.5 °C, and the annual precipitation is 1675 mm, with a distinct wet season from April to June. The frost-free period lasts for 240–307 days. The soils are mainly red soil and red-yellow soil based on the Chinese soil classification, which are classified as ferralsols in the World Reference Base for Soil Resources. The soil texture is mostly silty loam, sandy clayey loam and clayey loam. The soil is mostly acidic, and soil thickness is generally greater than 50 cm. This area is rich in forest resources, with a forest coverage rate of 63.1%. The dominant vegetation types include evergreen broadleaf forests, P. massoniana forests, Cunninghamia lanceolata (Lamb.) Hook. forests and bamboo forests [14]. In the study area, the management of natural forests is mainly based on protection. Harvesting and other artificial measures are strictly restricted. However, the plantations are mainly used for cultivating timber. Artificial measures such as thinning and cutting trees are allowed to adjust stand structure, which can improve forest productivity.
2.2. Data Collection
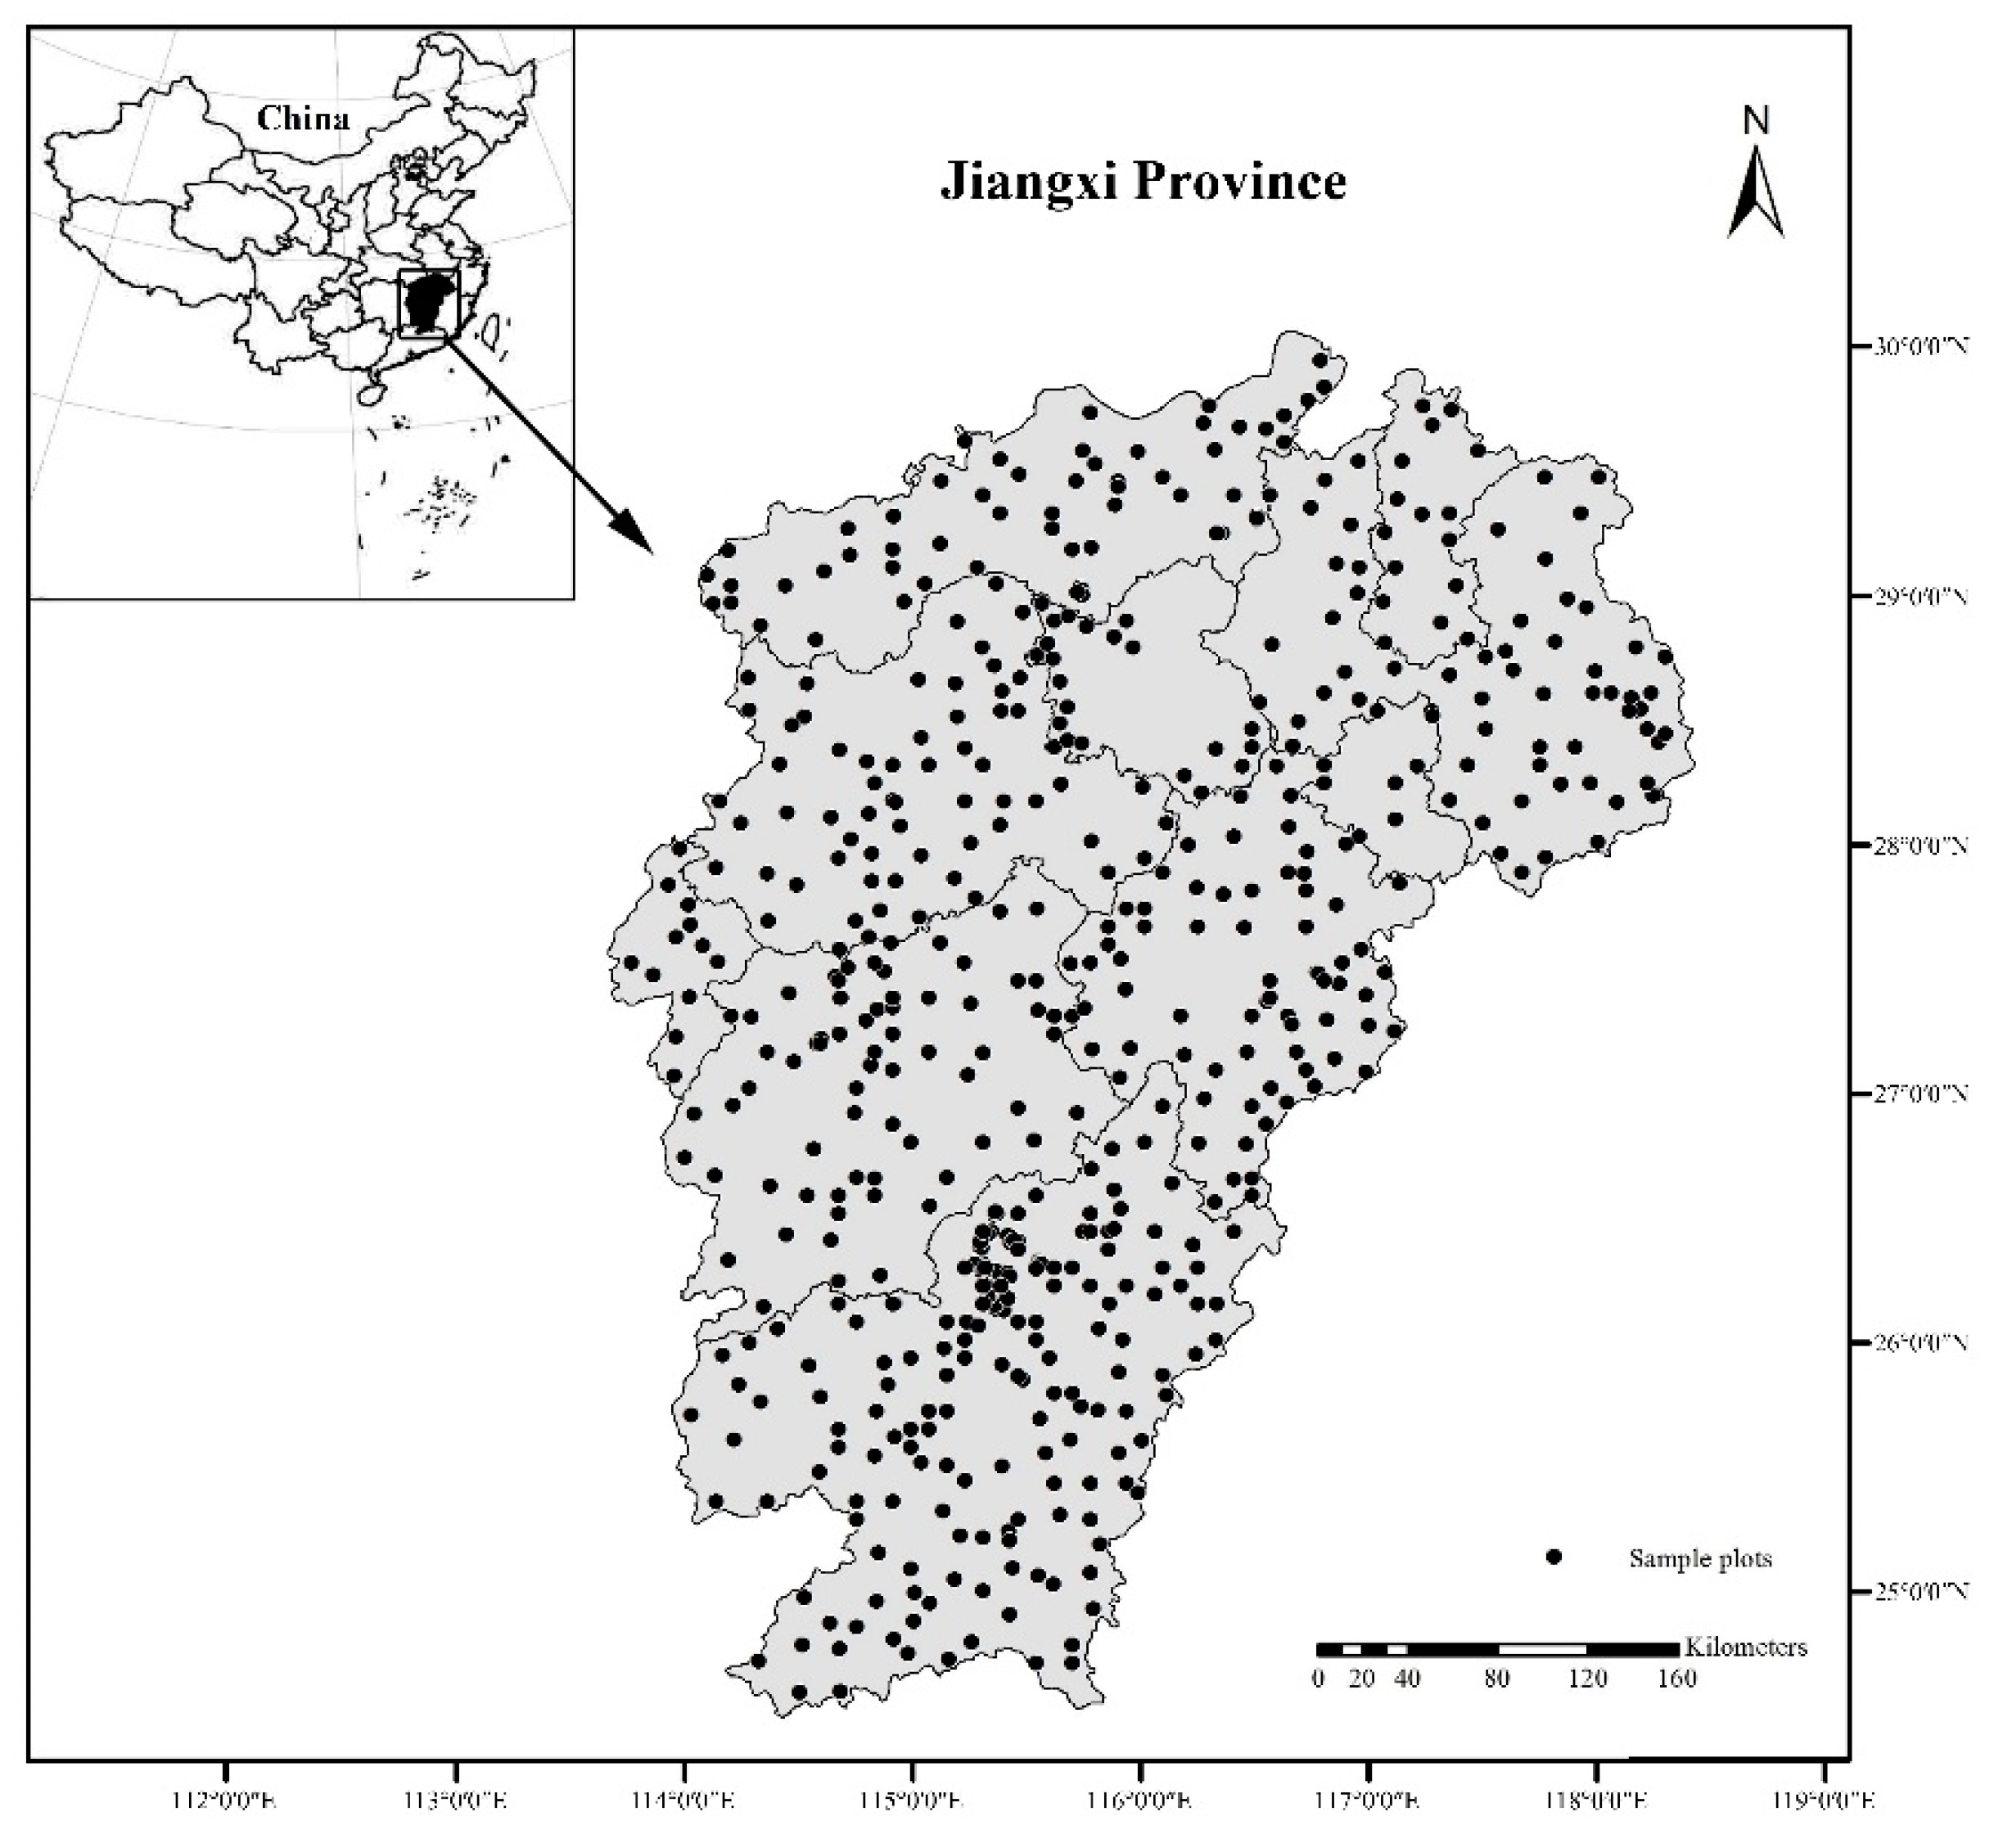
In total, 611 plots were located throughout the area of distribution of P. massoniana across the Jiangxi Province (Figure 1), of which 301 plots were in planted forests. Each plot covered an area of 800 m2 (28.28 m × 28.28 m) or 900 m2 (30 m × 30 m). All plots were established during 2011–2016. The description of sample plots is shown in Table 1. For each plot, the DBH (the diameter at breast height 1.3 m, minimum ≥ 5 cm and below was classified as understory) of each tree was measured individually. To measure the carbon concentration, we selected standard trees whose DBH and height were the same as or similar to the average DBH and height of sample plots and sampled their components (stems, branches, foliage and roots). Stem samples were taken in the middle of the trunk. Branch and foliage samples were taken in the middle of the crown. Root samples were excavated manually at approximately 1 m depth within a radius of 1 m from the tree centre. The understory biomass was determined at each sample plot using destructive sampling techniques, including herbs, shrubs, and trees of less than 5 cm DBH. Three 2 m × 2 m subplots were set up for shrubs, while three 1 m × 1 m subplots were established along a diagonal line for litter inside the plots. The shrub biomass components (branches, leaves and roots) and herb biomass components (aboveground parts and roots) were separated and determined the fresh weight. The litter in the 1 m × 1 m subplot was all collected and weighed to determine the fresh weight. Approximately 200 g of each sample was then taken back to the laboratory and oven dried at 65 °C for moisture content and carbon concentration analysis.
The mean annual temperature and mean annual precipitation were obtained from ClimateAP 2.11, which used a climate model to represent the eastern Asia Pacific region [15]. The period of the mean annual temperature and mean annual precipitation was 1980–2016.
2.3. Carbon Density Calculations
At present, biomass models and biomass estimation parameters have been widely used in large scale forest biomass estimation [16]. Biomass estimation parameters include biomass expansion factor [17], wood density [18] and so on. In this study, the biomass of tree components (stems, branches, foliage and roots) were estimated using the biomass models [19,20,21,22] (Supplementary Table S1). The biomass of shrub components (branches, leaves and roots), herb components (aboveground parts and roots) and litter were calculated by fresh weight and moisture content. The carbon concentration of each biomass component was measured by the potassium dichromate oxidation-external heating method [23]. The biomass of each component was multiplied by the corresponding carbon concentration to calculate the carbon density. The total vegetation carbon density was the sum of the different biomass components (Table 2).
2.4. Spatial Autocorrelation Analyses
Moran’s I is a commonly used indicator of spatial autocorrelation at global and local scales. Global Moran’s I is used to analyse the spatial autocorrelation pattern of the whole study area, and a single value is used to reflect the degree of autocorrelation of a variable. Values range from −1 to 1, with a value >0 indicating positive spatial autocorrelation and a value <0 indicating negative spatial autocorrelation. Furthermore, a value close to 0 implies spatial randomness. The statistic for global Moran’s I of vegetation carbon density is defined as:
While global Moran’s I indicates the presence or lack of spatial autocorrelation at the level of the study area as a whole, local Moran’s I is used to calculate the degree of correlation of a variable in each spatial location with its neighbouring locations and to identify local spatial cluster patterns and spatial outliers. The local Moran’s I index of vegetation carbon density can be expressed as:
where, xi and xj represent the values of vegetation carbon density at locations i and j respectively, is the average vegetation carbon density value of xi across the study area, and wij(d) is the spatial weight measure within a given bandwidth d. If the distance between block j and subject block i is less than or equal to d, then wij(d) = 1, otherwise, wij(d) = 0.
A high positive local Moran’s I value suggests the target value is similar to its neighbourhood, and then the locations are spatial clusters, including high-high clusters (high values in a high-value neighbourhood) and low-low clusters (low values in a low-value neighbourhood). Meanwhile, a high negative local Moran’s I value implies a potential spatial outlier, mainly including high-low (a high value in a low-value neighbourhood) and low-high (a low value in a high-value neighbourhood) outliers [24].
2.5. Geostatistical Analysis
Geostatistics uses variogram (or semivariogram) techniques to measure the spatial variability of a regionalized variable and provides the input parameters for the spatial interpolation of kriging [25,26]. The semivariogram of vegetation carbon density can be expressed as:
where, r(h) is the semivariogram of vegetation carbon density for the lag distance h, Z(xi) and Z(xi + h) are the values of vegetation carbon density at locations xi and xi + h respectively, h is the lag distance, and N(h) is the number of pairs of sample points separated by h. With the increase of distance, if the semivariogram stabilizes, it reaches a sill. The distance at which the semivariogram reaches the sill is called the range. Beyond this distance, data are considered to be independent. Discontinuities at the semivariogram origin could be present. Such an unstructured component of variation at h = 0 is known as the nugget effect, which may be due to sampling errors and short-scale variability. In this study, four semivariogram models were applied to explore the spatial structure of vegetation carbon density, which are linear, exponential, Gaussian, and spherical models. The best-fit semivariogram model for vegetation carbon density was chosen based on the highest coefficient values (R2) and the minimum residuals [27]. Thereafter, according to the result of the best-fit semivariogram model, ordinary kriging was applied to produce the spatial distribution map of vegetation carbon density.
2.6. Statistical Analysis
The representative percentiles and commonly used descriptive statistics were calculated. Spearman correlation was used to study the correlation between vegetation carbon density and environmental factors. The differences in vegetation carbon density among different forest management measures were analysed using analysis of variance (ANOVA). All statistical analyses were carried out with SPSS 19.0 (SPSS Inc., Chicago, IL, USA). In this study, a statistical test of the Kolmogorov–Smirnov (K–S) method together with the skewness and kurtosis values was applied to evaluate the normality of the data sets. Box-Cox transformation was performed using R software (version 3.3, R Core Team 2017). The coefficient of variation (CV) is calculated by dividing the standard deviation by the mean value, which is used to determine the degree of dispersion for the variables assessed. A CV < 10% suggests low variability, a CV in the range of 10%–90% suggests moderate variability, and a CV > 90% suggests high variability [28]. Global Moran’s I and local Moran’s I values were measured using GeoDa 1.12.1.139 software (Luc Anselin, Chicago, IL, USA). The geostatistical analysis was carried out with GS+ (version 9.0, Gamma design software, LLC, Plainwell, MI, USA). All maps were produced using GIS software ArcMap 10.2 (ESRI, Redlands, CA, USA).
3. Results and Discussion
3.1. Descriptive Statistics
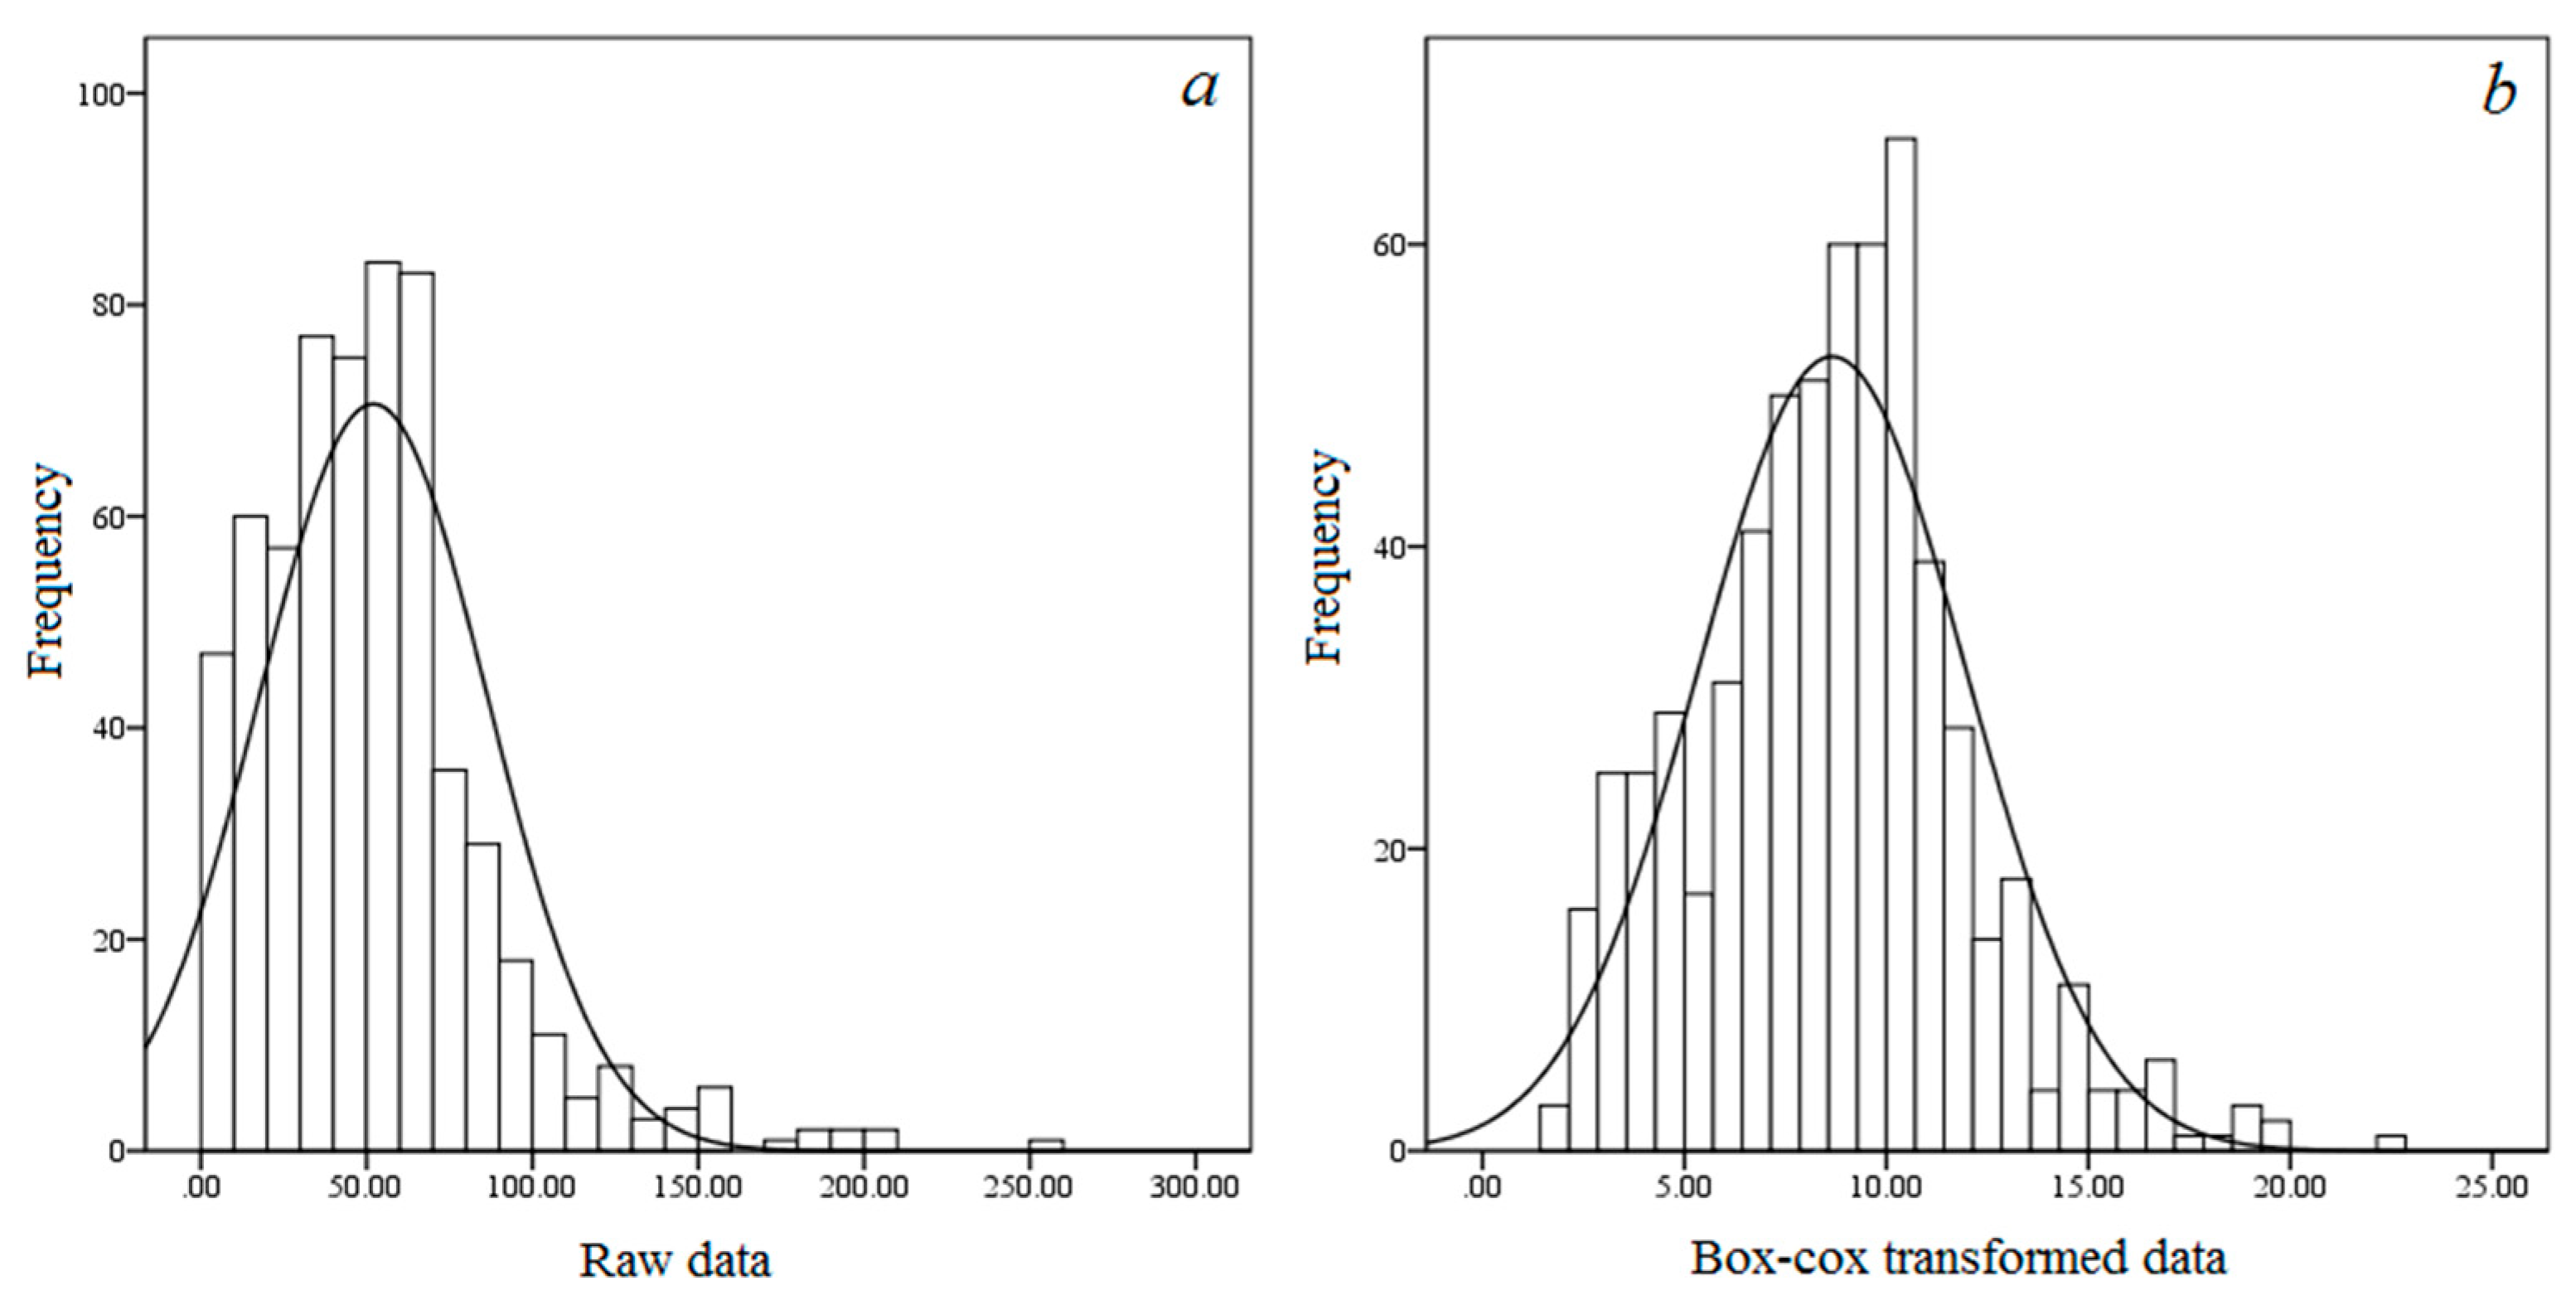
The average vegetation carbon density value of P. massoniana forest was 52.0 Mg·ha−1 (Table 3), which was close to that of warm coniferous forest (53.5 Mg·ha−1) in China [29]. In our study, the CV value of vegetation carbon density was 66.34%, indicating moderate variability. Histograms of vegetation carbon density with a normal distribution curve are shown in Figure 2. The raw data have a long tail towards high-carbon density values (Figure 2a). The Box-Cox transformed data show a normal distribution (Figure 2b). This result is confirmed by the K–Sp value (p > 0.05). Therefore, the transformed data were used for geostatistical analysis.
3.2. Analysis of Influencing Factors
3.2.1. Environmental Factors Related to Carbon Density
The spearman correlation coefficients between vegetation carbon density and environmental factors were calculated (Table 4). The vegetation carbon density was significantly (p < 0.05) and positively correlated with the elevation, slope position, slope aspect, mean annual precipitation (MAP), stand age, stand density and understory vegetation coverage and significantly (p < 0.01) and negatively correlated with the slope and mean annual temperature. The results of multiple linear regression were indicated that the vegetation carbon density was positively correlated with the stand age, MAP, elevation and stand density (Supplementary Tables S2 and S3). These results explained that stand age, MAP, elevation and stand density played vital roles in vegetation carbon density. Lan et al. [30] indicated that the vegetation carbon density values increased with increasing elevation, precipitation and stand age in the Guangdong Province, China. Zhao et al. [31] reported that the vegetation carbon density increased with increasing precipitation and decreased with increasing temperature. The vertical distribution of vegetation carbon density was mainly influenced by variation in the combination of water and heat [32]. The reason for the positive correlation between vegetation carbon density and elevation in this study may be that, with increasing elevation, the temperature decreases, and the precipitation increases, which is more conducive to plant growth. With increasing stand age, the plant biomass, and therefore the vegetation carbon density, increase, which could explain the positive correlation between vegetation carbon density and stand age in this study. The steeper the slope is, the more barren the soil is, which is not conducive to plant growth. Therefore, the vegetation carbon density decreased with increasing slope in this study.
3.2.2. Forest Management Related to Carbon Density
The vegetation carbon density was studied in areas with different forest management (natural and planted P. massoniana forests) (Figure 3). The vegetation carbon density of natural P. massoniana forest was significantly higher than that of plantation. Our results are generally consistent with the carbon density between natural and planted P. massoniana forests reported by Xiao et al. [33]. The reason may be related to man-made management measures. In the study area, the natural P. massoniana forest was mainly managed for pest control and forest fire prevention. Artificial measures such as tending, tree species and stand density adjustments were not implemented. The forest grew almost according to natural succession. Therefore, some broadleaf trees were present in the natural forest, and the coverage of understory vegetation was high. However, P. massoniana plantations were mainly used for cultivating timber. The management involved the removal of understory vegetation, thinning and cutting non-objective tree species such as broadleaf trees, resulting in a single structure of tree species and reduced understory vegetation. These forest management measures were not conducive to the positive succession of the plantation.
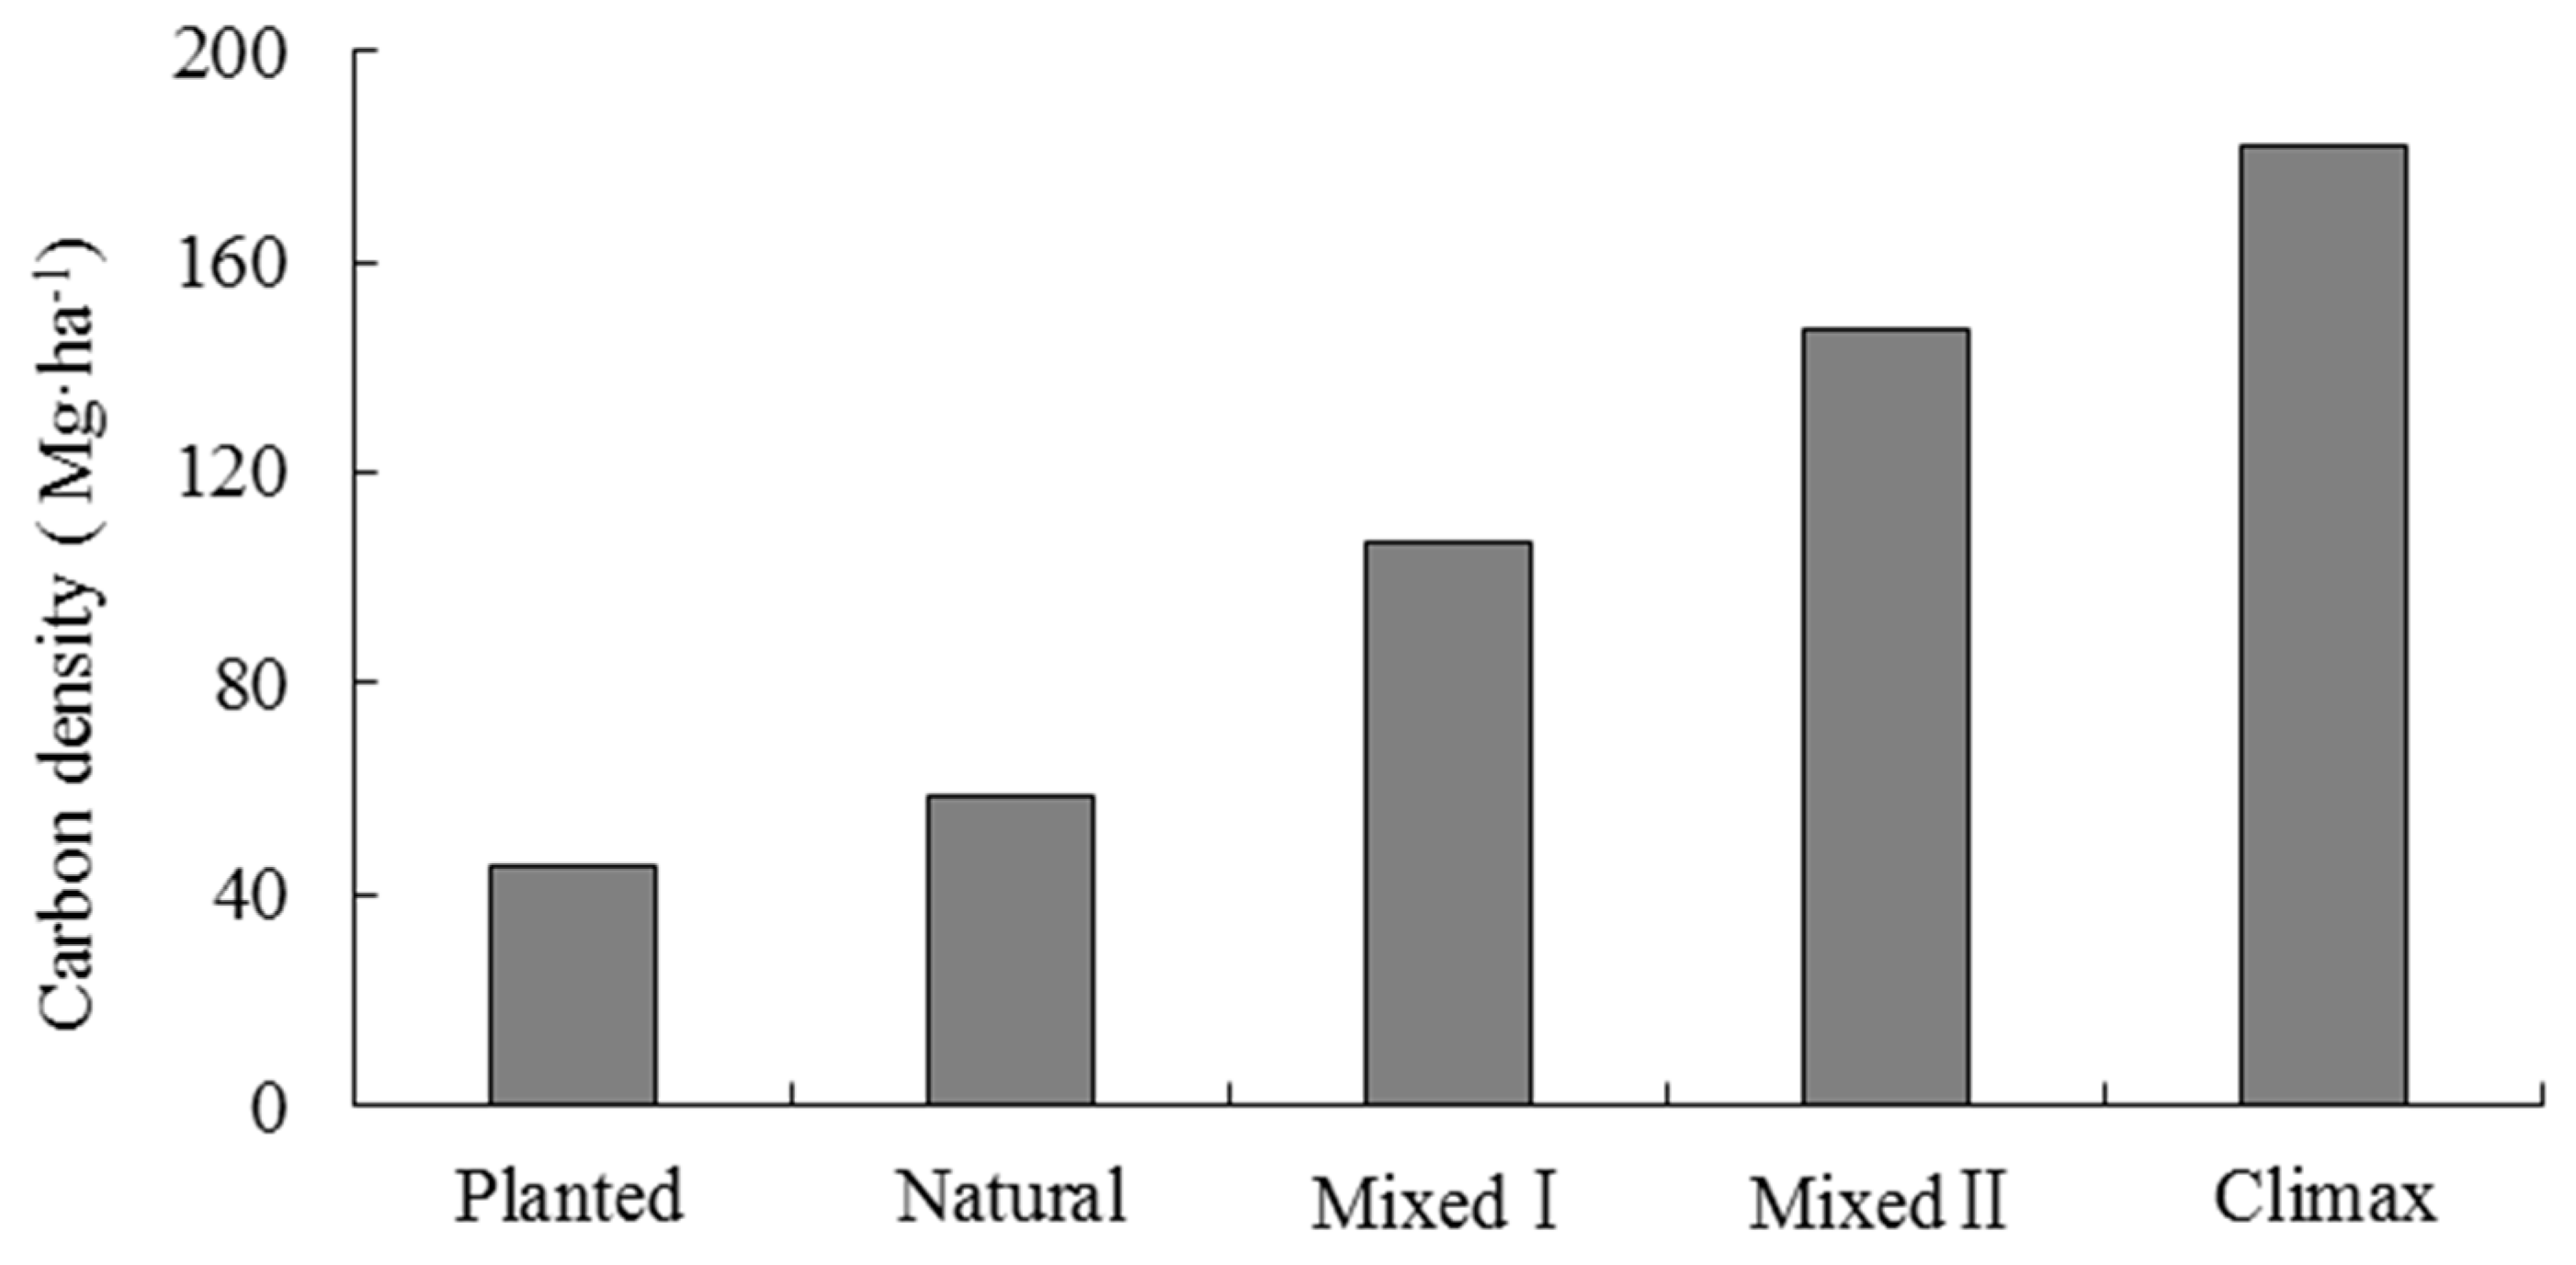
Zhan et al. [34] indicated that replanting broadleaf trees in P. massoniana forest for 20 years could improve soil fertility and promote the growth of P. massoniana. Fan et al. [35] also found that replanting broadleaf trees in P. massoniana forest could effectively improve the vegetation biomass. Lai et al. [36] reported that the vegetation carbon density of P. massoniana forest increased with the proportion of broadleaf trees. The planted and natural P. massoniana forests in our study were in the early stages of secondary succession, they would grow into mixed broadleaf-conifer forest that were P. massoniana-dominant (Mixed I), mixed broadleaf-conifer forest that were broadleaf-dominant (Mixed II) with forward succession, and finally succession to an evergreen broadleaf forest zonal climax community. When we combined our results with interrelated research [37,38] about different successional stages of carbon density (Figure 4), we found that the vegetation carbon density increased as the proportion of broadleaf trees increased. Therefore, to manage P. massoniana forest for carbon sequestration as the primary objective, near-natural forest management theory should be followed, such as replanting broadleaf trees. These measures would promote positive succession and improve the vegetation carbon sequestration capacity of forests. However, the relevant research reported that the carbon sequestration rate of vegetation decreased with positive succession. For example, Fang et al. [37] reported that during the period from P. massoniana forest to mixed forest through succession, the carbon sequestration rate of vegetation ranged from 4.63 to 7.37 Mg·ha−1·year−1 in the initial stage, then gradually slowed down, and finally, was in the range of 0.98–1.17 Mg·ha−1·year−1.
3.3. Spatial Cluster and Spatial Outlier Analysis
Figure 5 shows the results of local Moran’s I analysis for vegetation carbon density in P. massoniana forest. The global Moran’s I value of vegetation carbon density was 0.1277 (p < 0.01), indicating significant positive spatial autocorrelation in the spatial distribution across the study area. Overall, the high-high spatial cluster areas were mainly distributed in the southern part of the Jiangxi Province, and small high-high spatial clusters were found in the western and eastern areas of the province. The low-low spatial clusters were distributed in the Yushan Mountains and in the northern part of the Jiangxi Province. These cluster distributions may be due to elevation, human activities and other factors. The high-high spatial cluster areas were characterized by high elevation, followed by less human disturbance, and natural forests were mainly distributed in the areas, which were conducive to the accumulation of forest carbon sinks [39]. The vegetation in the low-low spatial clusters of the Yushan Mountains was severely damaged, which resulted in soil erosion and degradation. After afforestation with P. massoniana, the forest is gradually restored, but plant growth has been poor, and understory vegetation remains generally scarce [40]. The soil degradation was serious and was not conducive to vegetation carbon sequestration. The occurrence of high-low and low-high outliers may be affected by the local forest soil, microclimate and topography. The relevant research also reported that the spatial clusters and spatial outliers were found in the spatial distribution of forest carbon density [32,41].
3.4. Semivariance Analysis and Spatial Distribution
To stabilize the spatial variance, the transformed data, excluding the spatial outliers, were used. The best-fit semivariogram model for vegetation carbon density was chosen based on the highest coefficient values (R2) and the minimum residuals. Compared to the linear, exponential and Gaussian models, the spherical model was the best fitted semivariogram model for vegetation carbon density (Table 5), and this conclusion is supported by the semivariogram graphs (Figure 6). The “nugget-to-sill” value mainly represents the extent of spatial dependence, and the values <0.25, 0.25–0.75, and >0.75 represent strong, moderate and weak spatial dependence, respectively [42]. In this study, vegetation carbon density had moderate spatial dependence based on the “nugget-to-sill” value of 0.45. Therefore, both intrinsic and extrinsic factors strongly affected the spatial dependence of vegetation carbon density. The reason may be that plant growth was affected not only by structural factors such as topography, climate and other environmental factors but also by random factors such as human activities.
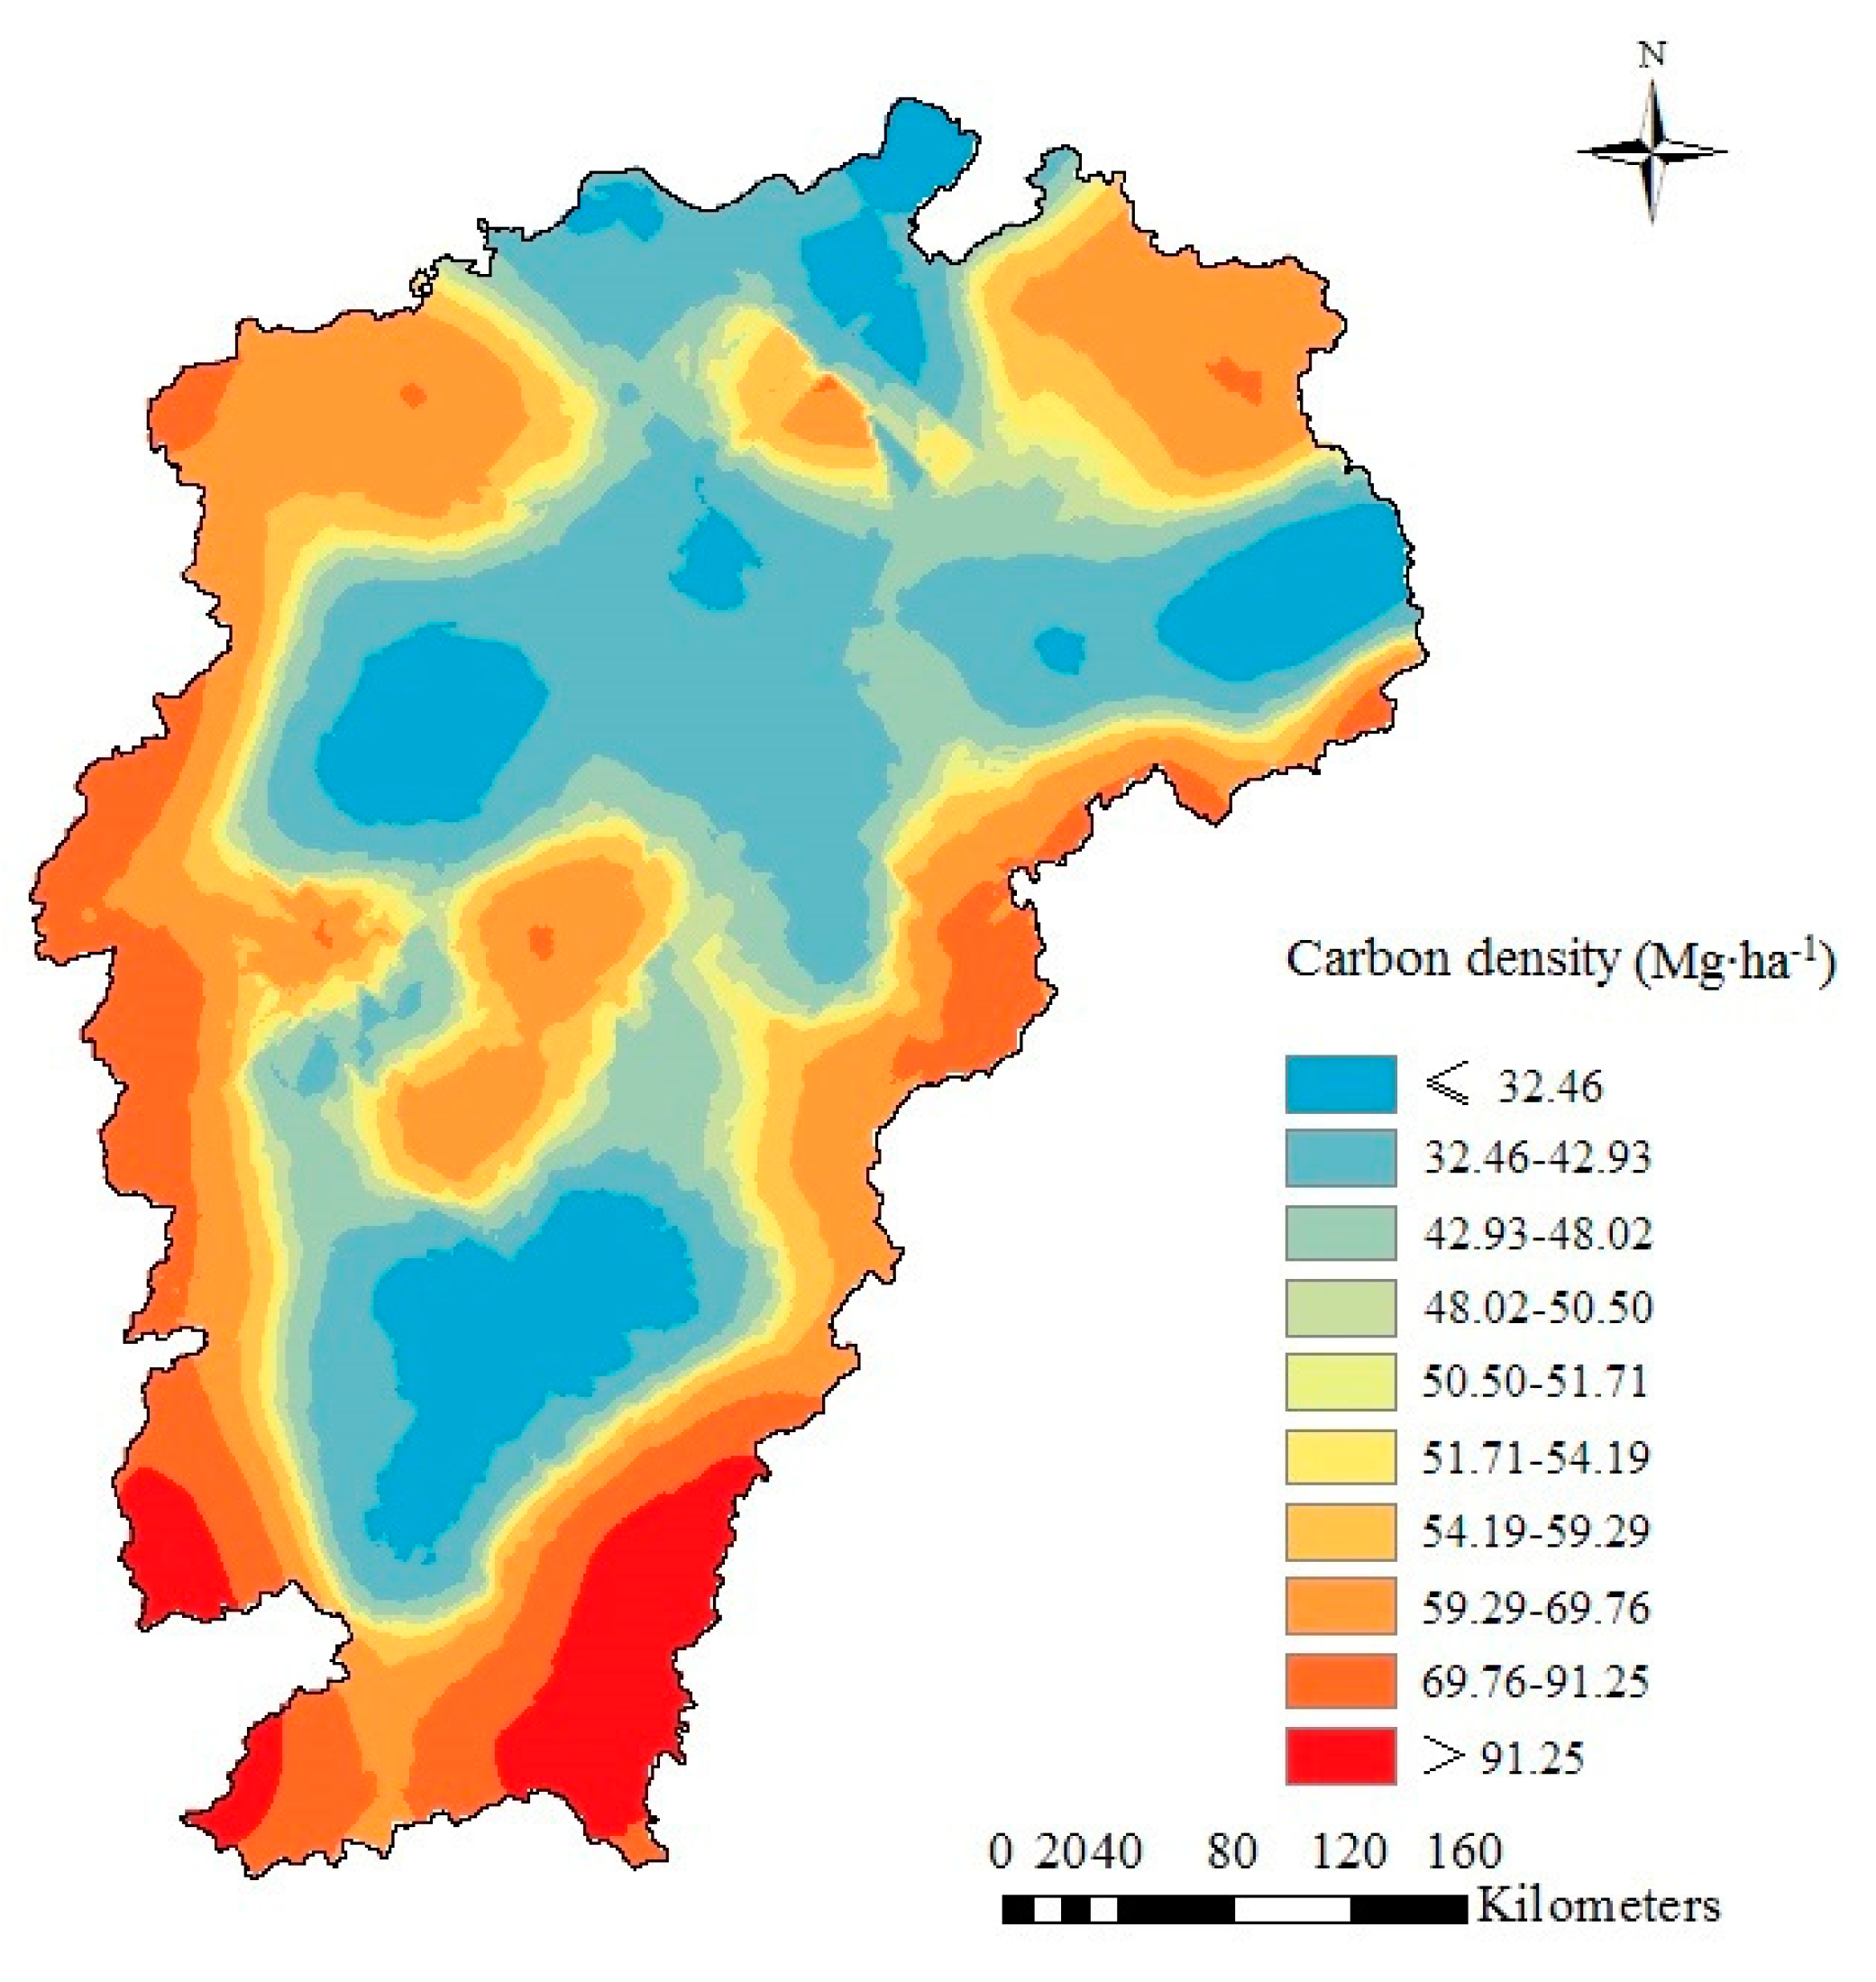
Based on kriging spatial interpolation, the vegetation carbon density was mainly concentrated in the range of 32.5–69.8 Mg·ha−1 (Figure 7). The spatial distribution of vegetation carbon density regularity was generally low in the middle region and high in the peripheral region, which was consistent with the terrain characteristics of the study area. Our results are similar to the findings of Cao et al. [43] and Zhang et al. [44]. The high carbon density was mainly located in the northeast, western and southern parts of the Jiangxi Province. These areas were characterized by high elevation and good hydrothermal conditions, followed by less human disturbance, which resulted in the high-vegetation carbon density. The areas with low carbon density were mainly located in the northern and central parts, which were characterized by low elevation and dense population, followed by frequent human activities. In addition, the soil erosion was serious in the Yushan Mountains, which led to the soil degradation and was not conducive to vegetation carbon sequestration.
The main factors affecting the spatial distribution of forest vegetation carbon density on the large regional scale were temperature, precipitation, elevation and other natural factors, while terrain characteristics could directly affect the distribution patterns of temperature and precipitation. Our results are similar to the results of Mizanur Rahman et al. [45], Swetnam et al. [46] and Wen et al. [47]. The spatial distribution of forest vegetation carbon density coincides with the terrain characteristics, which reflects that plant growth depends largely on natural conditions. Therefore, we can see that natural conditions are the dominant factors affecting forest productivity. In addition, the spatial distribution of forest vegetation carbon density is also affected by forest land use [48,49], forest management measures [50,51] and other human factors. These factors mainly affect the spatial distribution of forest vegetation carbon density in some small areas. Therefore, on a large regional scale, the spatial distribution of forest vegetation carbon density was consistent with the terrain characteristics. However, in some areas, the spatial distribution of forest vegetation carbon density did not coincide with the terrain characteristics. In this study, we analysed only the vegetation carbon density of P. massoniana forest. However, soil is the largest organic carbon pool in the terrestrial ecosystems: the global amount of carbon in soils is estimated at 2500 Gt, including 1550 Gt of soil organic carbon and 950 Gt of soil inorganic carbon [52]. The soil organic carbon stock is nearly three times the vegetation biomass carbon pool and approximately twice the amount of carbon stored in the atmosphere [53]. Therefore, we will further study the spatial variation of soil carbon density in P. massoniana forest in the future.
4. Conclusions
The average vegetation carbon density value of P. massoniana forest was 52 Mg·ha−1 in the study area. Stand age, mean annual precipitation, elevation and stand density played vital roles in vegetation carbon density. Forest management played an important role in vegetation carbon density. Replanting broadleaf trees in P. massoniana forest could effectively improve the vegetation carbon sequestration capacity. There was moderate spatial dependence of vegetation carbon density, related to natural and anthropogenic factors. The spatial patterns were in line with the spatial clusters. The spatial distribution of vegetation carbon density regularity was generally low in the middle region and high in the peripheral region, which was consistent with the terrain characteristics of the study area.
Supplementary Materials
The following are available online at https://www.mdpi.com/1999-4907/10/10/880/s1, Table S1: Biomass models of different tree species; Table S2. Statistical performance indicators of different models; Table S3. Coefficients of model.
Author Contributions
Conceptualization, P.P. and X.O.; methodology, P.P., Y.S. and H.Z.; formal analysis, P.P., H.Z., and, J.N.; investigation, P.P., J.N., and X.O.; data curation, X.O.; writing—original draft preparation, P.P. and J.R.; visualization, Y.S., J.N. and H.Z.
Funding
This research was funded by the National Natural Science Foundation of China (grant numbers 31760207, 31360181, 31700563) and the Strategic Priority Research Program of the Chinese Academy of Sciences (grant numbers XDA05050205).
Conflicts of Interest
The authors declare no conflict of interest.
References
- Vitousek, P.M. Beyond global warming: Ecology and global change. Ecology 1994, 75, 1861–1876. [Google Scholar] [CrossRef]
- Jones, C.; Lowe, J.; Liddicoat, S.; Betts, R. Committed terrestrial ecosystem changes due to climate change. Nat. Geosci. 2009, 2, 484–487. [Google Scholar] [CrossRef]
- Alam, A.; Kilpeläinen, A.; Kellomäki, S. Impacts of initial stand density and thinning regimes on energy wood production and management-related CO2 emissions in boreal ecosystems. Eur. J. For. Res. 2012, 131, 655–667. [Google Scholar] [CrossRef]
- Litton, C.; Raich, J.; Ryan, M. Carbon allocation in forest ecosystems. Glob. Chang. Biol. 2007, 13, 2089–2109. [Google Scholar] [CrossRef] [Green Version]
- Ren, H.; Chen, H.; Li, L.; Li, P.; Hou, C.; Wan, H.; Zhang, Q.; Zhang, P. Spatial and temporal patterns of carbon storage from 1992 to 2002 in forest ecosystems in Guangdong, Southern China. Plant Soil 2013, 363, 123–138. [Google Scholar] [CrossRef]
- Houghton, R.A. Balancing the global carbon budget. Annu. Rev. Earth Planet. Sci. 2007, 35, 313–347. [Google Scholar] [CrossRef]
- Ruiz-Peinado, R.; Bravo-Oviedo, A.; Lopez-Senespleda, E.; Montero, G.; Rio, M. Do thinnings influence biomass and soil carbon stocks in Mediterranean maritime pine woods. Eur. J. For. Res. 2013, 132, 253–262. [Google Scholar] [CrossRef]
- Pan, Y.D.; Birdsey, R.A.; Fang, J.Y.; Houghton, R.; Kauppi, P.E.; Kurz, W.A. A large and persistent carbon sink in the world’s forests. Science 2011, 333, 988–993. [Google Scholar] [CrossRef]
- He, N.; Wen, D.; Zhu, J.; Tang, X.; Yu, G. Vegetation carbon sequestration in Chinese forests from 2010 to 2050. Glob. Chang. Biol. 2016, 23, 1575–1584. [Google Scholar] [CrossRef]
- Dixon, R.K.; Brown, S.; Houghton, R.A.; Trexier, M.C.; Wisniewski, J. Carbon pools and flux of global forest ecosystems. Science 1994, 263, 185–190. [Google Scholar] [CrossRef]
- Zhang, Q.Z.; Wang, C.K. Carbon density and distribution of six Chinese temperate forests. Sci. China Life Sci. 2010, 53, 831–840. [Google Scholar] [CrossRef] [PubMed]
- Saatchi, S.S.; Harris, N.L.; Brown, S.; Lefsky, M.; Mitchard, E.T.A.; Salas, W. Benchmark map of forest carbon stocks in tropical regions across three continents. Proc. Natl. Acad. Sci. USA 2011, 108, 9899–9904. [Google Scholar] [CrossRef] [PubMed] [Green Version]
- Thurner, M.; Beer, C.; Santoro, M.; Carvalhais, N. Carbon stock and density of northern boreal and temperate forests. Glob. Ecol. Biogeogr. 2014, 23, 297–310. [Google Scholar] [CrossRef]
- Pan, P.; Sun, Y.J.; Ouyang, X.Z.; Rao, J.F.; Feng, R.Q.; Yang, Z.Y. Spatial variation of carbon density in Pinus massoniana forest in Jiangxi Province, China. Chin. J. Appl. Ecol. 2019, 30, 1885–1892. [Google Scholar]
- Wang, T.; Wang, G.; Innes, J.L.; Seely, B.; Chen, B. ClimateAP: An application for dynamic local downscaling of historical and future climate data in Asia Pacific. Front. Agric. Sci. Eng. 2017, 4, 448–458. [Google Scholar] [CrossRef]
- Somogyi, Z.; Cienciala, E.; Mäkipää, R.; Muukkonen, P.; Lehtonen, A.; Weiss, P. Indirect methods of large scale forest biomass estimation. Eur. J. For. Res. 2007, 126, 197–207. [Google Scholar] [CrossRef]
- Fang, J.Y.; Chen, A.P.; Peng, C.H.; Zhao, S.Q.; Ci, L.J. Changes in forest biomass carbon storage in China between 1949 and 1988. Science 2001, 291, 2320–2322. [Google Scholar] [CrossRef]
- Jones, D.A.; O’hara, K.L. Carbon density in managed coast redwood stands: Implications for forest carbon estimation. Forestry 2012, 85, 99–110. [Google Scholar] [CrossRef]
- State Forestry Administration. The Ministerial Standard of the People’s Republic of China (LY/T 2263-2014): Tree Biomass Models and Related Parameters to Carbon Accounting for Pinus massoniana; Standards Press of China: Beijing, China, 2014; pp. 2–5. [Google Scholar]
- State Forestry Administration. The Ministerial Standard of the People’s Republic of China (LY/T 2264-2014): Tree Biomass Models and Related Parameters to Carbon Accounting for Cunninghamia Lanceolata; Standards Press of China: Beijing, China, 2014; pp. 2–5. [Google Scholar]
- State Forestry Administration. The Ministerial Standard of the People’s Republic of China (LY/T 2660-2016): Tree Biomass Models and Related Parameters to Carbon Accounting for Schima Superba; Standards Press of China: Beijing, China, 2016; pp. 2–3. [Google Scholar]
- State Forestry Administration. The Ministerial Standard of the People’s Republic of China (LY/T 2658-2016): Tree Biomass Models and Related Parameters to Carbon Accounting for Quercus; Standards Press of China: Beijing, China, 2016; pp. 2–7. [Google Scholar]
- Lu, R.K. Methods of Soil and Agro-Chemical Analysis; China Agricultural Science and Technology Press: Beijing, China, 2000. [Google Scholar]
- Zhang, C.S.; Tang, Y.; Luo, L.; Xu, W.L. Outlier identification and visualization for Pb concentrations in urban soils and its implications for identification of potential contaminated land. Environ. Pollut. 2009, 157, 3083–3090. [Google Scholar] [CrossRef]
- Webster, R.; Oliver, M.A. Geostatistics for Environmental Scientists; John Wiley & Sons Ltd.: Chichester, UK, 2007. [Google Scholar]
- Goovaerts, P. Geostatistics for Natural Resources Evaluation; Oxford University Press: New York, NY, USA, 1997. [Google Scholar]
- Guan, F.; Xia, M.; Tang, X.; Fan, S. Spatial variability of soil nitrogen, phosphorus and potassium contents in Moso bamboo forests in Yong’an City, China. Catena 2017, 150, 161–172. [Google Scholar] [CrossRef]
- Fang, X.; Xue, Z.; Li, B.; An, S. Soil organic carbon distribution in relation to land use and its storage in a small watershed of the Loess Plateau, China. Catena 2012, 88, 6–13. [Google Scholar] [CrossRef]
- Zhou, Y.R.; Yu, Z.L.; Zhao, S.D. Carbon storage and budget of major Chinese forest types. Acta Phytoecologica Sinica 2000, 24, 518–522. [Google Scholar]
- Lan, X.; Du, H.; Song, T.Q.; Zeng, F.P.; Peng, W.X.; Liu, Y.X.; Fan, Z.L.; Zhang, J.Y. Vegetation carbon storage in the main forest types in Guangxi and the related influencing factors. Acta. Ecol. Sin. 2019, 39, 2043–2053. [Google Scholar]
- Zhao, M.; Zhou, G.S. Carbon storage of forest vegetation and its relationship with climatic factors. Sci. Geogr. Sin. 2004, 24, 50–54. [Google Scholar] [CrossRef]
- Fu, W.J.; Jiang, P.K.; Zhou, G.M.; Zhao, K.L. Using Moran’s I and GIS to study the spatial pattern of forest litter carbon density in a subtropical region of southeastern China. Biogeosciences 2014, 11, 2401–2409. [Google Scholar] [CrossRef]
- Xiao, X.; Wei, X.H.; Liu, Y.Q.; Ouyang, X.Z.; Li, Q.L.; Ning, J.K. Aerial seeding: An effective forest restoration method in highly degraded forest landscapes of sub-tropic regions. Forests 2015, 6, 1748–1762. [Google Scholar] [CrossRef]
- Zhan, X. Changes in soil fertility after interplanting pure Pinus massioniana plantations with broadleaved forest under the canopy during 20 years. J. Beijing For. Univ. 2018, 40, 55–62. [Google Scholar]
- Fan, H.B.; Li, Y.Y.; Su, B.Q.; Lin, D.X.; Liu, C.H.; Jiang, Z.K. Allocation pattern of biomass and productivity in the mixed uneven-aged stands of Masson’s pine and hardwood species. Acta Ecol. Sin. 2006, 26, 2463–2473. [Google Scholar]
- Lai, G.Z.; Cao, M.; Pan, P.; Ouyang, X.Z.; Guo, R.; Xiang, Y.X.; Wu, Z.R. Carbon density of vegetation of mixed plantation of Pinus massoniana and Schima superba in different proportions. J. Cent. South Univ. For. Tech. 2018, 38, 108–113. [Google Scholar]
- Fang, Y.T.; Mo, J.M.; Peng, S.L.; Li, D.J. Role of forest succession on carbon sequestration of forest ecosystems in lower subtropical China. Acta Ecol. Sin. 2003, 23, 1685–1694. [Google Scholar]
- Gong, C.; Wang, S.L.; Zeng, Z.Q.; Deng, S.J.; Chen, J.P.; Long, K.S. Carbon storage and its distribution pattern of evergreen broad-leaved forests at different succession stages in mid-subtropical China. Chin. J. Ecol. 2011, 30, 1935–1941. [Google Scholar]
- Fu, W.J.; Fu, Z.J.; Ge, H.L.; Ji, B.Y.; Jiang, P.K.; Li, Y.F.; Wu, J.S.; Zhao, K.L. Spatial variation of biomass carbon density in a subtropical region of southeastern China. Forests 2015, 6, 1966–1981. [Google Scholar] [CrossRef]
- Pan, P.; Zhao, F.; Ning, J.K.; Zhang, L.; Ouyang, X.Z.; Zang, H. Impact of understory vegetation on soil carbon and nitrogen dynamic in aerially seeded Pinus massoniana plantations. PLoS ONE 2018, 13, e0191952. [Google Scholar] [CrossRef] [PubMed]
- Dai, W.; Fu, W.J.; Jiang, P.K.; Zhao, K.L.; Li, Y.H.; Tao, J.X. Spatial pattern of carbon stocks in forest ecosystems of a typical subtropical region of southeastern China. Forest Ecol. Manag. 2018, 409, 288–297. [Google Scholar] [CrossRef]
- Zhang, X.Y.; Sui, Y.Y.; Zhang, X.D.; Meng, K.; Herbert, S.J. Spatial variability of nutrient properties in black soil of northeast China. Pedosphere 2007, 17, 19–29. [Google Scholar] [CrossRef]
- Cao, Y.; Chen, Y.M.; Jin, B.; Qu, M. Carbon storage and density of forest vegetation and its spatial distribution pattern in Shanxi province. J. Arid Land Resour. Environ. 2014, 28, 69–73. [Google Scholar]
- Zhang, F.; Du, Q.; Ge, H.L.; Liu, A.X.; Fu, W.J.; Ji, B.Y. Spatial distribution of forest carbon in Zhejiang Province with geostatistics based on CFI sample plots. Acta Ecol. Sin. 2012, 32, 5275–5286. [Google Scholar] [CrossRef]
- Rahman, M.M.; Khan, M.N.I.; Hoque, A.F.; Ahmed, I. Carbon stock in the Sundarbans mangrove forest: Spatial variations in vegetation types and salinity zones. Wetl. Ecol. Manag. 2015, 23, 269–283. [Google Scholar] [CrossRef]
- Swetnam, T.L.; Brooks, P.D.; Barnard, H.R.; Harpold, A.A.; Gallo, E.L. Topographically driven differences in energy and water constrain climatic control on forest carbon sequestration. Ecosphere 2017, 8, e01797. [Google Scholar] [CrossRef]
- Wen, D.; He, N. Forest carbon storage along the north-south transect of eastern China: Spatial patterns, allocation, and influencing factors. Ecol. Indic. 2016, 61, 960–967. [Google Scholar] [CrossRef]
- Zhang, M.; Huang, X.; Chuai, X.; Yang, H.; Lai, L.; Tan, J. Impact of land use type conversion on carbon storage in terrestrial ecosystems of China: A spatial-temporal perspective. Sci. Rep. 2015, 5, 10233. [Google Scholar] [CrossRef] [PubMed]
- Xu, Q.; Yang, R.; Dong, Y.X.; Liu, Y.X.; Qiu, L.R. The influence of rapid urbanization and land use changes on terrestrial carbon sources/sinks in Guangzhou, China. Ecol. Indic. 2016, 70, 304–316. [Google Scholar] [CrossRef]
- Ford, S.E.; Keeton, W.S. Enhanced carbon storage through management for old-growth characteristic in northern hardwood-conifer forests. Ecosphere 2017, 8, e01721. [Google Scholar] [CrossRef]
- Chen, L.C.; Guan, X.; Li, H.M.; Wang, Q.K.; Zhang, W.D.; Yang, Q.P.; Wang, S.L. Spatiotemporal patterns of carbon storage in forest ecosystems in Hunan Province, China. For. Ecol. Manag. 2019, 432, 656–666. [Google Scholar] [CrossRef]
- Lal, R. Carbon sequestration. Philos. Trans. R. Soc. B Biol. Sci. 2008, 363, 815–830. [Google Scholar] [CrossRef] [PubMed]
- Yang, R.M.; Zhang, G.L.; Yang, F.; Zhi, J.J.; Yang, F.; Liu, F.; Zhao, Y.G.; Li, D.C. Precise estimation of soil organic carbon stocks in the northeast Tibetan plateau. Sci. Rep. 2016, 6, 21842. [Google Scholar] [CrossRef] [PubMed]
Figure 1.
Location of the study area (Jiangxi Province, China) and Pinus massoniana sample plots.

Figure 2.
Histograms of raw and Box-cox transformed vegetation carbon density (including tree, understory vegetation and litter layers) in Pinus massoniana forest. (a) and (b) represent raw and Box-cox transformed vegetation carbon density, respectively.
Figure 2.
Histograms of raw and Box-cox transformed vegetation carbon density (including tree, understory vegetation and litter layers) in Pinus massoniana forest. (a) and (b) represent raw and Box-cox transformed vegetation carbon density, respectively.

Figure 3.
Vegetation carbon density (including tree, understory vegetation and litter layers) of natural and planted Pinus massoniana forests in the Jiangxi Province.
Figure 3.
Vegetation carbon density (including tree, understory vegetation and litter layers) of natural and planted Pinus massoniana forests in the Jiangxi Province.
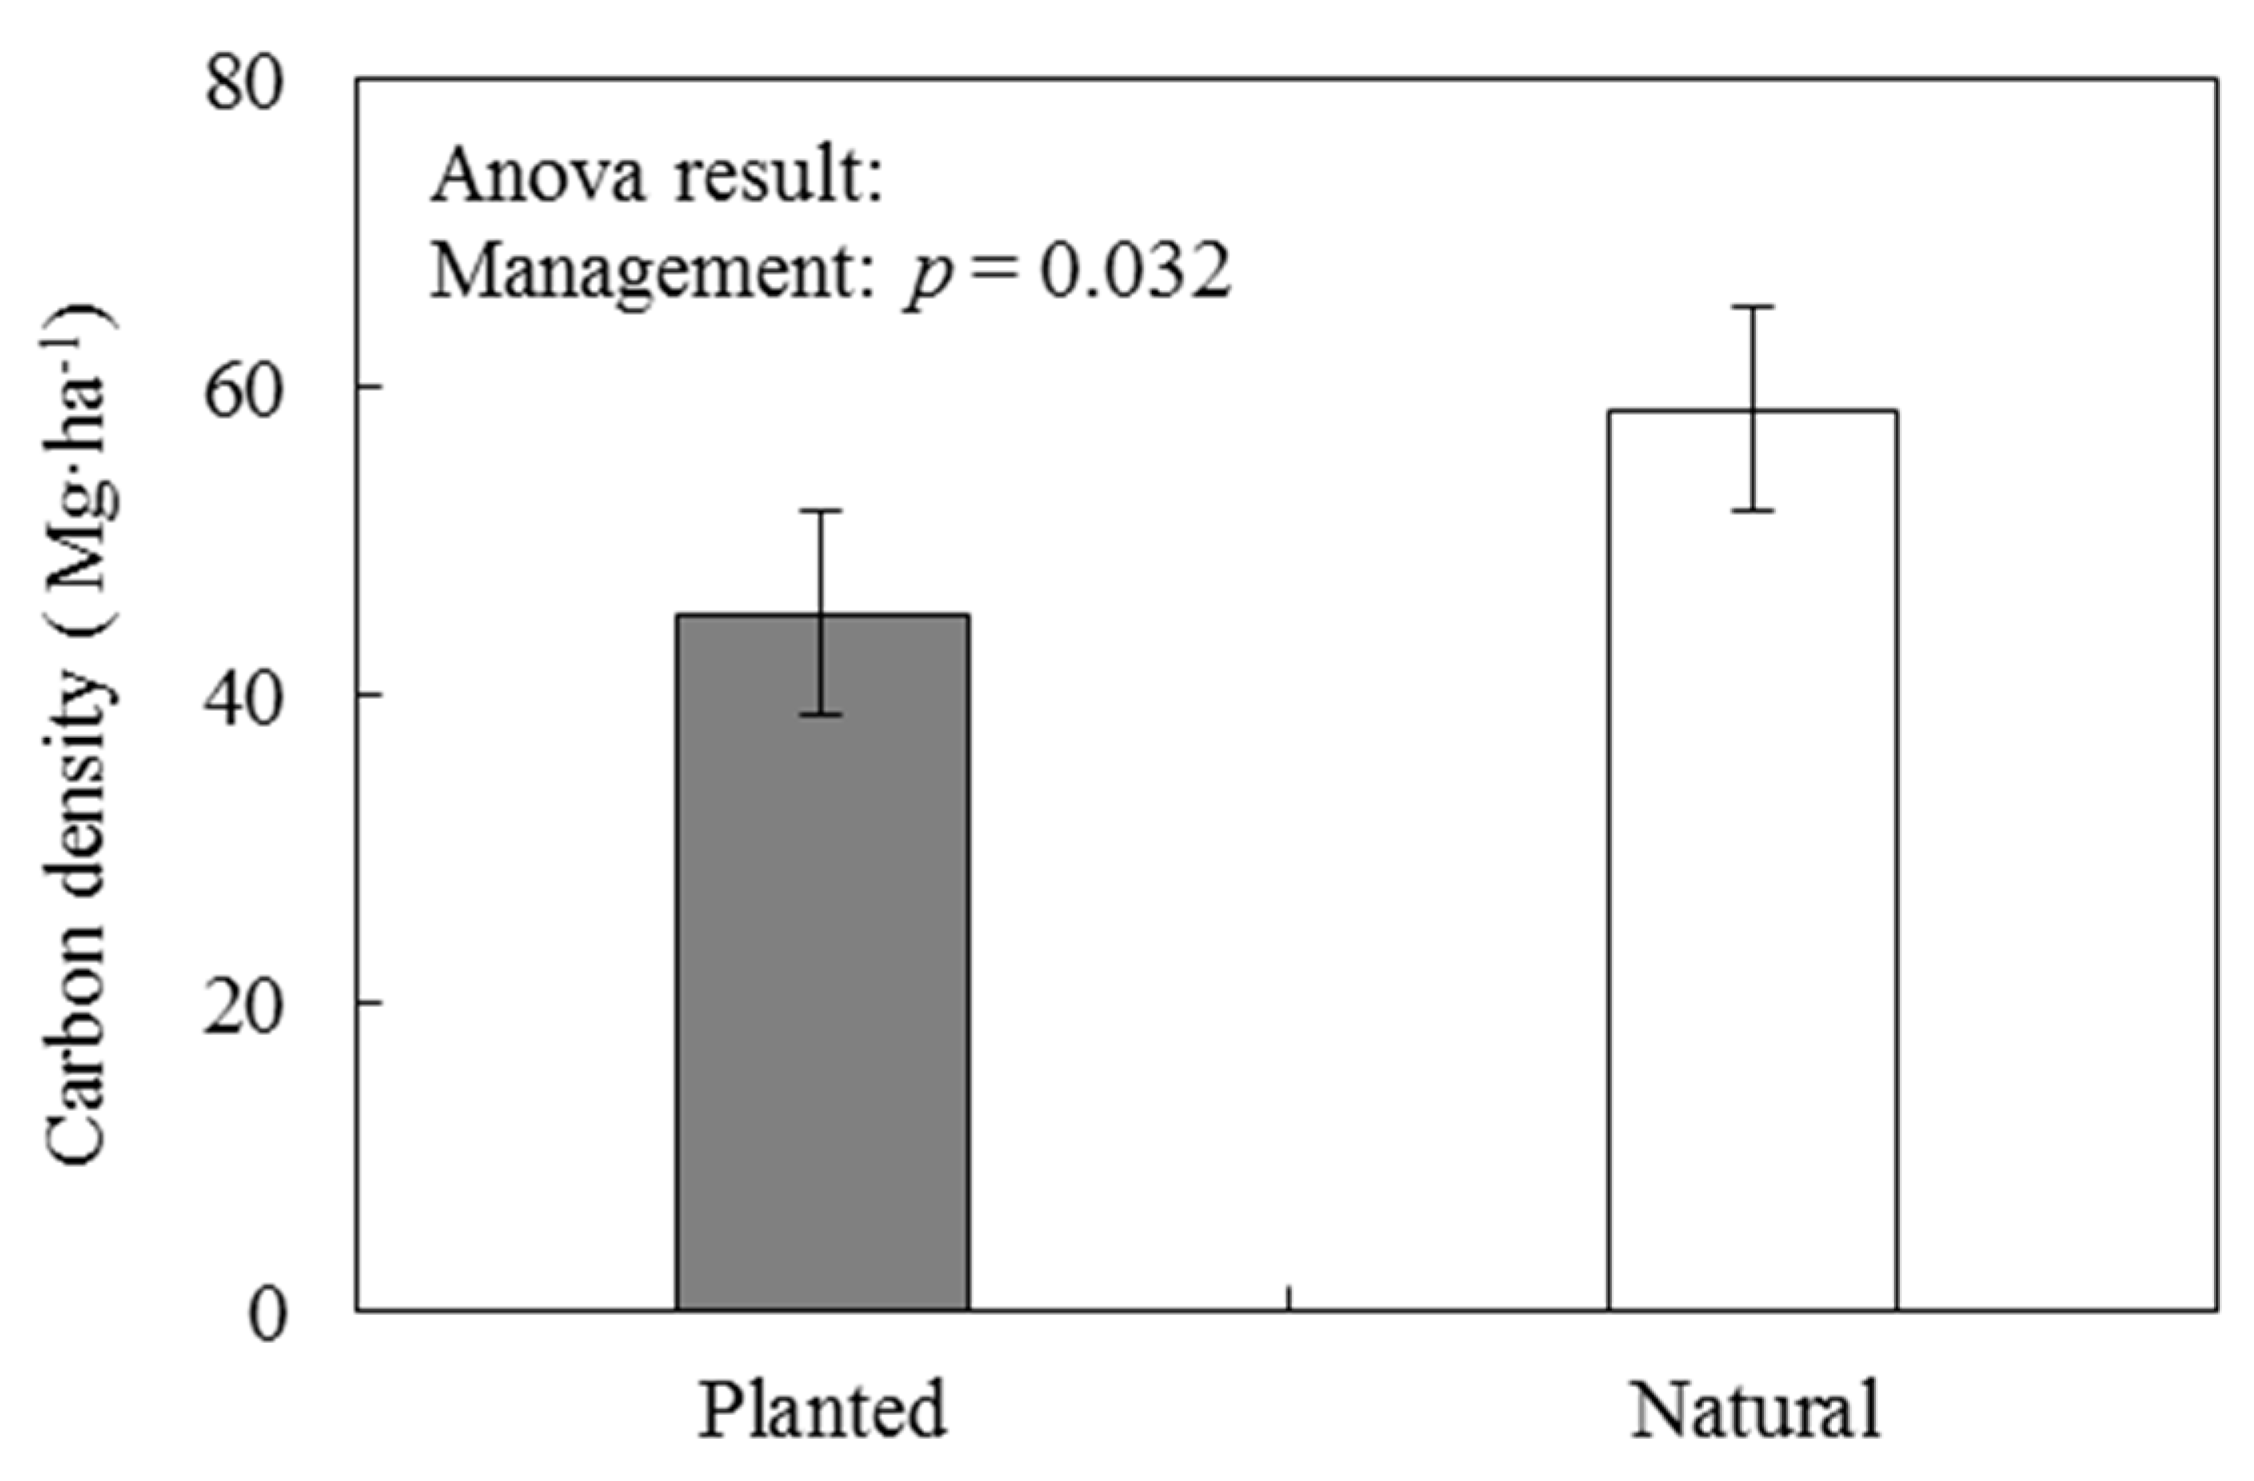
Figure 4.
Vegetation carbon density (including tree, understory vegetation and litter layers) of various successional forests in the study subtropical region. Mixed I denotes mixed forests that are Pinus massoniana-dominant, while Mixed II denotes mixed forests that are broadleaf-dominant [37,38].

Figure 5.
Map of spatial clusters and spatial outliers in vegetation carbon density (including tree, understory vegetation and litter layers) in Pinus massoniana forest in the Jiangxi Province.
Figure 5.
Map of spatial clusters and spatial outliers in vegetation carbon density (including tree, understory vegetation and litter layers) in Pinus massoniana forest in the Jiangxi Province.
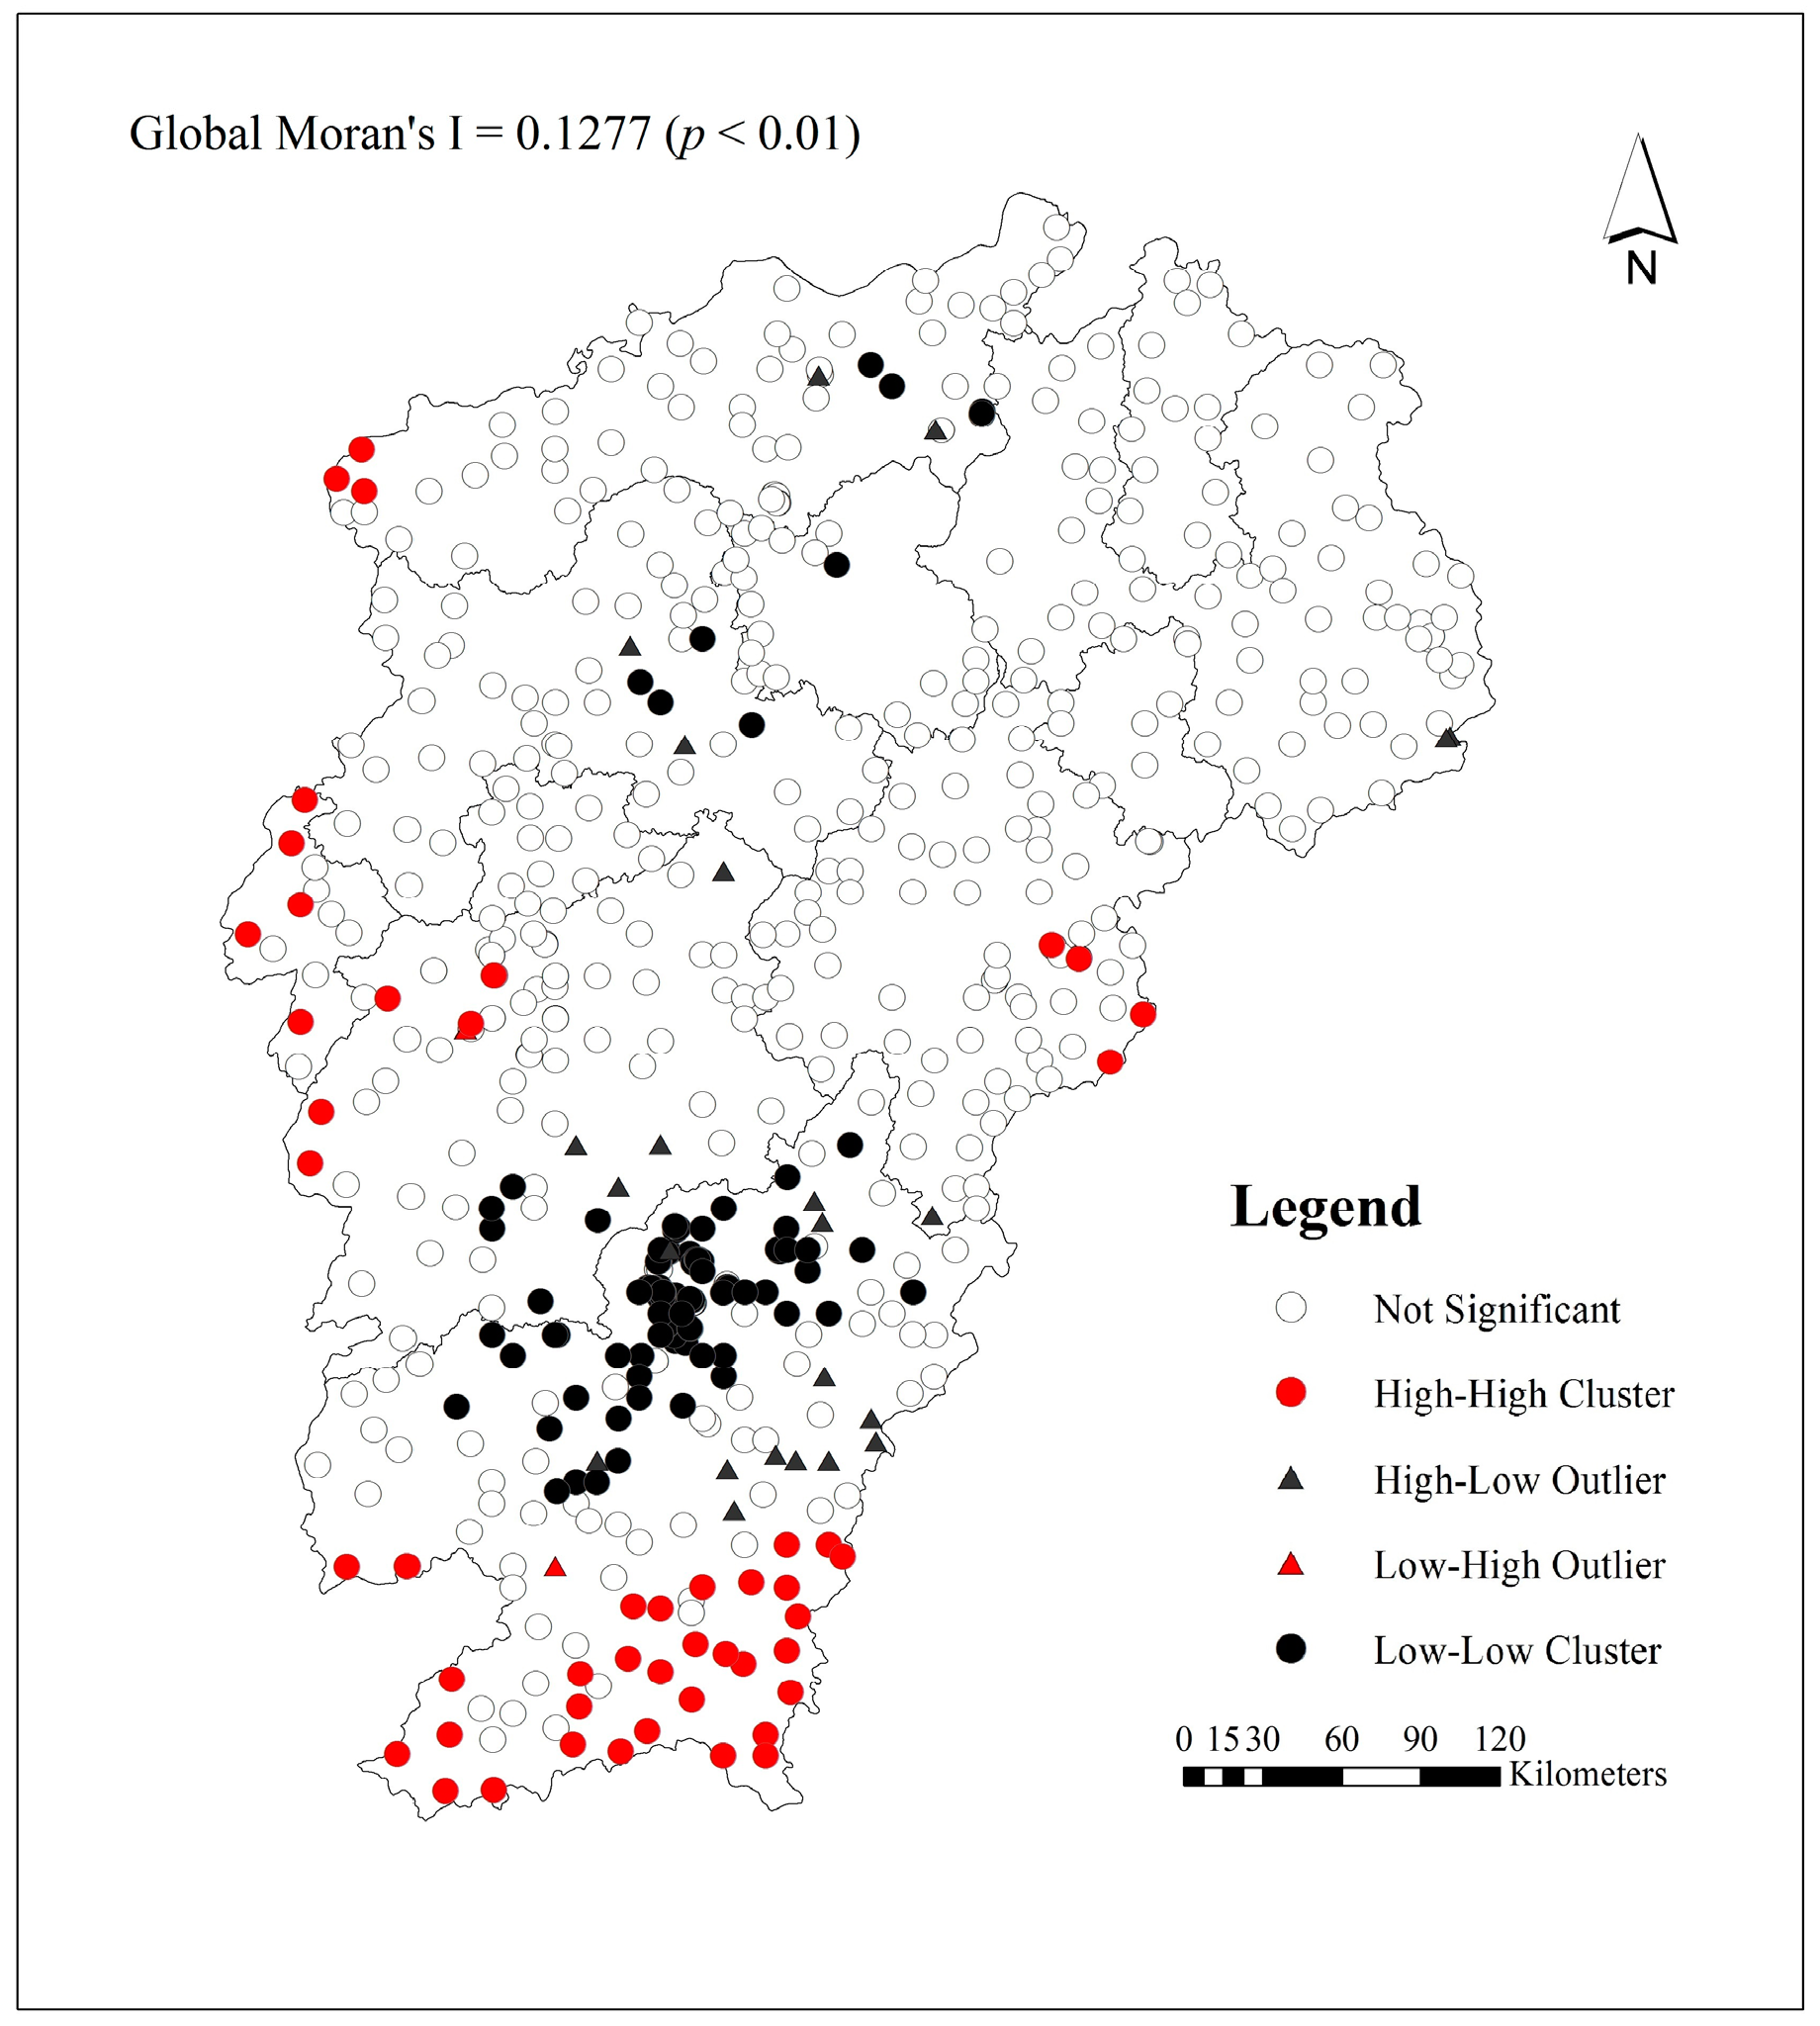
Figure 6.
Semivariograms of vegetation carbon density (including tree, understory vegetation and litter layers) in Pinus massoniana forest in the Jiangxi Province. (a), (b), (c), and (d) represent linear model, spherical model, exponential model and Gaussian model, respectively.
Figure 6.
Semivariograms of vegetation carbon density (including tree, understory vegetation and litter layers) in Pinus massoniana forest in the Jiangxi Province. (a), (b), (c), and (d) represent linear model, spherical model, exponential model and Gaussian model, respectively.
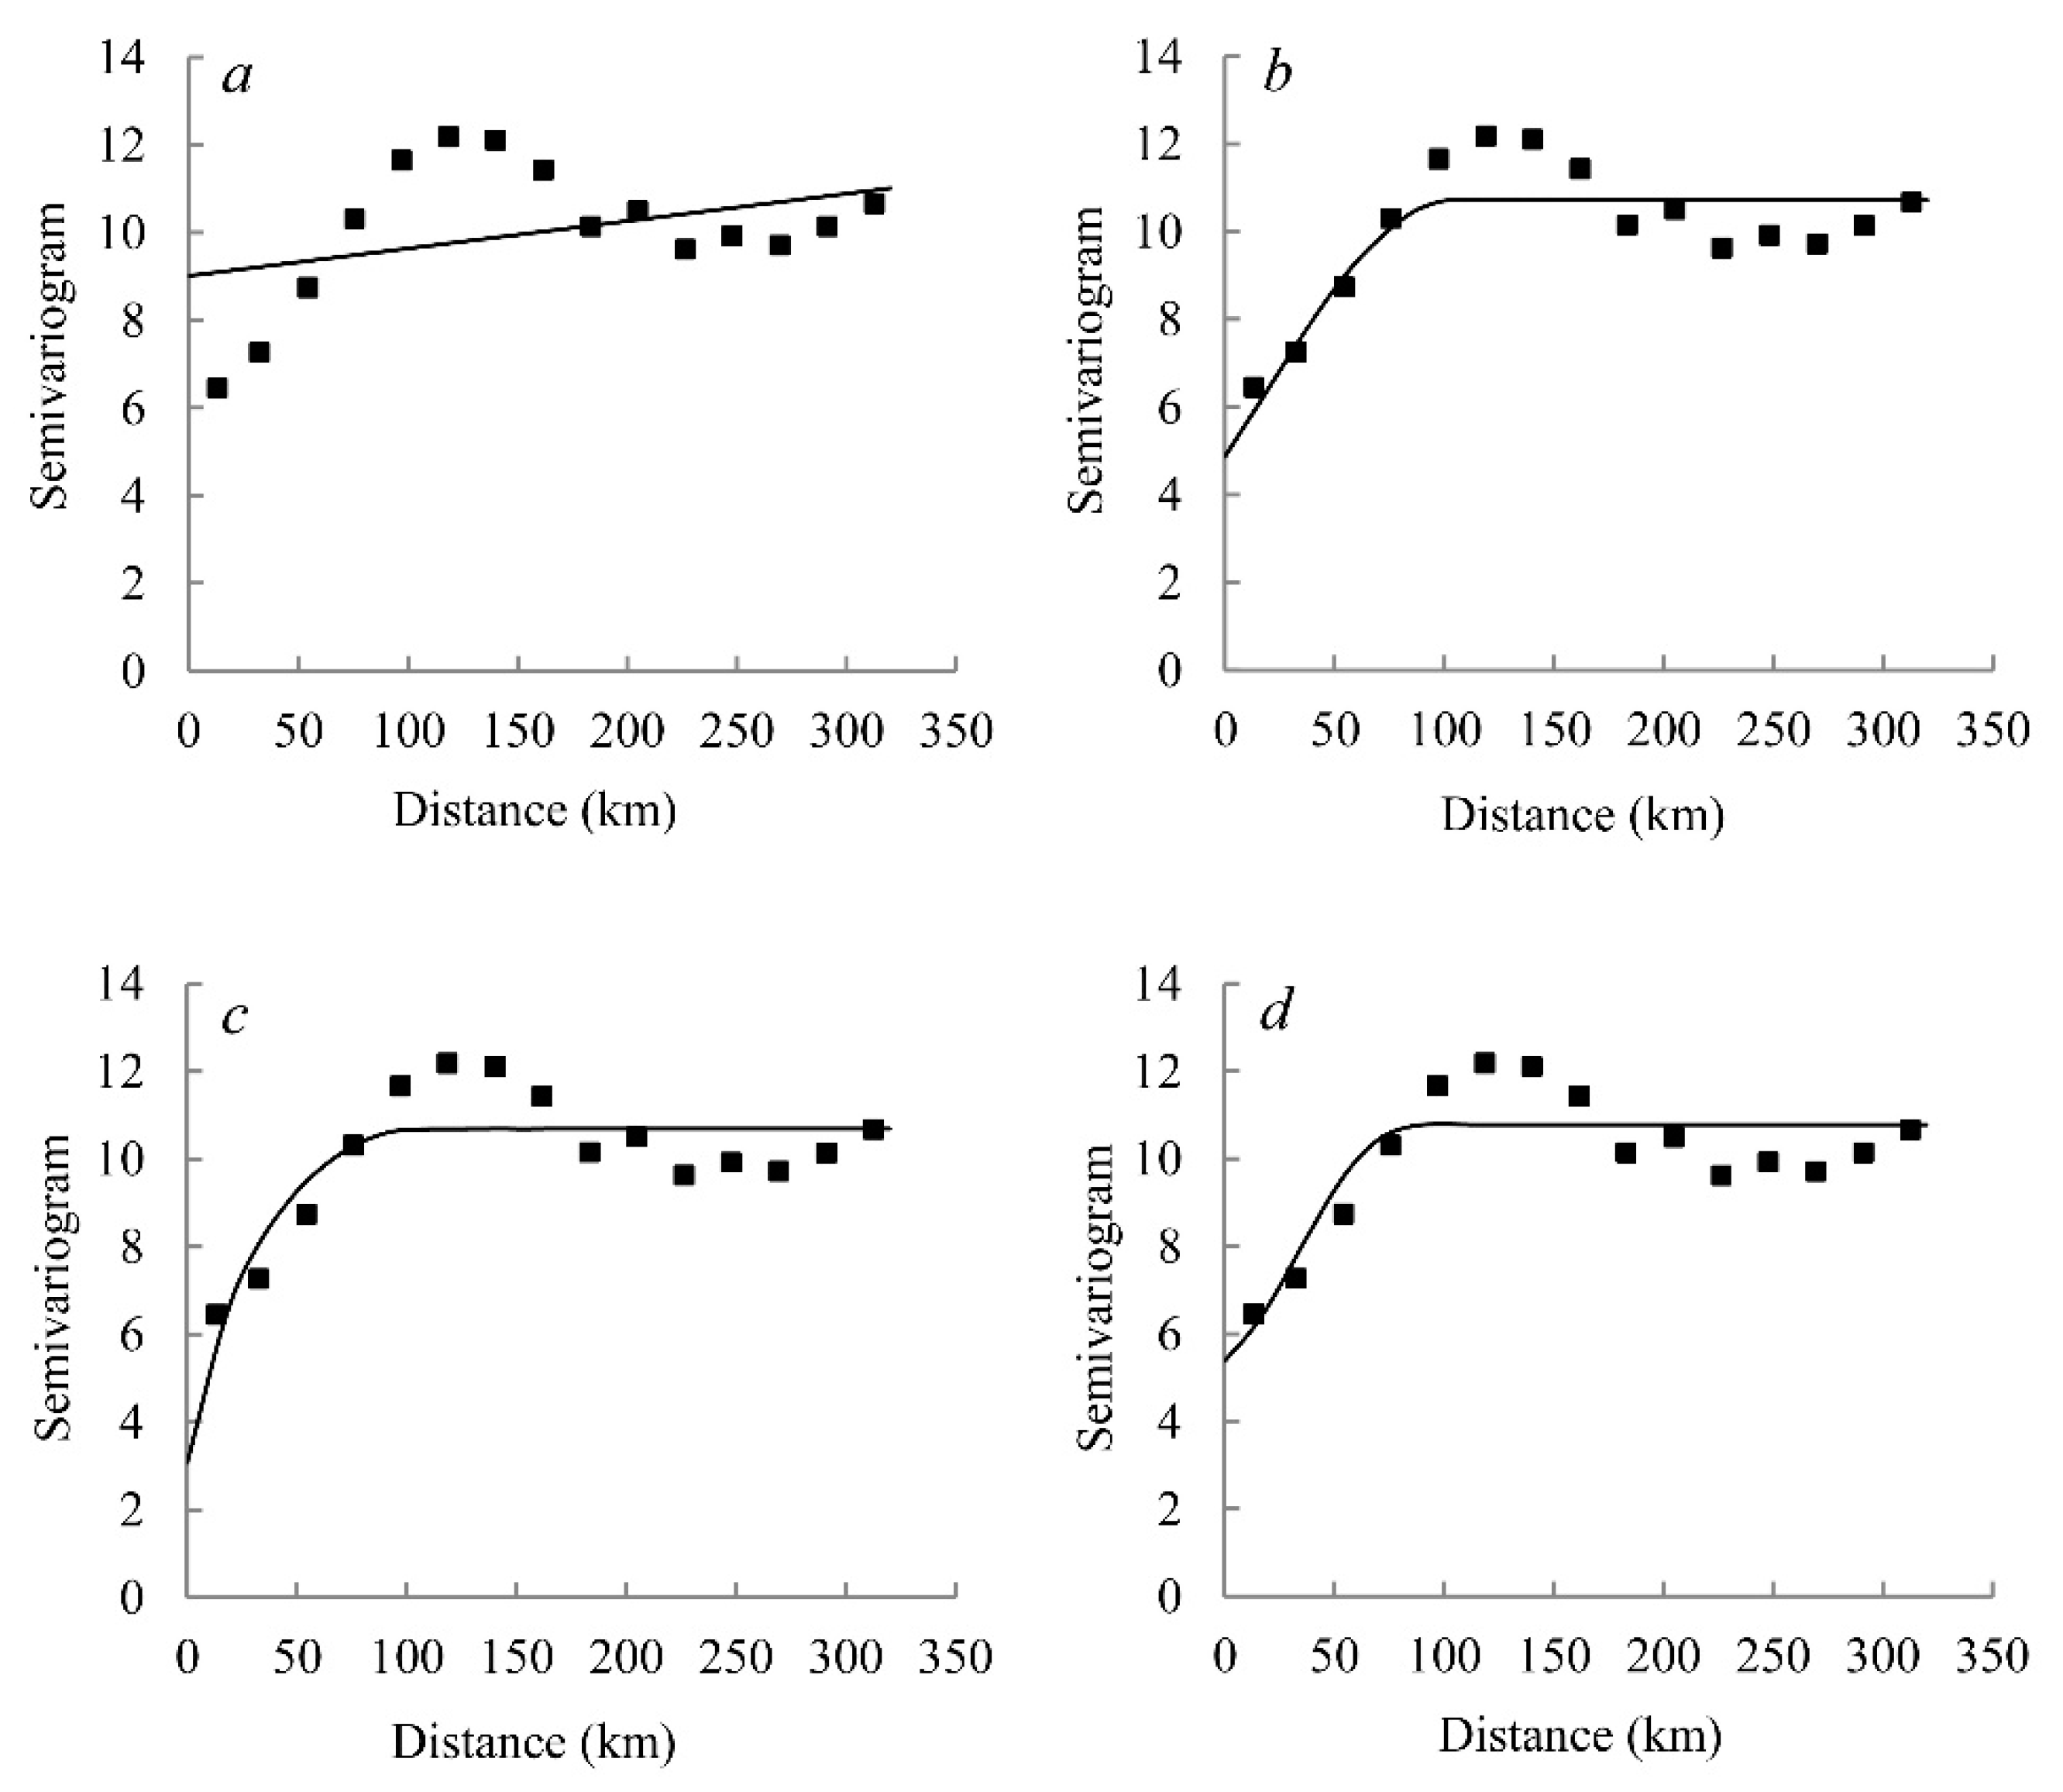
Figure 7.
Spatial interpolation graph of vegetation carbon density (including tree, understory vegetation and litter layers) in Pinus massoniana forest in the Jiangxi Province.
Figure 7.
Spatial interpolation graph of vegetation carbon density (including tree, understory vegetation and litter layers) in Pinus massoniana forest in the Jiangxi Province.


Table 1.
Description of Pinus massoniana sample plots.
| Factors | Mean | Standard Deviation |
|---|---|---|
| Elevation (m) | 209 | 186.56 |
| Slope (°) | 20 | 10.53 |
| Soil depth (cm) | 76 | 27.62 |
| Stand age (a) | 24 | 10.60 |
| Stand density (N·ha−1) | 1567 | 905.14 |
| Understory vegetation coverage (%) | 68 | 10.02 |
| Mean annual temperature (°C) | 18.5 | 1.09 |
| Mean annual precipitation (mm) | 1645 | 174.66 |
N, number of trees.
Table 2.
Carbon density of tree (including stem, branch, foliage and root), understory vegetation and litter layers in Pinus massoniana forest (Mg·ha−1).
Table 2.
Carbon density of tree (including stem, branch, foliage and root), understory vegetation and litter layers in Pinus massoniana forest (Mg·ha−1).
| Variables | Mean | Standard Deviation | |
|---|---|---|---|
| Tree layer | Stem | 24.37 | 16.78 |
| Branch | 8.94 | 4.06 | |
| Foliage | 5.76 | 3.47 | |
| Root | 6.61 | 4.73 | |
| Total | 45.68 | 31.98 | |
| Understory vegetation layer | 4.53 | 2.44 | |
| Litter layer | 1.81 | 0.92 | |
Table 3.
Descriptive statistics of vegetation carbon density (including tree, understory vegetation and litter layers) in Pinus massoniana forest (Mg·ha−1).
Table 3.
Descriptive statistics of vegetation carbon density (including tree, understory vegetation and litter layers) in Pinus massoniana forest (Mg·ha−1).
| Item | Mean | SD | CV (%) | Skew | Kurt | K–Sp |
|---|---|---|---|---|---|---|
| Carbon density | 52.02 | 34.51 | 66.34 | 1.53 (0.39) | 4.34 (0.69) | 0.000 (0.054) |
SD, standard deviation; CV, coefficient of variation; Skew, skewness; Kurt, kurtosis; K–Sp, significance level of Kolmogorov–Smirnov test for normality. Skew, Kurt and K–Sp values in brackets were calculated after Box-Cox transformation.
Table 4.
Spearman correlation coefficients between environmental factors and vegetation carbon density (including tree, understory vegetation and litter layers) in Pinus massoniana forest (n = 611).
Table 4.
Spearman correlation coefficients between environmental factors and vegetation carbon density (including tree, understory vegetation and litter layers) in Pinus massoniana forest (n = 611).
| Factors | Elevation | Slope | Slope Position | Soil Aspect | Stand Age | Stand Density | Understory Vegetation Coverage | Mean Annual Temperature | Mean Annual Precipitation |
|---|---|---|---|---|---|---|---|---|---|
| Carbon density | 0.261 ** | −0.115 ** | 0.095 * | 0.086 * | 0.302 ** | 0.145 ** | 0.140 ** | −0.106 ** | 0.270 ** |
| Elevation | −0.358 ** | 0.207 ** | 0.166 ** | 0.067 | 0.007 | 0.090 * | 0.199 ** | 0.119 ** | |
| Slope | −0.113 ** | −0.058 | −0.031 | −0.008 | −0.128 ** | −0.032 | −0.079 * | ||
| Slope position | 0.029 | 0.049 | 0.093 * | 0.042 | −0.014 | 0.028 | |||
| Soil aspect | −0.008 | 0.085 * | 0.017 | −0.065 | 0.052 | ||||
| Stand age | −0.039 | 0.063 | 0.008 | 0.084 * | |||||
| Stand density | 0.038 | −0.040 | 0.051 | ||||||
| Understory Vegetation Coverage | −0.123 ** | 0.183 ** | |||||||
| Mean annual Temperature | −0.404 ** |
* Correlation is significant at the 0.05 level. ** Correlation is significant at the 0.01 level.
Table 5.
Parameters of semivariogram models for vegetation carbon density (including tree, understory vegetation and litter layers) in Pinus massoniana forest in the Jiangxi Province.
Table 5.
Parameters of semivariogram models for vegetation carbon density (including tree, understory vegetation and litter layers) in Pinus massoniana forest in the Jiangxi Province.
| Model Type | Nugget | Sill | Range/(km) | Nugget/Sill | RSS | R2 |
|---|---|---|---|---|---|---|
| Linear model | 9.02 | 11.01 | 313.05 | 0.82 | 31.4 | 0.143 |
| Spherical model | 4.87 | 10.72 | 103.60 | 0.45 | 9.5 | 0.742 |
| Exponential model | 3.08 | 10.69 | 29.80 | 0.29 | 12.0 | 0.672 |
| Gaussian model | 5.38 | 10.77 | 49.50 | 0.50 | 9.9 | 0.736 |
RSS, residual; R2, coefficient value.
© 2019 by the authors. Licensee MDPI, Basel, Switzerland. This article is an open access article distributed under the terms and conditions of the Creative Commons Attribution (CC BY) license (http://creativecommons.org/licenses/by/4.0/).
Share and Cite
MDPI and ACS Style
Pan, P.; Sun, Y.; Ouyang, X.; Zang, H.; Rao, J.; Ning, J. Factors Affecting Spatial Variation in Vegetation Carbon Density in Pinus massoniana Lamb. Forest in Subtropical China. Forests 2019, 10, 880. https://doi.org/10.3390/f10100880
AMA Style
Pan P, Sun Y, Ouyang X, Zang H, Rao J, Ning J. Factors Affecting Spatial Variation in Vegetation Carbon Density in Pinus massoniana Lamb. Forest in Subtropical China. Forests. 2019; 10(10):880. https://doi.org/10.3390/f10100880
Chicago/Turabian StylePan, Ping, Yujun Sun, Xunzhi Ouyang, Hao Zang, Jinfeng Rao, and Jinkui Ning. 2019. "Factors Affecting Spatial Variation in Vegetation Carbon Density in Pinus massoniana Lamb. Forest in Subtropical China" Forests 10, no. 10: 880. https://doi.org/10.3390/f10100880
Note that from the first issue of 2016, this journal uses article numbers instead of page numbers. See further details here.