The Composition and Height of Saplings Capturing Silvicultural Gaps at Two Long-Term Experiments in Managed Northern Hardwood Forests


1
School of Forest Resources and Environmental Science, Michigan Technological University, 1400 Townsend Drive, Houghton, MI 49931, USA
2
USDA Forest Service, Northern Research Station, 5985 Highway K, Rhinelander, WI 54501, USA
*
Author to whom correspondence should be addressed.
Forests 2019, 10(10), 855; https://doi.org/10.3390/f10100855
Submission received: 25 August 2019
/
Revised: 18 September 2019
/
Accepted: 27 September 2019
/
Published: 1 October 2019
(This article belongs to the Special Issue Role of Gap Factors in Forest Tree Regeneration and Plant Communities)
Abstract
:Managing forests for mixtures of canopy species promotes future resilience and mitigates risks of catastrophic resource loss. This study describes the compositions, heights, and locations within openings of gap-capturing saplings in two long-term group-selection experiments in managed northern hardwoods. We expected opening size to affect the composition of gap-capturing saplings and that composition would match advance regeneration where relatively large stems remained following harvest. We also expected sapling height to respond positively to opening size, but plateau in gap areas above 200 m2, and legacy-tree retention to negatively affect sapling height. In two group-selection experiments, we found that the composition of gap-capturing saplings was not affected by opening size at 15 and 23 years post-harvest, respectively, and that composition matched advance regeneration only when larger stems (>2.5 cm breast height, dbh) were removed during harvest. Gap-capturing sapling composition did not match the surrounding canopy in either study site. Sapling height was positively correlated with gap area, but, as we expected, plateaued in larger openings. In openings without legacy-retention, gap area did not significantly predict sapling height in openings larger than 100–200 m2, whereas this threshold was between 300–400 m2 in openings with single legacy-tree retention. Sapling height was negatively associated with distance into openings when legacy-trees were present. Group selection appears to recruit modestly higher proportions of shade-midtolerant and intolerant species to the canopy compared to adjacent unmanaged second-growth or managed, uneven-aged northern hardwoods.
1. Introduction
As stresses on forested ecosystems increase due to climate change and increased human use, managing forests for future resilience becomes increasingly important for maintaining biodiversity, ecosystem services, and reducing risks of financial loss [1,2,3]. Managing for mixtures of canopy species reduces the risk of catastrophic resource loss by creating redundancy and reducing over-reliance on any one species [2]. Mixed forest canopies slow the spread of disease by limiting vectored routes between individual conspecific trees [4]. They also possess varieties of functional traits necessary to respond resiliently to natural and human disturbances [5] and can benefit other taxa, such as animals [6] and fungi [7]. In eastern North America, the predominant contemporary forms of silviculture and fire suppression have decreased canopy diversity over time [8,9]. This is especially true in hardwoods, where extractive harvests in the late-1800s and early-1900s created largely homogeneous cohorts of second-growth forests [10]. Management of these forests has focused on a few high-value species, resulting in reduced species richness over time [11].
The uneven-aged management of temperate hardwoods in eastern North America was initially developed as an alternative to clearcutting, but has sometimes been used to justify selective harvesting (i.e., high-grading) [12]. Early results from experimental forests shifted the uneven-aged silvicultural paradigm towards emulating naturally-occurring stand structures [12]. In the upper Great Lakes region, single-tree selection (STS) methods developed by Eyre and Zillgitt [13] and Arbogast [14] became the predominant guidelines followed by forest managers and are still widely applied [15]. STS roughly emulates common natural disturbances in temperate hardwoods—namely, single-tree blowdowns and/or natural senescence—to create canopy openings <400 m2, promote natural regeneration and recruitment, and maintain diverse vertical structures [16]. However, STS is known to favor shade-tolerant tree regeneration by maintaining partial canopy coverage [17] and tends to homogenize forest composition over time [9]. Furthermore, a large portion of present-day STS management does not closely follow Arbogast [14] or other guidelines, and therefore, may delay future harvest cycles in addition to homogenizing canopy composition [15,18]. Group selection may be an option for increasing canopy heterogeneity by recruiting shade-midtolerant and -intolerant species and promoting vigorous regeneration of desired hardwood species in uneven-aged systems [19].
Group selection was designed to approximate infrequent, intermediate-scale natural disturbances, such as thunderstorm downbursts. By creating canopy openings ranging 400–2000 m2, group selection promotes natural regeneration of light-demanding species and increases horizontal heterogeneity in managed stands [16]. Many studies of group selection in eastern North American hardwoods exist, and generally, natural tree regeneration in openings is more diverse than in other forms of uneven-aged management [20,21,22]. Regeneration diversity also generally increases with opening size [23,24], but various studies have documented factors limiting regeneration diversity resulting from group selection, such as herbivory, competing vegetation, microsite factors, and propagule availability [25].
However, a complete understanding of regeneration dynamics should include the entire process from seed dispersal to canopy recruitment [26], and relatively few studies of group selection have documented the composition of trees successfully recruiting to the overstory [21,27,28]. Of those that assess canopy recruitment and composition in group-selection openings, their results do not clearly indicate if group selection is an effective technique for increasing overstory richness. For example, Leak [21] found that canopy composition in large 2000 m2 openings in second-growth stands changed from shade-tolerant red maple–American beech (Acer rubrum L.–Fagus grandifolia Ehrh.) dominated to over 1/3 midtolerant and intolerant birches (Betula spp.) after the removal of all advance regeneration. In contrast, Bolton and D’Amato [27] found that in second-growth stands with canopies dominated by shade-tolerant sugar maple (Acer sachharum Marsh.), smaller group-selection openings ranging from 100–700 m2 with intact advance regeneration recruited predominately sugar maple saplings to the overstory. Webster and Lorimer [28] found that in managed hemlock-hardwood forests, midtolerant yellow birch (Betula alleghaniensis Britt.) and sugar maple recruited to the canopy with equal likelihood in openings (100–1000 m2), despite that advance regeneration remained largely intact following harvests. Individual site factors and histories may also be important in determining regeneration patterns with group selection [29]. However, the lack of consensus and small number of available studies highlight the need for more empirical results to improve understanding of the underlying factors driving canopy recruitment in harvested openings.
Canopy recruitment depends on many factors, such as locally available seed sources [30], surrounding canopy height [31], and the management history of a site [32], but arguably opening size and the presence/absence of advance regeneration are most important to recruitment in group-selection openings [27,28,33]. Generally, in northern hardwoods, canopy gaps smaller than about 5 m radius (78 m2) will not allow even fast-growing (often shade-tolerant) saplings to reach crown shoulder height before lateral canopy closure [31]. Midtolerant species, such as yellow birch, require slightly larger gaps (>100 m2) to successfully recruit to the canopy, although success improves with larger opening sizes [28]. Klingsporn et al. [34] suggested that group-selection openings with legacy retention must be >400 m2 to recruit yellow birch before lateral crown closure overtops saplings. Regeneration richness (seedlings and saplings) is known to increase with canopy opening size [23], but changes to canopy composition over a range of opening sizes have not yet been documented.
Advance regeneration, when present, often maintains initial height advantages over gap colonists germinating after gap creation [28,35], but species rely on advance regeneration differently and have different probabilities of recruitment success. Common examples in eastern North America include sugar maple, eastern hemlock (Tsuga Canadensis (L.) Carr.), yellow birch, and black cherry (Prunus serotina Ehrh.). Shade-tolerant sugar maples can persist through decades of suppression but are equally likely to capture canopy openings from seed as from advance regeneration [33,36], whereas shade-tolerant eastern hemlock cannot respond as quickly to openings and often require multiple gap formation events to capture canopy positions [28,37]. Midtolerant yellow birch occasionally capture openings from advance regeneration [28,38] but cannot persist through long periods of suppression and mostly colonize openings after gap creation [33]. Intolerant black cherry are often bird-dispersed and have evolved to grow rapidly in open conditions, quickly overtopping competition [39]. Interactions between advance regeneration and gap colonists through canopy recruitment are not well-documented in replicated studies or across ranges of advance regeneration size or opening size.
Position within openings is one additional factor affecting the likelihood of canopy recruitment for saplings [40]. Saplings located away from the crowns of bordering trees have greater likelihoods of ascending to the canopy [31] and often grow faster than when near gap edges [41]. Likewise, shade-intolerant species generally respond better when further away from edges of canopy gaps [42]. Some studies have reported a north–south light gradient in temperate latitudes, with northern sides of canopy openings receiving more light than southern sides [43], but growth advantages have not always been observed in northern portions of group-selection openings in the Great Lakes region [44].
In this study, we examined the likely future canopy in two sets of experimental group-selection openings in northern hardwood forests of the upper Great Lakes region with the goal of assessing the efficacy of group selection in augmenting canopy composition in uneven-aged management systems. We also assessed patterns of sapling height and composition across openings to look for lasting legacies of harvest methods on canopy development. We hypothesized that gap-capturing saplings, like the overall regeneration layers, would contain higher proportions of shade-intolerant species in larger openings and would differ compositionally from canopies prior to harvest. We also expected similar gap-capturing sapling and advance regeneration compositions where relatively large advance regeneration remained onsite post-harvest, but different compositions where large advance regeneration were removed. Webster and Lorimer [28] found that opening size did not affect sapling height beyond 200 m2 in comparable forests, so we expected similar patterns for gap-capturing sapling height in openings without legacy-tree retention. However, we expected to find a larger threshold in openings with legacy-tree retention and for legacy-trees (located in the centers of openings) to suppress sapling growth near their crowns regardless of opening size. We hypothesized that sapling shade-tolerance classes would partition openings based upon light availability, and we expected to find more intolerant saplings in the northern halves of canopy openings where light availability was greater. We also expected taller saplings in the northern halves of openings than in southern halves. Lastly, we hypothesized that where large advance regeneration was left onsite, shade-tolerant species would be tallest, while intolerant species would be tallest where larger advance regenerations were removed during or following harvest.
2. Methods
The current study examined two long-term experiments on the effects of group-selection openings on forest regeneration in northern hardwoods of the upper Great Lakes region, USA. The experimental designs of both sites included ranges of opening sizes, and one experiment included a single, retained legacy-tree in each opening. The dynamics of gap-capturing saplings within openings were assessed at 15 and 23 years post-harvest, respectively. Details of each experiment follow.
2.1. Study Areas
2.1.1. Divide Canopy Gap Study
The Divide Canopy Gap Study (DCGS) was established in 1994 within the Chequamegon-Nicolet National Forest in Forest County, Wisconsin, USA (N 45°56′, W 88°59′) in a 136 ha stand of second-growth northern hardwoods. The primary soil type is Padus sandy loam (coarse-loamy, mixed, superactive, frigid Alfic Haplorthods), a deep and well-drained spodosol typical of glacial outwash plains and moraines, with occasional inclusions of both Pence and Tipler series [45]. The landscape is characterized by kame and kettle topography, and occasional pits and mounds are present from past single-tree blowdowns. The primary habitat type is Acer-Tsuga/Dryopteris (ATD), with sugar maple strongly dominating the canopy and sparsely present understory vegetation and shrubs [46]. Mean summer and winter temperatures are 18.8 °C and −8.7 °C, respectively, and mean annual precipitation is 75.3 cm [47]. White pine (Pinus strobus L.) likely comprised 5–10% of canopies near the DCGS in pre-settlement times and were exploitatively harvested during the 1870s–1890s [48]. In the 1930s, stands at the DCGS were commercially clearcut for hardwoods, and thereafter remained unmanaged until the study was initiated in 1994, when stands were estimated to be 60 year-old second-growth in the stem exclusion stage of development [49].
The DCGS has a randomized, complete-block design. Prior to the initial harvest, the study site was surveyed and delineated into seven areas, four of which were randomly selected as experimental blocks. Experimental blocks were divided into 0.4 ha square sections to which treatments were randomly assigned. Treatments were circular canopy openings in six size classes based on radius—0 m (reference), 3 m, 5 m, 10 m, 15 m, and 23 m—with three replicates per block. The treatments were created through the commercial timber harvesting of trees >11.4 cm diameter at breast height (dbh, 1.4 m) in the winters of 1994 and 1995. In addition, all stems over 2.5 cm dbh were cut with brush saws inside the prescribed radii. As a result, there were 56 total experimental canopy gaps (plus 4 canopy gaps that were marked but not harvested) and 12 unharvested reference sites. At the same time as gap treatment creation (winter of 1994–1995), the remainder of the study site was thinned (except in the reference sites where no harvesting occurred). The thinning followed the guidelines of Erdmann [50] for converting even-aged to uneven-aged stands through stocking reduction to a mean residual basal area of 23 m2 ha−1.
2.1.2. Yellow Birch Legacy-Tree Project
The Yellow Birch Legacy-tree Project (YBLP) was established in 2003 at Michigan Technological University’s Ford Center and Forest in Baraga County, Michigan, USA (N 46°37′, W 88°29′) on 235 ha of mature northern hardwoods. Soils at the YBLP are comprised primarily of Champion cobbly silt loam (coarse-loamy, mixed, superactive, frigid Oxyaquic Fragiorthods), which includes a shallow fragipan starting around 45–60 cm depth. Other soils present include Kallio cobbly silt—similar to Champion series but with a shallower fragipan—and Witbeck muck (coarse-loamy, mixed, semiactive, nonacid, frigid Histic Humaquepts) [45]. The site is characterized by rolling upland moraines with frequent pits and mounds from past single-tree blowdown events. The primary habitat type is also ATD [51], but the overstory at the YBLP contains a greater component of eastern hemlock than the DCGS, and 0.5–1 ha groves of eastern hemlock are common in localized catchment basins. Mean summer and winter temperatures are 17.7 °C and −9.2 °C respectively, and annual precipitation is 84.0 cm with 363 cm annual snowfall [47]. Forests near the YBLP likely contained larger portions of white pine in pre-settlement times (17–23%) [9], most of which were harvested in 1898 [52]. A heavy partial harvest in 1938 removed nearly 70% of available merchantable timber volume, most of which was hardwood [53]. After receiving the property as a donation from the Ford Motor Company in 1954, Michigan Technological University implemented uneven-aged management following the guidelines of Arbogast [14,54]. Since then, stands in the YBLP have been managed using the BDq method of single-tree selection (q-factor of 1.3) on 10–15 years cycles with the stocking criteria of a 16.1 m2 ha−1 residual basal area and maximum allowable diameters of 51–56 cm [55].
The YBLP has a completely randomized design consisting of 49 group-selection openings and 20 reference sites centered on single, dominant/codominant yellow birch legacy-trees. In 2003, the study area was surveyed for dominant and codominant yellow birch, and 69 were randomly selected to serve as centers of either canopy openings or reference sites. Canopy gaps were roughly circular and cut into four size classes based upon radii—0 m (reference), 11 m, 16.5 m, and 22 m. A minimum buffer distance of 60 m was used between adjacent gap edges and/or reference sites. Harvests occurred during the winter of 2003–2004, and all stems over 10 cm dbh were cut within the prescribed radii except for central yellow birch trees. Merchantable trees were removed, while unmerchantable stems were cut and left onsite as coarse woody debris. Concurrent with group-selection harvests, a STS harvest occurred over the study site following the above guidelines. Some incidental rutting occurred during harvests within and between openings because the ground was not frozen beneath the deep snowpack.
2.2. Field Sampling
Field sampling of gap-capturing saplings occurred during the summer of 2018, 23 years post-harvest at the DCGS and 15 years post-harvest at the YBLP. “Gap-capturing saplings” with high likelihoods of capturing future canopy positions were defined as the tallest saplings within a defined area and were only measured within group-selection openings (no reference sites) at each study. Openings were divided into four quadrants along cardinal directions, and the number of gap-capturing saplings measured depended on gap size: 1 sapling per quadrant for radii ≤11 m, 2 saplings per quadrant for radii between 11–16.5 m, and 3 saplings per quadrant for radii >16.5 m. This resulted in roughly one gap-capturing sapling measured per 100 m2, assuming an even distribution (for 3 m and 5 m gaps at the DCGS, opening area per measured sapling was 7 m2 and 20 m2 respectively). Species, height, dbh, and location within the gap were measured for each gap-capturing sapling recorded. Species nomenclature followed the USDA Plants Database [56]. A clinometer and measuring tape were used to measure heights, while azimuth and distance from gap center were measured with a compass and sonic rangefinder (Haglöf DME Range Finder, Haglöf Sweden AB, Långsele, Sweden). Gap centers were defined as the permanent central vegetation subplots at the DCGS and the approximate points of germination of yellow birch legacy-trees at the YBLP.
Field sampling of advance regeneration occurred at 2 years post-harvest during the summers of 1997 and 2005 in the DCGS and YBLP respectively [44,54]. Advance regeneration data were approximated with available data from each study site because advance regeneration was not measured preceding harvests. At the DCGS, advance regeneration was defined as saplings over 0.6 m height measured 2 years post-harvest. Subplots (1.8 m fixed-radius) were arrayed along intersecting transects following cardinal directions, and all stems were tallied by species and height class (<0.6 m, 0.6–2.1 m, >2.1 m). Data from all 56 canopy gaps were used in calculations. To account for differing numbers of subplots in different-sized openings, data were rarefied to include 5 subplots from each canopy gap lying within the gap driplines. At the YBLP, advance regeneration was defined as saplings over 0.5 m height but under 10.5 cm dbh measured 2 years post-harvest. Each canopy gap contained 12 fixed-radius (1 m) subplots: 4 under the yellow birch legacy-tree crown were located randomly along transects following the cardinal directions, while 8 were located randomly along transects following each of the cardinal and sub-cardinal directions between the legacy-tree crown and the gap dripline. Data from all 49 canopy gaps were used in calculations.
Field sampling of the overstory reference occurred during the summers preceding harvest at the DCGS and YBLP in 1994 and 2003 respectively [44,57]. At the DCGS, each experimental block contained three, randomly placed 11.3 m fixed-radius plots monitoring the growth and mortality of overstory trees. In 1994, all stems over 12.7 cm dbh were tallied by species within these and 12 additional fixed-radius plots (also 11.3 m) centered on the reference (0 m radius) gaps (total n = 24). At the YBLP, continuous forest inventory (CFI) plots in section 30 of T49N R33W (the section containing the study site) were measured in 2003. CFI plots were arrayed in a systematic grid with 161 m and 201 m between plots in the N–S and E–W directions, respectively. All stems over 12.7 cm dbh within 16.1 m fixed-radius plots were tallied by species. Data were subset to include only CFI plots lying within the YBLP study area (n = 23).
Gap area data were collected during the second growing season post-harvest (1997) at the DCGS and immediately following harvest (Spring 2004) at the YBLP [44,54]. Methods were similar among the sites: distance measurements were taken along cardinal and sub-cardinal directions from gap centers to the forest canopy dripline, and gap areas were calculated as eight-sided polygons. Driplines were defined as points under which the furthest extent of the crown or interpolation between branches measured 90° vertical with a clinometer.
2.3. Data Analysis
Unless stated otherwise, means always are presented plus or minus the standard error of the mean. Study sites (DCGS and YBLP) were analyzed separately to account for differences in experimental designs. Species were grouped into three shade-tolerance classes—tolerant, midtolerant, and intolerant—based on the shade-tolerance descriptions from Burns and Honkala [58] (Table 1). To investigate compositional species differences between gap-capturing saplings (by opening size), advance regeneration, and the reference canopy, multiple response permutation procedures (MRPP) were used in R version 3.5.3 with the vegan package version 2.5-4 [59,60], using the Sørenson (Bray–Curtis) distance measure and 999 iterations. Primary matrices contained species relative abundances in canopy gaps, reference plots, or overstory plots. Groups were defined as treatments (opening size), advance regeneration, or reference canopy, and pairwise comparisons were used to find differences between group combinations. To correct for multiple comparisons, the Benjamini–Hochberg procedure was used within each set of results (by study) to reduce the chance of committing a type I error [61]. A false-discovery rate—the chance of accepting a false-positive result as significant—of 0.1 was used to adjust α = 0.05 [61]. The p-values for MRPPs described the probability that species assemblages of two groups were distinct [62].
To investigate the effects of opening size on the relative abundance of species and shade-tolerance classes in gap-capturing saplings, we used linear models of relative abundance predicted by opening size (treatment), constructing separate models for each species and shade-tolerance class. For the DCGS data, mixed-effects models were used with “blocks” as random effects to account for the randomized block design (nlme package version 3.1-139 [60,63]). Post-hoc comparisons of estimated marginal means were made between opening size treatments using the emmeans package version 1.3.3 [64]. For YBLP data, one-way ANOVAs were used with R version 3.5.3 [63] to match the completely randomized experimental design, and Tukey’s HSD was used to make comparisons between opening-size treatments. For both studies, relative abundances of species and shade-tolerance groups were averaged within each canopy gap prior to analyses. To test for differences in the relative abundance of shade-tolerance classes in the northern and southern halves of canopy openings (gap-capturing saplings), we constructed two-way contingency tables for each treatment and used Pearson’s chi-square to assess significance.
To test for effects of gap area and distance to gap edge on gap-capturing sapling height, linear mixed-effects models were created with the nlme package, version 3.1-139 [60,63] and estimated using restricted maximum likelihood [65]. Likelihood-ratio tests were used to ensure that the random intercept models with random effects were appropriate [65], and model assumptions were checked visually. For these models, random effects were “gaps” nested within “blocks” for DCGS data to account for the randomized block design, whereas only “gaps” were used as random effects for YBLP data. Distance to gap edge was calculated by approximating each canopy gap as circular and using gap area to calculate an approximate radius; distance to gap center was subtracted from the approximate radius to calculate distance to edge (m). Not all canopy gaps were perfectly circular, and gap-capturing saplings were occasionally calculated to lay outside gap edges. To better approximate the reality on the ground and focus our analyses on saplings infilling within the gaps, we reassigned negative edge distances to 0 m. Few saplings were more than 1 m beyond calculated edges (maximum of 4.3 m beyond calculated edge), but we assessed the possible effects of larger deviations by generating models with and without saplings more than 1 m outside calculated edges (all negative edge distances were reassigned to 0 m). However, model estimates and standard errors were largely unchanged by omitting these saplings and, therefore, all saplings were included in all subsequent analyses. Both distances to edge and gap areas were natural-log transformed (ln(x +1)) to meet assumptions of linearity and homoscedasticity and to improve model fit. Previous studies suggest that the relationship between sapling height and gap area approaches a horizontal asymptote [28]. To find the point at which gap area no longer correlated to increased sapling height, we created mixed-effects models while sequentially increasing the lower limit of gap area in steps of 100 m2. Models of sapling height predicted by gap area and distance to edge for each data subset were assessed until the fixed-effect of gap area was no longer significant.
Linear mixed-effects models (nlme package version 3.1-139 [60,63]) and post-hoc comparisons of estimated marginal means (emmeans package version 1.3.3 [64]) were used to test for effects of shade-tolerance classes on gap-capturing sapling height and distance from gap edge (assessed separately) in each study site. Random effects for DCGS models were “gaps” nested within “blocks,” while only “gaps” were treated as random effects for YBLP data. To test for height differences between gap-capturing saplings growing in the northern compared to southern halves of canopy openings, we used similar mixed-effects models and post-hoc comparisons, this time using location within gaps (northern versus southern halves) to predict height. Again, the Benjamini–Hochberg procedure was used to correct for multiple comparisons within result sets and study sites with a false discovery rate of 0.1 [61].
To visualize patterns of sapling height and spatial distribution within canopy openings, we created interpolated height surfaces while marking the locations of all individual trees. Sapling location and height data from each treatment (opening size) were overlaid, and heights were averaged within 3 × 3 m square bins. Interpolated height surfaces were constructed from averaged heights at center points of respective bins with the akima package version 0.6-2 [65]. Spatial distributions of gap-capturing saplings were assessed using the L-function (i.e., Besag’s transformation of Ripley’s K-function) , where , in which a is the area of the point pattern, n is the number of points, r is radial distance from gap center, dij is the distance between the ith and jth points, I is an indicator equal to 1 when dij ≤ r and 0 otherwise, and eij is an error correction for the ith and jth points [66,67,68,69]. The hypothesis of complete spatial randomness (CSR) was rejected if the function L(r) fell outside the simulated envelope of L(r) generated with the spatstat package version 1.60-1 [66]. The L-functions and envelopes were calculated with overlaid gap-capturing saplings from a given opening size treatment, and spatial distributions were said to be aggregated or dispersed if L(r) was above or below the simulated envelope, respectively.
3. Results
3.1. Study Sites and Initial Conditions
Prior to harvest, the DCGS averaged 510 ± 30 stems ha−1 over 12.7 cm dbh with an average basal area of 27.6 ± 1.0 m2 ha−1. Sugar maple comprised the majority (85.4 ± 2.9%) of canopy stems, while yellow birch, white ash (Fraxinus americana L.), and American basswood (Tilia americana L.) ranged from 2.4% to 4.3% of the reference canopy (Figure 1a). In contrast, white ash and ironwood (Ostrya virginiana [Mill.] K. Koch) comprised 25.6% ± 6.7% and 20.9% ± 6.8% of advance regeneration in canopy gaps, while sugar maple were only 47.2 %± 7.4% (Figure 1a).
Prior to harvest, the YBLP averaged 357 ± 23 stems ha−1 over 12.7 cm dbh with an average basal area of 23.9 ± 1.3 m2 ha−1. Sugar maple and eastern hemlock comprised the majority of canopy stems, at 54.1% ± 7.1% and 19.0% ± 4.1% respectively (Figure 1b), while yellow birch were 12.4% ± 3.6% of canopy stems. The majority of advance regeneration were sugar maple (80.4% ± 3.6%), whereas eastern hemlock and yellow birch were only 1.5% ± 2.3% and 0.4% ± 0.5%, respectively (Figure 1b).
3.2. The Composition of Gap-Capturing Saplings
At the DCGS, 350 gap-capturing saplings were measured over 56 canopy gaps, and heights ranged from 1.5 to 21.3 m. Opening areas ranged from 10 to 1,986 m2 at 2 years post-harvest (1997) depending on treatment. Gap-capturing saplings were mostly mixtures of sugar maple (33.6% ± 4.1%), ironwood (30.5% ± 4.0%), and white ash (27.5% ± 4.5%) (Figure 1a). Balsam fir (2.8% ± 1.5%) were also occasionally found, along with other species. American basswood was found as a gap-capturing sapling in only one 15 m radius opening, while yellow birch were found capturing only two 23 m gaps.
At the YBLP, 463 gap-capturing saplings were measured over 49 canopy gaps, and heights ranged from 3.4 to 21.6 m. Immediately following harvest in 2004, opening areas ranged from 200 to 1460 m2. Gap-capturing saplings were mostly sugar maple (69.5% ± 3.1%) (Figure 1b). Red maple (12.1% ± 2.6%), ironwood (3.9% ± 1.4%), black cherry (9.4% ± 2.3%), and to a lesser extent, yellow birch (2.6% ± 1.0%) were also present. No eastern hemlock were recorded as gap-capturing saplings in any opening.
In both study sites, no differences in the relative abundances of individual species (linear mixed-effects models (DCGS) and ANOVA (YBLP), p ≥ 0.179, Table S1) or shade-tolerance groups (linear mixed-effects models (DCGS) and ANOVA (YBLP), p ≥ 0.303, Table S2) were found between opening size treatments (reference canopy and advance regeneration data were not included in tests). MRPPs revealed that species composition of gap-capturing saplings did not differ between opening size treatments in either study site (Table 2 and Table S3), although 3 m and 15 m openings at the DCGS had marginal compositional differences (p = 0.041) that were not significant after correcting for multiple comparisons. However, the composition of gap-capturing saplings did differ from reference canopies in both studies (MRPP, p < 0.003). In the DCGS, the composition of advance regeneration differed from the reference canopy (MRPP, p = 0.001), but did not differ from the composition of gap-capturing saplings in any opening size (MRPP, p ≥ 0.057). In contrast, composition of advance regeneration in the YBLP differed from both the reference canopy (MRPP, p = 0.001) and gap-capturing saplings in all opening sizes (MRPP, p < 0.037) (Table 2, Figure 1b, and Table S3).
3.3. Sapling Height
The height of gap-capturing saplings was strongly and positively related to canopy-gap area in both study sites (linear mixed-effects models, DCGS: p < 0.001, YBLP: p = 0.011) (Table 3 and Figure 2). However, this relationship weakened and disappeared as gap area increased. Linear mixed-effects models revealed that gap area was no longer a significant predictor of sapling height between 100 and 200 m2 in the DCGS and 300 and 400 m2 in the YBLP (Table S4). Mean heights of gap-capturing saplings differed by shade-tolerance class in the YBLP but not the DCGS (Figure 3b); however, shade-intolerant saplings were omitted from mixed-effects models at the DCGS because of low representation (n = 9) and uneven distribution within treatments (appearing in three of 56 canopy gaps). In the DCGS, midtolerant (13.7 ± 0.4 m) and shade-tolerant gap-capturing saplings (11.8 ± 0.3 m) did not differ significantly in height (linear mixed effects model, p = 0.727), and intolerant saplings averaged 16.9 ± 1.0 m. In the YBLP, shade-midtolerant gap-capturing saplings (13.3 ± 1.0 m) were taller than shade-tolerants (12.1 ± 0.1 m) (linear mixed-effects model, p = 0.026), and both groups were taller than intolerant saplings (10.1 ± 0.4 m) (linear mixed effects model, p < 0.003).
3.4. Spatial Patterning of Gap-Capturing Saplings
Analyses of the L-function indicated that when gap-capturing saplings for a given opening size were overlaid, their spatial arrangements were random, except in the largest gap sizes where distributions were aggregated beyond 1–2 m from gap centers: 16.5 and 22 m openings at the YBLP and 23 m openings at the DCGS (Figure S1). After accounting for the effect of gap area, sapling height decreased with distance from gap edge in the YBLP and weakly in the DCGS (linear mixed-effects models, YBLP: p < 0.001 and DCGS: p = 0.097) (Table 3 and Figure 2). In the DCGS, this effect was not observed in gaps larger than 100–200 m2 (Table S4). We only observed north–south differences in gap-capturing sapling height in 11 m radius openings at the YBLP (linear mixed-effects models, p = 0.028). There, heights in northern versus southern halves were 12.0 ± 0.5 m and 10.3 ± 0.5 m, respectively (Figure 4). We also did not observe any differences in the abundance of shade-tolerant groups in northern versus southern halves of canopy gaps (chi-square tests, p ≥ 0.139).
Gap-capturing saplings differed in their distance from gap edge depending on their shade tolerance in the YBLP, but not the DCGS (Figure 3a). In the DCGS, midtolerant gap-capturing saplings were not further from gap edges (9.1 ± 0.6 m) than shade-tolerants (6.6 ± 0.3 m) (linear mixed-effects models, p = 0.823). Shade-intolerant saplings were omitted from mixed-effects models at the DCGS because of low representation (n = 9) and uneven distribution within treatments (appearing in three of 56 canopy gaps), but they averaged 9.3 ± 1.7 m from gap edges. In the YBLP, all shade-tolerance classes had different averaged distances from gap edges (linear mixed-effects models, p ≤ 0.043). Intolerant saplings were found furthest from edges (7.2 ± 0.5 m), whereas shade-tolerant saplings were found at intermediate distances (5.5 ± 0.2 m), and midtolerant saplings relatively close to gap edges (2.7 ± 0.6 m).
4. Discussion
Collectively, our results suggest that group selection may help to alter overstory composition by incorporating more shade-midtolerant and -intolerant species into the canopies of managed northern hardwood forests; however, we found that opening size had little effect on overall species composition. Our results may also indicate the importance of harvest methods, as advance regeneration had notable impacts on the composition of gap-capturing saplings in openings. In accordance with expectations, sapling height responded positively to gap area in small openings but plateaued as opening size increased. However, single legacy-tree retention increased the range over which sapling growth was likely suppressed by roughly 200 m2. We found only slight evidence of north–south differences in sapling height, and species were not more likely to grow in northern portions of openings based upon their shade tolerance. We found some spatial aggregation in the largest opening sizes of both study sites, suggesting that some regions within openings may be generally more suitable for gap capture. Some compositional and spatial patterns of gap capture differed between study sites, but it is not entirely clear what factors were behind these discrepancies. We suspect that study designs, harvest methods, herbivore populations, and stand management histories may have influenced, at least in part, the composition of gap-capturing saplings and the spatial patterns of sapling height and shade tolerance within openings.
Our method of sampling gap-capturing saplings likely reflects advance regeneration and fast-growing species. We sampled only the tallest saplings present in quadrants, partitioning group-selection openings into four equal regions. Advance regeneration often maintains initial height advantages over saplings germinating after gap creation [28], and fast-growing species, such as red maple, can outgrow other species in canopy gaps within the span of 15–23 years [33]. Nevertheless, the composition of advance regeneration differed from that of gap-capturing saplings in the YBLP even though large advance regeneration (<10 cm dbh) were left onsite following harvest. These large advance regeneration contributed greatly to the composition of gap-capturing saplings, but were augmented by additional gap-colonist species. For example, black cherry comprised nearly 10% of the gap-capturing saplings (9.4% ± 2.3%) compared to only 1.4% ± 0.6% of advance regeneration at the YBLP (Figure 1b), likely due to its ability to readily germinate in canopy openings [70] and outgrow most competitors when open-grown [39]. However, when black cherry was removed from MRPP analyses, results still showed that the composition of advance regeneration differed from that of gap-capturing saplings regardless of opening size in the YBLP (p ≤ 0.036). Consequently, our results suggest that no single species is responsible for the shift in composition, rather this difference likely arose from the cumulative contributions of numerous subtle changes in abundance.
4.1. Composition
Our finding that composition of gap-capturing saplings was unaffected by opening size contrasts with our expectations and previously observed trends from both study sites, which suggested that opening size affects the overall regeneration composition and the abundance of midtolerant and intolerant species [49,71,72]. Consequently, the composition of species that ultimately capture group-selection openings may differ from general compositional patterns of regeneration. It is well documented that larger canopy openings create more favorable conditions for regenerating species with low shade tolerance [73]; however, other studies have also documented that some species do not regenerate preferentially based upon opening size [74]. In our study, there was marginal evidence that gap-capturing saplings in very small openings (3 m, DCGS) differed from those in larger openings (15 m, DCGS) (MRPP, p = 0.042, non-significant). However, our overarching results suggest that future canopy composition will be altered within group-selection openings up to 2000 m2 but that no dramatic compositional changes occur as opening size increases.
The species composition of gap-capturing saplings differed from reference canopy composition in both studies, and in the YBLP, advance regeneration remaining after harvest. In the DCGS, sugar maple comprised roughly 85% of the reference canopy, whereas advance regeneration and gap-capturing saplings were largely mixtures of sugar maple, white ash, and ironwood (Figure 1a). The ATD habitat type provides near optimal growth conditions for mesic hardwoods, and sugar maple is expected to dominate seedling and sapling layers, with minor competition from other shade tolerant species such as basswood, ironwood, hemlock, and yellow birch [51]. Therefore, it was unusual to find shade-tolerant ironwood and midtolerant white ash in such relative preponderance, even in large canopy openings. We conjecture that high herbivore density may have altered regeneration composition at the DCGS and discuss this further below. The reference canopy at the YBLP had a comparatively even mixture of species typical of ATD habitat types. Sugar maple comprised just over half of canopy trees (54%), while sizeable components of eastern hemlock (19%), yellow birch (12%), and red maple (6%) were also found. Also consistent with the expectations of ATD stands, sugar maple dominated advance regeneration (80%) along with smaller components of ironwood (6.3%) and red maple (5.5%) [51]. The composition of gap-capturing saplings in the YBLP was more consistent with expectations from theory than in the DCGS; namely, that large canopy openings create diverse light and moisture conditions suited for the natural regeneration of midtolerant and intolerant species [75]. Both midtolerant yellow birch (pairwise comparison, p = 0.011) and intolerant black cherry (pairwise comparison, p < 0.001) were more abundant as gap-capturing saplings than as advance regeneration in the YBLP. Time may also have created some compositional differences between the DCGS and YBLP, as openings at the DCGS were 8 years older, and long-term results (47 years) of some group-selection experiments suggest that the proportion of midtolerant species may increase over time [21]. Taken collectively, our results suggest that group selection might alter future canopy composition when implemented as part of a well-established STS system or when first converting an even-aged stand to uneven-aged management.
4.2. Legacy-Tree Effects
Unlike at the DCGS—where all canopy-level trees were harvested within group-selection openings—single, dominant/co-dominant yellow birch legacy-trees were retained at the center of every opening at the YBLP, and this difference may explain some of the variation of gap-capturing sapling composition, height, and spatial patterning between studies. In the DCGS, the location of gap-capturing saplings did not drastically affect their heights (Table 3). This agrees with previously observed patterns of regeneration height at this site [44] and separate findings that growth rates of most species plateau in high-light conditions [76]. However, sapling height decreased with distance from gap edge in the YBLP (Figure 2 and Figure 4), which may reflect effects of legacy-trees on sapling growth. Conditions near or beneath the legacy-tree crowns likely approximated conditions near or beyond gap edges [57], which are known to have less available light and to slow sapling growth [77]. In a study on the effects of intact forest aggregates on regeneration growth in adjacent harvested stands, Curzon et al. [78] found that patches of retained forest negatively affected the growth of regeneration layers up to 5 m beyond their edges. If we imagine that legacy-tree crowns and gap-edge trees affect regeneration up to 5 m away—note that legacy-tree crown radius averaged 4.1 ± 1.1 m in 2018—then 14 m radius openings (~600 m2) would be the minimum size necessary to avoid delays in regeneration growth. In the YBLP, we found that gap area did not negatively affect sapling height beyond 300–400 m2. This may suggest that single legacy-trees do not drastically influence sapling growth beyond their crowns or sufficiently shade circular openings larger than 300–400 m2 as to impact averaged height growth across openings. Studies from eastern North American hardwoods [79] and western North American conifers [80] also demonstrate that legacy-retention slows regeneration growth, but the magnitude of suppression depends on retention density. In the DCGS, sapling height was not affected by gaps areas larger than 100–200 m2, which agrees with findings from other group-selection openings in northern hardwoods where sapling height plateaued beyond 200 m2 (Figure 2) [28]. We expected legacy-trees to partially shade the northern portions of openings and alter the expected north–south growth pattern for canopy gaps in the northern hemisphere [81]. However, only 11 m radius gaps at the YBLP displayed a north-south height difference (Figure 4), in which gap-capturing saplings were taller in northern portions of openings. This is further evidence that the shading effects legacy-trees might be limited to their immediate vicinities.
4.3. Harvest Methods
Harvest methods differed between study sites and might also explain some of the discrepancies in composition and height of gap-capturing saplings. Stems less than 2.5 cm dbh were left uncut within openings at the DCGS, whereas stems less than 10 cm dbh remained in the YBLP. This potentially explains why shade-intolerant saplings tended to be shorter than other tolerance classes at the YBLP. Advance regeneration in group-selection openings often grows rapidly following release, and can dominate new cohorts [17]. Even though growth rates of gap colonists can surpass those of advance regeneration, initial height advantages of advance regeneration often persist to canopy recruitment [28]. In the DCGS, intolerant gap-capturing saplings tended to be taller than other tolerances classes, but were too rare to compare statistically. Since advance regeneration at the DCGS was smaller, there may not have been substantial height differences between advance regeneration and colonists; however, there clearly were additional impediments to intolerant species establishment. In contrast, shade-midtolerant and -tolerant advance regeneration in the YBLP maintained their initial height advantages 15 years post-harvest (Figure 3). Another study of group-selection openings in Minnesota, USA, retained large advance regeneration and found that saplings most likely to capture openings were also present as advance regeneration prior to harvest [27]. Despite initial height advantages, the composition of advance regeneration differed from gap-capturing saplings in the YBLP, whereas gap-capturing sapling and advance regeneration compositions did not differ in the DCGS (Table 2), suggesting that additional factors drove regeneration composition and recruitment. It should also be noted that neither site was scarified during winter harvesting. This may explain the relatively low recruitment of yellow birch, especially at the YBLP where seed trees were intentionally retained. Other research in similar forests suggests that scarification may greatly increase germination and recruitment of yellow birch in group-selection openings [82,83,84,85].
4.4. Herbivory
Herbivory by white-tailed deer (Odocoileus virginianus) is recognized as a major challenge to diversifying forests using group selection in the Great Lakes region [25] and may partially explain the compositional patterns we observed. At the DCGS, deer herbivory was likely higher than at the YBLP and may have contributed to the unusually high abundance of ironwood and white ash in gap-capturing saplings. Under intense browse pressure, regeneration composition can shift in favor of unpalatable [86] and/or browse-tolerant species [87]. Ironwood are generally avoided by deer [88], whereas both white ash, and to a lesser extent, sugar maple, though preferred, maintain high survivorship when intensively browsed [89]. In other hardwoods canopy gaps in the upper Great Lakes region, high deer densities led to the replacement of sugar maple by ironwood [90]. Deer herbivory may be “pre-filtering” advance regeneration at the DCGS, potentially explaining why the composition of advance regeneration differed from the reference canopy but not from gap-capturing saplings. Herbivory may also partially explain the low recruitment of yellow birch at the YBLP, as many heavily browsed yellow birch stems with growth arrested below 2 m height were observed (personal observation).
Deer herbivory was likely higher at the DCGS than the YBLP because of differences in deer density and patterns of winter use. Although no direct estimates of deer density exist for either study site, relative deer density may be inferred from harvest records of antlered bucks (antlerless deer harvesting is not currently allowed in the Michigan deer management unit containing the YBLP), which suggest deer abundance may be ~1.5 times greater at the DCGS site than the YBLP. For the 2015–2017 deer hunting seasons, 0.28 ± 0.07 antlered bucks km−2 were harvested near the YBLP (Michigan Management Unit 007) [91,92,93], whereas 0.43 ± 0.03 antlered bucks km−1 were harvested near the DCGS (Forest, County, WI) [94]. Additionally, snowpack depths likely contributed to differing spatial patterns of deer use between sites. Mean snowpack depth for periods of measurable snowpack at the YBLP is 42 ± 2 cm [95] compared to 20 ± 6 cm at the DCGS (Eagle River, WI) [96]. Deep snowpack is known to restrict deer movement above 40 cm [97] and, in high-snow regions, instigates the migration of deer to areas with dense mesic conifer canopy coverage (often under eastern hemlock) [98]. Tahtinen et al. [99] also reported that during winter months, deer near the YBLP preferred conifer stands and canopy gaps <80 m2 to avoid moving through deep snow. Taken together, higher densities and rates of use at the DCGS likely produced greater potential for deer to affect regeneration composition.
4.5. Management History
Differing management histories might explain some discrepancies in gap-capturing sapling composition between studies. Stands at the YBLP experienced a heavy partial harvest in 1938 and nearly four decades of single-tree selection prior to study establishment [53,55], whereas those at the DCGS went largely unmanaged since being clearcut in the 1930s. This difference may partially explain the dominance of shade-tolerant sugar maple as advance regeneration and gap-capturing saplings in the YBLP, despite relatively low sugar maple dominance in the overstory compared to the DCGS (Figure 1b). However, advance regeneration composition was likely affected by deer herbivory (discussed above) via preferential browsing [90]. It is well documented that single-tree selection in northern hardwoods (outside the range of American beech) shifts species composition towards sugar maple dominance at the expense of other species [11,54]. Despite this, managed uneven-aged stands may harbor more or similar numbers of woody species than unmanaged second-growth in northern hardwoods [11]. For example, black cherry may have benefited from long-term implementation of STS at the YBLP by persisting in the understory via periodic canopy openings and surviving to reproductive age [100], thus enhancing seed availability. Otherwise, it is difficult to explain the differences in black cherry relative abundance in gap-capturing saplings between the YBLP and DCGS, where only 0.5% ± 0.4% and 0.2% ± 0.3% of canopy trees were black cherry respectively. Future research might specifically compare regeneration within group-selection openings placed into unmanaged second-growth versus stands managed with single-tree selection to reveal any tangible effects of management history on recruitment diversity.
Sugar maple commonly dominates the canopy of hardwood forests in the upper Great Lakes [101], and current canopy composition at both the DCGS and YBLP are likely direct results of past management activities. Tubbs [102] suggested that timber harvesting around the turn of the 20th century often created “accidental shelterwoods” by selecting for specific species and/or grades, and that upon later canopy removal, robust cohorts of mostly shade-tolerant regeneration were released. Thus, harvests in the 1930s may have released large cohorts of shade-tolerant advance regeneration, dramatically shifting canopy composition in favor of sugar maple at both study sites. The difference in harvest intensities in the 1930s between the DCGS and YBLP, a commercial clear cut versus a heavy partial harvest, may partially explain the relative dominance of sugar maple in the canopy of the DCGS.
5. Conclusions
Experimental group-selection openings at the DCGS and YBLP serve as individual case studies on the effects that site factors, harvest methods, and management histories may have on resultant canopy compositions. While opening size was not a significant predictor of the species composition of gap-capturing saplings, group-selection openings appeared to alter canopy composition compared to managed and unmanaged northern-hardwoods second-growth by increasing the proportion of shade-midtolerant and -intolerant species recruited to the overstory. Additionally, the size of advance regeneration remaining after harvest may have tangibly affected future canopy composition within group-selection openings by favoring shade-tolerant species when larger advance regeneration was left behind. Opening size affected gap-capturing sapling height, and openings smaller than 300–400 m2 with legacy-retention or 100–200 m2 without retention may have suppressed sapling growth. Site-specific factors, such as management histories and deer densities, may also have influenced regeneration patterns and should be considered when pursuing context dependent management goals [32]. Group selection, though, appears to be one option for increasing the proportions of shade-intolerant and -midtolerant canopy species, thereby increasing future resilience, in uneven-aged managed northern hardwoods.
Supplementary Materials
The following are available online at https://www.mdpi.com/1999-4907/10/10/855/s1, Figure S1: Plots of L(r) versus r, radial distance from opening center, for gap-capturing saplings by treatment. Table S1: Relative abundance and inter-treatment comparisons of primary species. Table S2: Relative abundance and inter-treatment comparisons of saplings by shade-tolerance class. Table S3: Multiple response permutation procedure (MRPP) pairwise comparisons between gap-capture saplings, reference canopy, and advance regeneration. Table S4: Linear mixed-effects models of sapling height predicted by gap area and distance to gap edge.
Author Contributions
S.P.K. wrote the original manuscript, and C.C.K., C.R.W., and S.P.K. reviewed, edited, and re-wrote subsequent manuscript drafts. C.C.K., C.R.W., and S.P.K. developed methodology, and S.P.K. collected field data and conducted analyses. C.C.K. and C.R.W. conceptualized and obtained funding for the project.
Funding
This research was funded by the McIntire-Stennis Cooperative Forestry Research Program (project accession number 1010950) from the USDA National Institute of Food and Agricultural, the USDA Forest Service (agreement number 14-JV-11242307-084), and the School of Forest Resources and Environmental Science at Michigan Technological University.
Acknowledgments
We thank Russell Lipe and Kaylie Butts for help with field data collection and entry and Grace Parikh for acquiring snowpack depth data for our study sites. We also thank Erik Lilleskov and Robert Froese for their insightful comments on earlier drafts of this manuscript. We thank Michigan Technological University’s Ford Center and Forest for hosting our research sites, along with the Chequamegon-Nicolet National Forest. Support for this research came from the McIntire-Stennis Cooperative Forestry Research Program, USDA Forest Service, and Michigan Technological University’s School of Forest Resources and Environmental Science.
Conflicts of Interest
The authors declare no conflict of interest.
References
- Pretzsch, H. Diversity and productivity in forests: Evidence from long-term experimental plots. In Forest Diversity and Function; Springer: Berlin, Germany, 2005; pp. 41–64. [Google Scholar]
- Millar, C.I.; Stephenson, N.L.; Stephens, S.L. Climate change and forests of the future: Managing in the face of uncertainty. Ecol. Appl. 2007, 17, 2145–2151. [Google Scholar] [CrossRef] [PubMed]
- Liang, J.; Crowther, T.W.; Picard, N.; Wiser, S.; Zhou, M.; Alberti, G.; Schulze, E.D.; McGuire, A.D.; Bozzato, F.; Pretzsch, H. Positive biodiversity-productivity relationship predominant in global forests. Science 2016, 354, aaf8957. [Google Scholar] [CrossRef] [PubMed] [Green Version]
- Comita, L.S.; Queenborough, S.A.; Murphy, S.J.; Eck, J.L.; Xu, K.; Krishnadas, M.; Beckman, N.; Zhu, Y. Testing predictions of the Janzen–Connell hypothesis: A meta-analysis of experimental evidence for distance-and density-dependent seed and seedling survival. J. Ecol. 2014, 102, 845–856. [Google Scholar] [CrossRef] [PubMed]
- Johnstone, J.F.; Allen, C.D.; Franklin, J.F.; Frelich, L.E.; Harvey, B.J.; Higuera, P.E.; Mack, M.C.; Meentemeyer, R.K.; Metz, M.R.; Perry, G.L. Changing disturbance regimes, ecological memory, and forest resilience. Front. Ecol. Environ. 2016, 14, 369–378. [Google Scholar] [CrossRef]
- Tews, J.; Brose, U.; Grimm, V.; Tielbörger, K.; Wichmann, M.; Schwager, M.; Jeltsch, F. Animal species diversity driven by habitat heterogeneity/diversity: The importance of keystone structures. J. Biogeogr. 2004, 31, 79–92. [Google Scholar] [CrossRef]
- Kernaghan, G. Mycorrhizal diversity: Cause and effect? Pedobiologia 2005, 49, 511–520. [Google Scholar] [CrossRef]
- Nowacki, G.J.; Abrams, M.D. The demise of fire and “mesophication” of forests in the eastern United States. BioScience 2008, 58, 123–138. [Google Scholar] [CrossRef]
- Schulte, L.A.; Mladenoff, D.J.; Crow, T.R.; Merrick, L.C.; Cleland, D.T. Homogenization of northern US Great Lakes forests due to land use. Landsc. Ecol. 2007, 22, 1089–1103. [Google Scholar] [CrossRef]
- Williams, M. Americans and Their Forests: A Historical Geography; Cambridge University Press: Cambridge, UK, 1992. [Google Scholar]
- Crow, T.R.; Buckley, D.S.; Nauertz, E.A.; Zasada, J.C. Effects of management on the composition and structure of northern hardwood forests in Upper Michigan. For. Sci. 2002, 48, 129–145. [Google Scholar]
- O’Hara, K.L. The historical development of uneven-aged silviculture in North America. Forestry 2002, 75, 339–346. [Google Scholar] [CrossRef]
- Eyre, F.H.; Zillgitt, W.M. Partial Cuttings in Northern Hardwoods of the Lake States: Twenty-Year Experimental Results; US Dept. of Agriculture: Washington, DC, USA, 1953.
- Arbogast, C. Marking Guides for Northern Hardwoods under the Selection System; Service, U.F., Ed.; Lake States Forest Experiment Station: St. Paul, MN, USA, 1957. [Google Scholar]
- Seymour, R.S.; Guldin, J.; Marshall, D.; Palik, B. Large-scale, long-term silvicultural experiments in the United States: Historical overview and contemporary examples. Allg. Forst Jagdztg. 2006, 177, 104–112. [Google Scholar]
- Wisconsin Department of Natural Resources. Silvicultural Handbook; Wisconsin Dept. of Natural Resources: Madison, WI, USA, 2013; Volume 24315, pp. 2114–2116. [Google Scholar]
- Nyland, R.D. Selection system in northern hardwoods. J. For. 1998, 96, 18–21. [Google Scholar]
- Pond, N.C.; Froese, R.E.; Nagel, L.M. Sustainability of the selection system in northern hardwood forests. For. Sci. 2014, 60, 374–381. [Google Scholar] [CrossRef]
- Woods, K.D. Long-term change and spatial pattern in a late-successional hemlock–northern hardwood forest. J. Ecol. 2000, 88, 267–282. [Google Scholar] [CrossRef]
- Leak, W. Species composition and structure of a northern hardwood stand after 61 years of group/patch selection. North J. Appl. 1999, 16, 151–153. [Google Scholar] [CrossRef]
- Leak, W.B. Regeneration of patch harvests in even-aged northern hardwoods in New England. North. J. Appl. For. 2003, 20, 188–189. [Google Scholar]
- Webster, C.R.; Lorimer, C.G. Single-tree versus group selection in hemlock-hardwood forests: Are smaller openings less productive? Can. J. For. Res. 2002, 32, 591–604. [Google Scholar] [CrossRef]
- Dale, M.E.; Smith, H.C.; Pearcy, J.N. Size of Clearcut Opening Affects Species Composition, Growth Rate, and Stand Characteristics; Res. Pap. NE-698; US Department of Agriculture, Forest Service, Northeastern Forest Experiment Station: Radnor, PA, USA, 1995; p. 21.
- Mcclure, J.W.; Lee, T.D. Small-Scale Disturbance in a Northern Hardwoods Forest-Effects on Tree Species Abundance and Distribution. Can. J. For. Res. 1993, 23, 1347–1360. [Google Scholar] [CrossRef]
- Kern, C.C.; Burton, J.I.; Raymond, P.; D’Amato, A.W.; Keeton, W.S.; Royo, A.A.; Walters, M.B.; Webster, C.R.; Willis, J.L. Challenges facing gap-based silviculture and possible solutions for mesic northern forests in North America. For. Int. J. For. Res. 2017, 90, 4–17. [Google Scholar] [CrossRef]
- Clark, J.; Beckage, B.; Camill, P.; Cleveland, B.; HilleRisLambers, J.; Lichter, J.; McLachlan, J.; Mohan, J.; Wyckoff, P. Interpreting recruitment limitation in forests. Am. J. Bot. 1999, 86, 1–16. [Google Scholar] [CrossRef] [Green Version]
- Bolton, N.W.; D’Amato, A.W. Regeneration responses to gap size and coarse woody debris within natural disturbance-based silvicultural systems in northeastern Minnesota, USA. For. Ecol. Manag. 2011, 262, 1215–1222. [Google Scholar] [CrossRef]
- Webster, C.R.; Lorimer, C.G. Minimum opening sizes for canopy recruitment of midtolerant tree species: A retrospective approach. Ecol. Appl. 2005, 15, 1245–1262. [Google Scholar] [CrossRef]
- Bataineh, M.; Kenefic, L.; Weiskittel, A.; Wagner, R.; Brissette, J. Influence of partial harvesting and site factors on the abundance and composition of natural regeneration in the Acadian Forest of Maine, USA. For. Ecol. Manag. 2013, 306, 96–106. [Google Scholar] [CrossRef]
- Willis, J.L.; Walters, M.B.; Farinosi, E. Local seed source availability limits young seedling populations for some species more than other factors in northern hardwood forests. For. Sci. 2016, 62, 440–448. [Google Scholar] [CrossRef]
- Cole, W.G.; Lorimer, C.G. Probabilities of small-gap capture by sugar maple saplings based on height and crown growth data from felled trees. Can. J. For. Res. 2005, 35, 643–655. [Google Scholar] [CrossRef]
- Webster, C.R.; Dickinson, Y.L.; Burton, J.I.; Frelich, L.E.; Jenkins, M.A.; Kern, C.C.; Raymond, P.; Saunders, M.R.; Walters, M.B.; Willis, J.L. Promoting and maintaining diversity in contemporary hardwood forests: Confronting contemporary drivers of change and the loss of ecological memory. For. Ecol. Manag. 2018, 421, 98–108. [Google Scholar] [CrossRef]
- McClure, J.W.; Lee, T.D.; Leak, W.B. Gap capture in northern hardwoods: Patterns of establishment and height growth in four species. For. Ecol. Manag. 2000, 127, 181–189. [Google Scholar] [CrossRef]
- Klingsporn, S.; Webster, C.R.; Bump, J.K. Influence of legacy-tree retention on group-selection opening persistence. For. Ecol. Manag. 2012, 286, 121–128. [Google Scholar] [CrossRef]
- Nyland, R.D. Even-to uneven-aged: The challenges of conversion. For. Ecol. Manag. 2003, 172, 291–300. [Google Scholar] [CrossRef]
- Lorimer, C.G. Relative effects of small and large disturbances on temperate hardwood forest structure. Ecology 1989, 70, 565–567. [Google Scholar] [CrossRef]
- Marshall, R. The Growth of Hemlock Before and After Release from Suppression; Harvard Forest: Petersham, MA, USA, 1927. [Google Scholar]
- Webster, C.R.; Jensen, N.R. A shift in the gap dynamics of Betula alleghaniensis in response to single-tree selection. Can. J. For. Res. 2007, 37, 682–689. [Google Scholar] [CrossRef]
- Marquis, D.A. Prunus serotina Ehrh. black cherry. Silv. N. Am. 1990, 2, 594–604. [Google Scholar]
- Poznanovic, S.K.; Poznanovic, A.J.; Webster, C.R.; Bump, J.K. Spatial patterning of underrepresented tree species in canopy gaps 9 years after group selection cutting. For. Ecol. Manag. 2014, 331, 1–11. [Google Scholar] [CrossRef]
- Weigel, D.R.; Parker, G.R. Tree regeneration response to the group selection method in southern Indiana. North J. Appl. 1997, 14, 90–94. [Google Scholar] [CrossRef]
- Lu, D.; Wang, G.G.; Yan, Q.; Gao, T.; Zhu, J. Effects of gap size and within-gap position on seedling growth and biomass allocation: Is the gap partitioning hypothesis applicable to the temperate secondary forest ecosystems in Northeast China? For. Ecol. Manag. 2018, 429, 351–362. [Google Scholar] [CrossRef]
- Poulson, T.L.; Platt, W.J. Gap light regimes influence canopy tree diversity. Ecology 1989, 70, 553–555. [Google Scholar] [CrossRef]
- Kern, C.C.; Reich, P.B.; Montgomery, R.A.; Strong, T.F. Do deer and shrubs override canopy gap size effects on growth and survival of yellow birch, northern red oak, eastern white pine, and eastern hemlock seedlings? For. Ecol. Manag. 2012, 267, 134–143. [Google Scholar] [CrossRef]
- Soil Survey Staff. Web Soil Survey; Natural Resources Conservation Service, United States Department of Agriculture: Lincoln, NE, USA, 2017. Available online: https://websoilsurvey.sc.egov.usda.gov/ (accessed on 30 January 2019).
- Kotar, J.; Burger, T.L.; Kovach, J.A. A Guide to Forest Communities and Habitat Types of Northern Wisconsin; University of Wisconsin-Madison, Department of Forestry Ecology and Management: Madison, WI, USA, 2002. [Google Scholar]
- Arguez, A.; Durre, I.; Applequist, S.; Squires, M.; Vose, R.; Yin, X.; Bilotta, R. NOAA’s U.S. Climate Normals (1981–2010); NOAA National Centers for Environmental Information: Asheville, NC, USA, 2010. [CrossRef]
- Rhemtulla, J.M.; Mladenoff, D.J.; Clayton, M.K. Legacies of historical land use on regional forest composition and structure in Wisconsin, USA (mid-1800s–1930s–2000s). Ecol. Appl. 2009, 19, 1061–1078. [Google Scholar] [CrossRef]
- Kern, C.C.; D’Amato, A.W.; Strong, T.F. Diversifying the composition and structure of managed, late-successional forests with harvest gaps: What is the optimal gap size? For. Ecol. Manag. 2013, 304, 110–120. [Google Scholar] [CrossRef]
- Erdmann, G.G. Developing quality in second-growth stands. In The Northern Hardwood Resource: Management and Potential; Mroz, G.D., Reed, D.D., Eds.; Michigan Technological University: Houghton, MI, USA, 1986; pp. 206–222. [Google Scholar]
- Kotar, J.; Burger, T.L. A Guide to Forest Communities and Habitat Types of Michigan; University of Wisconsin-Madison, Department of Forestry Ecology and Management: Madison, WI, USA, 2003. [Google Scholar]
- Reed, D.D.; Holmes, M.J.; Johnson, J.A. A 22-year study of stand development and financial return in northern hardwoods. North J. Appl. 1986, 3, 35–38. [Google Scholar] [CrossRef]
- Bourdo, E.A.J.; Johnson, J.A. Practical Small Woodlot Management; Michigan College of Mining and Technology: L’Anse, MI, USA, 1959. [Google Scholar]
- Neuendorff, J.K.; Nagel, L.M.; Webster, C.R.; Janowiak, M.K. Stand structure and composition in a northern hardwood forest after 40 years of single-tree selection. North J. Appl. 2007, 24, 197–202. [Google Scholar] [CrossRef]
- Schwartz, J.W.; Nagel, L.M.; Webster, C.R. Effects of uneven-aged management on diameter distribution and species composition of northern hardwoods in Upper Michigan. For. Ecol. Manag. 2005, 211, 356–370. [Google Scholar] [CrossRef]
- Usda, N. The PLANTS Database; National Plant Data Team: Greensboro, NC, USA, 2019. Available online: http://plants.usda.gov (accessed on 29 April 2019).
- Shields, J.M.; Webster, C.R.; Nagel, L.M. Factors influencing tree species diversity and Betula alleghaniensis establishment in silvicultural openings. Forestry 2007, 80, 293–307. [Google Scholar] [CrossRef] [Green Version]
- Burns, R.M.; Honkala, B.H. Silvics of North America: 1. Conifers; 2. Hardwoods; U.S. Department of Agriculture, Forest Service: Washington, DC, USA, 1990; Volume 2, p. 877.
- Oksanen, J.; Blanchet, F.G.; Friendly, M.; Kindt, R.; Legendre, P.; McGlinn, D.; Minchin, P.; O’Hara, R.B.; Simpson, G.L.; Solymos, P.; et al. Vegan: Community Ecology Package, R Package Version 2.5-4. 2019. Available online: https://CRAN.R-project.org/package=vegan (accessed on 6 May 2019).
- R Core Team. R: A Language and Environment for Statistical Computing; R Foundation for Statistical Computing: Vienna, Austria, 2019. [Google Scholar]
- Benjamini, Y.; Hochberg, Y. Controlling the false discovery rate: A practical and powerful approach to multiple testing. J. R. Stat. Soc. Ser. B (Methodol.) 1995, 57, 289–300. [Google Scholar] [CrossRef]
- McCune, B.G.; Grace, J.J.B. Analysis of Ecological Communities; MJM Software Design: Gleneden Beach, OR, USA, 2002. [Google Scholar]
- Pinheiro, J.; Bates, D.; Sarkar, D.; Team, R.C. nlme: Linear and Nonlinear Mixed Effects Models, 3.1-129. 2019. Available online: https://CRAN.R-project.org/package=nlme (accessed on 13 May 2019).
- Lenth, R. emmeans: Estimated Marginal Means, Aka Least-Squares Means, R Package Version 1.3.3. 2019. Available online: https://CRAN.R-project.org/package=emmeans (accessed on 5 August 2019).
- Zuur, A.F.; Ieno, E.N.; Walker, N.; Saveliev, A.A.; Smith, G.M. Mixed Effects Models and Extensions in Ecology in R.; Springer Science+Business Media, LLC: Berlin, Germany, 2009. [Google Scholar]
- Akima, H.; Gebhardt, A. akima: Interpolation of Irregularly and Regularly Spaced Data, 0.6-2. 2016. Available online: https://CRAN.R-project.org/package=akima (accessed on 27 April 2019).
- Baddeley, A.; Rubak, E.; Turner, R. Spatial Point Patterns: Methodology and Applications with R; Chapman and Hall/CRC: London, UK, 2015. [Google Scholar]
- Besag, J. Discussion of Dr Ripley’s paper. J. R. Stat. Soc. Ser. B 1977, 39, 193–195. [Google Scholar]
- Ripley, B.D. Modelling spatial patterns. J. R. Stat. Soc. Ser. B (Methodol.) 1977, 39, 172–192. [Google Scholar] [CrossRef]
- Falk, K.J.; Elliott, K.A.; Burke, D.M.; Nol, E. Early seedling response to group selection harvesting in a northern hardwood forest. For. Chron. 2010, 86, 100–109. [Google Scholar] [CrossRef] [Green Version]
- Knapp, S.P.; Webster, C.R.; Kern, C.C. Can group selection with legacy retention change compositional trajectories in conventionally managed hardwoods? For. Ecol. Manag. 2019, 448, 174–186. [Google Scholar] [CrossRef]
- Klingsporn Poznanovic, S.K.; Webster, C.R.; Bump, J.K. Maintaining mid-tolerant tree species with uneven-aged forest management: 9-year results from a novel group-selection experiment. Forestry 2013, 86, 555–567. [Google Scholar] [CrossRef] [Green Version]
- Zhu, J.; Lu, D.; Zhang, W. Effects of gaps on regeneration of woody plants: A meta-analysis. J. For. Res. 2014, 25, 501–510. [Google Scholar] [CrossRef]
- Nagel, T.A.; Svoboda, M.; Rugani, T.; Diaci, J. Gap regeneration and replacement patterns in an old-growth Fagus–Abies forest of Bosnia–Herzegovina. Plant Ecol. 2010, 208, 307–318. [Google Scholar] [CrossRef]
- Denslow, J.S. Gap Partitioning among Tropical Rainforest Trees. Biotropica 1980, 12, 47–55. [Google Scholar] [CrossRef]
- Kaelke, C.M.; Kruger, E.L.; Reich, P.B. Trade-offs in seedling survival, growth, and physiology among hardwood species of contrasting successional status along a light-availability gradient. Can. J. For. Res. 2001, 31, 1602–1616. [Google Scholar] [CrossRef]
- York, R.A.; Battles, J.J.; Heald, R.C. Edge effects in mixed conifer group selection openings: Tree height response to resource gradients. For. Ecol. Manag. 2003, 179, 107–121. [Google Scholar] [CrossRef]
- Curzon, M.; Baker, S.; Kern, C.; Palik, B.; D’Amato, A. Influence of mature overstory trees on adjacent 12-year regeneration and the woody understory: Aggregated retention versus intact forest. Forests 2017, 8, 31. [Google Scholar] [CrossRef]
- D’Amato, A.W.; Catanzaro, P.F.; Fletcher, L.S. Early regeneration and structural responses to patch selection and structural retention in second-growth northern hardwoods. For. Sci. 2014, 61, 183–189. [Google Scholar] [CrossRef]
- Urgenson, L.S.; Halpern, C.B.; Anderson, P.D. Twelve-year responses of planted and naturally regenerating conifers to variable-retention harvest in the Pacific Northwest, USA. Can. J. For. Res. 2012, 43, 46–55. [Google Scholar] [CrossRef]
- Canham, C.D.; Denslow, J.S.; Platt, W.J.; Runkle, J.R.; Spies, T.A.; White, P.S. Light regimes beneath closed canopies and tree-fall gaps in temperate and tropical forests. Can. J. For. Res. 1990, 20, 620–631. [Google Scholar] [CrossRef]
- Gauthier, M.-M.; Lambert, M.-C.; Bédard, S. Effects of harvest gap size, soil scarification, and vegetation control on regeneration dynamics in sugar maple-yellow birch stands. For. Sci. 2016, 62, 237–246. [Google Scholar] [CrossRef]
- Godman, R.M.; Krefting, L.W. Factors important to yellow birch establishment in Upper Michigan. Ecology 1960, 41, 18–28. [Google Scholar] [CrossRef]
- Prevost, M.; Raymond, P.; Lussier, J.-M. Regeneration dynamics after patch cutting and scarification in yellow birch–conifer stands. Can. J. For. Res. 2010, 40, 357–369. [Google Scholar] [CrossRef]
- Raymond, P.; Munson, A.D.; Ruel, J.-C.; Nolet, P. Group and single-tree selection cutting in mixed tolerant hardwood–white pine stands: Early establishment dynamics of white pine and associated species. For. Chron. 2003, 79, 1093–1106. [Google Scholar] [CrossRef]
- Pellerin, M.; Saïd, S.; Richard, E.; Hamann, J.-L.; Dubois-Coli, C.; Hum, P. Impact of deer on temperate forest vegetation and woody debris as protection of forest regeneration against browsing. For. Ecol. Manag. 2010, 260, 429–437. [Google Scholar] [CrossRef]
- Krueger, L.M.; Peterson, C.J.; Royo, A.; Carson, W.P. Evaluating relationships among tree growth rate, shade tolerance, and browse tolerance following disturbance in an eastern deciduous forest. Can. J. For. Res. 2009, 39, 2460–2469. [Google Scholar] [CrossRef]
- Hurley, P.M.; Flaspohler, D. An assessment of long-term biodiversity recovery from intense and sustained deer browse on North Manitou Island, Sleeping Bear Dunes National Lakeshore. In Proceedings of the Michigan Society of American Foresters Conference, St. Ignace, MI, USA, 10 June 2005. [Google Scholar]
- Long, Z.T.; Pendergast IV, T.H.; Carson, W.P. The impact of deer on relationships between tree growth and mortality in an old-growth beech-maple forest. For. Ecol. Manag. 2007, 252, 230–238. [Google Scholar] [CrossRef]
- Matonis, M.S.; Walters, M.B.; Millington, J.D. Gap-, stand-, and landscape-scale factors contribute to poor sugar maple regeneration after timber harvest. For. Ecol. Manag. 2011, 262, 286–298. [Google Scholar] [CrossRef]
- Frawley, B.J. Michigan Deer Harvest Survey Report 2016 Seasons; Michigan Department of Natural Resources: Lansing, MI, USA, 2017. [Google Scholar]
- Frawley, B.J. Michigan Deer Harvest Survey Report 2017 Seasons; Michigan Department of Natural Resources: Lansing, MI, USA, 2018. [Google Scholar]
- Frawley, B.J.; Boon, C.E. Michigan Deer Harvest Survey Report 2015 Seasons; Michigan Department of Natural Resources: Lansing, MI, USA, 2016. [Google Scholar]
- Wallenfang, K. Forest County Buck Harvest Densities. Available online: https://dnr.wi.gov/wideermetrics/DeerStats.aspx?R=5 (accessed on 29 May 2019).
- National Operational Hydrologic Remote Sensing Center. Snow Data Assimilation System (SNODAS) Data Products at NSIDC, November 15–April 15 in 2005–2018; National Snow and Ice Data Center: Boulder, CO, USA, 2004. [Google Scholar]
- Western Regional Climate Center. Period of Record Monthly Climate Survey 1939–2016. Available online: https://wrcc.dri.edu/cgi-bin/cliMAIN.pl?wi2314 (accessed on 23 August 2019).
- Verme, L.J. Movements of white-tailed deer in upper Michigan. J. Wildl. Manag. 1973, 37, 545–552. [Google Scholar] [CrossRef]
- Witt, J.; Webster, C.; Froese, R.; Drummer, T.; Vucetich, J. Scale-dependent drivers of ungulate patch use along a temporal and spatial gradient of snow depth. Can. J. Zool. 2012, 90, 972–983. [Google Scholar] [CrossRef]
- Tahtinen, B.; Murray, B.D.; Webster, C.R.; Tarasoff, C.S.; Burton, A.J. Does ungulate foraging behavior in forest canopy gaps produce a spatial subsidy with cascading effects on vegetation? For. Sci. 2013, 60, 819–829. [Google Scholar] [CrossRef]
- Closset-Kopp, D.; Chabrerie, O.; Valentin, B.; Delachapelle, H.; Decocq, G. When Oskar meets Alice: Does a lack of trade-off in r/K-strategies make Prunus serotina a successful invader of European forests? For. Ecol. Manag. 2007, 247, 120–130. [Google Scholar] [CrossRef]
- Hupperts, S.F.; Dickinson, Y.L.; Webster, C.R.; Kern, C.C. Promoting structural and species diversity in Great Lakes northern hardwoods: A conceptual model and its application. For. Int. J. For. Res. 2018, 120, 16–25. [Google Scholar] [CrossRef]
- Tubbs, C.H. Natural Regeneration of Northern Hardwoods in the Northern Great Lakes Region; North Central Forest Experimental Station: St. Paul, MN, USA, 1977. [Google Scholar]
Figure 1.
The relative abundance of major species in two group-selection study sites in northern hardwood forests of the upper Great Lakes, USA: (a) Divide Canopy Gap Study (DCGS); (b) Yellow Birch Legacy Project (YBLP). Reference canopies were measured in fixed-radius plots near experimental openings in the year prior to harvest in each respective study. Advance regenerations were approximated as saplings remaining 2-years post-harvest, >0.5 m height in the YBLP and >0.6 m height in the DCGS. Composition of gap-capturing saplings described in experimental group-selection openings was measured at 15 years post-harvest in the YBLP and 23 years post-harvest in the DCGS. Error bars represent 95% confidence intervals. MRPP species compositional groupings are shown in Table 2.
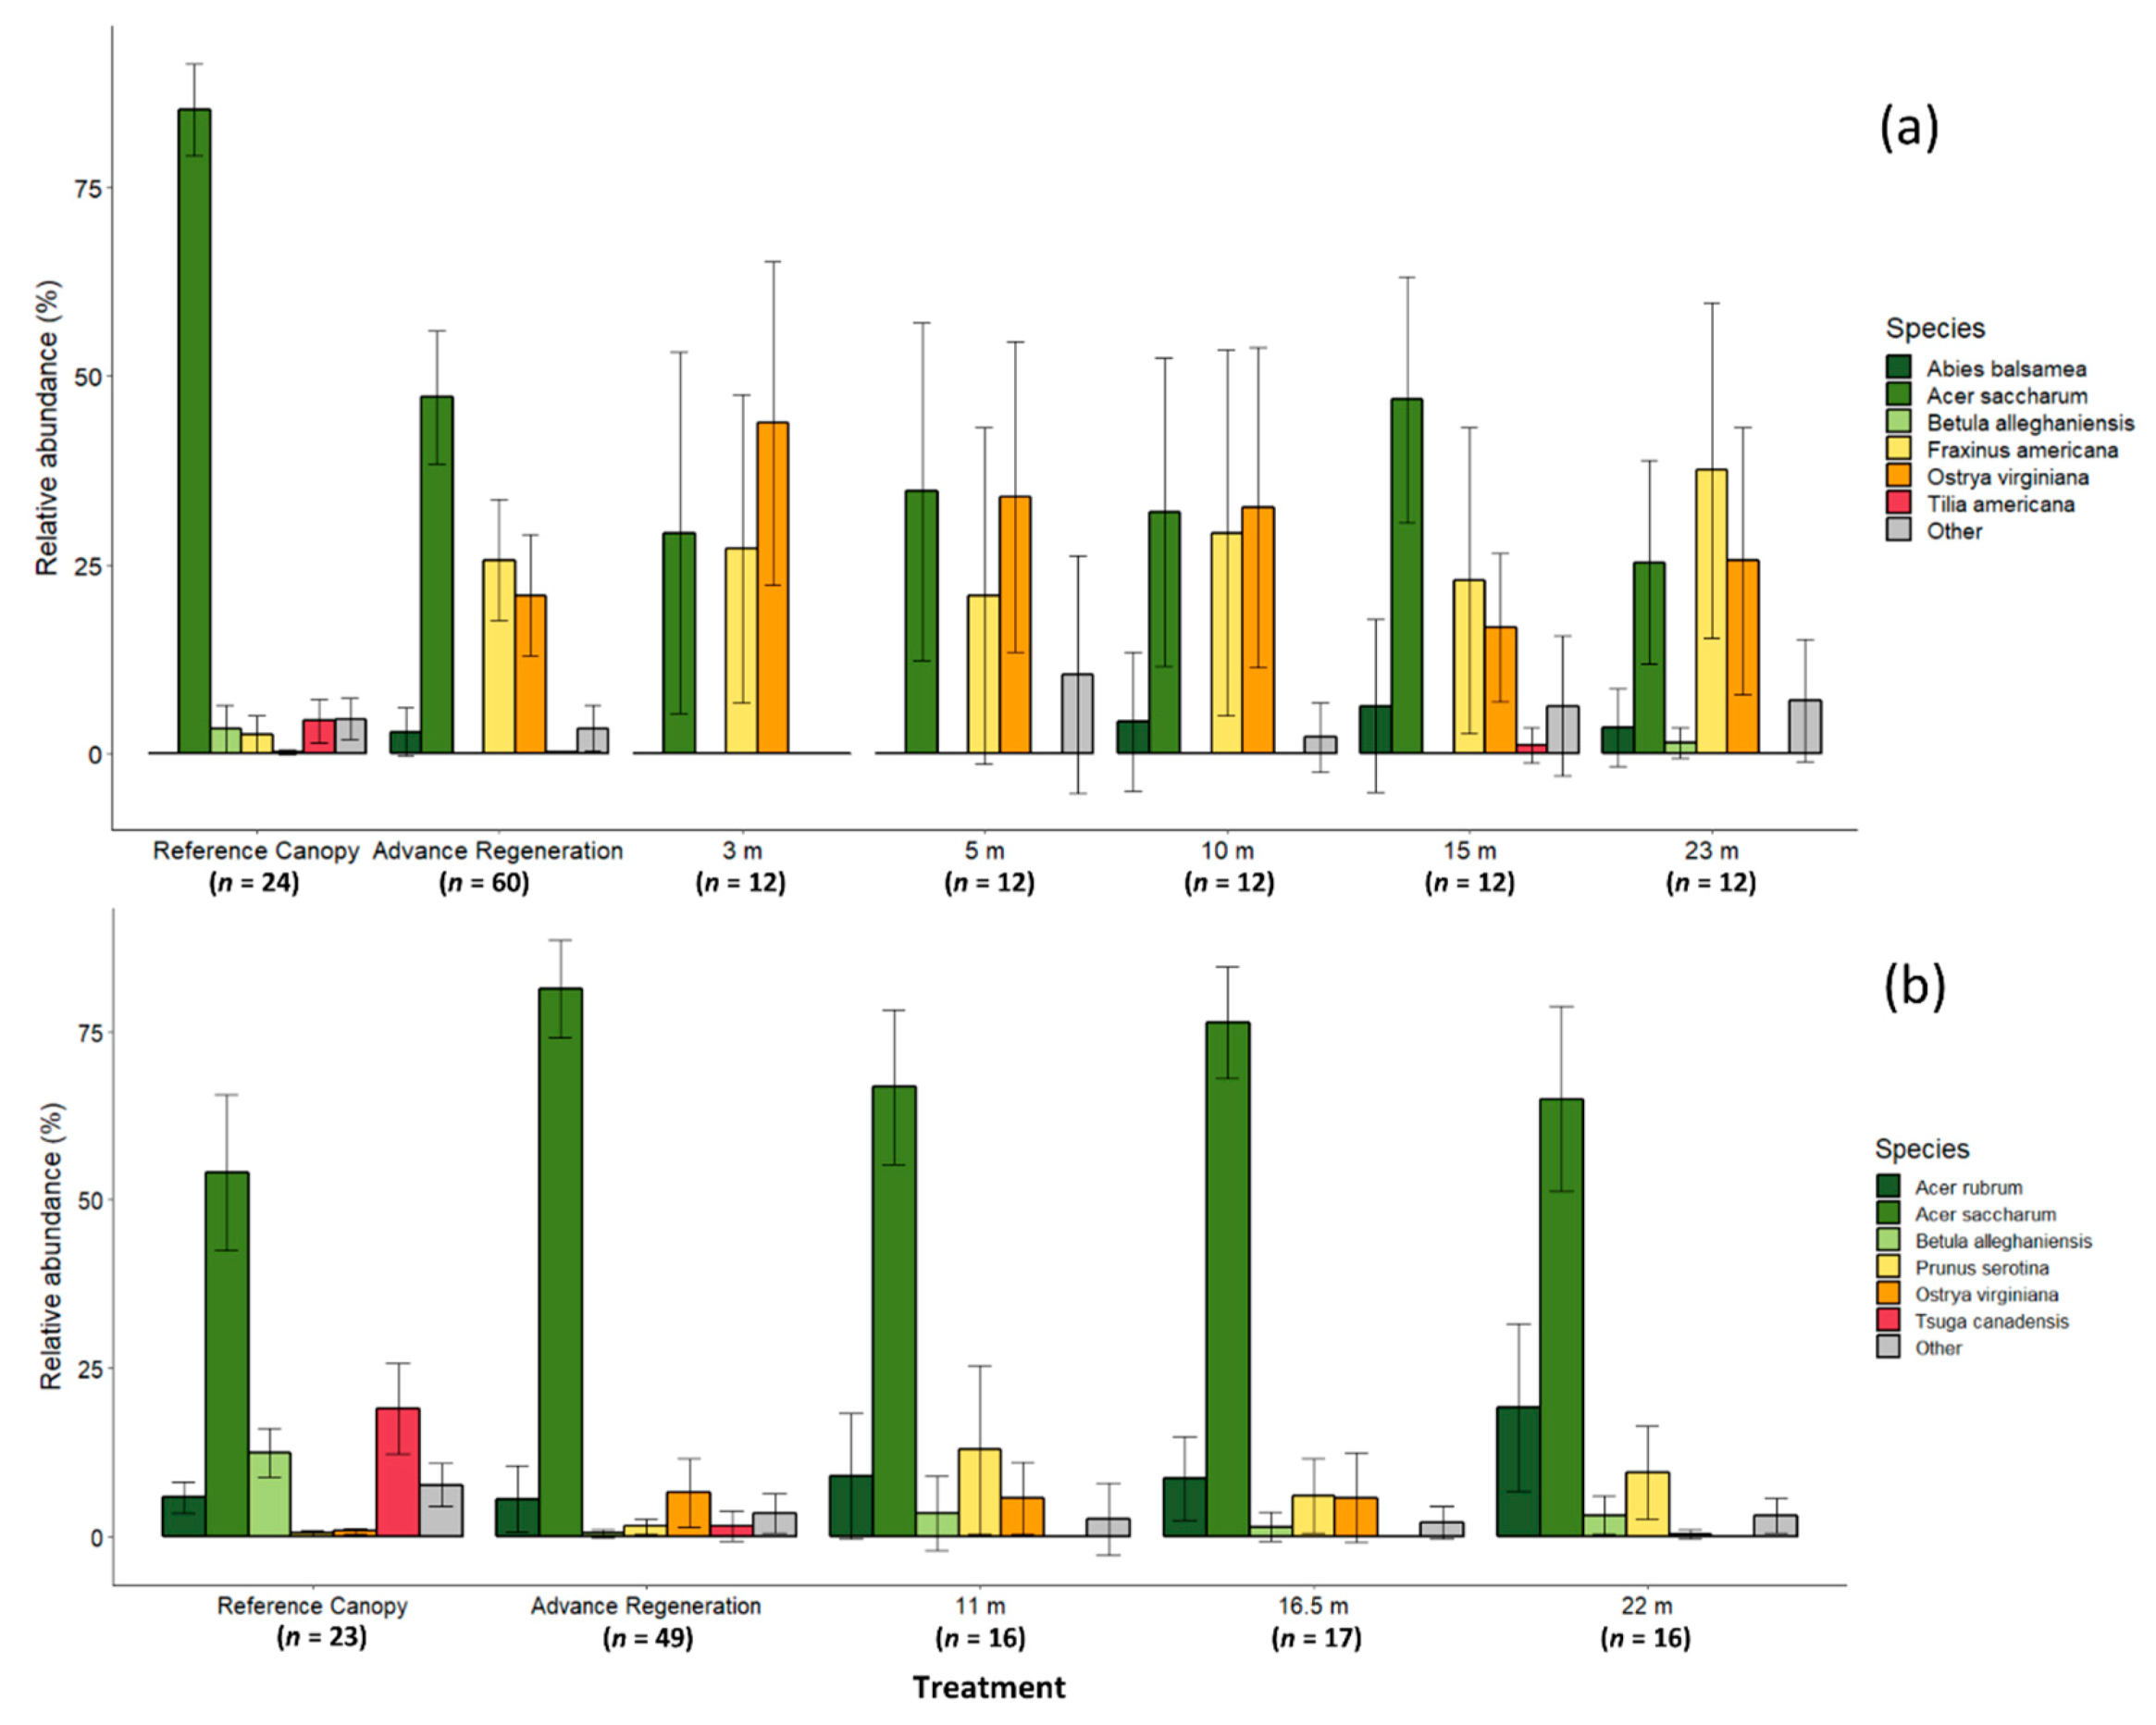
Figure 2.
Relationships between gap-capturing sapling height (m), distance from gap edge (m), and gap area (m2) for two group-selection study sites in northern hardwood forests of the upper Great Lakes, USA: (a) Divide Canopy Gap Study (DCGS); (b) Yellow Birch Legacy Project (YBLP). Dots represent individual gap-capturing saplings color-coded by opening-size class. Lines represent linear, mixed-effects model fits of sapling height predicted by gap area and distance from gap edge (Table 3). Average areas from each opening-size class were used as constant values to calculate fit lines of height versus distance from gap edge. *Distance from gap edge was not a significant predictor of sapling height in the DCGS model.

Figure 3.
Bar graphs of gap-capturing sapling (a) distance from gap edge and (b) height, separated by shade-tolerance classes in two group-selection study sites in northern hardwood forests of the upper Great Lakes, USA. Bars on the left represent gap-capturing saplings from the DCGS, while those on the right represent gap-capturing saplings from the YBLP. Bar heights reflect geometric means, and error bars reflect 95% confidence intervals. Sample sizes for each shade-tolerance class are listed in panel (b). Lowercase letters reflect groupings from post-hoc comparisons of estimated marginal (least-squares) means from linear mixed-effects models of edge, distance, or height predicted by shade-tolerance class. For DCGS models, individual canopy gaps nested within experimental blocks were used as random effects, while only individual canopy gaps were treated as random effects in models for the YBLP. The Benjamini–Hochberg procedure was used to adjust α = 0.05 with a false-discovery rate of 0.1 within sets of results within studies. * Shade-intolerant saplings were omitted from mixed-effects models at the DCGS because of low representation (n = 9) and uneven distribution within treatments (appearing in three of 56 canopy gaps).
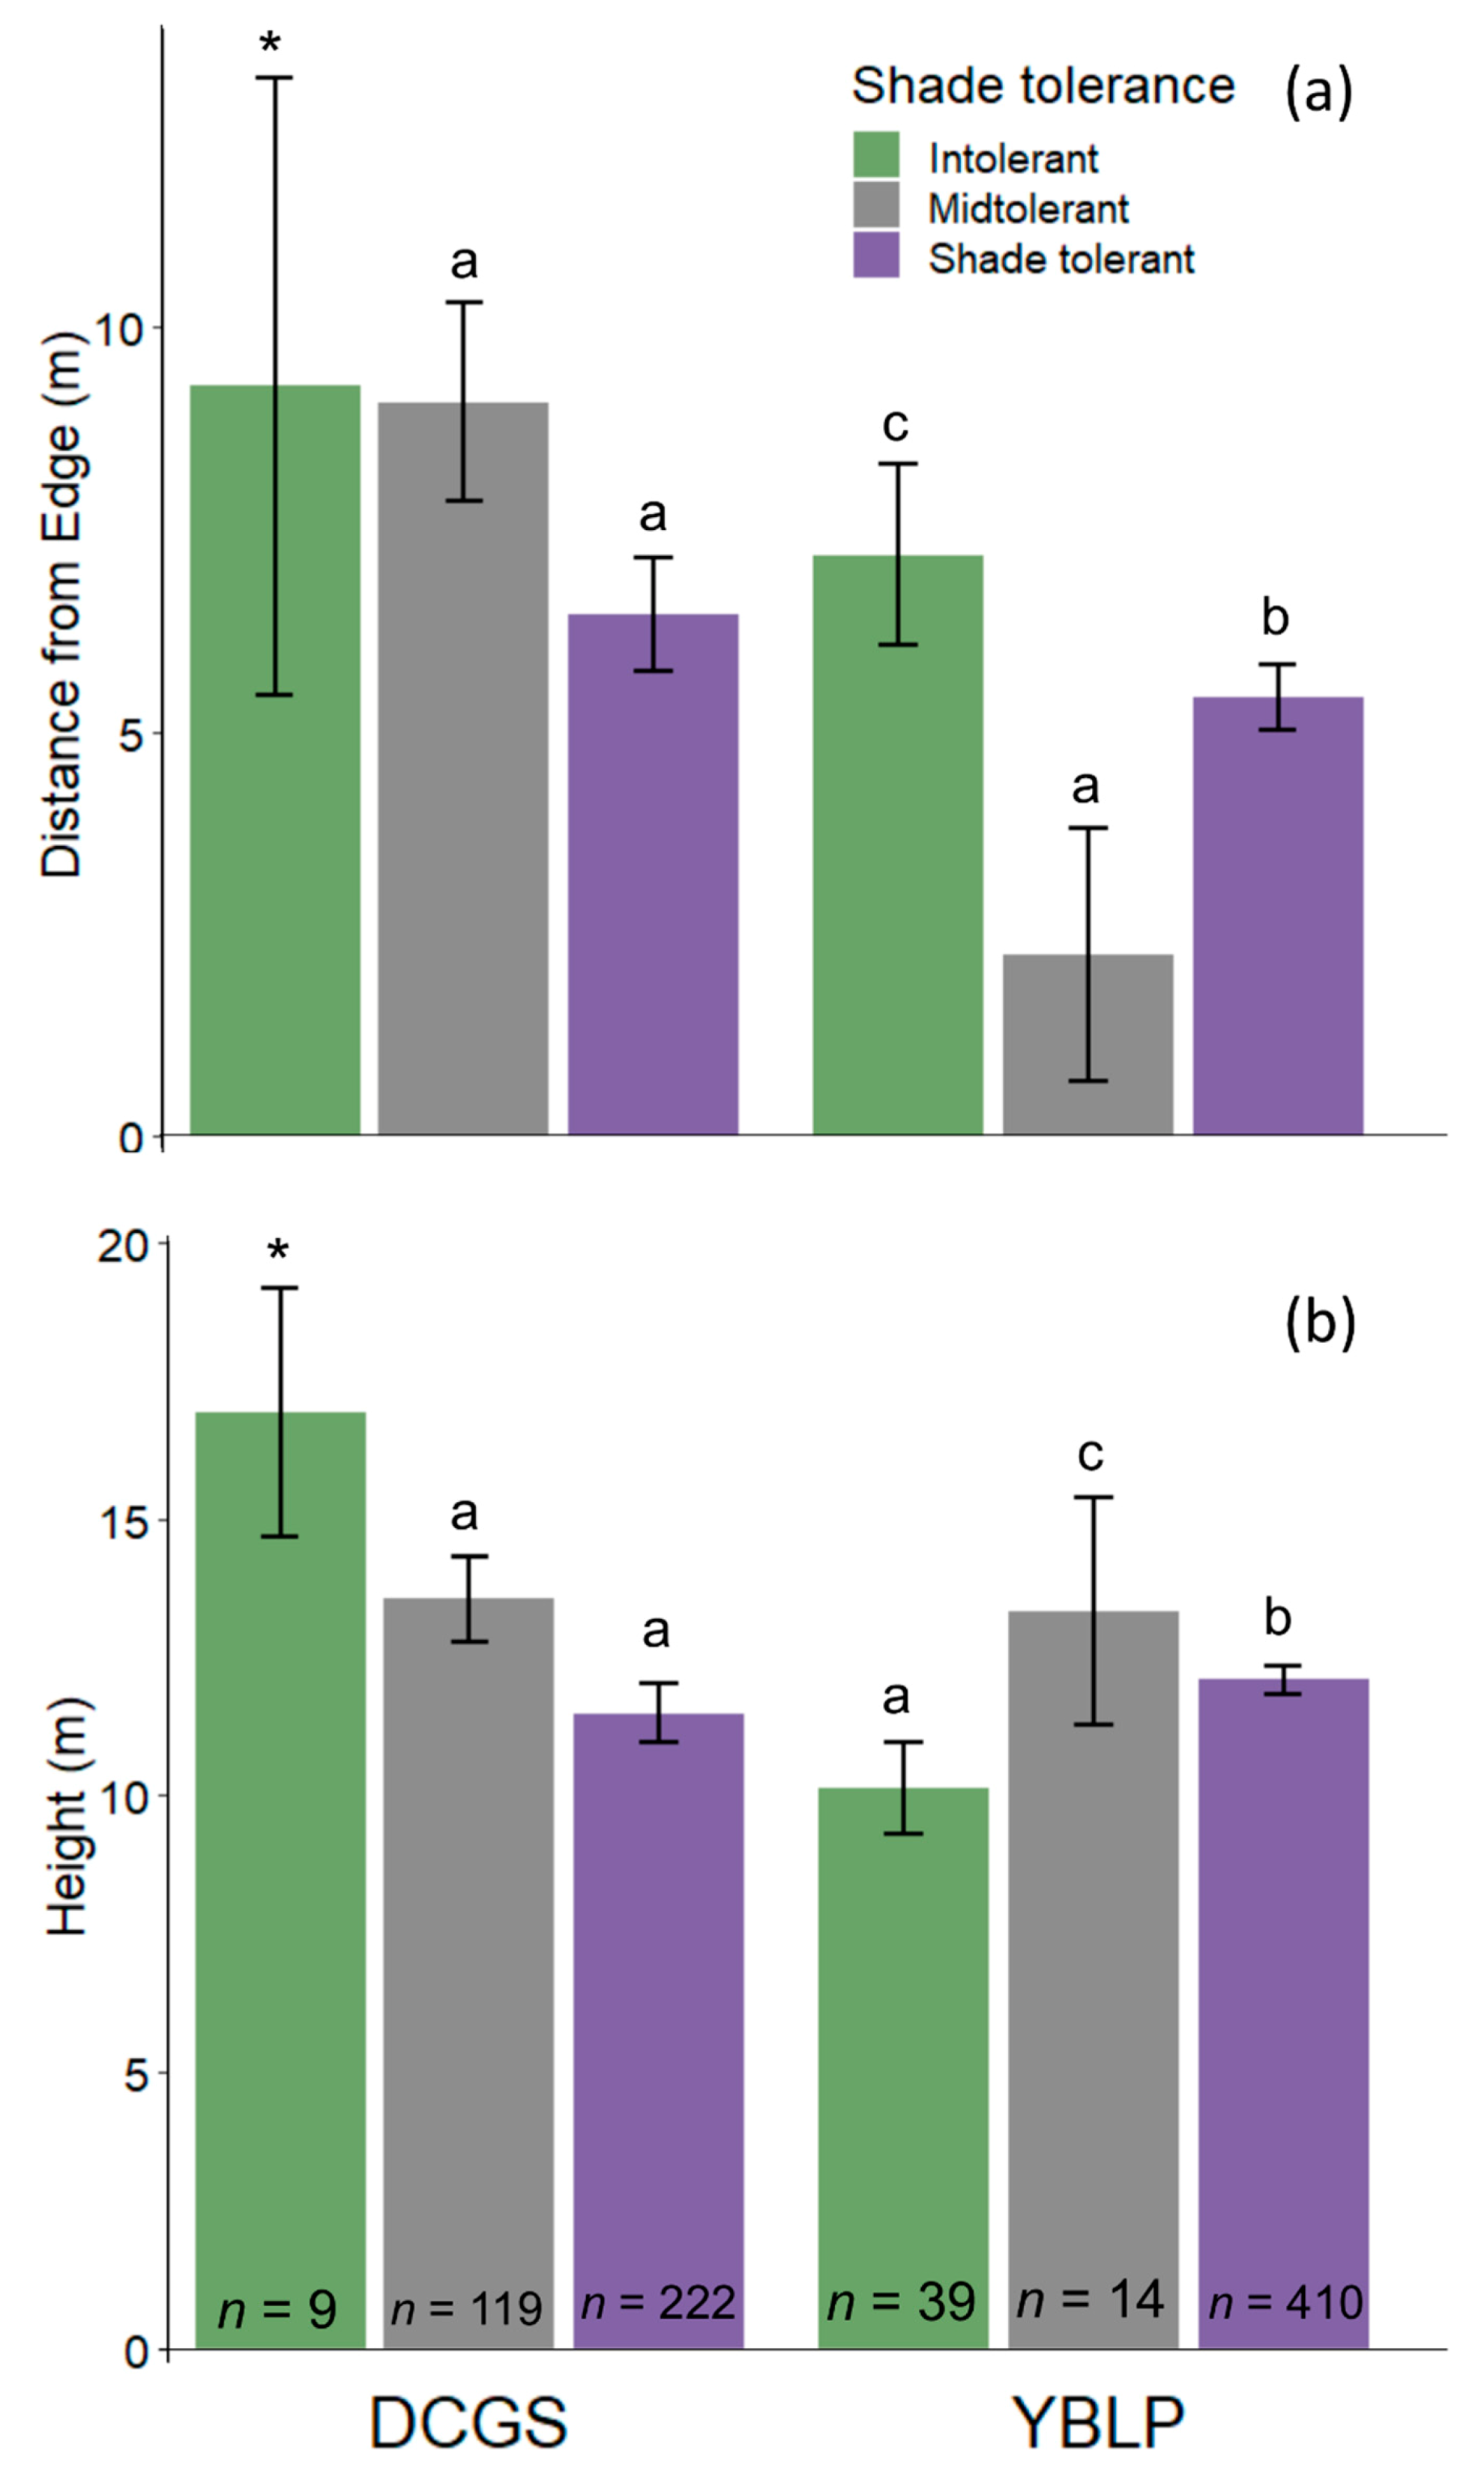
Figure 4.
Locations of individual gap-capturing saplings and height-averaged contour maps for experimental group-selection openings of varying sizes at two study sites in northern hardwoods of the upper Great Lakes, USA. Each plot represents data from individual opening-size class-based harvest radii: In the DCGS, 3 m (n = 12), 5 m (n = 12), 10 m (n = 12), 15 m (n = 12), and 23 m (n = 15); in the YBLP, 11 m (n = 16), 16.5 m (n = 17), and 22 m (n = 16). Sapling heights were averaged within 3 × 3 m bins, and contours were created by linearly interpolating averaged heights between bin center points. Dots denote individual saplings, and shapes denote shade-tolerance classes. Centers of plots correspond to centers of canopy openings, and degrees refer to directional azimuths. Openings were roughly circular, and the angular shapes of the contour plots are artifacts of the interpolation process. Note the y-axis scales are not uniform.
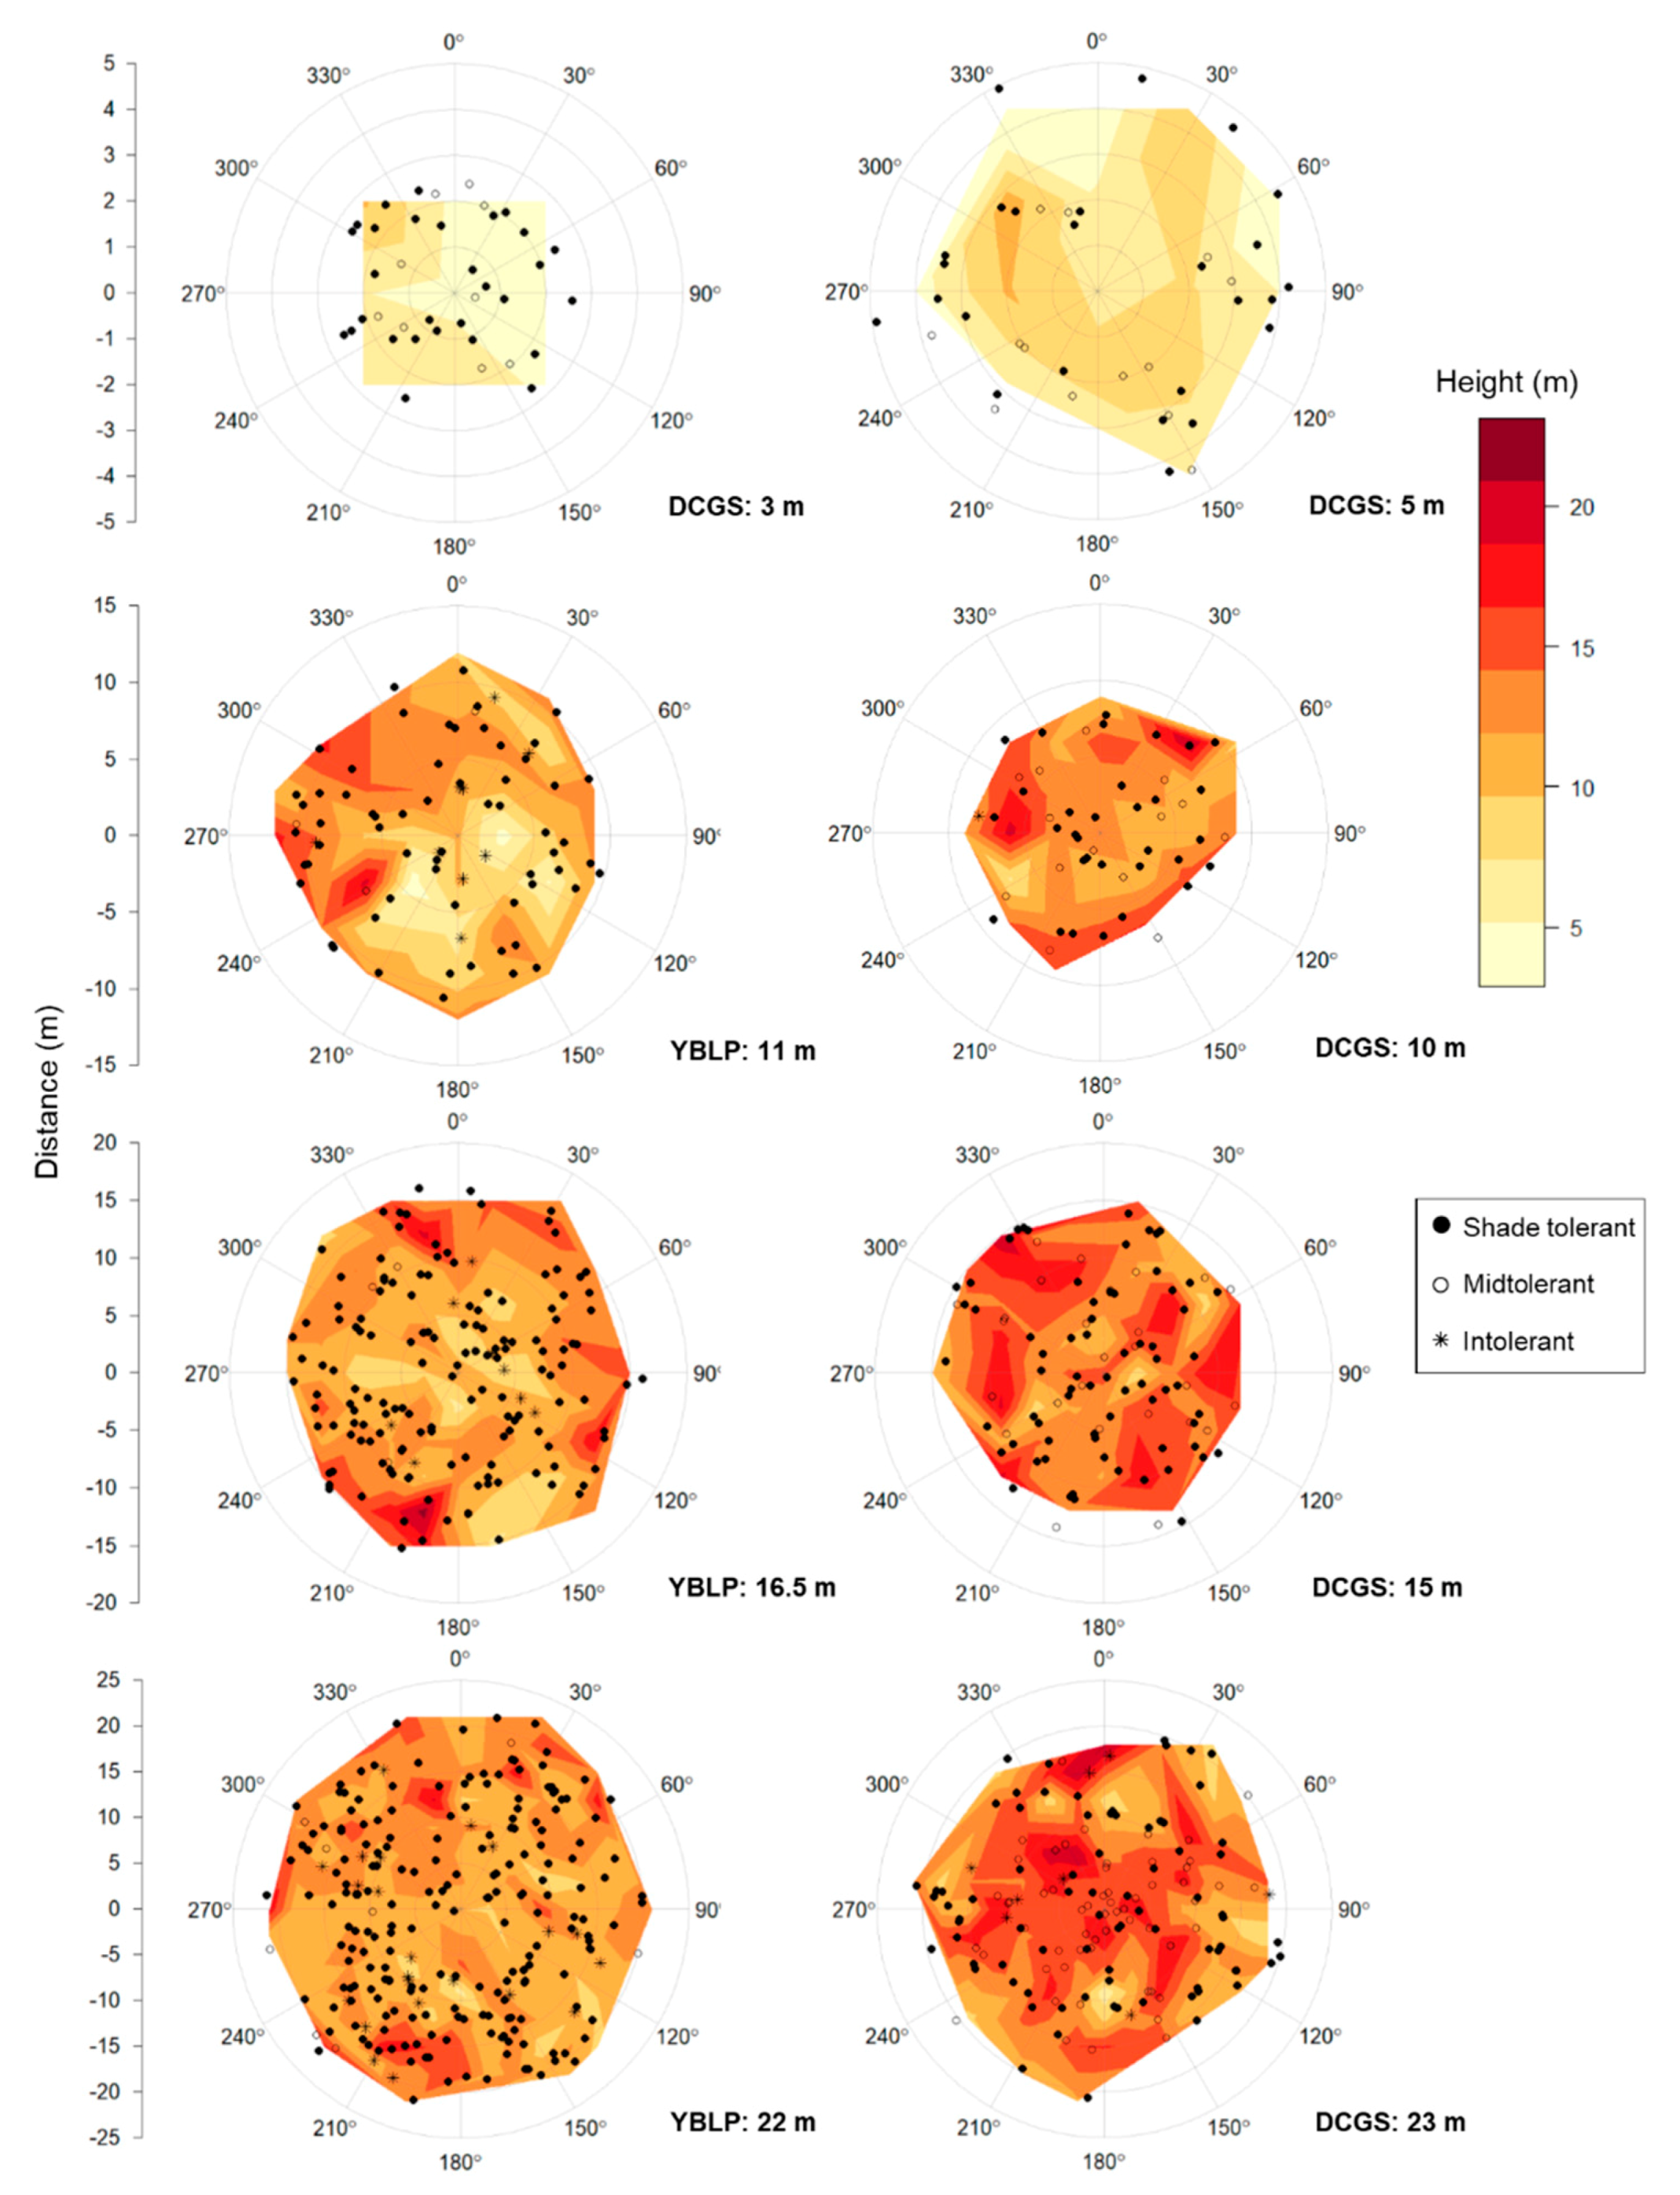

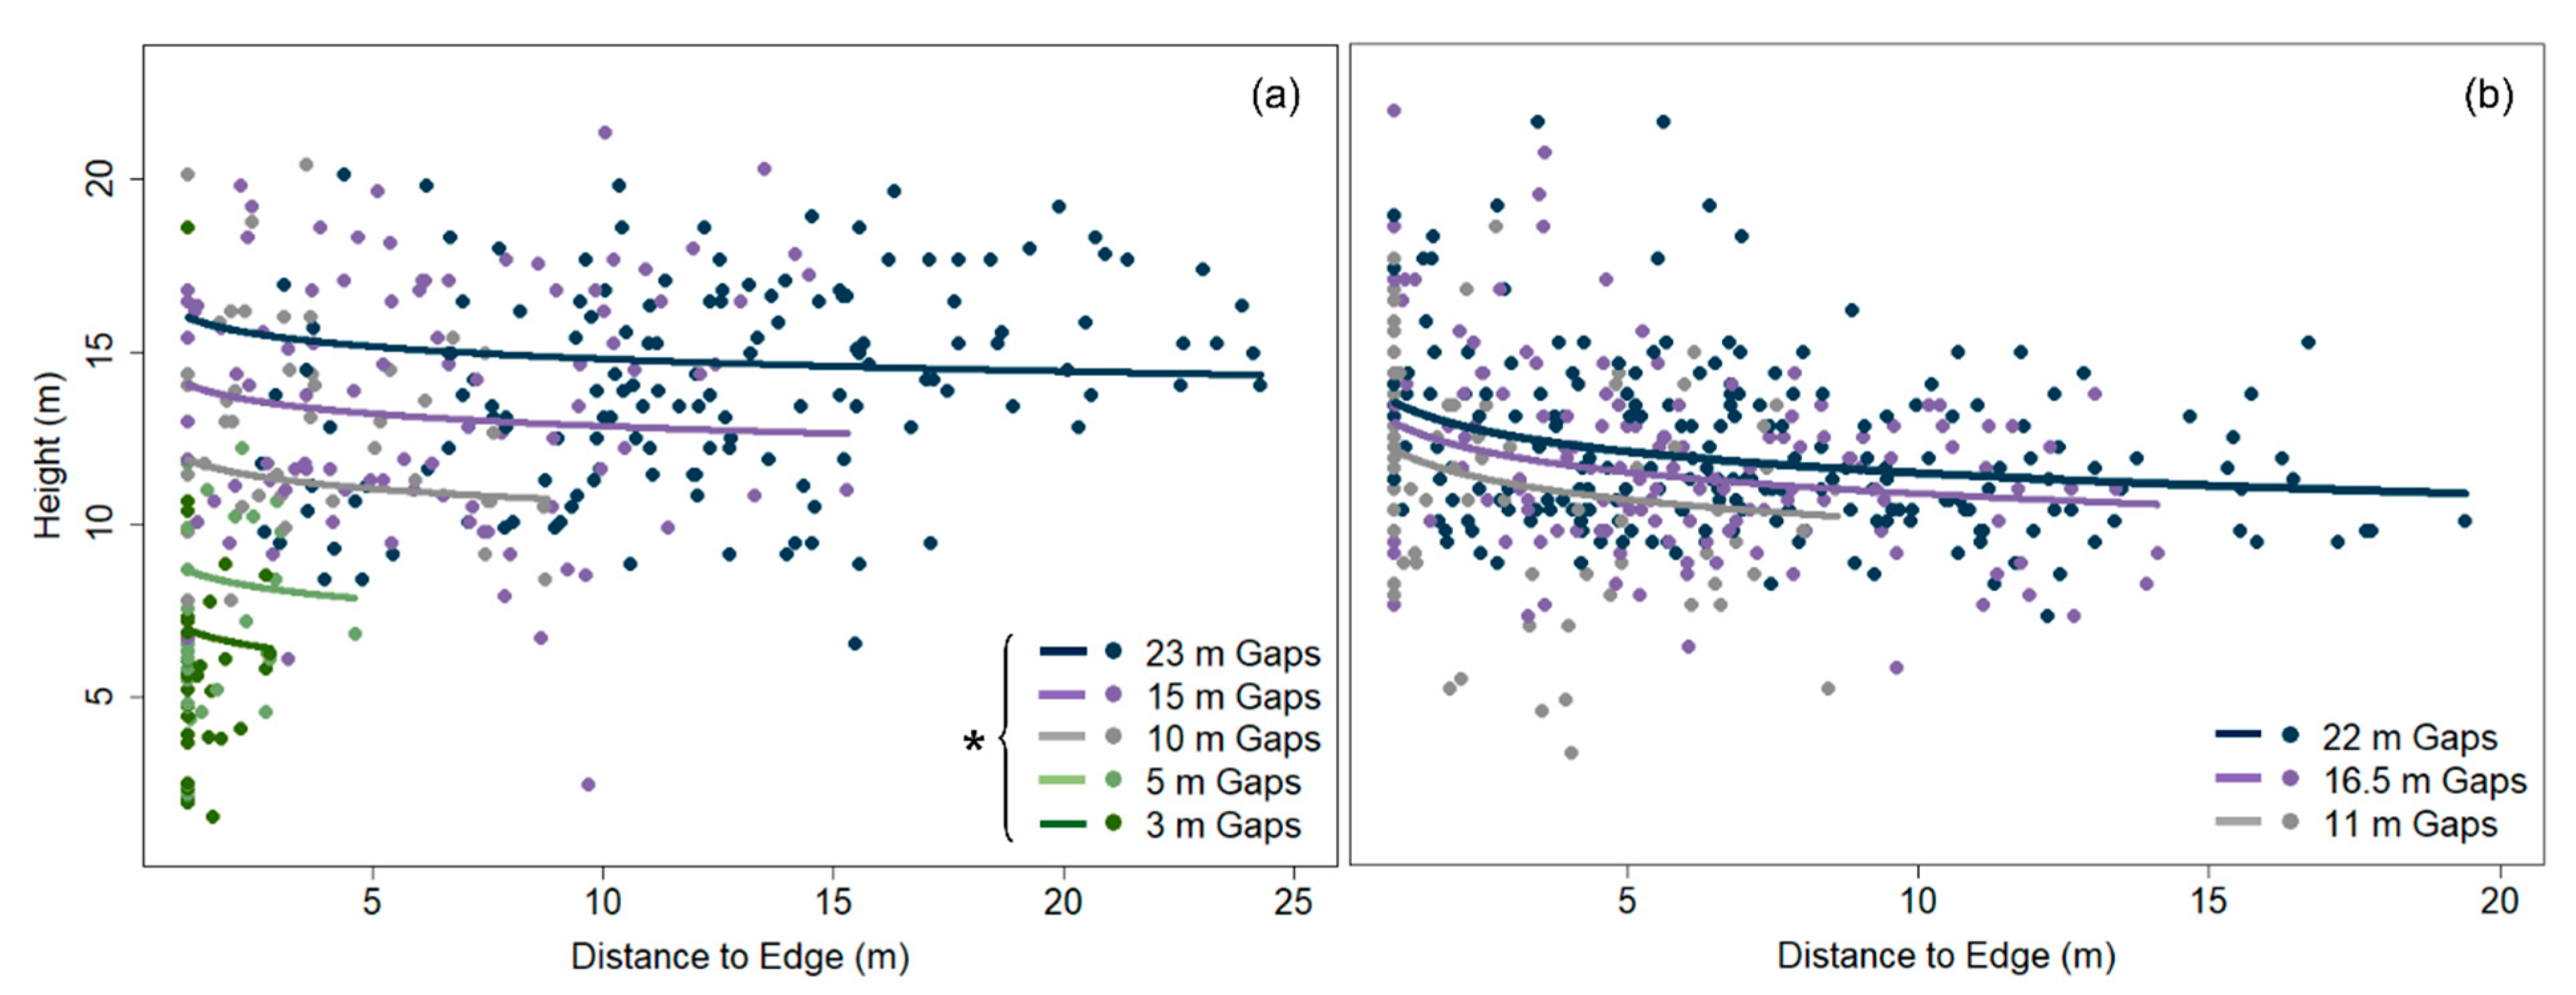
Table 1.
Shade tolerance classification of primary species present at two group-selection study sites in northern hardwood forests of the upper Great Lakes, USA. Table modified from Burns and Honkala [58]. Species marked with ‘X’ were found in each respective study site.
Table 1.
Shade tolerance classification of primary species present at two group-selection study sites in northern hardwood forests of the upper Great Lakes, USA. Table modified from Burns and Honkala [58]. Species marked with ‘X’ were found in each respective study site.
| Species | Shade Tolerance | DCGS | YBLP |
|---|---|---|---|
| Abies balsamea | Shade tolerant | X | X |
| Acer rubrum | Shade tolerant | X | X |
| Acer saccharum | Shade tolerant | X | X |
| Ostrya virginiana | Shade tolerant | X | X |
| Tilia americana | Shade tolerant | X | X |
| Tsuga canadensis | Shade tolerant | X | X |
| Betula alleghaniensis | Midtolerant | X | X |
| Corylus cornunta | Midtolerant | X | |
| Fraxinus americana | Midtolerant | X | |
| Picea glauca | Midtolerant | X | |
| Pinus strobus | Midtolerant | X | |
| Quercus rubra | Midtolerant | X | X |
| Ulmus americana | Midtolerant | X | X |
| Betula papyrifera | Intolerant | X | |
| Fraxinus nigra | Intolerant | X | |
| Juglans cinera | Intolerant | X | |
| Populus tremuloides | Intolerant | X | |
| Prunus serotina | Intolerant | X | X |
Table 2.
Species compositional differences of gap-capturing saplings (DCGS: 23 years post-harvest, YBLP: 15 years post-harvest) in group selection openings, reference canopies (year preceding harvests), and advance regeneration (2 years post-harvest) at two group-selection study sites in northern hardwood forests of the upper Great Lakes, USA. Groupings calculated with multiple response permutation procedures, and α = 0.05 was corrected for multiple comparisons with a false-discovery rate of 0.1.
| Treatment | n | Line Diagram | Grouping | |||
|---|---|---|---|---|---|---|
| Divide Canopy Gap Study | ||||||
| Reference Canopy | 24 | a | ||||
| Advance Regeneration | 60 | b | ||||
| Gap-capture saplings, 3 m gap | 12 | b | ||||
| Gap-capture saplings, 5 m gap | 12 | b | ||||
| Gap-capture saplings, 10 m gap | 12 | b | ||||
| Gap-capture saplings, 15 m gap | 12 | b | ||||
| Gap-capture saplings, 23 m gap | 12 | b | ||||
| Yellow Birch Legacy Tree Project | ||||||
| Reference Canopy | 23 | a | ||||
| Advance Regeneration | 49 | b | ||||
| Gap-capture saplings, 11 m gap | 16 | c | ||||
| Gap-capture saplings, 16.5 m gap | 17 | c | ||||
| Gap-capture saplings, 22 m gap | 16 | c | ||||
Table 3.
Linear mixed-effects model results of gap-capturing sapling height (DCGS: 23 years post-harvest, YBLP: 15 years post-harvest) predicted by gap area and distance to gap edge from two group-selection study sites in northern hardwood forests of the upper Great Lakes, USA. Both distances to edge and gap areas were natural-log transformed (ln (x + 1)) to meet assumptions of linearity and homoscedasticity and to improve model fit.
| Fixed Effects | Estimate | Standard Error | df | t-Value | Pr (>|t|) | Random Effect | Std Dev of Intercept | Std Dev of Residual |
|---|---|---|---|---|---|---|---|---|
| Divide Canopy Gap Study | ||||||||
| Gap area | 2.108 | 0.240 | 50 | 8.766 | <0.0001 | Gap ID in Block | 2.178 | 2.382 |
| Distance to edge | −0.505 | 0.303 | 294 | −1.667 | 0.0966 | |||
| Yellow Birch Legacy Tree Project | ||||||||
| Gap area | 1.003 | 0.380 | 47 | 2.638 | 0.0113 | Gap ID | 1.237 | 2.285 |
| Distance to edge | −0.942 | 0.148 | 413 | −6.380 | <0.0001 | |||
© 2019 by the authors. Licensee MDPI, Basel, Switzerland. This article is an open access article distributed under the terms and conditions of the Creative Commons Attribution (CC BY) license (http://creativecommons.org/licenses/by/4.0/).
Share and Cite
MDPI and ACS Style
Knapp, S.P.; Webster, C.R.; Kern, C.C. The Composition and Height of Saplings Capturing Silvicultural Gaps at Two Long-Term Experiments in Managed Northern Hardwood Forests. Forests 2019, 10, 855. https://doi.org/10.3390/f10100855
AMA Style
Knapp SP, Webster CR, Kern CC. The Composition and Height of Saplings Capturing Silvicultural Gaps at Two Long-Term Experiments in Managed Northern Hardwood Forests. Forests. 2019; 10(10):855. https://doi.org/10.3390/f10100855
Chicago/Turabian StyleKnapp, Samuel P., Christopher R. Webster, and Christel C. Kern. 2019. "The Composition and Height of Saplings Capturing Silvicultural Gaps at Two Long-Term Experiments in Managed Northern Hardwood Forests" Forests 10, no. 10: 855. https://doi.org/10.3390/f10100855
Note that from the first issue of 2016, this journal uses article numbers instead of page numbers. See further details here.