High Sulfate Attack Resistance of Reinforced Concrete Flumes Containing Liquid Crystal Display (LCD) Waste Glass Powder


1
Department of Civil Engineering, Kumoh National Institute of Technology, Gumi-si, Gyeongsangbuk-do 39177, Korea
2
Department of Architectural Engineering, Kyung Hee University, Yongin-si, Gyeonggi-do 17104, Korea
*
Author to whom correspondence should be addressed.
Materials 2019, 12(12), 2031; https://doi.org/10.3390/ma12122031
Submission received: 30 May 2019
/
Revised: 18 June 2019
/
Accepted: 19 June 2019
/
Published: 25 June 2019
(This article belongs to the Special Issue Deformation, Fatigue and Fracture of Materials)
Abstract
:To prevent chemical erosion of concrete and improve chemical resistance, reinforced concrete flumes were manufactured, conforming to the Korean Industrial Standards (KS). Two different sizes of liquid crystal display (LCD) waste glass powder (LWGP) particles were used (i.e., 5 and 12 µm) with two substitution types with cement in concrete (i.e., 10% and 20%). Changes in compressive strength, pore structure, weight, volume, and strength of the concrete flumes after immersion in two sulfate solutions (i.e., Na2SO4 and MgSO4) for 84 and 182 days were measured for sulfate attack resistance. The applicability of the LWGP concrete flume with a 0.5 mm crack width was also evaluated based on the bending strength results. The LWGP5, which has a smaller particle size among LWGPs, filled the smaller pores, thereby reducing the porosity and contributing to the compressive strength gain. Higher volume and weight change ratios for all specimens immersed in MgSO4 solution were found than those immersed in Na2SO4 solution under identical conditions. Flexural loads of all the LWGP concrete flumes with 0.05 mm crack widths were greater than 48.5 kN, as required by the KS code; however, these flexural loads were lower than those of ordinary Portland cement. The applicability was also validated via a flexural test complying with KS.
1. Introduction
In recent years, technological development of concrete materials has enabled the design of enlarged, high-rise, and multi-functional structures and plays a pivotal role in protecting human lives and properties from various disasters. Concrete structures have been designed and constructed to fulfill the same requirements as those of multi-functional structures. However, the durability of concrete structures in a marine condition and in wastewater treatment facilities in severe environments easily deteriorates from chemical erosion and often causes structural problems [1,2,3]. In particular, reinforced concrete flumes are most commonly used in flow water, sewage, and wastewater plants. The durability of such flumes reduces because of various pollutants contained in water [4,5,6,7,8,9].
Several studies have aimed at incorporating various binders together with cement to prevent chemical erosion of concrete and improve chemical attack resistance. In particular, the incorporation of pozzolanic materials produces a C–S–H phase within the cement matrix, which further densifies the cement matrix. It reduces permeability and improves the durability of concrete by suppressing the pore continuity.
Meanwhile, Korea’s investment in the LCD industry is as high as 27 billion USD per year, with a production of over 480,000 panels per month (the 8th generation, 50 inches) [10]. The composition of LCD waste glass occasionally fluctuates because of the use of different products. Therefore, LCD waste glass recycling is difficult in a field that is sensitive to composition change [11]. As most waste LCD is incinerated or buried, it wastes resources and causes various types of environment pollution on a national scale [12].
LCD contains SiO2 as the main component, which is similar to silica fume (SF), fly ash (FA), and blast furnace slag (BS); these components improve the pozzolanic reactivity. The replacement dosage of cement and the high fineness of the LCD waste glass powder (LWGP) are considered appropriate for durability improvement. Although the substitution of cement with LWGP improves durability as well as mechanical and microstructural properties, the deterministic characteristics of LCD glass powder particles include particle size/surface area and the substitution amount [13,14,15,16,17,18].
Herein, concrete containing 10% and 20% of LWGP was mixed with ordinary Portland cement (OPC). Sodium sulfate (Na2SO4) and magnesium sulfate (MgSO4) were used as solution for simulation of the sulfate-bearing environments. Changes in compressive strength, volume, and weight caused by chemical erosion were measured and compared. Based on these results, concrete flumes with an improved chemical resistance were fabricated to conform to the Korean Industrial Standards (KS F 4010) [19]. The applicability of the LWGP concrete flume was then evaluated based on the bending strength results when crack widths of 0.05 mm were first generated. A new concrete channel using LWGP was developed herein, which could increase the resistance of the concrete structures to sulfate attack.
2. Materials and Experimental Methods
2.1. Material Characterization and Mix Properties
OPC and two different types of LWGP were used as the primary binder in this experimental study. LWGP were prepared by grinding the LCD glass [13]. Table 1 shows the chemical properties of OPC and LWGP. The LWGP, with mean particle sizes of 5 and 12 µm and consisting of SiO2 (69%), Al2O3 (19%), and CaO (10%), was used as the admixture similar to the fly ash used as the concrete binder. In order to minimize the multi-degradation originating from carbonate aggregates (i.e., limestone-based aggregates) on the specimens [20,21], local cleaned river sand passed through 5 mm and crushed stone with a maximum size of 25 mm were used for fine and coarse aggregates, respectively. Its physical properties are presented in Table 2. The LWGP was made out of films with defects, which were collected from the manufacturing process, such as cutting or scribing [22]. They were not collected from the products after use. Borosilicate glass with an average thickness of 0.4 to 1.1 mm, which did not contain heavy metal, was used to make the LWGP. LWGP5 and LWGP12 with different mean particle sizes and a specific gravity of 2.79 and 2.81 replaced every 10% of the weight of OPC up to 20% as shown in Table 3.
2.2. Test for Slump of the LWGP Concrete (KS F 2402)
Concrete slump was checked according to KS F 2402 [25] (Figure 1). The mold shell was used in this test with the following dimension: The top was 100mm in diameter; the base as 200mm in diameter; the height was 300mm; and the thickness was 1.5 mm. The mold was removed immediately from the concrete when filled. Concrete compaction of 25 times was performed for every 1/3 fill, and the height of collapse was measured shortly after the slump cone was removed.
2.3. Test for the Compressive Strength of Concrete (KS F 2405)
2.4. Test for the Porosity and Pore Size Distribution
Mercury intrusion porosimetry (MIP) using Micromeritics (Autopore IV 9500, Micromeritics Instrument Corp., Georgia, USA) was implemented to measure the concrete porosity ratio and distribution of the concrete specimens with a 1.0 cm3 volume as a function of the replacement ratios. The water was totally dried out under a 105 °C after the specimens were submerged in an alcoholic solution for a week to halt hydration.
2.5. Test for the Sulfate Attack Resistance of Concrete
The cured specimens at 28 days were immersed in a solution of 5% Na2SO4 and MgSO4 to measure the reduction ratios of the volume, weight, and the changes of the compressive strength at 84 and 182 days. The LWGP concrete specimens cured in water for 28 days were immersed for 182 days. The used sodium sulfate and magnesium sulfate solutions were prepared according to the American Society for Testing and Materials (ASTM) C 1012 standards [27]. The solution used in the experiment was replaced by new solution every 30 days of immersion considering factors, such as moisture loss due to evaporation. The temperature of the experiment condition was kept constant at 23 ± 2 °C and the solution was stirred periodically so that the solution concentration in the immersion containers was uniformly distributed.
2.6. Manufacturing LWGP Concrete Flumes
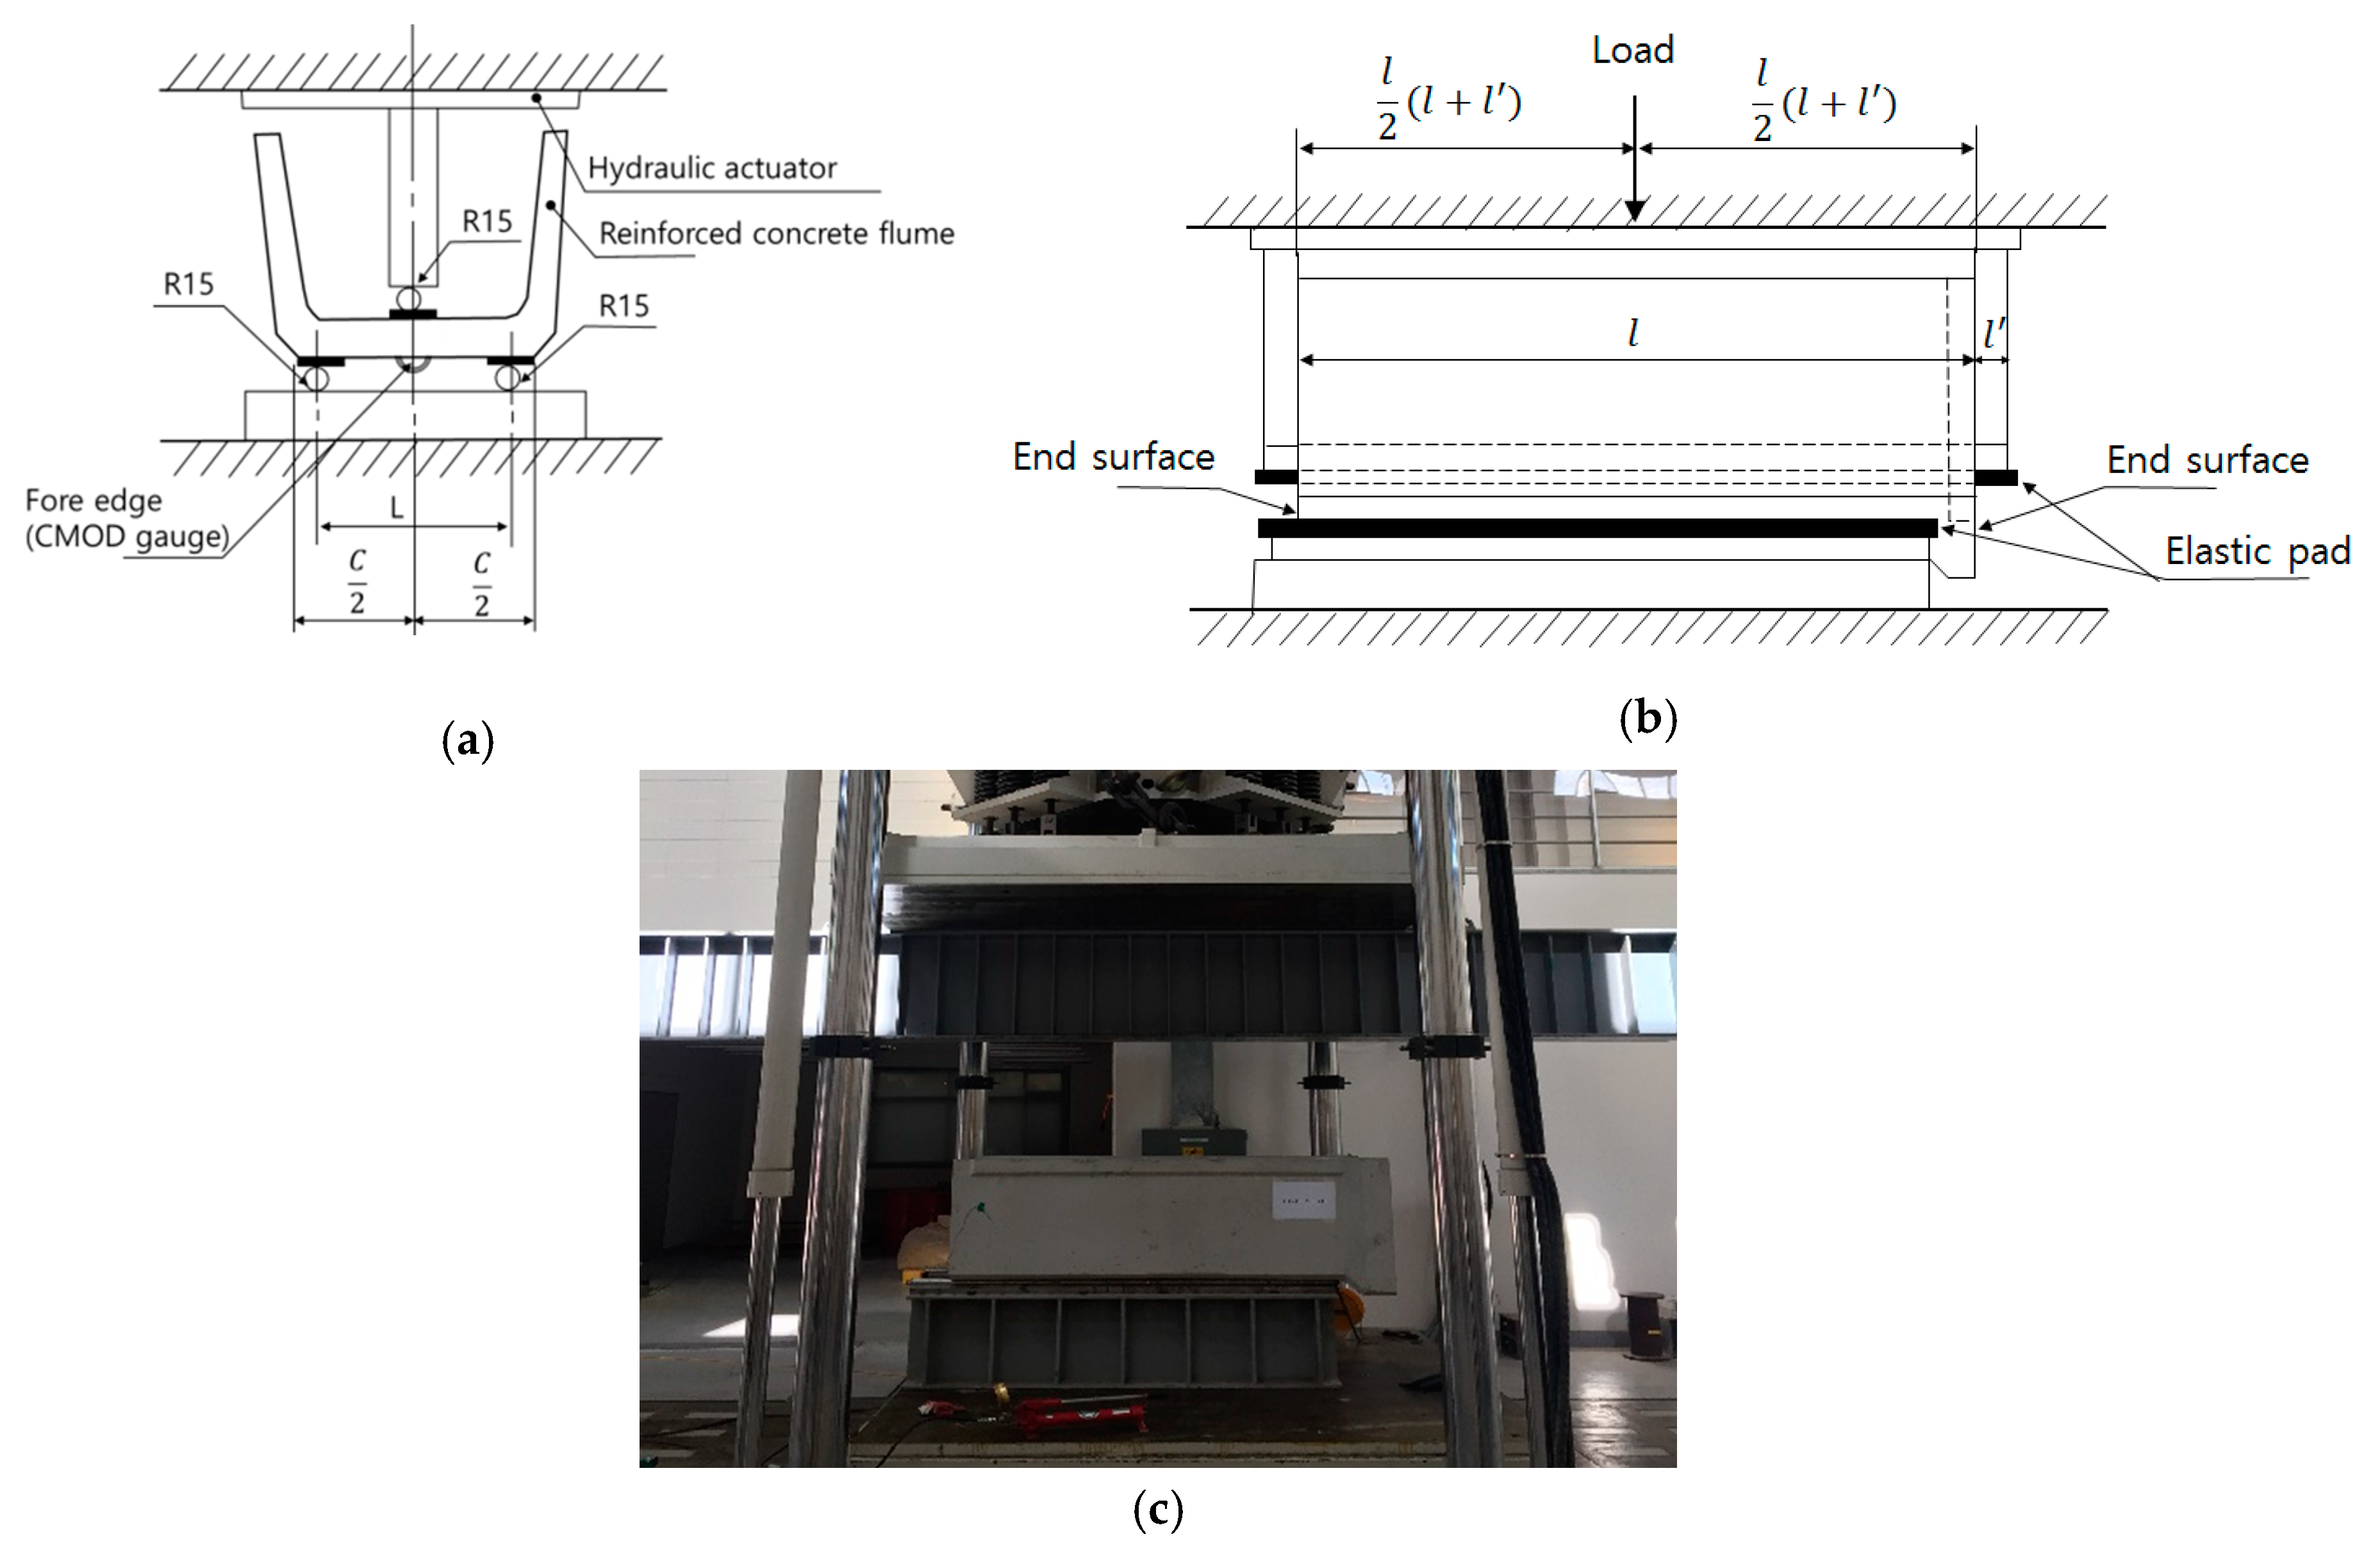
Figure 2 shows that the reinforced concrete flume type Ⅲ identical to those used in the site were manufactured under 600 C (L = 2000 mm) according to KS F 4010 [19]. The 10% and 20% cement weight was replaced by concrete using the LWGP. Manufacturing was done under the curing condition identical to that in the construction site. Figure 2a shows the cross-sectional dimensions of the fabricated specimen and 2b shows the dimensions of the side view. Figure 2c shows the specimens produced at the manufacturing site.
2.7. Flexural Loads of the LWGP Concrete Flumes
Figure 3c shows the test setup for the LWGP concrete flumes. The load was applied at the mid-point of the loading pad, which was installed longitudinally (l = 2000 mm as shown in Figure 3b). The load applied on the loading pad per 1 mm/min was measured. The length of the LWGP concrete flumes was 550 mm (L) according to KS F 4010 [19] under 600 °C. The Crack Mouth Opening Displacement (CMOD) gauge was attached to the end of the LWGP concrete flumes to measure the crack width caused by the loads (Figure 3a).
3. Results and Discussion
3.1. Slump
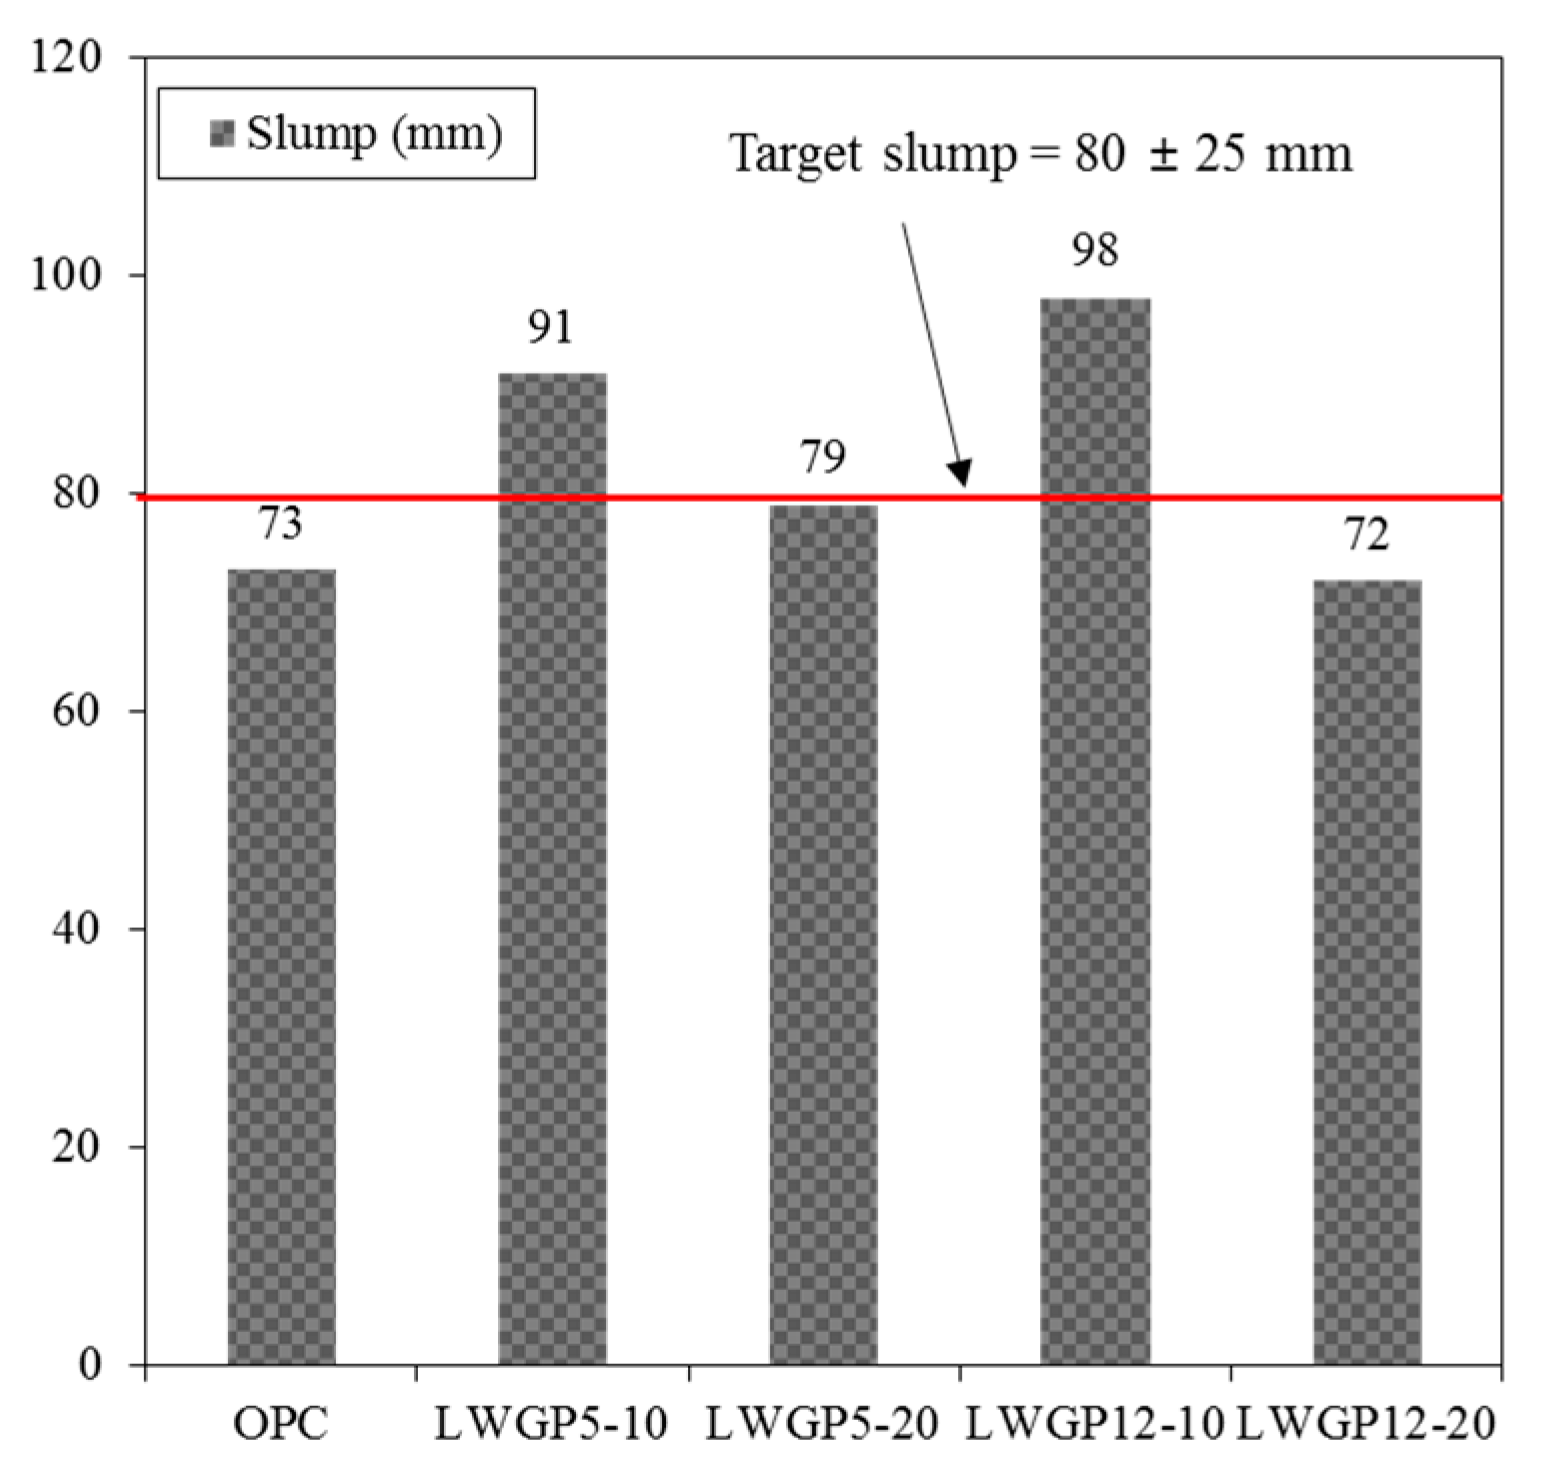
Figure 4 shows that slumps less than the target values of 80 ± 25 mm set for construction at a site were obtained. The slump of OPC was 73 mm, thereby meeting the target slump. A high slump was observed at the replacement ratio of 10%, regardless of the cement diameter. In contrast, a low slump was measured at the replacement ratio of 20% because the LWGP had angular and pyramidal shapes; hence, they increased the contact areas with adjacent cement particles, which increased the cohesion and reduced the mobility between them.
3.2. Changes in Weight and Volume
The LWGP-mixed concrete was immersed in a solution of 10% Na2SO4 and MgSO4 for 182 days to evaluate the resistance to sulfate attack by measuring the weight and volume according to ASTM C 1012 [27]. As shown in Figure 5, the blended specimen exhibited a lower reduction ratio of the weight and the volume compared with OPC, regardless of the sulfate type. The influence of the LWGP-mixed concrete was noticeable when Na2SO4 was used. This phenomenon may be caused by the matrix porosity. The sulfate ions that intruded the concrete initially reacted with calcium hydroxide to form ettringite and gypsum, which continuously accumulated within the pores. In turn, the amounts of hydration products caused the dilatation of the concrete and generating an internal stress around the matrix, followed by cracking. The calcium hydroxide depletion induced the decalcification of the hydration products, thereby resulting in a dissolution of the C–S–H gel and a subsequent increase of the matrix porosity [28,29,30]. Consequently, the flexural and compressive strengths of the concrete structures would gradually be reduced with the increase of the decalcification degradation, along which the matrix structure collapsed. However, according to Yang et al. [31], the rate of the ionic transport is affected by the pore structure, especially the capillaries in the cement matrix. The LWGP-mixed concrete, possessing the lower porosity at the capillaries, may perform the reduced ingress of aggressive ions into the concrete, enhancing the resistance to a sulfate attack resulting from the limited reaction between the sulfates and the hydrates. The higher resistance against sulfate ingress was caused by the reduction of Ca(OH)2 because of the pozzolanic reaction obtained from the replacement of the LWGP powder in the concrete. Regardless of the mixture of the LWGP powders, the reduction ratios of the weight and the volume for concretes were smaller when they were immersed in the MgSO4 solution than in the Na2SO4 solution for 182 days. This result can be attributed to the reaction between the Mg2+ ions and the hydrates formed in the matrix. According to Lee [4,32], the OH− and Mg2+ ions in the pore water reacted to form magnesium hydroxide (Mg(OH)2) at early exposure periods, as well as the formation of gypsum and ettringite, filling the voids within the matrix (i.e., micro-filler effect). Therefore, the penetration resistance of ions into the concrete substituted by the LWGP increased with exposure duration to MgSO4 solution, which is validated by the time-dependent behavior of concrete deterioration, implying change of the pore structure. The deterioration by sulfates also decreased at the early ages. However, in the long-term periods, the deterioration of concrete exposed to the MgSO4 solution would be accelerated because of an increase of the stress inside the concrete arising from the accumulation of hydrates [33,34]. Furthermore, the C–S–H gel, which is responsible for the concrete strength, can be transformed into the M–S–H gel by the ion exchange caused by the excessive Mg2+ ions in the pore solution [34,35]. Consequently, the volume and the weight change ratios for all the specimens immersed in the MgSO4 solution showed a higher value at 182 days of exposure compared with that in the Na2SO4 solution at an identical condition.
3.3. Compressive Strength and Strength Change
The compressive strengths of the concrete mixed with the LCD powder are shown in Figure 6, in which the compressive strengths were obtained for five cases with different diameters and replacement ratios (i.e., OPC, LWGP5-10, LWGP5-20, LWGP12-10, and LWGP12-20).
Note that the high strengths of concrete at an early age (7 days) were produced when the mean particle diameter of 5 μm with 10% and 20% replacement ratios was used. Similar cases were observed with the mortar test. However, the compressive strengths decreased when the substituting ratio increased to 20%. However, the LWGP12 with large average diameters showed a strength smaller than that of OPC, regardless of the substituting ratios. The LCD cement showed compressive strengths slightly smaller for the diameter of 12 μm; however, the compressive strengths were higher for cement with a 5 μm diameter (Figure 6). This phenomenon may be caused by the fact that the Si and Al ions in the LWGP reacted with the Ca ions, which were included in the pore solution, to form the C–S–H and C–A–H gels, thus producing a dense and more compact matrix [13].
The LWGP5 with small average diameters exhibited a higher strength from 7 days, which resulted in a noticeable strength increase at 28 days, showing the influence of diameters on the strength. When made of finer powders and smaller diameters, the LWGP-mixed concrete could result in an active pozzolanic reaction, leading to an increase in both strength and durability.
The compressive strengths (KS F 2405 [26]) for the LWGP-mixed concrete exposed to the sulfate solutions were measured to explore the mechanical changes. Figure 7 shows the variation of the compressive strength for the concrete containing LWGP powder under sulfate-bearing environments. The un-bond capping method was used to minimize the measurement errors caused by the surface damage. The reduction ratios of the compressive strength of the LWGP powder, which was smaller compared with that of OPC, were observed under circumstances, including exposure duration and sulfate types. The LWGP powder not only filled the voids physically, but also led to a densification of the cement matrix caused by secondary reactions. This would induce a decreased porosity at the capillary pores and lead to a difference of the resistance from a sulfate attack. A relatively rapid strength decrease was observed because of the additional Mg-based hydration products formed when immersed in the MgSO4 solution, leading to a limited strength activation caused by the M–S–H gel formation. The strength reduction trends were similar to those observed with the weight and the volume. The chemical resistance of the concrete exposed to the sea waters and underground waters can be provided by adjusting the replacement ratios.
3.4. Pore Distribution of the Concrete Blended with the LWGP Powder
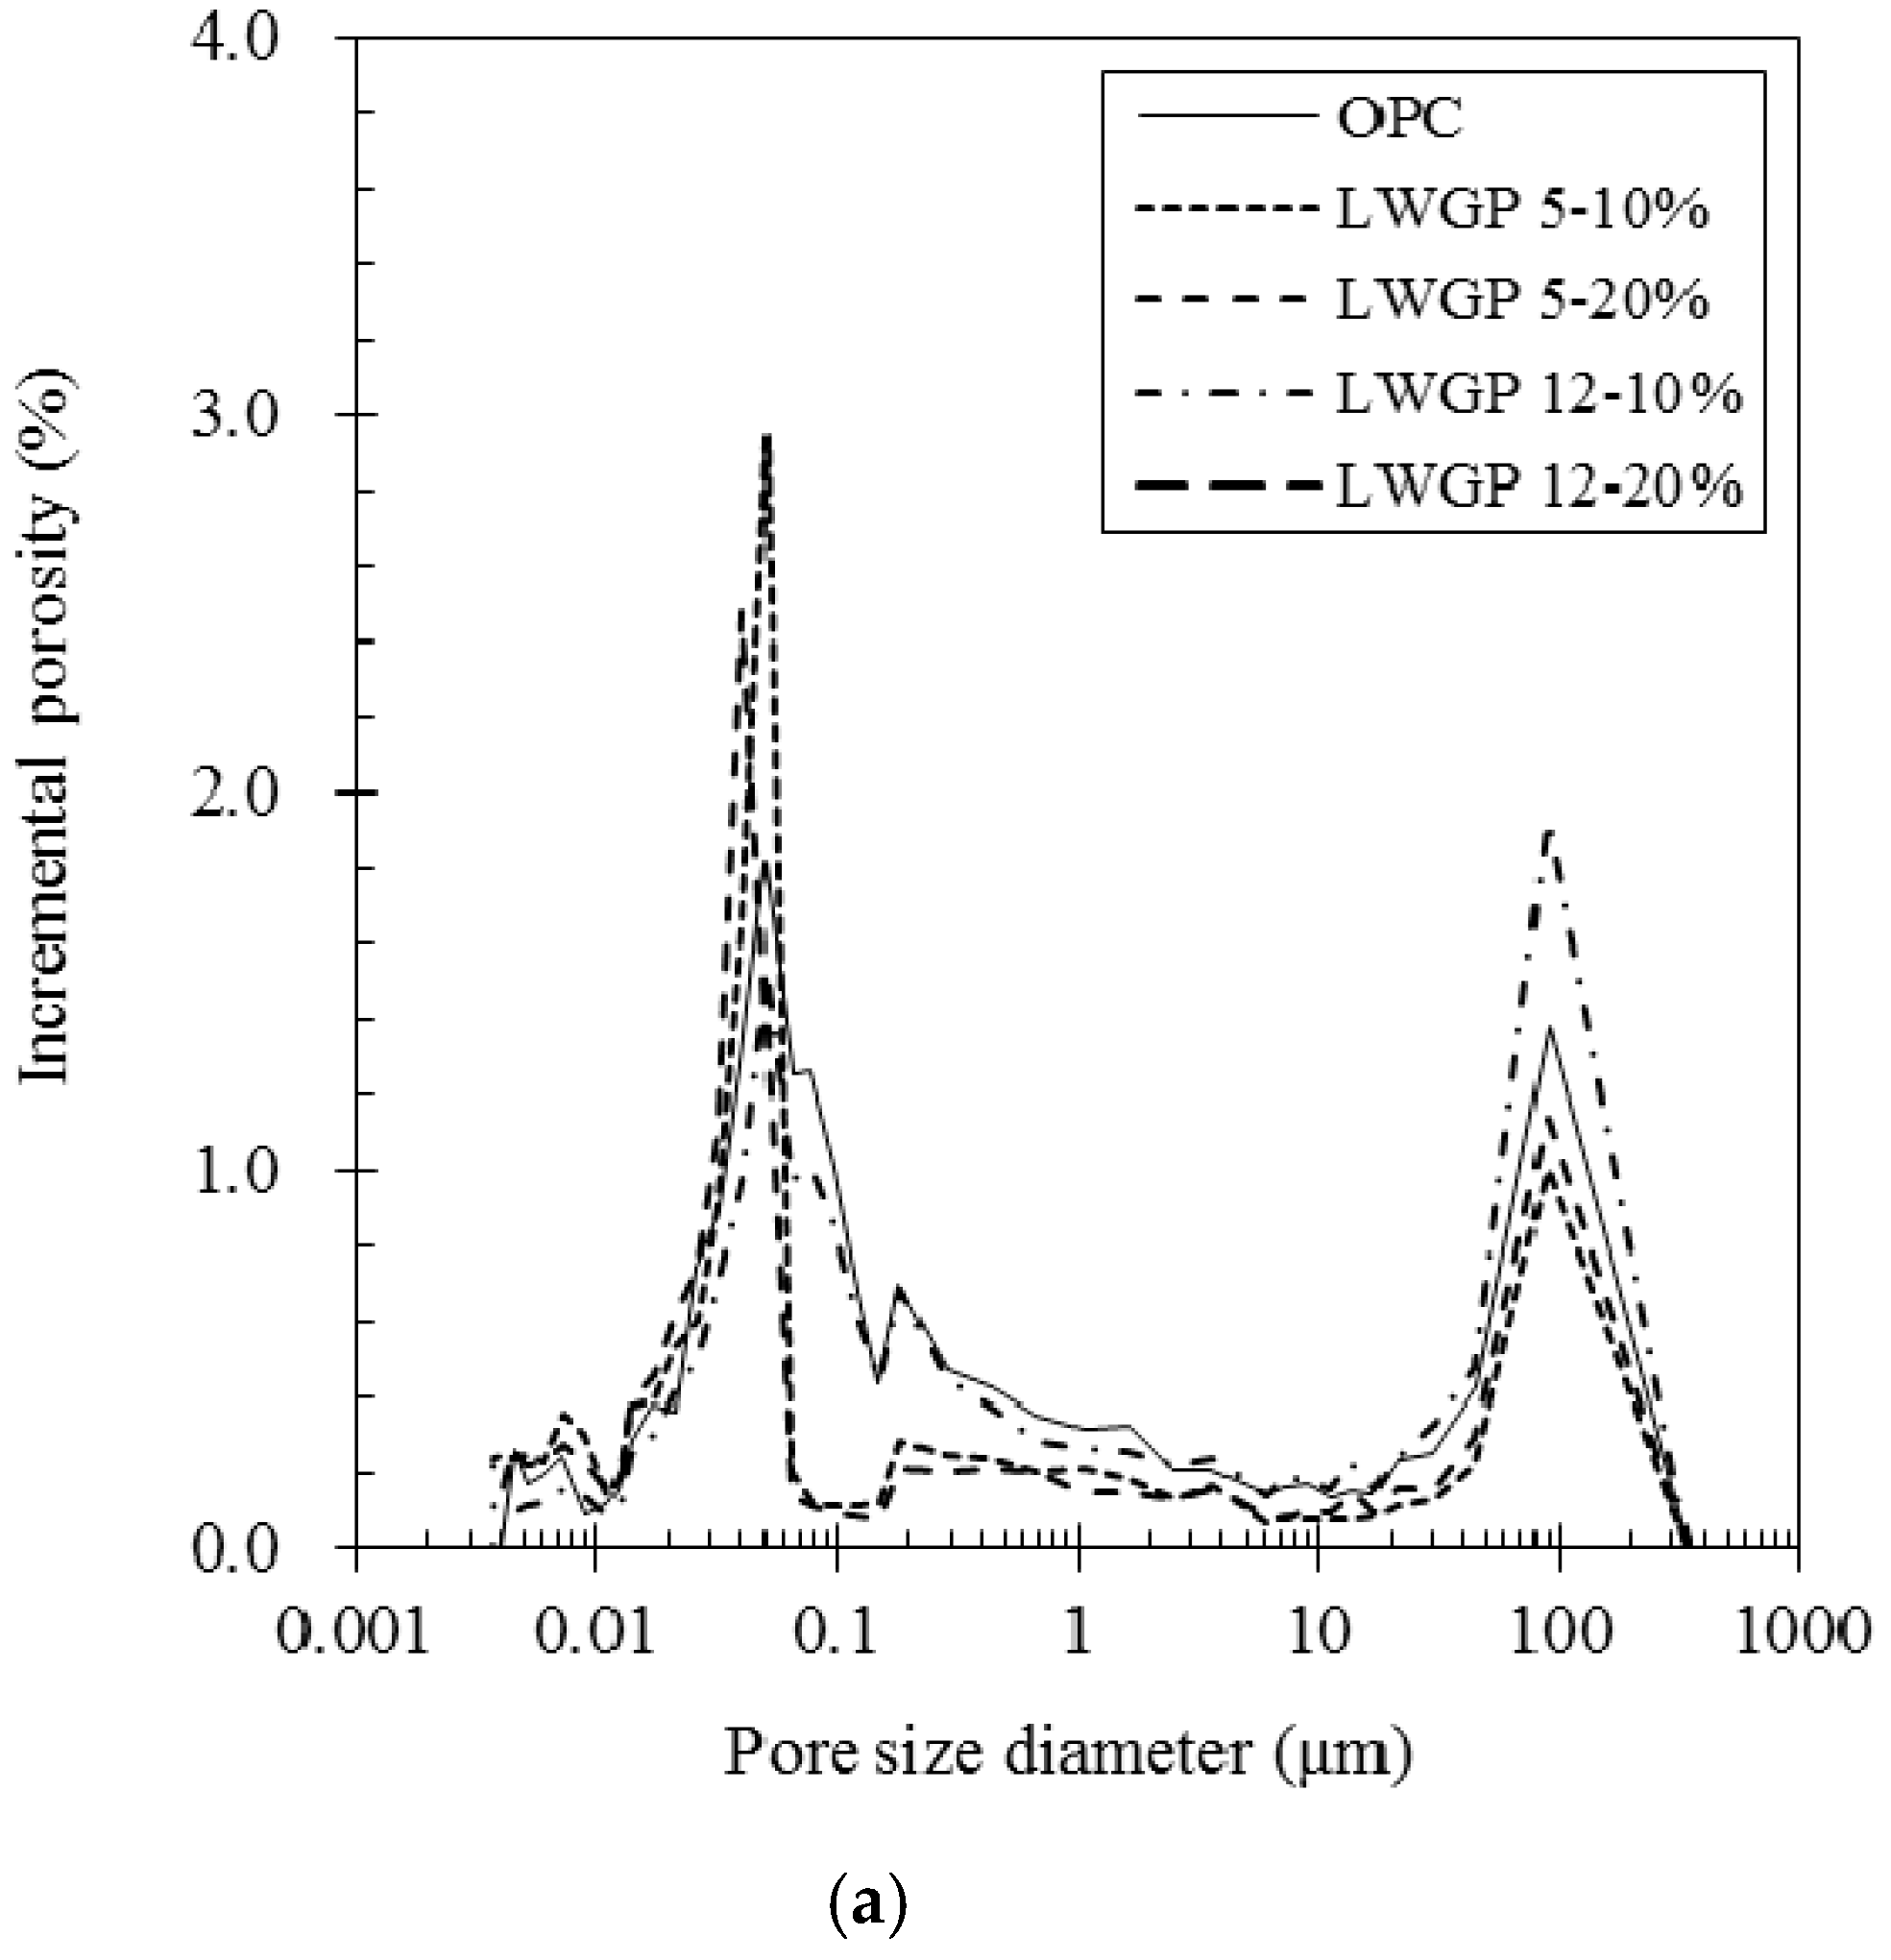
The importance of the pore distribution in the matrix must be expressed. Materials with the same pore size can perform completely differently because of the pore size and dispersion [36,37]. The pore distribution of the blended concretes was measured at 28 days using the MIP, of which the samples (approximately 1.0 cm3 in the volume) were obtained from concrete for the compressive strength. The pore size was divided into four groups: 1) Voids: >10 μm; large capillaries: 0.05–10 μm; medium capillaries: 0.01–0.05 μm; and small capillaries: <0.01 μm [38].
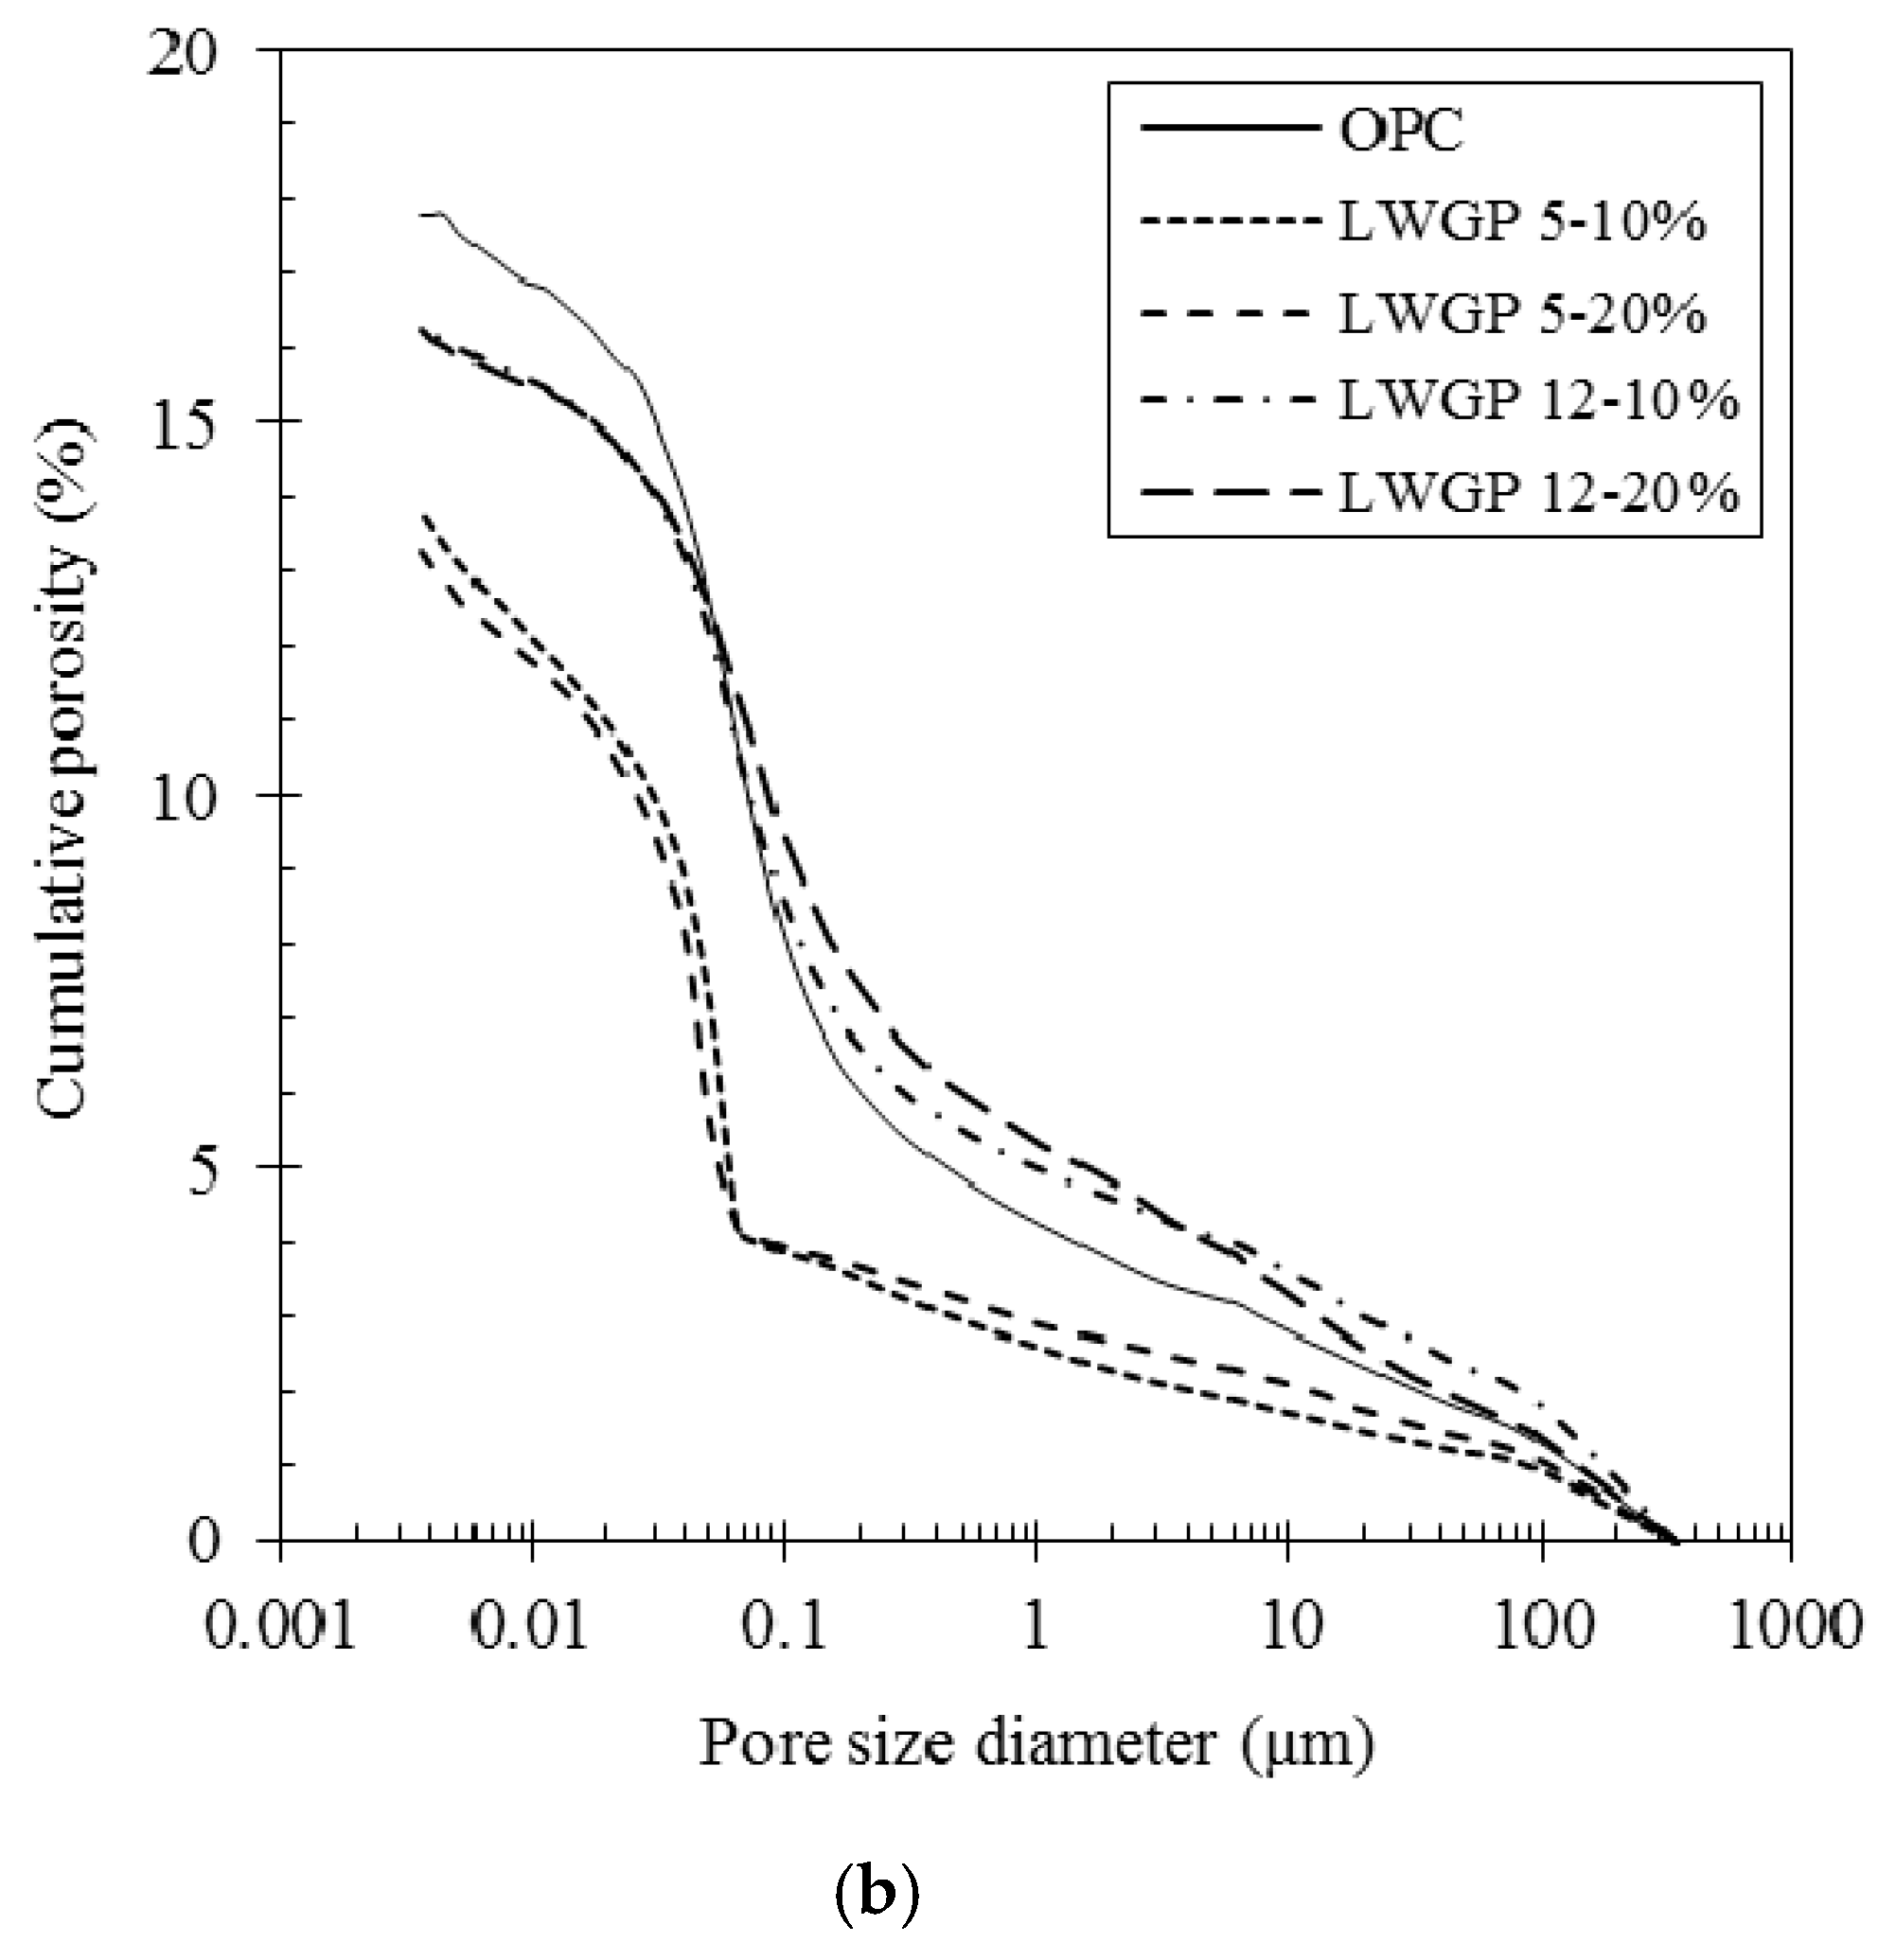
The pore decrease of the concrete containing the LWGP powder is elucidated in Table 4 and Figure 8, which show that the pores of OPC of 17.79% are the greatest, followed by the LWGP12-10 (16.32%), LWGP12-20 (16.24%), LWGP5-10 (13.79%), and LWGP5-20 (13.27%). Figure 8a shows the incremental porosity by the pore size diameter of the specimens and Figure 8b shows the cumulative porosity by the pore size diameter of the specimens. The capillary pores were found to be similar to the compressive strength at 28 days because of the pozzolanic reaction by the LWGP. The capillary pores occupied by Ca(OH)2 decreased, whereas the gel pores increased by forming the C–S–H gel as the time elapsed. This result led to a pore reduction and a higher strength development [39]. However, both quantitative and qualitative studies on the gel pores, including test and analysis (e.g., nitrogen and helium absorption methods), are necessary for in-depth investigations because the measurement by the MIP adopted herein only provided limited information on the gel pores.
3.5. Flexural Capacity
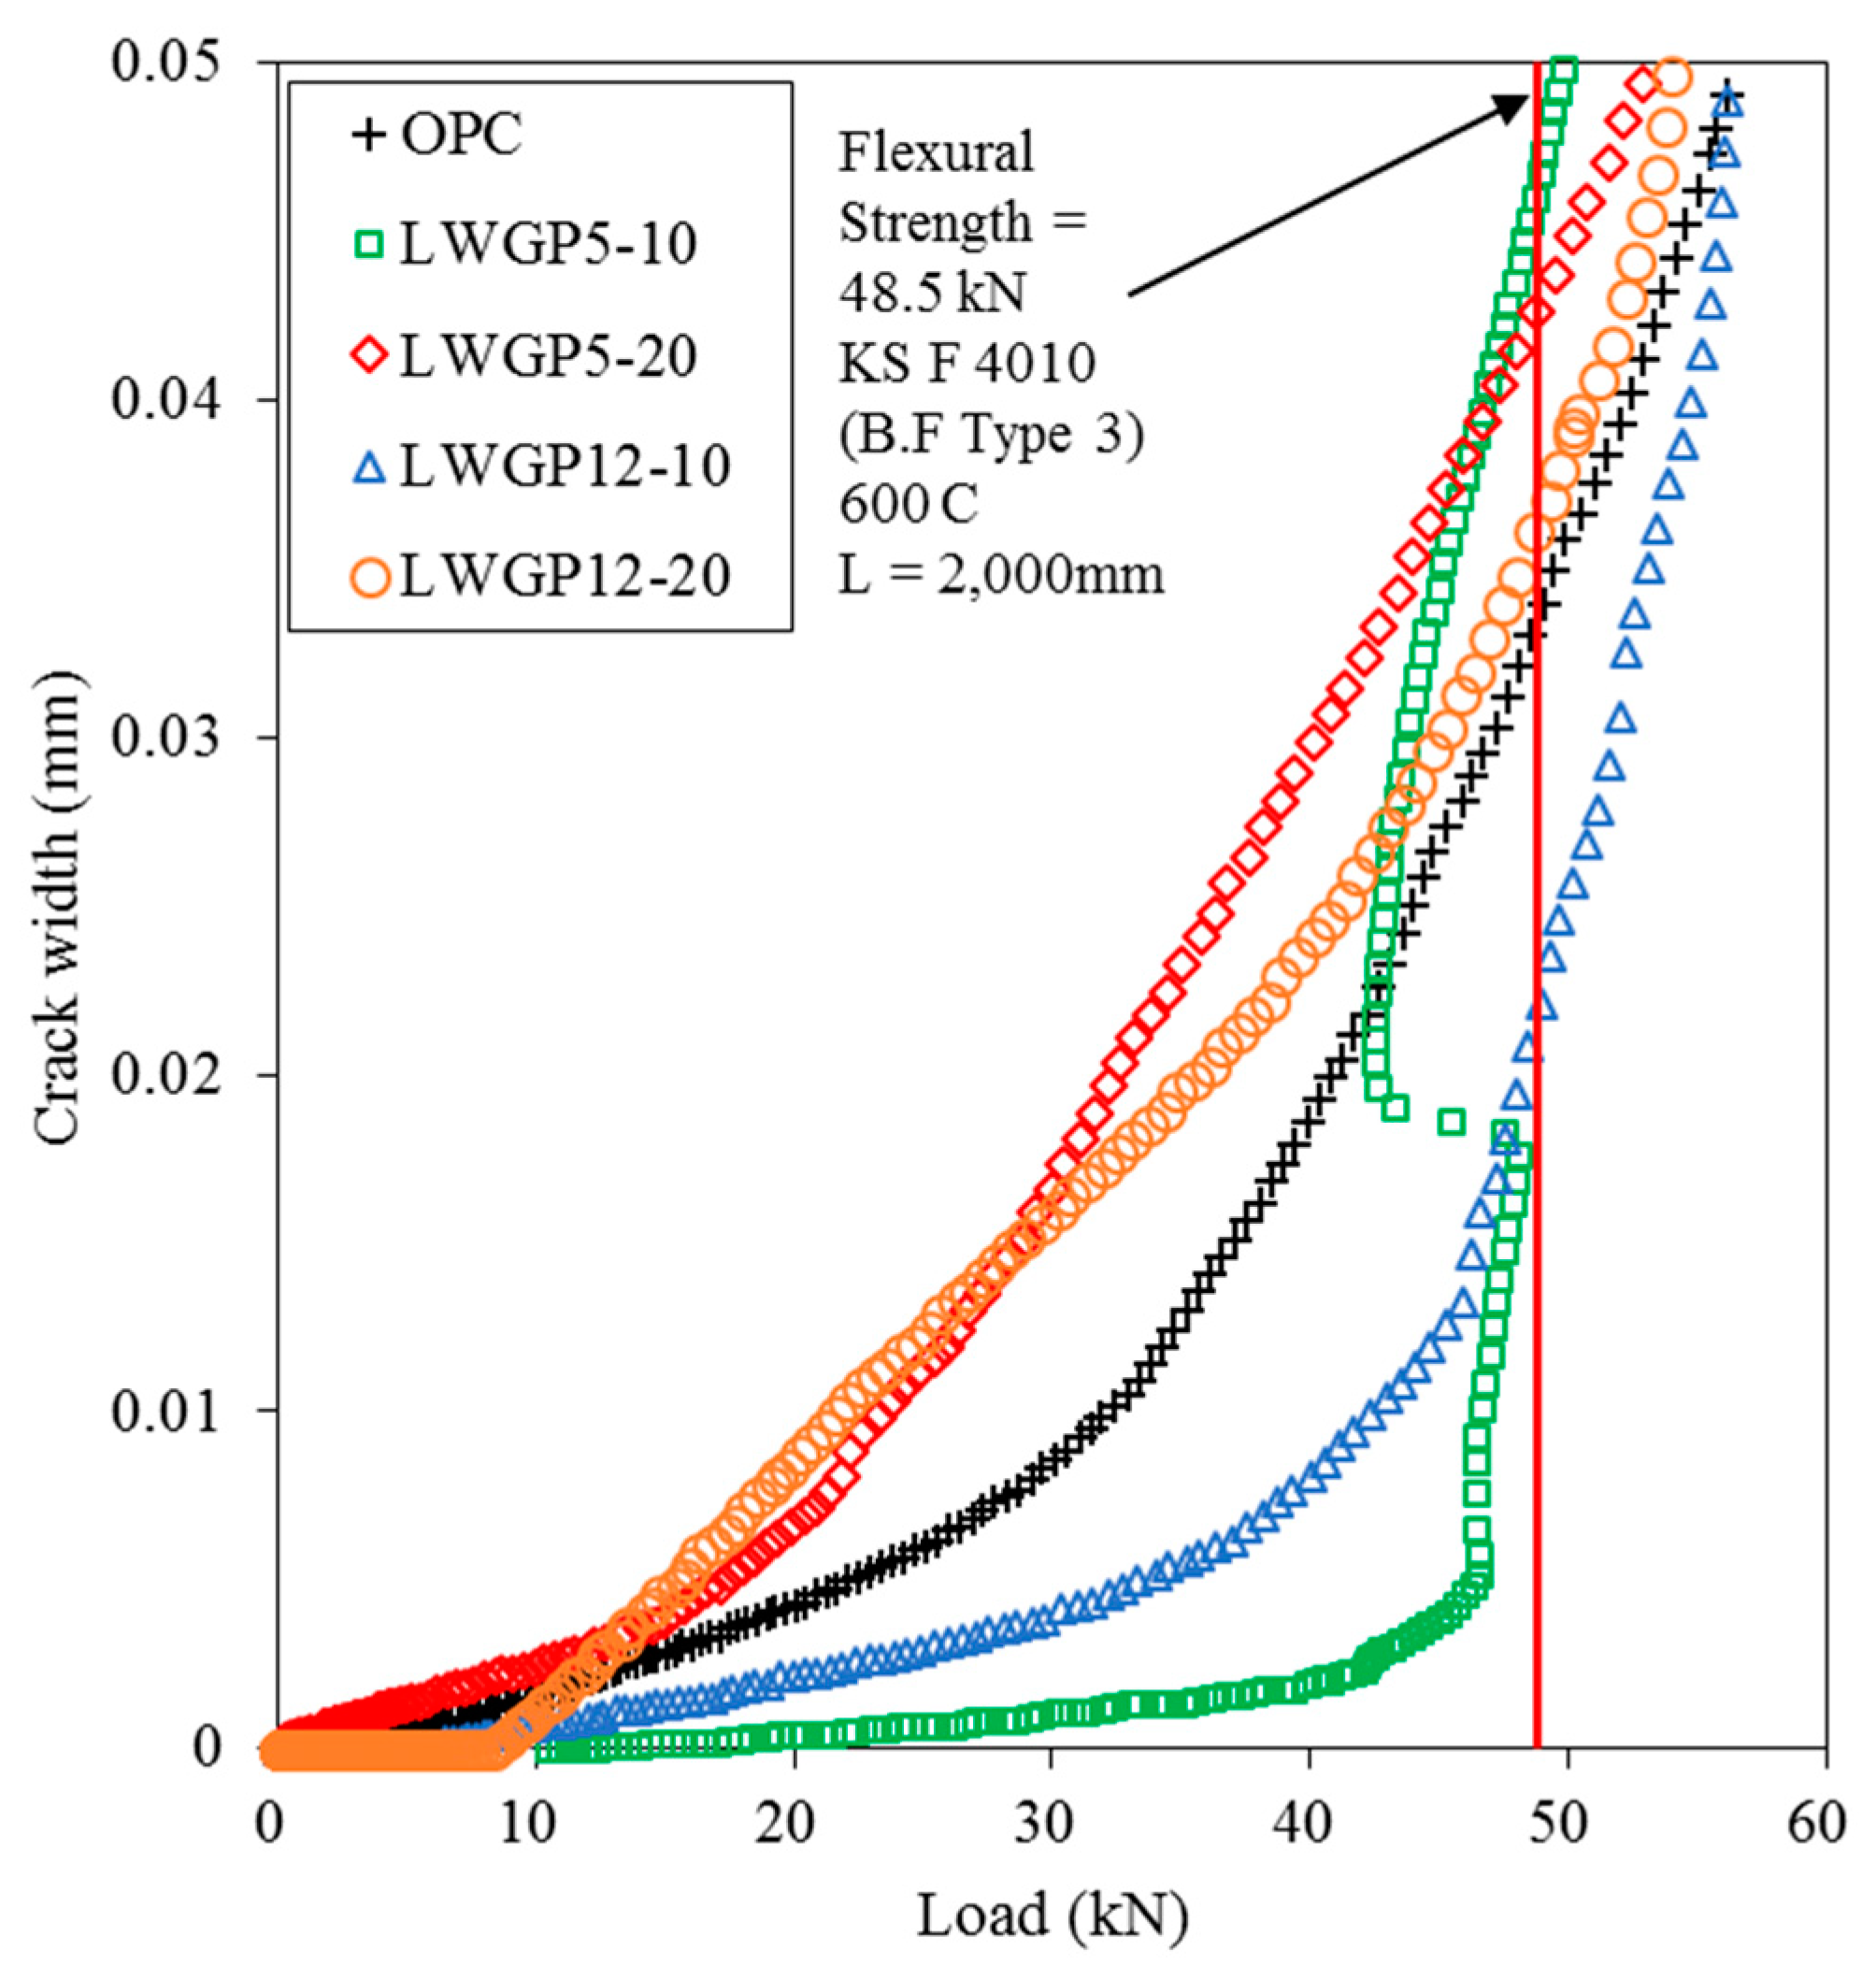
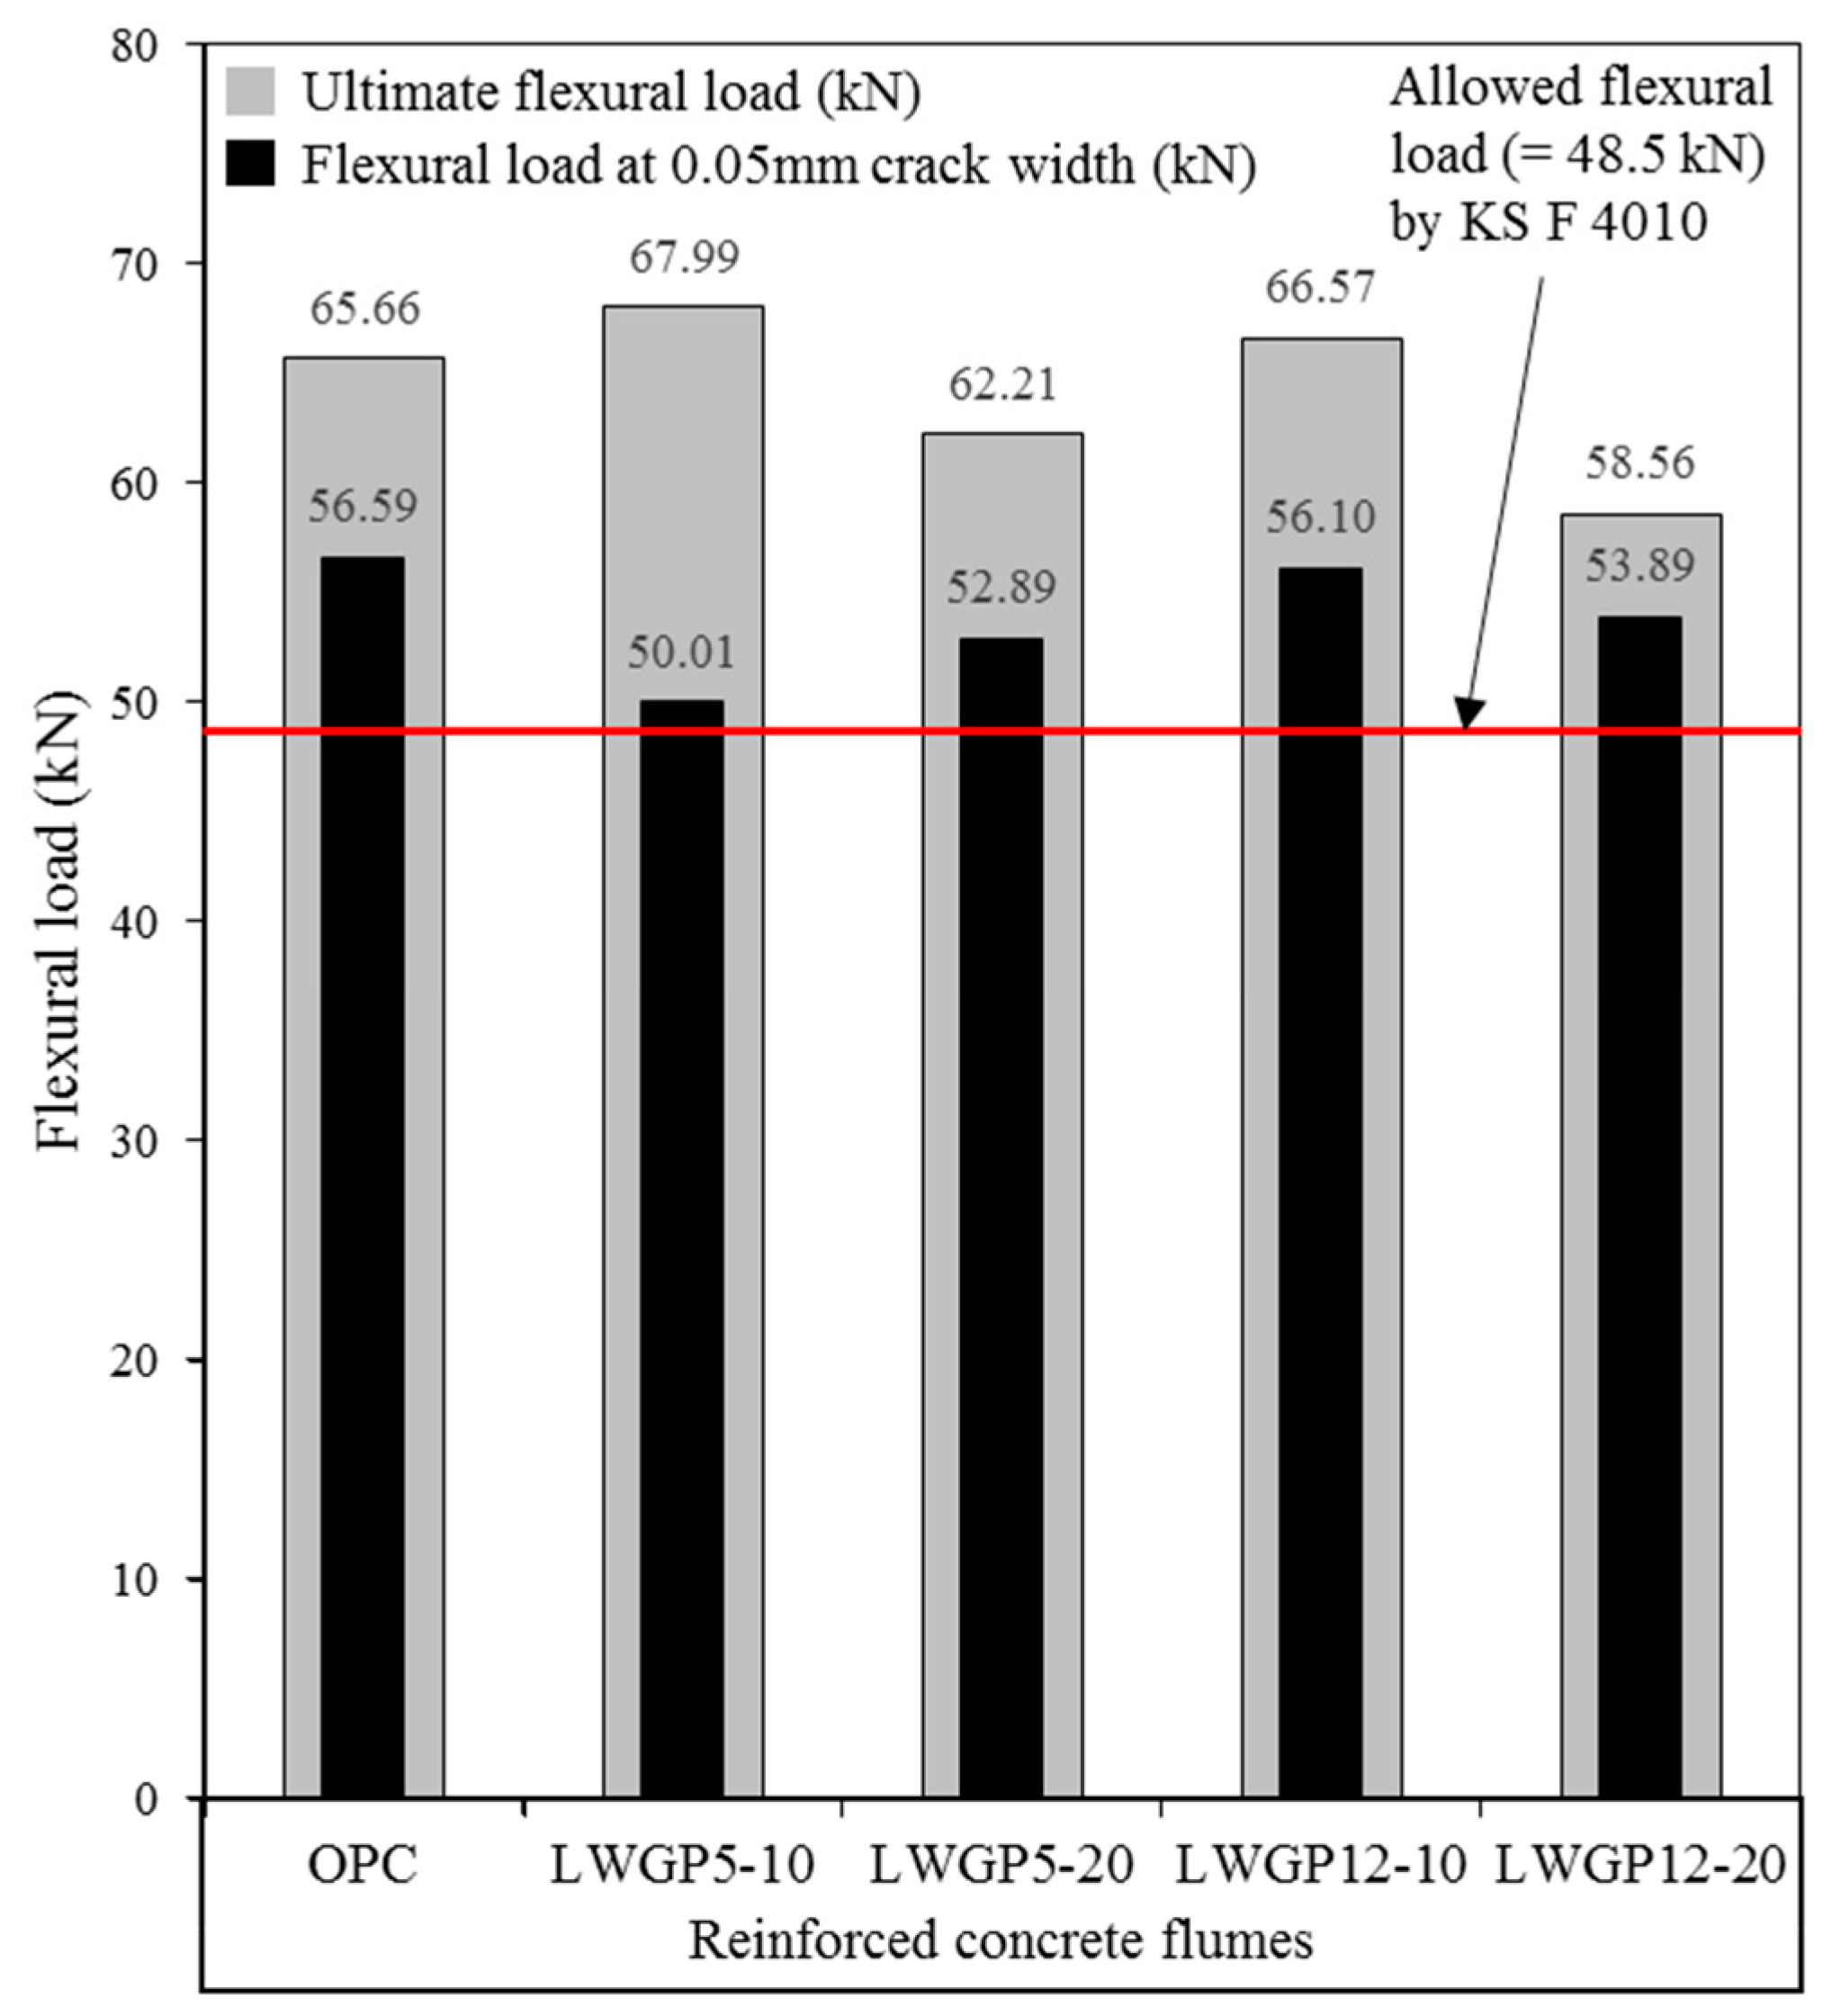
The structural behavior of the LWGP concrete flumes was investigated by comparing the flexural loads by OPC and LWGP. Testing was done for 28 days based on various diameters and substituting ratios. The cracks were monitored by strain gauges attached to the lower part of the socket. The flexural loads were identified when cracks with a width of 0.05 mm were found at the end of the section (Figure 9). Table 5 and Figure 9 summarize the test results and the crack patterns where the longitudinal cracks were observed, leading to flexural failure of the section. A flexural load greater than 48.5 kN required by KS F 4010 [19] was obtained for all the LWGP concrete flume specimens with a length of 2000 mm.
The flexural load of the LWGP concrete flumes greater than that of OPC by 3.5% to 6.5% was observed, demonstrating a trend similar to that of the compressive strength of the LWGP5, which was greater than the compressive strength of OPC by 15% to 17%. Load was applied with 1 mm/min according to KS F 4010 to measure the flexural capacities. The flexural capacity of OPC was 65.66 kN, whereas those of the LWGP concrete flumes were 69.92 kN and 67.99 kN for LWGP5-10 and LWGP5-20, respectively. However, the flexural loads of the LWGP concrete flumes decreased to 62.21 kN and 58.56 kN for LWGP12-10 and LWGP12-20, respectively. Table 5 shows that the flexural capacity decreased when the replacement ratios increased. The pozzolanic reaction contributed to the secondary formation of the C–S–H gel by making the concrete microstructures denser, leading to the increase of the LWGP concrete flume [40]. The LWGP diameters were fine enough to replace OPC; however, the contribution of the flexural load of LWGP12 was smaller than that of LWGP5 because the pozzolanic reaction was not salient. The diameters and substituted ratios should be determined to improve the activity for maximized contribution to the increase of the flexural load and durability of the LWGP. The LWGP with the substituted ratios up to 20% provided an acceptable flexural load and durability. As shown in Figure 10, the initial cracks were effectively controlled for the LWGP5-10 and the LWGP12-10 before the critical loads, at which the cracks rapidly increased. The cracks increased in proportion to the increase of loads for LWGP5-20, LWGP12-20, and OPC.
The KS code defines the flexural load of the reinforced concrete flume when the crack width of 0.05 mm was reached to protect the reinforced concrete flume contacted by polluted waters from erosions of wires and structural damages of the concrete. The ductility of the LWGP concrete flume is also shown in Figure 11, where sudden drops of the flexural capacities were observed. From Figure 11, the initial linear stage of the flexural behavior, which is the flexural behavior before cracking (Wcr < 0.05 mm) from the bottom of the LWGP concrete flumes, exhibited a high stiffness caused by the increase in the compressive strength [41]. The deformation of the LWGP concrete flume with the LWGP5 demonstrated a smaller deformation compared to that of the OPC tube, while the yielding point was smaller than that of OPC. A more brittle behavior than that of the OPC tube was also observed (Figure 11) because the wires yielded, causing rapid load drops. However, the flexural loads of the LWGP concrete flumes with a crack width of 0.05 mm were greater than 48.5 kN, which was required by the KS code (Figure 12).
4. Conclusions
This study used the LWGP, an industrial waste material, as an admixture to increase the sulfate attack resistance of concrete flumes. The compressive strength, pore structure, weight, volume, and strength change in two kinds of sulfate solution were measured for the durability evaluation. The LWGP was also mixed with the reinforced concrete flumes, and the performance was evaluated by the bending strength test. The results are as follows.
- (1)
- The LWGP yielded large compressive strengths of 23.66 to 28.92 MPa at 28 days. LWGP5 especially resulted in a strength increase greater than those of OPC. By contrast, the strengths of the LWGP12 demonstrated a compressive strength smaller than those of OPC, regardless of the substituted ratios of the LWGP.
- (2)
- A pore decrease of 25.4% compared with OPC was observed at 28 days when the LWGP5-20 powder was used with concrete. The capillary pores (below 10 μm) related with the ion penetrations were found in the order of OPC (17.79%), LWGP12-10 (16.32%), LWGP12-20 (16.24%), LWGP5-10 (13.79%), and LWGP5-20 (13.27%). The capillary pores occupied by Ca(OH)2 decreased, whereas the gel pores increased by forming the C–S–H gel. This led to pore reduction and a higher strength development.
- (3)
- The reduction ratios of the weight and the volume for concretes with the mixture of LWGP powders were smaller than with OPC. The reduction ratios of the weight and the volume of the LWGP5-10 concrete were the lowest as 4.41% and 2.70% when they were immersed in the Na2SO4 solution for 182 days, whereas those were 6.04% and 4.32% when immersed in the MgSO4 solution. This trend was found to be similar to that of the compressive concrete strength immersed in the sulfate solution.
- (4)
- The maximum flexural load of the LWGP concrete flume was the highest at 69.92 kN in the LWGP5-10 contained concrete, while the LWGP10 contained concrete flumes smaller than the OPC concrete flumes. The flexural load of the concrete was generally increased or decreased in proportion to the compressive strength; hence, the tendency similarity was confirmed. Moreover, the opposite case was that the decrease of the flexural load of the concrete flume with LWGP10 also had the same tendency.
- (5)
- The flexural loads of all the LWGP concrete flumes with a crack width of 0.05 mm were greater than the 48.5 kN required by the KS code, but smaller than the flexural loads of OPC. The initial cracks were effectively controlled for LWGP5-10 and LWGP12-10 before the critical load.
- (6)
- The durability of the conventional reinforced concrete flumes against the sulfate attack resistance was improved by substituting cement by LWGP, thereby extending the use of the new reinforced concrete flumes to the replacement of conventional reinforced concrete flumes. The applicability was also validated by the flexural test complying with KS.
Author Contributions
S.-K.K. conceived and designed the experiments; S.-K.K. performed the experiments; S.-K.K. and W.-K.H. analyzed the experimental data; S.-K.K. and W.-K.H. Writing—original draft preparation; S.-K.K. and W.-K.H. Writing—review and editing.
Funding
This research was supported by Grant (19CTAP-C152028-01) from Technology Advancement Research Program funded by Ministry of Land, Infrastructure and Transport of Korean government and the National Research Foundation of Korea (NRF) grant funded by the Korea government (MSIT) (No. 2019R1A2C2004965).
Acknowledgments
The above financial support is greatly appreciated.
Conflicts of Interest
The authors declare that there is no conflict of interest.
References
- Liu, Z.; Zhang, F.; Deng, D.; Xie, Y.; Long, G.; Tang, X. Physical sulfate attack on concrete lining–A field case analysis. Case Stud. Constr. Mater. 2017, 6, 206–212. [Google Scholar] [CrossRef]
- Yoshida, N.; Matsunami, Y.; Nagayama, M.; Sakai, E. Salt weathering in residential concrete foundation exposed to sulfate-bearing ground. J. Adv. Concr. Technol. 2010, 8, 121–134. [Google Scholar] [CrossRef]
- Haynes, H.; O’Neill, R.; Neff, M.; Mehta, P.K. Salt weathering distress on concrete exposed to sodium sulfate environment. ACI Mater. J. 2008, 105, 35–43. [Google Scholar]
- Lee, S. Magnesium sulfate attack and deterioration mode of matakaolin blended cement matrix. J. Korea Concr. Inst. 2009, 21, 21–27. [Google Scholar] [CrossRef]
- Kim, M.; Baek, D. Unit weight and compressive strength of cement mortars using crushed sand under sulfate attacks. J. Korean Soc. Civ. Eng. 2007, 27, 585–591. [Google Scholar]
- Moon, H.; Lee, S.; Kim, H.; Kim, S. Evaluation on the resistance of Portland cement mortars due to chemical attack. J. Korean Soc. Civ. Eng. 2002, 22, 181–191. [Google Scholar]
- Santhanam, M.; Cohen, M.D.; Olek, J. Mechanism of sulfate attack: A fresh look part 2: Proposed Mechanisms. Cem. Concr. Res. 2003, 33, 341–346. [Google Scholar] [CrossRef]
- Moon, H.Y.; Jeon, J.K.; Kim, H.S. Resistance on the sulfuric acid corrosion of cement matrix containing mineral admixture. J. Korean Soc. Civ. Eng. 2005, 25, 225–232. [Google Scholar]
- Wee, T.H.; Suryavanshi, A.K.; Wong, S.F.; Rahman, A.K.M.A. Sulfate resistance of concrete containing mineral admixtures. ACI Mater. J. 2000, 97, 536–549. [Google Scholar]
- Shin, D.; Kang, L.; Park, J.L.; Lee, C.G.; Yoon, J.; Hong, H.S. Current research trend on recycling of waste flat panel display panel glass. J. Korean Inst. Resour. Recycl. 2015, 24, 58–65. [Google Scholar] [CrossRef]
- Kim, K.; Kim, K.; Hwang, J. LCD waste glass as a substitute for feldspar in the porcelain sanitary ware production. Ceram. Int. 2015, 41, 7097–7102. [Google Scholar] [CrossRef]
- Lee, C.T. Synthesis of zeolite from waste LCD panel glass. Appl. Chem. Eng. 2017, 28, 521–528. [Google Scholar] [CrossRef]
- Kim, S.K.; Hanif, A.; Jang, I.Y. Incorporating liquid crystal display (LCD) glass waste as supplementary cementing material (SCM) in cement mortars-rationale based on hydration, Durability, and Pore Characteristics. Materials 2018, 11, 2538. [Google Scholar] [CrossRef] [PubMed]
- Kim, S.K.; Kang, S.T.; Kim, J.K.; Jang, I.Y. Effects of particle size and cement replacement of LCD glass powder in concrete. Adv. Mater. Sci. Eng. 2017, 2017, 1–12. [Google Scholar] [CrossRef]
- Kim, S.K.; Jang, P.K.; Jang, I.Y. Material bahavior and strength character of 150 MPa ultra high strength concrete using LCD glass powder as fine aggregate. J. Korea Concr. Inst. 2017, 29, 615–623. [Google Scholar] [CrossRef]
- Wang, H.Y. A study of the effects of LCD glass sand on the properties of concrete. Waste Manag. 2009, 29, 335–341. [Google Scholar] [CrossRef] [PubMed]
- Wang, H.Y.; Huang, W.L. Durability of self-consolidating concrete using waste LCD glass. Constr. Build. Mater. 2010, 24, 1008–1013. [Google Scholar] [CrossRef]
- Wang, H.; Hou, T. A study of elevated temperatures on the strength properties of LCD glass powder cement mortars. Integr. Waste Manag. 2011, 1. [Google Scholar] [CrossRef]
- KS F 4010 Reinforced concrete flumes and bench flumes; Korean Standards Association: Seoul, Korea, 2010.
- Higgins, D.D.; Crammond, N.J. Resistance of concrete containing ggbs to the thaumasite form of sulfate attack. Cem. Concr. Compos. 2003, 25, 921–929. [Google Scholar] [CrossRef]
- Roziere, E.; loukili, A.; El Hachem, R.; Grondin, F. Durability of concrete exposed to leaching and external sulphate attacks. Cem. Concr. Compos. 2009, 39, 1188–1198. [Google Scholar] [CrossRef] [Green Version]
- Tang, C.W. Properties of fired bricks incorporating TFT-LCD waste glass powder with reservoir sediments. Sustainability 2018, 10, 2503. [Google Scholar] [CrossRef]
- ASTM C127-15 Standard Test Method for Relative Density (Specific Gravity) and Absorption of Coarse Aggregate; ASTM International: West Conshohocken, PA, USA, 2015.
- ASTM C128-15 Standard Test Method for Relative Density (Specific Gravity) and Absorption of Fine Aggregate; ASTM International: West Conshohocken, PA, USA, 2015.
- KS F 2402-2017 Standard Test Method for Concrete Slump; Korean Standards Association: Seoul, Korea, 2017.
- KS F 2405-2017 Standard Test Method for Compressive Strength of Concrete; Korean Standards Association: Seoul, Korea, 2017.
- ASTM C1012-18b Standard Test Methods for Length Change of Hydraulic-Cement Mortars Exposed to a Sulfate Solution; ASTM International: West Conshohocken, PA, USA, 2018.
- Kim, S.K.; Lee, K.W.; Song, J.H.; Jang, I.Y. Durability performance evaluations on resistance to chloride attack for concrete using LCD waste glass powder. J. Korean Recycl. Constr. Resour. Inst. 2018, 4, 289–296. [Google Scholar] [CrossRef]
- Yu, H.; Yang, J.; Rong, H. Research on decalcification degradation process of cement stone. J. Wuhan Univ. Technol. 2015, 30, 369–374. [Google Scholar] [CrossRef]
- Zheng, K. Recycled Glass Concrete. Eco-Efficient Concrete; Chapter 11; Woodhead publishing: Cambridge, UK, 2013; ISBN 0128089016, 9780128089019. [Google Scholar]
- Yang, H.J.; Jin, S.H.; Ann, K.Y. Chloride transport of high alumina cement mortar exposed to a saline solution. Adv. Mater. Sci. Eng. 2016, 2016, 1–8. [Google Scholar] [CrossRef]
- Park, K.; Cho, Y.; Shin, D. Effects of magnesium and sulfate ions on the sulfate attack resistance of alkali-activated materials. J. Korea Concr. Inst. 2017, 29, 415–424. [Google Scholar] [CrossRef]
- Rasheeduzzafar, O.S.B.; Al-Amoudi, O.S.B.; Abduljauwad, S.N.; Maslehuddin, M. Magnesium—sodium sulfate attack in plain and blended cements. J. Mater. Civ. Eng. 1994, 6, 201–222. [Google Scholar] [CrossRef]
- Neville, A. The confused world of sulfate attack on concrete. Cem. Concr. Res. 2004, 34, 1275–1296. [Google Scholar] [CrossRef]
- Al-Amoudi, O.S.B. Attack on plain and blended cements exposed to aggressive sulfate environments. Cem. Concr. Compos. 2002, 24, 305–316. [Google Scholar] [CrossRef]
- Hanif, A.; Parthasarathy, P.; Ma, H.; Fan, T.; Li, Z. Properties improvement of fly ash cenosphere modified cement pastes using nano-silica. Cem. Concr. Compos. 2017, 81, 35–48. [Google Scholar] [CrossRef]
- Mehta, P.K.; Monteiro, P.J.M. Concrete: Microstructure, Properties and Materials, 4th ed.; McGraw-Hill Companies: New York, USA, 2013. [Google Scholar]
- Aligizaki, K.K. Pore Structure of Cement-Based Materials: Testing, Interpretation and Requirements; Taylor & Francis: London, UK; New York, NY, USA, 2006; ISBN 9780419228004. [Google Scholar]
- Allen, A.J.; Thomas, J.J.; Jennings, H.M. Composition and density of nanoscale calcium-silicate-hydrate in cement. Nat. Mater. 2007, 6, 311–316. [Google Scholar] [CrossRef] [PubMed]
- Chen, X.; Wu, S.; Zhou, J. Influence of porosity on compressive and tensile strength of cement mortar. Constr. Build. Mater. 2013, 40, 869–874. [Google Scholar] [CrossRef]
- Nunes, C.; Slížková, Z.; Stefanidou, M.; Němeček, J. Microstructure of lime and lime-pozzolana pastes with nanosilica. Cem. Concr. Res. 2016, 83, 152–163. [Google Scholar] [CrossRef]
Figure 1.
Test to measure the compressive strength.
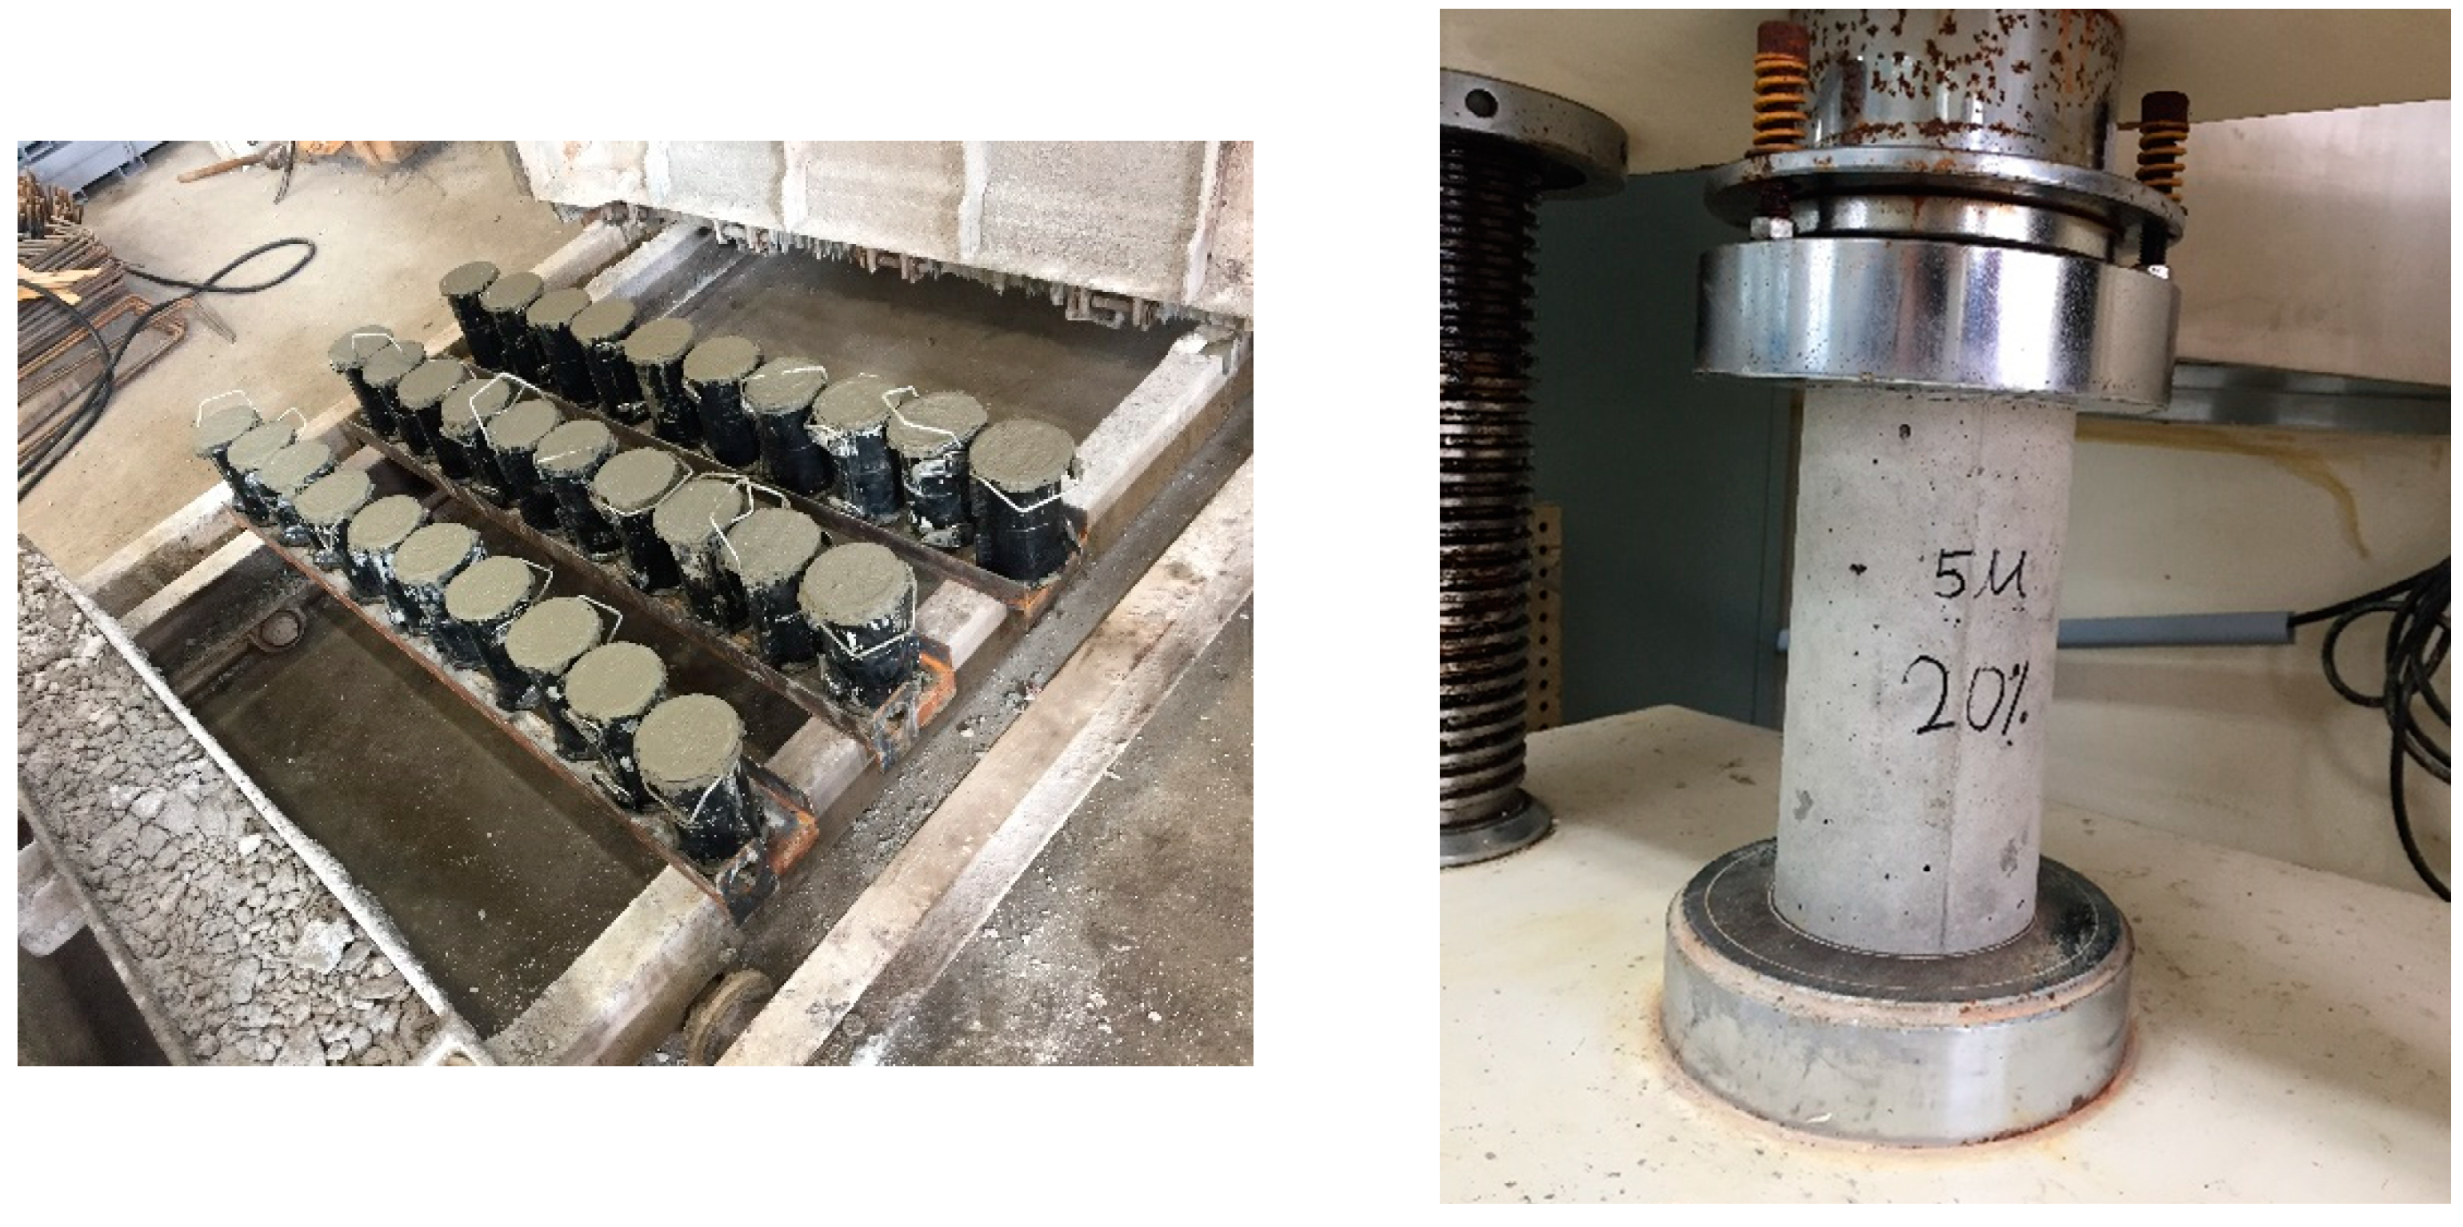
Figure 2.
Dimensions and type of LWGP concrete flumes. (a) Cross section; (b) Longitudinal section; (c) Specimens production.
Figure 2.
Dimensions and type of LWGP concrete flumes. (a) Cross section; (b) Longitudinal section; (c) Specimens production.
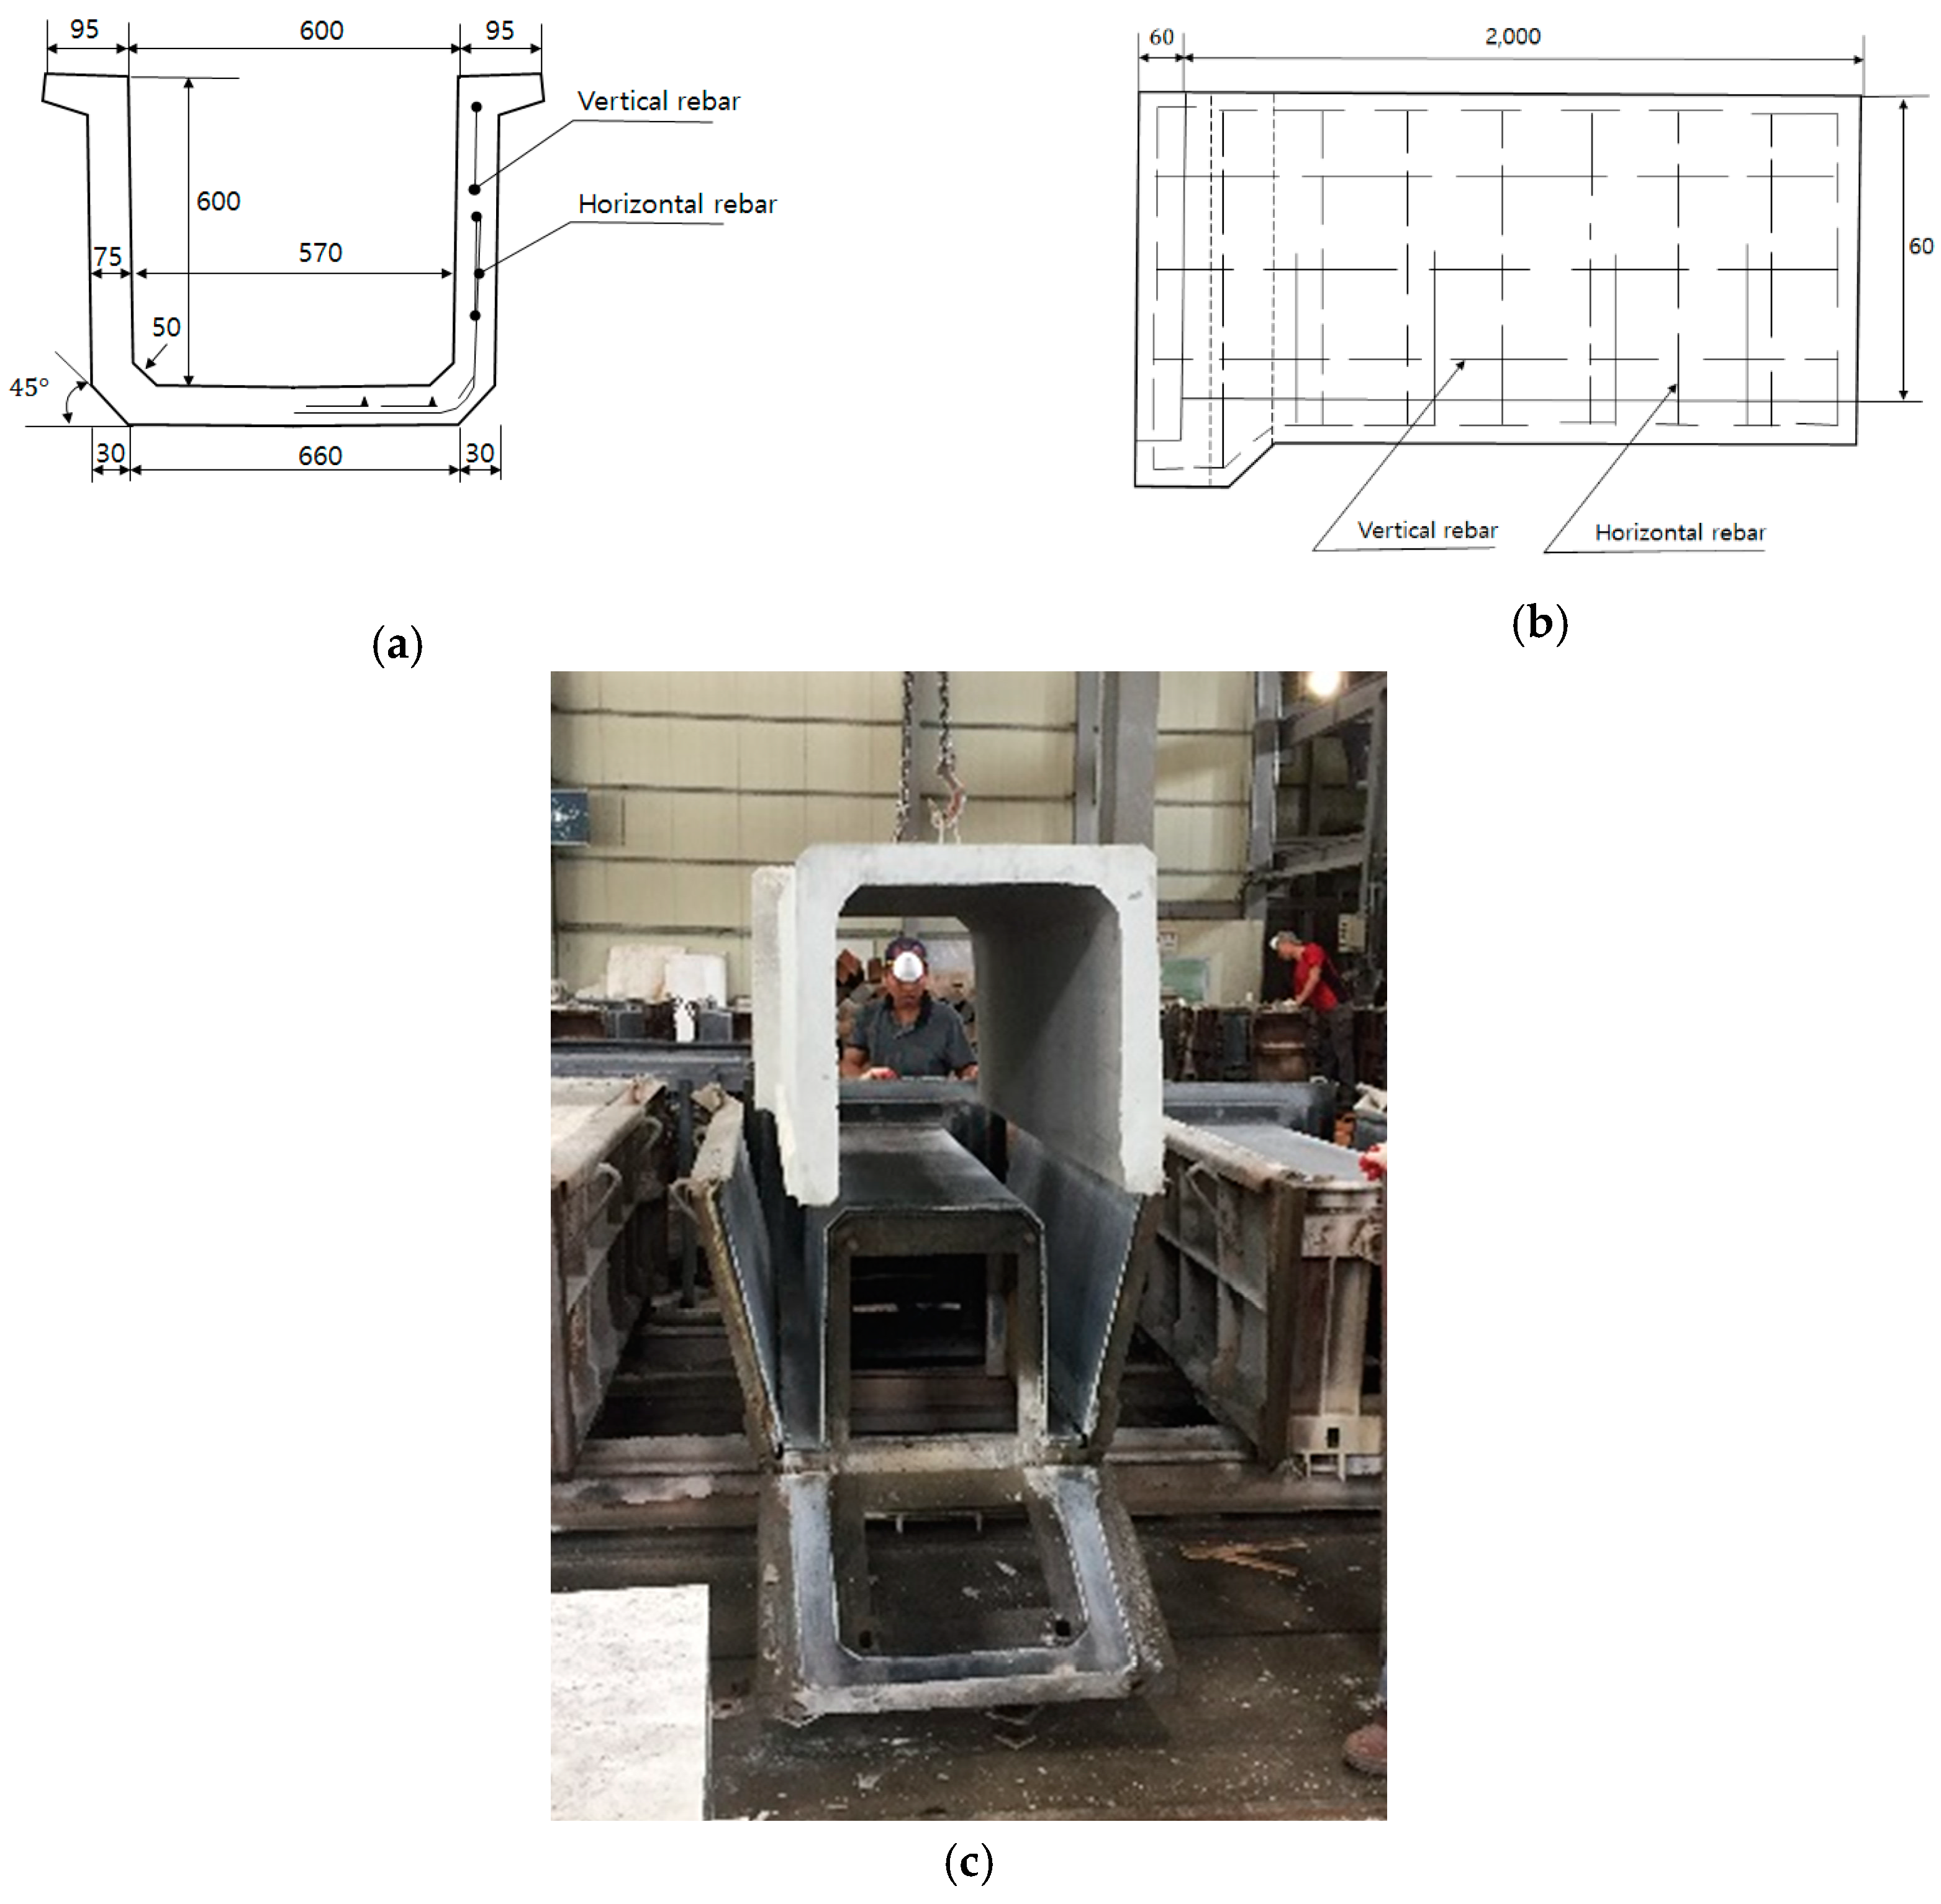
Figure 3.
Test method of the LWGP concrete flumes from KS F 4010. (a) Cross section; (b) Longitudinal section; (c) The test setup for the LWGP concrete flume.
Figure 3.
Test method of the LWGP concrete flumes from KS F 4010. (a) Cross section; (b) Longitudinal section; (c) The test setup for the LWGP concrete flume.

Figure 4.
Concrete slump results with the replacement of the LWGP concrete flumes.

Figure 5.
Deterioration of the LWGP-mixed concrete after exposure in different sulfate solutions for 84 and 182 days.
Figure 5.
Deterioration of the LWGP-mixed concrete after exposure in different sulfate solutions for 84 and 182 days.
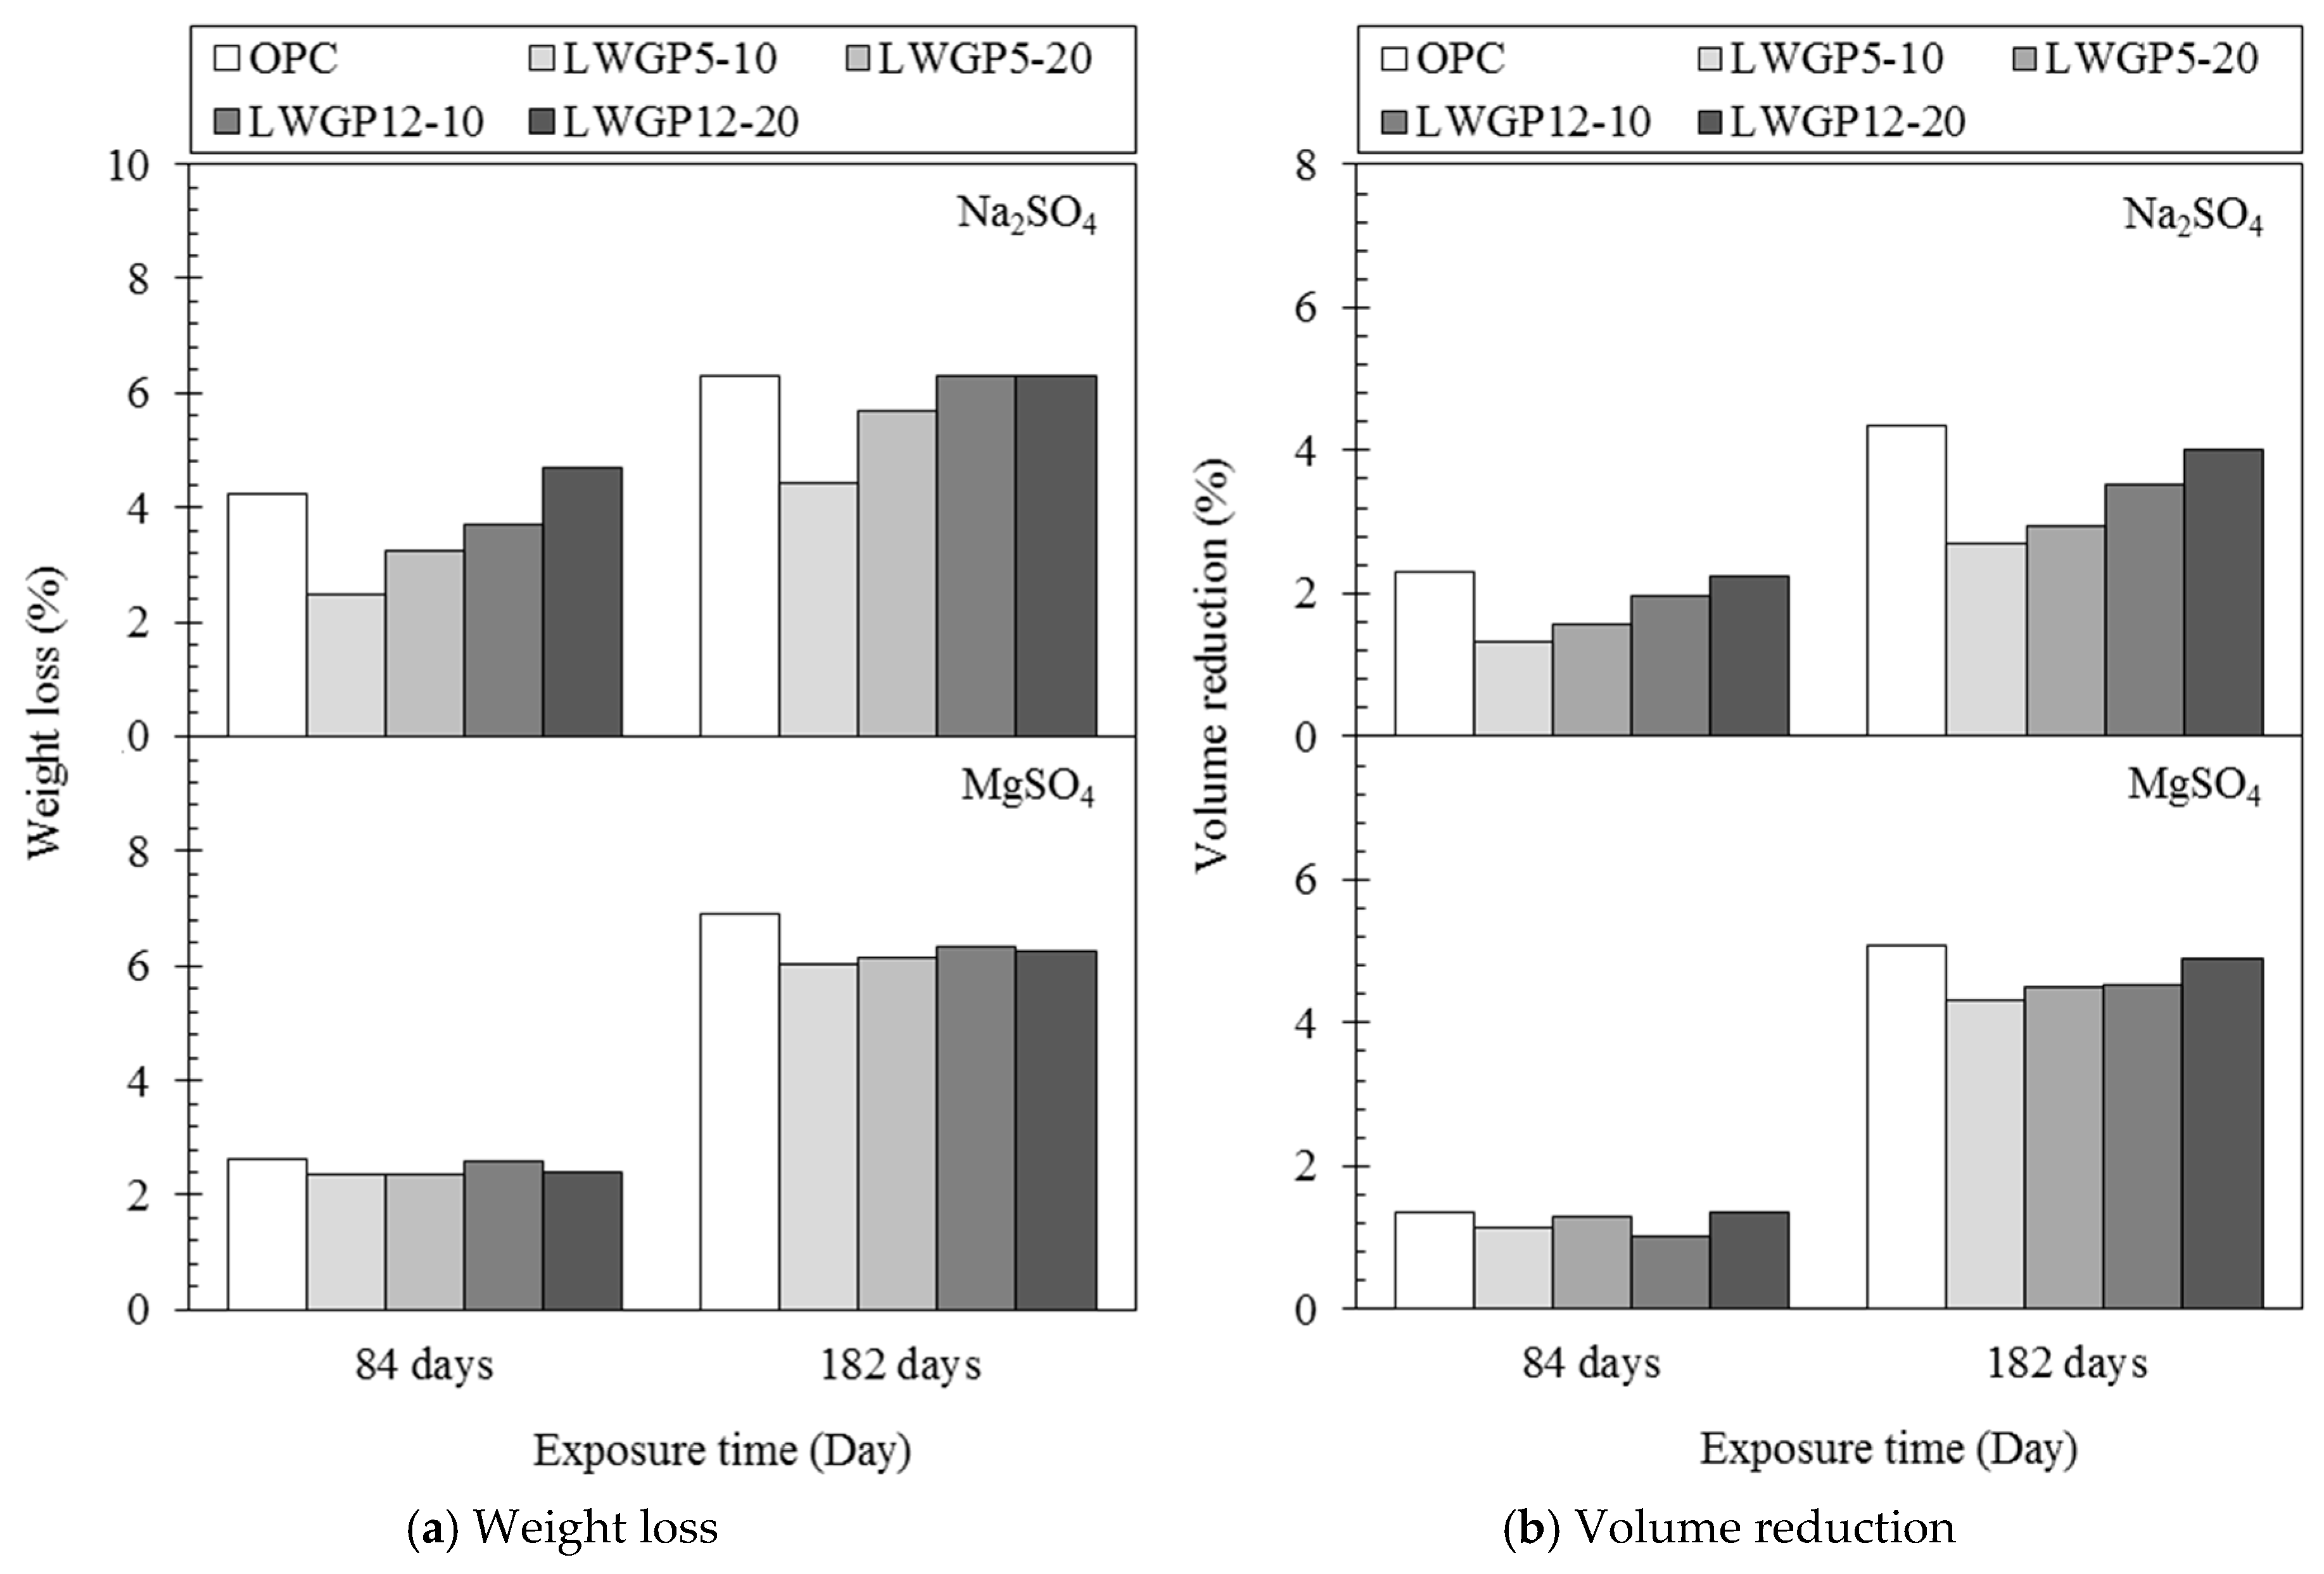
Figure 6.
Compressive strength results of the LWGP concrete flumes.
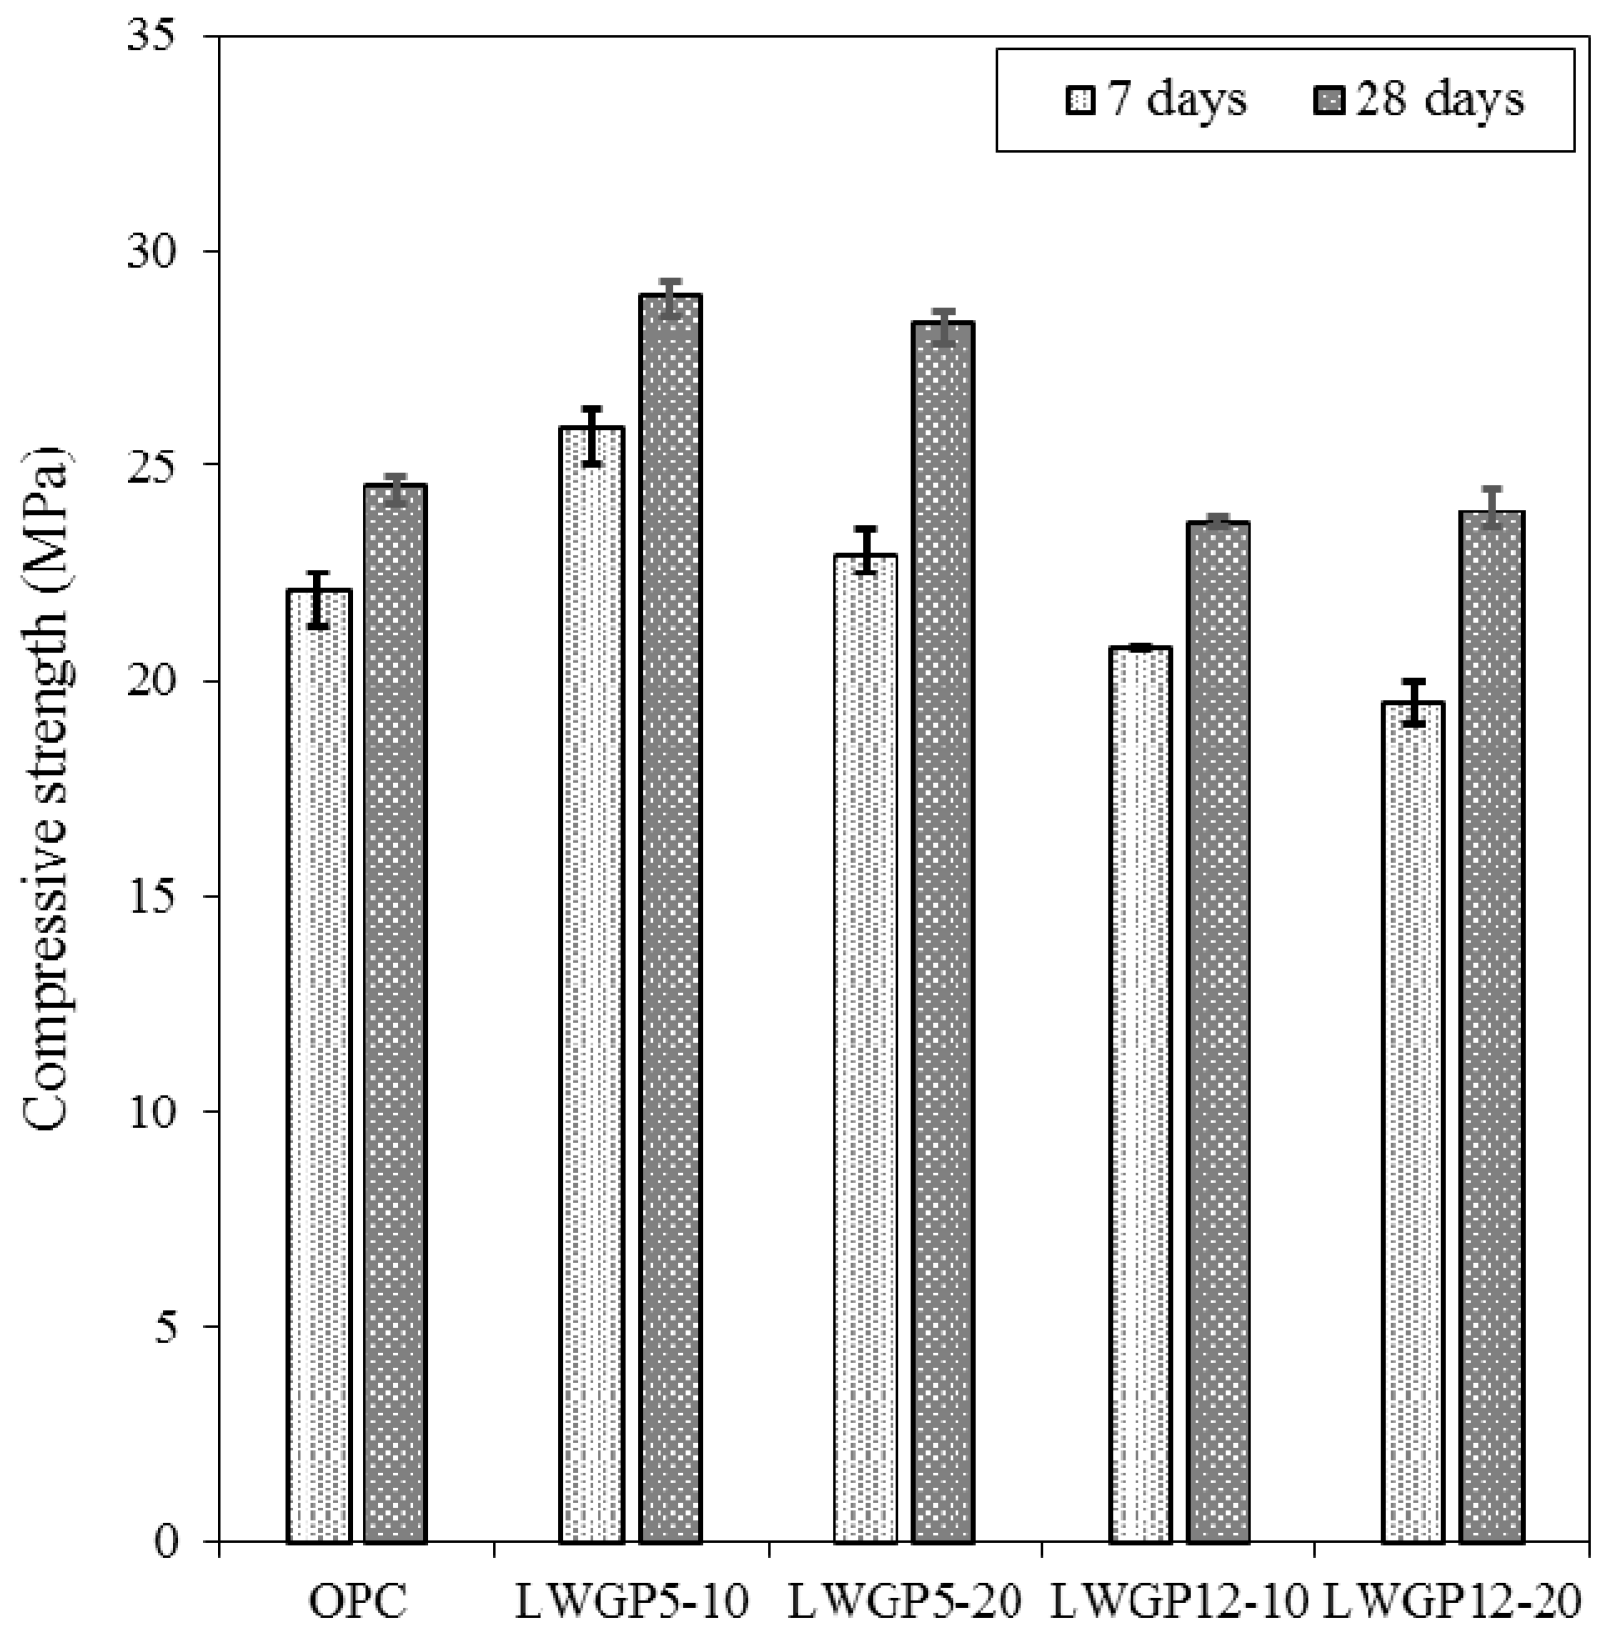
Figure 7.
Variation of the compressive strength for the concrete containing LWGP powder under sulfate-bearing environments.
Figure 7.
Variation of the compressive strength for the concrete containing LWGP powder under sulfate-bearing environments.
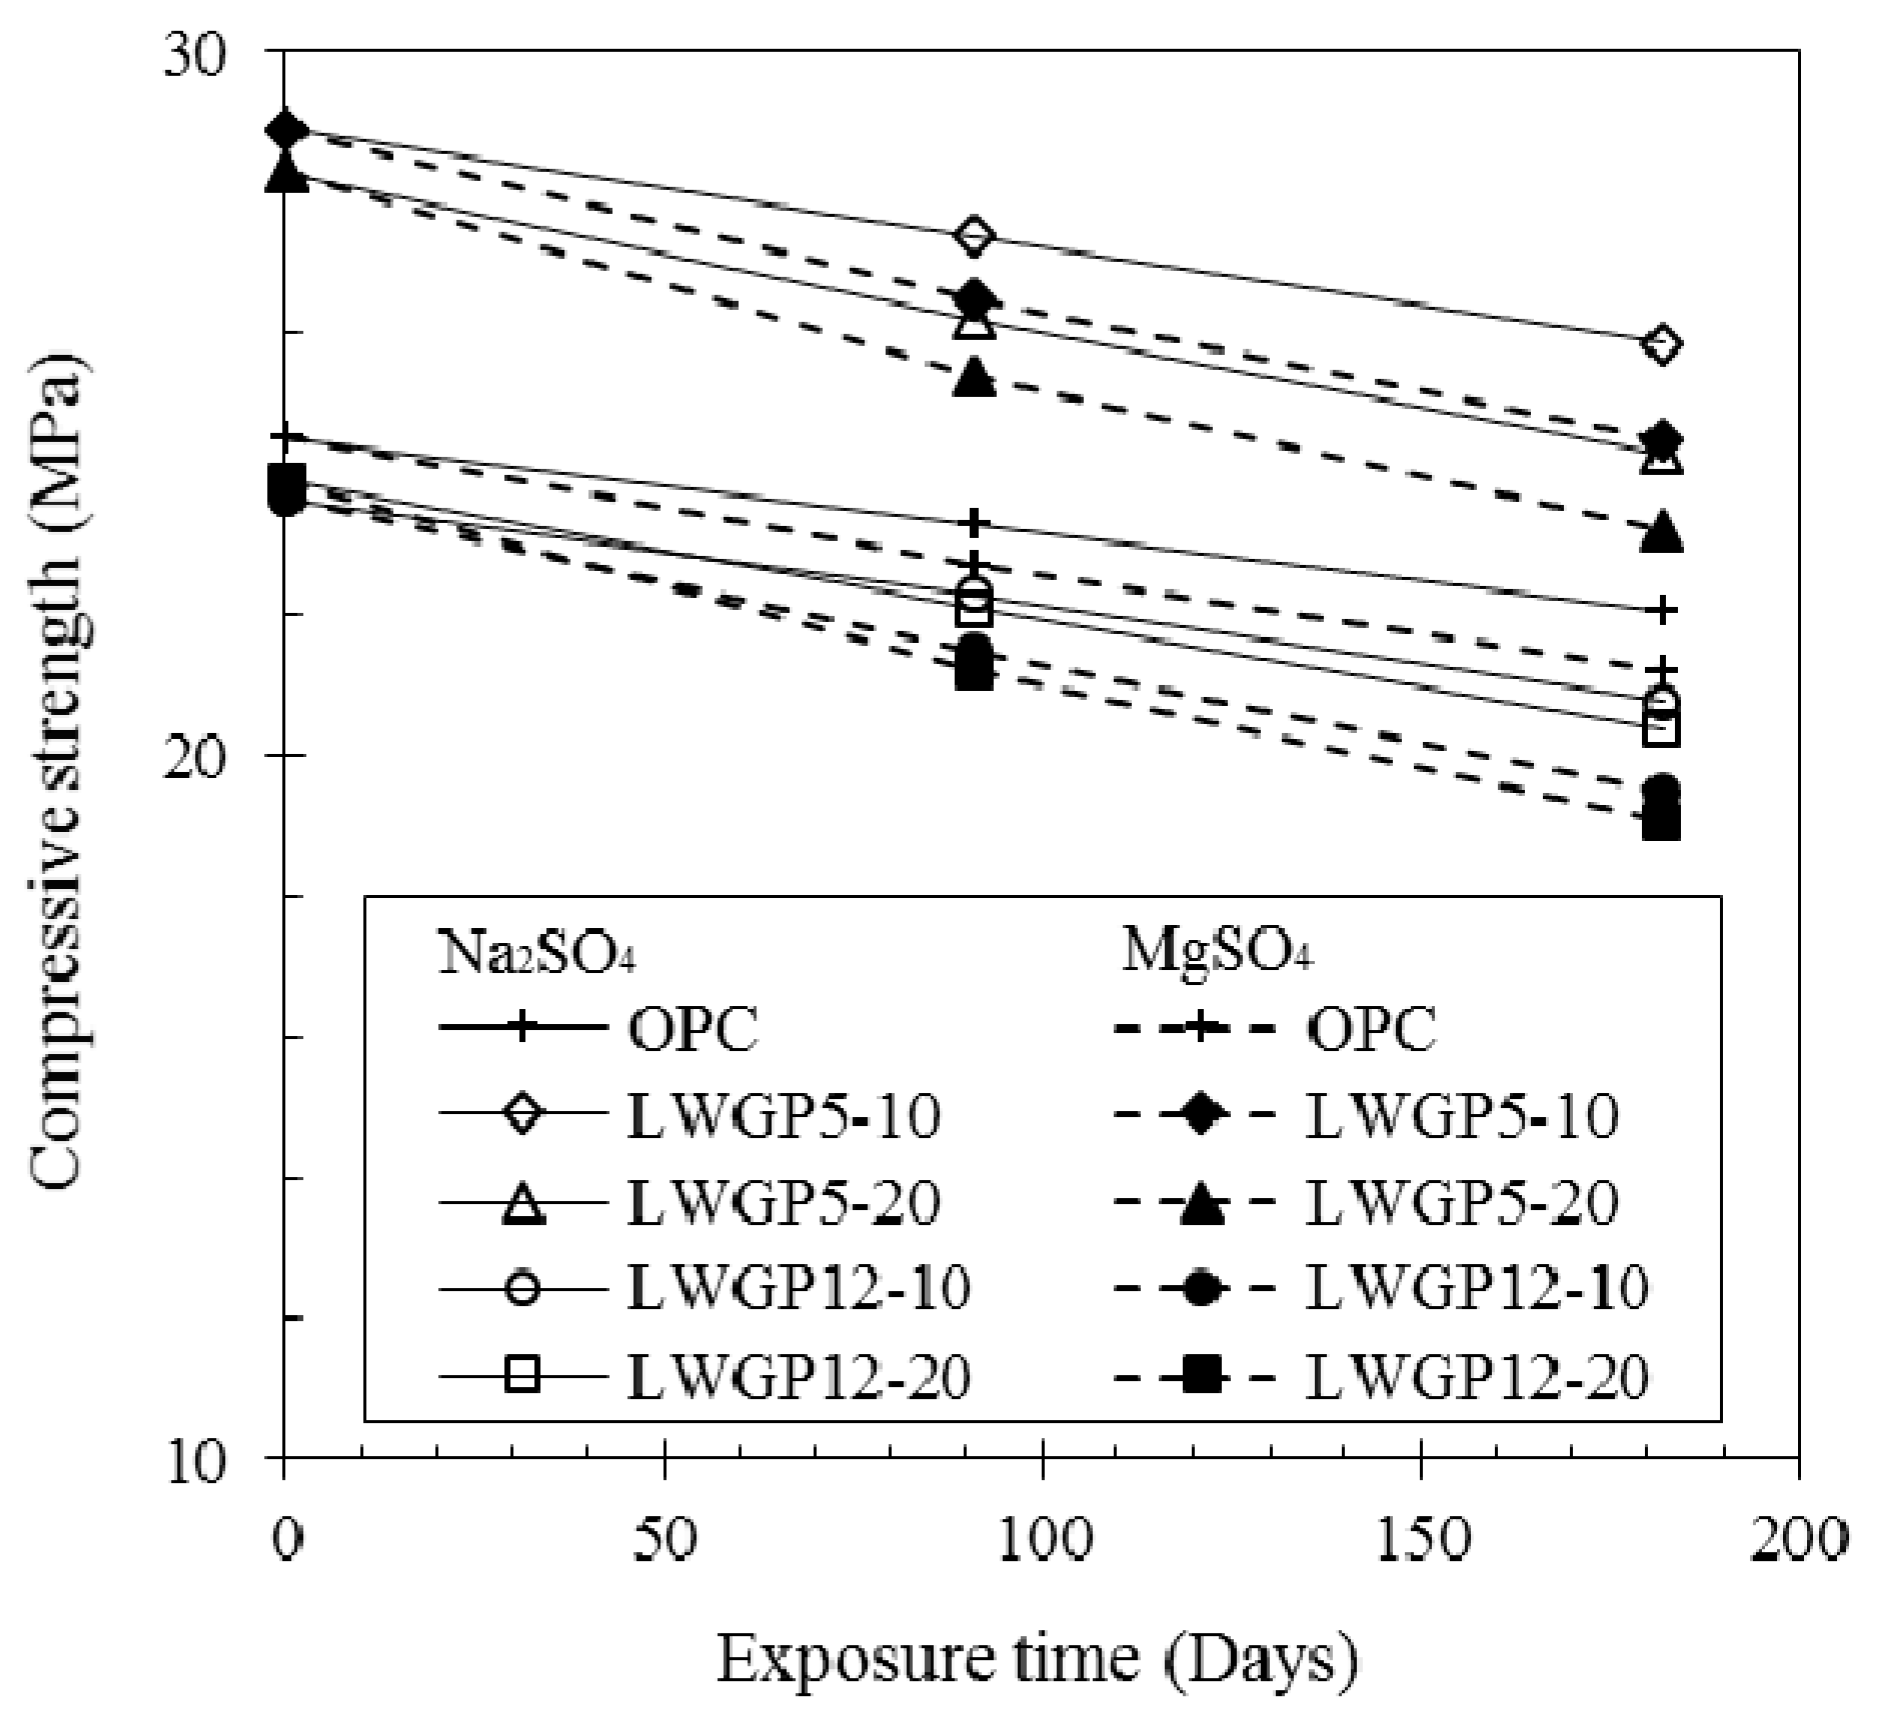
Figure 8.
Pore distribution of the specimen obtained from the concrete blended with the LWGP powder. (a) The incremental porosity by the pore size diameter; (b) The cumulative porosity by the pore size diameter.
Figure 8.
Pore distribution of the specimen obtained from the concrete blended with the LWGP powder. (a) The incremental porosity by the pore size diameter; (b) The cumulative porosity by the pore size diameter.


Figure 9.
Crack patterns of the LWGP concrete flume.
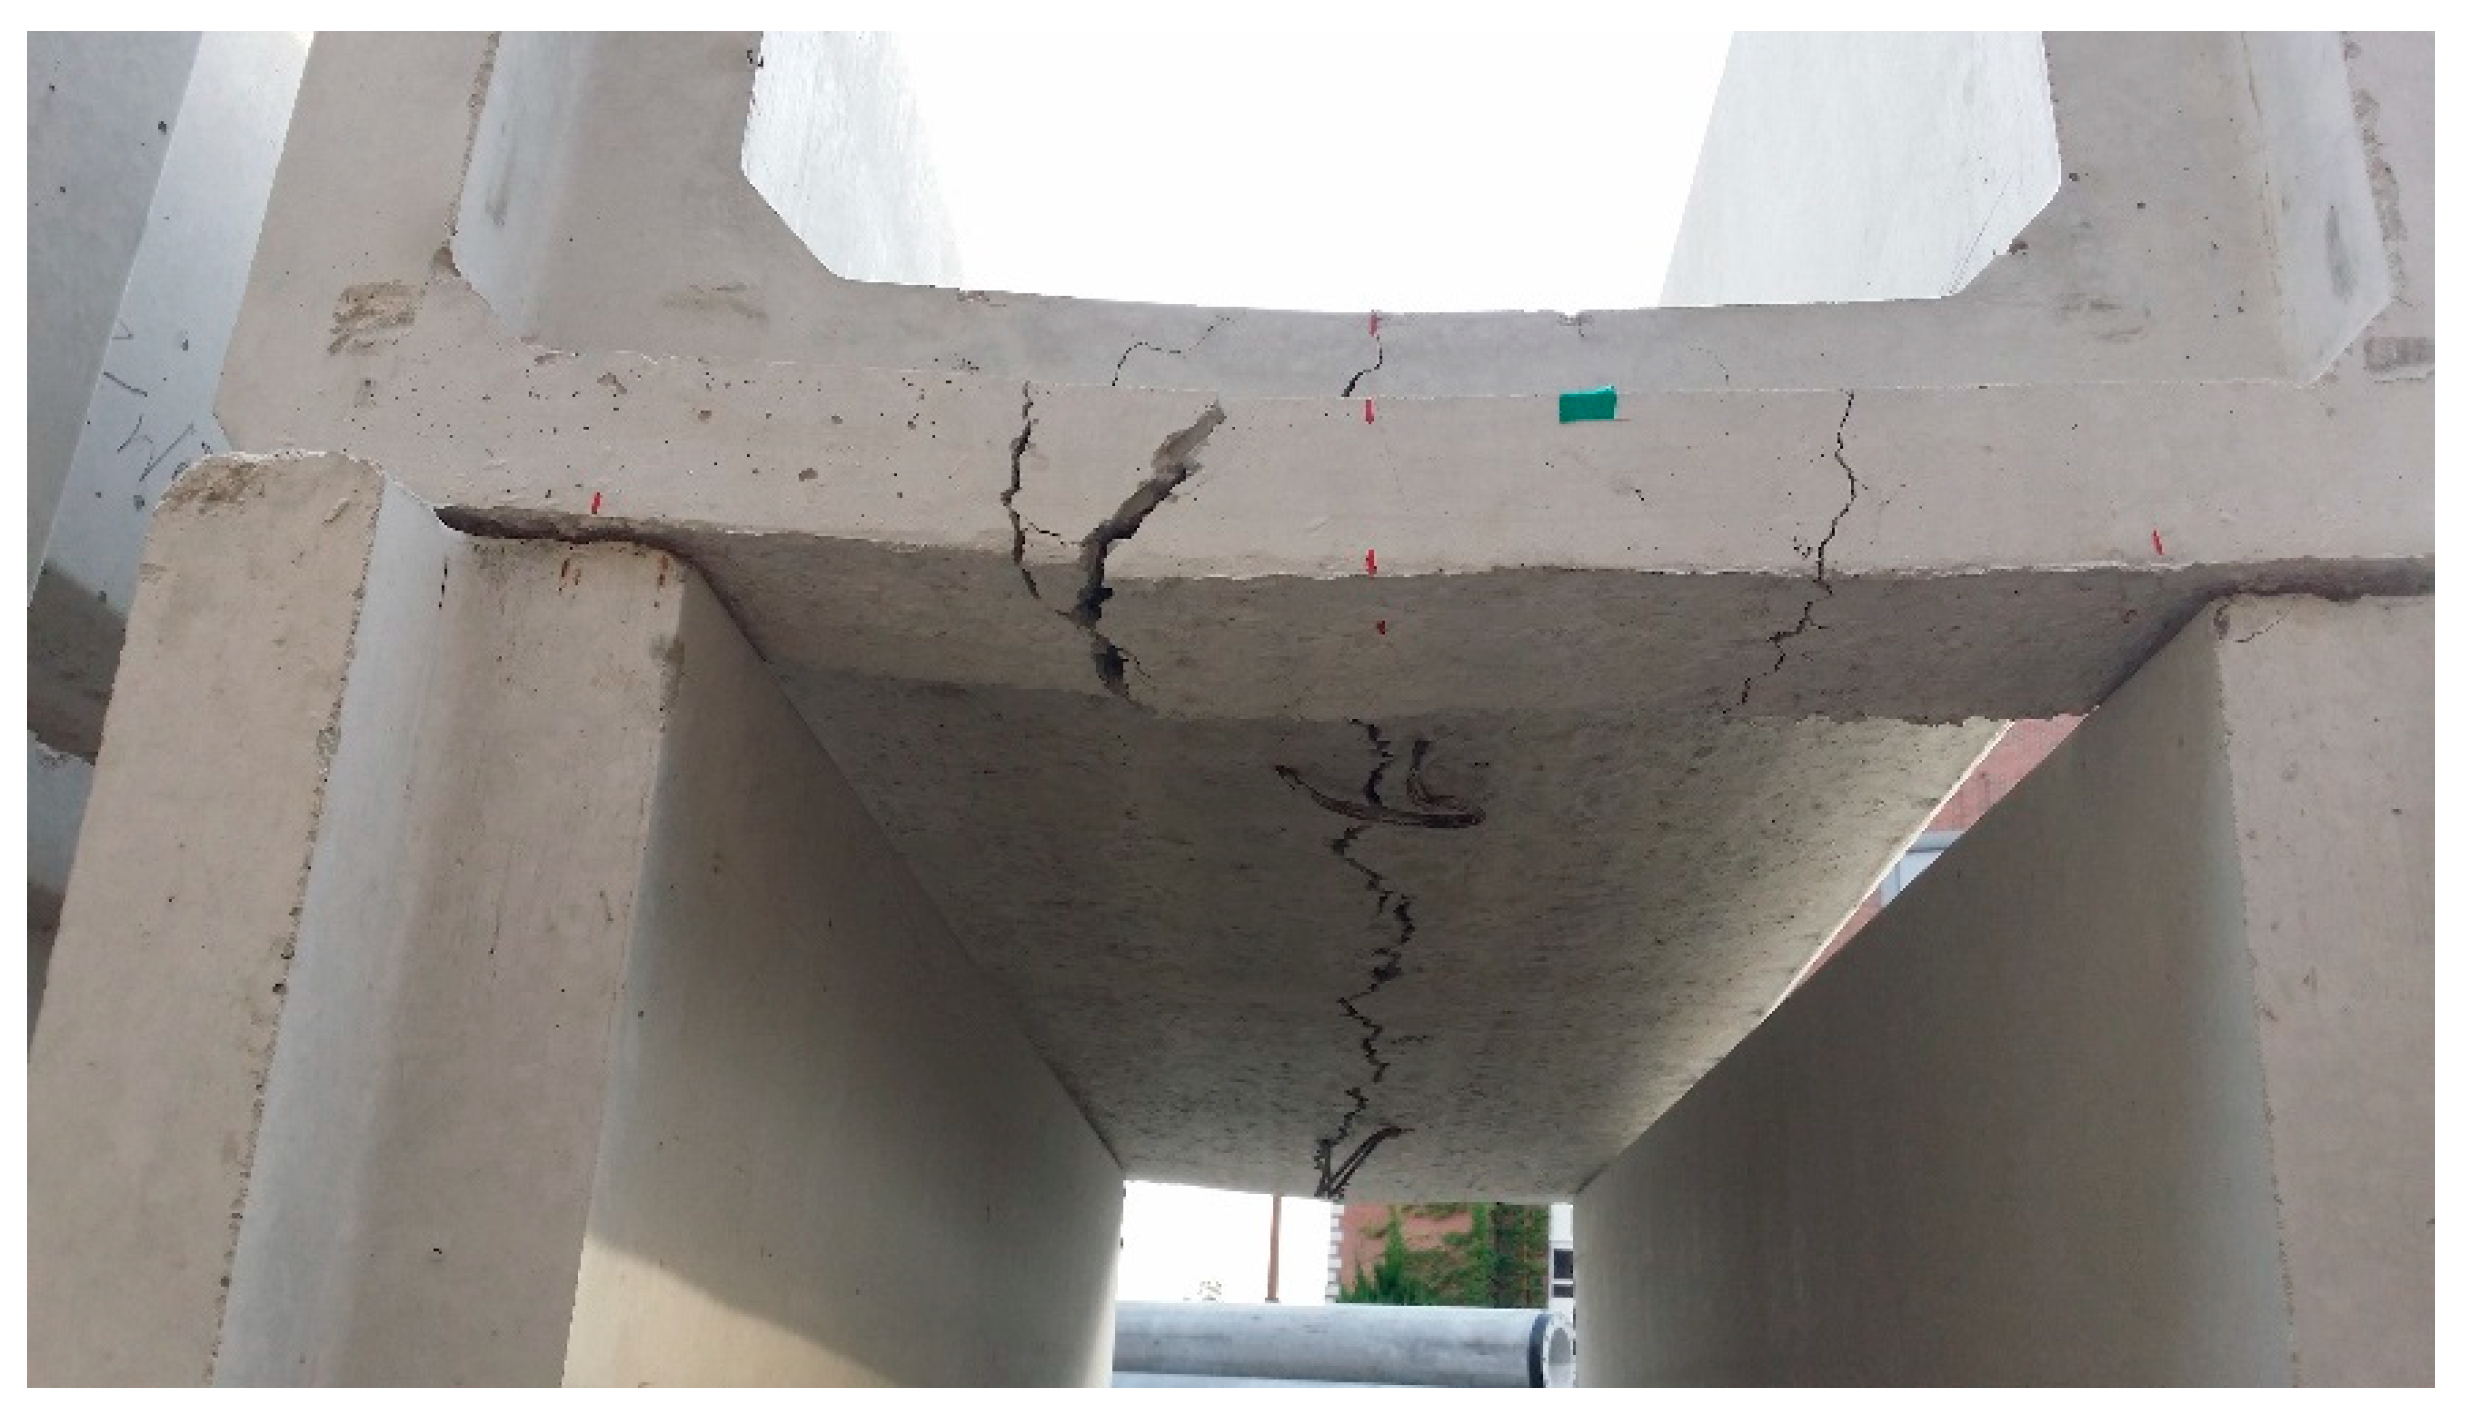
Figure 10.
Relationships of the LWGP concrete flume between the crack widths and the loads.

Figure 11.
Flexural load–displacement curve of the LWGP reinforced concrete flumes.
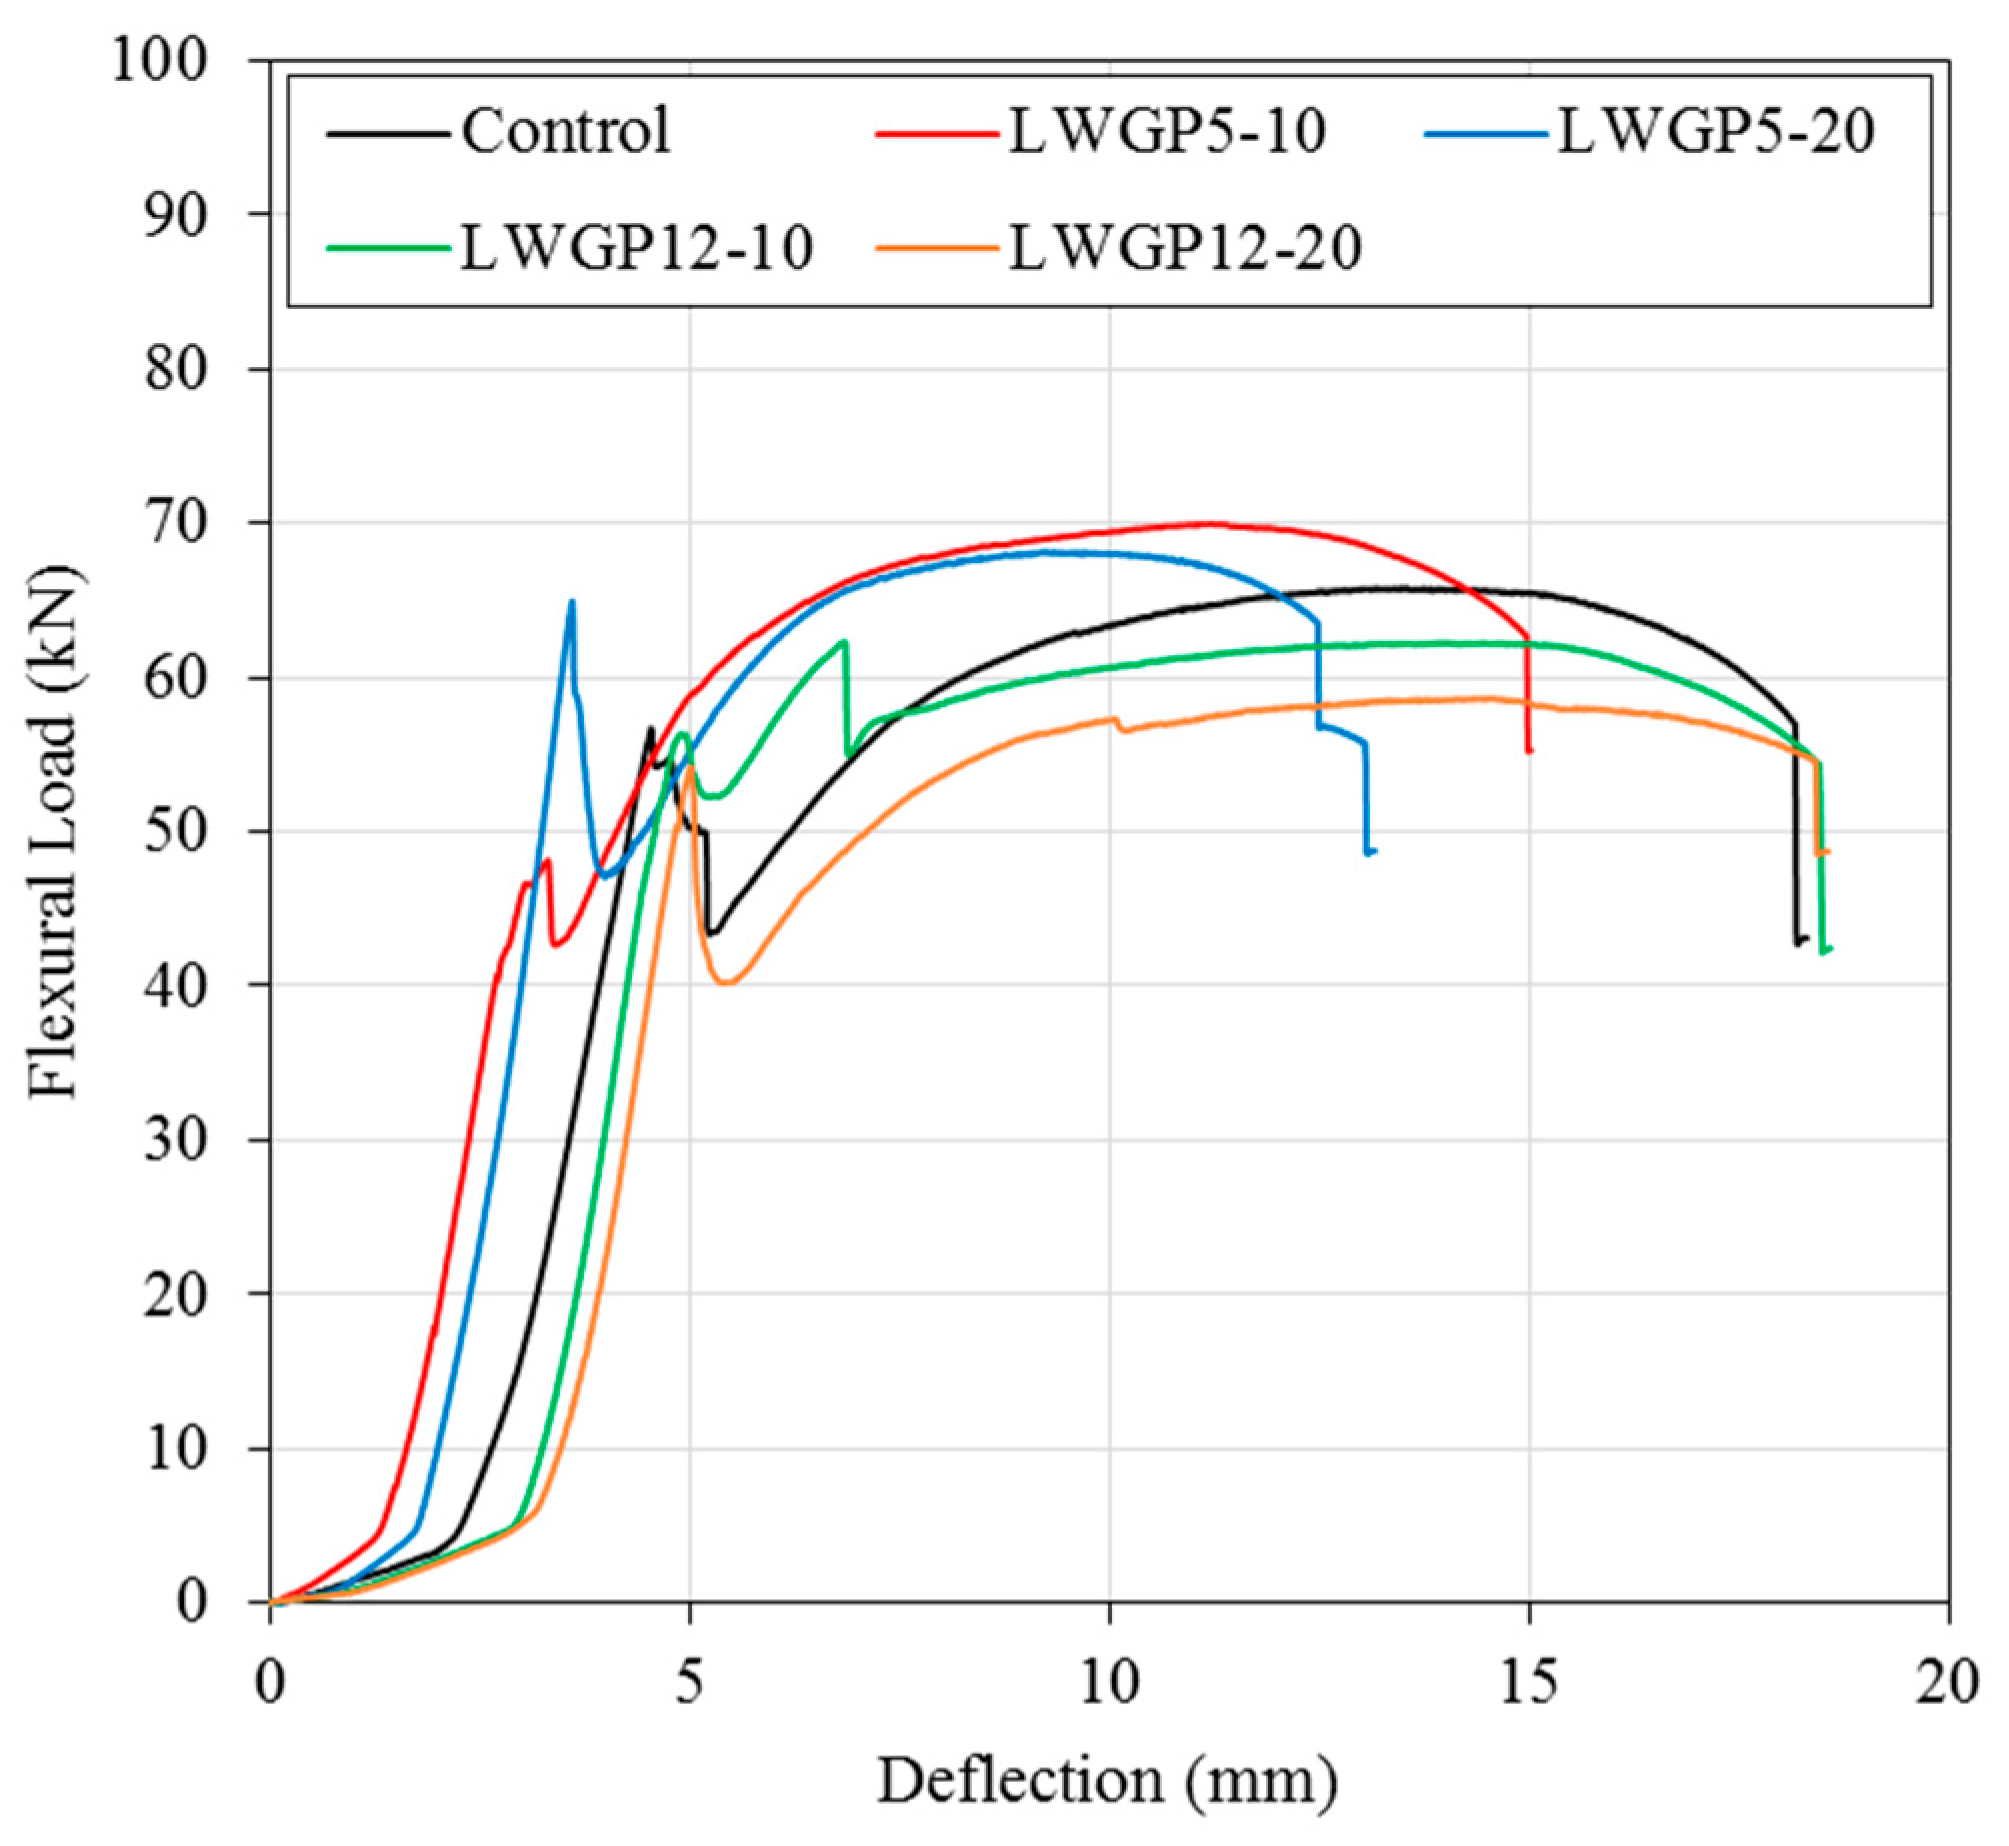
Figure 12.
Comparison of the ultimate flexural load of concrete flumes, flexural load of the LWGP concrete flumes at a crack width of 0.05 mm, and the allowable flexural load of standard.
Figure 12.
Comparison of the ultimate flexural load of concrete flumes, flexural load of the LWGP concrete flumes at a crack width of 0.05 mm, and the allowable flexural load of standard.


Table 1.
Chemical and physical properties of binders.
| Oxide Composition | Specific Gravity | ||||||||
|---|---|---|---|---|---|---|---|---|---|
| CaO | SiO2 | Al2O3 | Fe2O3 | SO3 | Na2O | K2O | MgO | ||
| OPC | 65.42 | 19.09 | 4.06 | 3.11 | 3.79 | 0.10 | 1.58 | 2.85 | 3.15 |
| LWGP5 | 10.00 | 66.90 | 18.21 | 0.08 | – | 0.23 | 0.05 | 0.44 | 2.79 |
| LWGP12 | 10.3 | 65.7 | 18.0 | 0.14 | – | 0.18 | 0.04 | 0.42 | 2.81 |
Table 2.
Physical properties of the fine and coarse aggregates.
| Fineness Modulus | Water Absorption* (%) | Specific Gravity (N/m3) | |
|---|---|---|---|
| Fine aggregate | 2.94 | 1.3 | 2.56 |
| Coarse aggregate | 6.51 | 1.2 | 2.59 |
Table 3.
Mixing proportions of the reinforced concrete flume with the LWGP.
| W/B (%) | S/a (%) | Unit Weight (kg/m3) | |||||
|---|---|---|---|---|---|---|---|
| Water | Cement | LWGP5, LWGP12 | Fine Aggregate | Coarse Aggregate | |||
| 47.2 | 39.6 | 150 | 360 | 0% | 0 | 400 | 1109 |
| 324 | 10% | 36 | |||||
| 288 | 20% | 72 | |||||
Table 4.
Comparison of porosity by the pore size of LWGP concrete specimen at 28 days.
| Porosity | 28 days | |||||
|---|---|---|---|---|---|---|
| OPC | LWGP 5-10 | LWGP 5-20 | LWGP 12-10 | LWGP 12-20 | ||
| Void | > 10 μm | 2.88 | 1.76 | 2.17 | 3.69 | 3.41 |
| Large-capillary | 0.05–10 μm | 9.74 | 5.41 | 3.41 | 8.49 | 9.11 |
| Medium-capillary | 0.01–0.05 μm | 4.30 | 5.07 | 6.33 | 3.46 | 3.01 |
| Small-capillary | < 0.01μm | 0.87 | 1.56 | 1.36 | 0.69 | 0.72 |
| Total | 17.79 | 13.79 | 13.27 | 16.32 | 16.24 | |
Table 5.
Compressive and flexural load results with the crack width.
| Flexural Loads of the Reinforced Concrete Flumes | ||||
|---|---|---|---|---|
| Pu(kN) | Pcr(kN) | Wcr(mm) | Normalized Pcr/Wcr(%) | |
| OPC | 65.66 | 56.59 | 0.0501 | 100 |
| LWGP5-10 | 69.92 | 50.01 | 0.0504 | 87.85 |
| LWGP5-20 | 67.99 | 52.89 | 0.0507 | 92.36 |
| LWGP12-10 | 62.21 | 56.10 | 0.0505 | 98.35 |
| LWGP12-20 | 58.56 | 53.89 | 0.0508 | 93.92 |
© 2019 by the authors. Licensee MDPI, Basel, Switzerland. This article is an open access article distributed under the terms and conditions of the Creative Commons Attribution (CC BY) license (http://creativecommons.org/licenses/by/4.0/).
Share and Cite
MDPI and ACS Style
Kim, S.-K.; Hong, W.-K. High Sulfate Attack Resistance of Reinforced Concrete Flumes Containing Liquid Crystal Display (LCD) Waste Glass Powder. Materials 2019, 12, 2031. https://doi.org/10.3390/ma12122031
AMA Style
Kim S-K, Hong W-K. High Sulfate Attack Resistance of Reinforced Concrete Flumes Containing Liquid Crystal Display (LCD) Waste Glass Powder. Materials. 2019; 12(12):2031. https://doi.org/10.3390/ma12122031
Chicago/Turabian StyleKim, Seong-Kyum, and Won-Kee Hong. 2019. "High Sulfate Attack Resistance of Reinforced Concrete Flumes Containing Liquid Crystal Display (LCD) Waste Glass Powder" Materials 12, no. 12: 2031. https://doi.org/10.3390/ma12122031
Note that from the first issue of 2016, this journal uses article numbers instead of page numbers. See further details here.