Article

The Development of Dewatering Predictions of the Velenje Coalmine

Natural Sciences and Engineering, University of Ljubljana, Ljubljana 1000, Slovenija
*
Authors to whom correspondence should be addressed.
Energies 2016, 9(9), 702; https://doi.org/10.3390/en9090702
Submission received: 6 May 2016 / Revised: 24 August 2016 / Accepted: 26 August 2016 / Published: 31 August 2016

Abstract

:
The complex hydro-geological situation, particularly in terms of groundwater, has been a constant threat to the mining carried out at the Velenje colliery since its inception. Of particular interest to the authors are the difficulties presented to the colliery by the adjacent sand aquifers, as the water pressure within these sands directly impacts mining safety, and the aquifers themselves are most directly affected by dewatering. In order to monitor water levels and estimate dewatering at the Velenje wells, multi-layered modelling using 3D Finite Difference Method (FDM) has already been carried out. However, FDM is not optimal due to its greater dependence on cell size than on water flow. In 2017 in Velenje, a series of wells will be terminated as a result of mining and mining-induced subsidence, leading to dewatering and danger of flooding. As part of a plan to address this by replacing dewatering structures, a series of drive-in filters will be implemented around the entry and exit point tunnels of a longwall face. Because FDM seems to be inadequate for purposes of optimising this process, the Finite Elements Method (FEM) was applied in this case. Based on such an application of FEM, a prediction of the optimisation of drive-in filters was carried out by the authors.

1. Introduction

The Velenje colliery is among the largest in Europe, as well among those with the most modern equipment. Positioned in the north-eastern region of central Slovenia, in the midst of the tectonic depression that is part of the Šalek Valley, it is packed with more than 1,000 m of Pliocene sediments. The latter exemplify a full sedimentation cycle, covering, in both directions, the terrestrial, swamp and lake phases of such a cycle. This progression is occasionally interrupted by fluviatile sediments coming from the north or north-west [1].
Beginning in the final years of the 19th century, coal extraction has continuously been taking place in the Velenje coal mine. From this time until present day, several methods of excavation of wide coal have been tested. In the first half of the 20th century, room, pillar and block caving were employed, while in the latter half, an improved longwall mining method named the Velenje longwall method became the favourite [2,
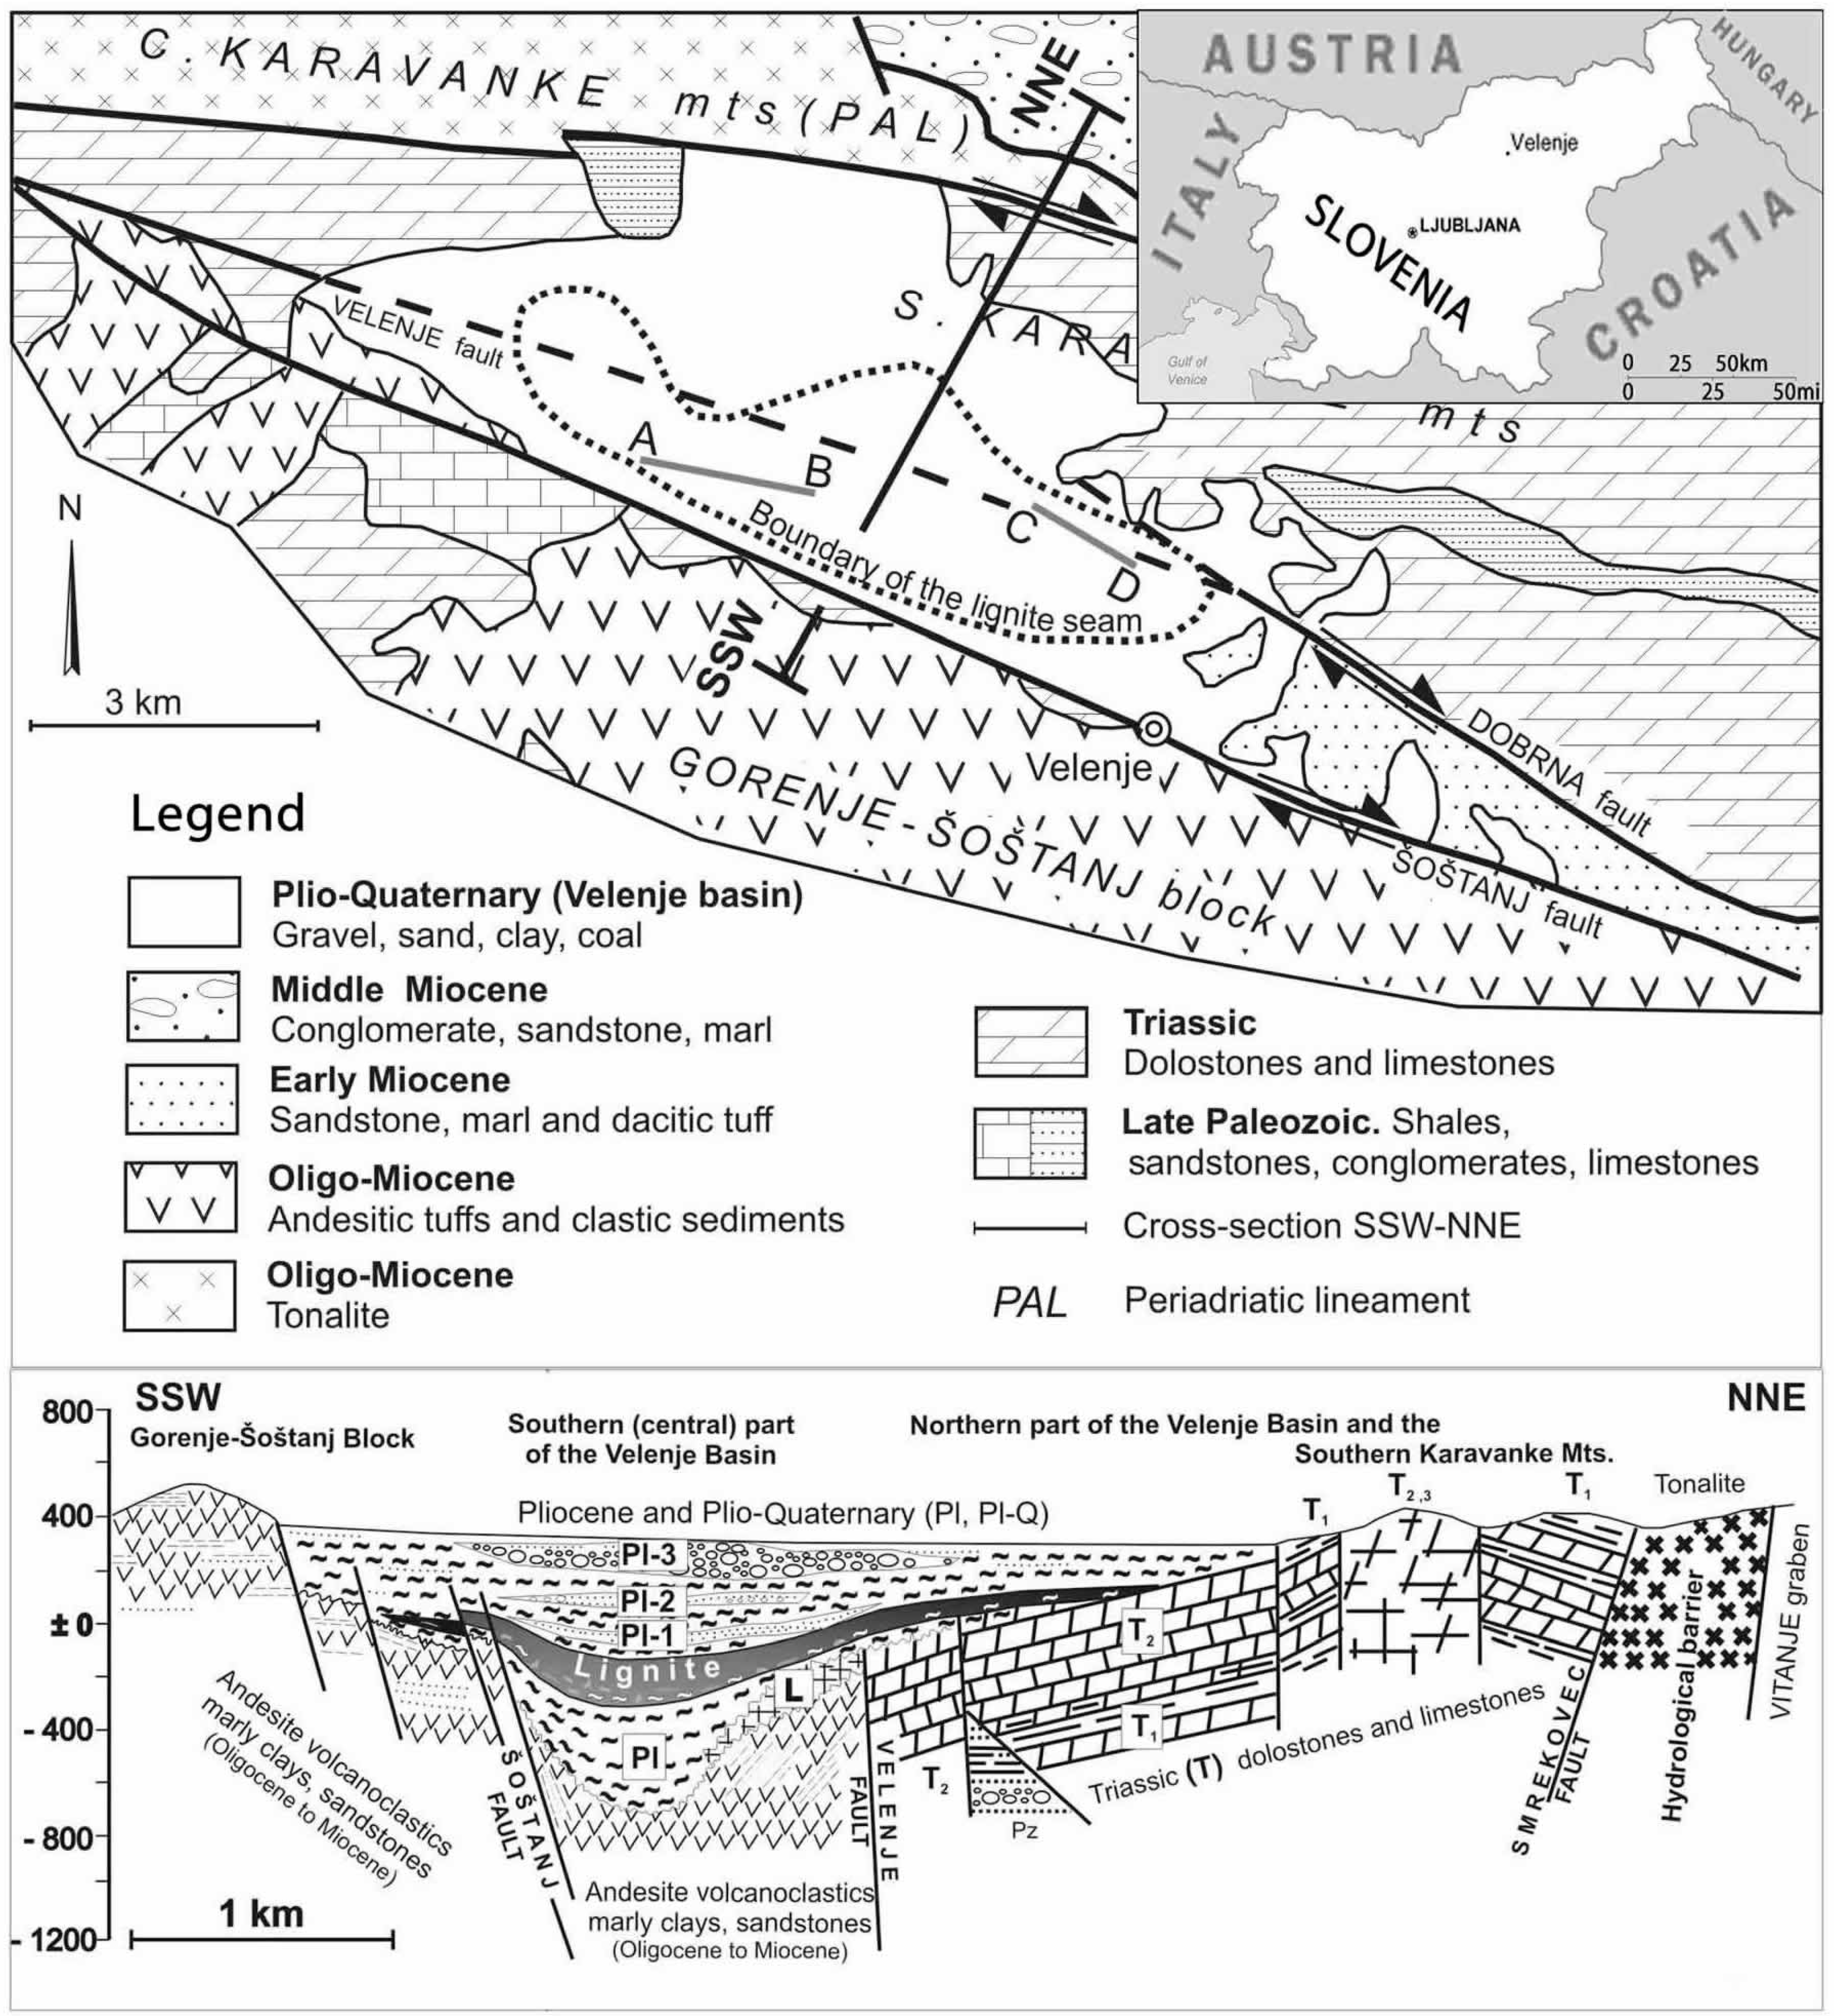
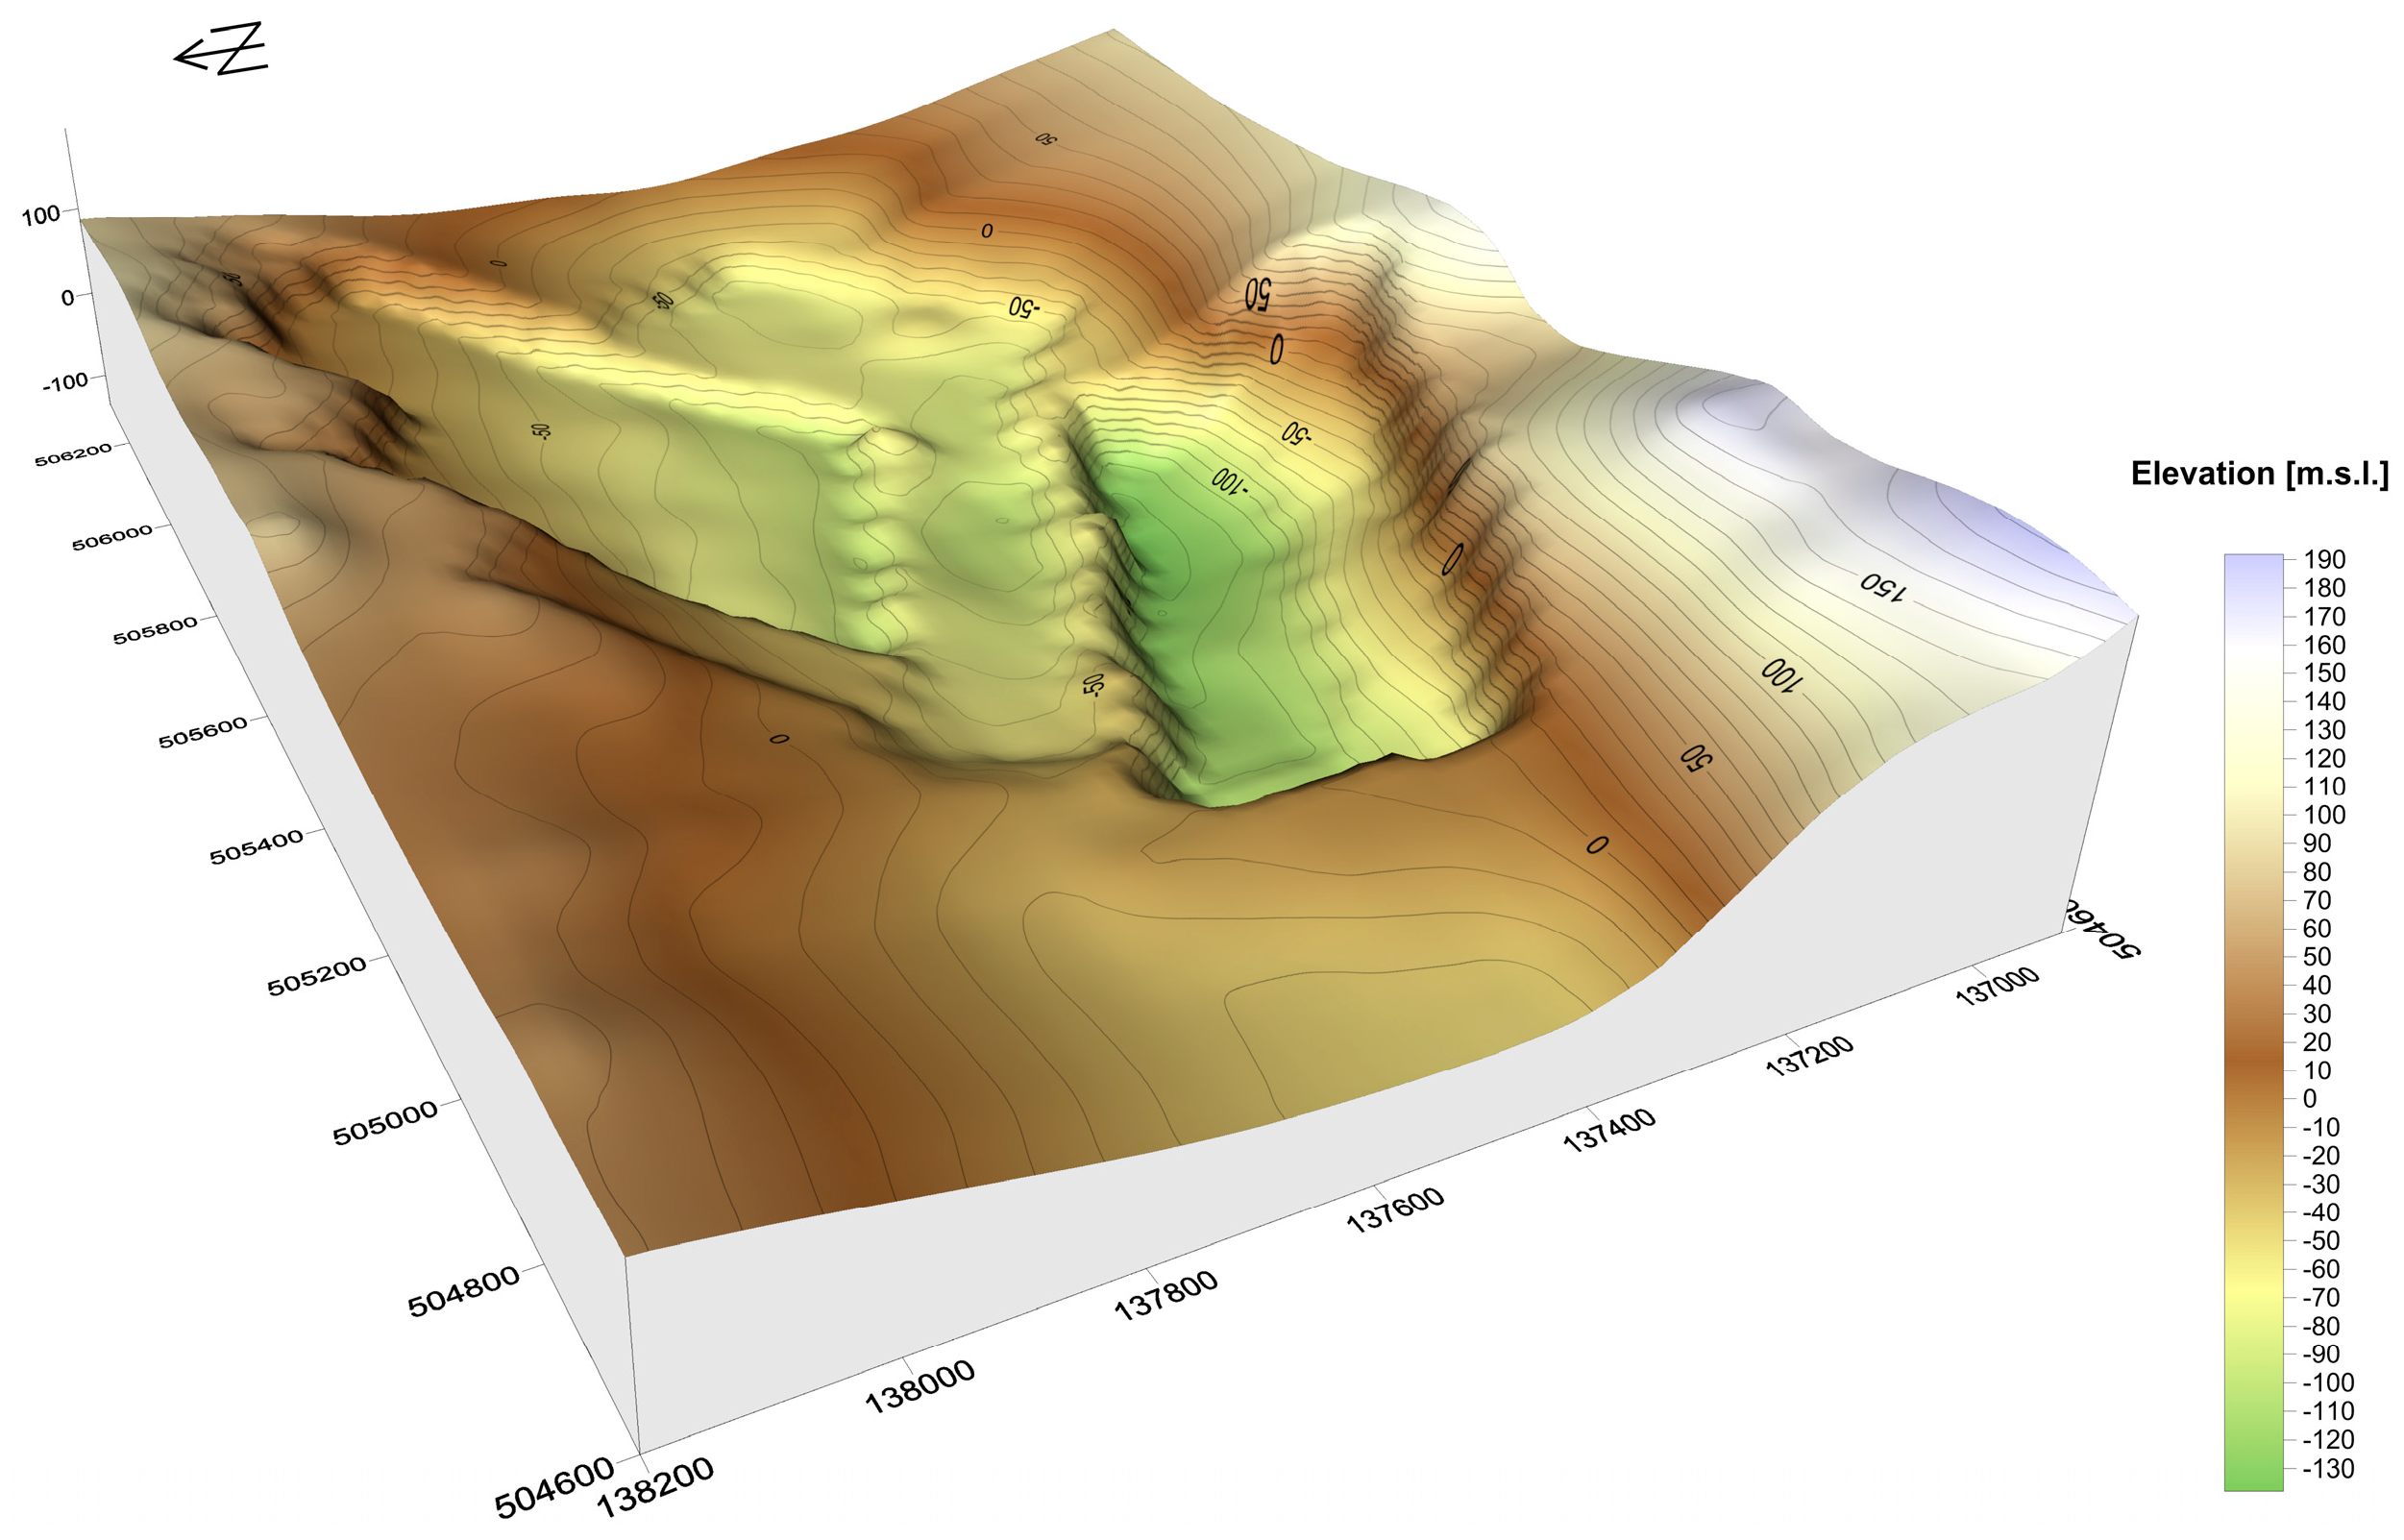
3]. Taking advantage of the truly astonishing dimensions of its coal seam, an approximately continuous body measuring 8.3 km in length, 2.5 km in width, more than 160 m in thickness and anywhere from 200 m to 500 m in depth, the Velenje colliery produces lignite. In its centre, the exploitable part of the coal seam measures up to 168 m in thickness and is deposited at a depth of approximately 450 m. In its margins, the seam is nearer the surface, with a deposited depth of only approximately 100 m, as seen in Figure 1 [4]. In its lower part, there is an increase of ash content in the seam, however, its upper margin is immensely sharp. The seam lies beneath a covering of marlstone, as well as beneath either laminated or massive mudstone as part of which water-bearing sands or leans of gravel of altering size appear.
There is also what is called an isolation or protection layer positioned above the coal seam and beneath the sands that cover it. This layer keeps water or mud from spilling into the excavated areas of the colliery [2]. However, when large, open areas are mined, the protective layer is in danger of cracking, which would result in the multiple layers of sand and gravel aquifer lying above the lignite seam coming into contact with it. As a result of this, in the multilayered aquifer, groundwater pressure must be monitored at all times [6,7] and models of the groundwater situation must be created in order to predict the underground hydrological situation.
In the past, the standard way to do this was using FDM numerical models, while the most effective predictions pertaining to the Velenje colliery were obtained through the use of Visual ModFlow. However, in spite of its success and popularity in Velenje, the former is limited in terms of its ability to make predictions about the hydrological situation in the short term, a well-known problem to which different potential solutions may be applied [8]. At the centre of this problem is the fact that the FDM method produces models of groundwater drawdown that are not as reflective of the fluid's movement as of its cell size [9].
In terms of the hydrological situation, in Velenje, three different hydro-geological systems can be found: the upper Quaternary, the Pliocene-Quaternary and the Pliocene [2,3,7,10]. The upper Quaternary system is topmost, the Pliocene-Quaternary at its lower border and the Pliocene in the lowest position. The latter is also separate from the coal seam, a consequence of both the previously mentioned isolation layer and the floor aquifers that are present within the aquifer layers of the Triassic dolomites to the north of, the lithotomic limestone in the centre of, and the Pliocene layer above the coal seam [4]. In 1981, roof aquifers were divided into Quaternary and Pliocene aquifers, based on the degree of groundwater in a single aquifer, as well as on reactions to pumping, chemical analysis and geophysical characteristics [10,11,12,13]. The Pliocene aquifers were further divided into three categories, namely the aquifers directly above both the coal seam and the layer of isolation directly above it, Pl1, the aquifers lying from 20 m to 80 m above the coal seam, Pl2, and the aquifers lying where the upper Pliocene layer is, Pl3 [1,5,7,13,14,15]. Examining the division from a point of view that prioritises safety, the Pl1 and Pl2 aquifers are the most crucial to keep an eye on, as the high degree of pressure present inside them can directly affect the underground works being done in their immediate vicinity [1,7,
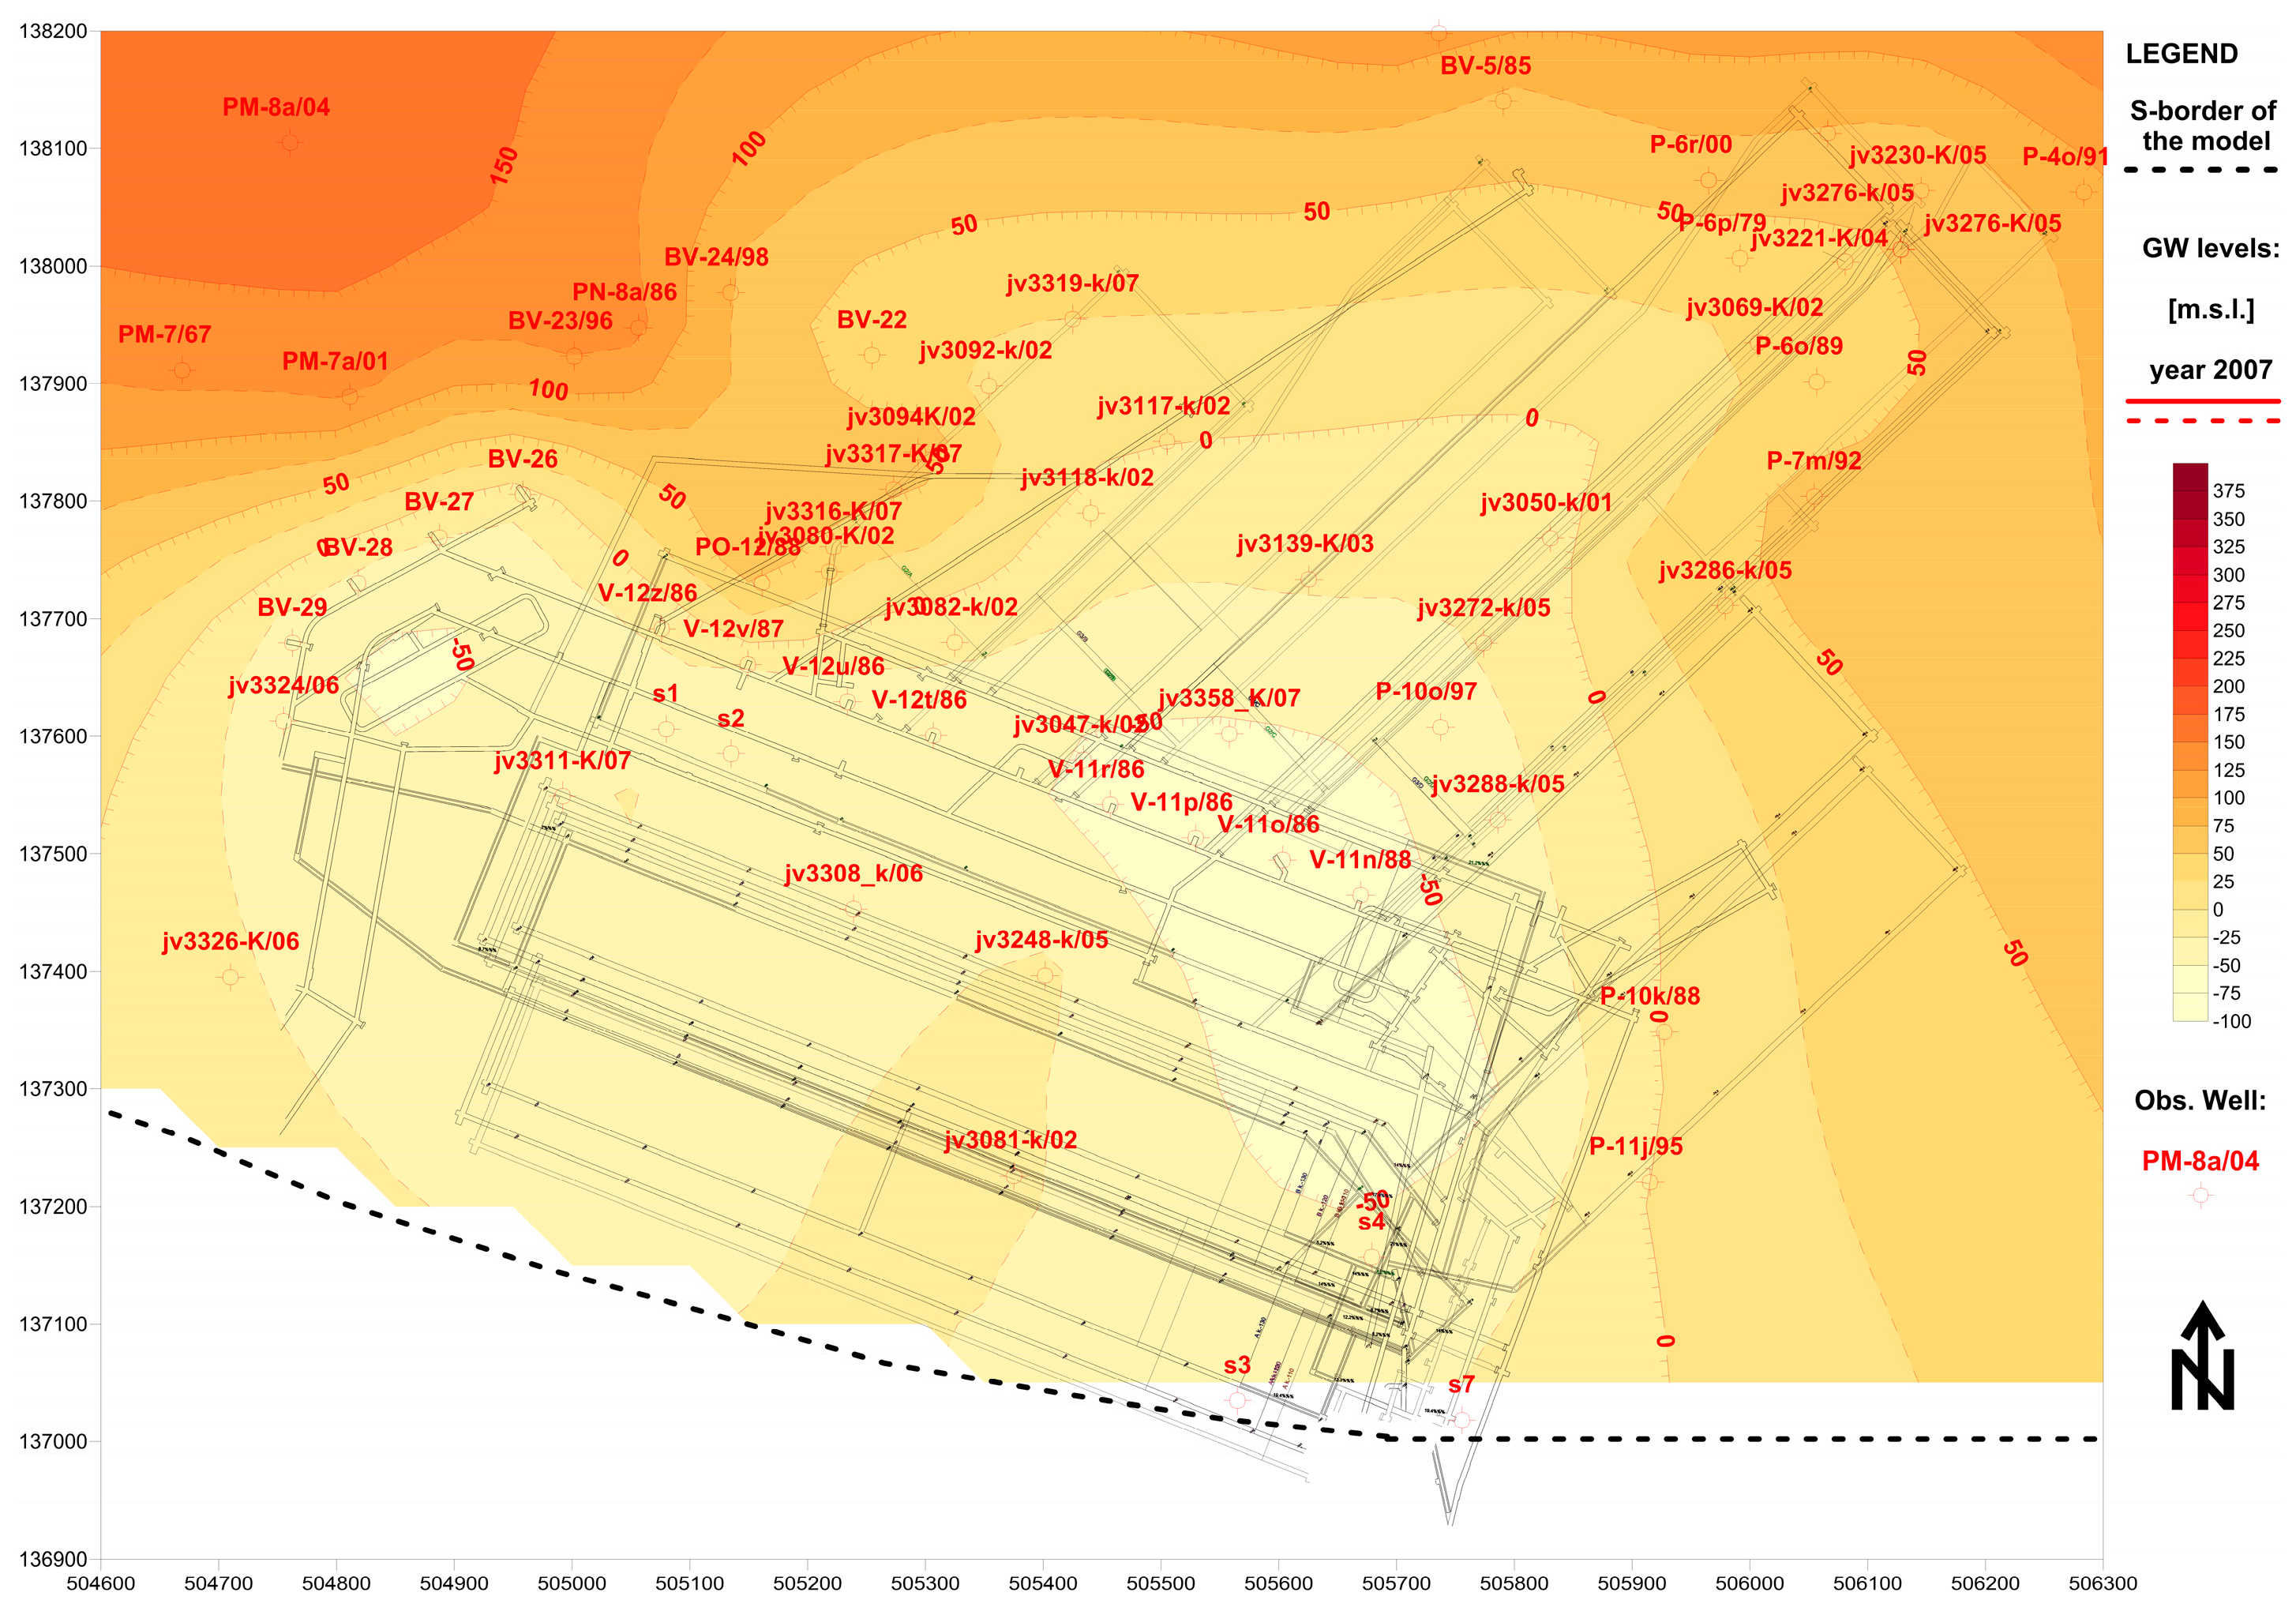
10]. As an illustration the degree to which the first, Pliocene sand-bearing waters have increased in the year 2007 is displayed in Figure 2 below.

2. Materials and Methods

It is evident from previous studies [1,2,3,7,10,
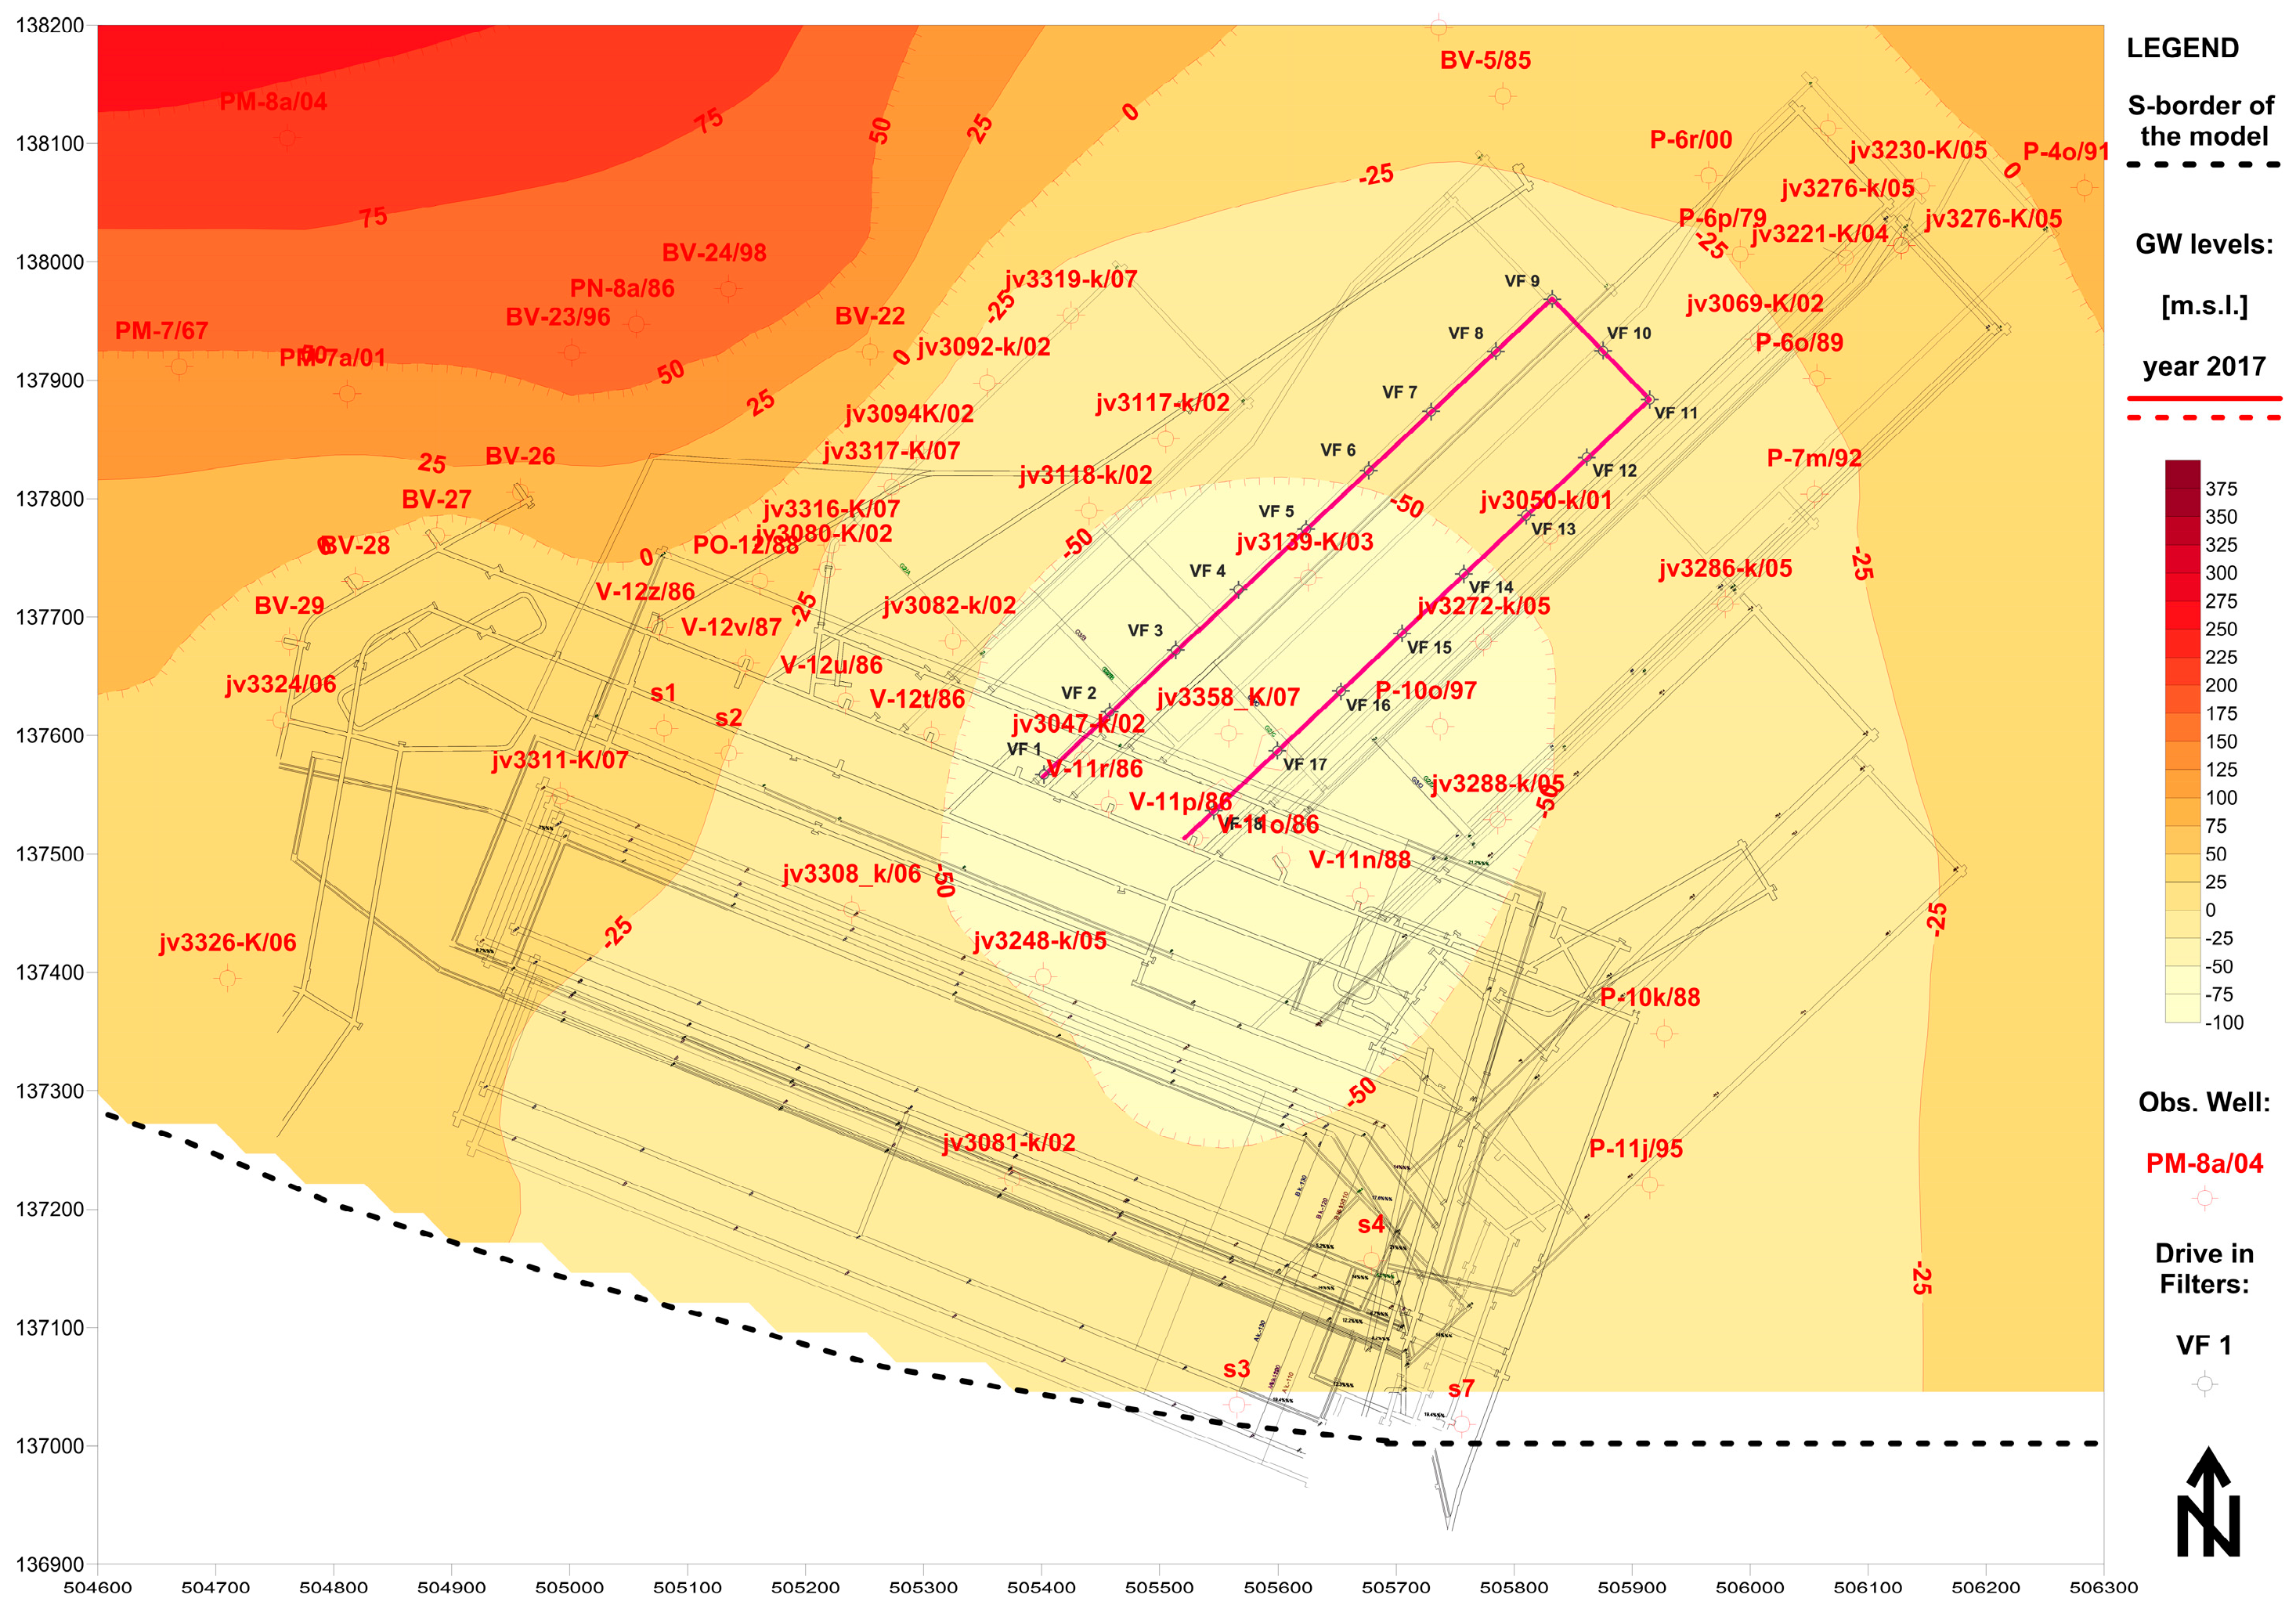
14] that underground works on the coal seam in Velenje will inevitably lead to an increased presence of open spaces in the coal seam, into which the materials lying above with ground water in it will tend to seep. The effects of mining in the Velenje colliery will also affect the rates of pumping, and the pumping wells depicted using red circles in 
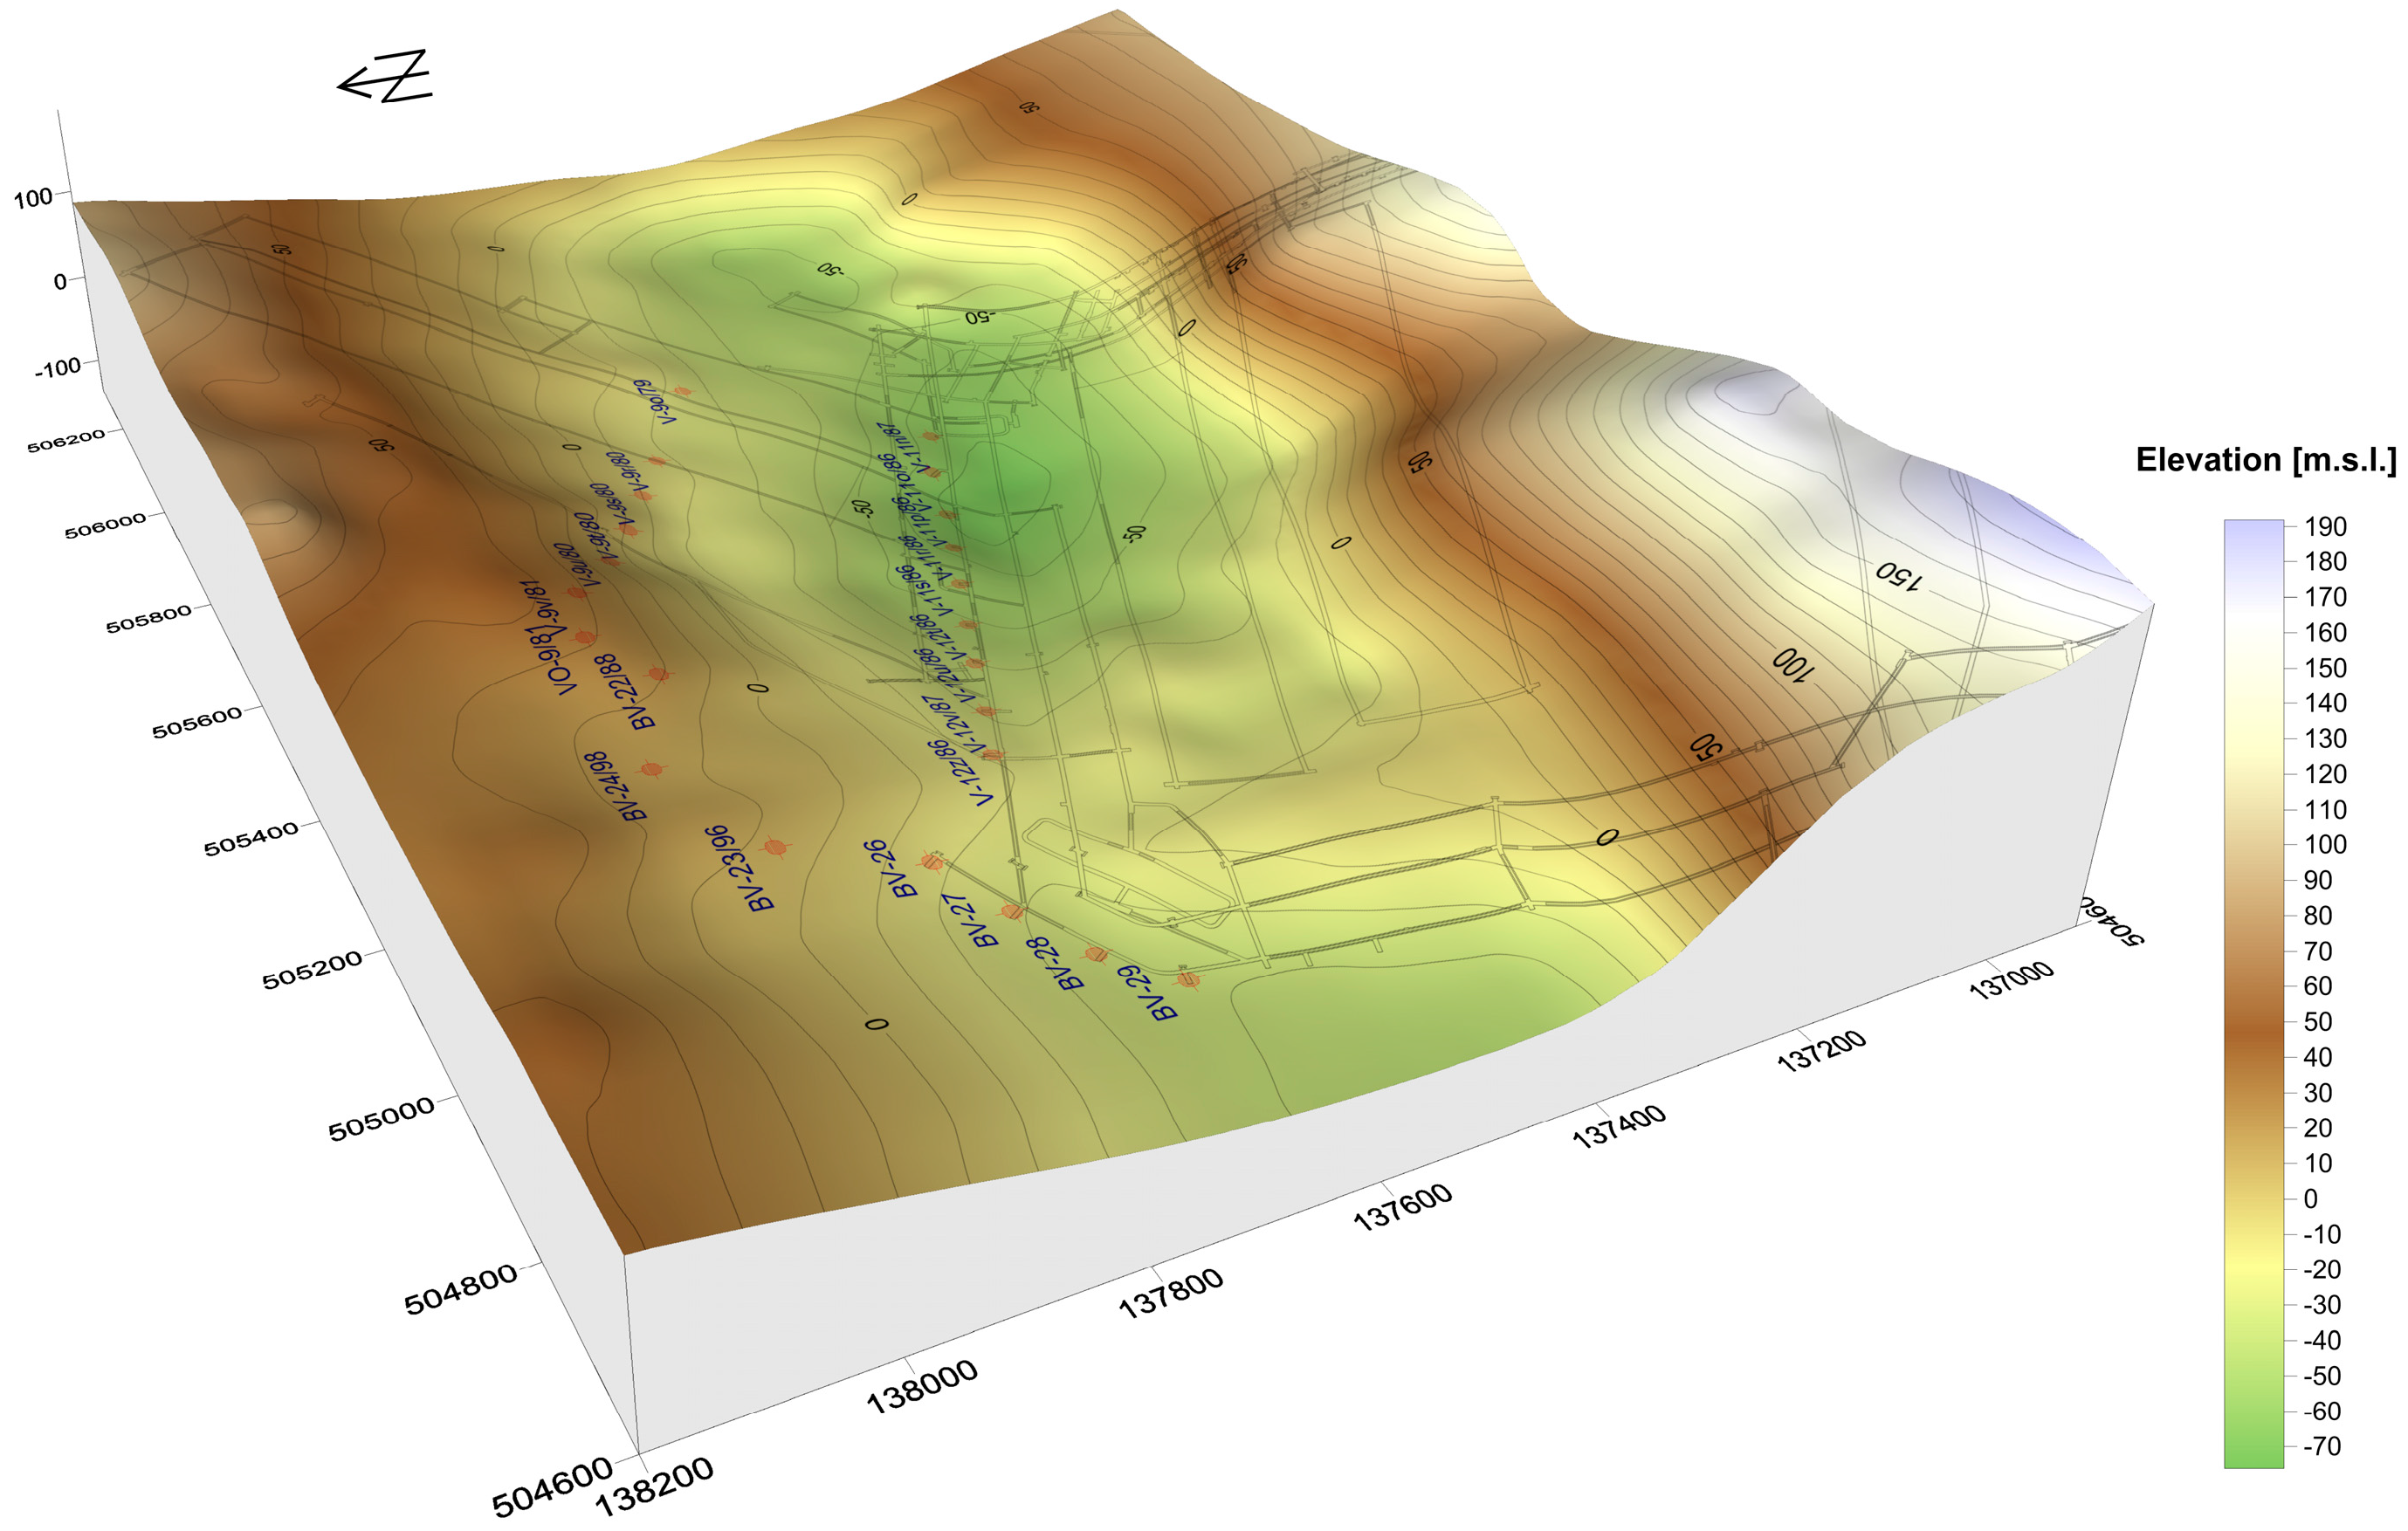
Figure 2 are expected to stop being workable in 2017, a result of the means of coal excavation directly beneath the wells. Consequently, the elevation of Pl-1 and Pl-2 is expected to change to the situation depicted in Figure 3.
As it turns out, the pressure levels in the groundwater in the Pl-1 and Pl-2 sands are crucial [1,2,3,7,10,14]. Employing data obtained with the aid of multilevel piezometers, the authors of this article were able to establish groundwater level, as depicted in 
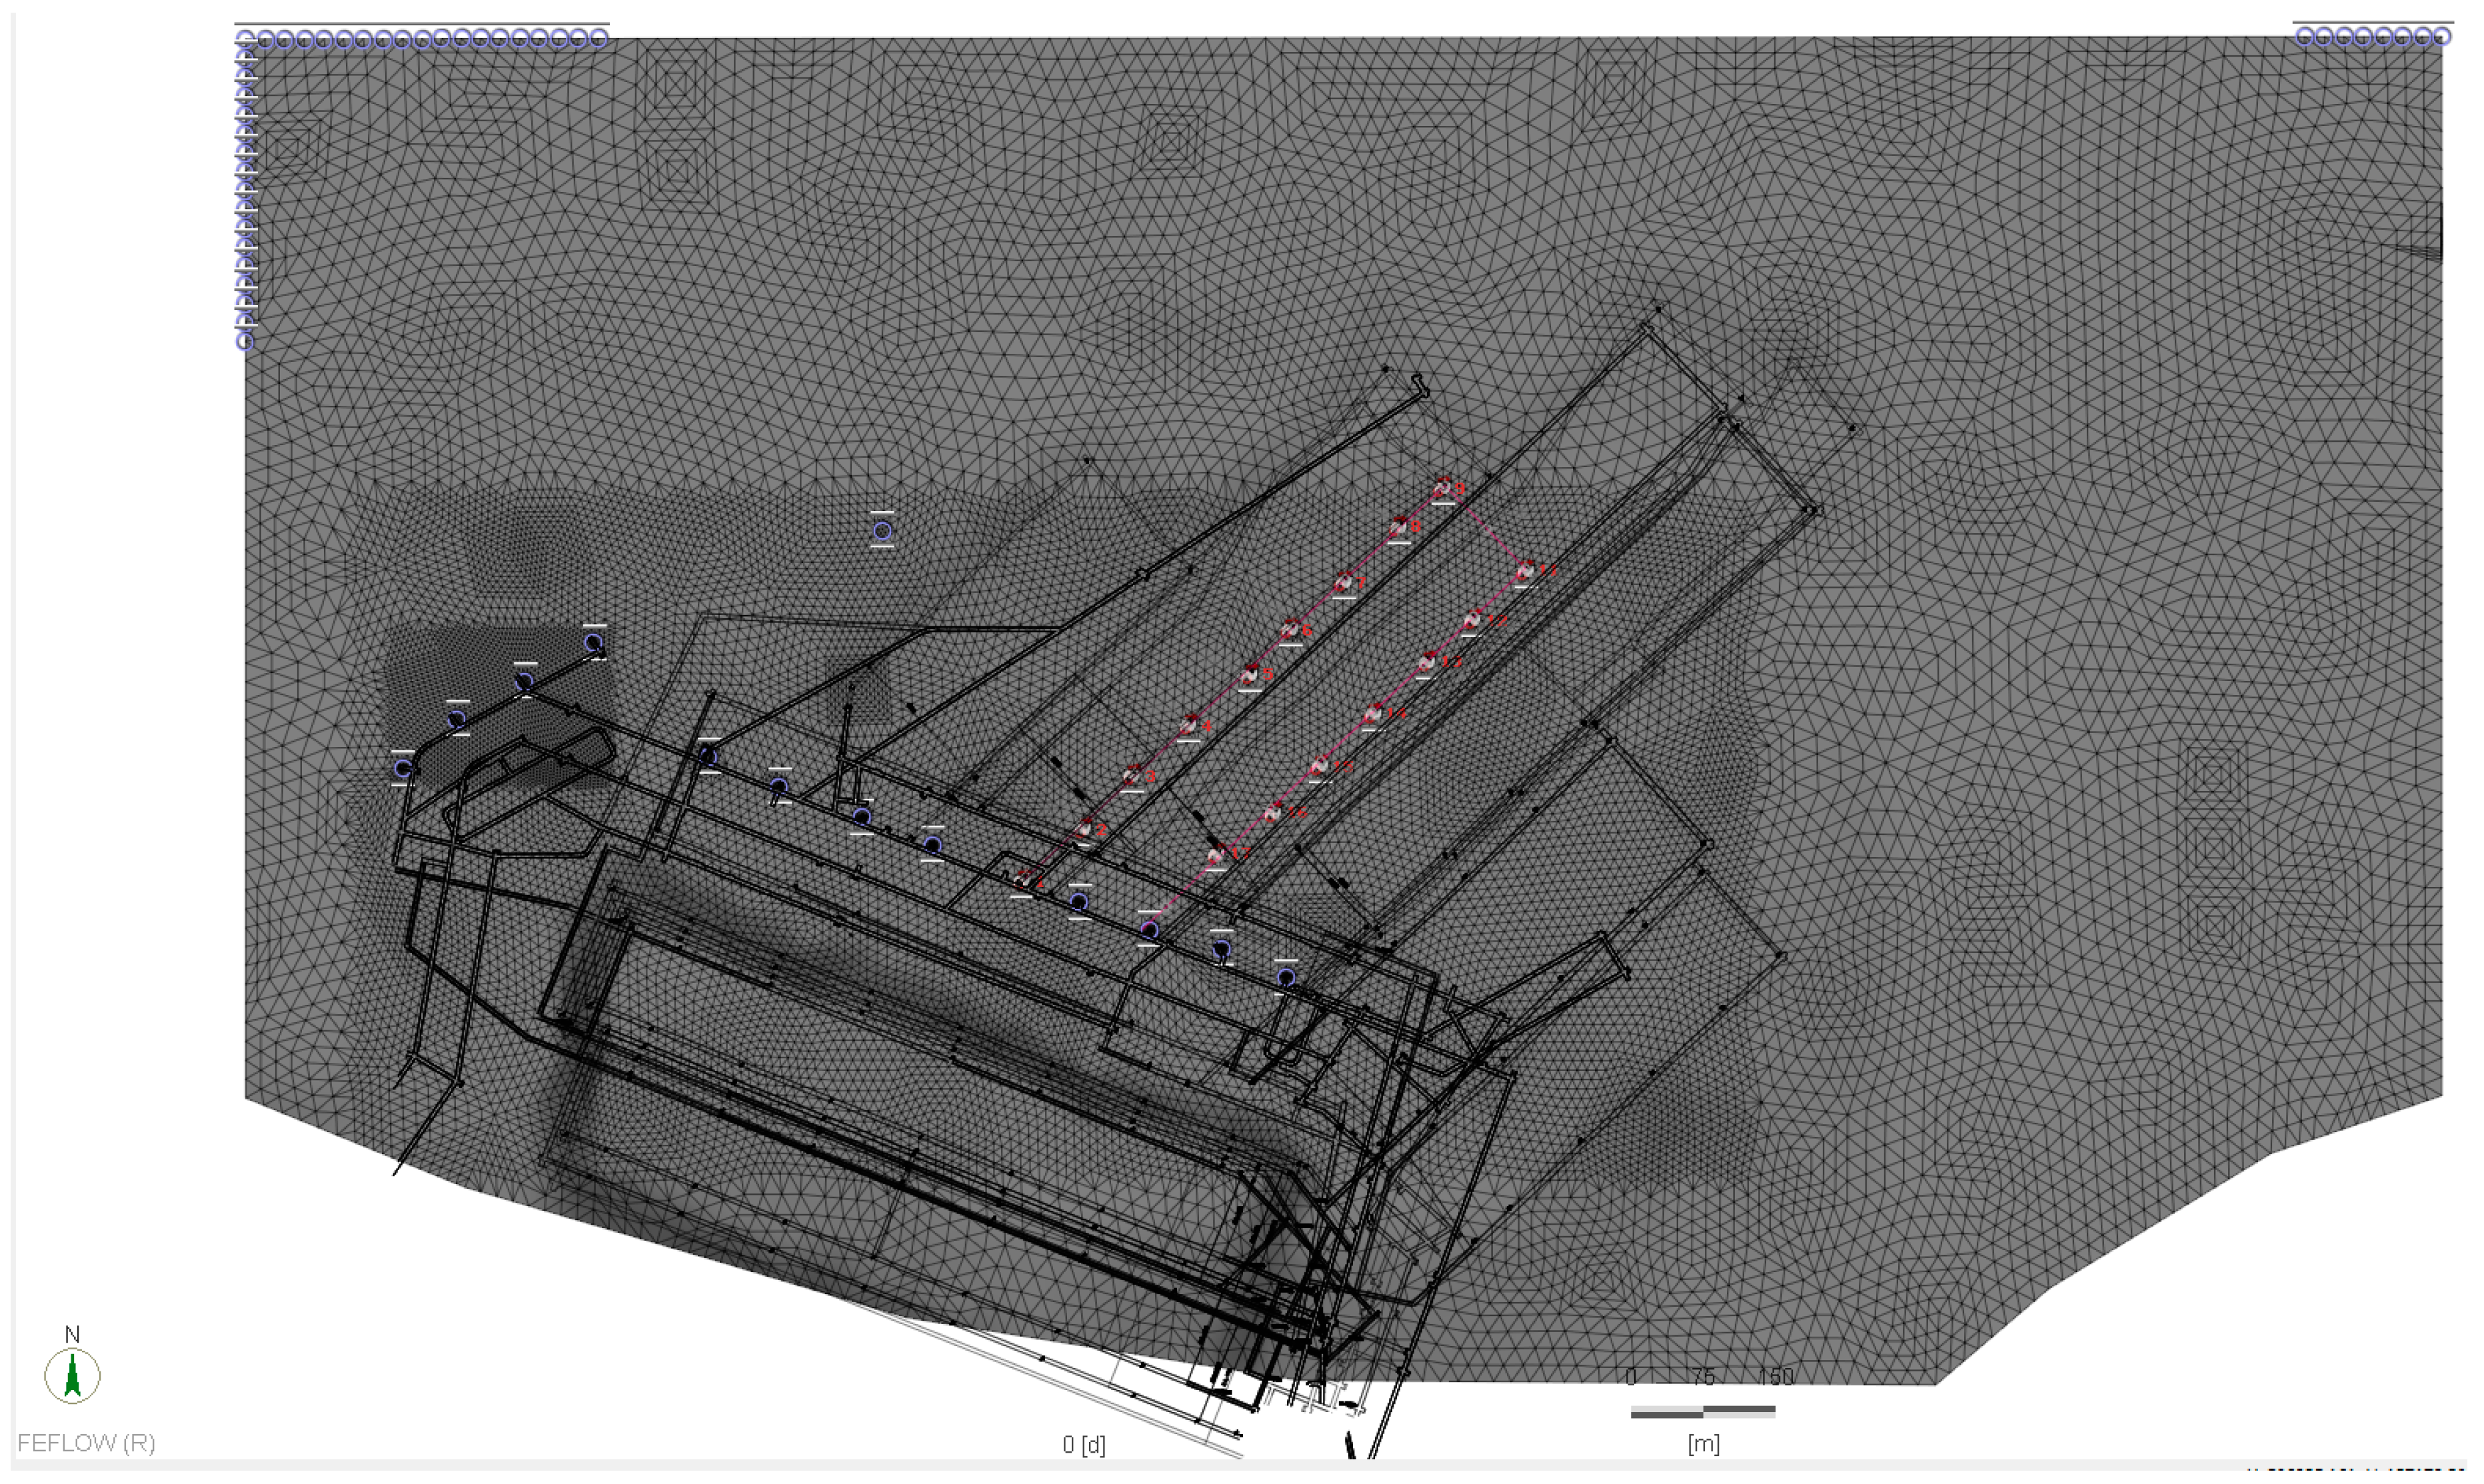
Figure 4. It is evident that groundwater depression will result from the practice of long-term dewatering in the colliery that is a result of water extraction using pumping wells. In order to minimise the effects of such closed pumping, thus-named drive-in filters will be implemented at the bottoms of vertical pumping wells, as depicted in Figure 4. These drive-in filters will not start functioning simultaneously, but will start and stop their function depending on the process taking place at the time as part of the longwall excavation method.

3. Results and Discussion

In order to be able to predict the effects of material seeping from above into the coal seam in the Velenje colliery, it was necessary to shut down the excavation battery as part of mining and replace the shut-down wells with drive-in filters strategically placed around the longwall face that was at the entrance and exit points of tunnels, as presented in Figure 4. For this, a 3D FEM was used, while for modelling purposes, a FeFlow 6.1 program used to model flow, mass and heat transfer was chosen.
Having obtained the grids displayed in Figure 2 and 
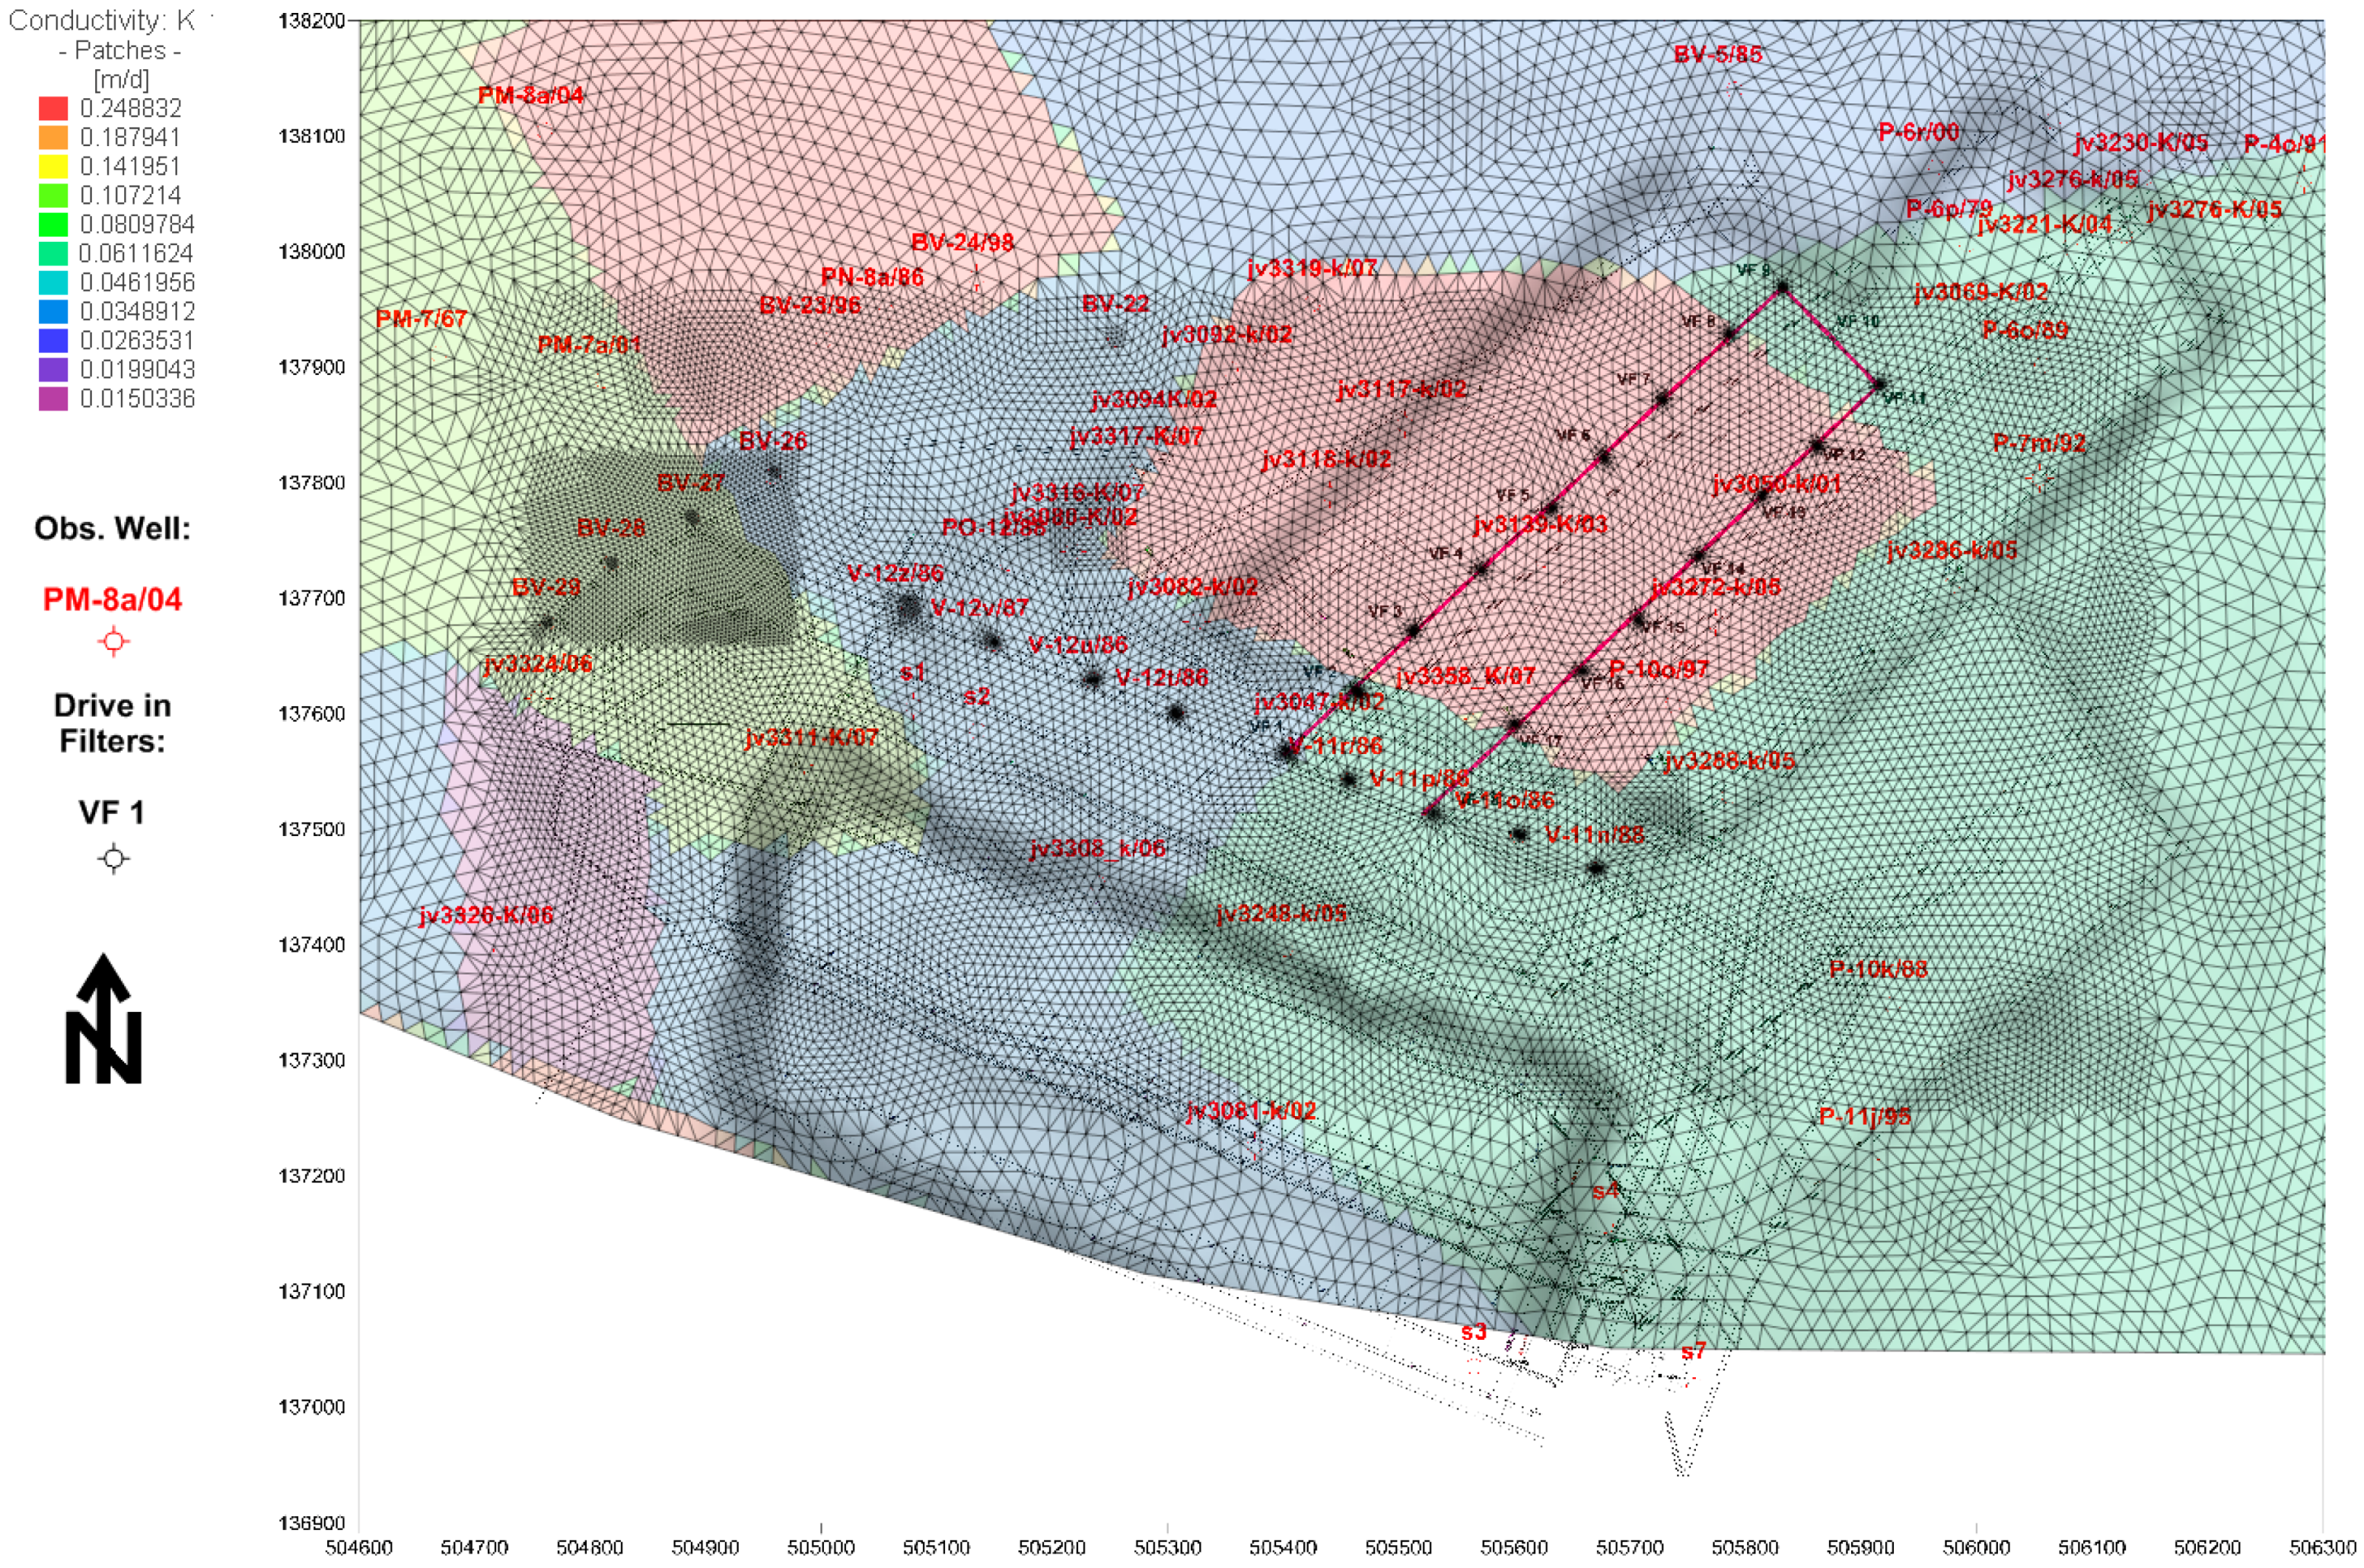
Figure 4, the authors first calibrated the model using FeFlow 6.1 so that it would reflect the current hydrological and mining situation, and then defined the calculated and calibrated model to the initial condition. Model calibration was performed primarily by changing the values in areas (Figure 5) with different hydraulic conductivity (k) using PEST. The different hydraulic conductivity areas were defined according to prior pumping test and to FDM results [1,3,7,10,14]. The inflows from the northern, north-western and north-eastern parts were also taken in account during the calibration and compared with previous findings [1,3,7,10,
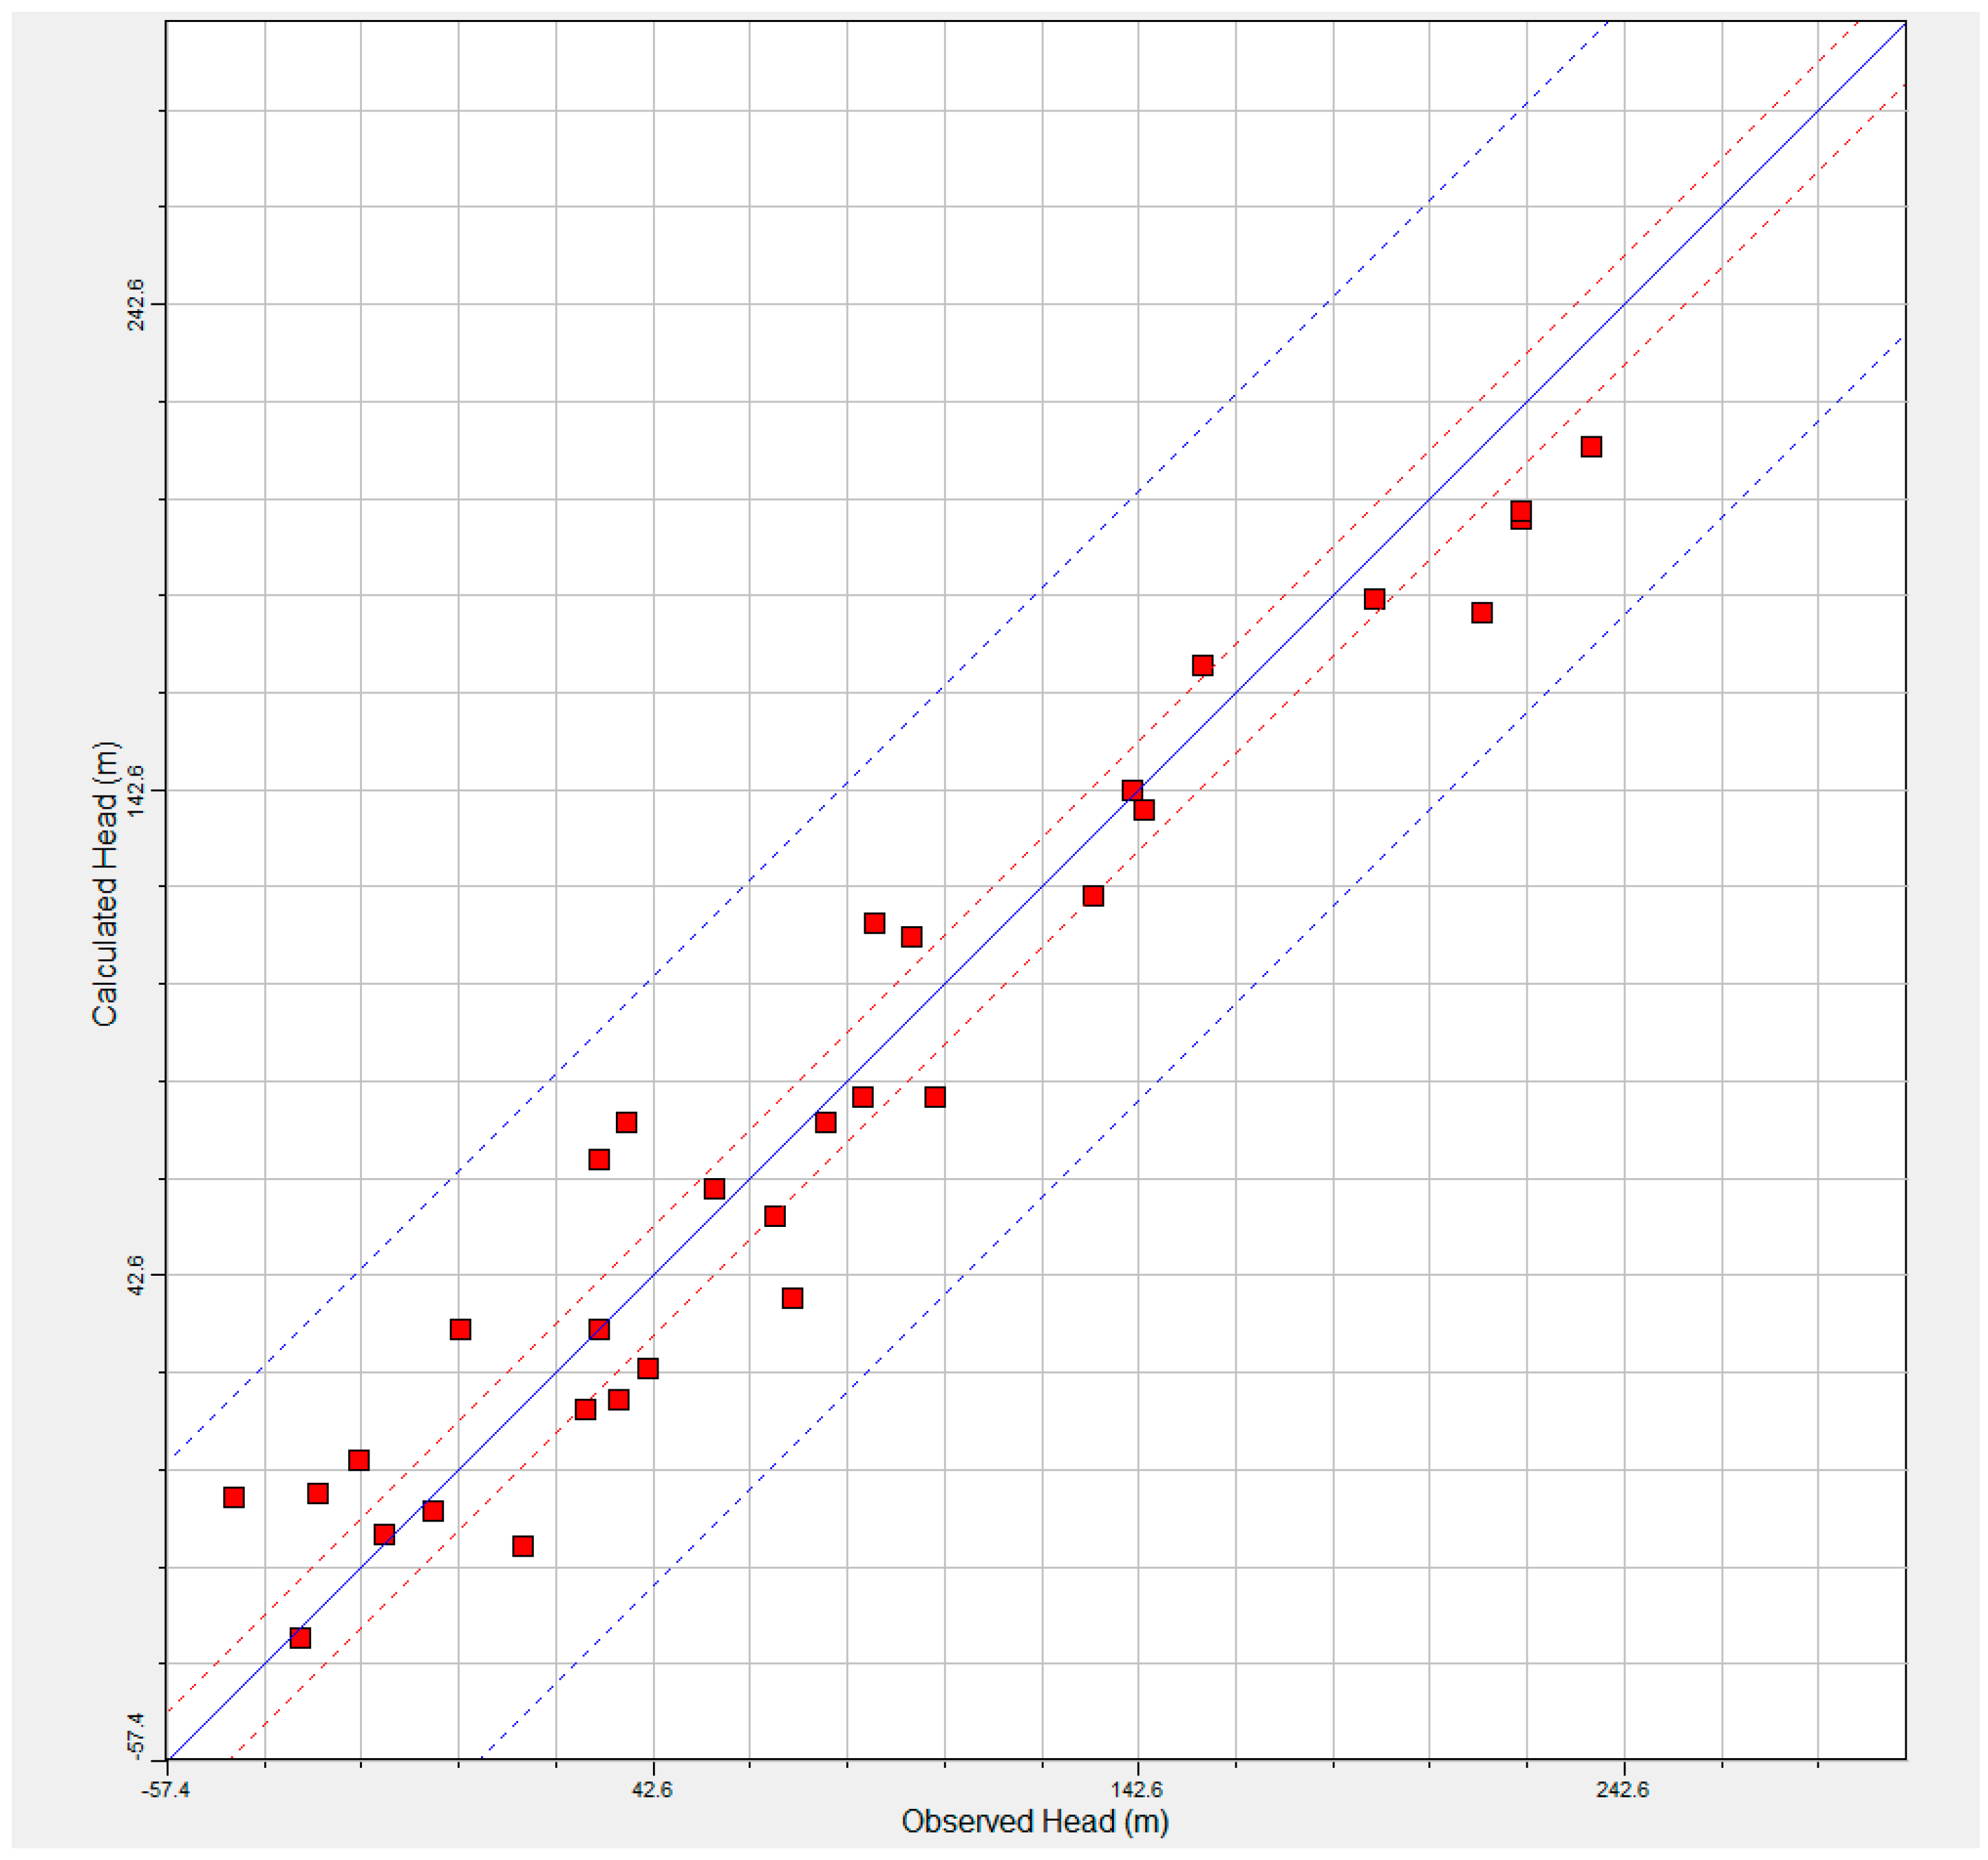
14]. The results of modeling are new values of (k) (Figure 5) with the RNMS around 7.49% (Figure 6). As mentioned before, in order to determine the boundary of flow, the authors chose the Dirichlet boundary condition for the northern, north-western and north-eastern parts of the model, as depicted in Figure 7. Extraction from old, residual wells was selected to have a single source or boundary, as is also depicted in Figure 7. The selected pumping rates were simply the averaged pumping rates beginning with the year 2005 and ending with the year 2006. The estimated underground well pumping rates were determined by a Dirichlet boundary condition, the heads of which were kept to the planned groundwater level (Figure 7). The model was also designed in such a way as to take into account the beginning and ending spots of underground vertical wells (Time constrains condition inside FeFlow 6.1 were applied).
In Figure 8, the largest expected depression of groundwater in m.s.l., as a result of numerical modelling calculations using the methodology described in the following section, is displayed. The former is to be encountered in the 360th day of work on the longwall face according to the pertinent mathematical model made in FeFlow 6.1. As is evident, the depression is the largest in the area of the underground vertical wells and, examining the development of the groundwater depression presented in 
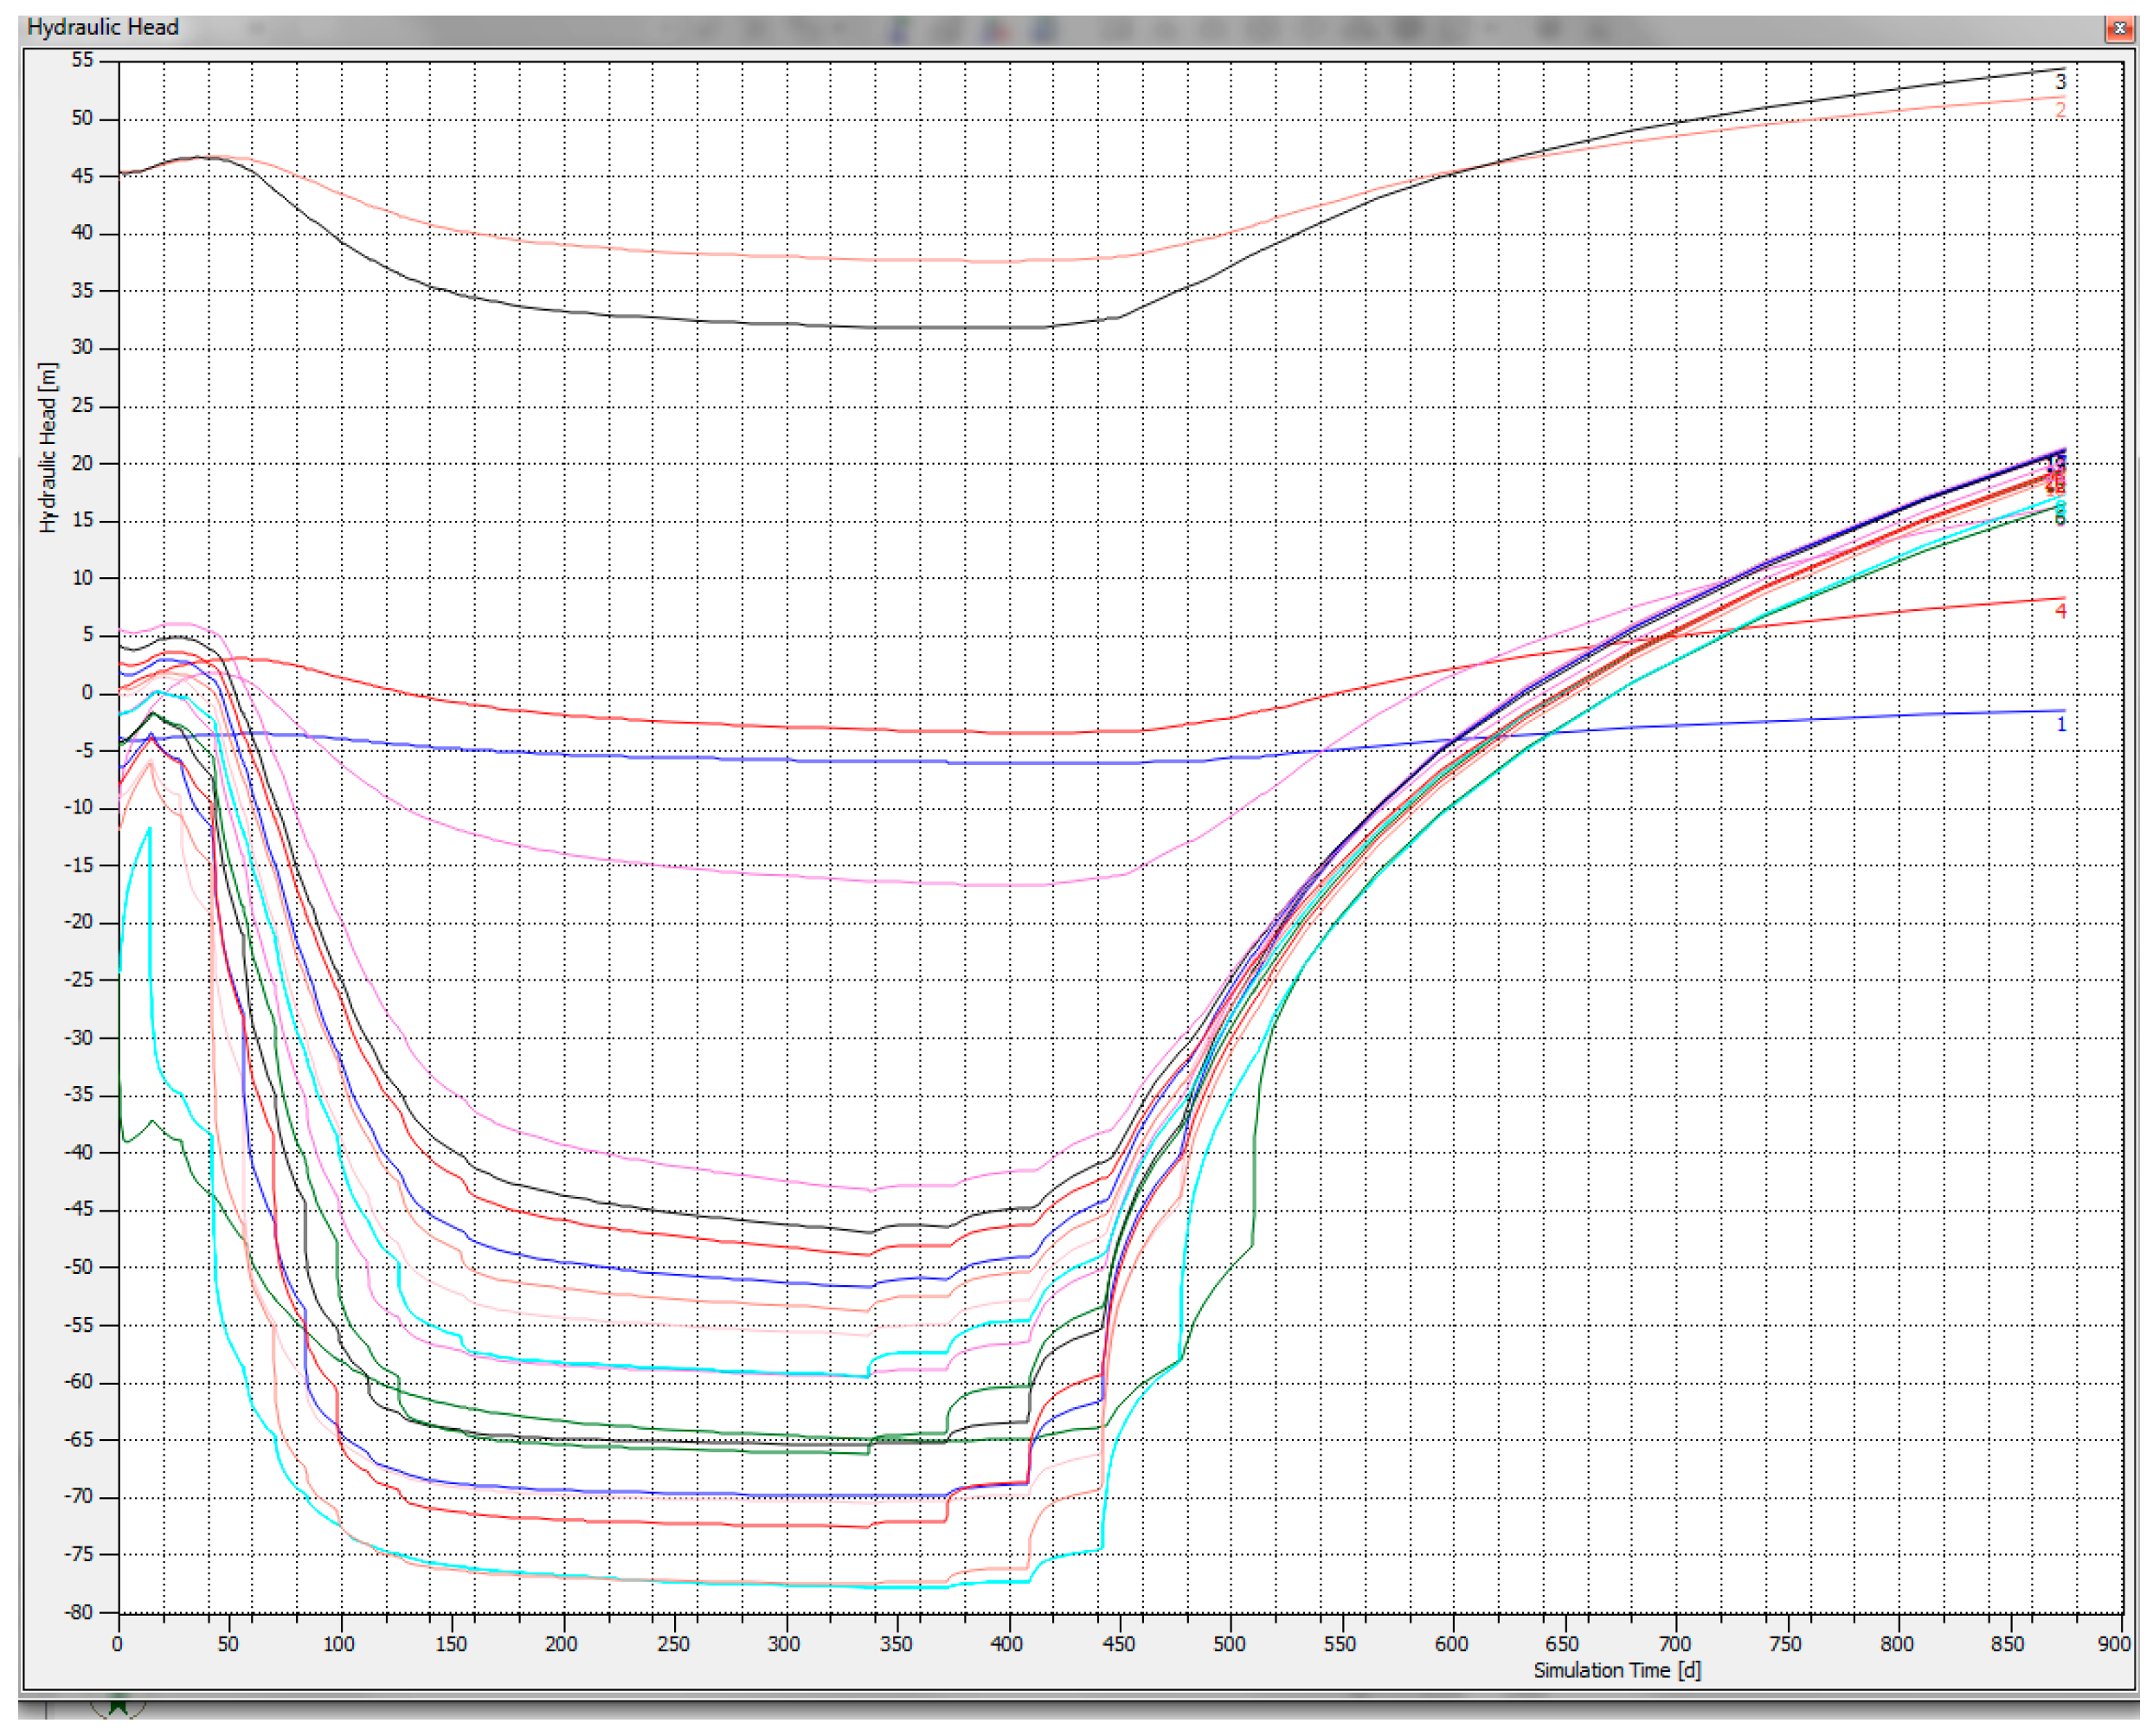
Figure 8, it could be asserted that the dewatering that is a result of underground vertical pumping wells has had a significant impact. If it is considered that the bottom at this stage of excavation is at 10 m.s.l., and if Figure 9 is also closely examined, it is possible to ascertain that the dewatering will be immensely effective and that after excavation is stopped at the drive-in filters, groundwater will begin to rise up and flood the entire area in less than 150 days.

4. Conclusions

In conclusion, utilising the FEM methods described above, the authors were able to form an accurate prediction of groundwater activity in the Velenje colliery area. It is also true that the prediction carries a 7.49% NRMS, but taking in consideration the constantly changing geometry due to mining works which we had to account in our modelling the error can be seen as reasonable. The drop predicted with the aid of the FEM method is much higher than that predicted with the aid of the FDM method. In the authors' experience and in literature [8,9], it is easily observable that the predicted drop on the basis of FDM is not as much a function of the actual situation of flow as of cell size. This effect may be circumvented with a large decrease in cell size, but the latter would also lead to a numerical instability and laborious numerical processing in FDM, which is why FEM was used instead. As a result of FEM prediction, it may be said that the planned water drainage is logical. However, attention must be paid to rapid groundwater rising once the vertical wells are terminated. Such an event must be avoided with the aid of a decrease in time between the passing from one longwall face to another.

Acknowledgments

This study was financially supported by the research project L1-5451 funded by Slovenian Research Agency (ARRS) and the Velenje coalmine.

Author Contributions

Željko Vukelić conceived and designed the implemented research. Evgen Dervarič and Goran Vižintin performed the measurements and simulations. Željko Vukelić, Evgen Dervarič, Jurij Šporin and Goran Vižintin were all equally represented in the preparation and writing of the paper.

Conflicts of Interest

The authors declare no conflicts of interest.

References

  1. Lajlar, B.; Supovec, I. Prognosis of the dewatering effects in the pliocene aquifers in Velenje colliery using mathematical model. Mine Water Environ. Proc. 1997, 1, 159–173. [Google Scholar]
  2. Kočar, F.; Veselić, M.; Ribičič, M.; Mramor, J. Kriteriji varnega odkopavanja premoga pod vodonosnimi plastmi v rudniku lignita Velenje. Rudarsko-metalurški zbornik 1989, 36, 421–438. [Google Scholar]
  3. Mavec, M.; Supovec, I. Pliocene aquifer dewatering in Velenje colliery and its effects on land subsidence. Mine Water Environ. Proc. 1998, 1, 75–86. [Google Scholar]
  4. Brezigar, A.; Ogorelec, B.; Rijavec, L.; Mioč, P. Geologic setting of the pre-pliocene basement of the Velenje depression and its surroundings. Geologija 1988, 30, 31–65. [Google Scholar]
  5. Kanduč, T.; Grassa, F.; Mcintosh, J.; Stibilj, V.; Ulrich-Supovec, M.; Supovec, I.; Jamnikar, S. A geochemical and stable isotope investigation of groundwater/surface-water interactions in the Velenje basin. Hydrogeol. J. 2014, 22, 971–984. [Google Scholar] [CrossRef]
  6. Dervarič, E.; Zavšek, S.; Kočar, F.; Ribičič, M. Categorization of rock masses for the design of tunnel support in Velenje coal mine. In Proceedings of the Prvo Mednarodno Posvetovanje o Gradnji Predorov in Podzemnih Prostorov, Ljubljana, Slovenia, 16–18 September 1992; pp. 14–23.
  7. Supovec, I.; Veselič, M. Poročilo o Modeliranju Pliocenskih Vodonosnikov v RLV; Geološki zavod: Ljubljana, Slovenia, 1989. [Google Scholar]
  8. De Marsily, G. Quantitative Hygrogeology: Groundwater Hydrology for Engineers; Academic Press: Paris, France, 1986; pp. 1–440. [Google Scholar]
  9. Bear, J.; Verruijt, A. Modeling Groundwater Flow and Pollution; D. Reidel Publishing Company: Dordrecht, The Netherlands, 1987; pp. 1–414. [Google Scholar]
  10. Veselič, M.; Supovec, I. Analiza Odvodnjevanja Pliocenskih Krovninskih Vodonosnikov s Poskusnimi Vodnjaki Objamski Progi na koti-72 v letih 1984–1986; Geološki zavod: Ljubljana, Slovenia, 1986. [Google Scholar]
  11. Žula, J.; Pezdič, J.; Zavšek, S.; Burič, E. Adsorption capacity of the Velenje lignite: Methodology and equipment. RMZ-Mater. Geoenvir. 2011, 2, 193–216. [Google Scholar]
  12. Kanduč, T.; Markič, M.; Zavšek, S.; Mcintosh, J. Carbon cycling in the pliocene Velenje coal basin, Slovenia, inferred from stable carbon isotopes. Int. J. Coal Geol. 2012, 89, 70–83. [Google Scholar] [CrossRef]
  13. Kanduč, T.; Žula, J.; Zavšek, S. Tracing coalbed gas dynamics and origin of gases in advancement of the working faces at mining areas preloge and pesje, Velenje basin. RMZ-Mater. Geoenvir. 2011, 58, 273–288. [Google Scholar]
  14. Supovec, I.; Lenart, M.; Jamnikar, S. Napoved Učinkovitosti Odvodnjevanja Pliocenskih Peskov z Baražno Progo po Kadunji: Raziskovalno Razvojna Naloga: Končno Poročilo; Premogovnik Velenje: Velenje, Slovenia, 2011; pp. 1–34. [Google Scholar]
  15. Kanduč, T.; Grassa, F.; Sedlar, J.; Zavšek, S. Geochemical and isotopic characterization of coalbed gases in active excavation fields at preloge and pesje (Velenje basin) mining areas. RMZ-Mater. Geoenvir. 2015, 62, 21–35. [Google Scholar]
Figure 1. A geological, SSW-NNE cross-section of the lignite mine in Velenje. The multi-layered aquifer system (Pl-1, Pl-2 and Pl-3) depicted is made up of sand strata atop a lignite stratum [4,5].
Energies 09 00702 g001
Figure 2. A 3D elevation map of the Pl-1 and Pl-2 variety of Pliocene water-carrying sands in the year 2007. Red circles present pumping wells affected from mining works.
Energies 09 00702 g002
Figure 3. A 3D elevation map of the Pl-1 and Pl-2 variety of Pliocene water-carrying sands in the year 2017. Pumping wells are not anymore present and the Pl-1 and Pl-2 geometry due to excavation works will change.
Energies 09 00702 g003
Figure 4. A groundwater levels map of the Pl-1 and Pl-2 variety of Pliocene water-carrying sands in the year 2007.
Energies 09 00702 g004
Figure 5. The hydraulic conductivity (k) areas values after the calibration in FeFlow 6.1.
Energies 09 00702 g005
Figure 6. The observation vs calculated heads are presented with red rectangles, red dots present 95% confident interval and blue dots 95% interval. The Normalized Root Mean Squared (NRMS) is 7.49%.
Energies 09 00702 g006
Figure 7. A Finite Elements Method (FEM) groundwater model. The active dewatering drive-in wells are depicted using red points, the surface wells and inflow into the model on the north were modelled with Dirichlet b. c. (blue points).
Energies 09 00702 g007
Figure 8. The groundwater depression level predicted to follow 360 days of work on the longwall face in the year 2017 using FeFlow 6.1. All underground vertical wells are depicted. Legend is in m.s.l.
Energies 09 00702 g008
Figure 9. The predicted water drainage curves taking into account drive-in filters positioned around the longwall (face) using FeFlow 6.1. Heads are in m.s.l.
Energies 09 00702 g009

