
Who Is Behaving? Consequences for Energy Policy of Concept Confusion


Department of Thematic Studies, Technology and Social Change, Linköping University, Campus Valla, SE-58183 Linköping, Sweden
*
Author to whom correspondence should be addressed.
†
These authors contributed equally to this work.
Energies 2015, 8(8), 7618-7637; https://doi.org/10.3390/en8087618
Submission received: 17 June 2015
/
Revised: 17 July 2015
/
Accepted: 20 July 2015
/
Published: 27 July 2015
(This article belongs to the Special Issue Multi-Disciplinary Perspectives on Energy and Sustainable Development)
Abstract
:Policies to reduce household energy use usually target the individual customer. This is probably one explanation for the limited effect of many information policies, because two concepts with different meanings are confused: individual and household. In most contexts, an individual stands for what s/he does, but in the policy context, an individual is taken to represent the entire household. This is not problematic for a single-person household, but, in a multi-person household, activities performed by different household members influence the whole household’s energy use. This paper illuminates problems arising from confusing the concepts of household and individual when developing policies to reduce household energy use. Examples relate to indoor space heating and energy-intensive home-based activities. The results indicate that it is analytically simple to consider individuals at home, as well as their activities using electrical appliances contributing to heating, but much more complicated to take the whole household into consideration. Our model provides a basis for better-targeted information actions to reduce energy use. Also, empirically based models capturing variations between households with different activity patterns are important for developing policies resulting in reduced energy use for space heating in multi-person households.
1. Introduction
Policy instruments in the energy area are intended to encourage more efficient or careful use of resources and more ecologically sustainable behavior. Instruments promoting such behavior vary greatly, but information is commonly used when targeting actors in the household sector [1]. Interest in running energy information campaigns targeting households is growing steadily, and professional actors, such as energy companies, include information campaigns in their business models [2]. However, information campaigns targeting household sector actors yield poor results, possibly becauseit is rarely actively sought by household members although energy use information is easily available, for example, on websites [3]. We claim that one reason for this failure is that energy companies and policymakers misdirect the information because they confuse the concepts of individual and household, two concepts with genuinely different meanings that are often used synonymously. For example, when energy companies distribute information encouraging reduced household energy use, such as energy saving advice and descriptions of new pricing models, they usually target the customer. The customer is the registered person who receives the household electricity bill, but this individual may not have significant influence on the whole household’s energy use. The customer is an individual who is equated to the household of which the customer is a member.
If the household comprises a single member (i.e., a one-person household), the problem is not as great, but most individuals live in households with more than one member [4]. In a multi-person household, there are many demands and desires, and matters such as what appliances to buy and use, what constitutes a comfortable indoor climate and how to divide household labor are continuously negotiated [5,6,7]. Matters such as which individuals in the household use electrical appliances and which individuals spend more time in the home have the most influence on the energy use, so policies to promote energy savings and energy efficiency must take more than a single household member, i.e., the customer, into consideration. There is a need for increased awareness of individual variations within and between households and of the division of labor within households: Who does what activities using electrical appliances, space heating and hot water? Who is at home, when? What is deemed a comfortable indoor climate? In other words, knowledge indicating who is the most significant energy user in the household is crucial.
This paper identifies the problems that arise if the concepts of household and individual are confused when developing policies to reduce household energy use. We will cite examples of models of how to approach these problems. Our aim is to improve the understanding of the household sector, making it less of a “black box” and to reveal some important aspects to consider when formulating energy policies targeting the household sector.
In the following, we will first describe methods and material used. Then we will discuss how household- and individual-targeted energy policy has been dealt with in earlier studies. We will use Swedish data, so before the presentation of our results we give some basic facts about energy use in Swedish households. We then cite examples illustrating how it matters whether an individual or household is targeted during policy formulation. Finally, we will suggest how to avoid confusing the two concepts.
2. Material and Methods
rIn the following section we review earlier research, we first do a review of earlier research in the field and then we present a principal discussion about how household members’ use their home and their electric appliances and problematize the policy implications of how to target policy information about energy conservation. We use different material and methodological approaches for achieving our purpose.
The household as a concept is seldom problematized in studies of energy use in dwellings or in analyses of how to develop policy targeting household inhabitants. To get an overview of how household and individuals were treated in earlier research we searched for articles in the Scopus and Web of Science databases from the years 2010–2013. The following keywords were used in searching both databases: (a) “energy use” AND household AND policy; (b) “energy use” AND individual AND policy; (c) “energy efficiency” AND household AND policy; (d) “energy efficiency” AND individual AND policy; (e) “household appliances” AND policy. Altogether, 622 articles were identified by the search. We read the abstracts of all identified articles and excluded the substantial number that had been identified more than once, using more than one combination of keywords. We then excluded articles treating the following: transportation, aggregated analysis of residential energy consumption, policy to increase household access to energy, energy-efficiency measures in multifamily dwellings in which policy targeted landlords, modeling the effects of different policy measures, and how local policymakers should conceptualize future housing districts in order to reduce household energy consumption. After this exclusion procedure, 42 articles were finally included in the literature review. When we started to read the full-text articles, another 12 were found to be largely irrelevant because they did not discuss households or individuals at all, so in the end we reviewed 30 articles. The result of this review is presented below, under Section 3.
In Section 4, we present models of energy consumption by individuals in households inspired by the time-geographical approach [8,9,10,11]. Two basic assumptions in time-geography are that the individual is regarded as indivisible during any time period of her life and that all activities during a period of time are performed in sequence. The assumption of indivisibility implies that the individual just can be located at one place at a given point in time. It also claims that important information about the complexity of human daily life is lost when a specific individual is looked upon in terms of an average individual. The indivisibility of the individual and the sequential performance of activities are crucial prerequisites for investigating the confusion between individual and household in energy policy information directed to the household sector. For the purpose of giving empirical ground for the models presented we utilize time-diary data. In order to carry out our investigation (to discern different effects from looking at the individual or the household as a unit of investigation of energy use in the household sector) we need a time-diary data set in which members of the same households have written time-diaries during the same days. In Sweden such a time-diary data set was collected in a pilot study by Statistics Sweden in 1996. Therein 179 households were included and 464 individual household members, in the age span from 10 to 97 years, wrote time-diaries during one weekday and one weekend day each [12] and just individuals from 10 years and over wrote time-diaries. Thereby, the 1996 pilot study offers time-diaries written by individuals who live together in households and we can use the diary information to investigate who does what activities (division of labor) and when the different household members are in the home. The household size varied from 1 to 10 members. The diary data is old, but for the purpose here—to show principal differences from using the individual or household as a leading concept in information policies—they provide useful insights. There are no time-diary data from individuals in the same households in the ordinary national time-use surveys in Sweden since they are sampled from registers of individuals (not households). Further, we have used the software VISUAL Time-PAcTS [13] to illustrate when people are at home and to exemplify daily activity sequences at individual and household levels. VISUAL Time-PAcTS includes a module in which electricity consumption from peoples’ activities can be calculated [14,15] and we use it for illustrating electricity use of individuals in households. The electricity calculation package is described in [14] and is validated with measured electricity use data from households who also wrote time-diaries during the period when their electricity use was measured [16].
3. Overview of Earlier Research on Household-Targeted Energy Policy
Policy instruments in the energy area attempt to influence processes in a way that leads to more efficient or careful use of resources. The instruments promoting such development vary in form and have been referred to in different terms in earlier research. One example is Bemelmans-Videc et al. [17] that discuss policy instruments in terms of “carrots”, “sticks” and “sermons”. Sticks mean regulations that the addressee is required to follow. Carrots are economic instruments that result in that an action become cheaper or more expensive. Sermons are information instruments that attempt to influence the receiver by persuasion or presenting facts on a subject. Lindén et al. [18] discuss policy targeting households in relation to four categories: information, economic, administrative, and physical improvement. Information instruments represent various aspects of knowledge mediation, such as written information, labeling, and advertisements. Economic instruments include taxing, pricing, subsidies, etc. Administrative instruments such as CO2 emission limits, prohibitions, and legislated regulations have immediate effects, punishing deviant behavior with negative sanctions such as fines. Finally, physical improvement instruments, such as provision of energy meters, provide immediate feedback so as to inculcate new patterns of behavior. All four types of instruments are intended to externally motivate actors to change routines and behavior [18]. Earlier research does however emphasize that the most effective way to influence households is to combine different types of instruments [17,18,19].
Follow-up of information measures, through statistical analysis and surveys, indicate that it is difficult to ascertain the results of a single campaign and what measures users would have taken in any case [17,20]. Similar conclusions are articulated in the Directive of the European Parliament and Council concerning energy end-use efficiency and energy services [21]. However, estimates have suggested that it would be possible to reduce energy consumption by up to 30% of current levels using informational tools [22,23,24]. On the other hand, there can be a problem with rebound effects, which refer to behavioral responses to the introduction of new technologies or measures that offset the expected beneficial effects [25,26,27].
Regardless, Bemelmans-Videc et al. [17] maintain that information dissemination is seen as a modern form of intervention, which is attractive to policymakers because it can put “emphasis on prevention of wrong or stimulation of the right conduct by offering insights into consequences of behavior” [17] (p. 11). Vedung [28] argues that information has become a more common means of control because of deregulation and privatization. Information provision can be a “pedagogical” measure, as the government informs people about what is good or bad or how they should or should not act. By means of information dissemination, the government tries to exert influence by argumentation, pleas, persuasion, and education. In such policy means, the government’s relationship with the ruled consists only of knowledge transfer and persuasion. The addressees are not forced in any way to consider the facts or follow the advice; they are not rewarded or punished in any way, as is the case with means of economic control or regulations.
Shove et al. [29] have demonstrated that household energy use is closely related to identity creation and the “image” a household wants to maintain. An energy-saving measure that is consistent with a household’s process of identity creation may be more successful than one that is not. Other researchers have pointed to the importance of individualized energy guidance and the provision of individually tailored information that is consistent with an individual’s values. Benders et al. [30] identified personalized information as taht which is based on the specific characteristics of a household. Customised information takes personalized information a step further, since the targeted households will receive energy consumption reduction options that best suit their preferences. Steg [31] concluded that such tailored information is more effective than general information when it comes to changing behavior. However, few studies have considered how to design tailored information to meet various households’ needs. Steg suggested that it is possible to tailor information on energy-saving options that are relevant to particular households, or that address a person’s economic or environmental concerns [31].
Werff and Steg [32] also conclude that it is difficult to find information campaigns that cover energy saving actions in general; people need one campaign to, e.g., reduce car use, and another to lower indoor temperature. For this reason, people need to engage in a range of energy saving behavior to be able to reduce CO2 emissions. It is possible to design many different campaigns, but the risk is that information overload is created [33,34,35] and that people stop paying attention. Another problem is that there are individual variations within households and that the household’s member should be targeted with different kinds of information.
Household or Household’s Members as Targets of Information?
The household as a concept is seldom problematized in these earlier studies of energy use in dwellings or in analyses of how to develop policy targeting household inhabitants. To increase our understanding on how the concepts household, individual and consumer have been used in earlier studies we reviewed 30 recently published articles. The selection of these 30 articles is described above in Section 2 (Material and Methods).
Most of these, 18 articles, treated the household as a unit and as one energy user regardless of its number of members. Two articles treated a household as one energy consumer regardless of its number of members [36,37]. Two articles problematized the fact that policy usually targets households, which often comprise more than one member having different behavioral patterns, routines, values, attitudes, etc. [38,39]. It was more common to treat energy consumers as individuals than as households. Six articles treated individuals as energy consumers [40,41,42,43,44,45], while five articles treated energy users as individuals [46,47,48,49,50].
The term that was used also related to which research field the study was positioned within. When the term used was energy consumers rather than energy users, the focus of the study was usually on the market relationships between producers, services and buyers. When individuals were the focus, the typical theoretical perspectives concerned behavioral science or psychology.
In relation to policy discussion in the articles (though not all articles treated policy), most (i.e., 20) discussed policy targeting households while six discussed policy targeting individuals. Several articles focused on individuals in their analyses but discussed policy targeting households in their conclusions. Hargreaves et al. [46], who examined household member interaction with feedback from smart energy monitors, interviewed and analyzed individuals but then drew conclusions concerning the household level without problematizing this shift. Similarly, Christie et al. [40] analyzed why homeowners did not adopt energy-efficiency technologies when these not only reduced environmental problems, but also improved health, comfort and economic and social wellbeing. The motivations underlying this apparent reluctance to adopt energy-efficiency technologies were investigated. Homeowners were treated as individual consumers in the analysis but, again, were then treated as households when discussing policy implications.
The vast majority of the articles also consider how policymakers can develop policies that most efficiently influence households. Most abstain from discussing how policy should be designed to best fit household members’ activity patterns in households, the variety of routines, attitudes, etc., instead being the focus of the analysis. There are some exceptions. For example, Gadenne et al. [42] examined green consumers, finding that government policies and subsidies did not influence their environmental behavior. The studied green consumers did not trust governments to deliver on promises for better policies and subsidies that would offset their costs. The authors concluded that there was a need for improved government policies and subsidies perceived as benefitting people who are committed to better environmental solutions and thus emphasized the household rather than policymaker perspective.
Four articles discussed, or at least mentioned, that it could be problematic to target all households with one policy because many households consist of various members who could respond differently to a given policy instrument. Palm and Ellegård [38] and Ellegård and Palm [39] discussed the need, when developing policy, to consider household activity patterns at both the individual and household levels and to interpret these as mutually dependent. Closely related to this, Maréchal [47] discussed the need to tailor energy policy to people’s habits. Maréchal emphasized that new policy instruments were needed because consumers are incapable of controlling their energy consumption in reaction to given incentives. From this perspective, habits are “counter-intentional”, which could explain the efficiency paradox and the ongoing increase in energy consumption. Maréchal concluded that policies aiming to reduce energy consumption should address the context in which habits are performed, arguing that the joint use of feedback and commitment would be a promising policy strategy. Maréchal did not, however, discuss the relationship between household members and their habits. Räty and Carlsson-Kanyama [49] calculated the total energy used in male and female consumption patterns in Germany, Norway, Greece, and Sweden by examining single households. They found significant differences in total energy use between Greece and Sweden, for example, demonstrating that men used more energy for travel, eating out and drinking. They believe that these findings should be considered in policymaking and that it is therefore necessary to recall that many households comprise both men and women, which calls for a different and more flexible use of policy instruments.
Some studies emphasized the need to target different household categories with different policies. For example, Zhang et al. [51] defined several household types with different characteristics: pioneer greens, follower greens, concerned greens, home stayers, unconscientious wasters, regular wasters, daytime wasters and disengaged wasters. Garabuau-Moussaoui [43] formulated a variant of this in a unique historical study of how individuals in France, at each stage of life, build a specific relationship with energy and energy efficiency. She concluded that it would be possible and probably necessary to develop public policies specific to each life stage and proposed the notion of generational policies and tools, because each life stage has its own behavior-changing possibilities as well as obstacles to those changes. She concluded that “Energy-conservation policies can be based on all these stages of life and relationships between generations to implement more personalized, realistic advice taking contexts and lifestyles into account.” [43] (p. 506).
From this overview of recent articles, we conclude that there is a need to be more precise regarding who is targeted by policies promoting energy conservation in the household sector. If the target is the user of appliances that require electricity to achieve the goals of various everyday projects, then more knowledge is needed about who performs what activities in various households. Alternatively, if the target is the customer in a multi-person household, the bill receiver needs information about how to engage with the other household members regarding energy issues. If the bill receiver intends to lower the electricity use of the household s/he has to argue with the other household members and then s/he must be able to discuss with them how to behave more energy efficiently when undertaking daily activities in which electrical appliances are used and to discuss the alternatives for keeping warm in a home with a lower indoor temperature than before. Of course, if the bill receiver equals the entire household, i.e., it is a one-member household, there is no need for such discussions.
4. Basic Information Concerning Energy Use in Sweden
As we use Swedish data in the following analyses, we will supply some basic facts about energy use in the Swedish household sector.
In Sweden about 40% of total energy consumption occurs in the household and premises sector. In 2013, the total energy use in this sector was 146 TWh, up to 60% of which was for space and water heating [52]. Sweden’s relatively cold climate in combination with fluctuating weather play important roles in determining the final energy use in this sector, since unusually cold weather increases the energy used for heating. It should be added that energy use for private transportation—not included in the above figures—merits special attention, compare [49].
As part of the work to reach the goal on energy reduction agreed on within the EU, Sweden appointed a commission for an energy-efficient Sweden. This commission investigated key public measures that would allow Sweden to achieve a reduction in energy use, and concluded that information dissemination and education are basic preconditions for achieving more efficient energy use [53]. Traditionally, information dissemination has also been the dominant policy means when trying to reach Swedish citizens and influence how they use energy [1]. The information campaigns are directed at citizens in general and no distinction is made between households and individuals. Some figures about the Swedish population and household stock give information that underline the importance of such a distinction.
Sweden had about 4,500,000 housing units, in both detached and multifamily buildings, in 2011. In 1990, the last year for which such statistics are available, there were about 1,500,000 one-member households, 1,200,000 two-member households and 1,125,000 households with three or more members [4]. The total population was 8,590,000 individuals in 1990, after which it grew to 9,415,000 individuals as of 2010. Statistics Sweden and Bladh [54] estimated that the proportion of small, one- and two-member households increased between 1990 and 2000; the share of single-person households increased from 40% in 1990 to 47% in year 2000, representing an increase from 18% to 22% of the population. The number of multi-person households declined proportionally, from representing 92% of the population in 1990 to 88% in year 2000 [54,55]. In terms of energy use in the household sector it is important to follow the development of household size, since individuals in single-person households use relatively more energy than individuals in multi-person households due to the latter using appliances in common.
5. Results and Discussion
In this section, we will cite and discuss examples illustrating how it matters if it is an individual or a household that is the target of a policy.
5.1. Individual or Household: Relevance to Scheduled Control Indoor Temperature
The most energy-intensive part of the household sector in Sweden is indoor space and water heating. There has been considerable discussion of how the time-scheduled control of indoor space heating in homes might help conserve energy, because lowering the indoor temperature when nobody is at home can save a considerable amount of energy. Arguments for lowering the indoor temperature when the home is empty depend on knowledge of how much time people spend at home. When the home is empty is relevant as well, in both single- and in multi-person households; this also relates to how household members coordinate their time at home. Here, the different time schedules of work, school and services play central roles in how people arrange their daily activities. In addition, involvement in various sports and cultural activities adds to the complexity of determining when the home is empty. Finally, the overarching structural trend in modern society towards the individualization of activities and associated appliances influences the use of the home.
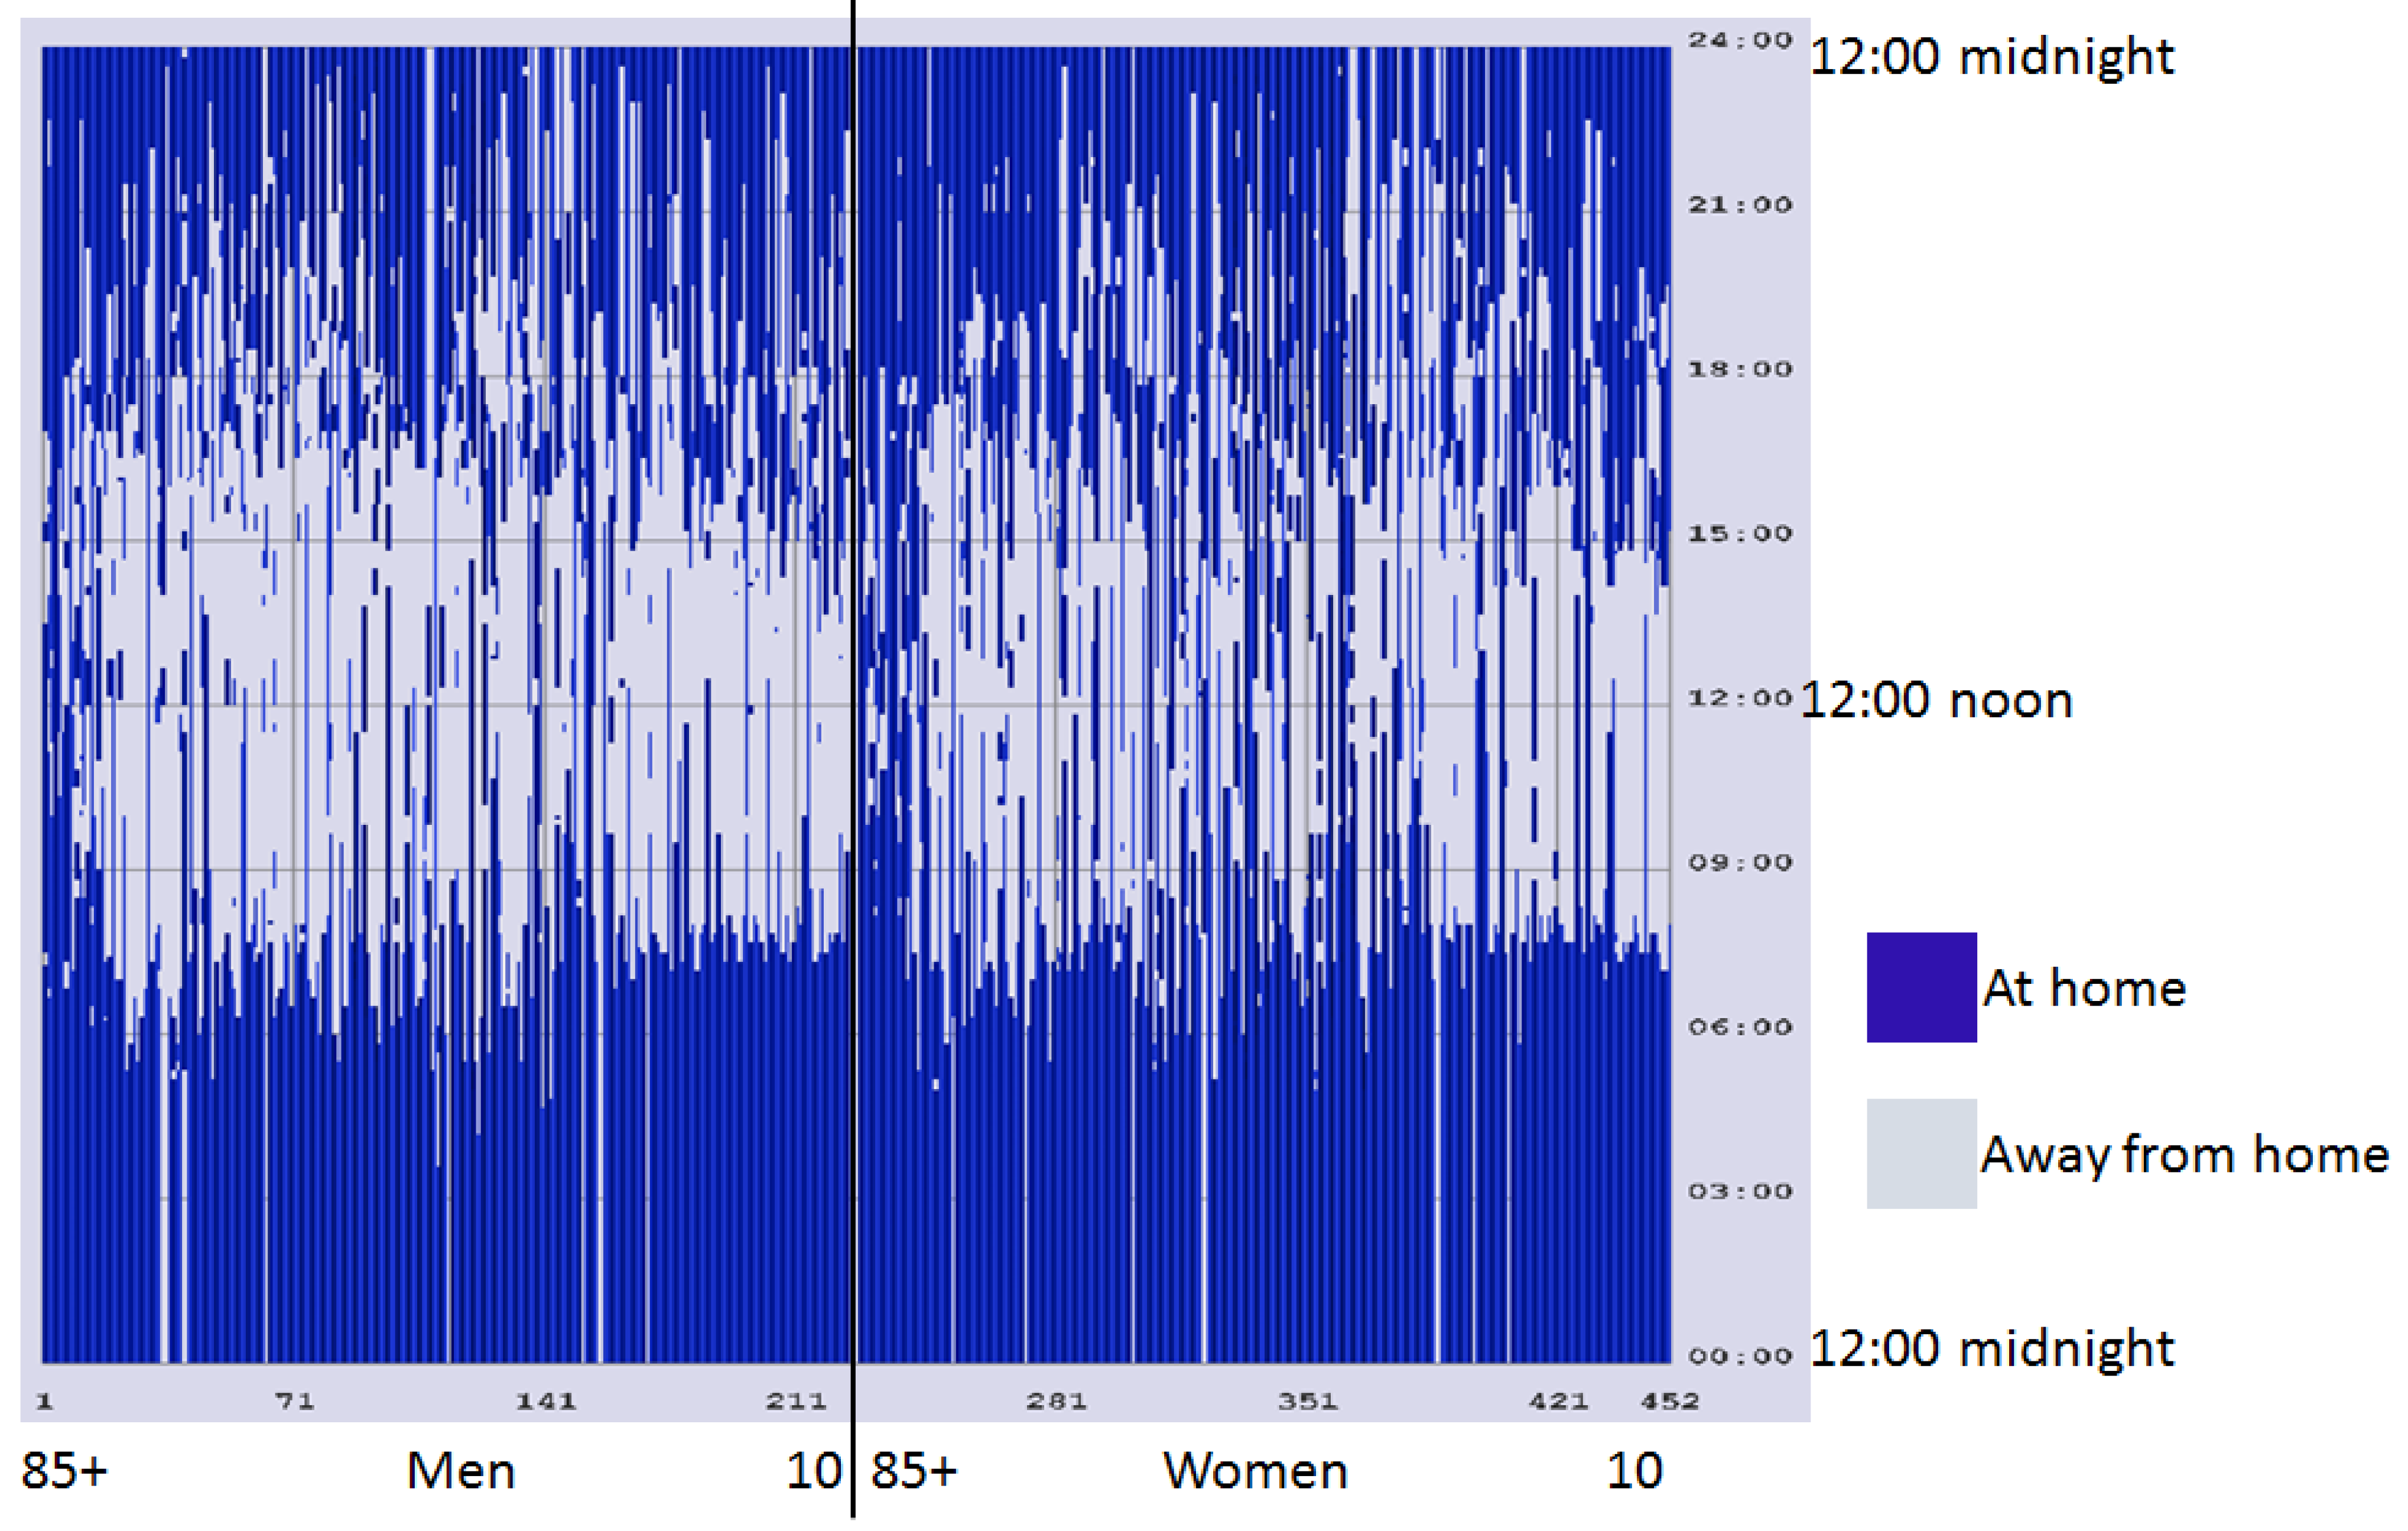
Using time-diary based data from a pilot study (see Section 2) undertaken by Statistics Sweden in 1996, Ellegård [56] demonstrated that the studied individuals on average spent about 65% of their time at home on weekdays and about 75% on weekend days. Figure 1 shows the temporal distribution of the time spent at home by 452 individuals on weekdays in the 1996 pilot study [57,58]. Each line represents one individual and the blue parts of the line indicate when the individual was at home; this clearly clearly indicates that people spent considerable time at their workplaces and in school during the daytime, except for the pensioners who spent a lot of time at home. The figure also shows that people of child-rearing age, especially women, spent considerable time at home during the daytime.
From the perspective of average individuals, lowering the indoor temperature when their homes are empty, which they are 35% of the time on weekdays, could save a considerable amount of energy. That figure applies to average individuals on weekdays, but says nothing about their household context—i.e., in the case of individuals who are members of households with additional members, and it also says nothing about whether and when household members are at home alone or together.
The average figure for time spent at home might nevertheless be of some interest if the concern is single-person households, at least at the aggregate level of all single-person households. The energy savings might then be estimated based on homes being empty for 35% of weekday time, but there would still be differences between individual one-person households because there are great variations in the amount of time these people spend at home, and when. This inter-household variation in the amount of time household members spend at home is one reason why information should target individuals with different lifestyles, be they differences in generation, as claimed by Garabuau-Moussaoui [43], or differences in environmental awareness, as claimed by Gadenne et al. [42].
Figure 1.
Time spent at home on weekdays based on 452 individual diaries. The day of each individual is shown by a vertical line to be read from bottom to top, i.e., from midnight to the next midnight, thereby each individual’s sequence of being at home and being away from home during the 24 h of the day is revealed. The individuals are ordered by gender, i.e., men (n = 225) to the left and women (n = 227) to the right, and age, i.e., the oldest to the left and the youngest to the right among men and women, respectively. The individuals range in age from 10 to 99 years.

The single-person household is a growing category, and around the turn of the century nearly half of all households in Sweden had just one member [54]; however, most individuals live in multi-person households. About 20% of all households have two members and the remaining households comprise three people or more. Variation in household size is an important factor to consider when formulating policies to promote energy efficiency and energy conservation in the household sector. In this context, it is also highly relevant to mention that people living in multi-person households may live in single-person households during the work week (i.e., weekly commuters) or that households with one or two registered members might have three or more members, for example, on weekends or every second week because of children’s alternating cohabitation with divorced parents (and their new partners). However, no statistics on these phenomena are available.
Consequently, figures based on an average individual removed from his/her household context cannot be taken as the point of departure for a deeper discussion of how much energy could be saved by lowering the indoor temperature. As mentioned above, a minority of all individuals live in single-person households and there are even variations within the single-person household category. In multi-person households, all members are unlikely to be at home during exactly the same time periods in the course of the day. We have little knowledge of whether more than one household member is at home at a given time. Statistics on peoples’ time at home are collected in national time-use surveys, but the regular Swedish time-use surveys are not primarily interested in households. Instead, they focus on the allocation of time spent on activities by individuals at the aggregate level. It is therefore difficult to obtain information about when individuals in a given household are at home, for how long and at what times of the day. However, in the previously mentioned pilot study from 1996 (see Section 2 above), 464 individuals in 179 households kept time diaries and, in their notes on the activities performed sequentially, 452 of them also noted where they were located and this information is the basis for Figure 1. In that study, it is possible to determine who is at home at what time in a given household—a matter we will return to later.
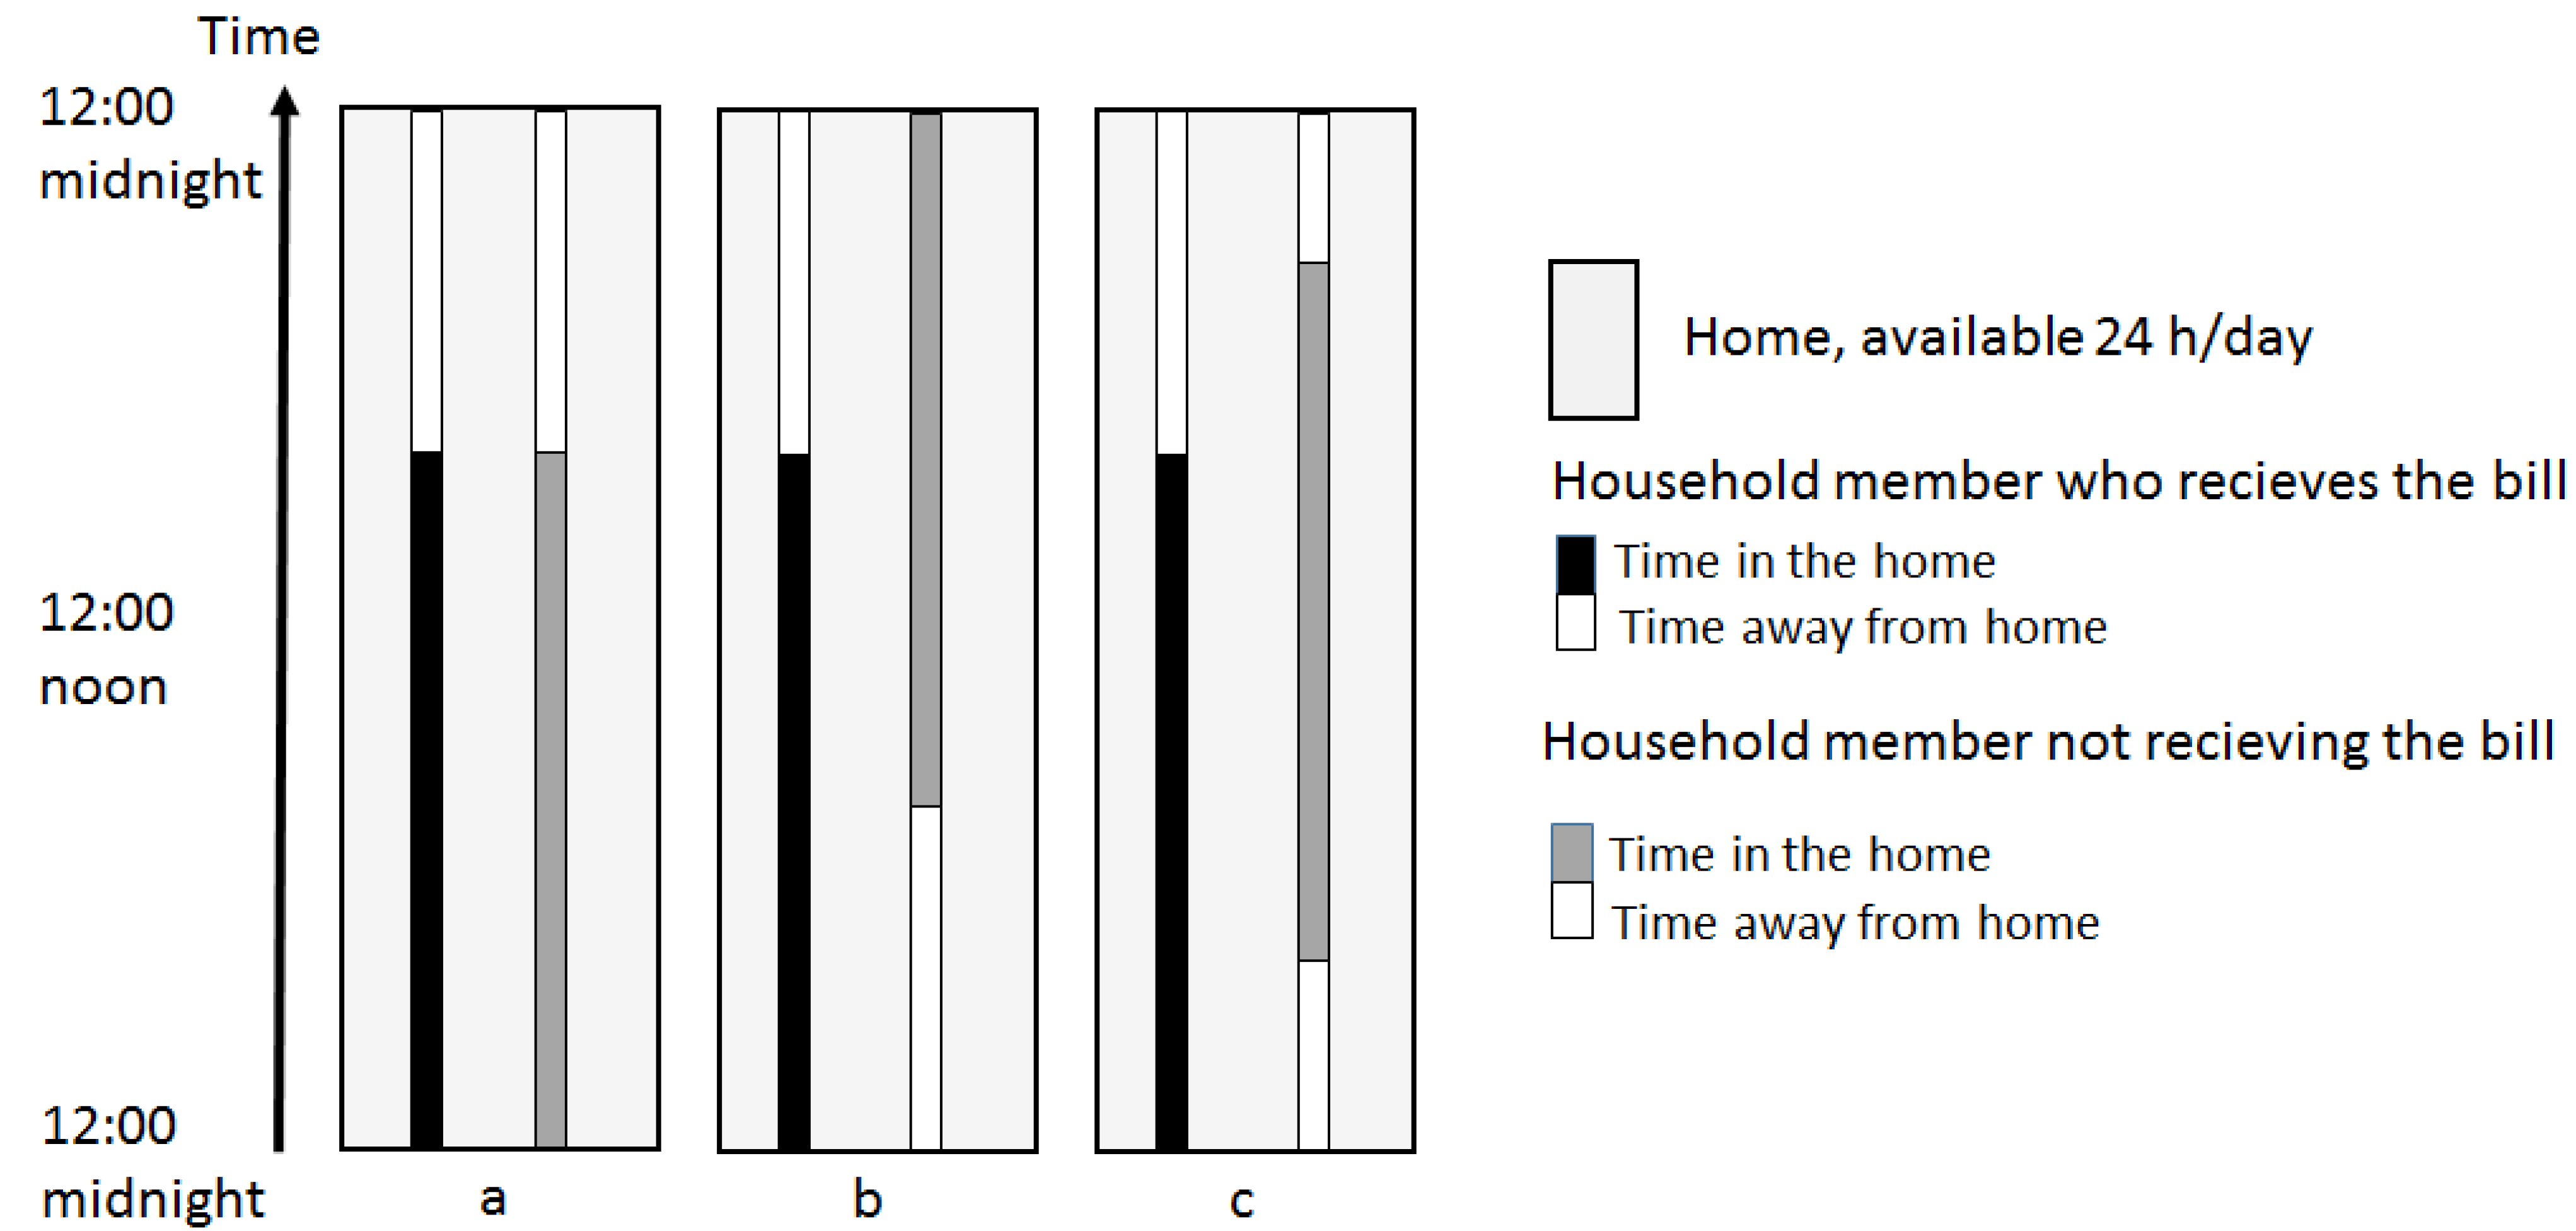
Problems that arise when the abovementioned general information on people’s time at home is applied to multi-person households are illustrated in Figure 2. We identify three principally different patterns of being at home in two-person households based on the two members’ timing of using the home. Figure 2 is based on the assumption that each person is an average person spending 65% of his/her day at home and that all time away from home appears in one period only and that the spread of the time away might differ between the household members. These patterns can be transformed to describe the situation of households with three or more members.
The patterns depicted in Figure 2 can be used, for example, when considering whether it is a good idea to install time-scheduled heating control in the residence. The household member registered as the customer of the energy company represented by the bar partly in black in Figure 2, is the one who likely will be approached about interest in installing time-scheduled indoor temperature control. Depending on whether Situation (a), (b) or (c) applies most days, the consequences for the household as a whole (including the people represented by both the black and grey bars) will differ considerably. Situation (a) entails greater potential for energy conservation, Situation (b) requires that the heat be on all day, while there is some conservation potential in Situation (c). If situation (b) prevails, then there is no immediate need for time-scheduled control of indoor space heating.
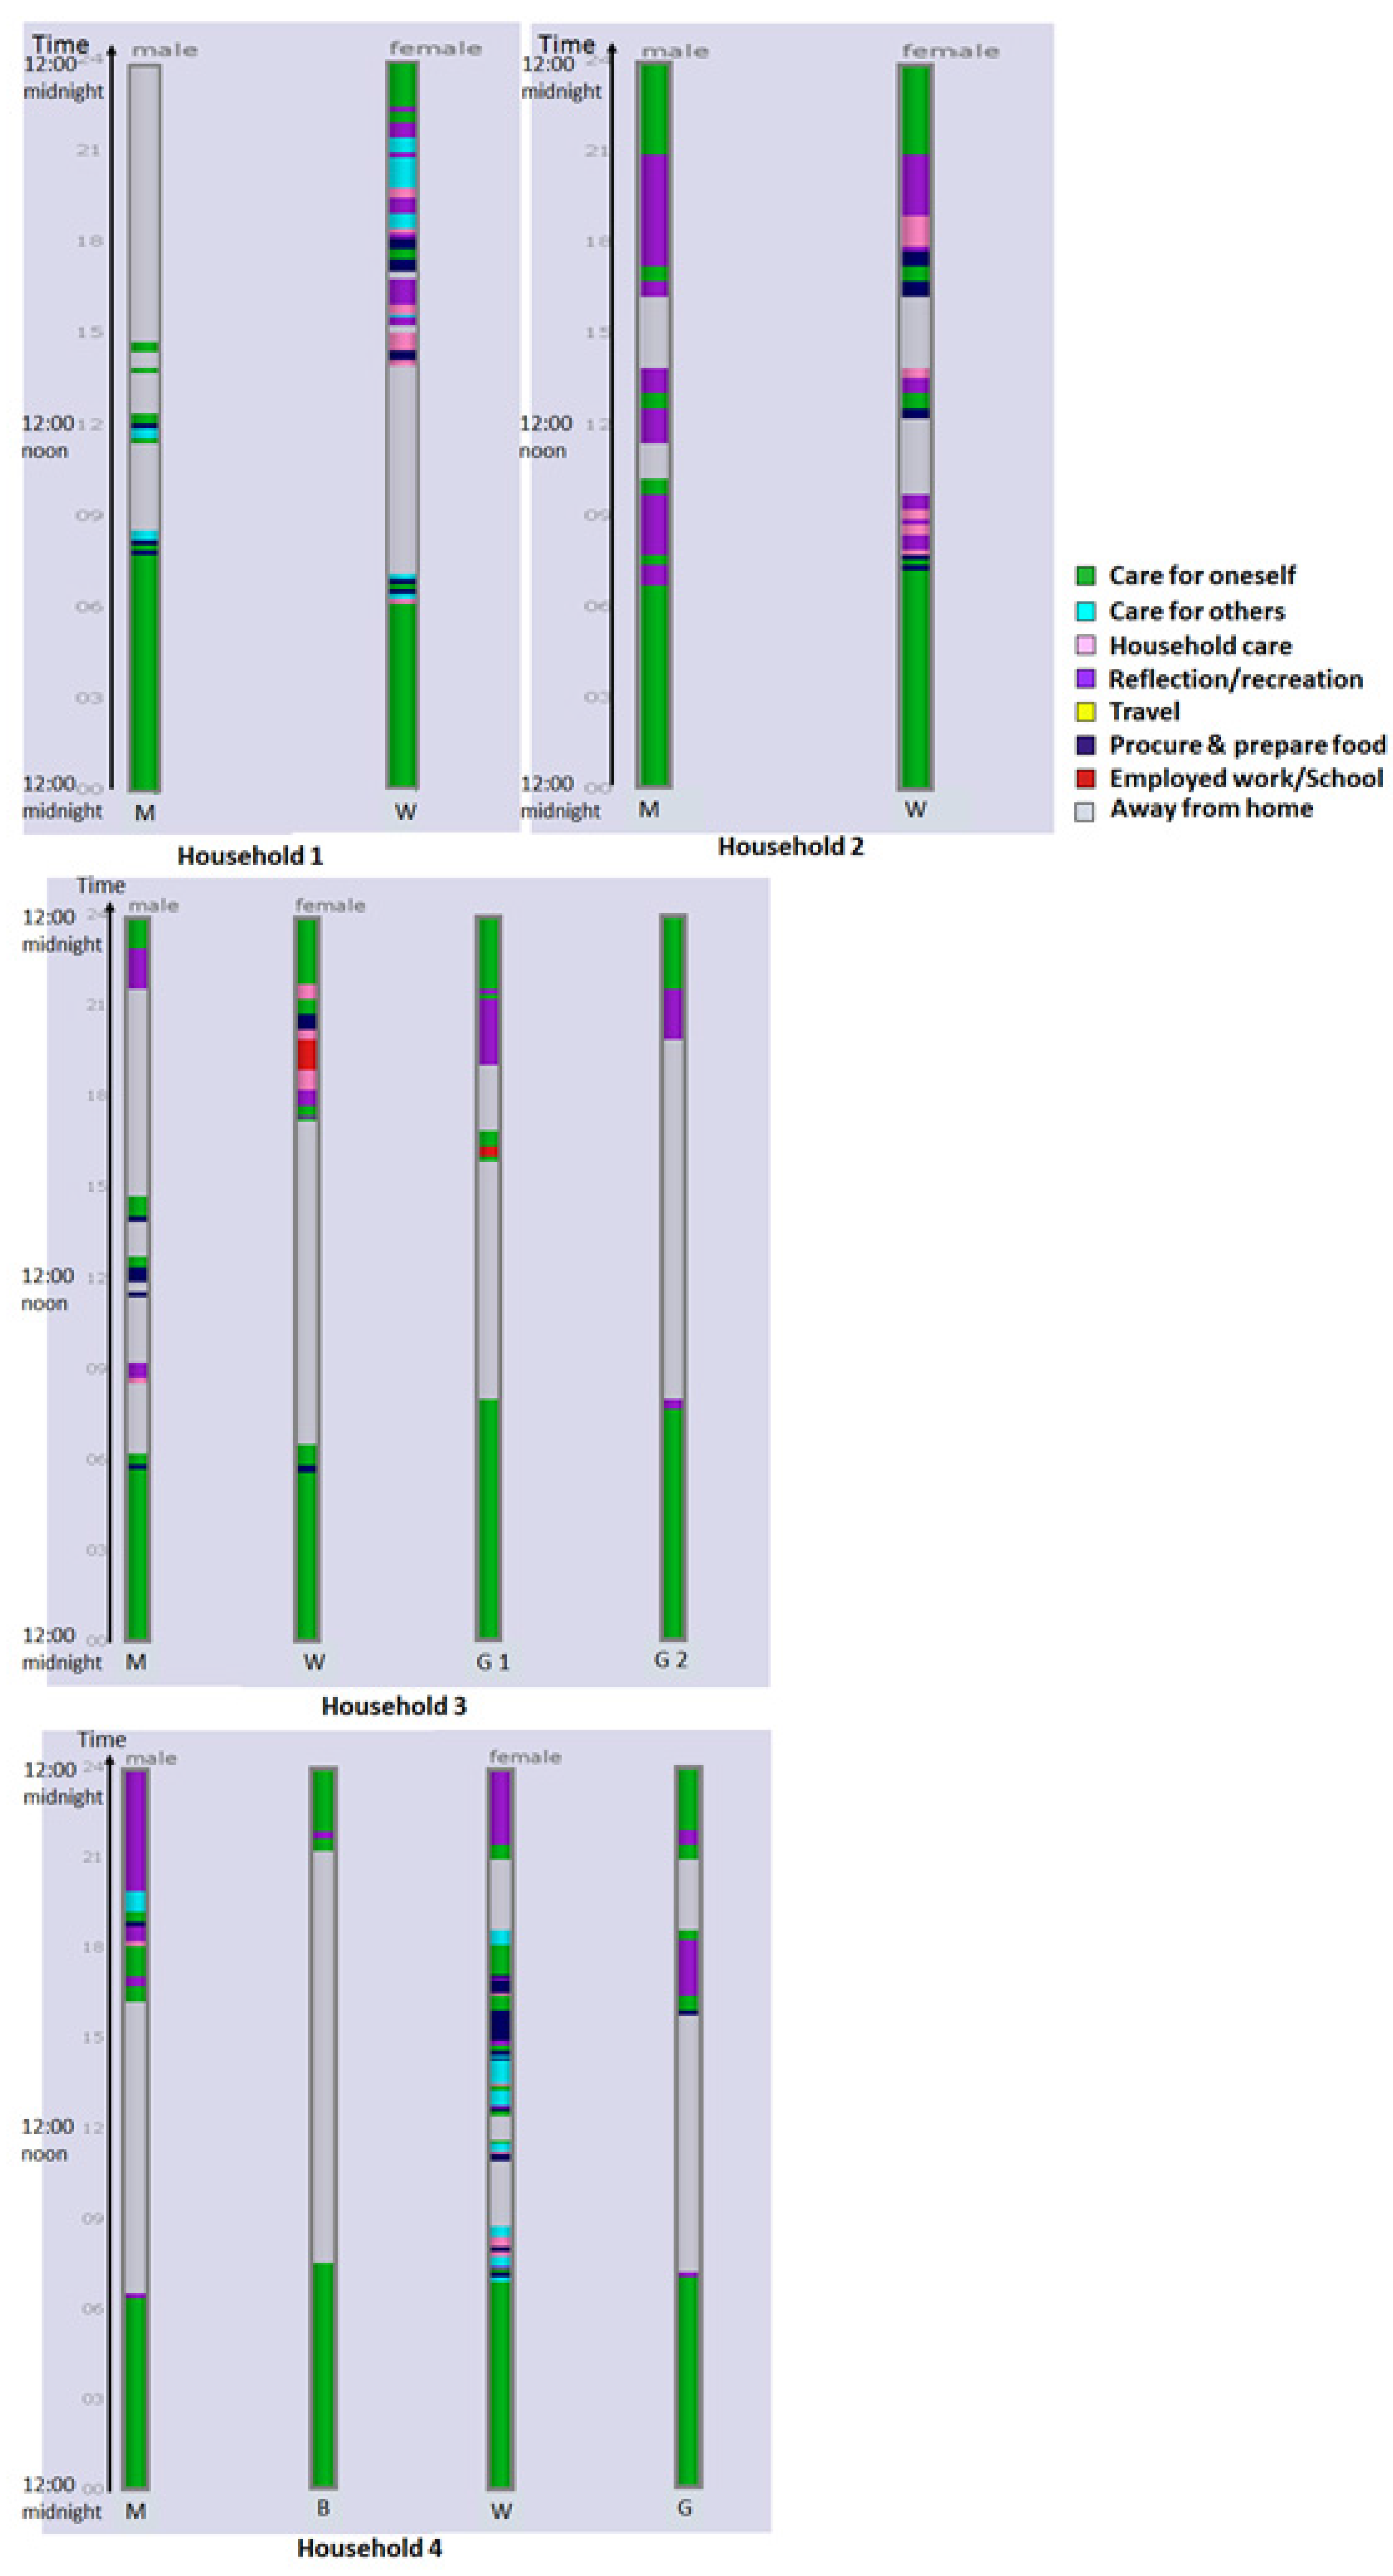
Figure 3 illustrates some variations in household at-home time patterns concerning household member numbers, age and employment status, when time is spent at home and whether the home is empty for any part of the day. Figure 3 also indicates the activities performed by the household members.
All people in all four households shown in Figure 3 sleep at home and get up between 6:00 a.m. and 9:00 a.m. On weekdays, all people in the households spend some time outside home, which they leave between 6:00 a.m. (employed) and 10:00 a.m. (pensioners). The time when they return home varies widely, from noon (five people have lunch at home) to about 10:00 p.m. (boy in household 4). The man in Household 1 spends most of the day away from home, while his partner is at home most of the day (except during working hours). The pensioners in Household 2 spend most of their time at home and their time away from home is spent in similar ways. In Household 3, the man spends a lot of time outside the home, and the woman and two girls are away from home for long periods during the day. The boy in Household 4 is away from home most of the day, while the woman is at home during certain periods of the day.
Policies to promote energy conservation by regulating indoor space heating must take the use of the home by all household members as a point of departure. If not, at least some household members will find the information provided irrelevant or even misleading. It is important that information about the influence of indoor temperature on total household energy use be disseminated not only to the customer (i.e., the person who receives the bill) but also to other household members—or at least take them into account. Otherwise, it will be difficult for such policies to foster useful change among the many individuals in the household sector who are not registered energy customers.
Figure 2.
Three home-use patterns in two-person households in which each household member spends 65% of his/her time at home (the large light grey rectangles). Each person is represented by a bar extending over time within the home; the bar is shaded (black or grey) when the person is at home and white when the person is away from home. The bar, which is partly in black, indicates the person billed by the energy company and the bar partly in grey, the other household member. (a) shows two individuals with exactly the same pattern of being at and away from their common home, leaving the home empty for 35% of the day (they use the home simultaneously); (b) shows that even if the two people are at home for exactly the same amount of time (i.e., 65% of the day) as in (a), the home is never empty because the household members’ time at home overlaps; and (c) shows that the two household members spend 65% of their time at home, parts of their time at home overlapping, leaving little time when the home is empty.
5.2. Individual or Household: Division of Labor in Household Projects
The need to heat the home not only concerns peoples’ being at home but also their performing activities, especially activities involving the use of electrical appliances. This existence of such activity-based heating makes it important to also consider the projects and activities people engage in at home [59,60].
Figure 3.
Four sample variations in the time spent at home by individuals in four households: Household 1, man (M) and woman (W) in a five-person household in which all three children are under 10 years old; Household 2, man and woman, both pensioners, in a two-person household; Household 3, man, woman and two girls (G) in a four-person household; and Household 4, man, boy (B), woman and girl in a seven-person household in which three children are under 10 years old. Each bar represents an individual’s activity sequence identified from their time-diaries; the colors indicate the various activities performed, except for the grey parts of the bars which indicate when the person is not at home. Green indicates eating and sleeping, turquoise caring for children, pink household chores, dark blue preparing food, lilac recreation and red employed work.

The common overall goal of household members’ projects is assumed to be that of living a comfortable life. Every day, individuals in their households are occupied with fulfilling various projects, some performed at home, others away from home, to facilitate their everyday life and make it as good as possible [10]. A household project is defined as a set of activities performed by individuals in a household to achieve a goal they have agreed upon. Projects include feeding the family, maintaining the home and belongings, raising children, earning income for sustenance or shorter-term projects such as preparing a specific dinner or buying a new washing machine. Projects are fulfilled by household members performing the necessary activities. For example, preparing dinner for the family comprises activities such as finding a recipe for the dish chosen, finding out what ingredients are needed, perhaps going to the grocery store to buy ingredients, cooking the dish, setting the table, serving the dinner and eating it (the goal of this project) and finally taking care of leftovers and washing the dishes. The activities that together contribute to fulfilling the dinner project can be performed by one household member alone or by several household members in cooperation [6].
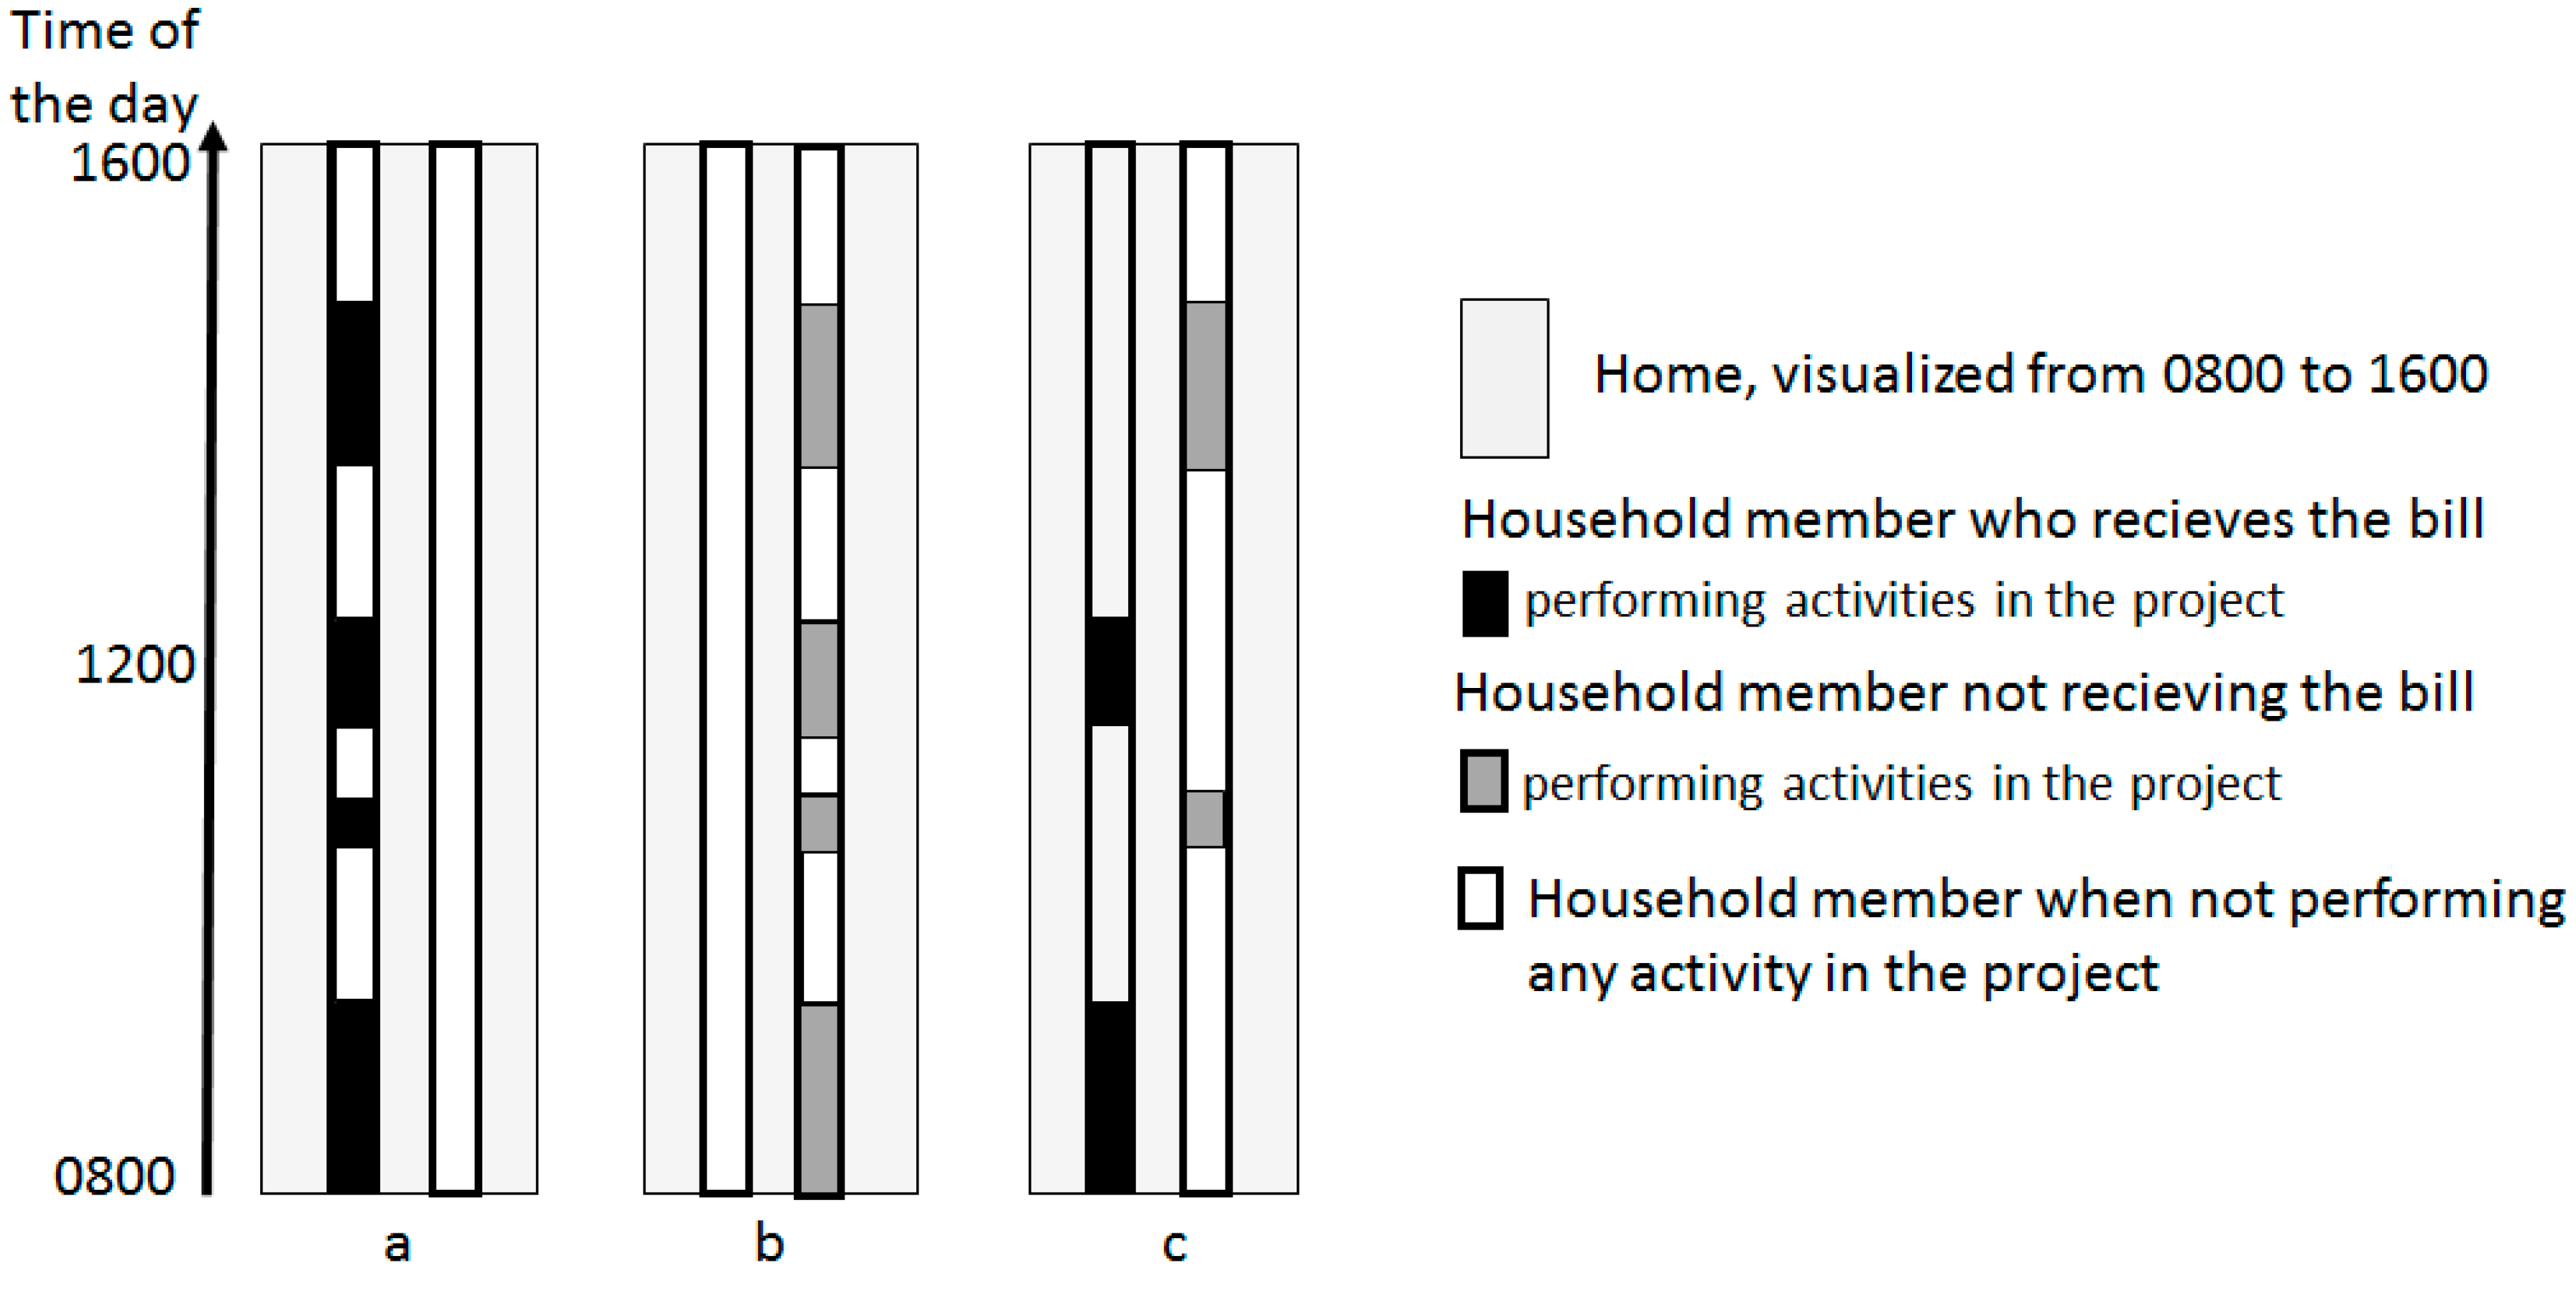
Most multi-person households usually have some kind of division of labor. Perhaps one member always performs all the activities in a certain household project or all household members cooperate and alternate the responsibility for performing certain activities over time (e.g., every second day or week). Figure 4 shows three patterns of division of labor in a two-person household from 8:00 a.m. to 4:00 p.m.
We assume that a person who performs activities to achieve the goal of a project knows more about the process of successfully fulfilling the project than does a person without the same experience. In a two-person household with a division of labor corresponding to Situation (a), energy conservation policies could successfully send information to the bill-receiving person because s/he is the one performing the project-relevant activities. In a two-person household with a division of labor corresponding to Situation (b), information about energy conservation should be given to the actual activity performer; if it is sent to the bill-receiving household member it will probably miss its target. In a household with a division of labor corresponding to Situation (c), policies can target either household member, because the two cooperating household members’ activities are closely connected and these people collaborate.
5.3. Gender Aspects of Policies Promoting Household Sector Energy Conservation
The abovementioned pilot study from 1996 can also be used to discern gender differences in electricity use for some household activities, for example, preparing food, washing dishes, entertainment, house cleaning and laundry [15]. It is well known that women do most housework activities and therefore can be expected to be the most intense users of the associated electricity-consuming appliances [61].
Figure 4.
Patterns of division of labor in performing activities in 2-person households in a project with different consequences for household energy conservation policies. In Situations (a) and (b), the division of labor results in only one person being involved in performing the activities constituting the project, while in Situation (c), the activities in the project are divided between the two household members. In Situation (a), the household member who receives the bill from the energy company performs all activities (indicated by black parts of the bar, shorter parts for activities of short duration and longer parts for longer activities) in a project, while the other household member (white bar) performs no activities in the project. In Situation (b), the household member having no contact with the energy company performs all activities in the project (indicated by grey parts of the bar) and the bill receiver, who does nothing in the project is indicated with a white bar, while in Situation (c), both people in the household perform different activities in the same project (the bill-receiving person’s activities are indicated by black parts of the bar and the other person’s by grey parts of the bar), thereby performing the project together, in sequence and not simultaneously.

In Figure 5, we have used gender information about the kinds of household activities performed by men and women, respectively, and we have accounted for the electricity used by the associated appliances when performing these activities. We have done that by utilizing VISUAL Time-PAcTS/energy use software [13,14], see Section 2 above. The highest average electricity demand for men’s activities is about 120 kWh per person and 5 min period, while the corresponding figure for women is about 220 kWh per person and 5 min period. The figure also shows that the electricity-consuming activities performed by men vary less than do the electricity-consuming activities performed by women. Women perform many more such activities than do men, for example, laundry, cleaning (indicated by bright lilac) and cooking (indicated by dark blue), while men perform more entertainment activities (indicated by dark lilac) than do women, for example, watching TV and playing with the computer. Gender differences in time spent at home were also illustrated by the households illustrated in Figure 3, based on the 1996 pilot study by Statistics Sweden.
Figure 5.
Average electricity demand derived from activities performed: men (left, maximum demand about 130 kWh per person and 5 min period), women (middle, maximum about 240 kWh per person and 5 min period) and average for all (right, maximum about 190 kWh per person) aged 15 years and over, weekdays in 1996. Power demand in kWh per person at 5-min intervals.
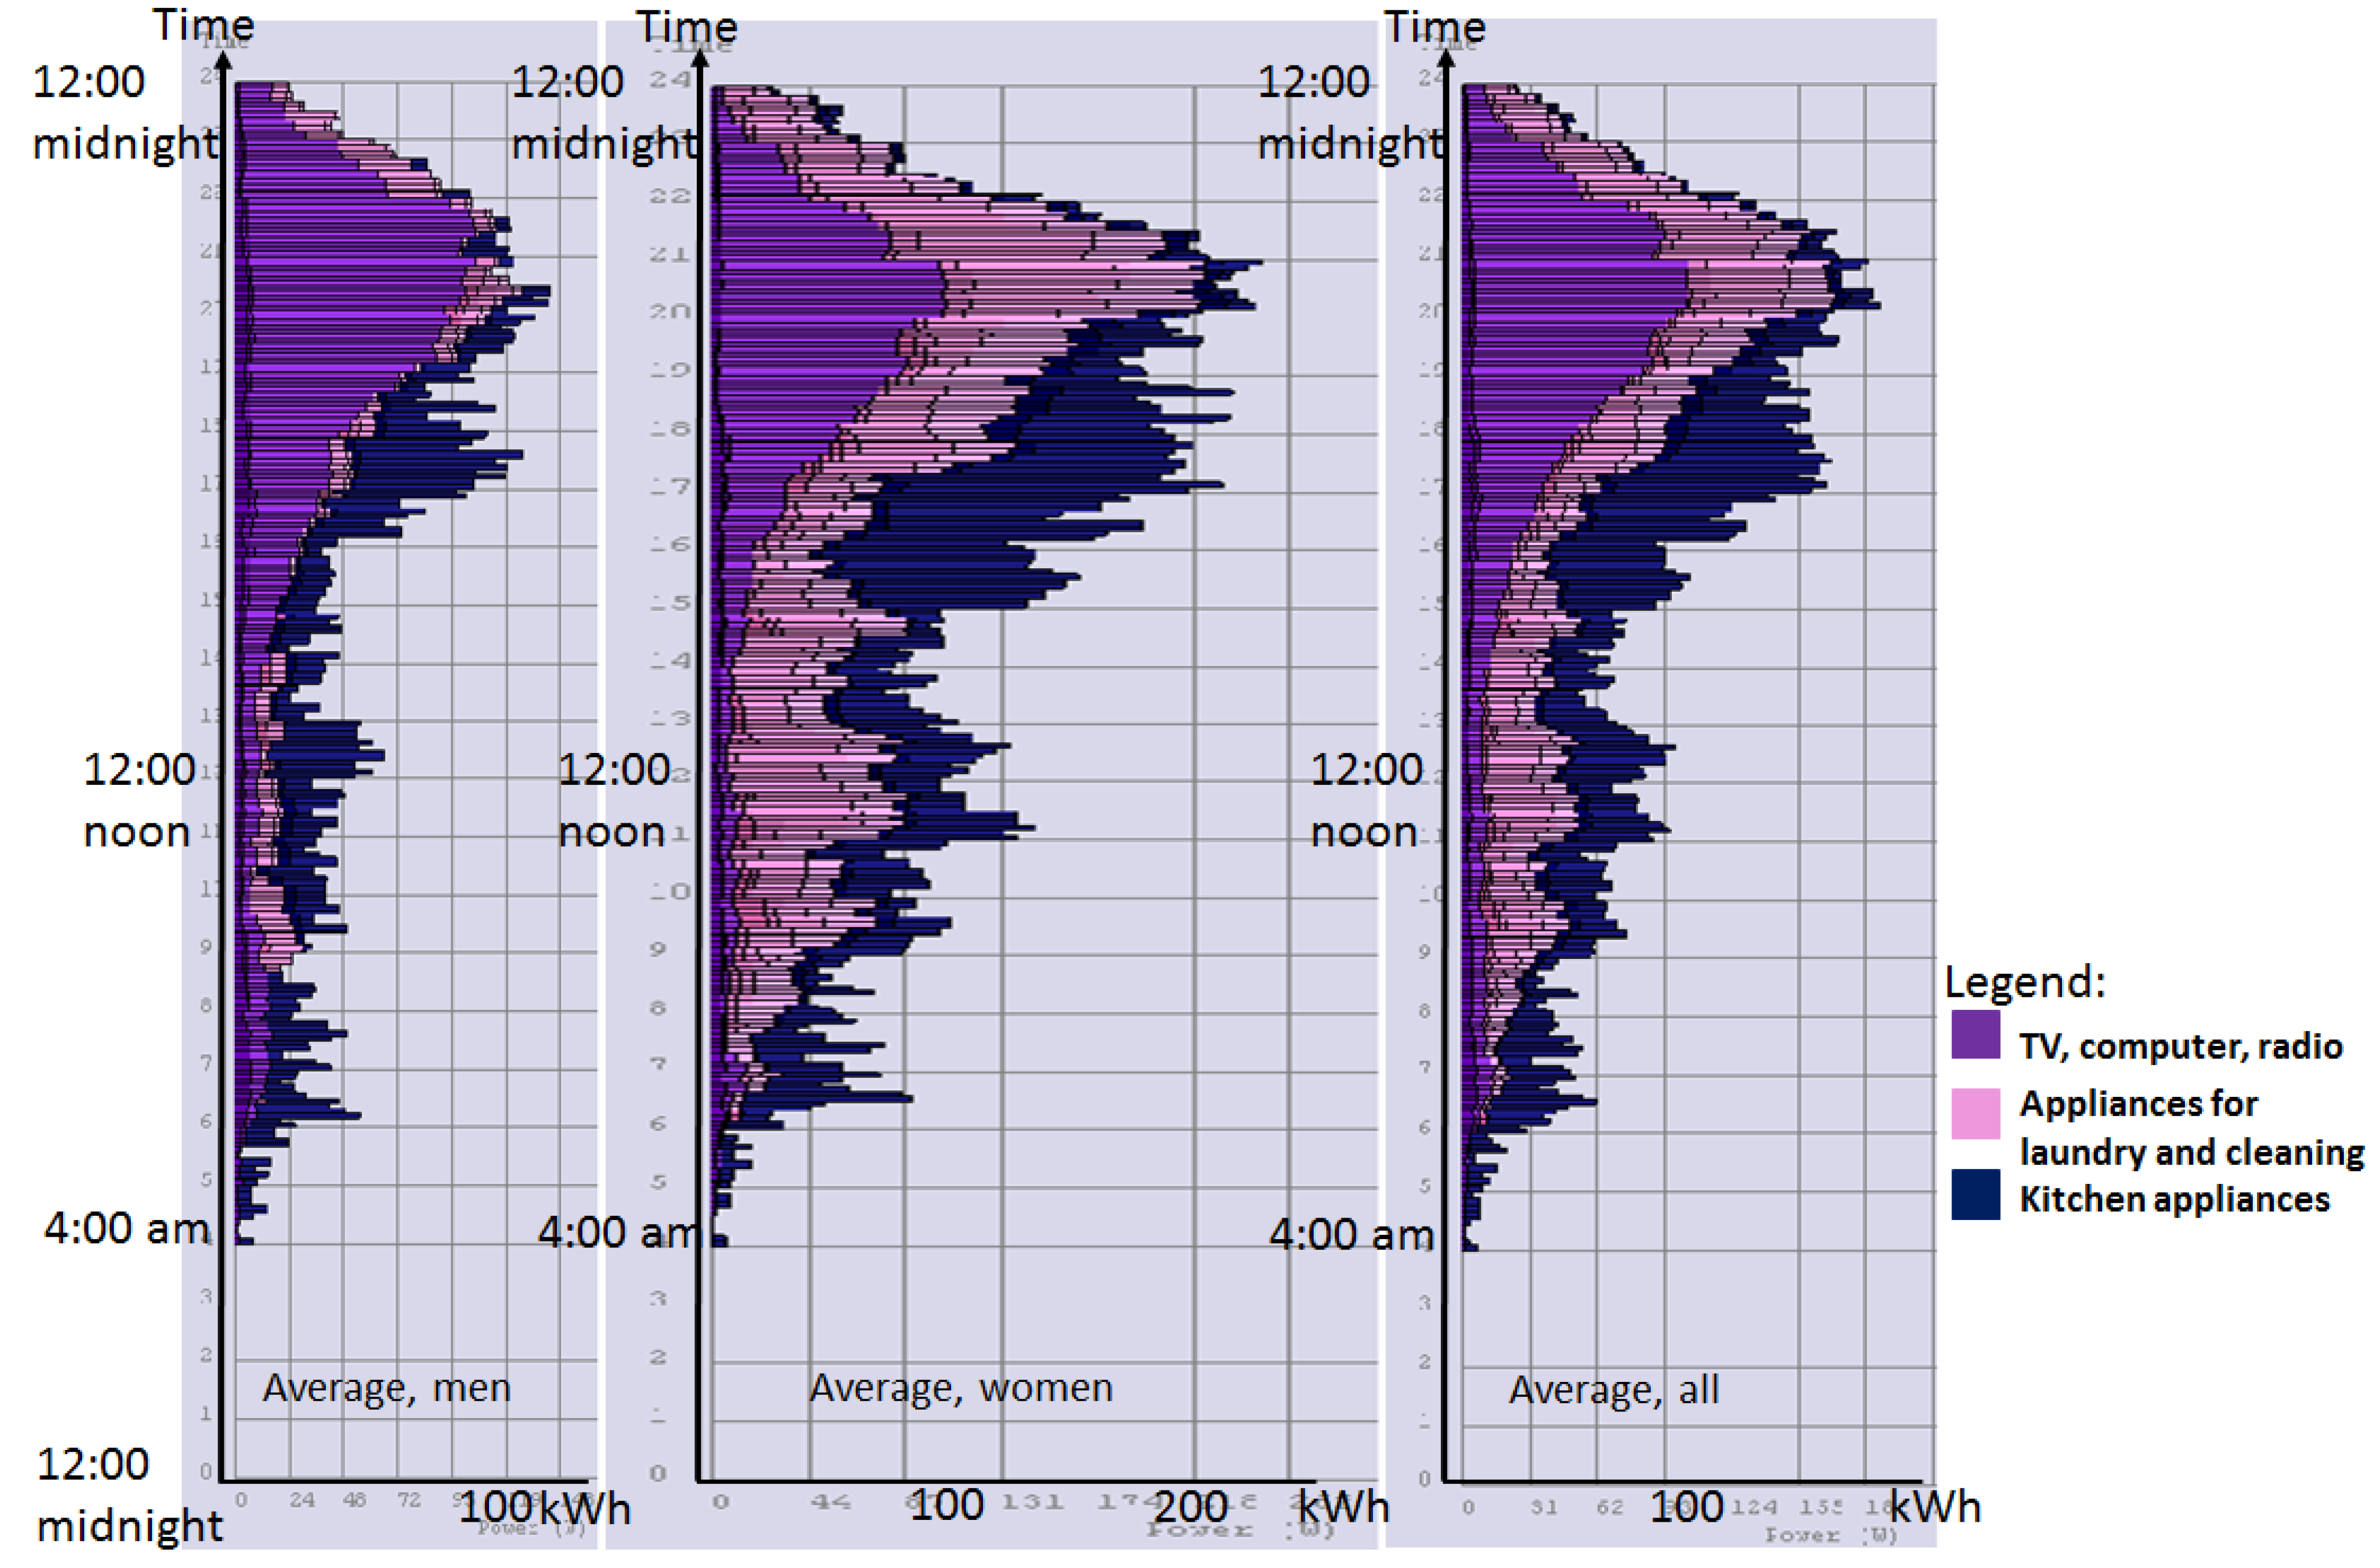
A gender difference is apparent in the electricity consumption over the course of the day. The basic pattern is similar among men and women, though women use more energy throughout the day. In the morning, relatively little electricity is used by appliances, then there is a small peak at lunchtime (the dark blue indicates cooking and the bright lilac indicates laundry and cleaning). The day’s peak energy consumption, for men and women, occurs in the afternoon (i.e., cooking dinner) and in the evening, when watching TV dominates among men while watching TV, doing laundry and cleaning dominate among women.
Since many households have both male and female members, it is important that policy measures target the household member who actually performs the activities addressed in the policies. This simple example has shown that it is important that information targeting women and men differ in content.
The importance of considering gender was recognized early on by, for example, Räty and Carlsson-Kanyama [49]. Another noteworthy gender difference is that it is conventional in Sweden for the man to be the subscriber and thus the individual registered with the energy company [39]. Information provided to households will therefore usually address the man even though it might be the woman who conducts the activity the information concerns.
6. Conclusions
Our discussion demonstrates that it is inefficient to base energy policymaking on an average individual taken out of his/her household context. To develop relevant and efficient policy promoting more efficient-energy consumption, we need better-informed knowledge of household composition, when and for how long homes are empty and who in the household performs the daily activities that use electrical appliances and hot water. By starting from an analysis of peoples’ everyday activities in their sequential appearance and household members’ interrelated projects, we will gain better knowledge of whom to target with policy instruments.
The results indicate that it is analytically quite simple to handle individuals’ time at home, but much more complicated when the whole household is to be taken into consideration. Our examples illustrate the importance of knowing how a household is composed and which household member usually performs an activity.
If a household comprises more than one individual, it would be important for policymakers to reach the person usually performing the activity addressed by the policy instrument. Household energy use is often a collective rather than individual process. This means that the couplings between members are as important to understand as individual activity performance per se if the goal is to reduce household energy consumption. By analyzing and better understanding household members’ interrelated activity patterns, we can avoid using a black-box household concept in policymaking, but can instead target the household member most responsible for a given energy-related activity. Individually tailored information is often discussed, but equally important are information and policy instruments targeting households’ and household members’ combined energy consumption patterns as they are derived from the activity sequences written in the individuals’ time-diaries.
Such a turn in policymaking would have great potential, but more research is needed, for example, into how household members negotiate and compromise regarding who should perform what activities, how and when, and on the actual outcome of these negotiations. We need to continue developing empirically based models that capture variations between households with differences in activity patterns among their individual members. This is necessary in order to devise effective policies resulting in reduced energy use for space heating in multi-person households.
Acknowledgments
The research reported here forms part of the Collaborative Research Program on Energy Efficiency in Renovation (CAREER). This research is funded by FORMAS-IQS and AB Stångåstaden. The authors also want to acknowledge the valuable comments from the anonymous reviewers.
Author Contributions
The authors contributed equally to this work. Both researchers have similar responsibility for the introduction and problem formulation, methods and materials and the conclusions. Palm is main contributor to the literature review while Ellegård is mainly responsible for the time-geographic visualizations in the result section.
Conflicts of Interest
The authors declare no conflict of interest.
References and Notes
- Palm, J. The public-private divide in household behavior: How far into home can energy guidance reach? Energy Policy 2010, 38, 2858–2864. [Google Scholar] [CrossRef]
- Gyberg, P.; Palm, J. Influencing households’ energy behaviour—How is this done and on what premises? Energy Policy 2009, 37, 2807–2813. [Google Scholar] [CrossRef]
- Sernhed, K. Effekten Av Effekten. Elanvändning Och Laststyrning i Elvärmda Småhus Ur Kund-och Företagsperspektiv. Fallstudier. In Avdelningen för Energihushållning, Institutionen för Värme-och kraftteknik, Lunds universitet; Lund University: Lund, Sweden, 2004. (In Swedish) [Google Scholar]
- Statistic Sweden. Statistikdatabasen. Available online: http://www.ssd.scb.se/databaser/makro/MainTable.asp?yp=tansss&xu=C9233001&omradekod=BE&omradetext=Befolkning&lang=1&langdb=1 (accessed on 8 January 2014).
- Isaksson, C. Uthålligt Lärande Om Värmen? Domesticering Av Energiteknik i Passivhus. Ph.D. Thesis, Linköping University, Linköping, Sweden, 1 October 2009. [Google Scholar]
- Palm, J.; Darby, S.J. The meanings of practices for energy consumption—A comparison of homes and workplaces. Sci. Technol. Stud. 2014, 27, 72–92. [Google Scholar]
- Isaksson, C.; Ellegård, K. Dividing or Sharing? A Time-geographical Examination of Eating, Labor, and Energy Consumption in Sweden. Energy Res. Social Sci. 2015, in press. [Google Scholar]
- Hägerstrand, T.; Ellegård, K.; Svedin, U.; Lenntorp, B. Tillvaroväven; Forskningsrådet Formas: Stockholm, Sweden, 2009. (In Swedish) [Google Scholar]
- Hägerstrand, T. What about people in regional science? Pap. Reg. Sci. 1970, 24, 7–24. [Google Scholar] [CrossRef]
- Ellegård, K. A time-geographical approach to the study of everyday life of individuals—A challenge of complexity. GeoJournal 1999, 48, 167–175. [Google Scholar] [CrossRef]
- Lenntorp, B. Paths in space-time environments: A time-geographic study of movement possibilities of individuals. Environ. Plan. A 1977, 9, 961–972. [Google Scholar]
- Statistic Sweden. The work reported in this paper has been carried out by Statistics Sweden as a part of, and with financial support by research and development work in Statistics- sup.Com 95.
- Ellegård, K.; Vrotsou, K. Capturing Patterns of Everyday Life: Presentation of the Visualization Method Visual-timepacts. In Proceedings of the International Association for Time-Use Research Conference, Copenhagen, Denmark, 16 August 2006.
- Widén, J. System Studies and Simulations of Distributed Photovoltaics in Sweden. Available online: http://www.citeulike.org/user/pbett/article/12788325 (accessed on 22 July 2015).
- Widén, J.; Molin, A.; Ellegård, K. Models of domestic occupancy, activities and energy use based on time-use data: Deterministic and stochastic approaches with application to various building-related simulations. J. Build. Perform. Simul. 2012, 5, 27–44. [Google Scholar] [CrossRef]
- Widén, J.; Karlsson, K. The Influence of Swedish Households’ Everyday Activities and Electricity-Use Patterns on the Utilization of Small-Scale Photovoltaic Systems. In Proceedings of the European Council for an Energy Efficient Economy, La Colle-sur-Loup, France, 1–6 June 2009.
- Bemelmans-Videc, M.-L.; Rist, R.C.; Vedung, E. Carrots, Sticks and Sermons: Policy Instruments and Their Evaluation; Transaction: New Brunswick, NJ, USA, 2003. [Google Scholar]
- Lindén, A.L.; Carlsson-Kanyama, A.; Eriksson, B. Efficient and inefficient aspects of residential energy behaviour: What are the policy instruments for change? Energy Policy 2006, 34, 1918–1927. [Google Scholar] [CrossRef]
- Vedung, E. Konsten Att Utvärdera Nätverk; Forsknings-och utvecklingscentralen för social-och hälsovården: Helsingfors, Finland, 2006. (In Swedish) [Google Scholar]
- Näringsdepartmentet. Samverkan för en Trygg, Effektiv Och Miljövänlig Energiförsörjning; Näringsdep., Regeringskansliet: Stockholm, Sweden, 2002. (In Swedish) [Google Scholar]
- Commission of the European Communities. Proposal for a Directive of the European Parliament of the Council on Energy End-use Efficiency and Energy Services. Available online: http://eur-lex.europa.eu/legal-content/EN/TXT/?uri=URISERV:l27057 (accessed on 6 January 2014).
- Henryson, J.; Håkansson, T.; Pyrko, J. Energy efficiency in buildings through information—Swedish perspective. Energy Policy 2000, 28, 169–180. [Google Scholar] [CrossRef]
- Gardner, G.T.; Stern, P.C. The short list: The most effective actions U.S. Households can take to curb climate change. Environment 2008, 50, 12–24. [Google Scholar] [CrossRef]
- Laitner, J.A.; Ehrhardt-Martinez, K.; McKinney, V. Examining the Scale of the Behaviour Energy Efficiency Continuum. In Proceedings of the European Council for an Energy Efficient Economy, La Colle sur Loup, France, 1–6 June 2009.
- Berkhout, P.H.G.; Muskens, J.C.; Velthuijsen, J.W. Defining the rebound effect. Energy Policy 2000, 28, 425–432. [Google Scholar] [CrossRef]
- Sorrell, S. Reducing energy demand: A review of issues, challenges and approaches. Renew. Sustain. Energy Rev. 2015, 47, 74–82. [Google Scholar] [CrossRef]
- Sorrell, S.; Dimitropoulos, J.; Sommerville, M. Empirical estimates of the direct rebound effect: A review. Energy Policy 2009, 37, 1356–1371. [Google Scholar] [CrossRef]
- Vedung, E. Informativa Styrmedel; Uppsala University: Uppsala, Sweden, 1995. [Google Scholar]
- Shove, E.; Lutzenhiser, L.; Guy, S.; Hackett, B.; Wilhite, H. Energy and social systems. Hum. Choice Clim. Chang. 1998, 2, 291–325. [Google Scholar]
- Benders, R.M.J.; Kok, R.; Moll, H.C.; Wiersma, G.; Noorman, K.J. New approaches for household energy conservation-in search of personal household energy budgets and energy reduction options. Energy Policy 2006, 34, 3612–3622. [Google Scholar] [CrossRef]
- Steg, L. Promoting household energy conservation. Energy Policy 2008, 36, 4449–4453. [Google Scholar] [CrossRef]
- van der Werff, E.; Steg, L. One model to predict them all: Predicting energy behaviours with the norm activation model. Energy Res. Soc. Sci. 2015, 6, 8–14. [Google Scholar] [CrossRef]
- Abrahamse, W.; Steg, L.; Vlek, C.; Rothengatter, T. The effect of tailored information, goal setting, and tailored feedback on household energy use, energy-related behaviors, and behavioral antecedents. J. Environ. Psychol. 2007, 27, 265–276. [Google Scholar] [CrossRef]
- Lee, B.-K.; Lee, W.-N. The effect of information overload on consumer choice quality in an on-line environment. Psychol. Mark. 2004, 21, 159–183. [Google Scholar] [CrossRef]
- Malhotra, N.K. Reflections on the information overload paradigm in consumer decision making. J. Consum. Res. 1984, 10, 436–440. [Google Scholar] [CrossRef]
- Palm, J.; Tengvard, M. Motives for and barriers to household adoption of small-scale production of electricity: Examples from sweden. Sustain. Sci. Pract. Policy 2011, 7, 6–15. [Google Scholar]
- Murray, A.G.; Mills, B.F. Read the label! Energy star appliance label awareness and uptake among U.S. consumers. Energy Econ. 2011, 33, 1103–1110. [Google Scholar] [CrossRef]
- Palm, J.; Ellegård, K. Visualizing energy consumption activities as a tool for developing effective policy. Int. J. Consum. Stud. 2011, 35, 171–179. [Google Scholar] [CrossRef]
- Ellegård, K.; Palm, J. Visualizing energy consumption activities as a tool for making everyday life more sustainable. Appl. Energy 2011, 88, 1920–1926. [Google Scholar] [CrossRef]
- Christie, L.; Donn, M.; Walton, D. The ‘apparent disconnect’ towards the adoption of energy-efficient technologies. Build. Res. Inf. 2011, 39, 450–458. [Google Scholar] [CrossRef]
- Nair, G.; Gustavsson, L.; Mahapatra, K. Factors influencing energy efficiency investments in existing swedish residential buildings. Energy Policy 2010, 38, 2956–2963. [Google Scholar] [CrossRef]
- Gadenne, D.; Sharma, B.; Kerr, D.; Smith, T. The influence of consumers’ environmental beliefs and attitudes on energy saving behaviours. Energy Policy 2011, 39, 7684–7694. [Google Scholar] [CrossRef]
- Garabuau-Moussaoui, I. Energy-related logics of action throughout the ages in france: Historical milestones, stages of life and intergenerational transmissions. Energy Effic. 2011, 4, 493–509. [Google Scholar]
- Kelly, G. Sustainability at home: Policy measures for energy-efficient appliances. Renew. Sustain. Energy Rev. 2012, 16, 6851–6860. [Google Scholar] [CrossRef]
- Shwom, R.; Lorenzen, J.A. Changing household consumption to address climate change: Social scientific insights and challenges. Wiley Interdiscip. Rev. Clim. Chang. 2012, 3, 379–395. [Google Scholar] [CrossRef]
- Hargreavesn, T.; Nye, M.; Burgess, J. Making energy visible: A qualitative field study of how householders interact with feedback from smart energy monitors. Energy Policy 2010, 38, 6111–6119. [Google Scholar] [CrossRef]
- Maréchal, K. Not irrational but habitual: The importance of “behavioural lock-in” in energy consumption. Ecol. Econ. 2010, 69, 1104–1114. [Google Scholar] [CrossRef]
- Kua, H.W.; Wong, S.E. Lessons for integrated household energy conservation policies from an intervention study in singapore. Energy Policy 2012, 47, 49–56. [Google Scholar] [CrossRef]
- Räty, R.; Carlsson-Kanyama, A. Energy consumption by gender in some european countries. Energy Policy 2010, 38, 646–649. [Google Scholar] [CrossRef]
- Røpke, I.; Haunstrup Christensen, T.; Ole Jensen, J. Information and communication technologies—A new round of household electrification. Energy Policy 2010, 38, 1764–1773. [Google Scholar] [CrossRef]
- Zhang, T.; Siebers, P.O.; Aickelin, U. A three-dimensional model of residential energy consumer archetypes for local energy policy design in the UK. Energy Policy 2012, 47, 102–110. [Google Scholar] [CrossRef]
- Swedish Energy Agency. Energiläget i Siffror 2015; Swedish Energy Agency: Eskilstuna, Sweden, 2015. (In Swedish)
- Statens Offentliga Utredningar. Vägen Till Ett Energieffektivare Sverige: Slutbetänkande; Fritze: Stockholm, Sweden, 2008. (In Swedish) [Google Scholar]
- Bladh, M. Hushållens Elförbrukning: Utvecklingen Totalt Och i Detalj 1980–2000; Tema University: Linköping, Sweden, 2005. (In Swedish) [Google Scholar]
- Statistic Sweden. Statistisk årsbok för sverige. Årg. 95 (2009); Statistiska centralbyrån: Stockholm, Sweden, 2008. (In Swedish)
- Ellegård, K. Lockropen ljuder: Kom.Hem. In Den gränslösa medborgaren: En antologi om en möjlig dialog; Agora: Stockholm, Sweden, 2002. (In Swedish) [Google Scholar]
- Ellegård, K.; Cooper, M. Complexity in daily life—A 3d-visualization showing activity patterns in their contexts. Electron. Int. J. Time Use Res. 2004, 1, 37–59. [Google Scholar] [CrossRef]
- Vrotsou, K.; Ellegård, K.; Cooper, M. Exploring time diaries using semi-automated activity pattern extraction. Electron. Int. J. Time Use Res. 2009, 6, 1–25. [Google Scholar] [CrossRef]
- Isaksson, C. Uthålligt Lärande Om Värmen? Domesticering Av Energiteknik i Passivhus. Available online: http://www.diva-portal.org/smash/record.jsf?pid=diva2%3A278013&dswid=5592 (accessed on 22 July 2015).
- Karresand, H. Apparater, Aktiviteter Och Aktörer: Lågenergiboende Som Resurs Och Restriktion för Energiordningar. Available online: http://liu.diva-portal.org/smash/get/diva2:748731/FULLTEXT02.pdf (accessed on 22 July 2015).
- Eurostat (Statistical Office of the European Communities). How Europeans Spend Their Time: Everyday Life of Women and Men; Data 1998–2002. Available online: http://www.unece.org/fileadmin/DAM/stats/gender/publications/Multi-Country/EUROSTAT/HowEuropeansSpendTheirTime.pdf (accessed on 22 July 2015).
© 2015 by the authors; licensee MDPI, Basel, Switzerland. This article is an open access article distributed under the terms and conditions of the Creative Commons Attribution license (http://creativecommons.org/licenses/by/4.0/).
Share and Cite
MDPI and ACS Style
Ellegård, K.; Palm, J. Who Is Behaving? Consequences for Energy Policy of Concept Confusion. Energies 2015, 8, 7618-7637. https://doi.org/10.3390/en8087618
AMA Style
Ellegård K, Palm J. Who Is Behaving? Consequences for Energy Policy of Concept Confusion. Energies. 2015; 8(8):7618-7637. https://doi.org/10.3390/en8087618
Chicago/Turabian StyleEllegård, Kajsa, and Jenny Palm. 2015. "Who Is Behaving? Consequences for Energy Policy of Concept Confusion" Energies 8, no. 8: 7618-7637. https://doi.org/10.3390/en8087618