1. Introduction
The global climate change situation is becoming more severe due to the depletion of fossil energy, so the application of renewable energy sources has been receiving more attention. Actually, except for geothermal and tidal, all kinds of renewable energies are different forms of solar energy. As one of the most popular forms of solar energy application, PV generation including grid-connected PV plants and stand-alone PV systems has increased rapidly around the World in recent years and will keep increasing in the future. Total installed PV capacity worldwide reached over 67.4 GW at the end of 2011. PV is now, after hydro and wind power, the third most important renewable energy in terms of globally installed capacity. The growth rate of PV during 2011 reached almost 70%, an outstanding level among all renewable technologies. The total energy output of the World’s PV capacity run over a calendar year is equal to some 80 billion kWh. This amount of energy is sufficient to cover the annual power supply needs of over 20 million households around the World [
1].
The yearly growth rates over the last ten years were more than 40% on average [
2], which makes PV one of the fastest growing industries at present. Many business analysts predict that investments in PV research, technology and industry could double from € 35–40 billion in 2010 to reach € 70 billion in 2015, while prices for consumers are continuously decreasing at the same time [
2]. The Chinese PV market capacity in 2010 is between 500–700 MW, bringing the cumulative installed capacity to about 1 GW. This is a significant increase from 160 MW in 2009, but still only 5 to 7% of the total solar PV production of China [
2]. This situation will change because of the revision of the PV targets for 2020. According to press reports, the new energy revitalizing development plan drafted by the National Development and Reform Commission of China proposes a solar PV installed power generation capacity target of 20 GW by 2020.
Large-scale grid-connected PV plant constitute the fastest growing part of the PV generation market in China. Due to the random variation of solar irradiance under changeable weather conditions, the output power of grid-connected PV plant follows the fluctuations of solar irradiance and this causes great difficulties to balance the power and adjust the frequency of the regional power systems. Power prediction of grid-connected PV plants is an important measure to solve this problem. It can provide useful input information and data for the operational running functions of regional power systems, such as optimal power flow, economic dispatch, reserve capacity control and security assessment. Accurate power prediction can enhance the stability and security level and lead to more economic operating decisions for the power system. Moreover, power prediction is important for the independent generation operator to schedule different types of generation plants or stations, determine reserve levels, provide information for electricity market trading, etc.
Solar irradiance forecasting is the basis of the power prediction of PV generation. With the fast growth of solar PV generation in recent years, there is an increasing need for more precise and applicable modeling, forecasting and prediction of solar irradiance [
3]. The available computational models include linear regression models [
4,
5], satellite data based models [
6,
7] and ANN models using meteorological parameters [
8,
9]. A regressive model for the estimation of the hourly diffuse solar irradiation under all sky conditions is proposed in [
4]. This regressive model is based on the sigmoid function and uses the clearness index and the relative optical mass as predictors. Many solar irradiance forecasting models were developed in the past. These models can be divided into two main classes: physical models and statistical models. Physical models are based on mathematical equations which describe the physical state and dynamic motion of the atmosphere. These physical models are very complex non-linear equations which need strong computing power to solve them. Numerical methods were used to obtain the approximate solutions of these equations, and these models are also known as numerical weather predictions (NWP) models. NWP is used in forecasting but it is not always available. The errors of solar irradiance forecast based on NWP vary significantly and depend on the different climate and dynamic motion of the atmosphere at the study location [
10,
11,
12]. The statistical models include time series models [
13,
14], satellite data based models [
15], sky images based models [
16], ANN and wavelet analysis based models [
17,
18,
19]. The statistical models based on satellite data and sky images detect the motion of cloud structures using motion vector fields. The motion of cloud structures is determined from two consecutive cloud index images from satellite data or sky camera images. The errors of satellite data and sky images based forecasts proposed in the literature [
15,
16] increase drastically under low sun elevations, high spatial variabilities and low irradiance conditions. In [
17], a practical method for solar irradiance forecast using ANN is presented. The proposed model makes it possible to forecast the solar irradiance on 24 h basis using the present values of the mean daily solar irradiance and air temperature.
Usually, the statistical models are less complex than physical models because they need less input information and shorter computation time for the forecast. Two features should be taken into account for the evaluation of these models: the first is the availability of data to be used as input by the models and the second is the accuracy and complexity of the forecasting model. Satellite data, sky images and NWP are not always available for various occasions. However, common meteorological parameters including ambient temperature, relative humidity, wind speed, wind direction, sunshine duration and clearness index are available in most instances, so the conventional solar irradiance forecasting model is built with the input of the historical measured data of solar irradiance and other meteorological parameters.
According to the technical specifications of the State Grid Corporation of China, the time scale of solar irradiance forecasting includes ultra short-term (up to 4–6 h ahead) and short-term (up to 24–72 h ahead) forecasting. The forecast up to 24 h ahead or even more is needed for the power dispatching plans and the optimization operations of grid-connected PV plants and the coordination control of energy storage devices. The most common short-term forecast horizon is 24 h of the next day. Solar irradiance forecasting models on different time scales based on ANN using meteorological parameters without NWP and satellite data show good performance and can be classified into three different types [
17]. The first one estimates the solar irradiance based on some meteorological parameters, the second one allows forecasting the future solar irradiance based on the past observed data of solar irradiance, the last one combines the two previous models. These approaches need some meteorological parameters as input of the ANN model, but these meteorological data are not always available. In order to overcome this problem, a simple approach for forecasting 24 h ahead solar irradiance using multilayer perceptron is proposed in [
15]. It shows good performance in forecasting solar irradiance except under unstable weather conditions such as fast variations or violent fluctuations.
The components of the input vector determine the adequacy and sufficiency of the input information. From the point of view of the input vector dimensions, excessive components will make the model structure become too complex, which increases the difficulty of modeling, but too few components will lead to the absence of important information that cause the model not to reflect the true variation. Only a reasonable balance between model complexity and information absence can settle the problem of the determination for the dimensions of input vector. From the point of view of the introduced forms for the components of input vector, most ANN models directly use the original data series of meteorological parameters as the input vector of the model. This will import too much information redundancy and reduce the generalization ability of the ANN forecasting model. In order to overcome these shortcomings and improve the forecast accuracy, in this paper the ANN model is improved in two aspects: firstly, some new input components are constructed using the few available meteorological parameters under the input dimension limits to extract more features from the existing data, secondly, CV is applied in the determination of the ANN model structure to optimize the number of neurons and other parameters.
2. Relation between Solar Irradiance and Weather Variations
Solar irradiance is defined as the amount of electromagnetic energy incident on a surface per unit time and per unit area. The energy emitted by the Sun passes through space until it is intercepted by planets, other celestial objects, or interstellar gas and dust. The intensity of solar radiation striking these objects is determined by a physical law known as the inverse square law. Only about 40% (general level) of the solar energy intercepted at the top of Earth’s atmosphere passes through to the surface. The proportion is different under different weather conditions: this proportion is greater than 40% in sunny days, approximately equal to 40–50% in cloudy days and less than 40% in overcast days. The solar constant
GSC is the energy from the Sun, per unit time received on a unit area of surface perpendicular to the direction of the Sun’s rays, at mean Earth-Sun distance, outside the atmosphere. The World Metrological Organization suggests a value of 1367 W/m
2 [
20].
Solar irradiance includes extraterrestrial irradiance
G0 and surface irradiance
Gs. Extraterrestrial irradiance refers to the upper bound irradiance which is not affected by the aerosphere and weather conditions but depends on the Earth’s rotation and revolution. Extraterrestrial irradiance is related to the latitude, the Sun elevation angle, date and the time of the day. Ignoring some minor factors such as polar motion, the precession of the Earth’s axis and leap years, extraterrestrial irradiance changes yearly. For a certain location, considering the effects of different day of one year and different time of one day, the corresponding extraterrestrial irradiance
G0 can be calculated from Formula (1) [
21]:
where
GSC is solar constant,
n is the date sequence number in one year,
n ∈ [1,365],
δ is solar declination,
ϕ is latitude,
ω is solar hour angle.
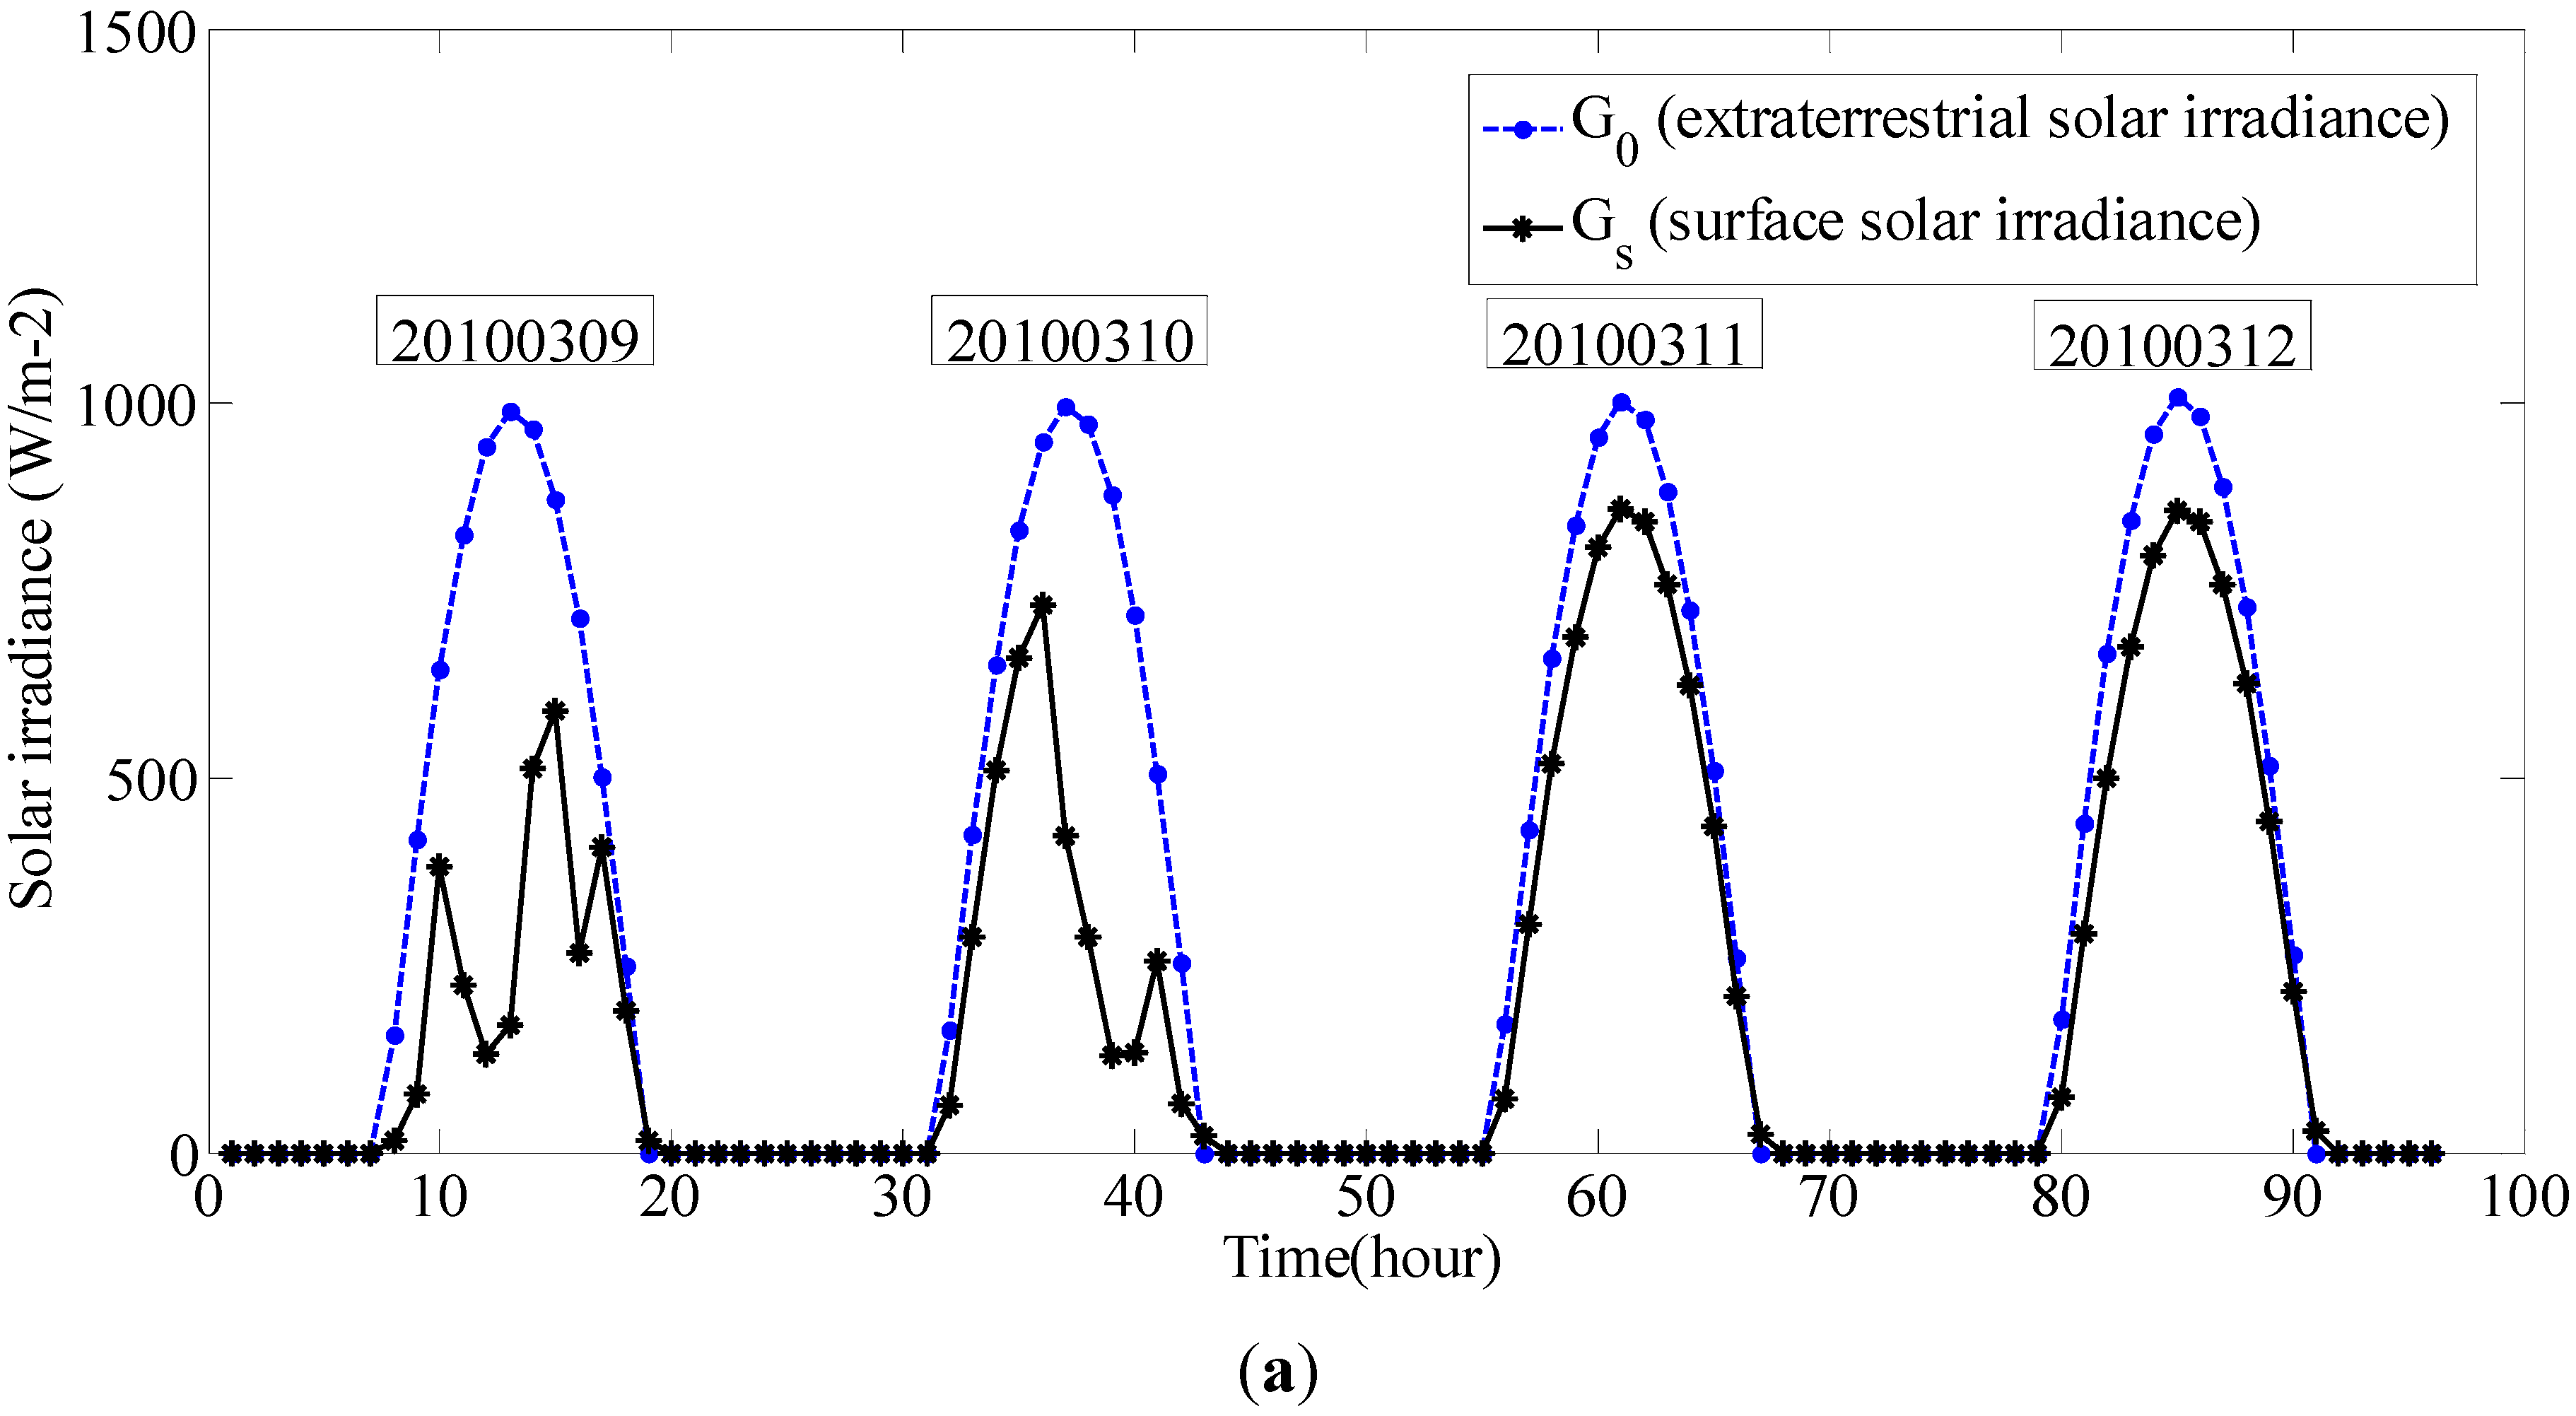
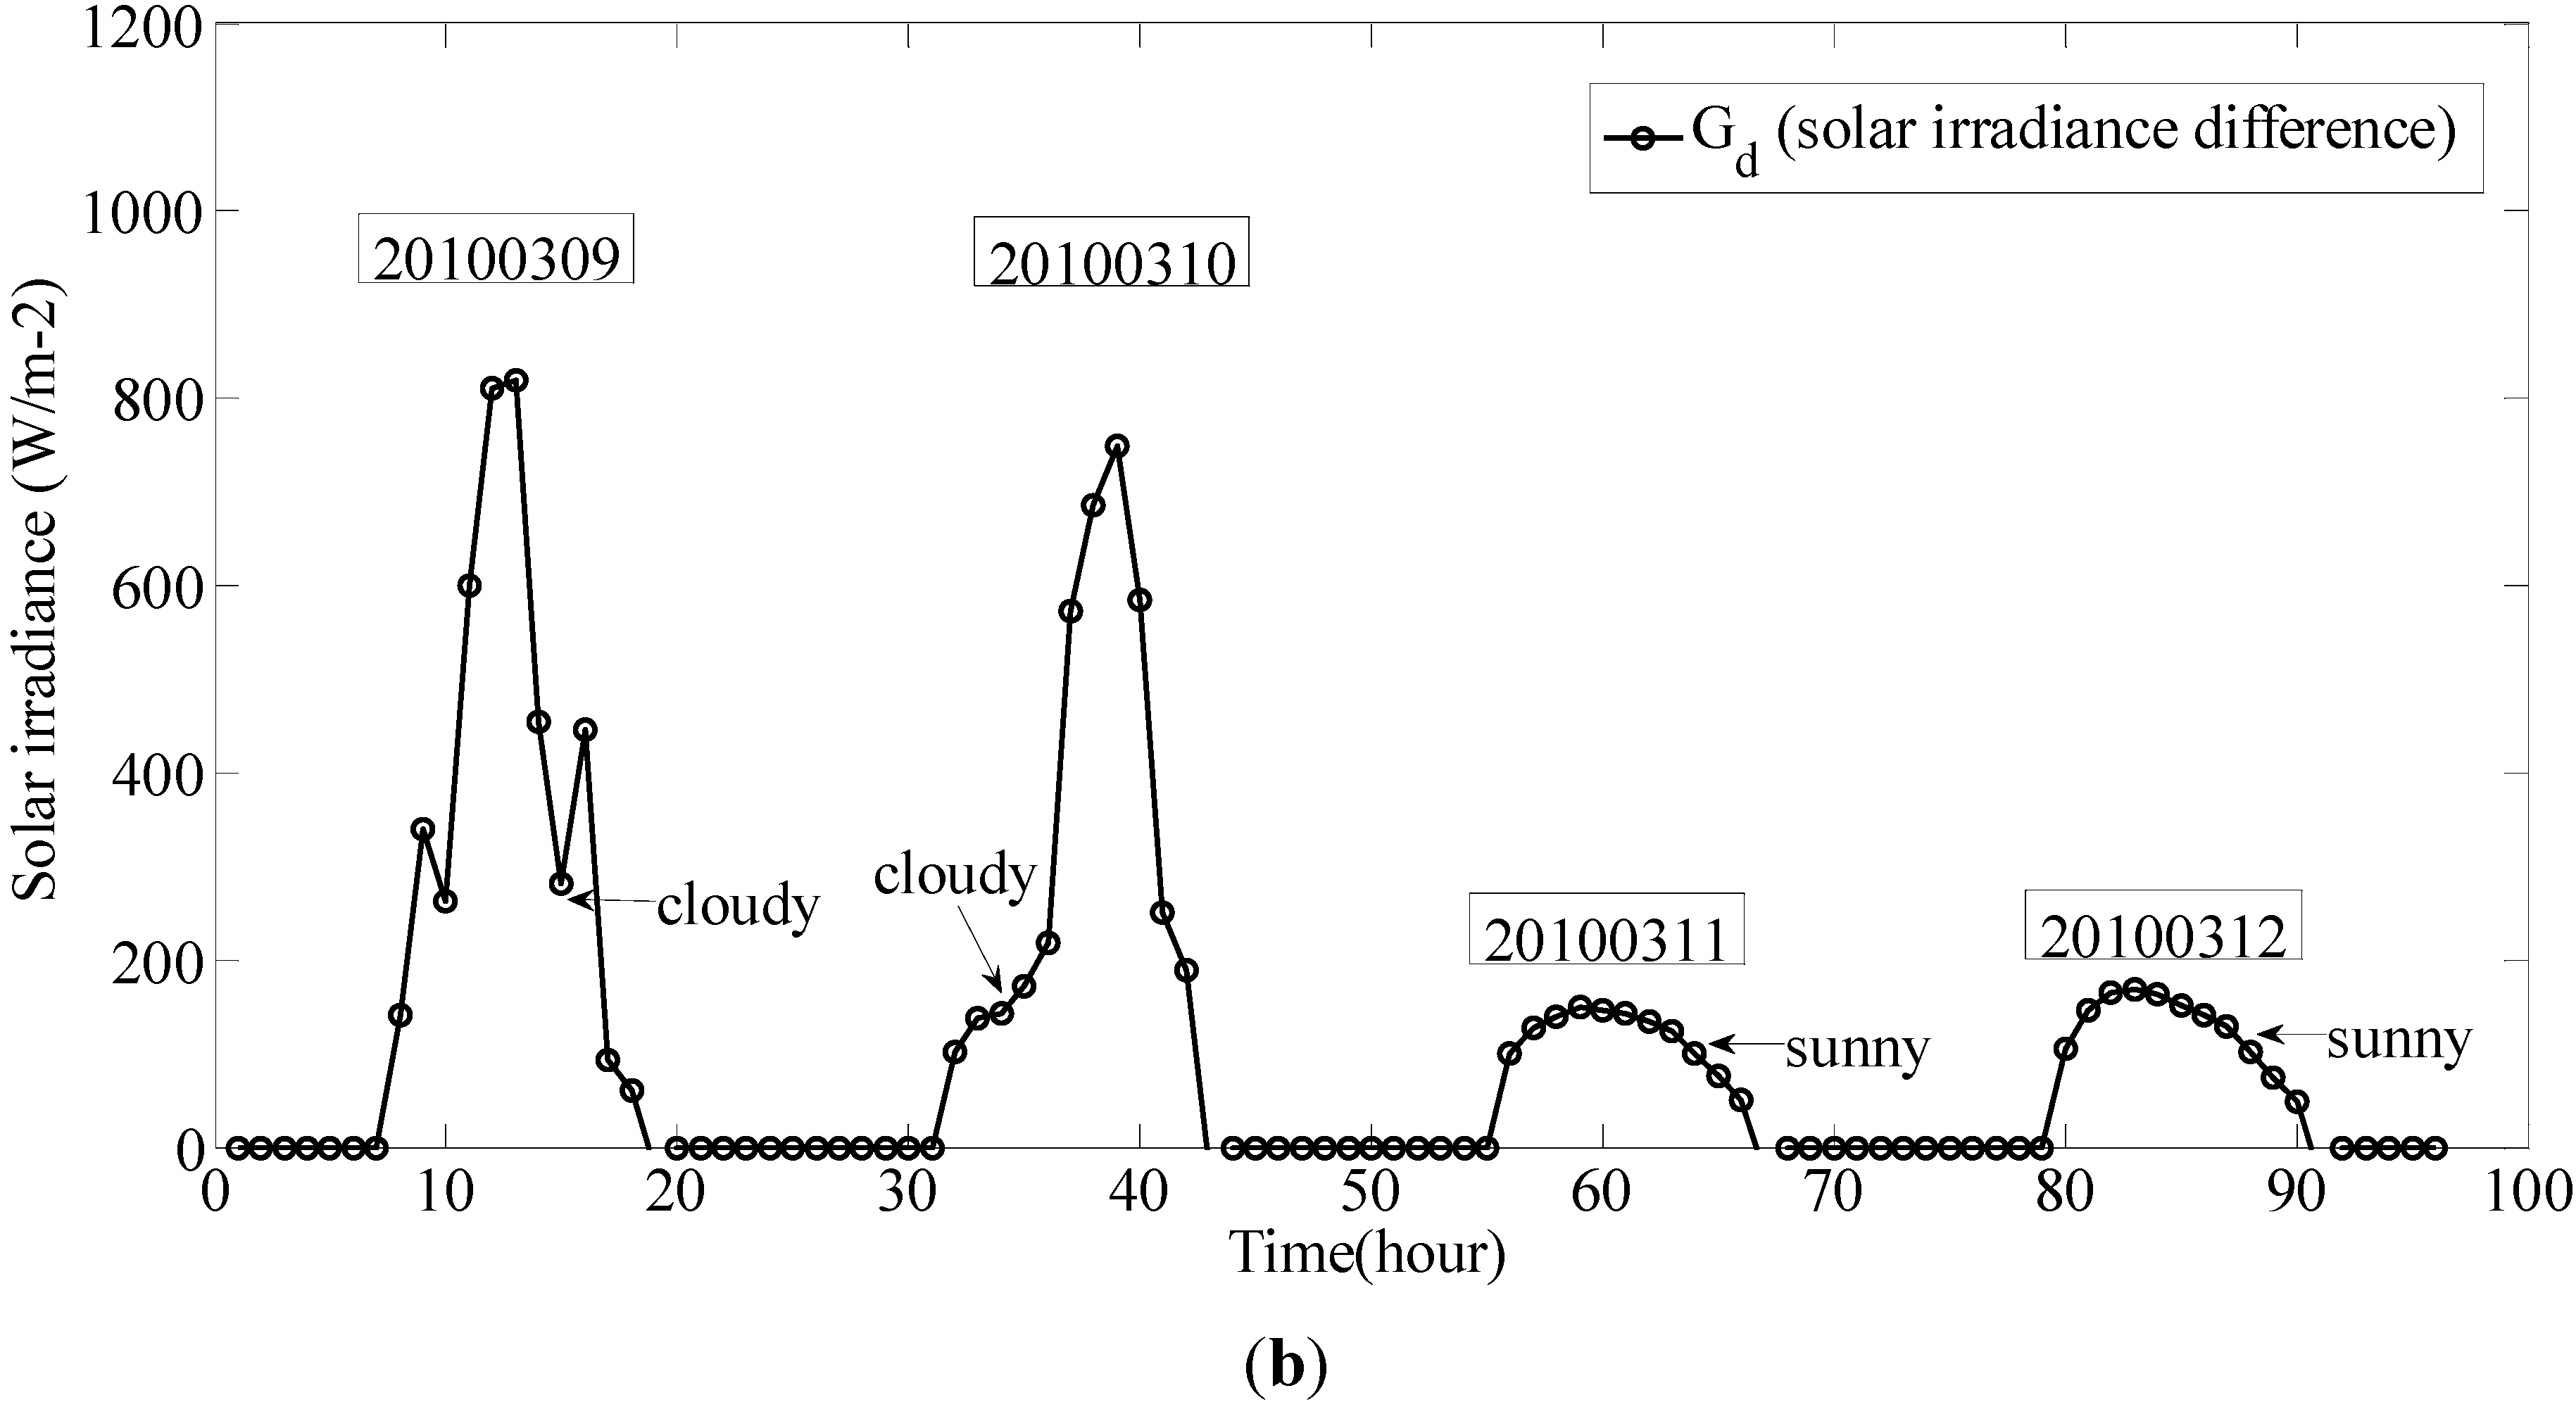
In the transmission process of solar radiation from the upper bound to the Earth’s surface, there will be an amount of attenuation because of the absorption, scattering and reflection of the atmosphere. The degree of attenuation is related to various factors such as the amount of clouds, cloud form, cloud thickness, water vapor, and aerosols. Therefore the surface irradiance at a certain location is less than its corresponding extraterrestrial irradiance. The surface irradiance changes randomly and these changes are closely related to the atmospheric motion. The difference between
G0 extraterrestrial irradiance and
Gs surface irradiance
Gd (hereinafter referred to as solar irradiance difference
Gd =
G0 −
Gs) can reflect the weather conditions. The measured data of surface solar irradiance
Gs (from 2010.03.09 to 2010.03.12, Kunming, Yunnan, China), corresponding extraterrestrial solar irradiance
G0 and solar irradiance difference
Gd are shown in
Figure 1.
Figure 1.
Extraterrestrial irradiance, surface irradiance and solar irradiance difference; (a) Extraterrestrial irradiance and surface irradiance; (b) Solar irradiance difference.
Figure 1.
Extraterrestrial irradiance, surface irradiance and solar irradiance difference; (a) Extraterrestrial irradiance and surface irradiance; (b) Solar irradiance difference.
In
Figure 1, we can see that the solar irradiance difference
Gd is small and has similar shape under sunny days (20100311, 20100312). In contrast,
Gd is larger and has more inflections on cloudy days (20100309, 20100310) than sunny days. In other words, it means that the change of
Gd is closely related to the weather conditions. The analysis of
Gd related to different weather conditions can lead and help us to extract more information from the measured data of surface solar irradiance
Gs and the calculated data of corresponding extraterrestrial solar irradiance
G0 by finding and selecting suitable mathematic parameters which can reflect these correlative variation characteristics.
Due to the strong correlation between some meteorological parameters and irradiance, these meteorological parameters are directly influenced by irradiance. Thus these parameters can reflect the changes of irradiance and can be considered as the input of the ANN forecasting model. These parameters include ambient temperature [
5], relative humidity,
etc.
3. Reconstruction for the Input Vector of the Forecasting Model
The components of forecasting model input vector are called forecasting factors, whose selection is significant to the performance of the model. Generally, forecasting factors of the ANN model are selected from the following two categories of historical data: solar irradiance itself and the meteorological parameters related to solar irradiance. Two aspects need to be considered in the process of the selection: what kind of data should be selected and in what form these data would be imported in. In most of the current ANN solar irradiance forecasting models, multi-dimensional historical data series of solar irradiance within a period of time is used as forecasting factors, it can be shown as:
where
IG is the input vector of the ANN forecasting model,
Gt−i (
i = 1,…,
m) is the historical data of solar irradiance,
m is embedding dimension. The time range of the historical data is determined by
m and sampling interval. Usually,
m is greater than 8.
Under varying weather conditions, the surface solar irradiance changes randomly. The surface solar irradiance is zero during the period of time between sunset and sunrise while it varies constantly between sunrise and sunset, taking the unprocessed multi-dimensional historical data series of solar irradiance as forecasting factors will import too much repeated information and lead to high dimensions of the input vector of the model which will make the modeling more difficult and complicated. Therefore, instead of the historical data series of solar irradiance, the statistical indicators of the historical data within a period of time can be taken as the new forecasting factors, so effective information of the historical data will be fully extracted and utilized. Meanwhile, the dimensions of input vector will be decreased. Moreover, because solar irradiance difference Gd reflect different weather conditions, it also can be considered as forecasting factors in appropriate forms, so that accurate weather condition information can be obtained for the model and the forecasting will be more precise. The surface irradiance Gs is discrete sampling data and extraterrestrial irradiance G0 is corresponding calculated value, thus Gd is a discrete multi-dimensional data series. Considering the restriction of the input vector dimensions, we can take some mathematical parameters of the data series of Gd as forecasting factors.
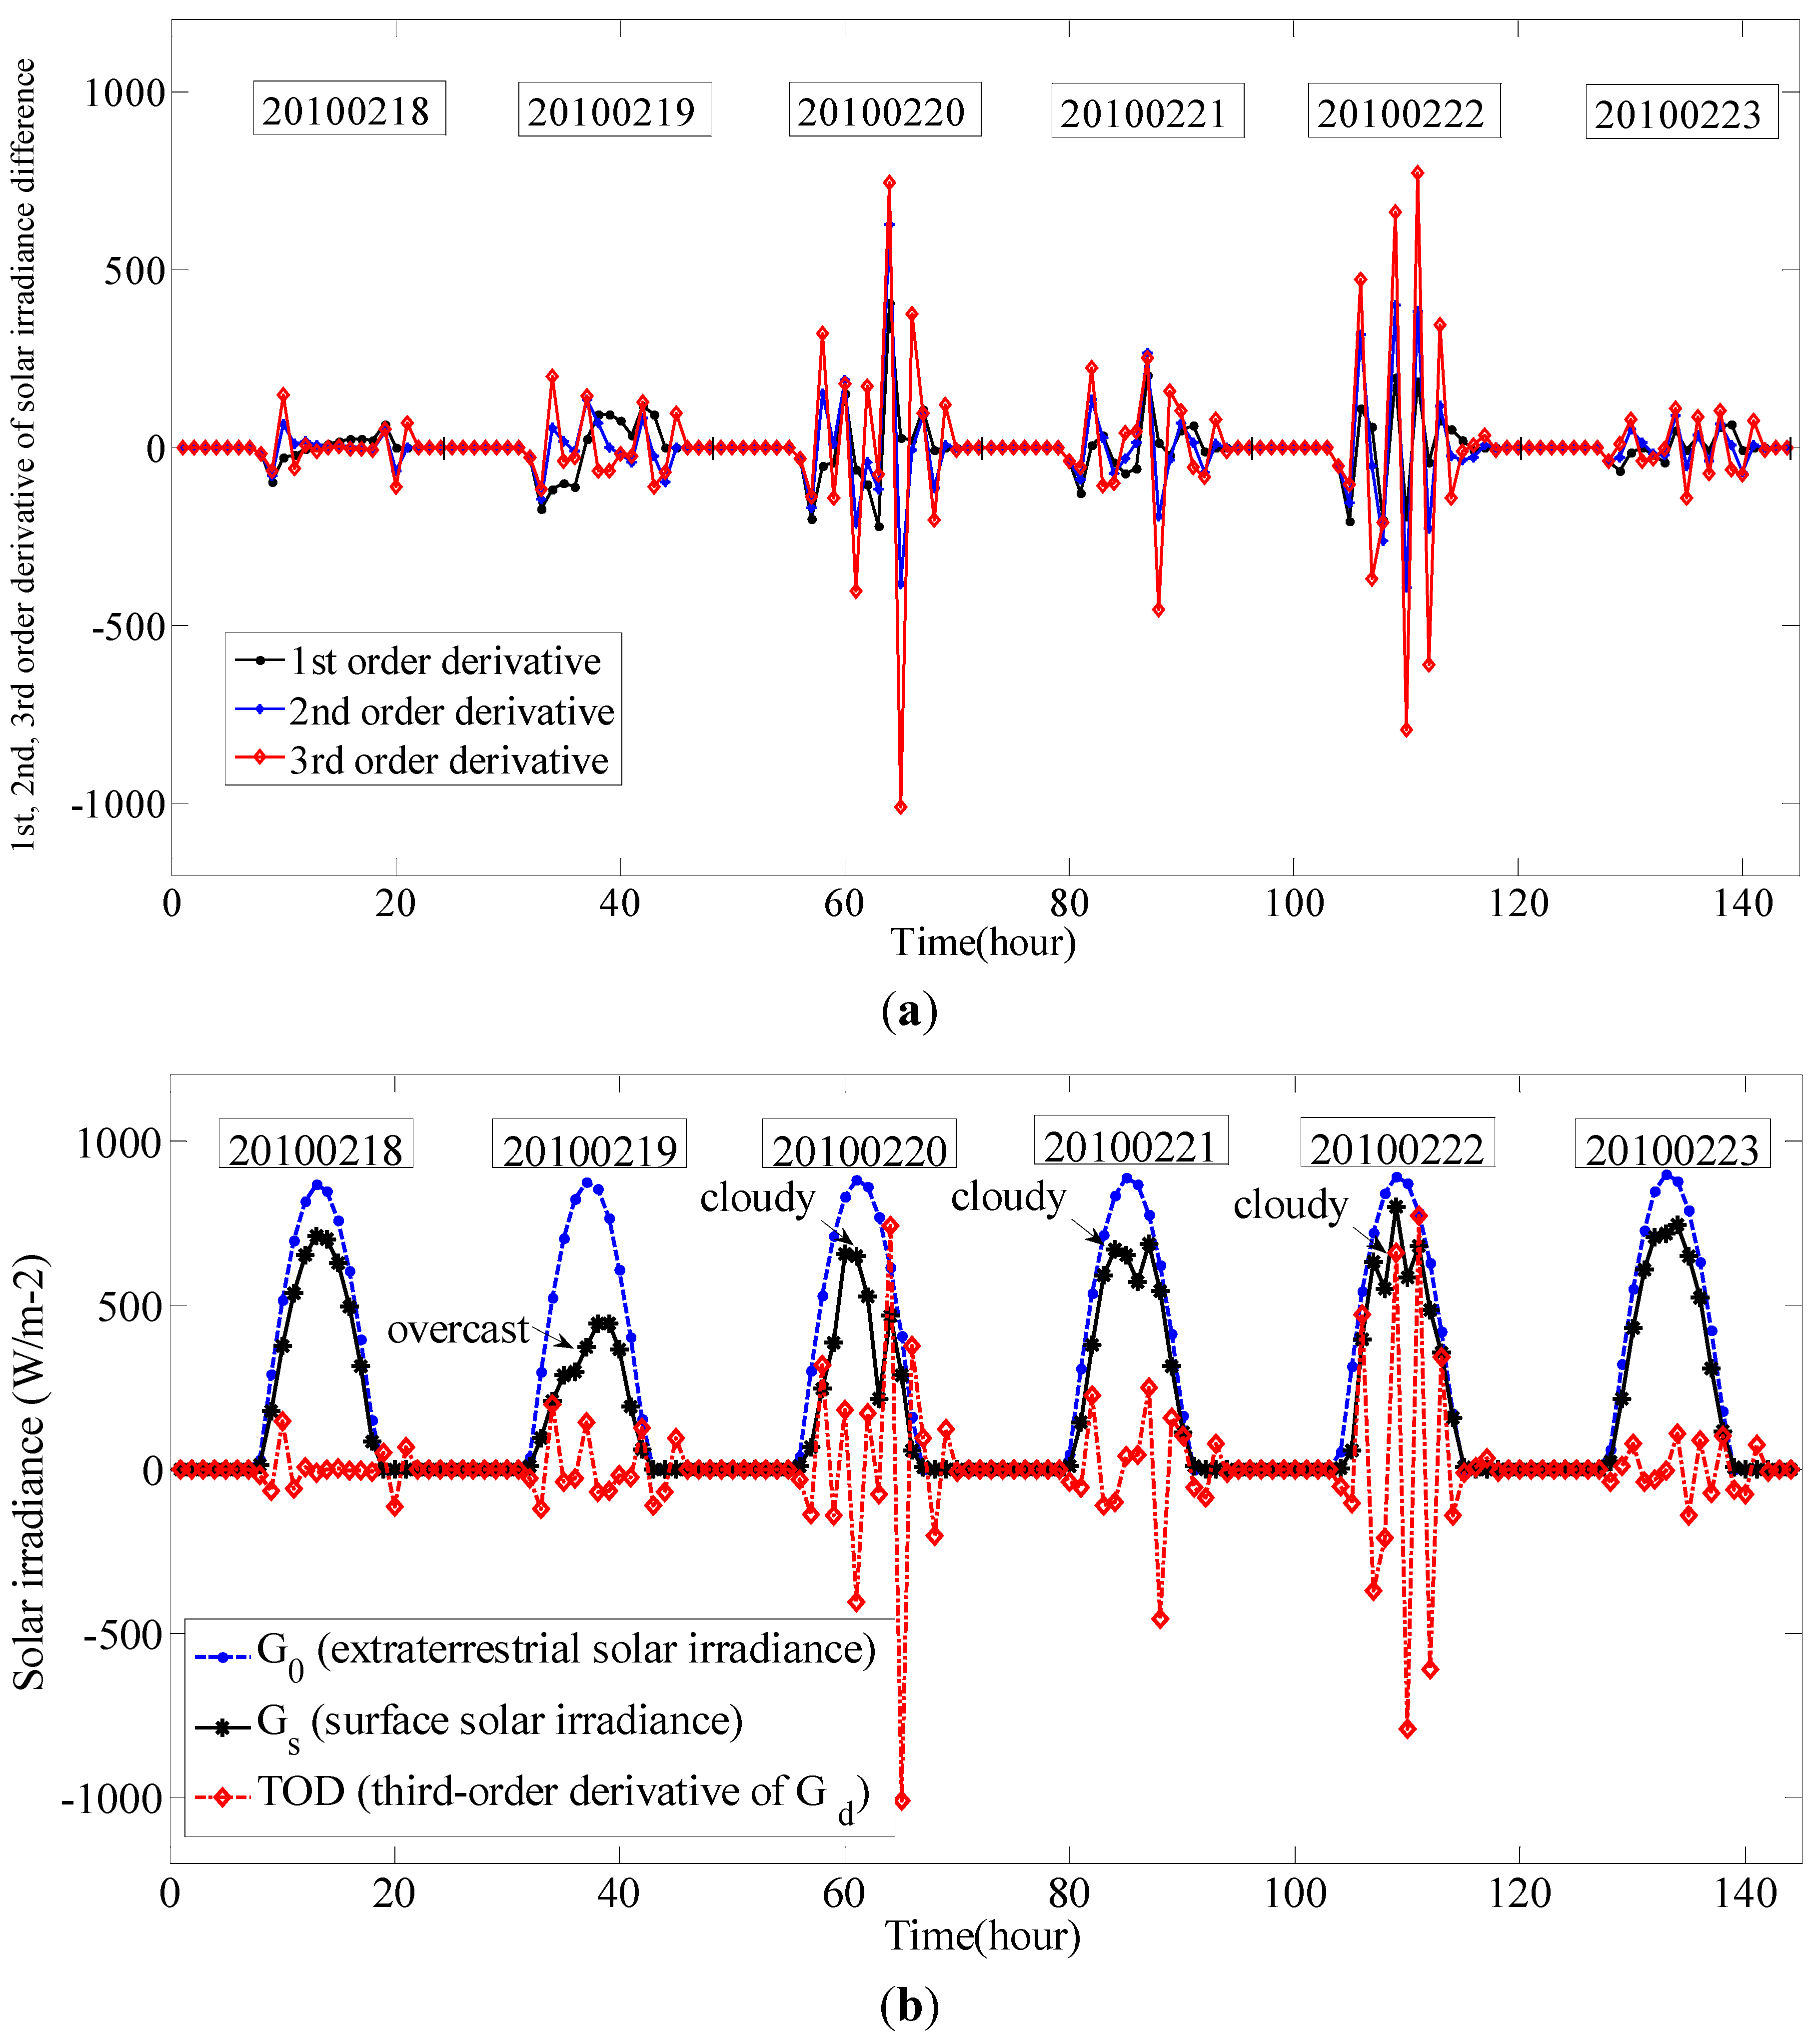
Usually, the derivative is a proper index to describe the variation tendency of the corresponding variable. The measured data of surface solar irradiance
Gs (from 2010.02.18 to 2010.02.23, Kunming, Yunnan, China), corresponding extraterrestrial solar irradiance
G0, the first-order, second-order and third-order derivative of solar irradiance difference are calculated and shown in
Figure 2.
It follows from the mathematical definition that derivatives of solar irradiance difference are related to the fluctuation of weather conditions. In
Figure 2, it can be seen that all order derivatives (1st, 2nd and 3rd order) of solar irradiance difference are positively correlated to the fluctuations intensity of surface solar irradiance. Further research indicated that third-order derivative of solar irradiance difference (
TOD =
d3Gd/
dt3) is obviously greater than the other two derivatives (1st and 2nd order) while there are mutations in the curve of
Gs which means that fast variation and violent fluctuation were occurred in the weather.
The comparisons of these derivatives shown in
Figure 2(a) have also illustrated this point. Therefore, third-order derivative of solar irradiance difference can be selected as an appropriate measure to describe the variation and fluctuation of weather conditions. In order to get more significant, clear and simple description for different weather conditions of one day, the maximum value of
TOD denoted by
TODmax is selected as an index for the weather changing characteristics.
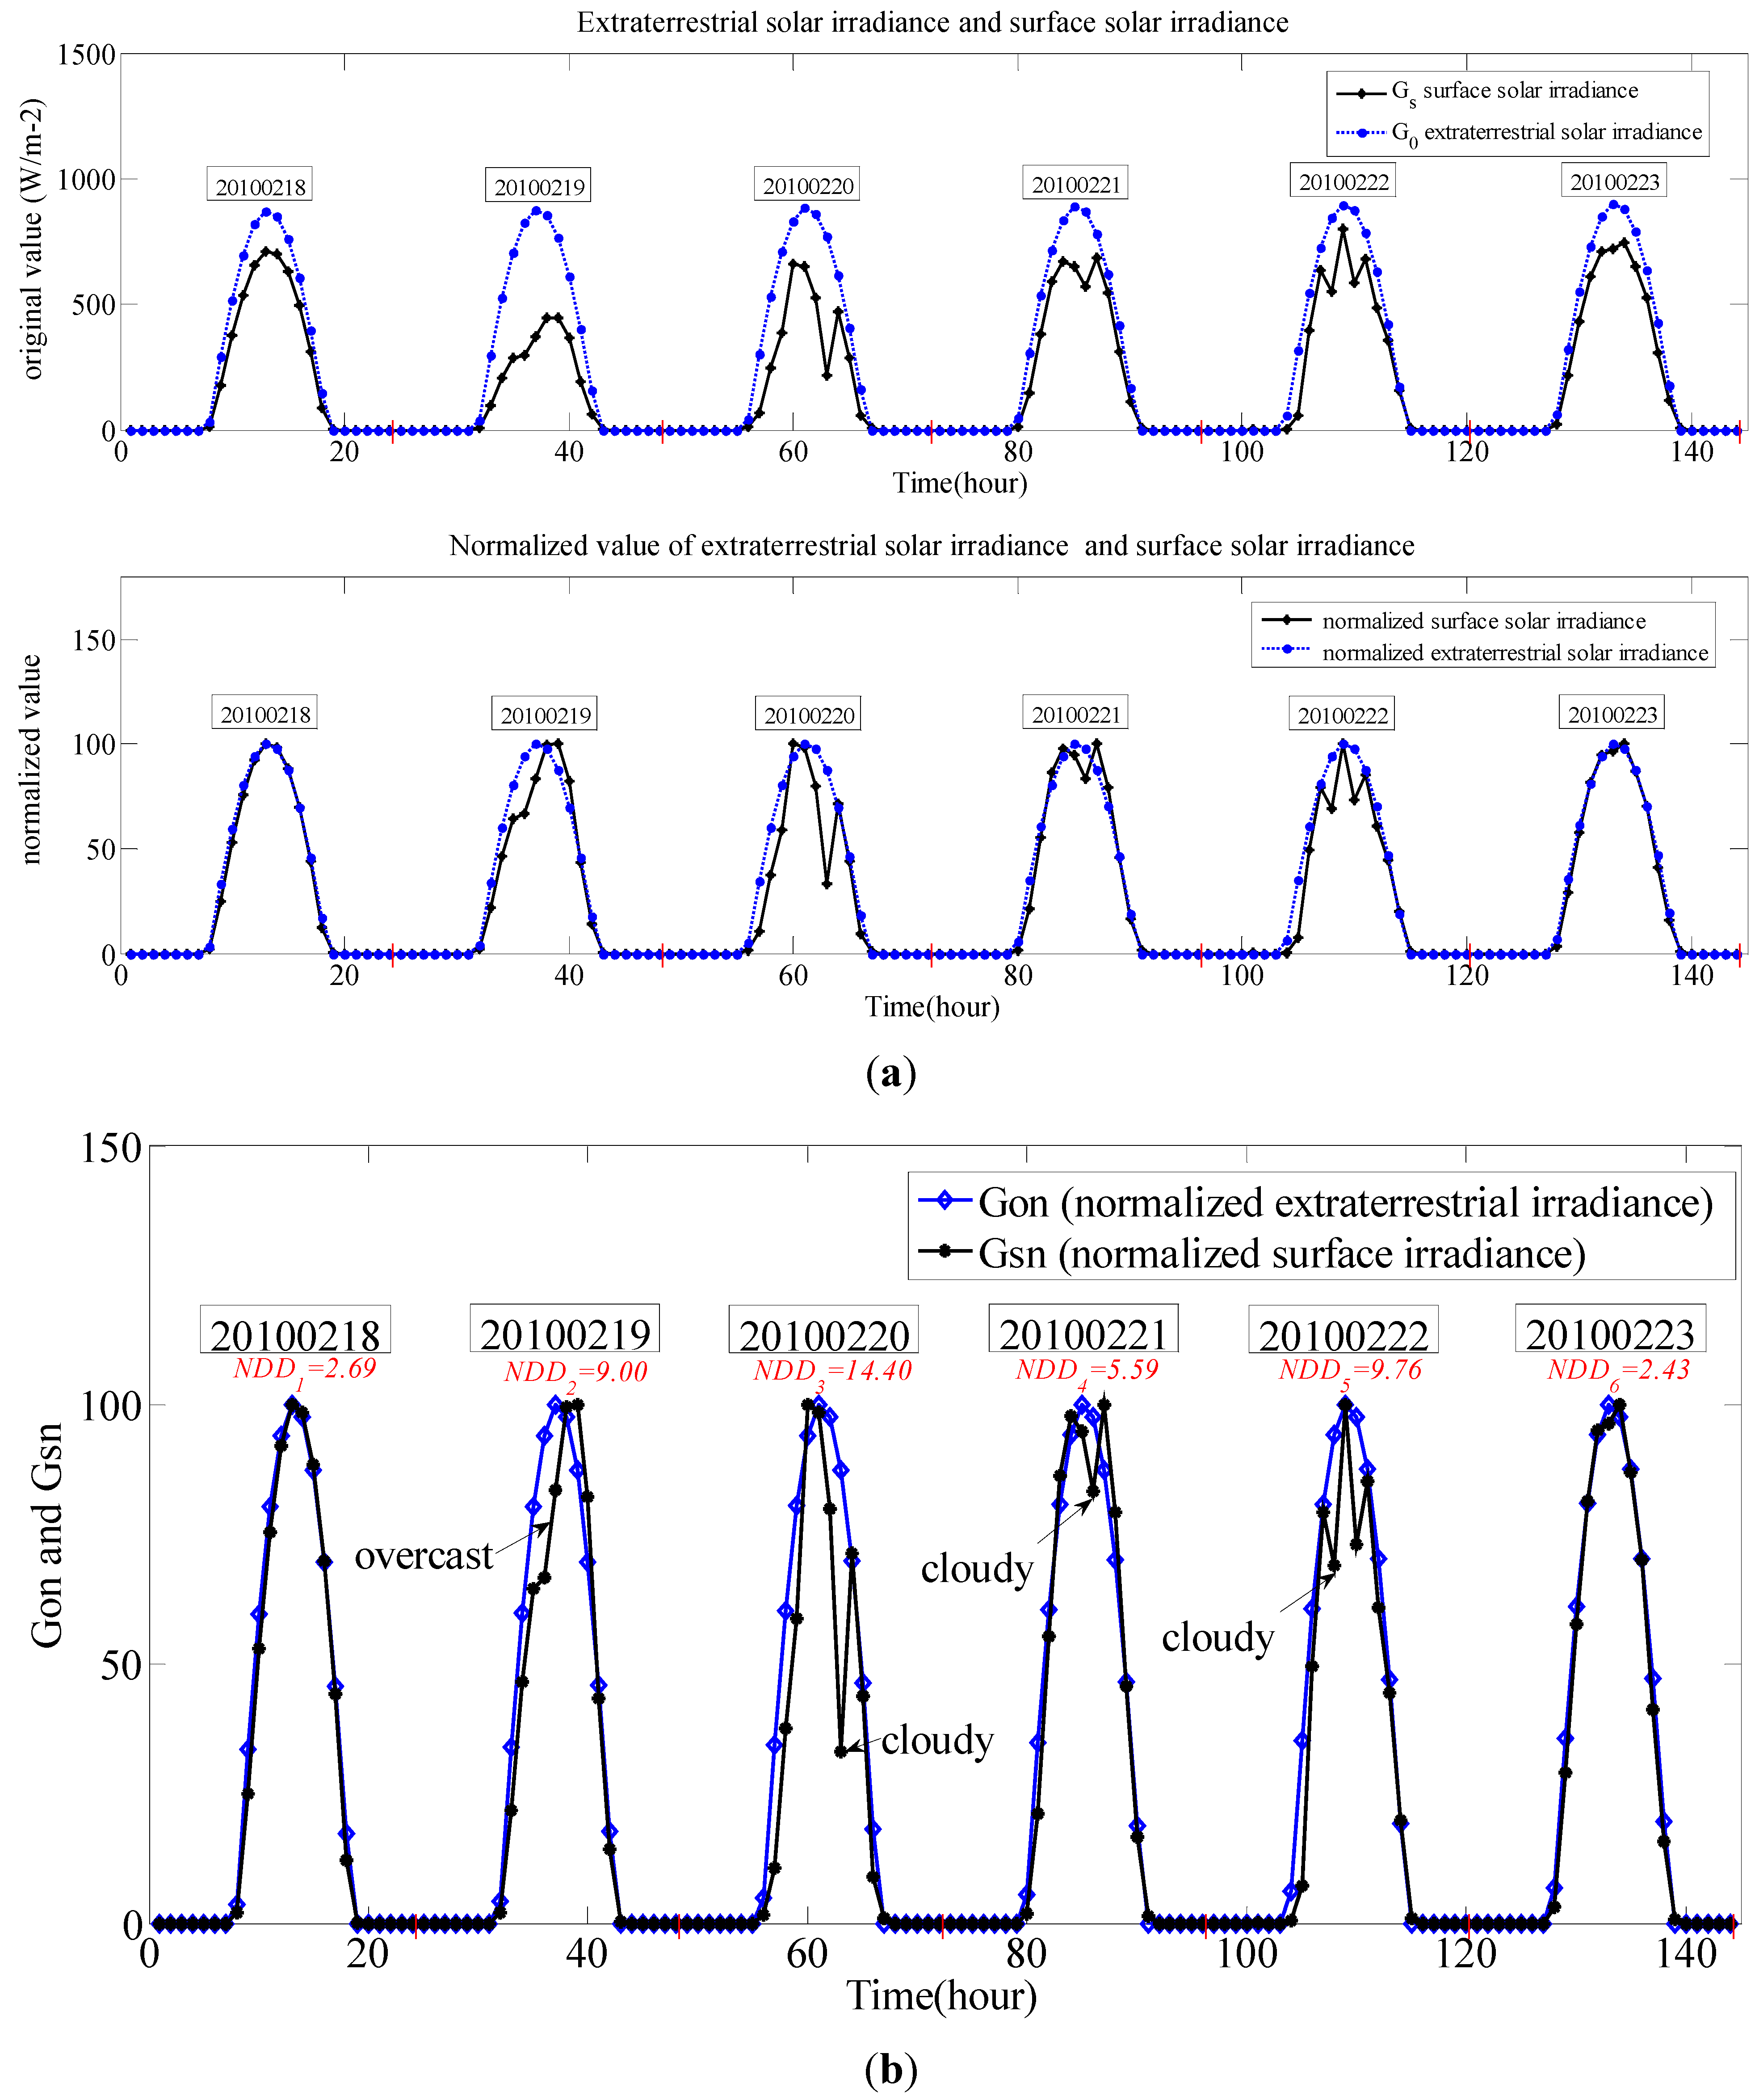
From another angle, we can see that the shape difference between surface irradiance
Gs and extraterrestrial irradiance
G0 is closely related with the change in the weather conditions, and it is relatively smaller in sunny days than in cloudy or overcast days. In order to make clear comparison of the shape difference between surface irradiance and extraterrestrial irradiance, the irradiance value are normalized through Formula (3) to eliminate the impact of different amplitude of the actual irradiance data:
where
G0N,i is normalized extraterrestrial irradiance,
GsN,i is normalized surface irradiance (
i = 1,2,…,
k),
k is the number of the irradiance data. And then the normalized discrete difference (
NDD) of solar irradiance is defined in Formula (4) as a specific index to describe the shape difference between surface irradiance and extraterrestrial irradiance:
Figure 2.
Solar irradiance and the derivatives of solar irradiance difference; (a) First-order, second-order and third-order derivative of solar irradiance difference; (b) Extraterrestrial solar irradiance, surface solar irradiance and TOD.
Figure 2.
Solar irradiance and the derivatives of solar irradiance difference; (a) First-order, second-order and third-order derivative of solar irradiance difference; (b) Extraterrestrial solar irradiance, surface solar irradiance and TOD.
According to the definition, the original and normalized value of solar irradiance, the
NDD index for every day (
k = 24) to the same irradiance data in
Figure 2 are calculated and shown in
Figure 3.
Figure 3.
Original value, normalized value and NDD of solar irradiance; (a) Original and normalized value of solar irradiance; (b) Normalized discrete difference of solar irradiance.
Figure 3.
Original value, normalized value and NDD of solar irradiance; (a) Original and normalized value of solar irradiance; (b) Normalized discrete difference of solar irradiance.
In
Figure 3,
NDD2 = 9.00 (overcast day),
NDD3 = 14.40 (cloudy day),
NDD4 = 5.59 (cloudy day),
NDD5 = 9.76 (cloudy day), it can be seen that
NDD index in these four days are significantly higher than in the other sunny days. From this, the
NDD index can be used to measure the different weather conditions.
In addition to
TODmax and
NDD, another factor that should be considered is the date sequence number
n in one year,
n ∈ [1, 365]. Based on these three factors, the average surface irradiance
Gsavg and the average ambient temperature
Tavg of one day are also introduced to the input vector. The final input vector of the new ANN forecasting model is composed of five components and shown in Formula (5):
where
IANN is the new input vector of the ANN forecasting model.
4. ANN Forecasting Model Using Statistical Feature Parameters
ANN is a mathematical model that is inspired by the structure and information processing of biological neural networks. ANN consists of an interconnected group of neurons, and it processes information using a connectionist approach to computation. It can model any actual system by changing its connection weights based on external or internal information that flows through the network during the learning phase. ANN is very useful due to the ability to imitate natural intelligence in its learning from existing sample data. ANN learn from sample data by constructing input-output map without explicit analytical expression of the model equation and it becomes a very important nonlinear statistical data modeling tools which is usually used to model complex relationships between inputs and outputs. Various ANN have been applied in to a broad range of problems, including pattern recognition, pattern classification, function approximation, optimization, prediction and forecasting, etc.
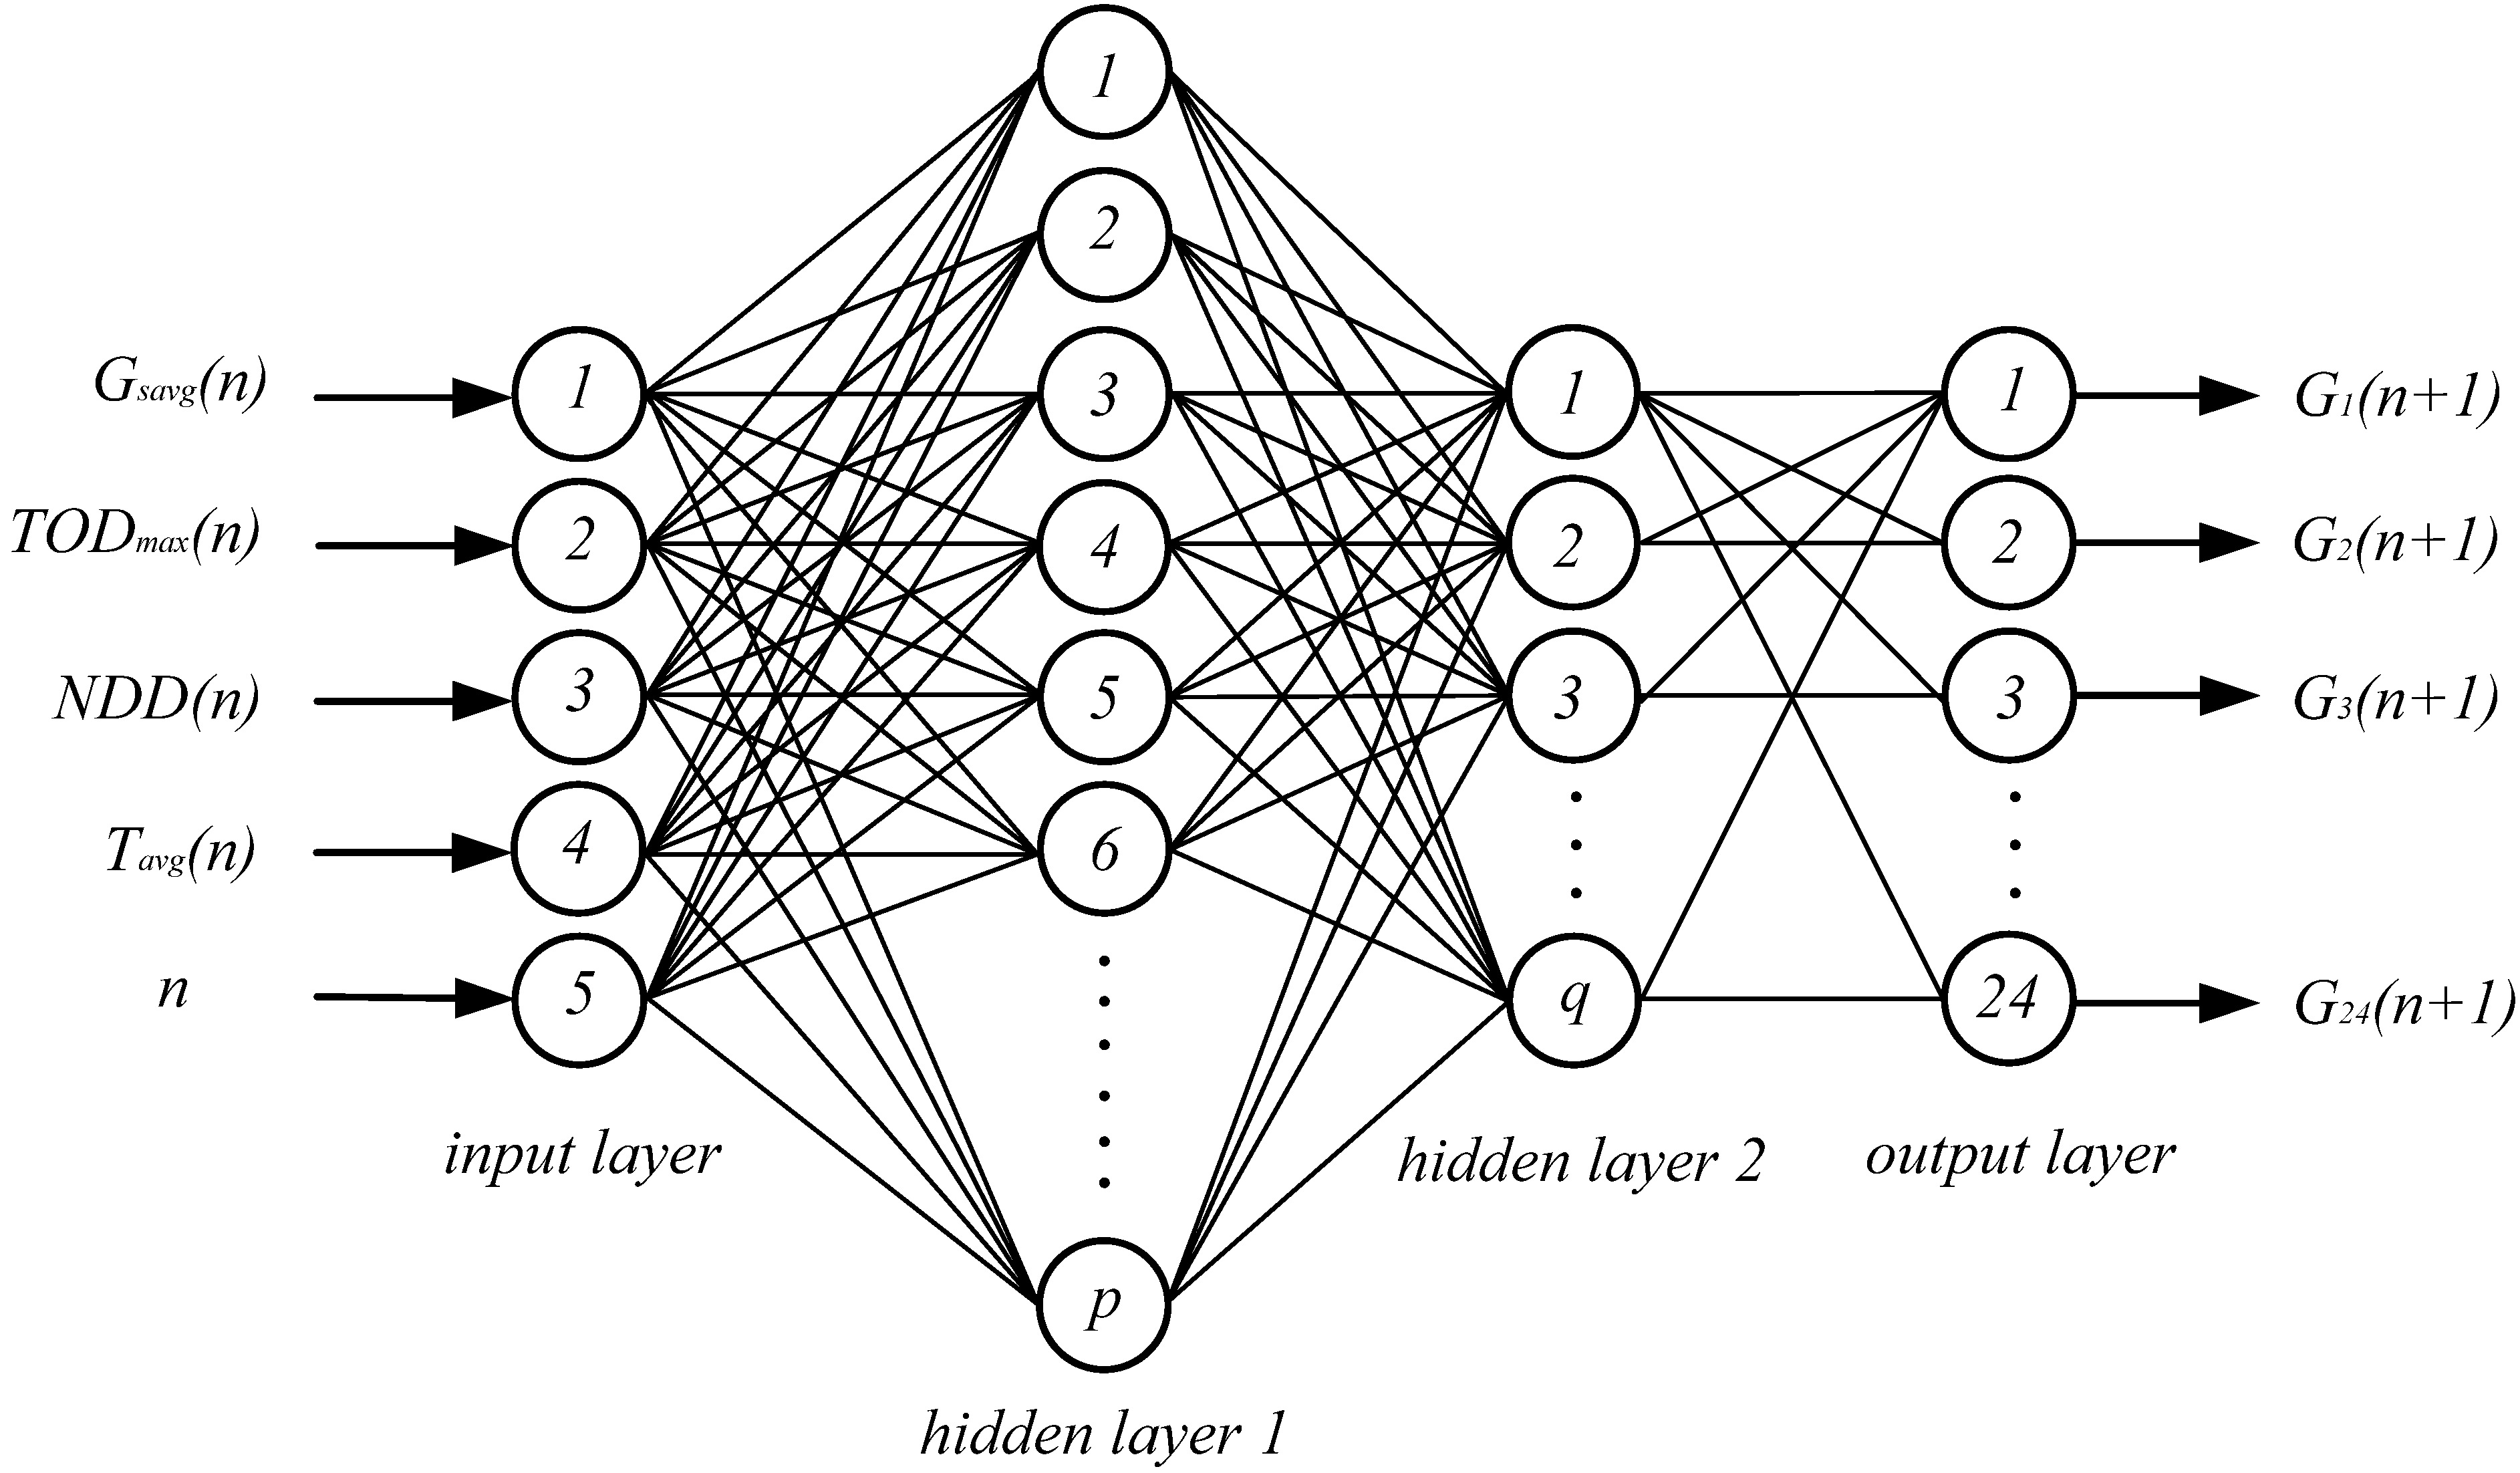
A properly trained ANN is able to achieve very accurate approximation of any nonlinear mapping. Error back propagation algorithm is usually adopted to adjust the neuron connection weights of multilayer feed-forward ANN in supervised learning mode in order to complete the complex learning task. BP network has good generalization ability to get right output for the input which is not in the training data set. In this paper, ANN are used for the modeling of solar irradiance forecast based on the input vector compose of statistical feature parameters. The time scale of short-term forecast is 24–72 h ahead. The time interval of input and output solar irradiance series is depended on the actual situation. According to the reconstruction for the input vector in part 3 above, a short-term forecasting model based on ANN using statistical feature parameters (ANN-SFP) is presented. This ANN model consists of four layers
i.e., input layer, hidden layer1, hidden layer 2 and output layer, the model is shown in
Figure 4.
The input vector is determined by Formula (5), including three statistical feature parameters of irradiance Gsavg (n), TODmax(n) and NDD(n), one statistical feature parameter of ambient temperature Tavg(n), and the date sequence number n. The output vector includes 24 components represent the surface irradiance of the next day (i.e., the date sequence number is n + 1). The time resolution is 1 h for the components of output vector. There are two hidden layers in the ANN model, and the number of neurons in hidden layer1 and hidden layer 2 are p, q respectively.
In this research, LMA is used instead of conventional BP algorithm. LMA combines the feature of Gauss-Newton algorithm and the gradient descent algorithm. LMA is more robust than Gauss-Newton algorithm that means it finds a solution even if it starts very far from the final minimum. At a large distance from the function minimum, the steepest descent method is utilized to provide steady and convergent progress toward the solution. As the solution approaches the minimum, damping parameter is adaptively decreased, the LMA approaches the Gauss-Newton algorithm, and the solution typically converges rapidly to the minimum [
22,
23].
Figure 4.
ANN forecast model using statistical feature parameters.
Figure 4.
ANN forecast model using statistical feature parameters.
The connection weights are adjusted by the LMA according to Formula (6):
where
ω is connection weights, Δ
ω is weight correction,
E(
ω) is learning error,
J(
ω) is the Jacobian matrix of error vector,
μ is damping parameter,
I is identity matrix,
P is the number of sample data.
5. Simulation and Discussion
The actual measured data of solar irradiance from March 2011 to December 2011 of Yundian Science and Technology Park grid-connected PV plant (102.47° E, 24.58° N, 166 kWp) is used to validate the proposed model. The data is divided into a training sample set and a performance test set using a ratio of 80% and 20%. Data is normalized to the range of [0,1] to avoid neuron saturation during the learning process. The neurons number of the first hidden layer is 11 and it is 15 for the second hidden layer, this is determined by 10-fold CV among multi-class model structure combination using sample training set. The neuron active function of hidden layer and output layer are
logsig and
purelin, respectively. Performance test set is used to evaluate the forecast accuracy of the model. In order to make comparison, the conventional ANN-HDS model is also built. The embedding dimension is
m = 24 and sampling interval is 1 h. Soft program is written using MATLAB, the simulation results for sunny days and cloudy days of the two models are shown in
Figure 5 and
Figure 6.
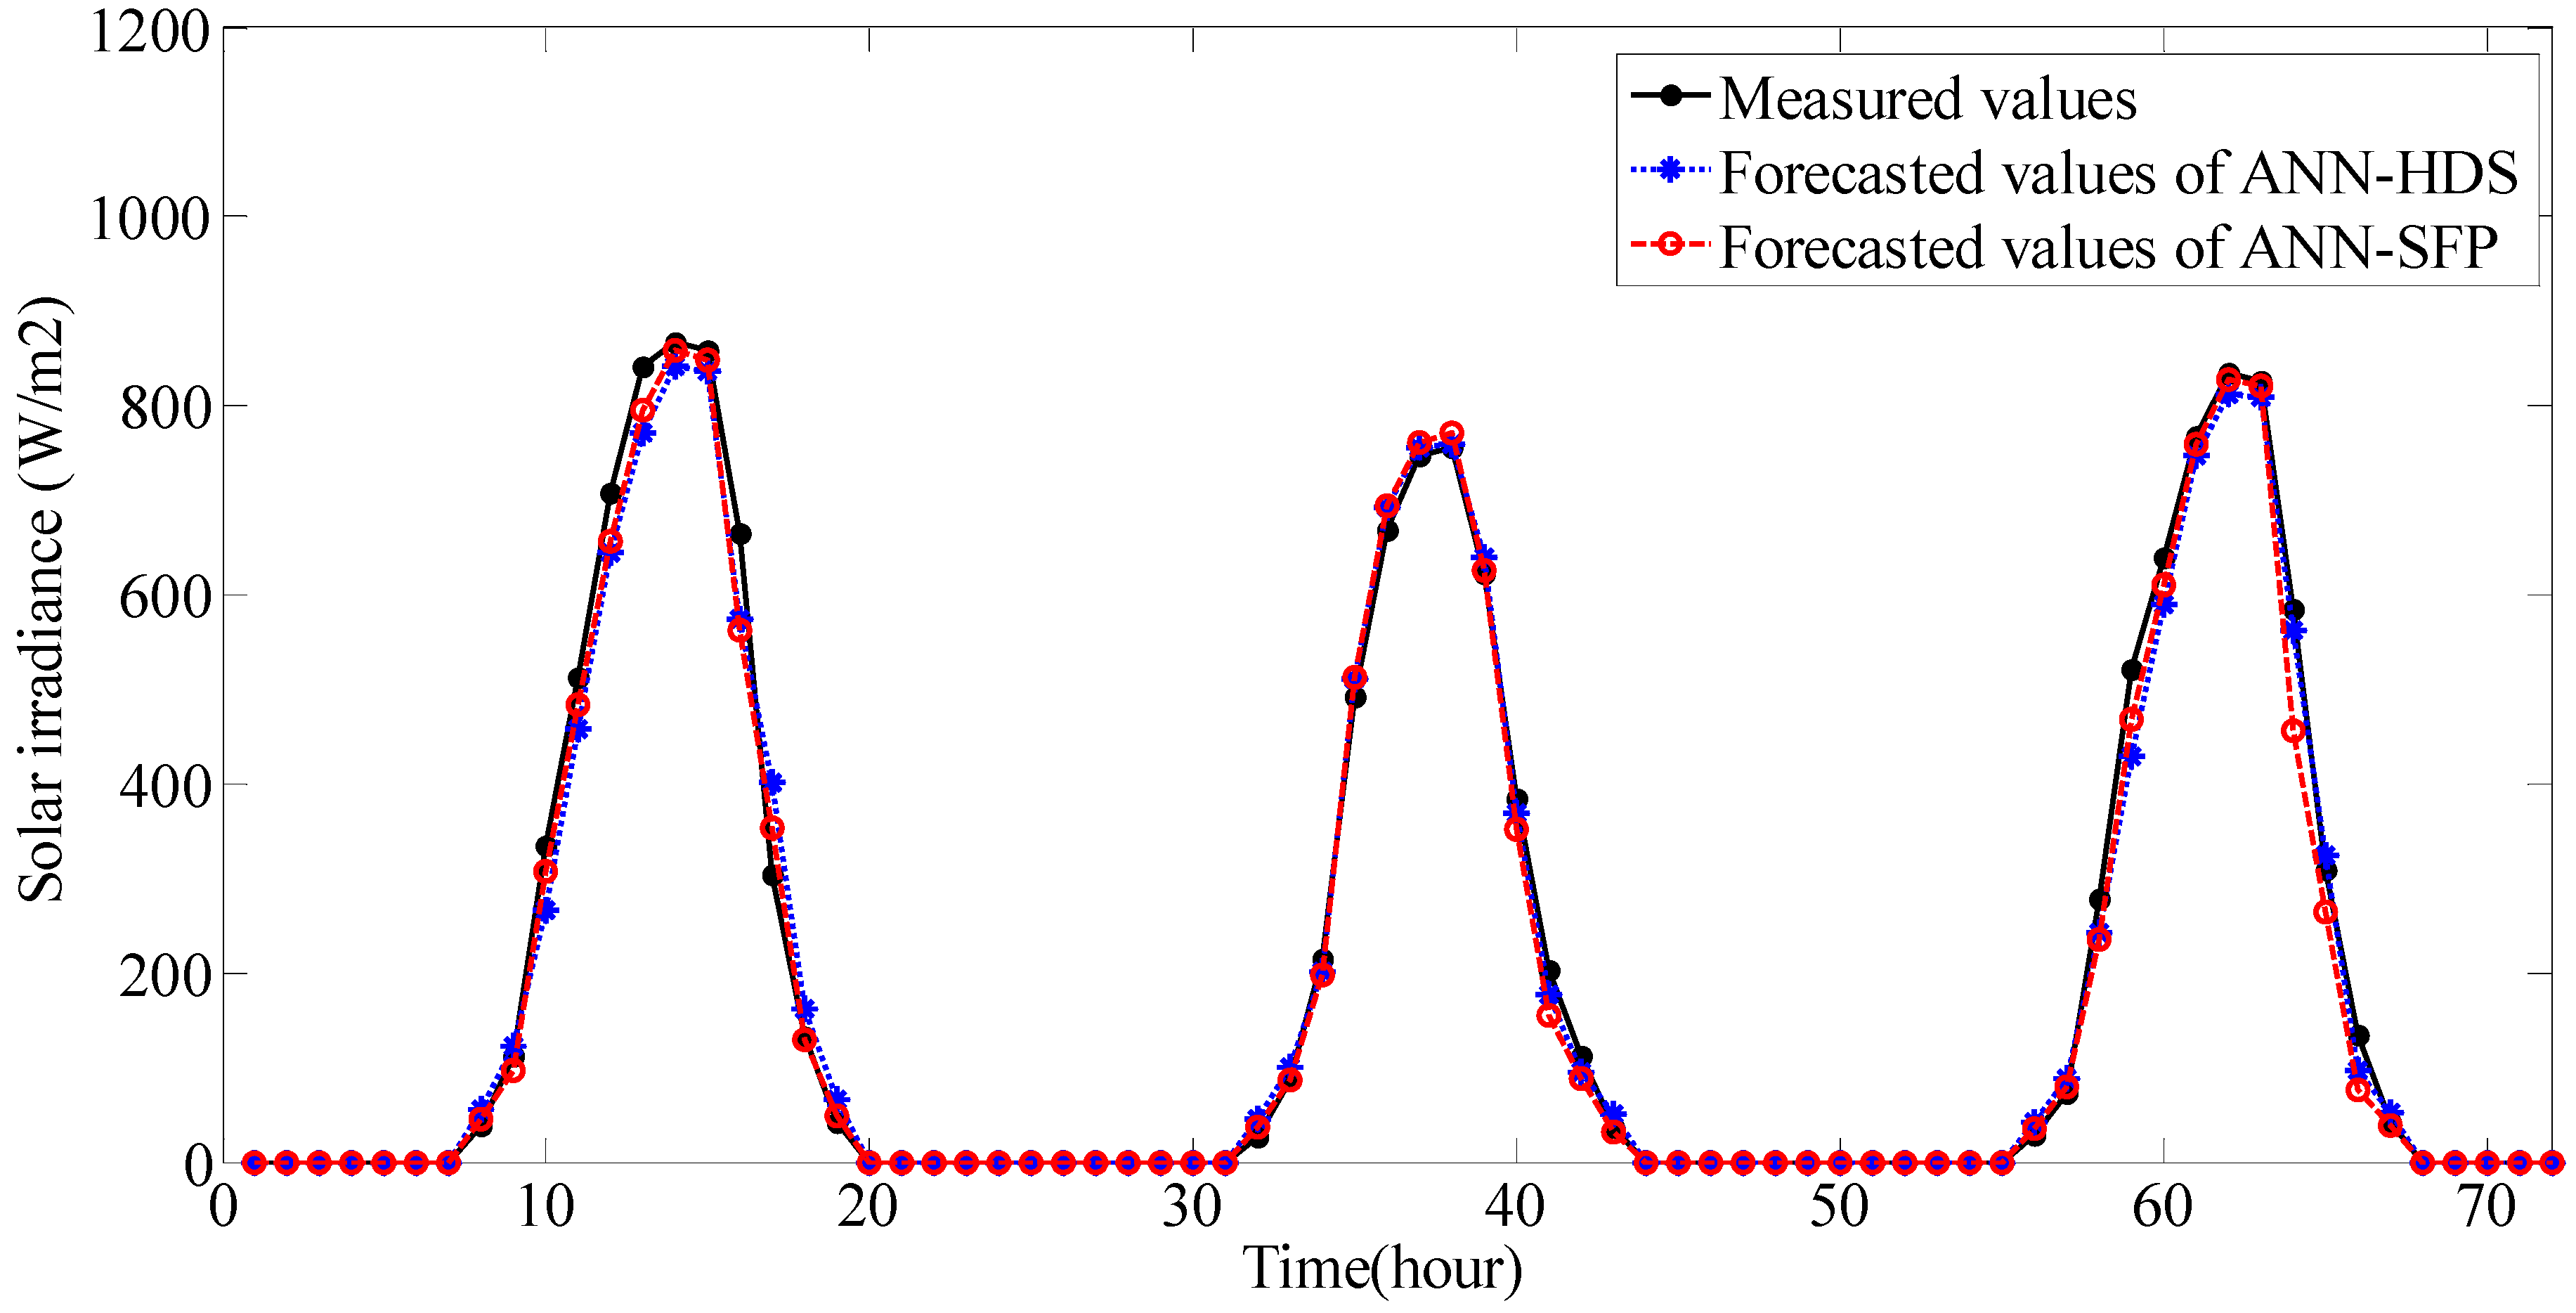
Figure 5.
Forecasted and measured values for sunny days.
Figure 5.
Forecasted and measured values for sunny days.
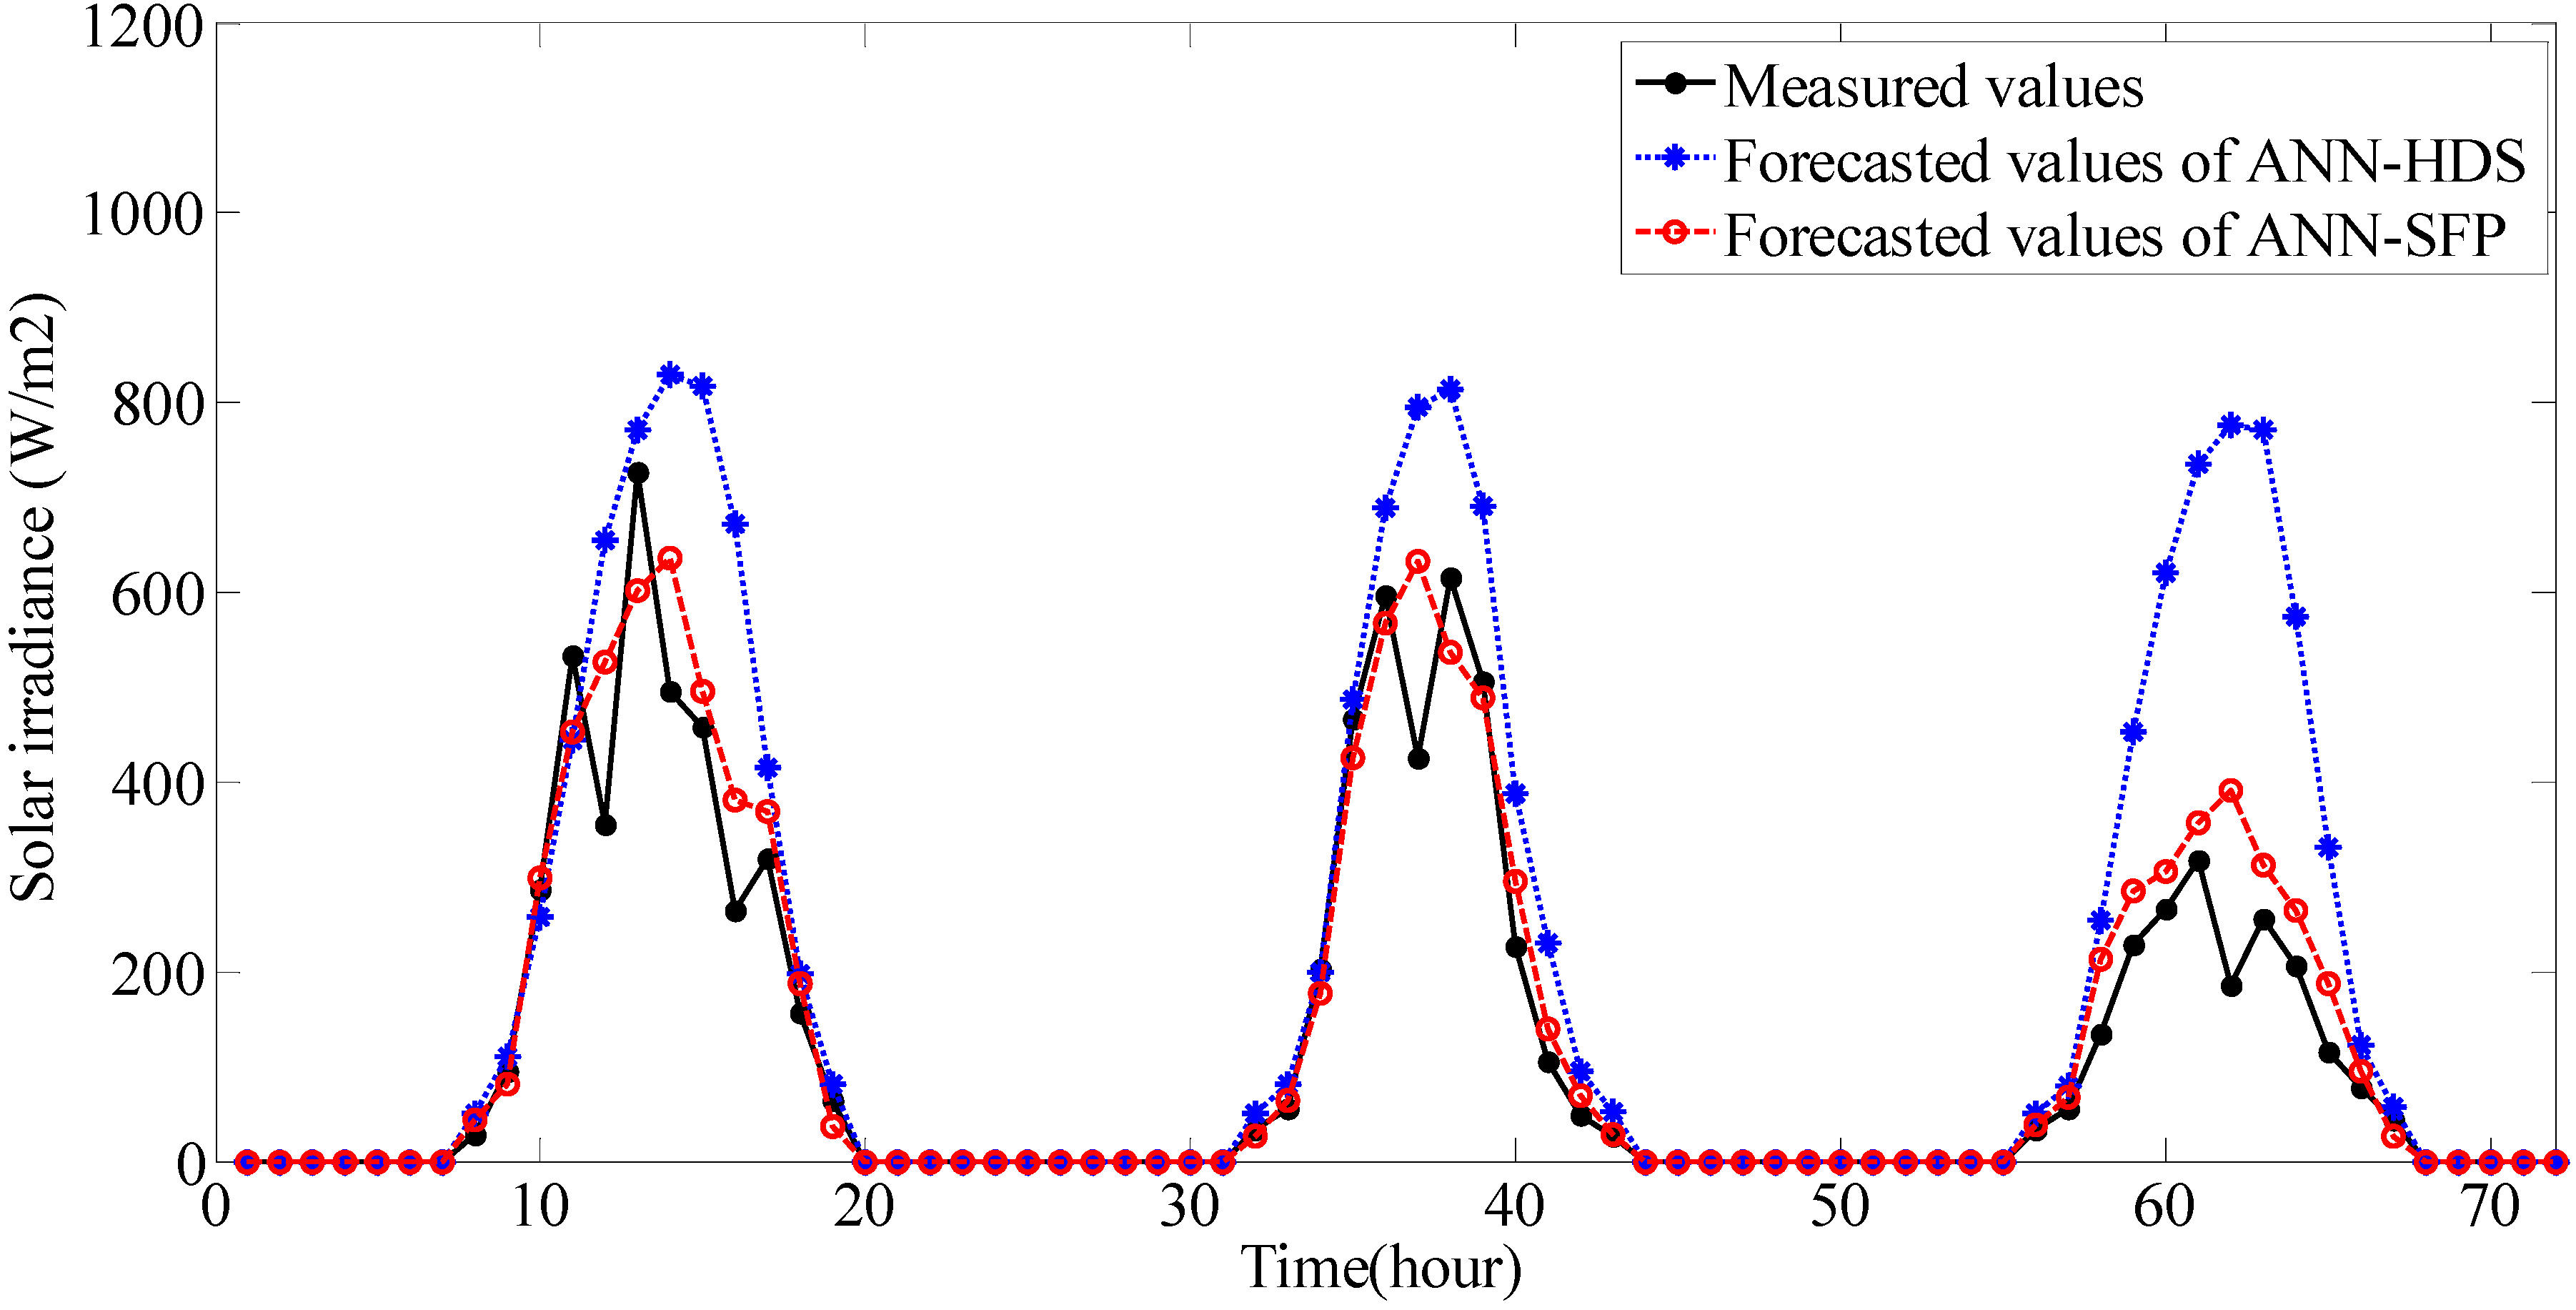
Figure 6.
Forecasted and measured values for cloudy days.
Figure 6.
Forecasted and measured values for cloudy days.
Three different error statistical indicators including mean absolute percentage error (MAPE), root mean square error (RMSE) and mean absolute bias error (MABE) are selected to evaluate the forecast accuracy of the models [
24], these error statistical indicators are calculated according to Formulas (7)–(9) and the results are shown in
Table 1:
where
Gf,i is forecasted value,
Gm,i is measured value, (
i = 1,2,…,
N),
N is the number of the solar irradiance data.
Table 1.
Error statistical indicators of the forecast models.
Table 1.
Error statistical indicators of the forecast models.
| Model | ANN-HDS | ANN-SFP |
|---|
| Error indicators | Sunny | Cloudy | Sunny | Cloudy |
|---|
| MAPE (%) | 10.06 | 81.11 | 9.09 | 26.70 |
| RMSE (w/m2) | 43.07 | 254.66 | 42.29 | 84.65 |
| MABE (w/m2) | 34.07 | 193.93 | 31.10 | 64.60 |
In
Figure 5, we can see that the forecasted values of the two models in sunny days are very close and have good agreement with the measured values, and the error statistical indicators in
Table 1 show that MAPE, RMSE MABE are also quite small. As it can be seen in
Figure 6, the difference between the forecasted values of ANN-HDS model and the measured values are significant on cloudy days, and the ANN-HDS model is completely ineffective in this case. The error statistical indicators of ANN-HDS model are widely variable in sunny and cloudy day,
i.e., MAPE is increased from 10.06% to 81.11%, RMSE is increased from 43.07 W/m
2 to 254.66 W/m
2, MABE is increased from 34.07 W/m
2 to 193.93 W/m
2. However, the forecast values of the proposed ANN-SFP model still follow the fluctuations and variation of actual measured data satisfactorily on cloudy days. According to
Table 1, the error statistical indicators of ANN-SFP model are better than the ANN-HDS model especially in cloudy day,
i.e., MAPE is decreased from 81.11% to 26.70%, RMSE is decreased from 254.66 W/m
2 to 84.65 W/m
2, MABE is decreased from 193.93 W/m
2 to 64.60 W/m
2. The performance of the proposed ANN-SFP model is superior to the ANN-HDS model, especially under severely changeable weather conditions.
The advantage of the conventional ANN-HDS model is that it can be simply built only by using historical data series of solar irradiance. One main drawback of ANN-HDS model is that the high dimension of the input vector, and this will lead to more complex model which is hard to build and train. Due to the absence of the other related parameters except solar irradiance, another drawback of ANN-HDS model is that the information contained in the input vector is incomplete and this will result in the losses of precision.
The solar irradiance of adjacent sunny days shows strong similarity and regularity and therefore perfect prediction can be achieved by the common ANN-HDS forecasting model. Under changeable weather conditions, solar irradiance show irregular complex changes due to a number of meteorological factors, and therefore the ANN-HDS forecast model is no longer applicable. The input vector of the proposed ANN forecast model is reconstructed, and few statistical feature parameters are selected to replace the multi-dimensional historical data series of solar irradiance. The input vector dimension is reduced and the main information about the variation of weather conditions can be effectively extracted through such improvement. The information redundancy and multiple coupling between the input components are greatly reduced in the proposed ANN-SFP forecast model.


