Review

A Review of Recent Advances on the Effects of Microstructural Refinement and Nano-Catalytic Additives on the Hydrogen Storage Properties of Metal and Complex Hydrides

1
Department of Mechanical and Mechatronics Engineering, University of Waterloo, Waterloo, Ontario, N2L 3G1, Canada
2
Faculty of Advanced Technology and Chemistry, Military University of Technology, 2 Kaliskiego Str., 00-908 Warsaw, Poland
*
Author to whom correspondence should be addressed.
Energies 2011, 4(1), 1-25; https://doi.org/10.3390/en4010001
Submission received: 11 November 2010 / Revised: 10 December 2010 / Accepted: 20 December 2010 / Published: 24 December 2010
(This article belongs to the Special Issue Hydrogen Storage)

Abstract

:
The recent advances on the effects of microstructural refinement and various nano-catalytic additives on the hydrogen storage properties of metal and complex hydrides obtained in the last few years in the allied laboratories at the University of Waterloo (Canada) and Military University of Technology (Warsaw, Poland) are critically reviewed in this paper. The research results indicate that microstructural refinement (particle and grain size) induced by ball milling influences quite modestly the hydrogen storage properties of simple metal and complex metal hydrides. On the other hand, the addition of nanometric elemental metals acting as potent catalysts and/or metal halide catalytic precursors brings about profound improvements in the hydrogen absorption/desorption kinetics for simple metal and complex metal hydrides alike. In general, catalytic precursors react with the hydride matrix forming a metal salt and free nanometric or amorphous elemental metals/intermetallics which, in turn, act catalytically. However, these catalysts change only kinetic properties i.e. the hydrogen absorption/desorption rate but they do not change thermodynamics (e.g., enthalpy change of hydrogen sorption reactions). It is shown that a complex metal hydride, LiAlH4, after high energy ball milling with a nanometric Ni metal catalyst and/or MnCl2 catalytic precursor, is able to desorb relatively large quantities of hydrogen at RT, 40 and 80 °C. This kind of behavior is very encouraging for the future development of solid state hydrogen systems.

1. Introduction

In principle, solid state hydrogen storage in hydrides as compared to gaseous and liquid storage has many benefits which outweigh its drawbacks. However, the hydrogen storage properties of metal and complex hydrides must be greatly improved before these materials could be applied commercially for supplying Proton Exchange Membrane (PEM) fuel cells particularly in automotive sector. It has been recognized that a refinement of the microstructure (particles and crystallites/grains) of hydrides, most preferably to the nanometric level, accompanied by nanosized catalytic additives can improve greatly hydrogen desorption/absorption rates. This paper is a comprehensive review of the recent advances on the effects of microstructural refinement brought about by ball milling and nanosized catalytic additives on the hydrogen storage behavior of simple MgH2 metal hydride and selected complex metal hydrides (LiAlH4). The results obtained in the past several years in the allied laboratories at the University of Waterloo (Canada) and Military University of Technology (Warsaw, Poland) are critically reviewed. Most of these results are accessible in the open literature although they are scattered in various journals and it is beneficial to collect them in one place for a quick access.

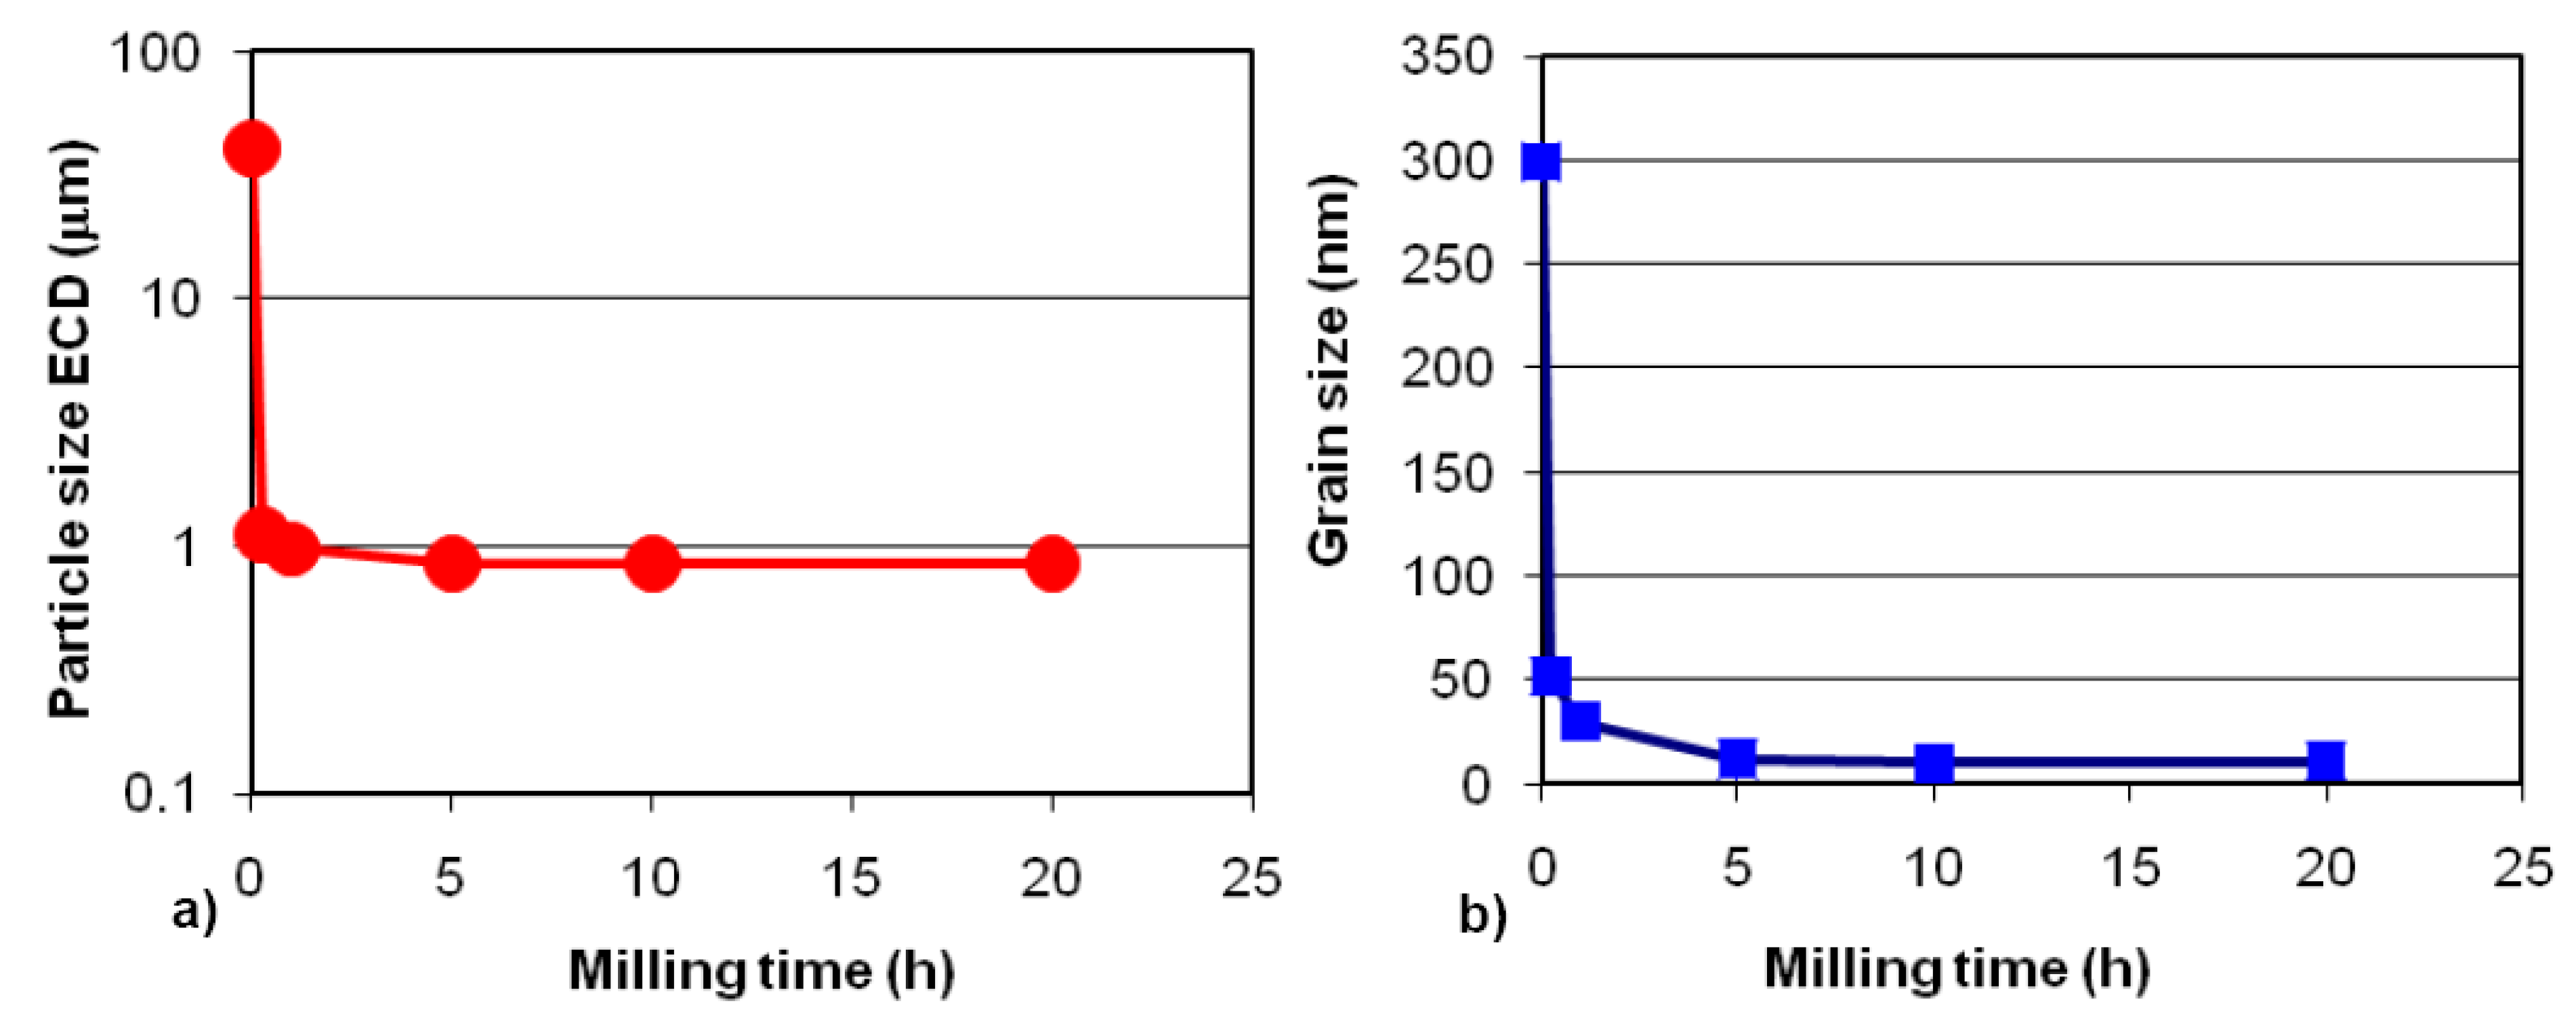
2. The Effects of Particle and Grain/Crystallite Size
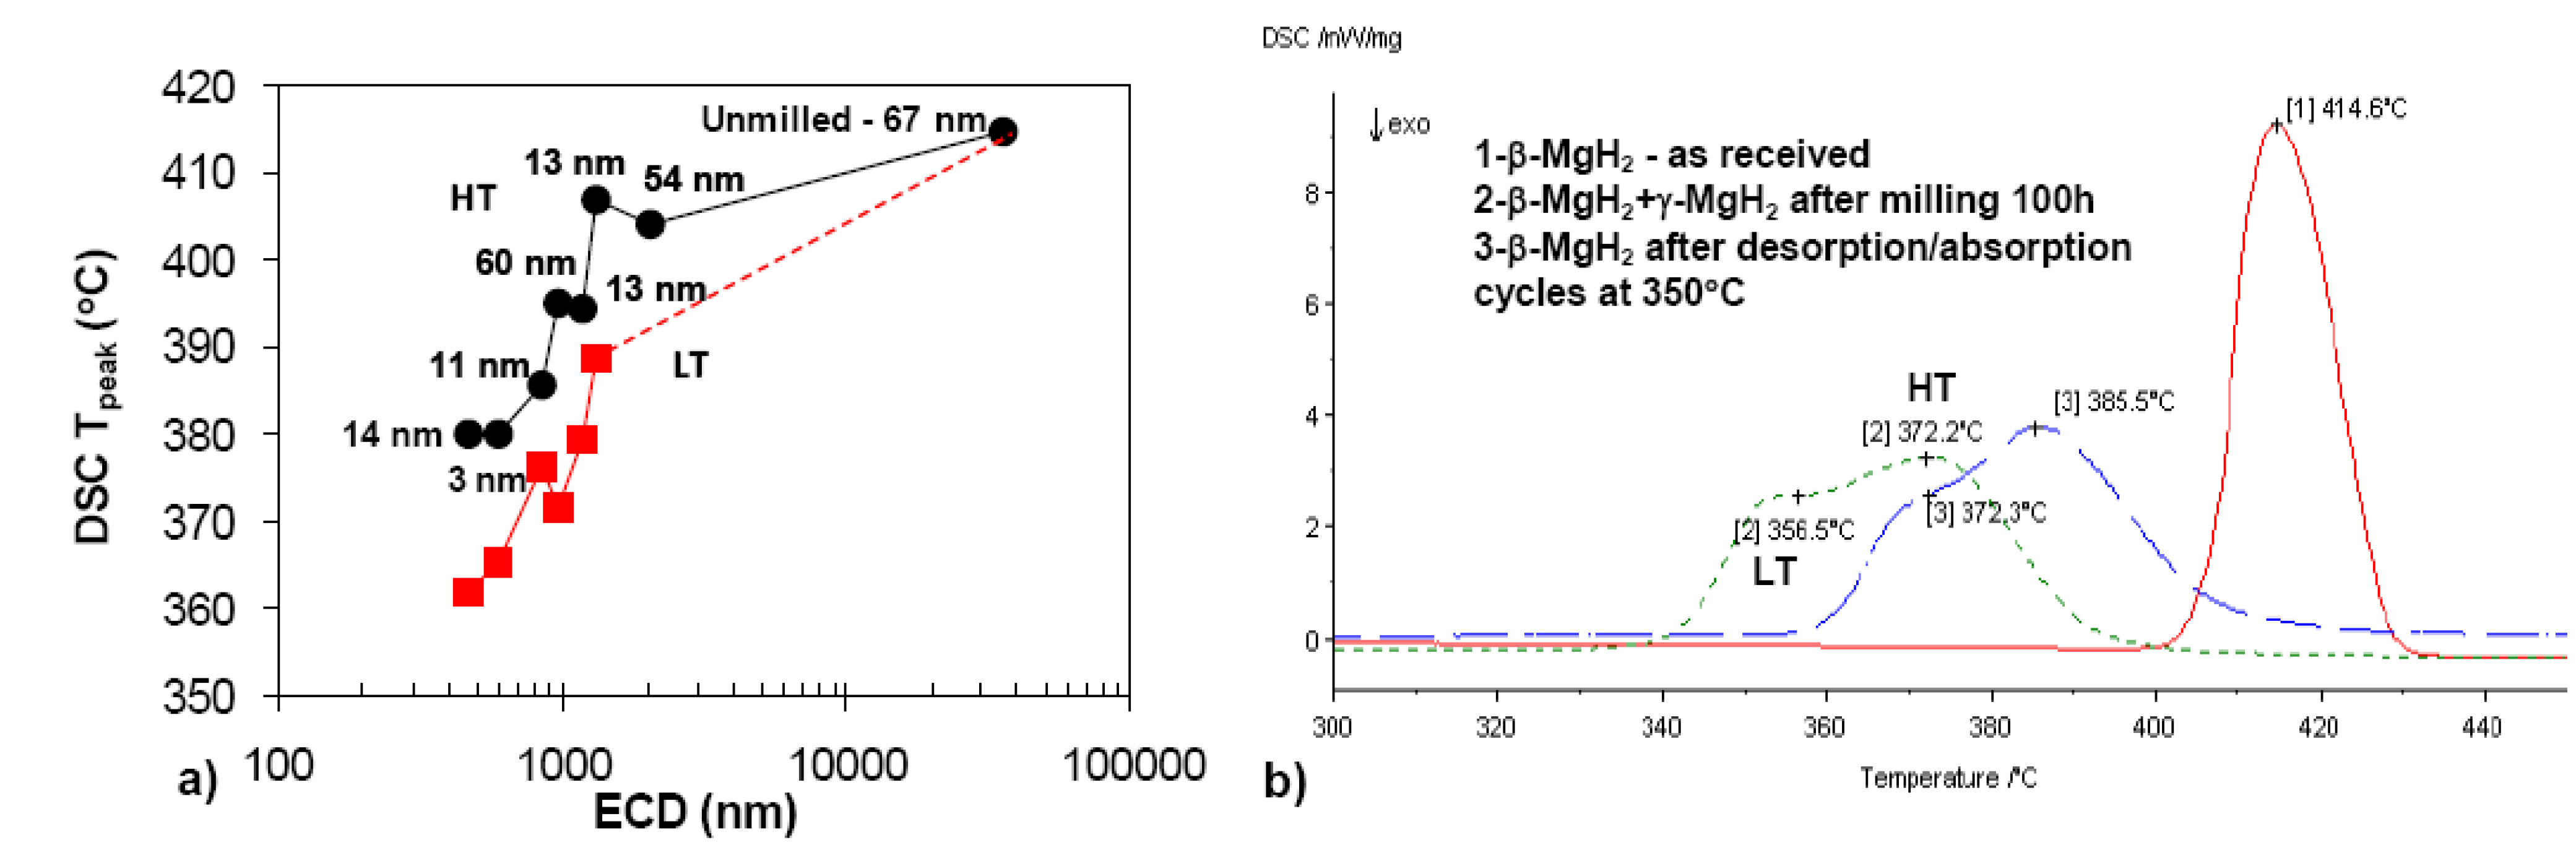
2.1. MgH2

One of the most thoroughly investigated simple metal hydrides is magnesium hydride (dihydride), MgH2. In the 1990’s it was investigated as a potential hydrogen storage material for supplying H2 to a Proton Exchange Membrane (PEM) fuel cell (FC) stack. However, one must realize that the general service conditions of an advanced PEM FC stack, which is a primary candidate for transportation (e.g., automotive) applications, require hydrogen pressure of about 1.1–1.8 bar while the waste-heat generated temperature usually does not exceed 60–70 °C [1]. In view of these practical requirements, a serious thermodynamic constraint for magnesium hydride (MgH2) is its high enthalpy of formation/decomposition which is within the range of ~71–75 kJ/mol [2] and does not allow dehydrogenation below about 280 °C at 0.1 MPa H2 (atmospheric pressure). No catalytic additive is able to alter these unfavorable thermodynamics [2]. Taking this into account it has been commonly realized in the last decade that a high temperature MgH2 hydride is not a suitable hydrogen storage medium for supplying a PEM fuel cell stack although it may be still considered for hydrogen supply to high temperature fuel cells, for instance, Solid Oxide Fuel Cell (SOFC). However, as first reported by Bogdanović et al. [3,4] the disadvantageous thermodynamics of the MgH2-Mg system for a solid state hydrogen storage can be quite advantageous for heat storage because approximately 0.9 kWh of heat per kg Mg can be stored at a hydrogen-pressure-dependent temperature level between 300 and around 500 °C applicable for solar power generation via Stirling engines or storage of industrial heat in the above temperature ranges. From this viewpoint MgH2 remains still relatively attractive hydride for this kind of application.
Mechanical (ball) milling technique is the most popular and widespread method of refining the microstructure (particles and grains) with the hope of improving hydrogen storage properties of various hydrides. The group led by Prof. J.O. Ström-Olsen at the McGill University in Montréal, Canada, in which a prominent role was played by L. Zaluski and A. Zaluska [5,6,7], was the first to apply ball milling for the synthesis of MgH2 from pure Mg with the resulting microstructural refinement. The first attempts to refine microstructure of a commercial MgH2 powder by ball milling were undertaken by the group of researchers in the Institut de recherche sur l'hydrogène Université du Québec à Trois-Rivières, Quebec, Canada [8,9,10].
However, those early works overemphasized the effect of nanograins (also commonly referred to as “crystallites”) formed within the heavily milled powder particles on the hydrogen absorption/desorption properties and somehow marginalized the role of the reduction of particle size. At least, in contrast to the prior work in the Ström-Olsen’s group, the authors from the Institut de recherche sur l'hydrogène also pointed out to the importance of the particle size reduction associated with an increase of the specific surface area (SSA). In the context of MgH2, Dornheim et al. [11] in a comprehensive review paper pointed out that for the optimization of hydrogen absorption rates for MgH2 it is important to reduce the diffusion path lengths for hydrogen atoms. This can be achieved by both small grain sizes and small particle sizes. On the other hand, hydrogen desorption rates can be enhanced by creating large surface areas as it occurs for small particle sizes and adding catalytic additives as well. However, for ball milled MgH2 they somehow overlooked the effect exerted by a metastable γ-MgH2 phase created during ball milling which will be discussed later.
In our laboratory we have investigated the changes in particle and grain/crystallite size (embedded within individual powder particles) as a function of ball milling time and clearly shown that these two events occur simultaneously as can be seen in Figure 1. It is important to emphasize that the particle size reduction occurs within a very similar time frame as does the reduction of grain size.
Figure 1. Simultaneous reduction of (a) the particle size and (b) the grain size as a function of ball milling time of MgH2. Adapted from [2].
Energies 04 00001 g001
This behavior is of a very general nature and practically, does not depend much on the mode of milling and the type of MgH2 commercial powder used for the experiments [2]. Almost identical time frame for grain and particle size variations as a function of milling makes it quite difficult to identify unambiguously which factor is, indeed, governing hydrogen storage characteristics. This difficulty has led to a common belief that the grain size is mostly responsible for the observed enhancement of hydrogen storage properties which is not necessarily the case as will be discussed later.
Figure 2a shows the DSC peak temperatures for low-temperature (LT) and high-temperature (HT) peak doublets/shoulders (see Figure 2b for designation of HT and LT) as a function of powder particle size (ECD-Equivalent Circle Diameter) for commercial MgH2 powder ball milled for various times [12]. The peak temperature decreases slowly and then, after achieving some critical (threshold) ECD range, decreases more rapidly, with decreasing ECD. The total observed drop of LT and HT peak temperatures from the initial peak temperature value for as-received MgH2 is equal to about 40–50 °C. The critical ECD at which sudden drop of DSC peak temperature commences in Figure 2a is around 2,000 nm (2 μm). Figure 2a also shows the corresponding grain sizes. It seems that there is no clear dependence of DSC peak temperatures on grain size. It must also be pointed out that the microstructure of ball milled MgH2 always contains a non-equilibrium γ-MgH2 phase which is a high pressure polymorph of MgH2 [13] coexisting with equilibrium β-MgH2 [2,12]. Figure 2b shows DSC curves of the MgH2 sample ball milled for 100h (ECD~621 ± 426 nm; grain size ~3 nm) and the same powder sample after three cycles of desorption/absorption at 350 °C (ECD ~ 625 ± 405 nm; grain size ~ 56 nm) as compared to the DSC curve of as-received commercial MgH2 [12].
Figure 2. (a) Peak temperature vs. particle size (ECD) for low-temperature (LT) and high-temperature (HT) peak doublets/shoulders for MgH2 ball milled for various times. A number beside each data point indicates the grain (crystallite) size of the β-MgH2 phase. (b) DSC curves of the MgH2 sample ball milled for 100 h (average ECD 621 ± 426 nm; average grain size ~3 nm) and the same after three cycles of desorption/absorption at 350 °C (average ECD 625 ± 405 nm; average grain size ~56 nm) as compared to the DSC curve of as-received commercial MgH2 (average particle size 36 ± 16.4 μm). DSC heating rate 4 °C/min. ECD-Equivalent Circle Diameter. Adapted from [12].
Energies 04 00001 g002
In Figure 2b the DSC curve for the thermally cycled MgH2 is shifted back to higher desorption temperatures range as compared to the as-milled sample but its peak maximum temperatures are still lower than those of as-received MgH2. The XRD pattern of the thermally cycled sample showed no trace of γ-MgH2. As argued in [12] if the grain size of β-MgH2 were the principal factor responsible for the reduction of hydrogen desorption temperature then the DSC curve of the thermally cycled sample should have been shifted very close to the original position corresponding to the DSC curve of the as-received MgH2 powder because the grain size of β-MgH2 is almost identical in both materials (~ 56 vs. 67 nm, respectively). However, one must keep in mind that the average particle size of the cycled sample (~ 625 nm) is nearly identical to that for ball milled MgH2 (~ 621 nm) and the DSC curve of the cycled MgH2 sample is shifted to higher temperatures but not exactly to the position of the peak temperature range of as received MgH2 (Figure 2b) which has a particle size of ~36 μm [12]. This behavior points towards some mild effect of reduced particle size on the temperature of DSC desorption peaks. However, it seems that the principal factor responsible for lowering the hydrogen desorption peak temperature of ball milled MgH2 is the presence of γ-MgH2. It seems that the γ-MgH2 hydride exhibits lower DSC desorption temperature than β-MgH2 [14]. Unfortunately, thermodynamic data are not available for γ-MgH2, so it is unknown if it may have a lower enthalpy of formation than its β-MgH2 counterpart. The second factor lowering the hydrogen desorption peak temperature seems to be a reduced particle size. In general, as pointed out by Selvam et al. [15] in the dehydriding stage, successively formed fresh Mg at the surface layer of coarse particles may function as the diffusion barrier to the hydrogen escaping from MgH2 while in small particles the Mg phase may form simultaneously all through the particle and the entire process of desorption is then governed by fast hydrogen diffusion rather than slow Mg–MgH2 boundary movement. In addition, smaller particles may provide larger total surface area for recombination of hydrogen molecules [16]. It must also be pointed out that a nearly identical dependence of the DSC hydrogen desorption peak maximum temperature on the particle size as in Figure 2a is also observed for MgH2 which was synthesized by a reactive ball milling under hydrogen [17].
As shown in Figure 3, a beneficial effect of the refinement of particle size and formation of γ-MgH2 is also reflected in the accelerated rate of hydrogen desorption during isothermal dehydriding for powders with higher specific surface area (SSA) which is roughly inversely proportional to the particle size. The ball milled powders having SSA = 13.7 and 43.9 m2/g exhibit the highest rate of hydrogen desorption. It also seems that the rate of desorption is independent of the type of ball milled used for processing. It is interesting that the dependence of the rate of hydrogen absorption on SSA (300 °C/10 bar H2) is not that pronounced as the one observed for desorption [18].
Unfortunately, ball milling and the resulting refinement of microstructure of MgH2 also bring about a detrimental reduction in the hydrogen storage capacity of the milled powders as shown in Figure 4a. The ball milled MgH2 powder does not completely desorb even at high temperatures of 375 and 400 °C showing ~6.2–7.0 wt.% desorbed hydrogen which is less than the purity-corrected 7.3 wt.% (at 95% purity) hydrogen capacity for this powder. The full capacity is in practical terms obtained without difficulty by hydrogen desorption from unmilled non-activated commercial powder at the temperature range 350–420 °C [2]. The microstructure of desorbed powders was investigated by XRD as shown in Figure 4b. After each desorption the diffraction peaks of retained MgH2 are discernible on the XRD pattern. Apparently, for whatever reason, the decomposition process of ball milled MgH2 hydride does not proceed to completion even at the temperature as high as 400 °C.
Figure 3. Desorption curves of nanocrystalline MgH2 prepared by ball milling for 20 h in different types of ball mills. Specific surface area (SSA) of each powder is shown in m2/g beside each desorption curve. Adapted from [18].
Energies 04 00001 g003
Figure 4. (a) Hydrogen desorption curves under 0.1 MPa H2 at three different temperatures for MgH2 milled continuously in argon for 100 h. (b) XRD patterns of the same powders after desorption. Adapted from [2].
Energies 04 00001 g004
The exact mechanism (s) responsible for MgH2 stabilization during desorption is/are not available at the present time. Nevertheless, there are a few factors that could be relevant to the case. First, the γ-MgH2 phase is always formed during milling due to the transformation of β-MgH2 [2]. However, during subsequent high temperature desorption or cycling this orthorhombic hydride phase quickly disappears (e.g., Figure 4b). According to Gennari et al. [14] the initial decomposition of the γ phase stimulates β-MgH2 decomposition by creating a volume contraction which, in turn, generates stresses acting on β-MgH2. Conversely, one may argue that if the γ phase decomposes too quickly then the β phase may become too stable and small amounts of it may persist even up to high desorption temperatures. Second, during desorption of a milled MgH2 powder and decomposition of β-MgH2 there always occurs a simultaneous growth of nanograins of β-MgH2. For example, for the powder in Figure 4a the nanograin of β-MgH2 after ball milling for 100 h was ~14 nm in size which increased to ~60–80 nm for the retained β-MgH2 present after desorption in Figure 4b [2]. Since particle size is not changed during desorption one may hypothesize that the growth of nanograins within β-MgH2 particles might somehow decelerate the decomposition of β-MgH2. It should also be pointed out that desorption under low vacuum rather than under 0.1 MPa H2 pressure removes any stabilization effect of retained MgH2 and no diffraction peaks of β-MgH2 are ever observed [19].
Finally, to put the effects of the microstructural refinement by ball milling on the hydrogen desorption properties of MgH2 into perspective it should be mentioned that the apparent activation energy of desorption can be affected more profoundly by the oxide/hydroxide layer at the surface of powder particles than by microstructural refinement. For example, ball milling under reducing hydrogen atmosphere lowers the apparent activation energy from ~217 kJ/mol for the as received heavily hydrolyzed MgH2 to ~140 kJ/mol after 25 h of ball milling [19]. In general, there is no dramatic difference between the apparent activation energies for dehydrogenation for unmilled non-activated/activated MgH2 which are within the range of 120–168 kJ/mol as opposed to the apparent activation energy values for ball milled powders which are within the range of 140–160 kJ/mol for both commercial MgH2 and the one synthesized from Mg by reactive milling in H2 [2].

2.2. Complex Hydrides

In general, ball milling of complex metal/non metal hydrides such as, for example, LiAlH4 (lithium alanate) and NaAlH4 (sodium alanate), is less effective for the microstructural refinement than ball milling of a simple metal hydride MgH2. For example, high energy impact milling of LiAlH4 for 15 min reduces its average particle size from ~10 to ~3 μm with the average corresponding grain size of ~40–80 nm [20]. For comparison, after about 15 min of high energy ball milling the average particle size of MgH2 is reduced from the initial ~40 μm to ~1 μm (Figure 1a) and the grain size to ~30–50 nm [2]. Thermal behavior of complex hydrides during DSC tests is not measurably affected by ball milling and resulting microstructural refinement [2,20,21]. However, their dehydriding rates are affected to a modest extent as shown in Figure 5. For long desorption times unmilled LiAlH4 decomposes in only Stage I which is attributed to the decomposition of LiAlH4 into Li3AlH6, Al and H2 as opposed to ball milled alanate which shows clearly two stages of decomposition, Stage I and II. Stage II is attributed to the decomposition of Li3AlH6 into LiH, Al and H2 [2,20,21]. The apparent activation energy estimated from the Johnson–Mehl–Avrami–Kolmogorov (JMAK) and Arrhenius equations [20] for Stage I and II for unmilled LiAlH4 is equal to ~111 kJ/mol (with an excellent coefficient of fit R2 = 0.998) and ~100 kJ/mol (R2 = 0.966), respectively. For ball milled LiAlH4 the apparent activation energy for Stage I and II is slightly lower at ~92.6 kJ/mol (R2 = 0.992) and ~92 kJ/mol (R2 = 0.979), respectively [20].

3. The Effects of Catalytic Nano-Additives

3.1. Elemental Nanometric Metal Catalysts

3.1.1. MgH2

Nanometric-size transition metals are excellent catalytic additives which increase profoundly the rate of hydrogen desorption/absorption of simple metal hydrides such as MgH2. One of the best nanometric metallic catalysts we have tested so far is nanometric nickel (n-Ni). Figure 6 shows scanning electron micrographs of two morphologies, spherical and filamentary, of n-Ni with slightly different SSA values produced as experimental batches by Vale Inco Ltd. Canada [22]. Figure 7 shows the effect of 5 wt.% of micrometric Ni (m-Ni) and nanometric Ni (n-Ni) additives on DSC hydrogen desorption traces for MgH2 ball milled for 15 min. Endothermic desorption peak for MgH2 + 5 wt.% m-Ni is only modestly shifted to lower temperatures exhibiting the onset temperature at ~350 °C and the peak maximum temperature at 392.8 °C as compared to a pure MgH2 milled for 15 min with the onset at ~380 °C and the maximum at 418.2 °C, respectively. In contrast, the hydrogen desorption peak for the MgH2 + 5wt.% n-Ni powder is substantially shifted to the lower temperatures with the onset temperature at ~170 °C and the peak maximum temperature at 243.1 °C. However, when the MgH2 + 5wt.% m-Ni powder was milled for 20 h its desorption properties were improved such that the onset was at ~275 °C and peak maximum temperature at 302.3 °C [2]. Apparently, longer milling time reduces desorption temperature most likely due to a better dispersion of coarser m-Ni particles within the MgH2 matrix. Nevertheless, the hydrogen desorption peak maximum temperature for the 20 h milled MgH2 + 5wt.% m-Ni nanocomposite is still higher than that for the 15 min milled MgH2 + 5wt.% n-Ni nanocomposite. This clearly shows that nanometric Ni (n-Ni) exhibits superb catalytic properties.
Figure 5. Comparison of volumetric desorption curves at 100 °C under 0.1 MPa H2 pressure for unmilled (as-received) LiAlH4 and LiAlH4 ball milled under high impact energy. Adapted from [20].
Energies 04 00001 g005
Figure 6. Scanning electron micrographs of the morphology of Vale Inco Ltd. nanometric Ni (n-Ni) with (a) SSA = 9.5 m2/g and (b) SSA = 14.5 m2/g used as a catalytic additive. Adapted from [21].
Energies 04 00001 g006
Figure 7. DSC traces of MgH2 doped with 5 wt.% Vale Inco Ltd. micrometric Ni (m-Ni; SSA = 0.7 m2/g) and nanometric Ni (n-Ni; SSA = 14.5 m2/g) subjected to 15 min of ball milling under 700 kPa hydrogen pressure. Heating rate 10 °C/min. Adapted from [2].
Energies 04 00001 g007
Figure 8 shows the improvement of hydrogen desorption rate of MgH2 ball milled with the addition of 5 wt.% n-Ni. As can be seen in Figure 8a the nanocomposite does not desorb at 200 and 250 °C under 0.1 MPa H2 due to the high enthalpy change of dehydrogenation for MgH2 as mentioned earlier in the text. However, at around 275 °C it is able to desorb about 4.5 wt.% H2. According to the Van’t Hoff equation [2] this temperature range is approximately the lowest at which MgH2 is able to desorb at the atmospheric pressure (0.1 MPa) of hydrogen due to its serious thermodynamic constraint which is its high enthalpy of formation/decomposition being within the range of 71–75 kJ/mol [2]. The desorption kinetics in Figure 8a become faster at higher temperatures although the maximum amount of H2 desorbed approaches ~6.5 wt.% which is about 0.6 wt.% less than the purity and the 5 wt.% n-Ni additive content corrected theoretical H2 content [23]. As discussed earlier, MgH2 is somehow stabilized after ball milling which prevents achieving a full desorption under 0.1 MPa H2 even in the presence of such a strong catalyst as n-Ni as shown in this work. Figure 8b shows the Arrhenius plot for the estimation of the apparent activation energy for desorption which for the temperature range 275–350 °C is equal to ~94 kJ/mol (note an excellent coefficient of fit R2 = 0.982). This value is much lower than the activation energy for desorption of ball milled MgH2 which falls within the 140–160 kJ/mol range as mentioned earlier. It is clear that the n-Ni catalytic additive improves profoundly the hydrogen desorption kinetics which is reflected in the reduction of the apparent activation energy for desorption. For the sake of clarity, it must be pointed out that as shown in Figure 9 the reduction of the SSA of a catalytic metal does not necessarily bring about more improvement in the hydrogen desorption kinetics. Figure 9 shows the plot of the rate constant k in the Johnson-Mehl-Avrami-Kolmogorov (JMAK) equation (see Sec. 1.4.1.2 in [2]) as a function of SSA for two desorption temperatures 275 and 300 °C for a variety of n-Ni additives with largely varying SSA [2]. The k increases up to SSA ~10–15 m2/g and then there is no further dependence with increasing SSA. It is also clear that there is no apparent effect of carbon (0.34–2.97 wt.%) and oxygen (0.05–11.7 wt.%) content in n-Ni on the hydrogen storage properties of MgH2, neither there is any apparent effect of the n-Ni morphology (spherical or filamentary) on hydrogen storage properties.
Another elemental nanometric metal nano iron (Fe) has been found to improve greatly the hydrogen absorption into Mg. Figure 10a,b show STEM images at various contrast modes of a nanocomposite powder particle showing Fe dispersoids embedded within the Mg matrix. This unusual microstructure was produced via thermal decomposition of the dynamically synthesized Mg2FeH6 ternary hydride precursor [24,25].
Figure 8. (a) Volumetric hydrogen desorption curves at various temperatures under initial hydrogen pressure of 0.1 MPa for the MgH2 + 5 wt.% n-Ni nanocomposite directly after milling for 15 min (average ECD = 0.74 ± 0.46 μm). (b) The Arrhenius plot of the desorption rate for the estimation of the apparent activation energy, EA. Adapted from [23].
Energies 04 00001 g008
Figure 9. The rate constant, k, in the Johnson-Mehl-Avrami-Kolmogorov (JMAK) equation as a function of the SSA of the Inco n-Ni catalytic additive. The first and second number in parentheses is content of carbon and oxygen in wt.%, respectively. Adapted from [2].
Energies 04 00001 g009
Figure 10. STEM images showing the microstructure of individual 2Mg-Fe powder particle obtained from the decomposition of Mg2FeH6. (a) Z-contrast (HAADF-High Angle Annular Dark Field detector) and (b) BF. (c,d) High resolution (HR) STEM bright field (BF) images showing the microstructure of 2Mg-Fe particle at lower and higher (lattice planes contrast) magnification. Adapted from [25].
Energies 04 00001 g010
Figure 10c at a higher magnification shows clearly nearly spherical nanometric Fe dispersoids with an average diameter of ~20–30 nm (notice 10 nm magnification marker) uniformly distributed in the Mg matrix. High resolution high magnification image in Figure 10d shows lattice planes of Mg matrix nanograins about ~5–10 nm in size in which the Fe dispersoids are embedded forming high misorientation angle phase boundaries. This Mg-Fe nanocomposite exhibits quite remarkable hydrogen absorption/desorption properties as shown in Figure 11. Figure 11a shows the total hydrogen absorption curve of the 2Mg-Fe (molar ratio) nanocomposite formed during decomposition of previously synthesized ternary Mg2FeH6 precursor [24]. At the temperature of barely 30 °C the sample kept under hydrogen pressure for 10 h shows a significant 1.1 mass % absorption of hydrogen. For the clarity, it is to be pointed out that for the molar ratio 2MgH2-Fe used in the synthesis [24] the theoretical maximum hydrogen quantity that could be absorbed is ~3.7 wt.%. It is most likely that prolonging the absorption time much beyond 10 h the 2Mg-Fe nanocomposite could absorb even more H2 at 30 °C. Figure 11b shows a temperature programmed desorption (TPD) spectrum of the 2Mg-Fe sample hydrogenated for 10h in a. The onset of dehydrogenation occurs at a temperature as low as ~130 °C, with a peak maximum around 250 °C, which is similar to the results reported for MgH2 catalyzed with Nb2O5 [26]. The TPD curve in Figure 11b is unusually shaped (asymmetrical). A TPD peak starts forming at a very low temperature around 130 °C then increases slowly developing a sort of a long “tail” and eventually finishes very rapidly just after reaching its maximum at ~250 °C. A typical shape for this type of peaks is rather symmetrical, as for example, reported in [2,26]. Varin et al. [27] pointed out that a narrow hydrogen TPD peak indicates the presence of small well-crystallized hydride particles. The asymmetry of the TPD peak in the present case might be related to the catalytic effect of Fe particles embedded into the Mg matrix and the grain size distribution for the Mg matrix which is skewed towards very small nanocrystalline grains. Taking this hypothesis into account and assuming that smaller MgH2 nanograins can desorb hydrogen at lower temperatures due to shorter diffusion paths, we can conclude that most likely, there is a large population of very small nanograins of MgH2 desorbing hydrogen much below 250 °C. Moreover, it seems that the population of relatively large MgH2 nanograins is rather limited because of the sharp drop of the TPD peak at around 250 °C in Figure 11b.
Finally, it must be clearly pointed out that the observed effects of nanometric Ni and Fe catalysts on the hydrogen storage behavior of MgH2 strongly suggest that all the improvement of hydrogen storage properties is owing to the kinetic effect of nanometric elemental metals acting as powerful catalysts rather than to a modification of thermodynamic properties (enthalpy) of the MgH2 + nanometal catalyst system. As pointed out in [25] He and Zhao [28] reported that a 2.25 at.% V decorated Mg nanoblade (25 nm thick) array absorbed volumetrically at room temperature about 1.7 wt.% H2 within 10 h under 1 MPa H2. This result is very comparable to the result shown in Figure 11a in the present work. In addition, they have clearly shown that the absorption enthalpy change ΔH and entropy change ΔS of the Mg-V nanoblade array system is equal to −74.6 ± 6.8 kJ/mol and −131.8 ± 13.0 kJ/mol, respectively, which clearly points toward a purely kinetic effect.
Figure 11. (a) Hydrogen absorption curve for the 2Mg-Fe elemental nanocomposite at 30 °C under 4 MPa of hydrogen pressure up to 10 h. (b) Temperature programmed desorption (TPD) spectrum of 2Mg + Fe nanocomposite sample hydrogenated at 30 °C under 4 MPa of hydrogen pressure up to 10 h (heating rate of 5 °C/min under flowing helium). Adapted from [25].
Energies 04 00001 g011

3.1.2. Complex Hydrides

The addition of barely 5 wt.% of n-Ni to a complex metal hydride LiAlH4 brings about a remarkable changes in its thermal behavior and profound improvement of its dehydriding properties. Figure 12 a,b,c,d show the evolution of DSC curves with increasing ball milling energy for the LiAlH4 + 5wt.% n-Ni nanocomposite as compared in Figure 12a to the DSC behavior of undoped LiAlH4 ball milled under high energy milling mode. It must be mentioned that high energy ball milling does not change the DSC curve shape neither it shifts the peak temperatures. However, ball milling of complex alanates is not very effective. The average ECD particle size with standard deviation (S.D.) was reduced from 9.9 ± 5.2 μm for as received LiAlH4 to 2.8 ± 2.3 μm after 2 h of ball milling [20].
According to the discussion in [21] the first exothermic (peak 1) at 143.8 °C in Figure 12a is most likely attributed to the reaction of the surface aluminum-hydroxyl groups owing to the presence of impurities as first reported by Block and Gray [29]:
>Al-OH + H-Al<→>Al-O-Al< + H2
The endothermic peak 2 at 174.4 °C is attributed to the melting of LiAlH4:
LiAlH4 (solid)→LiAlH4 (liquid)
An exothermic peak 3 at 201.1 °C is usually attributed to the decomposition of liquid LiAlH4 according to the following reaction:
LiAlH4 (liquid) →1/3Li3AlH6 (solid) + 2/3Al (solid) + H2
However, as reported in [20] two other thermal events such as solidification of Li3AlH6 and its decomposition also occur at this peak. Finally, a small and broad endothermic peak 4 at 234.7 °C is due to the final decomposition of the small amount of remaining Li3AlH6 [2,29]:
1/3Li3AlH6 (solid)→LiH (solid) + 1/3Al (solid) + 0.5H2 (final)
The last peak 5 at over 400 °C is usually attributed to the decomposition of LiH which was formed as a result of decomposition of Li3AlH6. However, decomposition of LiH has no practical value since its temperature is too high.
Figure 12. DSC curves for (a) undoped LiAlH4 milled for 15 min, (b) LiAlH4 + 5wt.% n-Ni mixed, (c) LiAlH4 + 5wt.% n-Ni milled for 15 min under low energy shearing mode with 1 weak magnet, 2 balls, (d) LiAlH4 + 5wt.% n-Ni milled for 15 min under high energy milling mode. Heating rate was 10 °C/min. R-ball-to-powder weight ratio; IMP68-high energy impact mode with 2 magnets in a magneto-mill. Adapted from [21].
Energies 04 00001 g012
Figure 12b shows that the addition of 5 wt.% n-Ni to LiAlH4 by simple mixing without ball milling does not change the reference DSC scan in Figure 12a. In contrast, even relatively low energy ball milling of n-Ni doped LiAlH4 using 1 weak magnet and 2 balls changes profoundly a DSC scan as shown in Figure 12c. Both melting peak of LiAlH4 (at 168 °C) and the following exo peak at 169 °C become very small. As can be seen in d high energy ball milling completely eliminates the endothermic melting peak 2 of LiAlH4 and virtually merges the exothermic peak 1 and 3 into one exo peak at 137.7 °C. Now the decomposition of LiAlH4 occurs fully in a solid state:
LiAlH4 (solid) → 1/3Li3AlH6 (solid) + 2/3Al (solid) + H2
This is quite a remarkable sequence which shows that the mere presence of the n-Ni catalyst in a mixture as obtained by just mixing is insufficient and the nano-catalyst must be very intimately embedded in the LiAlH4 particles in order to be able to exert a strong catalytic action on the alanate matrix. That also suggests that it is still insufficient if the n-Ni particles are distributed solely on the surface of hydride particles as it occurs during mixing but they must be also embedded in the bulk of the hydride particles which is only achieved by relatively high energy ball milling. As reported in [21] it is unclear if the reaction of the surface aluminum-hydroxyl groups (reaction (1)) triggers a spontaneous decomposition of ball milled n-Ni doped LiAlH4 at temperatures much lower than its melting point leading to a merger of peak 1 and 3 into one exothermic peak as presented in Figure 12d. This issue requires more studies.
The synthesis of LiAlH4 with 5 wt.% n-Ni by high energy ball milling also brings about some remarkable improvement of isothermal dehydring rate at quite moderate temperature as shown in Figure 13. It is seen that a LiAlH4 + n-Ni nanocomposite system always desorbs hydrogen in a solid state in two stages I and II which corresponds to reaction (5) and (4), respectively. Such a behavior has never been reported in the literature.
The apparent activation energy of Stage I and II as estimated from the Johnson–Mehl–Avrami–Kolmogorov (JMAK) and Arrhenius equations has been reported in [21] as being equal to ~70 (R2 = 0.998) and ~100 kJ/mol (R2 = 0.998), respectively. The one for Stage I is lower than the apparent activation energy for Stage I reported for metal chloride catalytic precursors in LiAlH4 [2,21].
Another effect of nano-catalytic Ni additive is its ability to induce a slow desorption of large quantities of hydrogen at room temperature (RT), 40 and 80 °C for the ball milled nanocomposite of LiAlH4 + 5 wt.% n-Ni as shown in Figure 14.
Figure 13. Comparison of volumetric desorption curves at 100 °C under 0.1 MPa H2 pressure for ball milled undoped LiAlH4 (curve 1) and ball milled LiAlH4 + 5 wt.% n-Ni (curve 2). Adapted from [21].
Energies 04 00001 g013
XRD studies have shown that the microstructure after 25 and 65 days of storage at RT consists mainly of a mixture of retained LiAlH4, newly formed Li3AlH6 and Al [21]. This kind of microstructure confirms that reaction (5) was incomplete during storage at RT which also agrees well with the release of ~3.4 wt.% H2 in Figure 14a. At 80 °C after 15 days of storage the microstructure consists mainly of newly formed Li3AlH6, Al and possibly some small amount of LiH [21]. This microstructure indicates near-completion of reaction (5) and the beginning of reaction (4). After 30 days at 80 °C the microstructure consists of a minimal amount of retained Li3AlH6, mostly Al and some LiH [21]. The rate of H2 release during storage at RT −80 °C can be easily regulated by increasing or decreasing temperature. These virtues make the LiAlH4 + 5 wt.% n-Ni nanocomposite a potential hydrogen storage material for applications where a continuous supply of hydrogen is required for a prolonged service time.
Figure 14. Plots of hydrogen desorbed vs. storage time in days (1 day = 24h) for LiAlH4 + 5(10) wt.% n-Ni mixtures ball milled for 15 min under high energy mode. (a) Stored at room temperature (RT) under Ar; subsequently desorbed at 140 °C under 0.1 MPa H2 pressure. (b) Stored at 40 °C under Ar; subsequently desorbed at 170 °C under 0.1 MPa H2 pressure. (c) Stored at 80 °C under Ar; subsequently desorbed at 170 °C under 0.1 MPa H2 pressure. Adapted from [21].
Energies 04 00001 g014

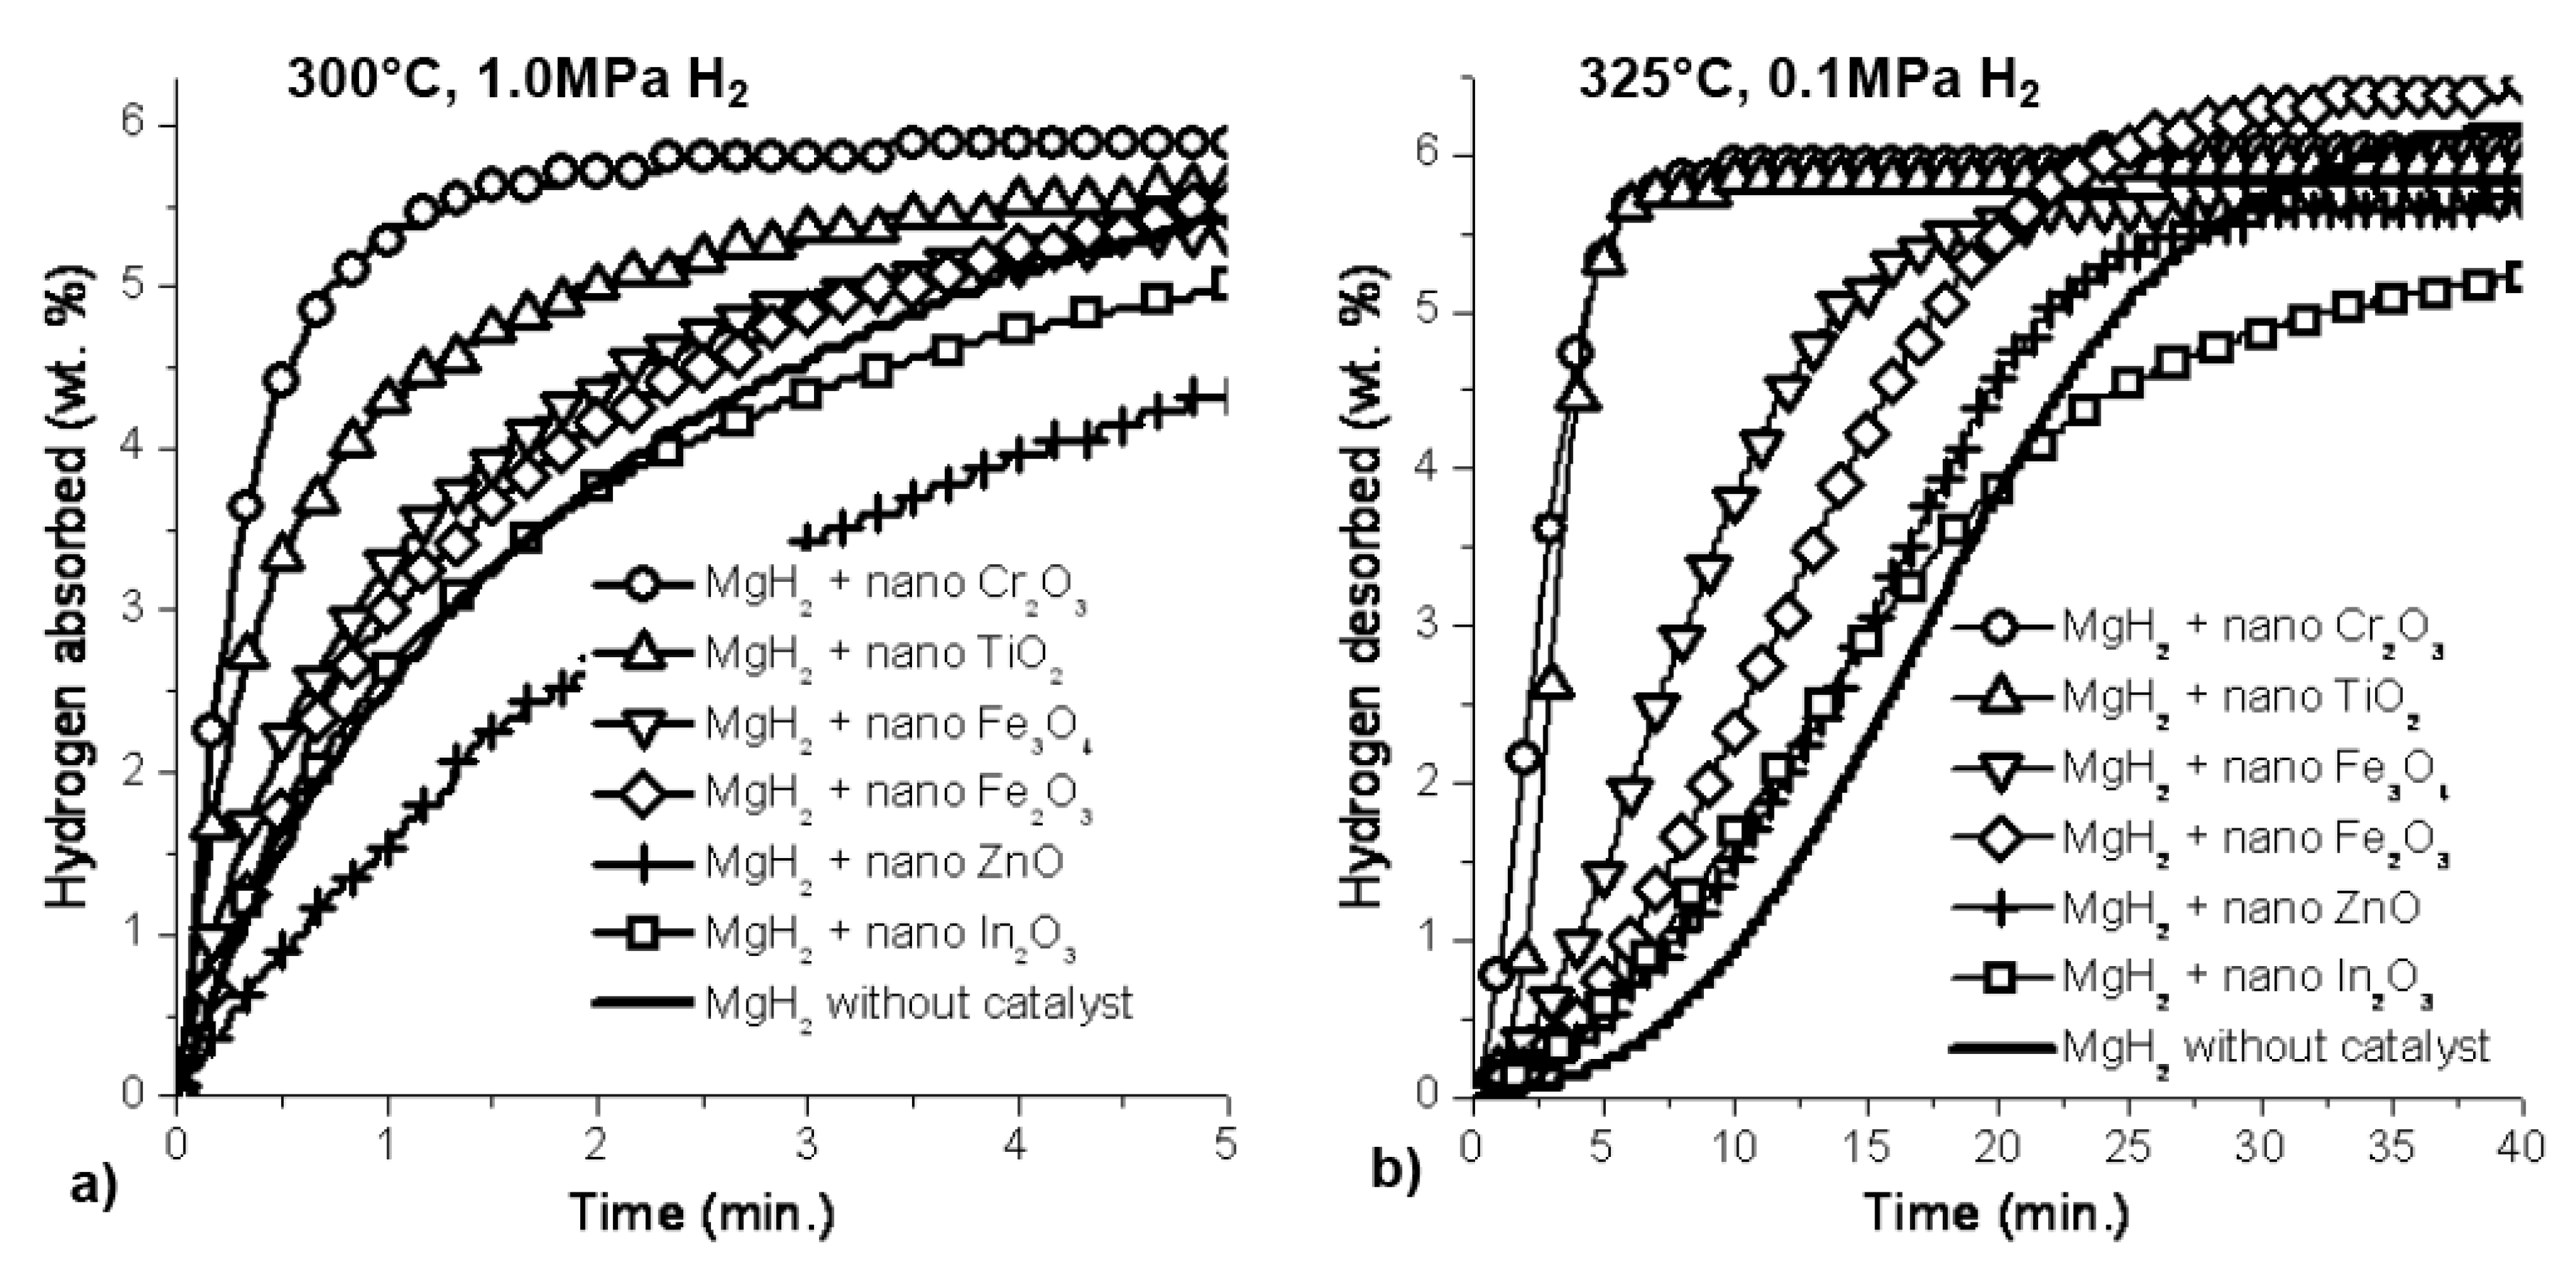
3.2. Nanometric Metal Oxides in MgH2

Various metal oxides seem to be quite potent catalytic additives to MgH2. Most of the studies on the effects of metal oxide additives on the dehydriding behavior of MgH2 until the end of 2008 were critically reviewed in [2]. Most recently, a number of metal oxide nanopowders (size within ~8–25 nm range) were investigated as catalysts for ball milled MgH2. In order to eliminate the effect of γ-MgH2 on dehydrogenation behavior (see Sec. 2.1) all the samples were first dehydrogenated at 325 °C under vacuum and then hydrogenated at 300 °C under 10 bar of hydrogen pressure. After the 1h absorption, sample was heated to 325 °C, and the desorption at 0.1 MPa H2 pressure was conducted [18,30]. Figure 15 shows absorption and subsequent desorption curves for a number of investigated nano-oxides. It is clear that the best catalytic effect on hydrogen desorption rate is exhibited by nano-Cr2O3 and nano-TiO2. The apparent activation energy of dehydrogenation for all additives was also estimated by the Kissinger method [2,30].
Figure 15. (a) Hydrogen absorption and (b) desorption curves for MgH2 ball milled with various nano-sized metal oxides. Adapted from [30].
Energies 04 00001 g015
For the samples with nano-Cr2O3 and nano-TiO2, the activation energy was found to be ~84 and ~94 kJ/mol, respectively, as compared to the range of 115–147 kJ/mol for the other nano-oxides in Figure 15. The obtained apparent activation energy range for nano-Cr2O3 and nano-TiO2 is quite comparable to that reported for the nano-Ni doped MgH2 in Figure 8b which is equal to ~94 kJ/mol. However, the DSC peak temperature for the nano-Cr2O3 and nano-TiO2 doped MgH2 nanocomposite was reported as being equal to 359 and 348 °C, respectively, for the heating rate of 10 °C/min [30]. These are much higher peak temperatures than 243.1 °C shown in Figure 7 for the n-Ni doped MgH2 nanocomposite registered at the same heating rate (10 °C/min). However, as mentioned in [30] there seems to be no linear dependence between the estimated apparent activation energy by the Kissinger method and the desorption rate measured by volumetric Sieverts’ method and DSC. This behavior may be caused by the fact that the DSC peak does not always correspond to the higher reaction rate (exothermic and endothermic peaks can overlap and shift the peak value). Therefore, Kissinger’s method, based on slightly shifted peaks, does not give very accurate values. It is also possible that even the correctly estimated activation energy is not the only factor influencing the desorption rate under both atmospheric and dynamic vacuum conditions.
Since nano-Cr2O3 is one of the two most efficient catalytic additives as discussed above the cyclic stability of the ball milled MgH2 + 10 wt.% nano-Cr2O3 additive was further investigated in [31]. The desorption step in cycling was conducted under high vacuum of 10−6 mbar while absorption was conducted under 10 bar of hydrogen pressure both at 325 °C. To evaluate precisely the amount of hydrogen absorbed by a sample, absorption isotherms were performed before cycling and after each 25 cycles. The total of 150 desorption/absorption cycles were conducted. Figure 16 shows that after only one cycle the total hydrogen capacity is reduced to about 5.2 wt.% from the initial capacity of ~6.7 wt.% and then it further decreases with increasing number of cycles reaching about 4.6 wt.% after 75 cycles. For the next 75 cycles the total hydrogen capacity seems not to be much affected by cycling and remains at a constant level of ~4.6 wt.% which suggests that most of the microstructural changes responsible for the capacity loss occurred within the first 75 cycles. In general, the hydrogen capacity loss with the progressive cycling is quite commonly observed for ball milled MgH2 both undoped and doped with catalytic additives [2,23]. Microstructural investigations in [31] revealed that a number of microstructural changes occurred during cycling which included powder particle sintering into clusters, segregation of the Cr2O3 particles to the interfaces between the sintered Mg particles, which after ball milling were quite uniformly distributed within the individual MgH2 particles, grain growth of the β-MgH2 grains/crystallites within the particles from ~30 nm after milling to over 100 nm after 150 cycles, and a gradual degradation of the Cr2O3 catalytic additive owing to its reduction by Mg and formation of MgO during an absorption step in cycling [31]. However, it was difficult to establish unambiguously which one of these microstructural alterations was primarily responsible for the peculiar loss of capacity observed in Figure 16.
Figure 16. The total hydrogen absorption capacity for MgH2 + 10 wt.% nano-Cr2O3 obtained from PCT curves after a specified number of cycles at 325 °C. Adapted from [31].
Energies 04 00001 g016

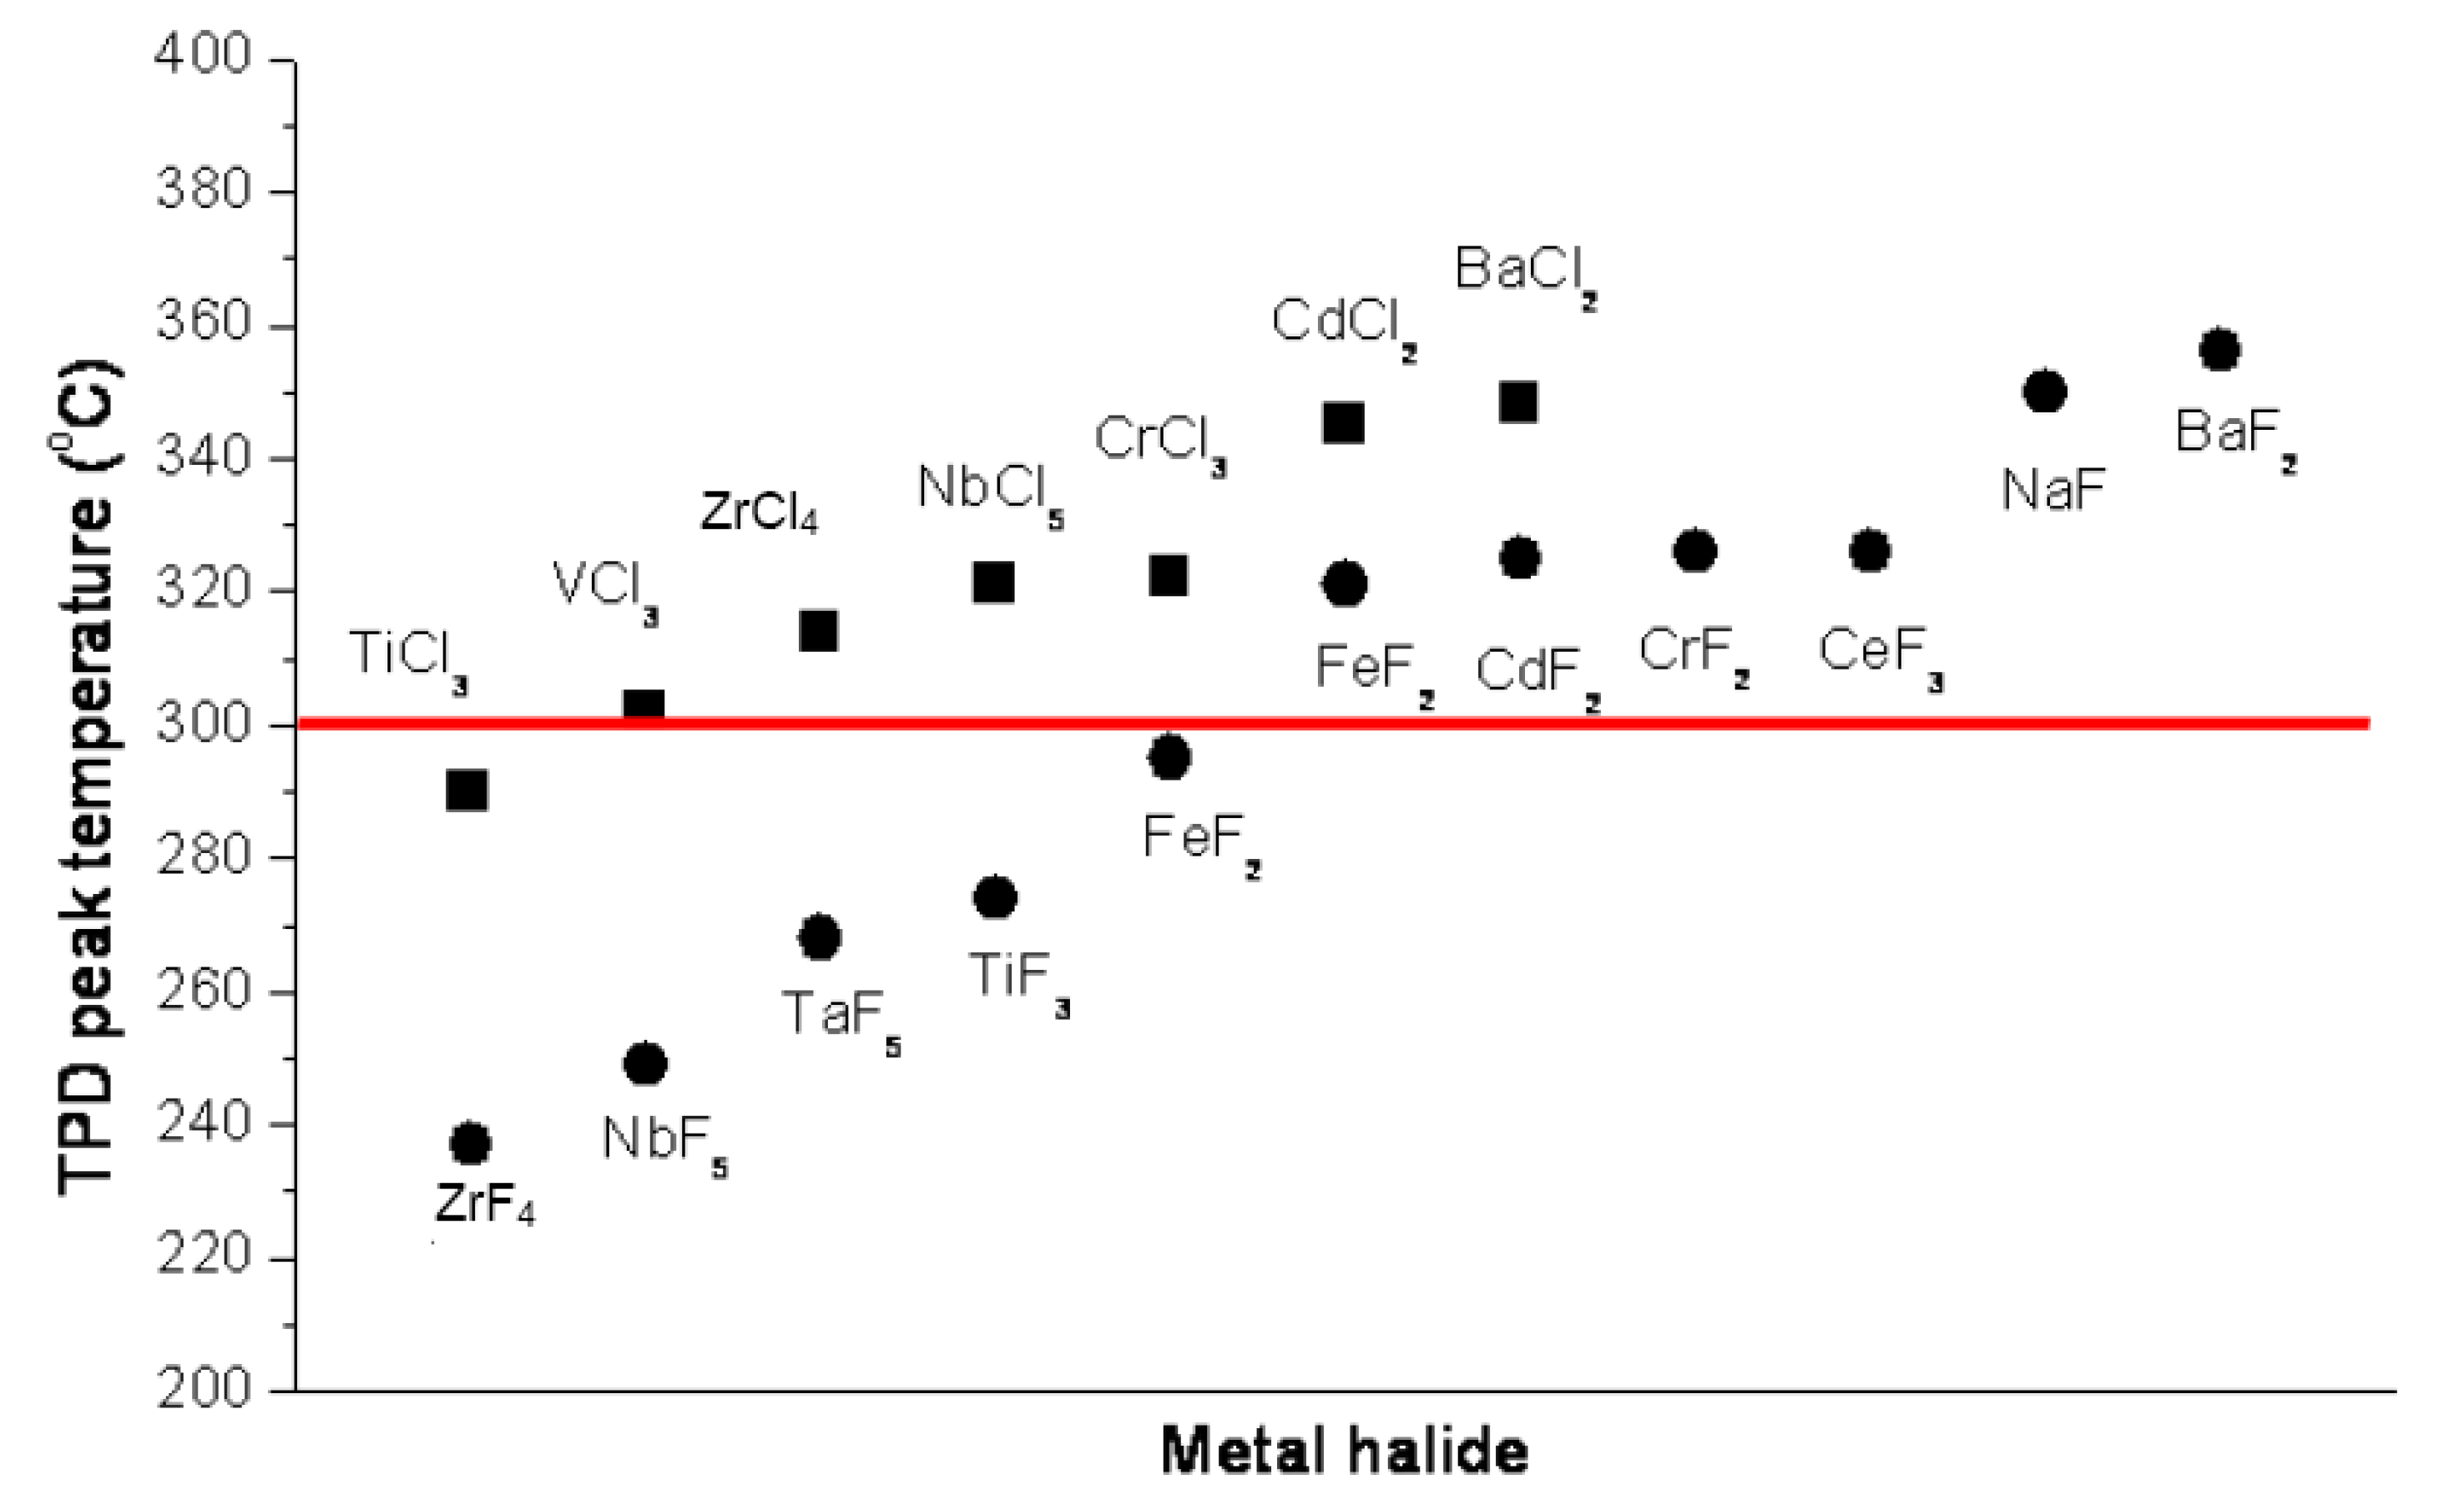
3.3. Metal Halides Catalytic Precursors

3.3.1. MgH2

Most recently a number of halides (chlorides&fluoridies) have been evaluated as potential catalysts for MgH2. The amount of 7 wt.% halides was added to the MgH2 matrix and ball milled in a planetary mill [32]. The dependence of the dehydrogenation peak temperature of the synthesized nanocomposites on the halide additive was monitored by temperature programmed desorption (TPD) and differential scanning calorimetry (DSC). Figure 17 shows the TPD dehydrogenation peak temperature as a function of the type of a halide additive. A horizontal line delineates all TPD temperatures lower than 300 °C. It is quite clear that for chlorides only the TiCl3 additive gives the peak temperature slightly lower than the 300 °C limit. The situation is much better for fluorides because a number of them such as ZrF4, NbF5, TaF5, TiF3, and FeF2 have peak temperatures below 300 °C. Apparently the lowest peak temperature is observed for ZrF4.
The apparent activation energies for dehydrogenation for MgH2 nanocomposites with TiCl3, ZrF4, NbF5, and TaF5 were calculated by the Kissinger method from TPD/DSC curves and are equal to 85 kJ/mol (R2 = 0.998)/79 kJ/mol (R2 = 0.997), 77 kJ/mol (R2 = 0.995)/82 kJ/mol (R2 = 0.999), 83 kJ/mol (R2 = 0.999)/70 kJ/mol (R2 = 0.999) and 97 kJ/mol (R2 = 0.940)/95 kJ/mol (R2 = 0.996), respectively. Apparently, the apparent activation energy ranges are the lowest ones for NbF5 and ZrF4 (note excellent coefficients of fit R2). The selected ZrF4, NbF5, and TaF5 fluorides have the highest oxidation states compared to other fluorides and chlorides which may be responsible for their enhanced behavior as catalytic species. However, the exact mechanism of the catalytic action exerted by them on MgH2 is still elusive.
Figure 17. Dehydrogenation TPD peak temperature of ball milled MgH2 doped with 7 wt.% of various halides as a function of the type of a halide additive. The horizontal line shows the limit of 300 °C for TPD peak temperature. Adapted from [32].
Energies 04 00001 g017
Further studies investigated the cyclic stability of ball milled nanocomposites MgH2 + 7 wt.% ZrF4 and NbF5. For both nanocomposites it has been observed that after 50 absorption/desorption cycles at 325 °C the hydrogen capacity decreased from the initial ~6.0 to ~4.9 wt. % for the MgH2/ZrF2 sample and ~4.5 wt.% for the MgH2/NbF5 [33]. The causes for the reduced capacity with cycling are not clear but it must be noted that this behavior is very similar to the one presented in Figure 16 for the nano-Cr2O3 additive. For the MgH2/NbF5 sample microstructural studies by STEM, XRD and EDS found that NbF5 was degraded after 50 cycles forming the MgF2 phase and nano-sized Nb-rich precipitates. It seems that the formation of MgF2 is mainly responsible for the loss of hydrogen storage capacity in this system due to the reduction in the volume fraction of MgH2 matrix. It is more difficult to explain the cyclic capacity loss for the MgH2/ZrF4. Microstructural studies showed no degradation of ZrF4 after 50 cycles. Possibly, the microstructural changes discussed earlier for the MgH2/Cr2O3 system might be responsible for the capacity loss for the MgH2/ZrF4 system. Apparently more research is required to quantitatively explain the observed behavior.

3.3.2. Complex Hydrides

The addition of catalytic metal halide precursors to complex metal hydrides has been very well documented. Some catalytic metal chloride precursors such as TiCl3, ZrCl4, VCl3, NiCl2 and ZnCl2were added to LiAlH4 which enhanced quite dramatically the rate of desorption and in effect lowered the effective desorption temperature of LiAlH4 [2]. In general, catalytic precursors work in such a way that they react with the hydride matrix forming a metal salt and a free nanometric or amorphous elemental metal/intermetallic catalyst [2].
Most recently, for the first time we have investigated the effect of a manganese chloride (MnCl2) catalytic precursor on the hydrogen storage properties of LiAlH4 [34]. This chloride is less volatile than those of Ti, V and Zr metals. Figure 18a shows a DSC curve for the ball milled LiAH4/MnCl2 system. The first exo peak is attributed to the partial decomposition of LiAlH4 to Li3AlH6, Al and H2 in a solid state according to reaction (5) in Sec.3.1.2. However, in contrast to the LiAH4/n-Ni system discussed in Sec.3.1.2 the melting of LiAlH4is not completely eliminated since reaction (5) is incomplete as a small amount of the retained LiAlH4 is melting around the small endo peak at 163.1 °C and decomposes to Li3AlH6, Al and H2 around the exo peak at 171.1 °C. It is to be reminded that the addition of 5 wt.% n-Ni and a similar ball milling energy completely eliminated the melting of LiAlH4 as shown in Figure 12d.
Figure 18b shows that the MnCl2 catalytic precursor is not as effective in enhancing the rate of dehydrogenation as n-Ni discussed in Sec.3.1.2. For the LiAH4/MnCl2 system dehydrogenation occurs in a solid state but only through Stage I (reaction (5) in Sec.3.1.2) whereas for the LiAH4/n-Ni system within a similar time span, dehydrogenation occurs in a solid state through both Stage I and II (reaction (5) and (4), respectively, in Sec.3.1.2). After desorption of ball milled LiAlH4/MnCl2 at 100 °C for 140 ks its XRD pattern (not shown here) exhibited the diffraction peaks of LiCl (JCPDS#04-0664), Al and Li3AlH6. Apparently, during decomposition besides reaction (5) in Stage I producing Li3AlH6 and Al, a second reaction producing LiCl (and again Al) must have occurred with the following general path [34]:
nLiAlH4 + MnCl2→(n-2)LiAlH4 + 2LiCl + 2Al + Mn + 4H2
For 5 wt.% MnCl2, n = 63 so the exact reaction is as follows:
63LiAlH4 + MnCl2→61LiAlH4 + 2LiCl + 2Al + Mn + 4H2
It is to be pointed out that since no diffraction peaks of Mn were observed after desorption at 100 °C for 140 ks, most likely, elemental Mn catalyzing the reaction is in an amorphous state.
The apparent activation energy of dehydrogenation of the ball milled LiAlH4/MnCl2 system for Stage I (reaction (5) in Sec.3.1.2) is equal to ~80 kJ/mol (R2 = 1.0) as compared to ~70 kJ/mol for the LiAlH4/n-Ni system (Sec.3.1.2).
Figure 18. (a) DSC curve for LiAlH4 + 5 wt.% MnCl2 ball milled under high energy impact mode. (b) Comparison of volumetric desorption curves at 100 °C under 0.1 MPa H2 for catalyzed LiAlH4 ball milled under high energy impact mode. 1 - LiAlH4 + 5 wt.% MnCl2 and 2 - LiAlH4 + 5wt.% n-Ni. R - ball-to-powder weight ratio; IMP68 - high energy impact mode with 2 magnets in a magneto-mill. Adapted from [34].
Energies 04 00001 g018
Figure 19 shows that ball milled LiAlH4 doped with 5 wt.% MnCl2 is able to desorb quite substantial quantities of H2 at room temperature (RT; ~21 °C), 40 and 80 °C. So far, such a behavior has never been reported for a metal chloride doped LiAlH4. At RT and 80 °C the ball milled LiAlH4 + 5 wt.% MnCl2 nanocomposite within a comparable time span slowly desorbs even slightly greater amount of H2 than its LiAlH4 + 5 wt.% n-Ni counterpart in Figure 14a,c despite that at elevated temperatures the apparent activation energy of 5 wt.% MnCl2 doped LiAlH4 is slightly greater (~80 kJ/mol vs. ~70 kJ/mol, respectively).
Figure 19. The amounts of hydrogen desorbed during long term storage at (a) room temperature (RT), (b) 40 and (c) 80 °C for ball milled LiAlH4 + 5 wt.% MnCl2. Adapted from [34].
Energies 04 00001 g019

4. Summary and Conclusions

The most recent advances on the effects of microstructural refinement and various nano-catalytic additives on the hydrogen storage properties of metal and complex hydrides have been critically discussed. It is shown that microstructural refinement induced by ball milling is rather of secondary importance to the hydrogen storage properties of metal and complex metal hydrides. In particular, for MgH2 the presence of the non-equilibrium pressure-induced γ-MgH2 phase formed during ball milling and the particle refinement to the size level achievable by high energy ball milling can measurably improve the kinetics of dehydrogenation of ball milled MgH2 but does not affect its thermodynamics. However, after the removal of γ-MgH2 by annealing the kinetics of dehydrogenation is only very modestly affected by the refined particle size. In this context it seems that the role of the refined grain size within the powder particles is quite minor. It also seems that the reduction of the hydroxide layer on the MgH2 particles, if ball milling occurs under reducing H2, is even more important than the particle refinement.
For complex metal hydrides (e.g., LiAlH4) microstructural refinement induced by ball milling still improves the kinetics of dehydrogenation but again the overall effect is at least quite modest. Taking the apparent activation energy of dehydrogenation as a most important kinetic parameter, for example, three-fold refinement by ball milling of the average particle size of LiAlH4 from ~10 to ~3 μm brings about only a very modest decrease of the apparent activation energy by ~10 kJ/mol.
Nano-sized elemental metals (e.g., n-Ni and n-Fe) influence the kinetics of dehydrogenation of ball milled MgH2 in a major way much more substantially than the microstructural refinement. The observed decrease of the apparent activation energy with respect to the ball milled undoped MgH2 is within the range of ~50–60 kJ/mol. For complex metal hydrides the reduction in the apparent activation energy approaches ~30 kJ/mol. Quite similar effects on the kinetics of dehydrogenation and particularly on the apparent activation energy of MgH2 dehydrogenation are obtained by the addition of halide catalytic precursors. Again the reductions of the apparent activation energy within the range of ~50–60 kJ/mol are easily achieved.
For the complex hydrides, like LiAlH4, the addition of metal chloride precursors result in more modest reductions in the apparent activation energy on the order of ~20 kJ/mol as compared to undoped LiAlH4.
A complex metal hydride LiAlH4 after ball milling with nanometric Ni metal catalysts and MnCl2 catalytic precursor is able to desorb large quantities of hydrogen at RT, 40 and 80 °C. This kind of behavior is very encouraging for the future development of solid state hydrogen systems.

Acknowledgements

A financial support from the NSERC Hydrogen Canada (H2CAN) Strategic Research Network, NSERC Discovery, NSERC/Vale Inco Inc. Collaborative Research and Development, and the Polish Ministry of Science and Higher Education, Key Project POIG.01.03.01-14-016/08, is gratefully acknowledged.

References

  1. Homepage of Nuvera Fuel Cells. Available online: http://www.nuvera.com/products/androm.php (Accessed on 20 December 2010).
  2. Varin, R.A.; Czujko, T.; Wronski, Z.S. Nanomaterials for Solid State Hydrogen Storage; Springer Science + Business Media: New York, NY, USA, 2009; Chapter 1–3. [Google Scholar]
  3. Bogdanović, B.; Bohmhammel, K.; Christ, B.; A. Reiser, A.; Schlichte, K.; Vehlen, R.; Wolf, U. Thermodynamic investigation of the magnesium–hydrogen system. J. Alloys Compd. 1999, 282, 84–92. [Google Scholar] [CrossRef]
  4. Bogdanović, B.; Hofmann, H.; Neuy, A.; Reiser, A.; Schlichte, K.; Spliethoff, B.; Wessel, S. Ni-doped versus undoped Mg–MgH materials for high temperature heat or hydrogen storage. J. Alloys Compd. 1999, 292, 57–71. [Google Scholar] [CrossRef]
  5. Zaluski, L.; Zaluska, A.; Ström-Olsen, J.O. Nanocrystalline metal hydrides. J. Alloys Compd. 1997, 253–254, 70–79. [Google Scholar]
  6. Zaluska, A.; Zaluski, L.; Ström-Olsen, J.O. Nanocrystalline magnesium for hydrogen storage. J. Alloys Compd. 1999, 288, 217–225. [Google Scholar] [CrossRef]
  7. Zaluska, A.; Zaluski, L.; Ström-Olsen, J.O. Structure, catalysis and atomic reactions on the nano-scale: A systematic approach to metal hydrides for hydrogen storage. Appl. Phys. A 2001, 72, 157–165. [Google Scholar] [CrossRef]
  8. Huot, J.; Liang, G.; Boily, S.; Van Neste, A.; Schulz, R. Structural study and hydrogen sorption kinetics of ball-milled magnesium hydride. J. Alloys Compd. 1999, 293–295, 495–500. [Google Scholar]
  9. Schulz, R.; Huot, J.; Liang, G.; Boily, S.; Van Neste, A. Structure and hydrogen sorption properties of ball milled Mg dihydride. Mater. Sci. Forum 1999, 312–314, 615–622. [Google Scholar]
  10. Schulz, R.; Huot, J.; Liang, G.; Boily, S.; Lalande, G.; Denis, M.C.; Dodelet, J.P. Recent developments in the application of nanocrystalline materials to hydrogen technologies. Mater. Sci. Eng. A 1999, 267, 240–245. [Google Scholar] [CrossRef]
  11. Dornheim, M.; Doppiu, S.; Barkhordarian, G.; Boesenberg, U.; Klassen, T.; Gutfleisch, O.; Bormann, R. Hydrogen storage in magnesium-based hydrides and hydride composites. Scr. Mater. 2007, 56, 841–846. [Google Scholar] [CrossRef]
  12. Varin, R.A.; Czujko, T.; Wronski, Z. Particle size, grain size and γ-MgH2 effects on the desorption properties of nanocrystalline commercial magnesium hydride processed by controlled mechanical milling. Nanotechnology 2006, 17, 3856–3865. [Google Scholar] [CrossRef]
  13. Bastide, J.-P.; Bonnetot, B.; Létoffé, J.-M.; Claudy, P. Polymorphisme de l’hydrure de magnesium sous haute pression. Mat. Res. Bull. 1980, 15, 1779–1787. [Google Scholar] [CrossRef]
  14. Gennari, F.C.; Castro, F.J.; Urretavizcaya, G. Hydrogen desorption behavior from magnesium hydrides synthesized by reactive mechanical alloying. J. Alloys Compd. 2001, 321, 46–53. [Google Scholar] [CrossRef]
  15. Selvam, P.; Viswanathan, B.; Swamy, C.S.; Srinivasan, V. Magnesium and magnesium alloy hydrides. Int. J. Hyd. Energy 1986, 11, 169–192. [Google Scholar] [CrossRef]
  16. Barkhordarian, G.; Klassen, T.; Bormann, R. Kinetic investigation of the effect of milling time on the hydrogen sorption reaction of magnesium catalyzed with different Nb2O5 contents. J. Alloys Compd. 2006, 407, 249–255. [Google Scholar] [CrossRef]
  17. Varin, R.A.; Czujko, T.; Chiu, C.; Wronski, Z. Particle size effects on the desorption properties of nanostructured magnesium dihydride (MgH2) synthesized by controlled reactive mechanical milling (CRMM). J. Alloys Compd. 2006, 424, 356–364. [Google Scholar] [CrossRef]
  18. Polanski, M.; Bystrzycki, J.; Plocinski, T. The effect of milling conditions on microstructure and hydrogen absorption/desorption properties of magnesium hydride (MgH2) without and with Cr2O3 nanoparticles. Int. J. Hyd. Energy 2008, 33, 1859–1867. [Google Scholar] [CrossRef]
  19. Varin, R.A.; Jang, M.; Czujko, T.; Wronski, Z.S. The effect of ball milling under hydrogen and argon on the desorption properties of MgH2 covered with a layer of Mg(OH)2. J. Alloys Compd. 2010, 493, L29–L32. [Google Scholar] [CrossRef]
  20. Varin, R.A.; Zbroniec, L. Decomposition behavior of unmilled and ball milled lithium alanate (LiAlH4) including long-term storage and moisture effects. J. Alloys Compd. 2010, 504, 89–101. [Google Scholar] [CrossRef]
  21. Varin, R.A.; Zbroniec, L. The effects of nanometric nickel (n-Ni) catalyst on the dehydrogenation and rehydrogenation behavior of ball milled lithium alanate (LiAlH4). J. Alloys Compd. 2010, 506, 928–939. [Google Scholar] [CrossRef]
  22. Paserin, V.; Baksa, S.; Zaitsev, A.; Shu, J.; Shojai, F.; Nowosiadly, W. Potential for mass production of nickel-based nanomaterials by carbonyl process. J. Nanosci. Nanotechnol. 2008, 8, 4049–4055. [Google Scholar] [CrossRef] [PubMed]
  23. Varin, R.A.; Czujko, T.; Wronski, Z.S. Thermal stability of Vale Inco nanonometric nickel as a catalytic additive for magnesium hydride (MgH2). Int. J. Hydrogen Ener. 2009, 34, 8603–8610. [Google Scholar] [CrossRef]
  24. Polanski, M.; Plocinski, T.; Kunce, I.; Bystrzycki, J. Dynamic synthesis of ternary Mg2FeH6. Int. J. Hydrogen Energy 2010, 35, 1257–1266. [Google Scholar] [CrossRef]
  25. Polanski, M.; Bystrzycki, J.; Varin, R.A.; Plocinski, T. Rapid hydrogenation at 30 °C of magnesium (Mg) and iron (Fe) nanocomposite obtained through a decomposition of Mg2FeH6 precursor. Int. J. Hydrogen Energy 2010, 8. [Google Scholar] [CrossRef]
  26. Hanada, N.; Ichikawa, T.; Hino, S.; Fujii, H. Remarkable improvement of hydrogen sorption kinetics in magnesium catalyzed with Nb2O5. Int. J. Hydrogen Energy 2006, 420, 46–49. [Google Scholar]
  27. Varin, R.A.; Li, S.; Wronski, Z.; Morozova, O.; Khomenko, T. The effect of sequential and continuous high-energy impact mode on the mechano-chemical synthesis of nanostructured complex hydride Mg2FeH6. J. Alloys Compd. 2005, 390, 282–96. [Google Scholar] [CrossRef]
  28. He, Y.; Zhao, Y. Hydrogen storage and cycling properties of a vanadium decorated Mg nanoblade array on a Ti coated Si substrate. Nanotechnology 2009, 20, 204008. [Google Scholar] [CrossRef] [PubMed]
  29. Block, J.; Gray, A.P. The thermal decomposition of lithium aluminum hydride. Inorg. Chem. 1965, 4, 304–305. [Google Scholar] [CrossRef]
  30. Polanski, M.; Bystrzycki, J. Comparative studies of the influence of different nano-sized metal oxides on the hydrogen sorption properties of magnesium hydride. J. Alloys Compd. 2009, 486, 697–701. [Google Scholar] [CrossRef]
  31. Polanski, M.; Bystrzycki, J.; Robert, A.; Varin, R.A.; Plocinski, T.; Pisarek, M. The effect of chromium (III) oxide (Cr2O3) nanopowder on the microstructure and cyclic hydrogen storage behavior of magnesium hydride (MgH2). J. Alloys Compd. 2010, 11. in press. [Google Scholar] [CrossRef]
  32. Malka, I.E.; Czujko, T.; Bystrzycki, J. Catalytic effect of halide additives ball milled with magnesium hydride. Int. J. Hydrogen Energy 2010, 35, 1706–1712. [Google Scholar] [CrossRef]
  33. Malka, I.E.; Bystrzycki, J.; Plocinski, T. Microstructure and hydrogen storage capacity of magnesium hydride with zirconium and niobium fluoride additives after cyclic loading. J. Alloys Compd. 2010, 10. in press. [Google Scholar] [CrossRef]
  34. Varin, R.A.; Zbroniec, L. Fast and slow dehydrogenation of ball milled lithium alanate (LiAlH4) catalyzed with manganese chloride (MnCl2) as compared to nanometric nickel catalyst. J. Alloys Compd. 2010, 09. in press. [Google Scholar] [CrossRef]

