1. Introduction
As a crucial unconventional natural gas resource, tight sandstone gas reservoirs contribute to 75% of the total unconventional natural gas production, which is of great significance for development. China is rich in tight gas resources, predominantly located in regions such as Ordos, Sichuan, Tarim, and Songliao. However, a common issue during the development process is water production, which leads to wellbore fluid accumulation, reduced production, and even shutdowns. This, in turn, negatively impacts the overall development efficiency of tight gas reservoirs [
1]. Specifically, the tight reservoir of the Dongsheng gas field in Ordos faces the challenges of poor physical properties, strong heterogeneity, and a complex pore-throat structure, which lead to intricate gas–water permeability characteristics that directly impact the gas reservoir’s recovery rate [
2,
3]. Therefore, studying the gas–water permeability characteristics and occurrence patterns of tight sandstone reservoirs is crucial for improving the development efficiency of tight gas reservoirs [
4,
5,
6].
During the formation of tight water-bearing reservoirs, hydrocarbon gases displace the primary formation water as they migrate. However, due to the varying sizes of reservoir pore throats, some small pore throats tend to trap residual formation water. At the same time, pore water is more likely to accumulate in reservoirs with low local structures and favorable physical properties. Additionally, the change in geological structure and water content distribution, as well as the change in pressure difference in the development process, may lead to the formation of aquifers, which makes the tight water gas reservoir show the characteristic of a high water content [
7]. A high water content increases gas flow resistance, which hinders gas production, leads to a rapid decline in gas well pressure and output, and shortens the production life cycle of gas wells [
8].
The two-phase flow behavior of gas and water in tight sandstone is complex. Laboratory experiments have been conducted to determine the gas–water two-phase permeability curves of rock cores using both steady-state and non-steady state methods. The steady relative-permeability test method is used to measure the relative permeability according to the gas and water flow rate under the stable state of inlet and outlet pressure by simultaneously injecting gas and water phases at a constant flow rate. There is a logarithmic function relationship between relative permeability and water saturation. With the increase in core permeability, the isotonic point moves towards a higher water saturation, the irreducible water saturation increases, and the residual gas saturation decreases accordingly [
9]. In the saturated core, gas migration needs to overcome capillary displacement pressure, and its process undergoes two characteristic stages: capillary force and diffusion control [
10]. The experimental results show that the relative-permeability curve of fixed water saturation measured by the steady-state method can effectively characterize the multiphase flow characteristics in the fractured and porous dual media [
11]. The fracture geometry and temperature and pressure conditions will significantly affect the relative permeability of gas and water [
12], and the change in the properties of the two-phase fluid under a high-temperature and high-pressure environment will lead to significant changes in the relative-permeability curve [
13].
The unsteady gas–water-phase permeability experiment is simple, and closer to the actual reservoir conditions, and it is widely used. In the unsteady displacement method, the saturated water core is driven by gas. The gas–water production and the pressure difference between the two ends of the sample are recorded with time at the outlet of the sample, and the relation curve between gas–water relative permeability and water saturation is plotted. The gas–water two-phase seepage behavior in the reservoir is affected by many complicated factors. In terms of the theoretical model, the traditional relative-permeability model is improved based on the fractal capillary bundle hypothesis by introducing parameters such as the effective porosity coefficient and critical pore diameter, so as to describe the gas–water seepage characteristics in coal more accurately [
14]. The experimental results show that the capillary end effect and the end water film result in the low relative permeability of gas under low injection pressure [
15]. Pore structure characteristics, wettability, confining pressure conditions, and pressure gradients all significantly affect the variation in gas–water relative permeability. It is worth noting that due to the high heterogeneity of the rock itself, the relative-permeability curves of different coal samples show significant differences [
16,
17].
The relative-permeability curve is a key indicator for exploring the flow characteristics of multiphase fluids in reservoirs. It provides essential data for dynamic analysis, development strategy planning, and reservoir numerical simulation during oil and gas field development. To accurately depict the permeability characteristics of reservoir fluids, indoor experiments are necessary to measure the phase permeability curves of multiple representative rock samples. These curves are then normalized to obtain a single phase permeability curve that represents the entire reservoir’s permeability characteristics while preserving the overall features of each individual curve. Currently, the main normalization methods include the averaging method, empirical formula method, and polynomial fitting method. Many scholars have proposed normalization models, as shown in
Table 1. Lu et al. [
18] improved the average method using Lagrange interpolation, which provides better normalization effects on oil–water permeability curves. Pan et al. [
19] valuated the applicability of normalization methods for relative-permeability curves across different reservoir types and flow units, considering variations in reservoir properties and the morphological characteristics of relative-permeability curves. Gong et al. [
20] proposed the semi-normalization method for relative-permeability curves, which normalizes only the water phase’s relative permeability, while the oil phase’s relative permeability is obtained by multiplying the water phase’s relative permeability with the ratio of the oil to water relative permeability. This method avoids the problem of low fitting accuracy in the logarithmic relationship between the oil phase’s relative permeability and oil saturation. For tight gas reservoirs with a high water content, the irreducible water saturation obtained from non-steady-state displacement experiment is high, but the actual irreducible water content of the reservoir is low, which makes it difficult for the existing normalization methods to accurately characterize the gas–water relative permeability of such gas reservoirs.
This study aims to address the gap in the literature by focusing on the gas–water permeability characteristics and normalization methods specifically for high-water-content tight gas reservoirs. Through laboratory experiments and refined normalization techniques, this research seeks to provide a more accurate and reliable framework for modeling gas–water two-phase flow and improving the development efficiency of such reservoirs. Additionally, the study will explore the impact of high water content on gas flow resistance and propose optimized methods for reservoir management that account for these unique challenges.
2. Materials and Methods
2.1. The Experimental Materials
Six core samples were collected from the Permian B1 layer of the Dongsheng gas field in the Ordos Basin (
Figure 1), and their porosity and permeability were measured. The basic physical properties of the core samples are shown in
Table 2. The synthetic formation water was prepared to replicate the groundwater properties of the Dongsheng gas field, with a composition designed to closely match the typical ionic profile and salinity found in the region’s formation water (
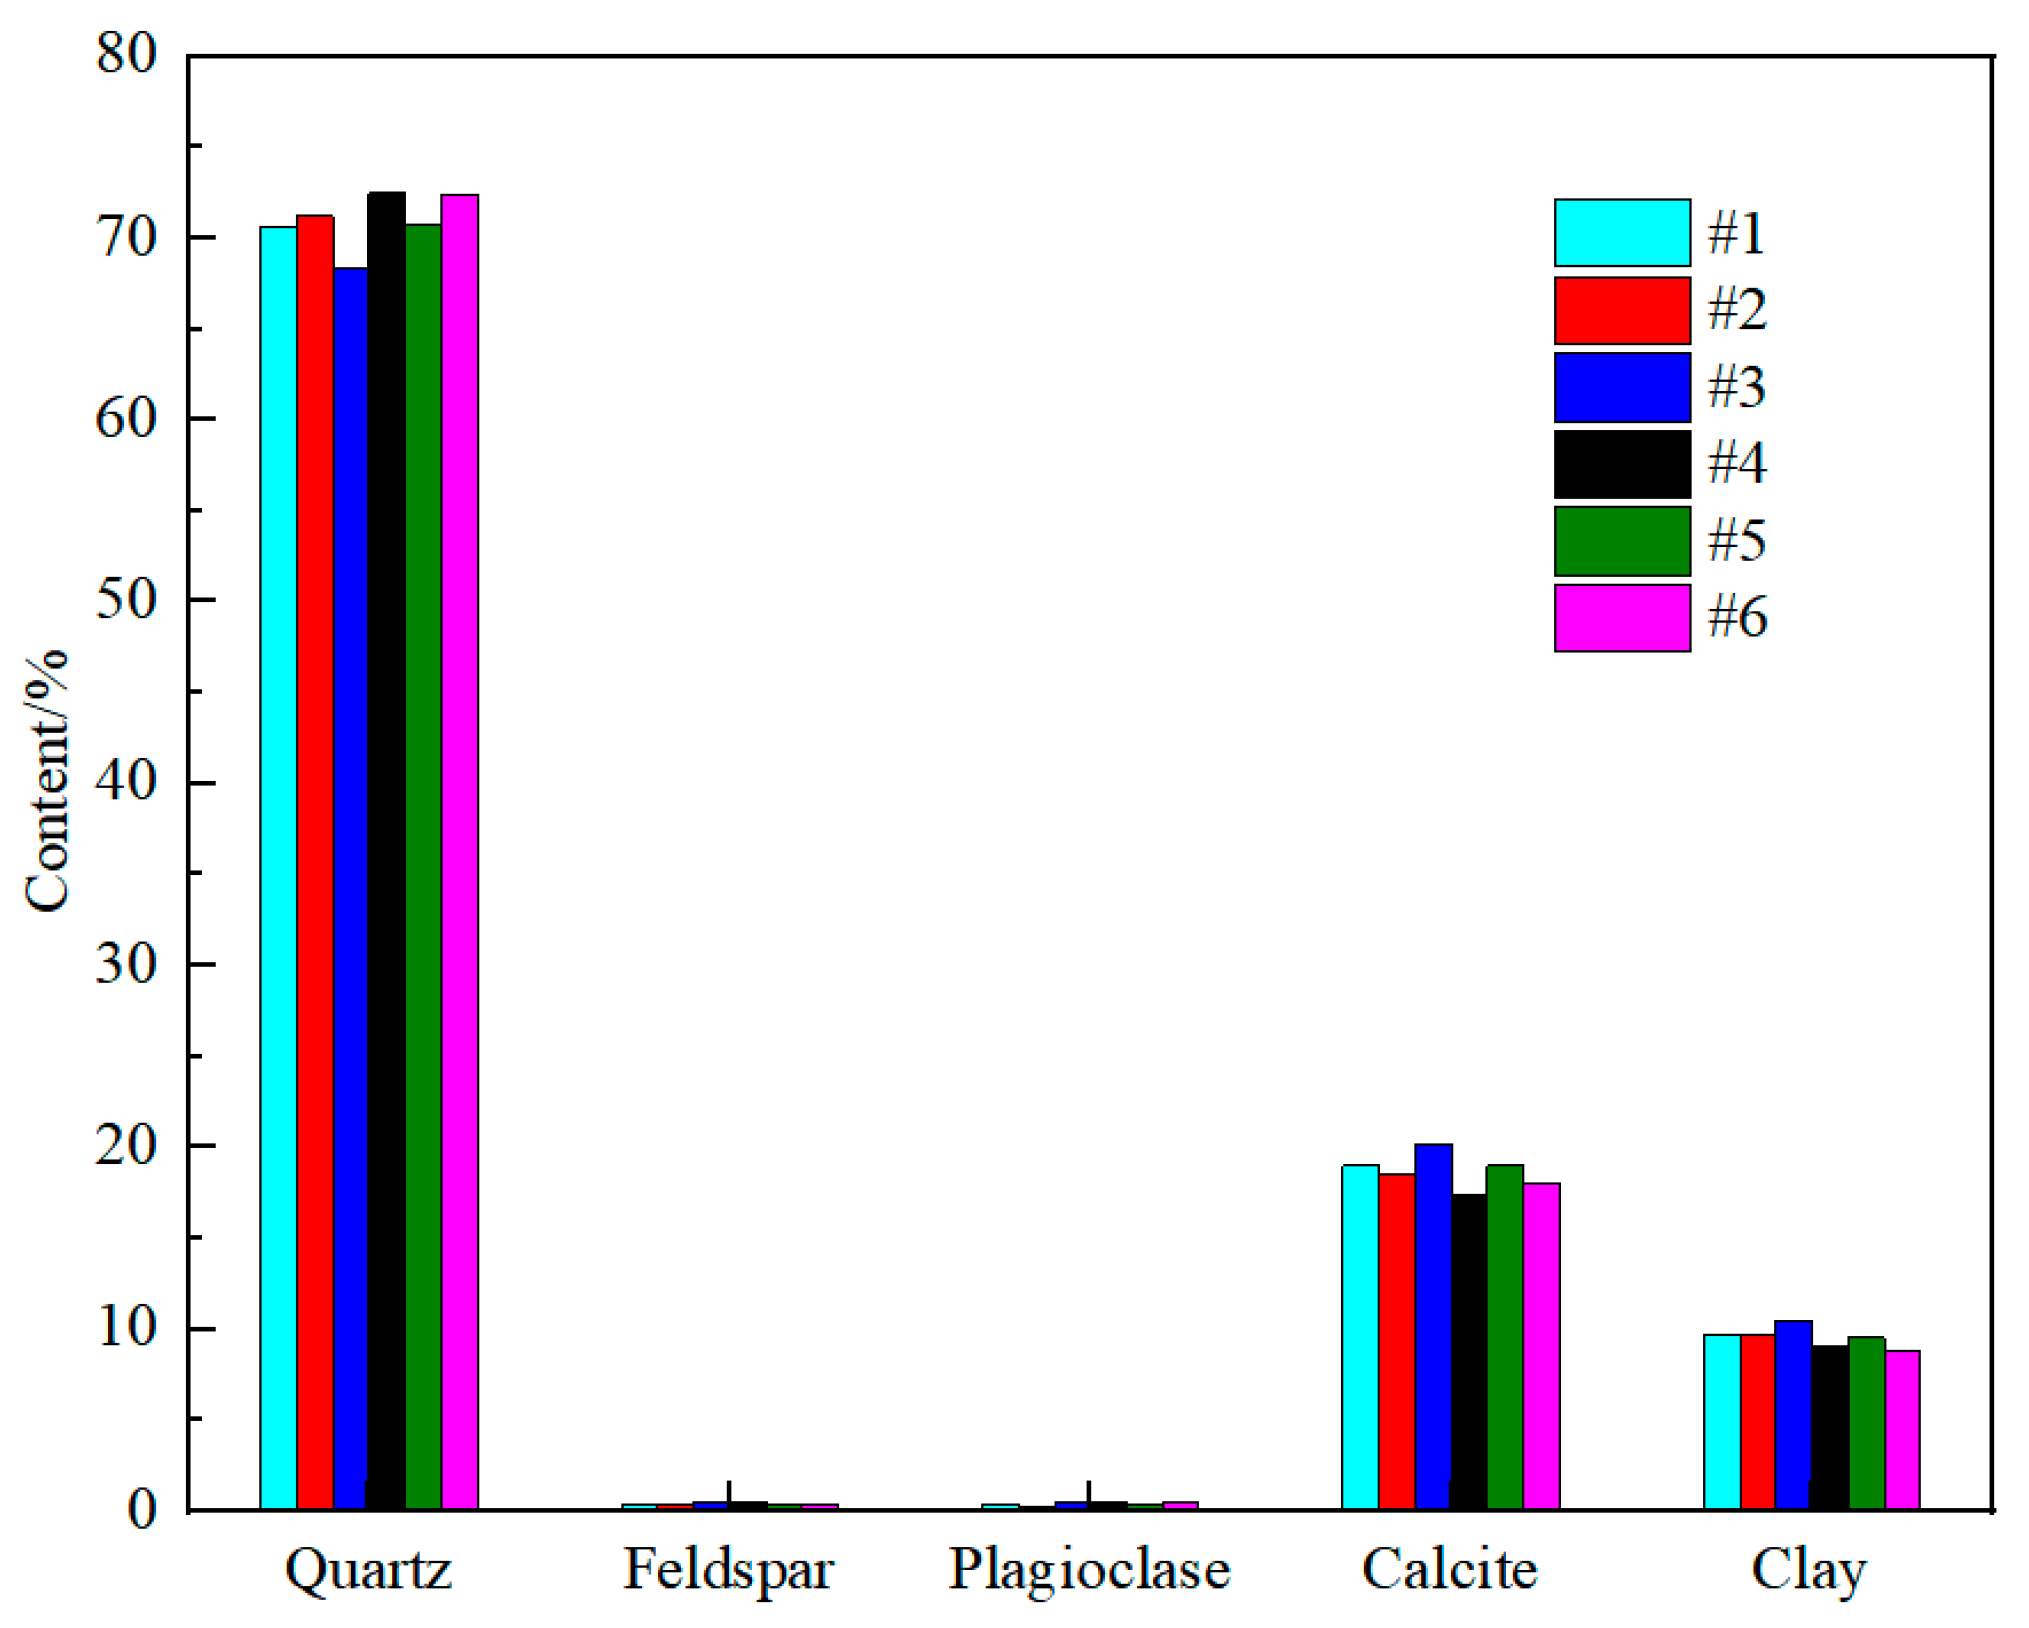
Table 3). The salinity of 48,126 mg/L is typical for the water found in the Permian B1 layer, providing a realistic simulation for the experimental conditions. Methane was used as the gas in the experiment. The core samples collected from the Permian B1 layer of the Dongsheng gas field exhibit a wide range of porosity (2.14% to 11.58%) and permeability (0.027 to 1.149 mD), indicative of the heterogeneity typical of tight gas reservoirs. The nuclear magnetic pore size distribution and mineral content of 6 core samples are shown in
Figure 2 and
Figure 3, respectively. It can be seen from
Figure 2 that the mineral contents of the six cores are not much different, with quartz content accounting for 70%, indicating that the six cores are hydrophilic. It can be seen from
Figure 3 that as the permeability of the core increases, the peak value of the nuclear magnetic resonance curve shifts to the right and the proportion of macropores in the core increases.
2.2. Non-Steady State Infiltration Experiment
To investigate the variation in the relative permeability of rock core gas and water under different displacement pressures, a self-made experimental device was developed for this study, as shown in
Figure 4. The device includes a high-precision plunger pump, an intermediate container, a high-precision pressure-regulating valve, a nitrogen cylinder, a core seat, a hand pump, and a back pressure valve. The detailed experimental steps are as follows:
Step 1: Place the core sample in the intermediate container and vacuum for 48 h to remove any residual fluids.
Step 2: Introduce the formation water into the container, pressurize it to 5 MPa, and allow the core to equilibrate for 48 h before proceeding to the next phase.
Step 3: Weigh the water-saturated rock core and place it in the core holder. Simulate the sandstone’s state under pressure by applying a confining pressure of 10 MPa. Open the gas cylinder, adjust the pressure valve, and inject CH4 into the core through the injection end at a pressure of 2 MPa to simulate the gas flooding process. Record the volume of liquid in the measuring cylinder and the reading of the gas flowmeter every 3 min, and calculate the cumulative water and gas production until there is no water production at the outlet end.
Step 4: The inlet pressures of 3 MPa, 4 MPa, and 5 MPa were selected to simulate a range of typical formation pressures in tight gas reservoirs. These pressures represent conditions where gas displacement is likely to occur in the initial, intermediate, and late stages of reservoir depletion.
Calculate the relative permeability of gas and water based on the experimental results, where the formula for calculating the non-steady state relative permeability of gas and water is as follows [
25]:
In the formula, fw (Sg) is the moisture content; (t) is the dimensionless cumulative water production, expressed as a multiple of pore volume; (t) is the dimensionless cumulative liquid production, expressed as a multiple of pore volume; Krw is the relative permeability of the aqueous phase; Krg is the relative permeability of the gas phase; I is the relative injection capacity, also known as the flow capacity ratio, dimensionless; Q(t) is the liquid production and flow rate at the outlet face of the rock sample at time t, cm3/s; Q0 is the initial oil production flow rate at the outlet section of the rock sample, cm3/s; Δp0 is the initial driving pressure difference, MPa; Δp(t) is the displacement pressure difference at time t, MPa; Sg is the gas saturation at the outlet face of the rock sample; μg is the gas viscosity, mPa·s; under experimental conditions; μw is the viscosity of the formation water under experimental conditions, mPa·s.
2.3. Determination of Irreducible Water Saturation Based on NMR
NMR (nuclear magnetic resonance) measurements, specifically the T
2 relaxation time, provide additional insights into the water distribution in pores, allowing for a more accurate determination of irreducible water saturation when used in conjunction with the centrifugal method. The centrifuge and nuclear magnetic device were shown in
Figure 5. The centrifugal force was gradually increased to remove water from the rock core. At each centrifugal stage, nuclear magnetic resonance (NMR) was used to monitor changes in water content over time. When the water content stabilized and showed no further change under a given centrifugal force, it was considered that the minimum water saturation corresponding to that centrifugal force had been reached. As the centrifugal force continued to increase and the water content in the core remained effectively unchanged, it was determined that the bound water saturation had been reached. At this point, the experiment was concluded. This range of centrifugal forces ensures that water is removed from both macro-pores and micro-pores, allowing for the determination of irreducible water saturation across the full spectrum of pore structures. T₂ spectra of the core samples were obtained at different levels of centrifugal pressure. The shorter T
2 values correspond to water in smaller pores, while longer T
2 values are associated with water in larger pores. By correlating the T
2 values with known saturation values, the irreducible water saturation can be calculated, providing insight into the pore structure and water retention characteristics of the core sample.
3. Results
3.1. Analysis of Experimental Results of Non-Steady State Permeation Curve
As shown in
Figure 6, the variation in fluid permeability within the core of tight sandstone was revealed. It can be seen that, with the increase in water saturation, the relative permeability of the water phase gradually increases, while the relative permeability of the gas phase shows an exponential upward trend. This phenomenon may be due to the fact that, under high-water-saturation conditions, most of the pore space is filled with water, which restricts gas flow. As the water saturation decreases, the connectivity between pore spaces improves, resulting in more open channels for gas to flow. This is due to the reduced capillary forces holding the water within the pore throats, which allows gas to flow more freely through previously constricted pathways. This increase in gas flow capacity is directly related to the rapid increase in the relative permeability of gas.
As shown in
Figure 6, under the same water saturation conditions, an increase in displacement pressure led to a decrease in the relative permeability of gas, while the relative permeability of liquid increased. Taking Core 1 as an example, at a water saturation of 80%, the relative permeability of gas decreased by 70.98%, while the relative permeability of liquid increased by 251.51%. This phenomenon can be attributed to the fact that the higher displacement pressure allowed the gas to more effectively overcome the obstruction of capillary forces, thereby occupying a larger portion of the flow channel and altering the shape of the gas–liquid interface. At the same time, the flow channels for the liquid became narrower and more complex, leading to increased flow resistance. The combined effect of these factors ultimately resulted in a decrease in the gas relative permeability and an increase in the liquid relative permeability.
As the displacement pressure gradually increased, the irreducible water saturation tended to decrease. During the process of increasing from 2 MPa to 5 MPa, the irreducible water saturation of the six samples decreased by 7.21%, 7.39%, 12.06%, 13.05%, 19.69%, and 22.52%, respectively. This was because, as the displacement pressure increased, it was able to overcome the binding effect of capillary forces, thereby breaking the bound state of water and leading to a decrease in the saturation of bound water. However, when the displacement pressure increases, it tends to flow preferentially along the “dominant path” with the least resistance. Once these dominant channels are established and connected, the gas will mainly migrate within these channels rather than continue to penetrate into the water in the non-dominant paths. A large amount of water is left behind, forming residual water, which leads to the residual water remaining high even when the displacement pressure difference is increased.
Under the same displacement pressure, the higher the permeability of the core, the lower the saturation of bound water. Taking a displacement pressure of 5 MPa as an example, the irreducible water saturation of the six samples decreased to 72.63%, 71.04%, 65.08%, 64.03%, 56.71%, and 53.09%, respectively. This is because rocks with high permeability have larger and more connected pore networks, making it easier for gas to form continuous phases and occupy more space, while water becomes more confined to smaller pores. As permeability further increased, the distribution of water tended to become more uneven, gathering more in areas with lower permeability, thereby reducing the saturation of bound water.
3.2. Determination of Irreducible Water Saturation Endpoint Based on NMR Centrifugation Method
Figure 7 shows a comparison of the nuclear magnetic resonance (NMR) curves of six cores under saturated water and a centrifugal force of 3 MPa. It can be seen from the figure that the curves show a downward trend under centrifugal force, indicating that the water in the cores has been displaced. The curves of Cores 5 and 6 show a significant decrease after 10 ms, suggesting a high degree of water displacement in the macropores. The water saturation after centrifugation was calculated by the nuclear magnetic resonance curves before and after centrifugation, as shown in
Figure 8. As seen in
Figure 8, the water saturation of the cores gradually decreases with an increase in centrifugal force. At low centrifugal forces, the decrease in water saturation is slower because the initial displacement pressure is insufficient to overcome capillary forces, causing water to remain trapped in the pores. At higher centrifugal forces, water saturation decreases rapidly, indicating that the displacement pressure is sufficient to overcome capillary forces, leading to the expulsion of more water.
Under the same centrifugal force, as the permeability of the core increased, the water saturation decreased. For example, when the centrifugal force was 3 MPa, the water saturation of the six core samples was 60.58%, 58.56%, 52.21%, 48.83%, 43.28%, and 41.93%, respectively. Core samples with higher permeability were more sensitive to changes in water saturation due to their well-developed pore structures, which offered less resistance to fluid flow. As a result, water was more easily expelled under the same centrifugal force. In contrast, rock cores with lower permeability were less sensitive to changes in water saturation because their complex pore structures significantly hindered fluid flow.
3.3. Differential Analysis of Irreducible Water Saturation Using Different Methods
A comparison of the non-reducible water saturation of Sample 1 under centrifugation and displacement conditions is shown in
Figure 9. As seen in
Figure 9, centrifugation effectively reduces the irreducible water saturation of rock cores, with reductions of 16.56%, 17.56%, 19.77%, 23.74%, 23.69%, and 21.01%, respectively, across the six rock cores.
Figure 10 illustrates the distribution of pore water using both the non-steady-state displacement method and the centrifugal method. In tight sandstone reservoirs, formation water can be categorized into immobile bound water, mobile bound water, and mobile free water. Under displacement conditions, gas can form displacement channels, effectively displacing free water, which flows more easily through larger or smaller pores. However, water that is not easily displaced, such as that trapped in the reservoir rock surface, pore fissure corners, and microcapillary pores, remains difficult to remove. While the centrifugal method efficiently expels water from tight pores, the non-steady-state displacement method struggles to remove water from smaller pores and pore corners, where water remains trapped due to strong capillary forces. Furthermore, centrifugal action overcomes the adhesion forces between the rock surface and water, allowing the water to be expelled more quickly; the results are in agreement with the findings of Wang [
26]. Despite this, some water remains trapped on the rock surface, in the corners of the pores, and in microcapillary channels, where strong adhesion forces between the water and rock prevent its expulsion. Taking Core #1 as an example, the actual irreducible water saturation (S
wc) obtained using the 3 MPa centrifugation method shows a significant shift to the left on the phase permeability curve, compared to the critical water saturation (S
wcrit) measured by the unsteady state method under a displacement pressure difference of 5 MPa.
4. Discussion
The non-steady state displacement experiment is effective in measuring the critical irreducible water saturation under different displacement pressure differentials. However, it does not fully capture the actual irreducible water saturation of the core, as laboratory conditions may not entirely replicate reservoir conditions. To ensure a phase permeability curve that accurately represents the permeability characteristics of the entire reservoir, it is essential to apply endpoint corrections to relative-permeability curves. This study employs the Stone equation for gas–water systems within tight sandstone reservoirs, building on the empirical model proposed by Baker et al. [
24] for sandstone and mudstone. The Stone equation is particularly suitable for modeling relative permeability in tight sandstone reservoirs as it accounts for gas–water phase interactions while eliminating the influence of oil. In the gas–water system, the oil phase does not exist, that is, S
o = 0, the residual oil saturation is 0, and the terminal permeability symbols of the water phase and the gas phase are adjusted to the standard representation forms of the gas–water system, K
rwirg and K
rgcl. And the total saturation satisfies S
w + S
g = 1. Bound water saturation (S
wc) and residual gas saturation (S
gcrit) have become the dominant parameters. Based on experimental observations and numerical fitting, the following parameters were determined (water phase index
Nw = 1.5 and gas phase index
Ng = 2.5). These values reflect the pore structure and fluid distribution within the cores and are crucial for normalizing the relative-permeability curves. The relationship between the water and gas phases was analyzed, leading to the following equation:
where K
rwirg and K
rgcl are the water phase permeability under residual gas and gas phase permeability under bound water, and N
w and N
g are the water phase index and gas phase index, respectively. These two parameters are determined by the pore structure of the rock. By using the interpolation method to continuously fit the normalized curve, the curvature of the experimental gas–water two-phase permeability curve is made to be the same as that of the normalized curve, and the fitting value in the experiment was N
w = 1.5, N
g = 2.5.
The relative-permeability curves of gas and water for different samples exhibit variations in terms of irreducible water saturation, residual gas saturation, the number of experimental data points, and the corresponding water saturation. Consequently, it is not feasible to directly use the curve of any single sample type as a comprehensive permeability curve that represents all samples. To address this issue, the normalization of these curves is required.
The relationship between irreducible water saturation and residual gas saturation was derived by fitting data from different permeability cores and displacement pressure differentials, as shown in
Figure 11 and
Figure 12. The corresponding expressions for displacement pressure difference, irreducible water saturation, and residual gas saturation are presented in Formulas (8) and (9).
The fitting coefficients (a, b, c, and d) were determined through regression analysis of experimental data, ensuring that the derived models accurately represent the irreducible water saturation and residual gas saturation for each core sample, as shown in
Table 4.
In order to study the influence of different permeability cores on irreducible water saturation and residual gas saturation, the relationship between coefficients a, b, c, and d in Equations (8) and (9) and permeability was fitted as shown in
Figure 13. The mathematical models of irreducible water saturation and residual gas saturation with permeability and displacement pressure difference were obtained, as shown in Equations (10) and (11).
The irreducible water saturation and residual gas saturation at different pressure differentials under reservoir permeability can be calculated using Equations (4) and (5). The resulting phase permeability curves are then normalized using Equations (6) and (7), with the normalized phase permeability curves shown in
Figure 14.
To validate the accuracy of the proposed normalization method, a comparison was conducted with existing normalization models, including the Jone Park J model and Corey model. The result is shown in
Figure 15. The K
rg values in the Jone Park J model exceed 1, and the K
rw values in the Jone Park J and Corey models fall below 0, both of which introduce significant errors. These discrepancies indicate that these models are not suitable for characterizing the gas–water relative permeability of high-water-content tight sandstone reservoirs. In contrast, the proposed normalization approach effectively eliminates inconsistencies across different samples and ensures a standardized representation of the reservoir’s permeability characteristics. This study established a robust normalization method for the gas–water relative-permeability curve of high-water-content tight sandstone gas reservoirs, which improved the accuracy of reservoir characterization and development planning. The normalized relative-permeability curve can be integrated into reservoir simulation models to more accurately predict fluid flow behavior and reservoir performance. This is crucial for optimizing development strategies such as well spacing, production rate, and injection schemes, which can help to improve gas recovery and reduce operating costs.


