Abstract
Remote island regions often depend on isolated power grids dominated by small-scale thermal power plants. Decarbonizing these systems is challenging due to limited interconnection capacity and variable renewable output, highlighting the need for flexible resource balance. This study develops an optimization model that minimizes system costs and CO2 emissions by integrating variable renewable energy and Vehicle-to-Grid (V2G) while considering the minimum-output constraints of thermal power generation. The model is applied to Tanegashima Island, Japan. The results demonstrate that all optimized scenarios reduced the cost and emissions compared with the baseline. In the cost-minimizing scenario, the total annual cost decreased from 2.81 to 2.46 billion yen, while CO2 emissions decreased from 56.5 to 44.4 kt. In the CO2-minimizing scenario, V2G further reduced emissions to 43.8 kt at a lower cost (2.54 billion yen) than the system without V2G. However, renewable curtailment remained high due to the minimum-output constraint of thermal generators. These findings confirm that while V2G is a cost-effective, distributed flexibility resource, it cannot fully eliminate renewable curtailment under current operational limits. Enhanced coordination, behavioral engagement, and complementary measures—such as relaxing thermal constraints and expanding storage—are required to unlock its full potential in isolated power systems.
1. Introduction
The global push for decarbonization, which is driven by international climate change mitigation frameworks such as the Paris Agreement, necessitates a large-scale structural transformation of the energy sector. The IPCC WG3 [] states that to achieve the 1.5 °C target, it is fundamental to adopt certain transformations, including decarbonization, significant improvements in energy efficiency, widespread electrification, and the expansion of renewable energy. The International Energy Agency (IEA) [] emphasizes the need for accelerated investment in renewable energy and infrastructure development.
The expansion of renewable energy is indispensable for achieving decarbonization. According to the IEA [], global solar and wind power capacity has doubled over the past five years, establishing renewable energy as the primary means of decarbonization in the power sector. In island regions with small, isolated power grids, introducing renewable energy can reduce greenhouse gas emissions, decrease dependence on fuel imports, and enhance regional energy self-sufficiency.
However, variable renewable energy (VRE) sources, such as solar and wind power, whose output depends on weather conditions, pose significant challenges due to their inherent fluctuations. In power grids, time mismatches between supply and demand must be addressed, as insufficient balancing capacity makes renewable curtailment increasingly evident []. Large-scale curtailment has become routine in several regions of Japan, including the Kyushu Electric Power Company service area, during spring and autumn when demand is low. This trend is particularly pronounced in remote islands with limited grid connections [].
Thermal power generation coordinated with renewable energy faces technical and operational limitations, such as minimum-output constraints (minimum load). Diesel power generators are widely adopted as the primary power source on isolated islands with independent power systems, and a minimum-output level must be maintained to ensure equipment stability. These minimum-output constraints prevent the power generation output from being reduced to zero during periods of low demand and high renewable energy output, thereby increasing the likelihood of renewable energy curtailment. In response, measures are being sought to enhance the flexibility of power supply in island regions, such as the optimization of existing thermal power plant operations and the introduction of new balancing resources [].
Consequently, Vehicle-to-Grid (V2G) technology has been increasingly studied as a potential solution for enhancing grid flexibility. V2G manages VRE fluctuations using electric vehicles (EVs) batteries as distributed resources that bidirectionally exchange power with the grid. In recent years, the global adoption of EVs has progressed rapidly, and the IEA [] predicts that by 2030, EVs will constitute nearly half of all new car sales globally. Typically, EVs are parked most of the time, and they can function as practical batteries by bidirectionally exchanging electricity with the grid []. Furthermore, V2G enables ancillary services, such as frequency regulation, voltage control, and reserve power supply, thereby expanding the potential of EVs as distributed energy resources [].
Although several studies have demonstrated the technical feasibility of V2G, its actual performance is highly context dependent. The effectiveness of V2G in mitigating renewable curtailment depends on factors such as EV penetration rates, usage patterns, battery degradation, charging/discharging infrastructure, and the overall supply–demand structure of the system. If the operational goal is to minimize costs or CO2 emissions rather than fully maximizing renewable energy, output suppression may occur. Therefore, a realistic evaluation framework that does not necessarily treat output suppression avoidance or VRE maximization as constraints is required.
Building upon these operational challenges, V2G research has evolved from technical feasibility toward integrated analyses that combine technical, economic, and policy dimensions. Recent reviews have emphasized the importance of linking these dimensions. For instance, Lei et al. [] and Comi et al. [] provide comprehensive overviews that systematize V2G research across technical, market, and policy perspectives. Similarly, Zhang et al. [] and Giannelos et al. [] extended these discussions by reassessing the life-cycle cost and reliability implications of V2G integration. Collectively, these reviews highlight that while V2G technologies can significantly reduce carbon emissions and enhance grid flexibility, actual implementation depends heavily on market design, carbon pricing mechanisms, and user participation incentives.
Previous studies can be broadly categorized into three interrelated layers:
- Technical and optimization models that assess V2G’s impact on grid operation and flexibility (e.g., Amiruddin et al. []; Taliotis et al. []);
- Regional implementation studies that evaluate V2G in specific islands or urban contexts (e.g., Dominković et al. []; Raveendran et al. []);
- Economic and policy frameworks that explore electricity market participation and carbon trading (e.g., Lei et al. []; Zhang et al. []).
The impacts of V2G vary considerably across regions due to geographical and socioeconomic factors. For example, Geng et al. [] demonstrated that regional energy mixes significantly alter the net CO2 outcomes of V2G operation. Steinbach et al. [] highlighted that socioeconomic factors—such as income and vehicle ownership—affect the cost distribution and equity of grid reinforcement. These contextual differences strongly influence the feasibility and effects of V2G implementation; however, comparative discussions across different socioeconomic conditions remain limited.
Within this broader context, several studies have investigated the potential of V2G specifically in island power systems. For example, Amiruddin et al. [] conducted a scenario analysis of Indonesia’s power system to examine the impact of EV adoption rates and charging patterns on renewable energy adoption rates, CO2 emissions, system costs, and battery storage requirements. Their findings demonstrated that V2G effectively promotes renewable energy adoption and reduces CO2 emissions. Similarly, Taliotis et al. [] evaluated the impact of V2G on renewable energy adoption rates, CO2 emissions, and grid costs for a projected 2035 energy system for the island of Cyprus. Dominković et al. [] assessed the role of V2G in ensuring grid stability to support high renewable energy adoption rates in Caribbean islands. Raveendran et al. [] evaluated the potential for EVs to provide ancillary services through V2G, albeit using a nonlinear programming model, to mitigate solar power fluctuation on the island of Menorca, Spain.
Previous studies have positioned V2G as a promising solution for enhancing flexibility and decarbonization on islands; however, several studies have not explicitly set the minimum-output limit of thermal power plants. Thermal power plants generally have a lower limit on their rated output, and failing to consider this can lead to an overestimation of VRE adoption or an underestimation of the grid stabilization effects of V2G. Previous studies also analyzed regions with a stable peak power demand of approximately 100 MW. In contrast, remote islands with small populations and limited industries have low peak power demand and less energy system redundancy. Consequently, the grid response and introduction potential for VRE and V2G in these fragile systems may differ from those in previous studies. Previous studies have often evaluated the timing of EV charging and discharging, which is critical for V2G operations, based on predefined scenarios, resulting in limited insights into user behavior.
This study focuses on Tanegashima Island, Japan, a small-scale, isolated power system with no interconnections to the mainland. The island’s economy is predominantly agricultural, and industrial or commercial demand remains limited, resulting in a relatively small overall electricity consumption. The warm and humid subtropical climate of the island creates considerable seasonal variation in electricity demand. Unlike metropolitan regions with diversified demand structures and market-based balancing mechanisms, Tanegashima exhibits low-demand elasticity, a strong dependence on diesel generation, and minimal opportunities for energy trading or demand-side management. Consequently, its geographical, climatic, and socioeconomic characteristics make Tanegashima a representative case study for examining the operational potential of V2G in small, agriculture-based, stand-alone island systems, where grid flexibility and market incentives are structurally constrained.
This study is primarily positioned within the technical modeling domain; it also bridges economic and institutional discussions by explicitly incorporating real-world operational constraints—such as the minimum-output limits of thermal units—often overlooked in market-based analyses. Therefore, this study bridges the gap between global V2G analyses and localized implementation by developing a linear programming model for island power systems that explicitly considers these operational and socioeconomic constraints. The framework provides a realistic assessment of how V2G can enhance both decarbonization and system flexibility in small-island contexts.
2. Methodology
2.1. Study Area
Tanegashima, an island in the Kyushu region of Japan, was selected as the study area (Figure 1). It is a long and narrow island stretching approximately 60 km from north to south, characterized by a warm and humid subtropical climate, which results in significant seasonal fluctuations in electricity demand. Agriculture is its main industry; however, in recent years, the population has been aging and declining. Owing to these demographic and industrial changes, the overall electricity demand—particularly during the daytime—has gradually decreased, reducing the demand-side flexibility of the island. The island has an independent power grid that is separate from Japan’s four main islands, and its primary power source is diesel engines. The island also hosts the Tanegashima Space Center (TNSC), a rocket launch facility operated by the Japan Aerospace Exploration Agency (JAXA). The TNSC maintains a dedicated power system that is independent from the island grid because its mission-critical operations; thus, it is excluded from the analytical scope of this study. Because of the island setting, generation costs are higher than those on the mainland, and solar photovoltaics (PV) have spread rapidly owing to expectations for renewable energy adoption. The peak electricity demand is approximately 25 MW in 2025. However, due to population decline and changes in the industrial structure, daytime demand has decreased, resulting in a time mismatch between supply and demand. Consequently, Japan’s first renewable energy output curtailment was implemented in May 2015, which continues to date [].
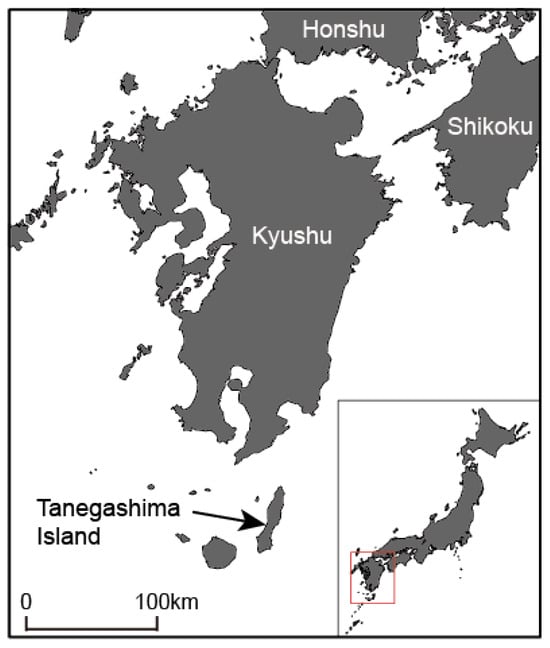
Figure 1.
Location of Tanegashima Island in the Kyushu region of Japan. (The inset map shows the position of Kyushu within Japan, highlighted by the red box).
In addition, residents rely heavily on private vehicles due to insufficient public transportation, resulting in a household vehicle ownership rate of 1.57 vehicles per household, which is higher than the national average. In recent years, the number of EV charging stations on the islands, some of which are powered by solar energy, has increased. Thus, Tanegashima is an ideal location for exploring systems that combine renewable energy with V2G. Furthermore, Tanegashima represents a typical small-scale, independent island power system characterized by low-demand elasticity and high renewable variability. These geographical and socioeconomic characteristics make it a representative case for examining the realistic operational potential of V2G under local conditions, which are often overlooked in global analyses.
2.2. Model Construction
In this study, a linear programming model was constructed to minimize the annual total system cost and CO2 emissions for the projected 2050 Tanegashima power system (Table S1). The mathematical programming problem was solved using MATLAB R2025a®, with a year defined as 365 days divided into 8760 1-h intervals. The target year 2050 was selected because the Government of Japan and local municipalities in Tanegashima have declared their commitment to achieving carbon neutrality by 2050. By that time, the diffusion of EVs—a key enabler of V2G—is also expected to reach near 100% of private passenger cars, providing sufficient penetration for evaluating the potential system-level impacts of V2G deployment. The optimal solution was determined by predicting electricity demand and power generation for Tanegashima in 2050 from various sources and considering the following components: power sources (thermal (diesel), solar PV, and wind power), storage systems (batteries and V2G), and decision variables (installed capacity, generation output, and charging/discharging volume). Figure 2 provides an overview of the model.
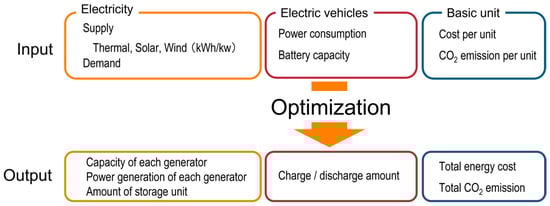
Figure 2.
Overview of the optimization model used in this study.
2.2.1. Objective Function
The objective function minimizes the total annual system cost or CO2 emissions and is expressed as follows:
where TC denotes the annual total system cost or annual total CO2 emissions, pfi denotes the capital cost (yen/kW·year) or embodied CO2 emissions (kg/kW·year) for power plant I, pvi denotes the operating cost (yen/kWh) or operational CO2 emissions (kg/kWh) for power plant I, pfsj denotes the capital cost (yen/kWh·year) or embodied CO2 emissions (kg/kWh·year) for storage system j, Copj denotes the operation-related marginal cost (yen/kWh) for storage system j, including battery degradation and incentive payments to EV users, Cemsj denotes the fixed annual cost (yen/EV·year) for V2G system operation and communication energy management system and virtual power plant (EMS/VPP), which applies only to V2G (j = 2), Xi,d,t denotes the generation output (kW) of power plant i on day d at hour t, Ki denotes the installed capacity (kW) of power plant i, and Skwhj denotes the capacity (kWh) of storage system j. The model comprises three power plants: thermal, solar, and wind (i = 1–3), and two storage systems: battery and V2G (j = 1–2).
2.2.2. Constraints
Based on the optimal generation mix model developed by Komiyama et al. [], which analyzes the integration of VRE and battery storage, we imposed supply–demand balance, capacity, and minimum-output constraints. Additionally, we introduced our own V2G charge/discharge balancing, hourly V2G power limits, and minimum V2G state-of-charge (SOC) constraints. The principal constraints employed were as follows:
- Supply–demand balance constraint;
The demand comprises the electricity needs of customers in Tanegashima plus battery and EV charging, whereas the supply comprises thermal, solar, and wind generation plus discharge from batteries and EVs. The curtailment term Curtd,t represents the amount of renewable generation that cannot be used because of surplus supply. This equation ensures that total supply matches demand plus renewable curtailment at each time step, with Curtd,t ≥ 0 for all d, t.
- Reserve margin constraint;
The value follows the operational standard of the Kyushu Electric Power area, which serves as a realistic reference for Tanegashima’s grid configuration [].
- Minimum thermal output constraint;
This constraint represents the minimum output required for thermal generators to maintain a stable operation. To ensure equipment stability, thermal generators must maintain at least 50% of their rated output []. Because the installed capacity is a decision variable in our model, we set the minimum output to 50% of the base-load demand (Table S1).
- Charge–discharge balance constraint;
This constraint governs the charging and discharging of batteries and V2G, considering the self-discharge and efficiency losses. Following Komiyama et al. [], the self-discharge rate was set at 0.001 per hour, and the efficiency of the round-trip was assumed to be 0.9 (Table S2).
- EV SOC lower limit constraint;
The model represents the aggregated behavior of all EVs on the island rather than tracking individual vehicles. Battery SOC varies among EV users. However, based on proprietary data provided by a domestic charging-station operator, Japanese EV users typically initiate charging when the SOC falls below approximately 50% and fully charge their vehicles before departure. Therefore, the SOC range was constrained between a minimum of 50% and a maximum of 100% of the total EV battery capacity (Table S1). Because Tanegashima is a relatively small island, this range is sufficient to meet most daily mobility needs and represents a realistic assumption for local EV operation.
- EV charge–discharge power limit constraint;
The maximum hourly charging/discharging power per EV was set to 7 kW, which corresponds to the performance of typical single-phase AC chargers commonly used in Japanese households. Because the model represents aggregated EV behavior, the total charge–discharge capacity at each time step was defined as the product of this unit capacity and the number of EVs connected to the grid.
2.3. Input Data
- Electricity demand and supply forecast;
In this study, the total hourly electricity demand is defined as the sum of baseline demand (excluding EV-related consumption) and EV-related electricity consumption. These two components were calculated separately and then aggregated hourly because the estimation procedures differ. The baseline electricity demand data for Tanegashima are not publicly available. Therefore, we recalculated the hourly baseline demand with monthly and weekday/weekend classifications using the methods of Kikuchi et al. [] and Igarashi et al. [] (Table S1). EV-related electricity consumption was estimated following the approach outlined in the vehicle-related forecast subsection of Section 2.3, and incorporated into the hourly demand after separate computation.
The power supply was considered to be diesel, solar PV, and wind generation. Diesel generation was calculated from the installed capacity; solar PV was determined from the installed capacity, solar irradiance, and temperature based on JIS C 8907:2005; and wind generation was computed from the wind speed and power curve of the HTW2.0 80 turbine [,] (Table S1).
- Vehicle-related forecast;
The total EV battery capacity in Tanegashima in 2050 was estimated by projecting the number of private passenger vehicles in proportion to the population decline, based on the 2024 National Institute of Population and Social Security Research []. Hourly electricity consumption was estimated from traffic survey data provided by Kikuchi et al. [] and the Ministry of Land, Infrastructure, Transport, and Tourism [] (Table S1). In addition, charging behavior was derived from aggregated and anonymized data provided by a domestic EV charging-station operator. The model represents the aggregate behavior of the EV fleet by averaging typical daily charging and discharging patterns across the dataset rather than tracking individual vehicles.
- Energy cost and CO2 emission settings;
Table 1 lists the capital and operating costs, as well as CO2 emission factors, for each generation and storage system. These parameters were based on data from previous studies and official statistics [,,,,,,,,,,,]. In this study, we evaluated costs in Japanese yen and CO2 emissions in kg-CO2. For the V2G system, the capital cost consists of the EMS and VPP costs (JPY/EV·year), while the operating cost comprises the battery degradation cost and user incentive payment [,,] (Table S2).

Table 1.
Energy costs and CO2 emissions used in this study.
3. Results
3.1. Overview of Optimization Results
Table 2a,b summarize the optimization results for the five simulation models. “Model 0” represents the 2050 baseline scenario, assuming no additional renewable deployment and V2G integration. “Models 1” and “2” minimize the total annual system cost with and without V2G, respectively, whereas “Models 3” and “4” minimize annual CO2 emissions without and with V2G, respectively.
Table 2.
(a). Optimization results for cost, emission, and power plant capacity. (b). Optimization results for thermal power generation, battery discharge, V2G charging/discharge, and curtailment.
All optimized models achieved lower total system costs than Model 0, confirming the benefit of optimizing renewable and storage capacities under the 2050 demand and full-EV assumptions common to all scenarios. The lowest total cost was obtained in Model 1, whereas Model 4—targeting CO2 minimization with V2G—achieved the lowest emissions while still maintaining a lower total cost than both Models 0 and 3. Model 2 demonstrated a slightly higher cost than Model 1 due to the inclusion of EMS/VPP capital costs; however, its emissions were lower than those of Model 1, indicating that V2G provides modest environmental benefits even when its additional costs are considered.
Thermal power capacity converged near a lower bound of approximately 8–10 MW across all optimized models. Solar PV capacity reached approximately 36–37 MW in the cost-minimizing models, whereas the wind capacity expanded substantially in the CO2-minimizing cases. The stationary battery capacity varied significantly depending on the objective function: it was large in Model 3 but much smaller in Model 4, indicating that under CO2 minimization, V2G partially substitutes for stationary batteries.
The annual thermal power generation decreased from 70.0 GWh in Model 0 to approximately 52–54 GWh in the optimized models; however, the differences among the optimized cases were small. Battery discharge was moderate in cost-minimizing cases and highest in Model 3, whereas Model 4—despite its small stationary battery—achieved additional system flexibility through V2G operation, with 5 GWh of discharging and 24 GWh of charging. These results indicate that V2G can function as a distributed storage resource even when its overall capacity is small.
However, renewable energy curtailment increased with greater renewable deployment. Although V2G slightly reduced curtailment under the cost-minimizing setting, it did not eliminate it.
Overall, the optimization results demonstrate that all scenarios with flexible optimization achieve both cost and emission reductions compared to the fixed-capacity baseline. Although the inclusion of EMS/VPP costs makes V2G slightly more expensive in the cost-minimizing case, it provides measurable emission benefits and substitutes for stationary batteries in the CO2-minimizing configuration.
3.2. Energy Cost and CO2 Emissions
Figure 3 shows a breakdown of the annual system costs for each model. In all models, thermal generation operating cost accounted for a large share of the total cost. Optimization of renewable and storage capacities substantially reduced overall system costs compared to the benchmark, mainly through decreased fuel consumption and increased utilization of solar and wind power. However, only small differences were observed between the operating costs of Models 1–4.
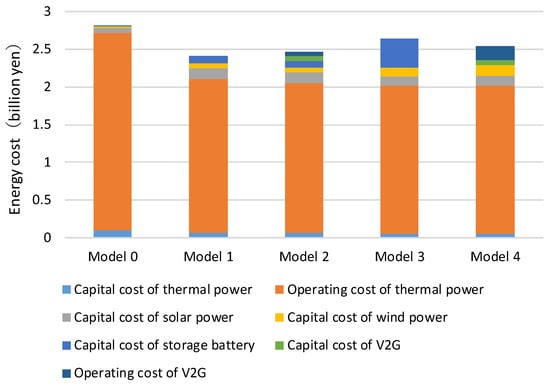
Figure 3.
Breakdown of annual energy costs for each model.
Model 2, which incorporates V2G under the cost-minimizing condition, showed a slightly higher total cost than Model 1 because of additional EMS/VPP capital and degradation-related costs. However, lower thermal fuel expenditures partially offset these costs. In the CO2-minimizing cases, the total costs increased moderately as the wind capacity expanded, but Models 3 and 4 remained less expensive than the baseline. Model 4 achieved the lowest emissions at a total cost of 2.54 billion yen, demonstrating that additional CO2 mitigation through V2G can be realized at a relatively small incremental cost. The differences in total costs among Models 1–4 were modest, indicating that the system has reached a near-optimal balance between renewable investment and thermal operation. A more detailed discussion of installed capacities and thermal generation behavior is provided in Section 3.3.
Figure 4 shows the breakdown of annual CO2 emissions for each model. Thermal generation accounts for most annual CO2 emissions, primarily from fossil fuel consumption during power generation. The total annual emissions decreased from 56.5 kt CO2 in Model 0 to approximately 44–45 kt CO2 in the optimized cases. These differences primarily resulted from variations in renewable energy and storage capacities among the optimized models. The lowest value, 43.8 kt CO2, was obtained in Model 4, confirming the additional emission reduction potential of V2G integration. The introduction of V2G consistently improved system performance by enhancing flexibility and enabling more effective use of renewable energy. However, similar to the total system cost, the differences in emission reductions among Models 1–4 were limited, which also resulted from the lower-bound constraint on thermal generation, as discussed in Section 3.3.
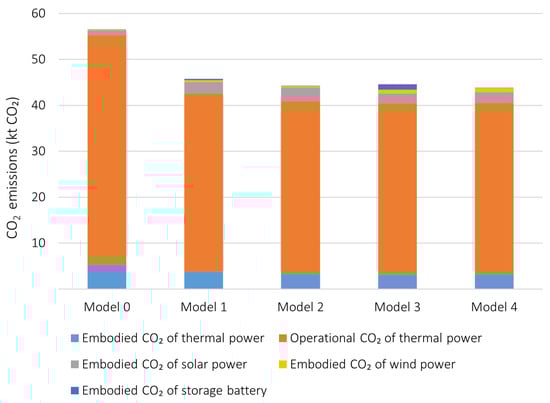
Figure 4.
Breakdown of annual CO2 emissions for each model.
3.3. Installed Capacity and Thermal Generation Operation
The installed thermal capacity was the lowest in Models 3 and 4; in this respect, the CO2 minimization models reduced the reliance on thermal generation and maximized the use of renewables. In contrast, Model 1 retained a slightly larger thermal capacity (10 MW) because, under cost minimization, the model sought to increase solar PV—the least-cost generation source—but the high variability of PV required maintaining sufficient thermal and storage capacity for system stability. Model 2, which also minimizes the total cost but includes V2G, reduces the thermal capacity to 8.8 MW and relies on V2G operation to provide flexibility at a lower capital cost than stationary batteries. In this configuration, V2G utilization was limited to levels that avoided excessive degradation and incentive costs, while a smaller stationary battery complemented its operation. A comparison of models with and without V2G revealed that the non-V2G cases (Models 1 and 3) had more varied thermal capacity decisions than the V2G cases (Models 2 and 4). In the non-V2G models, the thermal capacity differed according to the optimization objective—approximately 10 MW in Model 1 under cost minimization and 8 MW in Model 3 under CO2 minimization. In contrast, in the V2G models, thermal capacity consistently converged to approximately 8 MW, indicating that the inclusion of V2G stabilized capacity planning and that the lower-bound constraint on thermal generation became binding in both optimization settings, as discussed in Section 3.2.
The PV installed capacity was the highest in Model 2, implying that costs would be minimized. As PV was the cheapest generation source in this scenario, it was introduced in large quantities. The PV installed capacity was the highest in Model 2, consistent with the cost-minimizing objective, whereas the wind capacity expanded markedly in the CO2-minimizing cases (Models 3 and 4). These tendencies reflect the differing drivers of optimization: the high fuel cost of thermal generation favors low-cost PV in Models 1–2, whereas the high carbon intensity of thermal power promotes wind deployment in Models 3–4. In all optimized models, renewable capacities more than doubled the current levels, supported by higher electricity demand from full-EV adoption and increased fossil fuel costs projected for 2050.
Across all optimized cases, the installed capacities of batteries and V2G were determined primarily by the supply–demand balance constraint, rather than by the curtailment of surplus generation, since the model imposed no explicit penalty on renewable output control. Although both batteries and V2G absorbed excess renewable power to the maximum extent allowed by system conditions, the large renewable penetration under cost and CO2 minimization led to substantial curtailment that could not be fully mitigated. Conversely, under the present level of renewable deployment (Model 0 conditions), the same mechanisms suggest that introducing V2G could effectively reduce renewable output curtailment.
Examining the thermal generation output showed that Model 0 fixed the renewable capacity and supplemented the increased EV demand with thermal generation, resulting in a higher thermal output. Model 0, with fixed renewable capacities, compensated for the additional EV load mainly through thermal generation, resulting in the highest annual thermal output (70 GWh). In the optimized cases (Models 1–4), the total thermal generation converged to approximately 52–54 GWh, confirming that the minimum-output constraint was binding throughout most of the year. This finding explains why the total system cost and CO2 emissions differed only slightly among Models 1–4. Figure 5 shows the monthly proportion of hours during which the thermal generators operated at the minimum output. In Models 2–4, more than 90% of the hours were at minimum, except in December when winter meteorological conditions reduced the PV output and increased thermal generation. Consistent with the PV-dominant resource mix, this seasonal pattern indicates that further CO2 reduction would require technological or regulatory measures to relax the minimum output constraint of thermal units.
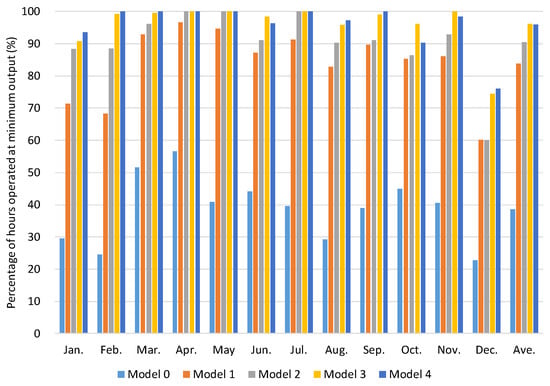
Figure 5.
Monthly proportion of hours operating at minimum thermal output for each model.
3.4. V2G Operational Characteristics
Figure 6 shows the V2G charging, discharging, and electricity demands on April 15 in Model 4. Charging mainly occurred during the daytime, particularly between 08:00 and 16:00 when PV generation was high, while discharging was concentrated in the early morning (around 02:00–07:00) and evening (around 17:00–23:00). This pattern indicates that V2G functioned as a flexible balancing resource by absorbing surplus renewable power during the daytime and supplying electricity during periods of high demand, particularly in the early morning and evening, when solar generation declines.
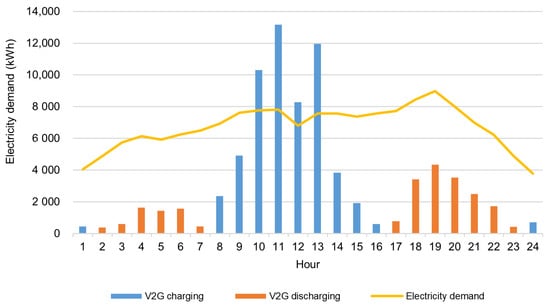
Figure 6.
Time series of V2G charging/discharging and power demand on 15 April of Model 4.
Figure 7 summarizes the frequency of V2G charging and discharging events by hour of day, based on the full-year optimization results. The charge or discharge ratio represents the proportion of days within a year (365 days) when charging or discharging occurred during each hour. In both cost- and CO2-minimizing cases, charging occurred mainly during 08:00–13:00 and 14:00–17:00, when solar generation was high and electricity demand was relatively low, and again during midnight hours (00:00–03:00), corresponding to periods of strong wind output and weak demand. This indicates that V2G absorbed surplus renewable energy during low-demand hours, contributing to system balancing.
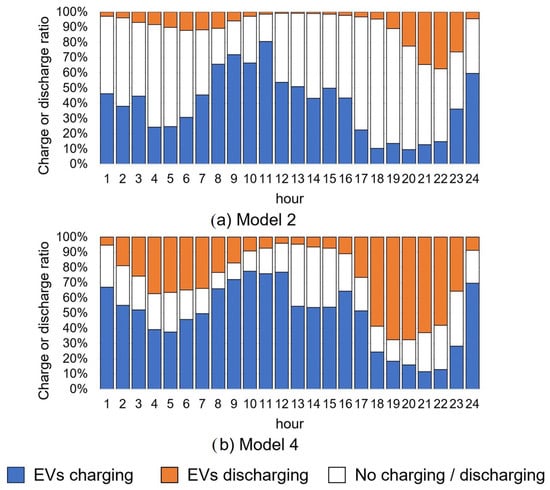
Figure 7.
Time of day distribution of V2G charging/discharging days.
The main difference lay in the discharge behavior: Model 2 discharged primarily during 05:00–08:00 and 18:00–22:00, but less frequently overall due to the additional costs of degradation and incentives, whereas Model 4 discharged more actively between 03:00–07:00 and 17:00–22:00, regardless of such costs, in pursuit of emission reduction. In Model 4, the discharging frequency exceeded 0.6 during 18:00–21:00, indicating that V2G effectively replaced thermal generation during the evening peak.
3.5. Sensitivity Analysis
To evaluate the robustness and practical applicability of the optimization framework, a simplified sensitivity analysis was conducted. Table 3 summarizes the tested parameters and their ranges. These ranges were chosen to reflect realistic technological and economic uncertainties expected in 2050, including possible improvements in thermal generation efficiency, variations in renewable investment costs, and future reductions in V2G- and battery-related costs. Each case was optimized independently under modified assumptions, keeping other parameters fixed.
Table 3.
Sensitivity analysis parameters and tested ranges.
Specifically, SA-1 relaxed the lower-bound constraint on thermal generation (50 → 30% of the peak load); SA-2 decreased the operating cost of thermal power to the 2015 actual level (24.7 yen/kWh); SA-3 increased the capital cost of PV and wind to 1.7 times the baseline, based on METI’s 2030 projection []; SA-4 reduced the annual EMS/VPP cost for V2G by 50%; and SA-5a/b varied the incentive unit price for V2G operation to one-half (8.3 yen/kWh) and double (33.2 yen/kWh) of the baseline. Table 4 summarizes the optimization results for each case.
Table 4.
(a). Results of sensitivity analyses for the cost-minimizing cases. (b). Optimization results for thermal power generation, battery discharge, V2G charging/discharge, and curtailment.
The relaxation of the minimum output constraint on thermal generation (SA-1) produced the largest impact among all parameters. Thermal output decreased significantly, solar capacity increased to approximately 1.3–1.4 times its baseline value, and wind capacity approximately doubled. Consequently, total CO2 emissions dropped from 45.8 kt CO2 to 34.9 kt CO2 in Model 1 and from 44.4 kt CO2 to 32.1 kt CO2 in Model 2. System costs also markedly declined, demonstrating that the thermal lower-bound constraint is the most influential factor limiting further decarbonization and cost reduction in this system.
When the operating cost of thermal generation was reduced to the actual 2015 level (SA-2), renewable deployment decreased and thermal reliance increased. As a result, CO2 emissions rose to 49.6 kt CO2 in Model 1 and 46.6 kt CO2 in Model 2. Model 2 nevertheless achieved a lower total cost (1.76 billion yen) by leveraging V2G flexibility to efficiently maintain the supply–demand balance. This suggests that the V2G-based configuration remains cost-competitive even under lower fuel-cost conditions.
According to METI’s 2030 projection (SA-3), increasing the capital costs of PV and wind by a factor of 1.7 led to moderate declines in renewable capacities and slightly higher CO2 emissions, reaching 45.0 kt CO2 in Model 2. However, the total annual costs increased by less than 0.13 billion yen, indicating that the cost-minimizing configuration with V2G remains economically robust even under less favorable renewable-cost assumptions.
Halving the annual EMS/VPP cost for V2G (SA-4) produced only marginal changes in total system cost and virtually no change in generation or storage capacities. Because this cost component represents a small portion of the total annual expenditure, its impact on overall optimization results was limited.
When the incentive for V2G participation was halved or doubled (SA-5a and SA-5b), total system cost changed modestly in proportion to the incentive level, while CO2 emissions remained nearly constant. In SA-5a, the lower incentive reduced total costs and slightly increased V2G discharge, whereas in SA-5b, the higher incentive raised total costs to 2.47 billion yen but did not significantly alter generation dispatch. These results indicate that the incentive cost primarily affects operational expenditures rather than the overall system configuration.
Among all tested parameters, the thermal lower-bound constraint exerted the strongest influence on both cost and emission outcomes. In contrast, variations in V2G-related costs had only limited effects on system performance, implying that the economic rationale for V2G integration is robust across assumptions. Even when renewable or thermal cost conditions were substantially varied, the V2G-enabled model (Model 2) consistently achieved lower emissions with comparable or lower total system cost relative to the non-V2G model (Model 1).
4. Discussion
4.1. Interpretation of the Main Results
This section interprets the main findings of Section 3, focusing on the influence of V2G integration on system cost, CO2 emissions, and operational flexibility under isolated island conditions.
In the cost-minimizing case (Models 1 and 2), the introduction of V2G slightly increased total system cost because of additional EMS/VPP and incentive-related expenses. However, it simultaneously reduced CO2 emissions by lowering thermal generation. In the CO2-minimizing case (Models 3 and 4), V2G achieved lower total cost and emissions than the non-V2G model. These results demonstrate that V2G enhances system efficiency when decarbonization is prioritized.
All supply–demand balancing must be internally achieved under isolated island conditions without interconnection to mainland grids. Thermal generators must maintain a minimum output to ensure grid stability, which restricts renewable expansion and increases curtailment. Both optimization settings reached a similar operational limit in which the minimum-output requirement constrained renewable deployment. Consequently, substantial renewable curtailment remained, exceeding the absorption capacity of the available battery and V2G capacities. Sensitivity analysis confirmed that the minimum-output constraint of the thermal generator was the dominant factor limiting further cost and emission reductions. Relaxing this constraint reduced both system cost and emissions, indicating that enhancing supply-side flexibility is essential to complement the balancing role of V2G.
While V2G provides a cost-effective means to improve system flexibility, its full potential is contingent on implementing measures that relax thermal constraints or introduce additional large-scale demand and storage technologies. These technological pathways are examined in Section 4.2.
The optimization results also revealed distinct temporal patterns in V2G operation, with charging and discharging aligned with renewable generation and demand variations. These patterns represent an aggregated system-level optimization rather than the behavior of individual EV users. The model does not account for each vehicle’s SOC, departure constraints, or uncertainties in user participation. Therefore, the practical realization of this optimal V2G operation depends on behavioral responses and effective policy design, as discussed in Section 4.3.
4.2. Technological and Policy Pathways for Deeper Decarbonization
The optimization results demonstrate that V2G integration can reduce both cost and CO2 emissions in isolated island systems. However, significant renewable curtailment remained due to the minimum-output constraint of thermal generators and the limited capacity of short-term storage. This outcome reflects the structural characteristics of island grids such as Tanegashima, where supply–demand balancing must be achieved internally without interconnection to the mainland. The main challenge is not the potential for renewable generation but maintaining grid stability under high renewable penetration and restricted operational flexibility. Sensitivity analysis confirmed that relaxing the minimum-output constraint of thermal generators yielded the greatest reductions in both cost and emissions, underscoring the need for greater flexibility on the supply side.
Hybrid renewable biomass systems represent a feasible technological pathway in Tanegashima, where diesel generation remains the primary balancing resource. A project involving one of the co-authors conducted field tests on converting sugarcane bagasse and woody biomass into fuel for small-scale distributed generation on the island [,]. Co-firing or partially substituting diesel with locally sourced biomass could reduce CO2 emissions, utilize regional resources, and enhance flexibility by enabling variable-output generation near demand centers.
Another opportunity arises from the JAXA TNSC, which has a stable electricity demand and existing hydrogen infrastructure. Currently, the center operates independently of the local grid for reliability, and its hydrogen for rocket fuel is imported. If non-critical facilities were connected to the grid during renewable surplus periods, electricity demand could increase when curtailment is high. Furthermore, surplus renewable power could be used for local hydrogen production, enhancing energy self-sufficiency and providing long-duration storage. Coordinating EV charging with electrolyzer operation can further stabilize grid conditions by linking V2G flexibility with hydrogen production.
Implementing such an integrated system requires coordination among the local utility, government, and the Space Center. Given the limited market mechanisms in isolated grids, targeted regulatory and financial measures—such as support for renewable biomass hybrid systems, investment in hydrogen infrastructure, and incentives for V2G participation—are essential. These complementary measures can strengthen both technological flexibility and regional economic circulation, enabling deeper decarbonization within the constrained grid environment of the island.
4.3. Behavioral and Social Dimensions of V2G Implementation
The optimization results demonstrated that V2G can reduce cost and CO2 emissions in isolated island grids. However, the model assumes that all EV users follow optimal charging and discharging schedules. In reality, user behavior is influenced by daily routines, convenience, and social norms, creating uncertainty regarding the alignment of individual actions with system needs. The model also aggregates all vehicles without representing individual SOC constraints and trip schedules, which limits its ability to reflect real-world diversity in user participation. Therefore, addressing these behavioral uncertainties is essential for translating the modeled potential of V2G into practical operation.
Sensitivity analysis demonstrated that overly high discharge incentives reduced V2G activity, as the system avoided expensive participation, even within the optimization framework. This result indicates that behavioral design should consider the broader social and normative contexts that influence decision-making rather than relying solely on financial mechanisms. In Japan, Kurushima and Kudo [] pointed out that environmentally conscious behaviors—such as waste sorting and energy-saving actions to reduce CO2 emissions—are often motivated not only by economic incentives but also by social cooperation and normative awareness. Thus, norm-based and community-driven approaches may provide a more stable foundation for promoting V2G participation, particularly in regions with strong social cohesion.
To support such engagement, one of the co-authors has helped develop “co-learning” frameworks that foster dialogue and mutual understanding among residents, experts, and local institutions [,]. Through participatory workshops and feedback sessions, residents explore how their everyday actions—such as adjusting EV charging times—can contribute to local sustainability goals. Applying these co-learning approaches to energy management can help users perceive V2G not only as a technical function but also as a shared community resource. In Tanegashima, where trust and collective responsibility are central to community life, such collaborative learning processes can enhance both behavioral alignment with system needs and local ownership of the energy transition.
Moreover, co-learning offers bidirectional benefits: it facilitates behavioral change among users and provides valuable feedback to engineers and policymakers, enabling the refinement of technology design and policy frameworks to better reflect local values and practical constraints. Through this iterative process, V2G can evolve from a technical option into a socially embedded infrastructure that integrates technology, behavior, and governance to support decarbonization and regional sustainability.
5. Conclusions
In this study, an optimization model was developed to evaluate the combined effects of renewable energy expansion and V2G integration in an isolated island power system using Tanegashima as a case study. The model minimized both total system cost and CO2 emissions while incorporating the lower-bound constraint of thermal generators, which is a defining characteristic of small-island grids.
The results demonstrated that V2G contributed to CO2 reduction in both cost- and emission-minimizing cases. In the cost-minimizing scenario, the total system cost slightly increased due to additional EMS/VPP and incentive costs; however, CO2 emissions declined due to reduced thermal generation. In the CO2-minimizing scenario, V2G achieved both lower total costs and emissions, demonstrating its potential to enhance flexibility and cost efficiency under high renewable penetration. These findings confirm that V2G can play a significant role in advancing decarbonization in small, autonomous power systems.
The analysis also revealed structural and methodological limitations. By aggregating EVs at the system level, the model cannot represent individual vehicle behavior or SOC dynamics. Consequently, user-specific constraints—such as ensuring minimum SOC upon departure—are not captured. Furthermore, the linear programming framework does not account for behavioral uncertainties, stochastic driving patterns, and varying V2G participation rates. Although these simplifications are necessary for system-level optimization, they limit the behavioral and operational realism of the results. Addressing these factors through stochastic or agent-based modeling represents an important direction for future research.
In addition, the minimum-output constraint of thermal generators and limited short-term storage capacity restrict renewable utilization, resulting in substantial curtailment. Sensitivity analysis confirmed that the relaxation of this constraint provided the most significant improvement in both cost and CO2 emissions. Future studies should explore complementary pathways, including flexible hybrid generation, biomass utilization, and hydrogen conversion, to enhance the decarbonization potential of V2G-enabled systems.
Future research should therefore integrate behavioral, stochastic, and technical dimensions into V2G modeling to enable a more realistic assessment of its role in achieving carbon neutrality in small, isolated power systems.
Supplementary Materials
The following supporting information can be downloaded at: https://www.mdpi.com/article/10.3390/en18225933/s1, Table S1. Baseline assumptions for Tanegashima in 2050 [,]. Table S2. Main parameters used in the optimization model.
Author Contributions
Conceptualization, K.I., H.K. and Y.S.; methodology, K.I. and H.K.; software, K.I.; validation, K.I. and H.K.; formal analysis, K.I.; investigation, K.I. and H.K.; resources, K.I. and H.K.; data curation, K.I.; writing—original draft preparation, K.I., H.K. and Y.S.; writing—review and editing, K.I., H.K. and Y.S.; visualization, K.I., H.K. and Y.S.; supervision, H.K.; project administration, H.K. and K.I.; funding acquisition, H.K. All authors have read and agreed to the published version of the manuscript.
Funding
This work was supported by JST COI-NEXT JPMJPF2003, the Environment Research and Technology Development Fund (JPMEERF20192010) of the Environmental Restoration and Conservation Agency of Japan.
Data Availability Statement
The datasets presented in this article are not readily available because the data are part of an ongoing study. Requests to access the datasets should be directed to kurikuri@shibaura-it.ac.jp.
Conflicts of Interest
The authors declare no conflicts of interest.
Abbreviations
The following abbreviations are used in this manuscript:
| EV | Electric vehicle |
| PV | Solar photovoltaics |
| SOC | State of charge |
| V2G | Vehicle-to-Grid |
| VRE | Variable renewable energy |
References
- IPCC WGIII. Climate Change 2022: Mitigation of Climate Change; Sixth Assessment Report; Intergovernmental Panel on Climate Change: Geneva, Switzerland, 2022; Available online: https://www.ipcc.ch/report/ar6/wg3/ (accessed on 17 July 2025).
- International Energy Agency (IEA). Net Zero by 2050: A Roadmap for the Global Energy Sector; IEA: Paris, France, 2021; Available online: https://www.iea.org/reports/net-zero-by-2050 (accessed on 17 July 2025).
- International Energy Agency (IEA). Integrating Solar and Wind: Global Experience and Emerging Challenges; IEA: Paris, France, 2024; Available online: https://www.iea.org/reports/integrating-solar-and-wind (accessed on 17 July 2025).
- Kyushu Electric Power. Past Output Curtailment Records. 2025. Available online: https://www.kyuden.co.jp/td_power_usages/out_ctrl_history.html (accessed on 28 July 2025). (In Japanese).
- Hamilton, J.; Negnevitsky, M.; Wang, X.; Semshchikov, E. The role of low-load diesel in improved renewable hosting capacity within isolated power systems. Energies 2020, 13, 4053. [Google Scholar] [CrossRef]
- International Energy Agency (IEA). Global EV Outlook 2023: Catching Up with Climate Ambitions; IEA: Paris, France, 2023; Available online: https://www.iea.org/reports/global-ev-outlook-2023 (accessed on 17 July 2025).
- International Energy Agency (IEA). Global EV Outlook 2020: Entering the Decade of Electric Drive? IEA: Paris, France, 2020; Available online: https://www.iea.org/reports/global-ev-outlook-2020 (accessed on 17 July 2025).
- Mojumder, M.R.H.; Ahmed Antara, F.; Hasanuzzaman, M.; Alamri, B.; Alsharef, M. Electric Vehicle-to-Grid (V2G) technologies: Impact on the power grid and battery. Sustainability 2022, 14, 13856. [Google Scholar] [CrossRef]
- Lei, X.; Yu, H.; Zhong, J.; Jia, Y.; Shao, Z. Exploring electric vehicle’s potential as capacity reservation through V2G operation to compensate load deviation in distribution systems. J. Clean. Prod. 2024, 451, 141997. [Google Scholar] [CrossRef]
- Comi, A.; Idone, I. The use of electric vehicles to support the needs of the electricity grid: A systematic literature review. Appl. Sci. 2024, 14, 8197. [Google Scholar] [CrossRef]
- Zhang, C.; Wang, X.; Wang, Y.; Tang, P. Economic viability of vehicle-to-grid (V2G) reassessed: A degradation cost integrated life-cycle analysis. Sustainability 2025, 17, 5626. [Google Scholar] [CrossRef]
- Giannelos, S.; Borozan, S.; Strbac, G.; Zhang, T.; Kong, W. Vehicle-to-Grid: Quantification of its contribution to security of supply through the F-Factor methodology. Sustain. Energy Res. 2024, 11, 32. [Google Scholar] [CrossRef]
- Amiruddin, A.; Dargaville, R.; Liebman, A.; Gawler, R. Integration of electric vehicles and renewable energy in Indonesia’s electrical grid. Energies 2024, 17, 2037. [Google Scholar] [CrossRef]
- Taliotis, C.; Fylaktos, N.; Partasides, G.; Gardumi, F.; Sridharan, V.; Karmellos, M.; Papanicolas, C.N. The effect of electric vehicle deployment on renewable electricity generation in an isolated grid system: The case study of Cyprus. Front. Energy Res. 2020, 8, 205. [Google Scholar] [CrossRef]
- Dominković, D.F.; Stark, G.; Hodge, B.-M.; Pedersen, A.S. Integrated energy planning with a high share of variable renewable energy sources for a Caribbean island. Energies 2018, 11, 2193. [Google Scholar] [CrossRef]
- Raveendran, V.; Alvarez-Bel, C.; Nair, M.G. Assessing the ancillary service potential of electric vehicles to support renewable energy integration in touristic islands: A case study from the Balearic island of Menorca. Renew. Energy 2020, 161, 495–509. [Google Scholar] [CrossRef]
- Geng, J.; Dou, H.; Hao, X.; Liu, Z.; Zhao, F.; Hao, H. Additional emissions of vehicle-to-grid technology considering China’s geographical heterogeneity. Carbon Footpr. 2025, 4, 8. [Google Scholar] [CrossRef]
- Steinbach, S.A.; Blaschke, M.J. How grid reinforcement costs differ by the income of electric vehicle users. Nat. Commun. 2024, 15, 9674. [Google Scholar] [CrossRef]
- Kyushu Electric Power. Past Output Curtailment Records—Tanegashima. 2025. Available online: https://www.kyuden.co.jp/td_power_usages/excel/tanegashima/%E9%81%8E%E5%8E%BB%E3%81%AE%E5%87%BA%E5%8A%9B%E5%88%B6%E5%BE%A1%E5%AE%9F%E7%B8%BE%EF%BC%BF%E7%A8%AE%E5%AD%90%E5%B3%B6.xlsx (accessed on 17 July 2025). (In Japanese).
- Komiyama, R.; Shibata, S.; Nakamura, Y.; Fujii, Y. Analysis on possible introduction of PV systems considering output power fluctuation and battery technology employing optimal power-generation mix model. IEEJ Trans. Electr. Electron. Eng. (EIS) 2011, 131, 1705–1714. (In Japanese) [Google Scholar] [CrossRef]
- Kyushu Electric Power. Verification Results of Output Curtailment of Renewable Energy Generating Facilities. 2015. Available online: https://www.occto.or.jp/oshirase/sonotaoshirase/2015/files/tenpu_saisei_yokusei_kenshou_kekka.pdf (accessed on 28 July 2025). (In Japanese).
- Organization for Cross-Regional Coordination of Transmission Operators (OCCTO). Minimum Output During Operation. 2023. Available online: https://www.occto.or.jp/iinkai/gridcode/2023/files/gridcode_14_05.pdf (accessed on 28 July 2025). (In Japanese).
- Kikuchi, Y.; Kimura, S.; Okamoto, Y.; Koyama, M. A scenario analysis of future energy systems based on an energy flow model represented as functionals of technology options. Appl. Energy 2014, 132, 586–601. [Google Scholar] [CrossRef]
- Igarashi, K.; Kurishima, H.; Kikuchi, Y. Evaluation of Vehicle-to-Grid system using renewable energy in Tanegashima. Papers Environ. Inf. Sci. 2022, 36, 87–92. (In Japanese) [Google Scholar]
- Japanese Industrial Standards Committee (JISC). JIS C 8907: Photovoltaic Power Generating System—Design Guideline. Available online: https://www.jisc.go.jp/app/jis/general/GnrJISNumberNameSearchList?toGnrJISStandardDetailList (accessed on 28 July 2025). (In Japanese)
- Hitachi, Ltd. Wind Turbine System HTW2.0-80. Available online: https://en.wind-turbine-models.com/turbines/1009-hitachi-ltd.-htw2.0-80 (accessed on 28 July 2025).
- National Institute of Population and Social Security Research. Regional Population Projections for Japan: 2020–2050; IPSS: Tokyo, Japan, 2024. Available online: https://www.ipss.go.jp/pp-shicyoson/j/shicyoson23/6houkoku/houkoku.pdf (accessed on 28 July 2025). (In Japanese)
- Kikuchi, Y.; Nakai, M.; Kanematsu, Y.; Oosawa, K.; Okubo, T.; Oshita, Y.; Fukushima, Y. Application of technology assessments to co-learning for regional transformation: A case study of biomass energy systems in Tanegashima. Sustain. Sci. 2020, 15, 1473–1494. [Google Scholar] [CrossRef]
- Ministry of Land, Infrastructure, Transport and Tourism (MLIT). National Road and Street Traffic Survey. Available online: https://www.mlit.go.jp/road/census/h27/ (accessed on 28 July 2025). (In Japanese)
- Kyushu Electric Power. Island Universal Service. Available online: https://www.egc.meti.go.jp/activity/emsc_electricity/pdf/006_06_06.pdf (accessed on 28 July 2025). (In Japanese)
- Ministry of Economy, Trade and Industry (METI). Summary of Generation Cost Verification. 2021. Available online: https://www.enecho.meti.go.jp/committee/council/basic_policy_subcommittee/mitoshi/cost_wg/2021/data/08_05.pdf (accessed on 28 July 2025). (In Japanese)
- World Bank. Commodity Markets Outlook—October 2021 Forecasts. Available online: https://thedocs.worldbank.org/en/doc/ff5bad98f52ffa2457136bbef5703ddb-0350012021/related/CMO-October-2021-forecasts.pdf (accessed on 28 July 2025).
- International Energy Agency (IEA). World Energy Outlook 2021; IEA: Paris, France, 2021; Available online: https://iea.blob.core.windows.net/assets/4ed140c1-c3f3-4fd9-acae-789a4e14a23c/WorldEnergyOutlook2021.pdf (accessed on 28 July 2025).
- Mitsubishi Research Institute. Report on Measures to Expand Introduction of Renewable Energy. Available online: https://www.env.go.jp/content/000137517.pdf (accessed on 28 July 2025). (In Japanese)
- Ministry of Economy, Trade and Industry (METI). Committee for Expansion of Stationary Battery Systems. Available online: https://www.meti.go.jp/shingikai/energy_environment/storage_system/pdf/004_04_00.pdf (accessed on 28 July 2025). (In Japanese)
- Central Research Institute of Electric Power Industry (CRIEPI). Comprehensive Evaluation of Life-Cycle CO2 Emissions of Power Generation Technologies in Japan. Available online: https://criepi.denken.or.jp/hokokusho/pb/reportDownload?reportNoUkCode=Y06&tenpuTypeCode=30&seqNo=1&reportId=8713 (accessed on 28 July 2025). (In Japanese).
- Tokyo Electric Power Company (TEPCO). Energy Status Report. Available online: https://www.tepco.co.jp/pg/company/environment/warming/pdf/energy_report2023.pdf (accessed on 28 July 2025). (In Japanese).
- Ministry of the Environment (Japan). CO2 Emission Factors for Electricity Supplied by Retail Electricity Business Operators. Available online: https://policies.env.go.jp/earth/ghg-santeikohyo/files/calc/r05_coefficient_rev4.pdf (accessed on 28 July 2025). (In Japanese)
- Okinawa Electric Power Company. Power Generation Facilities Overview. Available online: https://www.okiden.co.jp/company/guide/power-equipment/ (accessed on 28 July 2025). (In Japanese).
- Kawamoto, R.; Mochizuki, H.; Moriguchi, Y.; Nakano, T.; Motohashi, M.; Sakai, Y.; Inaba, A. Estimation of CO2 emissions of internal combustion engine vehicle and battery electric vehicle using LCA. Sustainability 2019, 11, 2690. [Google Scholar] [CrossRef]
- Ministry of Economy, Trade and Industry (METI). Committee for Expansion of Stationary Battery Systems. Available online: https://www.meti.go.jp/shingikai/energy_environment/storage_system/pdf/001_05_00.pdf (accessed on 28 July 2025). (In Japanese)
- V2GB project. V2GB: Vehicle to Grid Britain Public Report. Element Energy. 2019. Available online: https://esc-production-2021.s3.eu-west-2.amazonaws.com/2021/07/V2GB-Public-Report.pdf (accessed on 31 October 2025).
- Woo, S.; Strobel, L.; Yuan, Y.; Pruckner, M. Exploring bidirectional charging strategies for an electric vehicle population. Appl. Energy 2025, 397, 126361. [Google Scholar] [CrossRef]
- Kyushu Electric Power. Kyushu VPP Demonstration Project Results Report. Available online: https://sii.or.jp/vpp02/uploads/B8_kyuden.pdf (accessed on 28 July 2025). (In Japanese).
- Corradini, L.L.; Heiho, A.; Kanematsu, Y.; Shimono, R.; Ohara, S.; Kikuchi, Y. Simulation-based design of regional biomass thermochemical conversion system for improved environmental and socio-economic performance. Comput. Aided Chem. Eng. 2023, 52, 2361–2366. [Google Scholar]
- Kikuchi, Y.; Kurishima, H.; Kanematsu, Y.; Kasai, T.; Fujii, S.; Oshita, Y.; Ishida, T.; Ohara, S. Prospective life-cycle design of regional resource circulation applying technology assessments supported by CAPE tools. Comput. Aided Chem. Eng. 2024, 53, 2251–2256. [Google Scholar]
- Kurishima, H.; Kudoh, Y. Analysis on determining factors for implementing CO2 reduction activities. Papers Environ. Inf. Sci. 2009, 23, 245–250. [Google Scholar]
- Japan Remote Islands Center. Annual Report on Remote Islands Statistics; Japan Remote Islands Center: Tokyo, Japan, 2023; Available online: https://www.nijinet.or.jp/publishing/statistics/tabid/68/Default.aspx (accessed on 31 October 2025). (In Japanese)
- Ministry of the Environment (Japan). Renewable Energy Potential System (REPOS). Available online: https://repos.env.go.jp/web/ (accessed on 31 October 2025). (In Japanese)
Disclaimer/Publisher’s Note: The statements, opinions and data contained in all publications are solely those of the individual author(s) and contributor(s) and not of MDPI and/or the editor(s). MDPI and/or the editor(s) disclaim responsibility for any injury to people or property resulting from any ideas, methods, instructions or products referred to in the content. |
© 2025 by the authors. Licensee MDPI, Basel, Switzerland. This article is an open access article distributed under the terms and conditions of the Creative Commons Attribution (CC BY) license (https://creativecommons.org/licenses/by/4.0/).