Article

Parametric Study on Effective Thermal Conductivity of Dispersed Disks with Internal Heat Sources

Institute of Nuclear and New Energy Technology, Tsinghua University, Beijing 100084, China
*
Author to whom correspondence should be addressed.
Energies 2025, 18(17), 4719; https://doi.org/10.3390/en18174719
Submission received: 2 August 2025 / Revised: 30 August 2025 / Accepted: 3 September 2025 / Published: 4 September 2025

Abstract

Composite materials are widely used in various fields due to their superior properties. Given their complex internal structures, they are often modeled as homogeneous materials in engineering applications to simplify temperature distribution analysis. The key parameter in this approach is effective thermal conductivity (ETC). Conventional ETC models, based on Fourier’s law or the effective field approach, tend to underestimate temperatures when applied to composites containing internal heat sources, such as nuclear fuels. Preliminary studies have been conducted on ETC models for composite plates and particle-dispersed spheres with internal heat sources, using average temperature as the conserved quantity instead of the heat flux. This study focuses on dispersed disks containing internal heat sources. The finite element method is used to calculate its average-temperature-based ETC. The influence of filler size, filling fraction, and component thermal conductivities on the ETC is analyzed. Additionally, the impact of internal heat sources on ETC is discussed based on the theoretical model for the ETC of a one-dimensional composite plate. This research enhances understanding of ETC in composites with internal heat sources, reveals the connection between conventional and temperature-based ETC models, and provides insights for developing an ETC model for dispersed disks.

1. Introduction

Composite materials are engineered by incorporating filler phases into a matrix to fulfill specific functional requirements, and they have found widespread applications across various fields. A typical example is dispersed nuclear fuel, in which fuel particles are embedded within a matrix material of high thermal conductivity to improve the overall heat transfer performance of the fuel assembly [1]. Owing to the structural complexity of composite materials, direct numerical methods for thermal-hydraulic analysis are often computationally intensive and time-consuming. To overcome this challenge, engineering practice often adopts a homogenization approach, treating composites as an equivalent uniform material [2]. After homogenization, the material is characterized by a single thermal conductivity, known as the effective thermal conductivity (ETC).
Numerous ETC models have been developed to characterize composites with various morphologies [3,4]. Representative examples include the series and parallel models, the Maxwell–Eucken model [5,6], effective medium theory (EMT) [7], and the Chiew–Glandt model [8]. These conventional models are fundamentally based on Fourier’s law or the effective field approach, and they commonly assume the conservation of heat flux during the homogenization process. For composites without internal heat sources, these models generally provide good accuracy. However, studies have shown that conventional ETC models tend to underestimate temperatures in composites containing internal heat sources [9,10]. This discrepancy arises because internal heat generation changes the internal heat flux distribution, where the local heat flux is governed jointly by the temperature gradient and the internal heat sources. Since conventional ETC models neglect the effect of internal heat sources, they are not applicable to such cases [11].
Some studies have employed the finite element software COMSOL Multiphysics to investigate the ETC of composites [12,13]. Several numerical studies have studied problems involving internal heat sources. However, when calculating the ETC, they still relied on the Fourier’s law by using the temperature gradient between two boundaries. These studies do not account for the influence of internal heat sources on the local heat flux [14,15,16,17].
Liu M. et al. [18] proposed that, when calculating the ETC with internal heat sources, the peak temperature or the average temperature should be used as the conserved quantity for homogenization instead of Fourier’s law. Wang et al. [9] numerically investigated the effects of filling fraction, particle size, and sphere size on the peak-temperature-based ETC and the average-temperature-based ETC for particle-dispersed spheres. Their study covered filling fractions from 0.05 to 0.35 and dimensionless particle sizes (particle radius to sphere radius ratio) from 0.118 to 0.178. Although Liu M. et al. and some subsequent researchers developed models to predict the peak temperature in particle-dispersed spheres [19,20] and cylinders [20,21,22], these models still do not reveal the mechanism of how internal heat sources influence the ETC.
Liu Z. et al. [11,23] conducted an in-depth investigation into the mechanism of ETC with internal heat sources. They confirmed that the average temperature is a proper conserved quantity as it remains unchanged before and after homogenization. A key feature of the average-temperature-based ETC is its independence from boundary conditions and the magnitude of the heat source. Based on this definition, Liu Z. et al. theoretically derived ETC models for multilayer-coated particles [11] and one-dimensional composite plates [24,25] and developed a method to investigate the ETC by analyzing the composition of the average temperature. Building on this, they extended this work to three-dimensional particle-dispersed spheres and proposed an ETC model [26]. Qiu and Sun [27] also introduced an ETC model for particle-dispersed spheres using the effective matrix approximation method. Their work preliminarily revealed connections between models incorporating internal heat sources and conventional models.
For three-dimensional particle-dispersed cylinders, Liu Y. and Sun [28] systematically studied the effects and mechanisms of key parameters, including the filling fraction, size, and thermal conductivities of heating particles. The filling fractions ranged from 0.01 to 0.34, the dimensionless sizes (particle radius to cylinder radius ratio) ranged from 0.043 to 0.304, and the dimensionless thermal conductivity (filling phase to the matrix conductivity ratio) ranged from 0.001 to 1000. The study demonstrates that the filling fraction, particle size, and thermal conductivity of internal heat sources all affect the ETC, and the trends differ from cases without internal heat sources. Unfortunately, an ETC model for particle-dispersed cylinders has not yet been established.
A dispersed disk system with internal heat sources can be regarded as a simplified two-dimensional case of a particle-dispersed cylinder, since the cross-section of the particle-dispersed cylinder is essentially a dispersed disk. In this work, the dispersed disk is chosen as the research object, and the finite element method (FEM) is used to calculate its average-temperature-based ETC. The effects of key parameters on the disk ETC are systematically investigated, including the dimensionless filler disk size, filling fraction, and dimensionless thermal conductivity. The mechanisms driving these effects are also analyzed. Additionally, the Maxwell–Eucken model is applied to calculate the ETC within the studied parameter rang. The discrepancies between the conventional model predictions and numerical results are analyzed together with their causes.
Currently, there is no analytical expression for dispersed disks or particle-dispersed cylinders, while the one-dimensional composite plates, as the simplest case with internal heat sources, already have a theoretical expression. Therefore, the composite plates model is used to discuss the common influence of internal heat sources on the ETC of both the composite plates and dispersed disks. This analysis provides ideas for developing an ETC model for dispersed disks. The conclusions of this paper also form the foundation for the eventual establishment of an ETC model for particle-dispersed cylinders.

2. Modeling

2.1. Numerical Model

2.1.1. Procedure

This paper uses the finite element software COMSOL Multiphysics 5.5 to perform two-dimensional heat conduction simulations on a circular disk. A schematic diagram of the dispersed disk domain is shown in Figure 1, where a large number of small heat-generating disks are randomly distributed within a larger disk. The radius of the large disk is R 0 , and each of the N small disks have a radius of R 1 . The heat source power is S d . The thermal conductivities of the matrix and the heat-generating disks are λ m and λ p , respectively. The dimensionless thermal conductivity is defined as κ 2   =   λ p / λ m , the dimensionless size as μ 2   =   R 1 / R 0 , and the filling fraction as ϕ 2   =   N · R 1 2 / R 0 2 .
Since the average-temperature-based ETC is independent of both the boundary temperature and the magnitude of the internal heat source, a uniform circumferential boundary temperature T 0 is adopted in the modeling. For the homogenized heat source S in the dispersed disk domain with an ETC denoted as λ e , the heat conduction differential equation in cylindrical coordinates is given by
1 r d d r λ e r d T d r + S = 0
The expression for the temperature T ( r ) can be obtained as
T ( r ) = S 4 λ e R 0 2 r 2 + T 0
The definition of average temperature T a v g is
T a v g = 0 R 0 2 π r T ( r ) d r π R 0 2
By solving Equations (1) and (3), the relationship between the average temperature t a v g and the effective thermal conductivity λ e can be readily obtained as
T a v g T 0 = S R 0 2 8 λ e = S d ϕ 2 R 0 2 8 λ e
According to the definition that the average temperatures before and after homogenization are equal, the ETC can be determined from Equation (4) once the average temperature of the dispersed disk is obtained using the FEM.
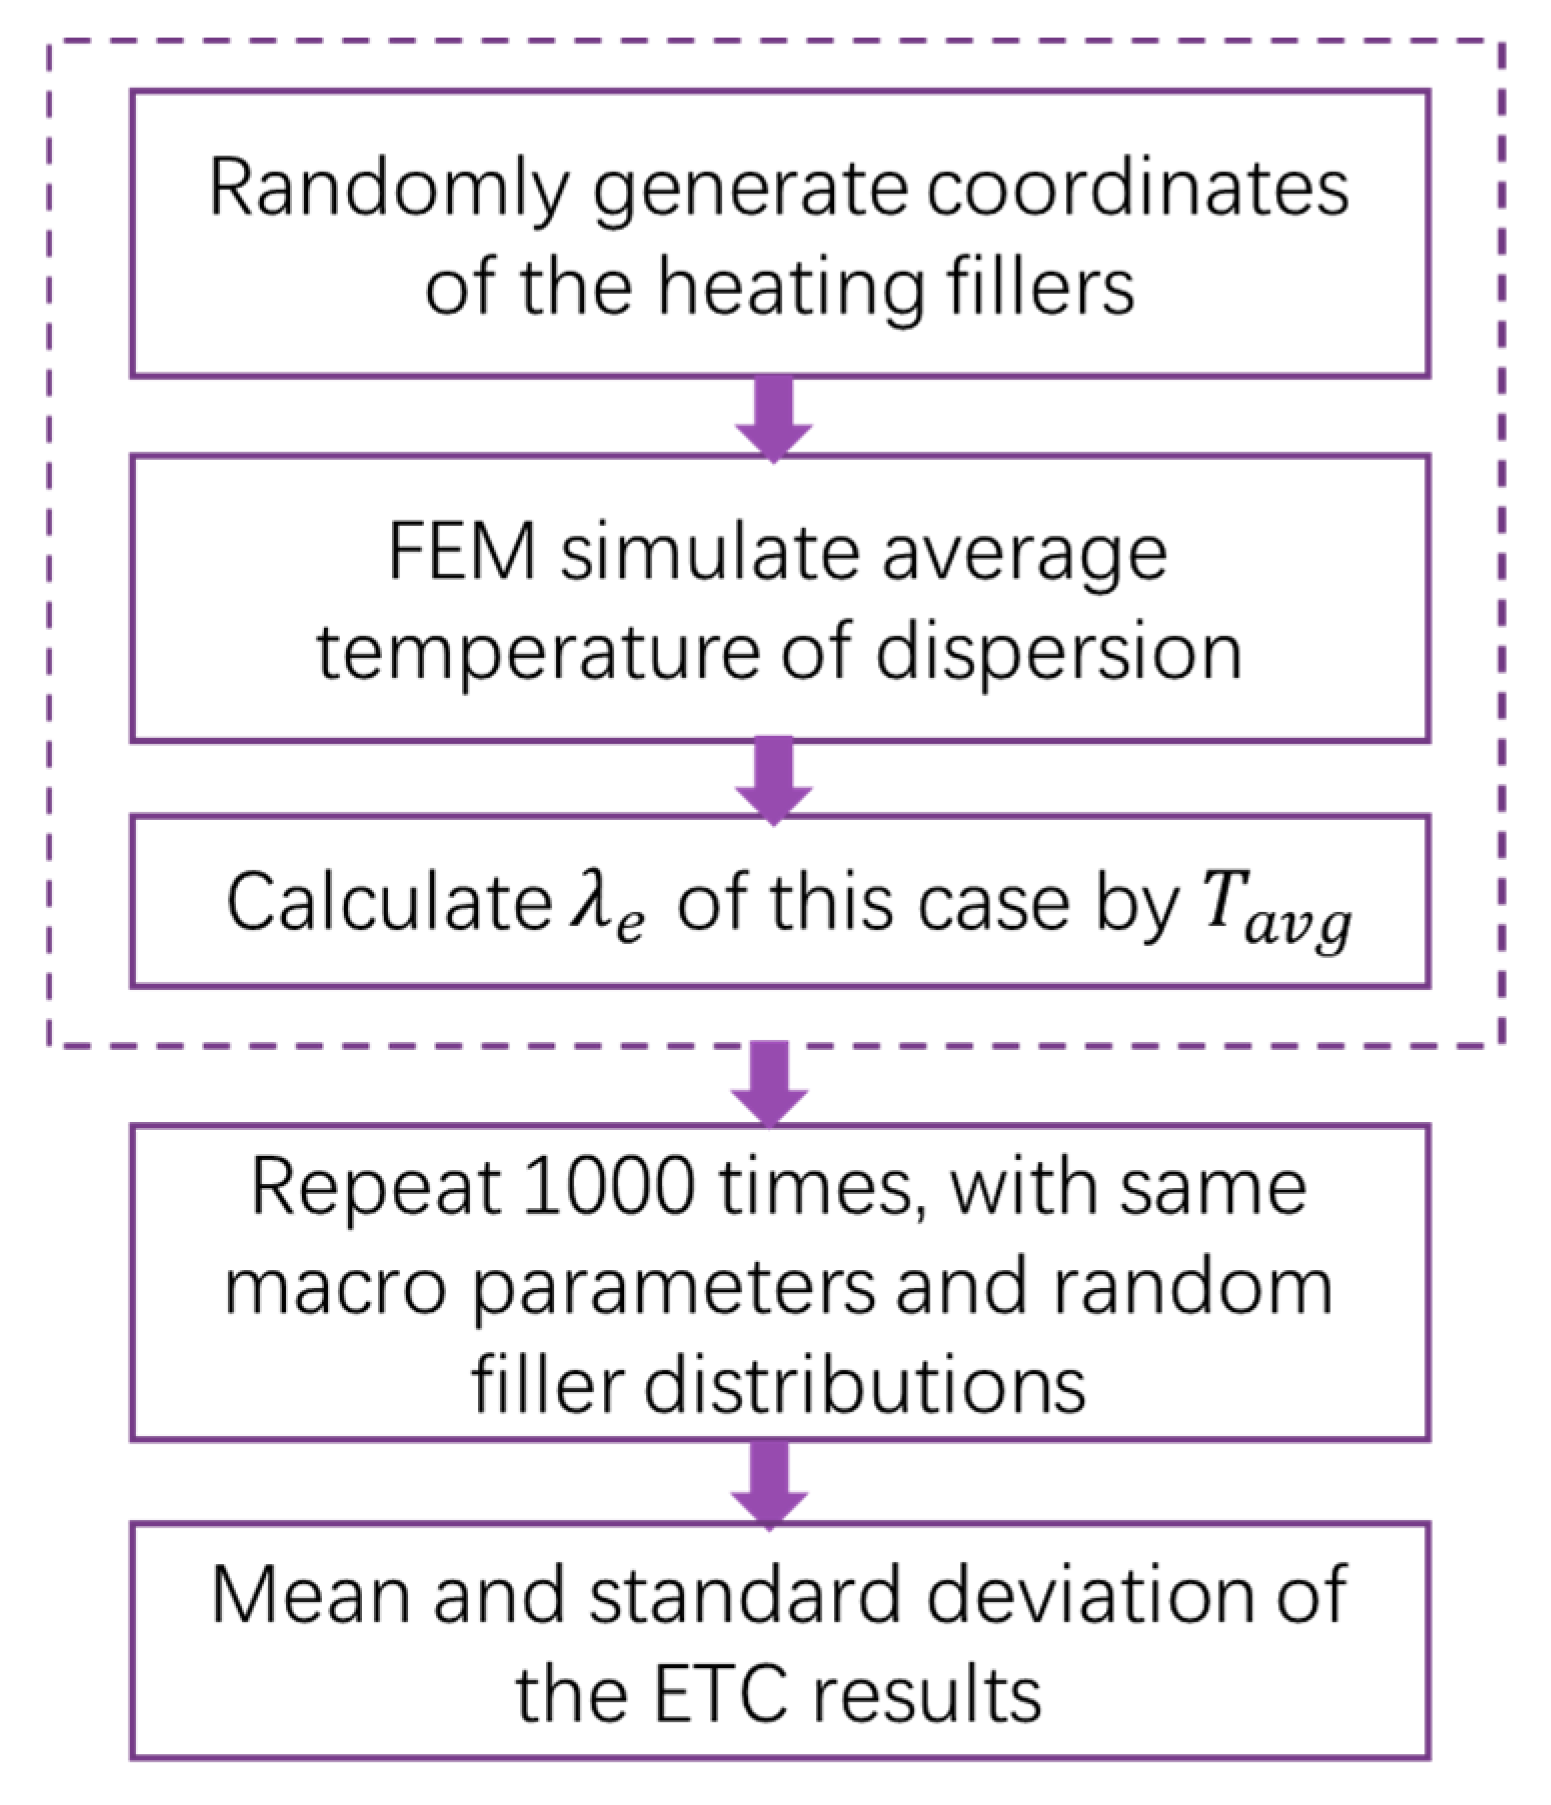
Similarly to the numerical method used to calculate the ETC of cylindrical particle dispersions [28], the procedure for determining the ETC of dispersed disk domains is illustrated in Figure 2.
The basic procedure is as follows:
(1)
The centers of the heat-generating small disks were randomly generated within the large disk, following a uniform distribution, meaning that each position inside the large disk had the same probability. During the generation process, the relative positions of all small disks were checked to ensure that no small disk touched the boundary of the large disk or overlapped with another small disk.
(2)
Based on the radius of the large disk, the radius of the small disks, and their coordinates, the geometry and mesh are constructed in COMSOL Multiphysics, followed by a steady-state simulation [29].
(3)
The average temperature T a v g of the dispersed disk domain is obtained through post-processing, and the corresponding ETC λ e is calculated.
(4)
Steps (1)–(3) are repeated 1000 times under the same set of macroscopic parameters, generating 1000 random configurations of disk positions.
(5)
The mean value of the 1000 ETC results is taken as the nominal ETC under the given conditions, which helps reduce deviations caused by randomness in individual simulations.
Different combinations of μ 2 , ϕ 2 , and κ 2 are obtained by varying R 1 , N , and λ p , while holding R 0 and   λ m constant.
In all numerical cases in this paper, R 0   =   11.5 mm, λ m   =   90 W/(m·K).

2.1.2. Mesh Independence

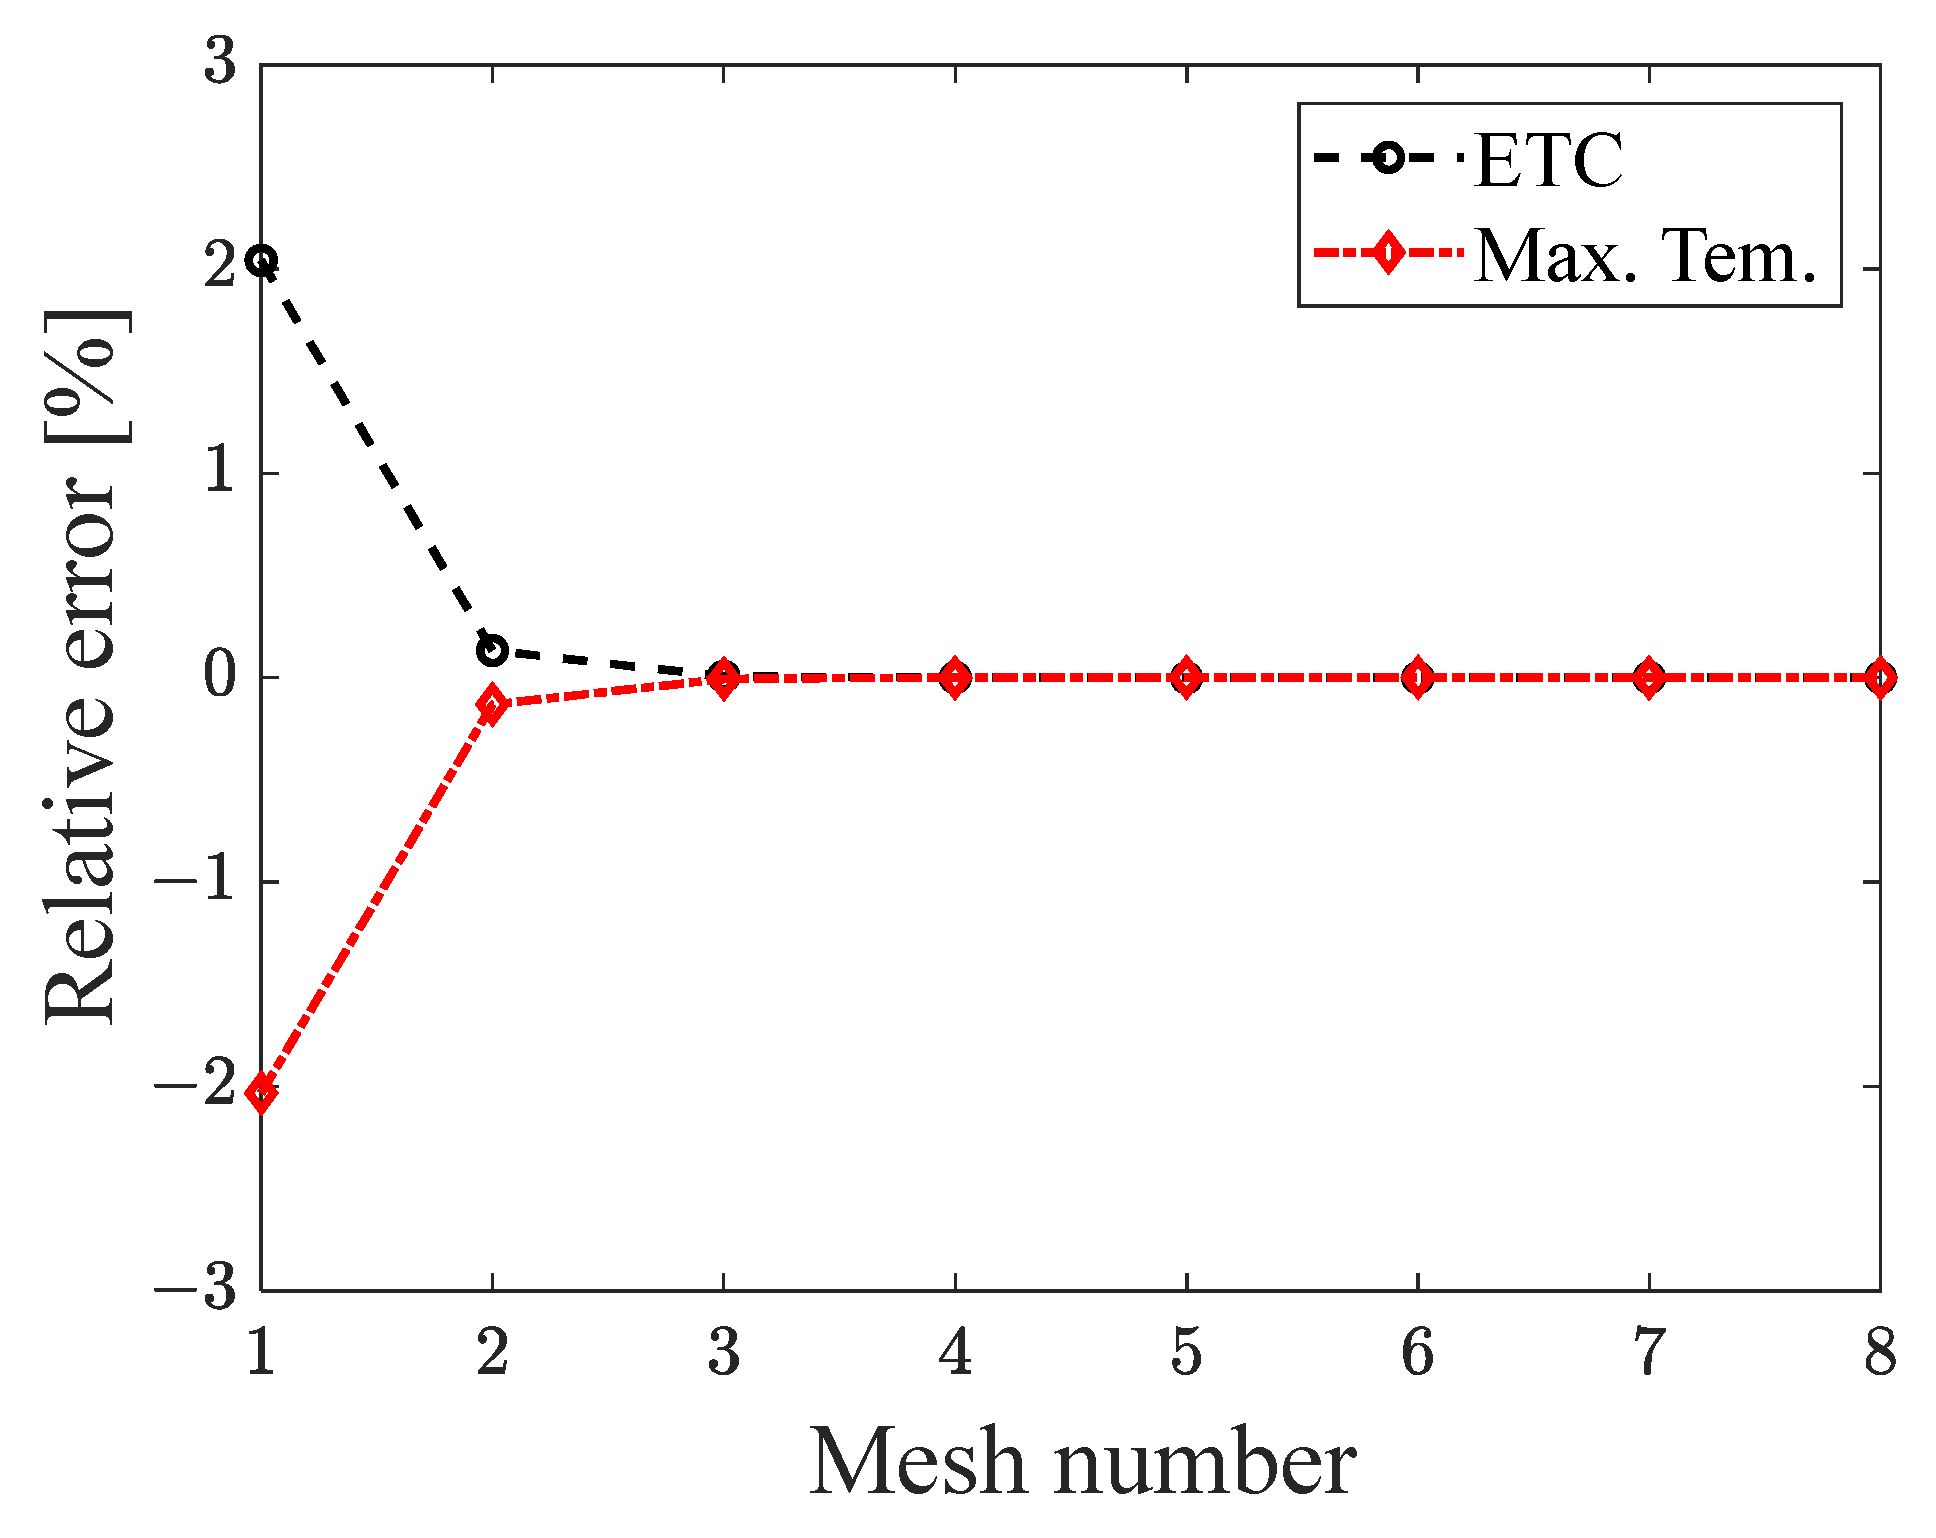
COMSOL’s automatic meshing tool was used to generate free triangular (FreeTri) meshes. Mesh independence was verified by comparing the ETC and maximum temperature for different mesh densities. The mesh size automatically adapts to the geometry; results are presented for the smallest mesh size ( R 1 = 0.12 mm, μ 2 = 0.010). In the simulations, the boundary of the large disk was fixed at T 0 = 1300 K, while a heat source of 1 × 10⁸ W/m3 was applied inside the small disks.
Table 1 lists eight different mesh configurations, where the mesh refinement was specified separately for the small disks and the matrix region.
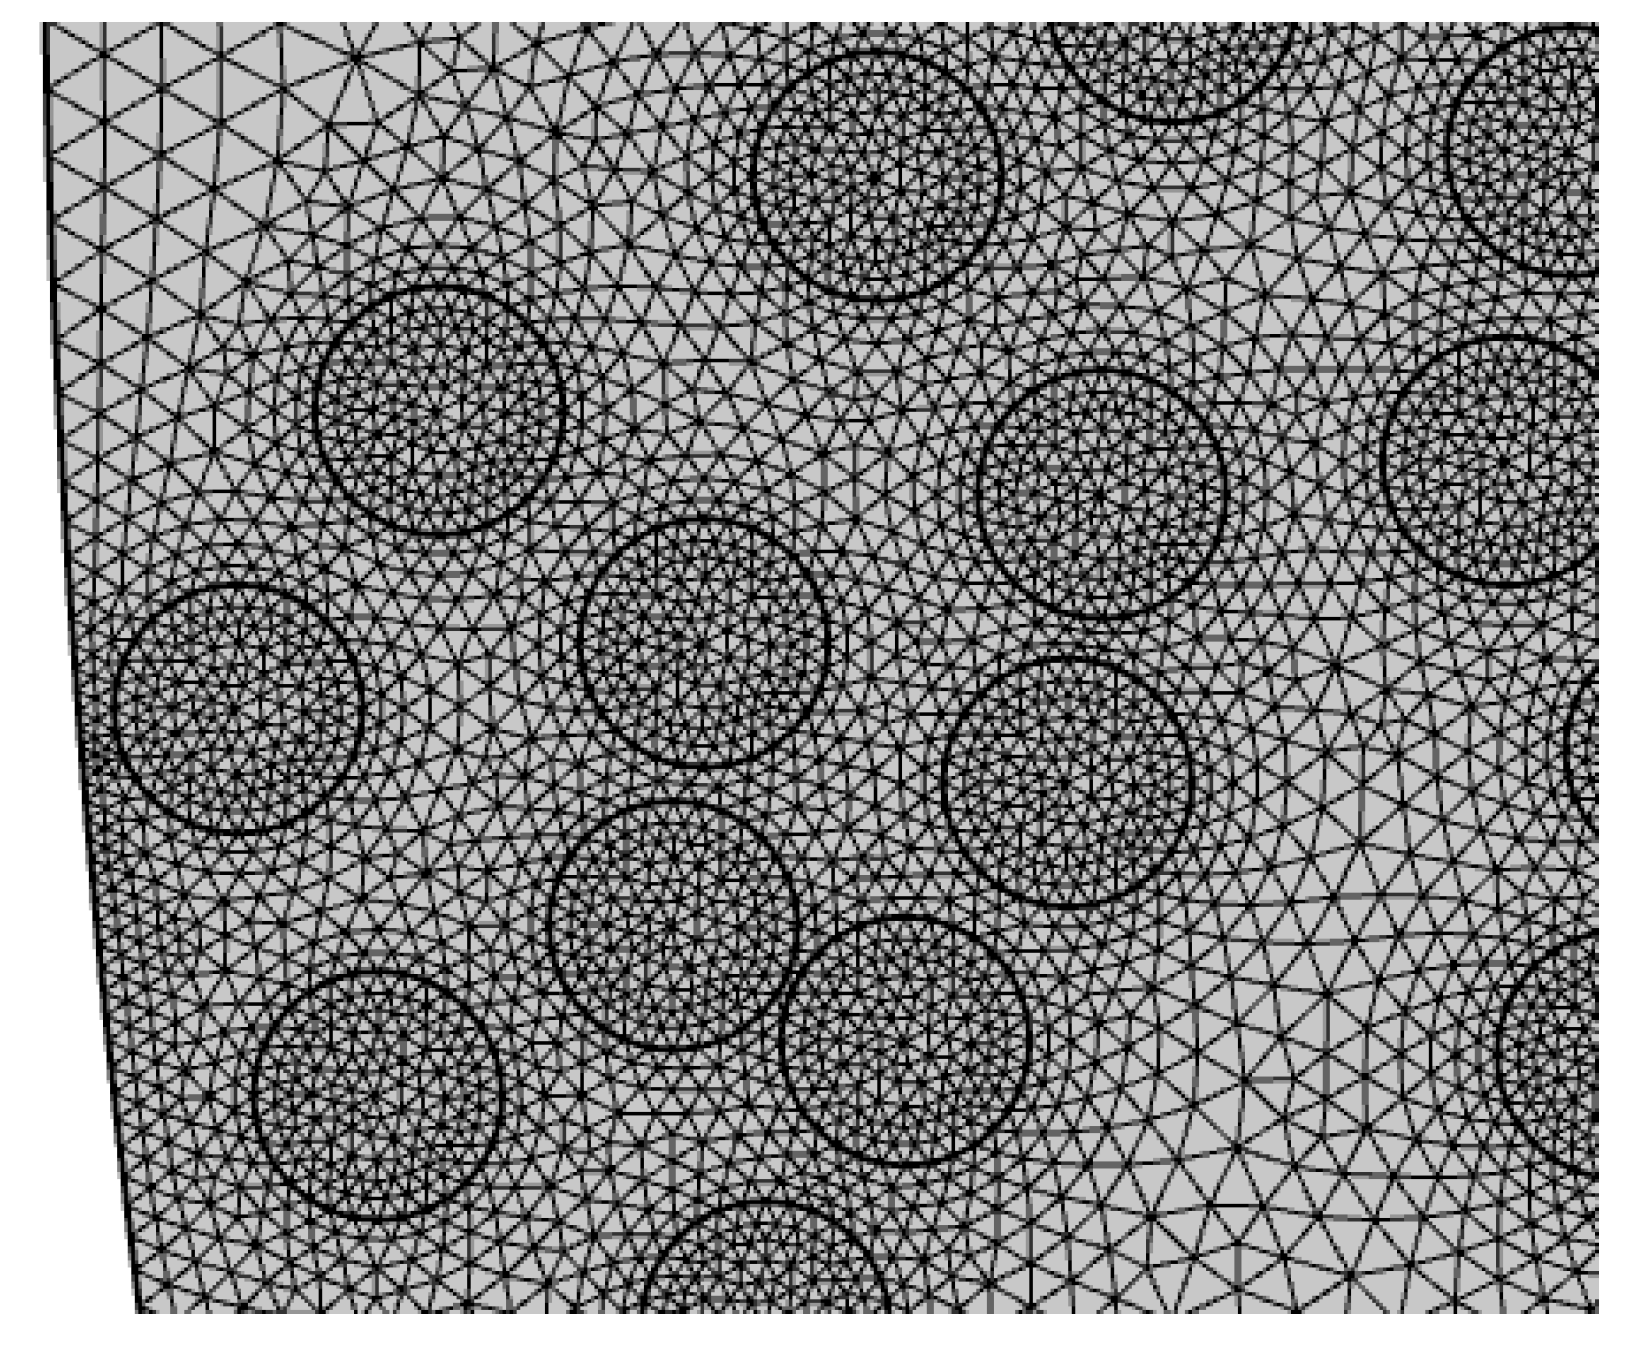
Taking the finest mesh (No. 8) as the reference, the relative errors of ETC and the maximum temperature obtained with other meshes were calculated, as shown in Figure 3. The results indicate that the errors for mesh No. 4 and denser are all within ±0.001%, and the results of meshes No. 7 and No. 8 are identical. Therefore, mesh No. 7 was selected for the final simulations, with the matrix region set to extra fine and the small disks set to extremely fine. An enlarged view of the mesh is shown in Figure 4.

2.1.3. Heat Source and Boundary Temperature Independence

ETC was further tested against different heat source power densities (1 × 10⁶, 1 × 10⁸, and 1 × 10¹⁰ W/m3) and boundary temperatures (500 K, 1300 K, and 2000 K). The results showed no variation, confirming that the ETC based on average temperature is independent of the heat source and boundary temperature, consistent with the findings of Liu Z et al. [11].
These results confirm that the FEM numerical model provides accurate predictions for the average-temperature-based ETC.

2.2. Maxwell–Eucken Model

Maxwell [6] proposed a model for calculating the effective electrical conductivity of spherical particles dispersed in a matrix material based on the principle of linear superposition. Eucken [30] later extended this formula to thermal conductivity, resulting in the expression for the ETC of a spherical particle dispersion system, denoted as λ e , N 3 :
λ e , N 3 = λ m 2 + κ + 2 ϕ κ 1 2 + κ ϕ κ 1
Here, ϕ is the volume filling fraction of the heat-generating particles, and κ is the ratio of the thermal conductivity of the filler phase λ p to that of the matrix λ m . This expression is commonly known as the Maxwell–Eucken model or, simply, the Maxwell model.
In the case of dispersed disks, since the heat sources are circular rather than spherical, the corresponding expression of λ e , N 2 must be derived for the disk geometry based on Maxwell’s superposition principle. The resulting equivalent equation [31] is
N λ m λ p λ m + λ p R 1 2 r = λ m λ e , N 2 λ m + λ e , N 2 R 0 2 r
The solution yields [3]
λ e , N 2 = λ m + λ p ϕ 2 λ m λ p λ m + λ p + ϕ 2 λ m λ p λ m
The dimensionless expression is
λ e , N 2 λ m = 1 + κ 2 ϕ 2 1 κ 2 1 + κ 2 + ϕ 2 1 κ 2
In this study, we employ the Maxwell–Eucken model as a representative conventional model that does not account for internal heat sources. By comparing the ETC values obtained from FEM simulations with those calculated using the Maxwell–Eucken model, we analyze the discrepancies between the two approaches to evaluate the influence of internal heat sources on ETC.

3. Results and Analysis

3.1. Typical Results

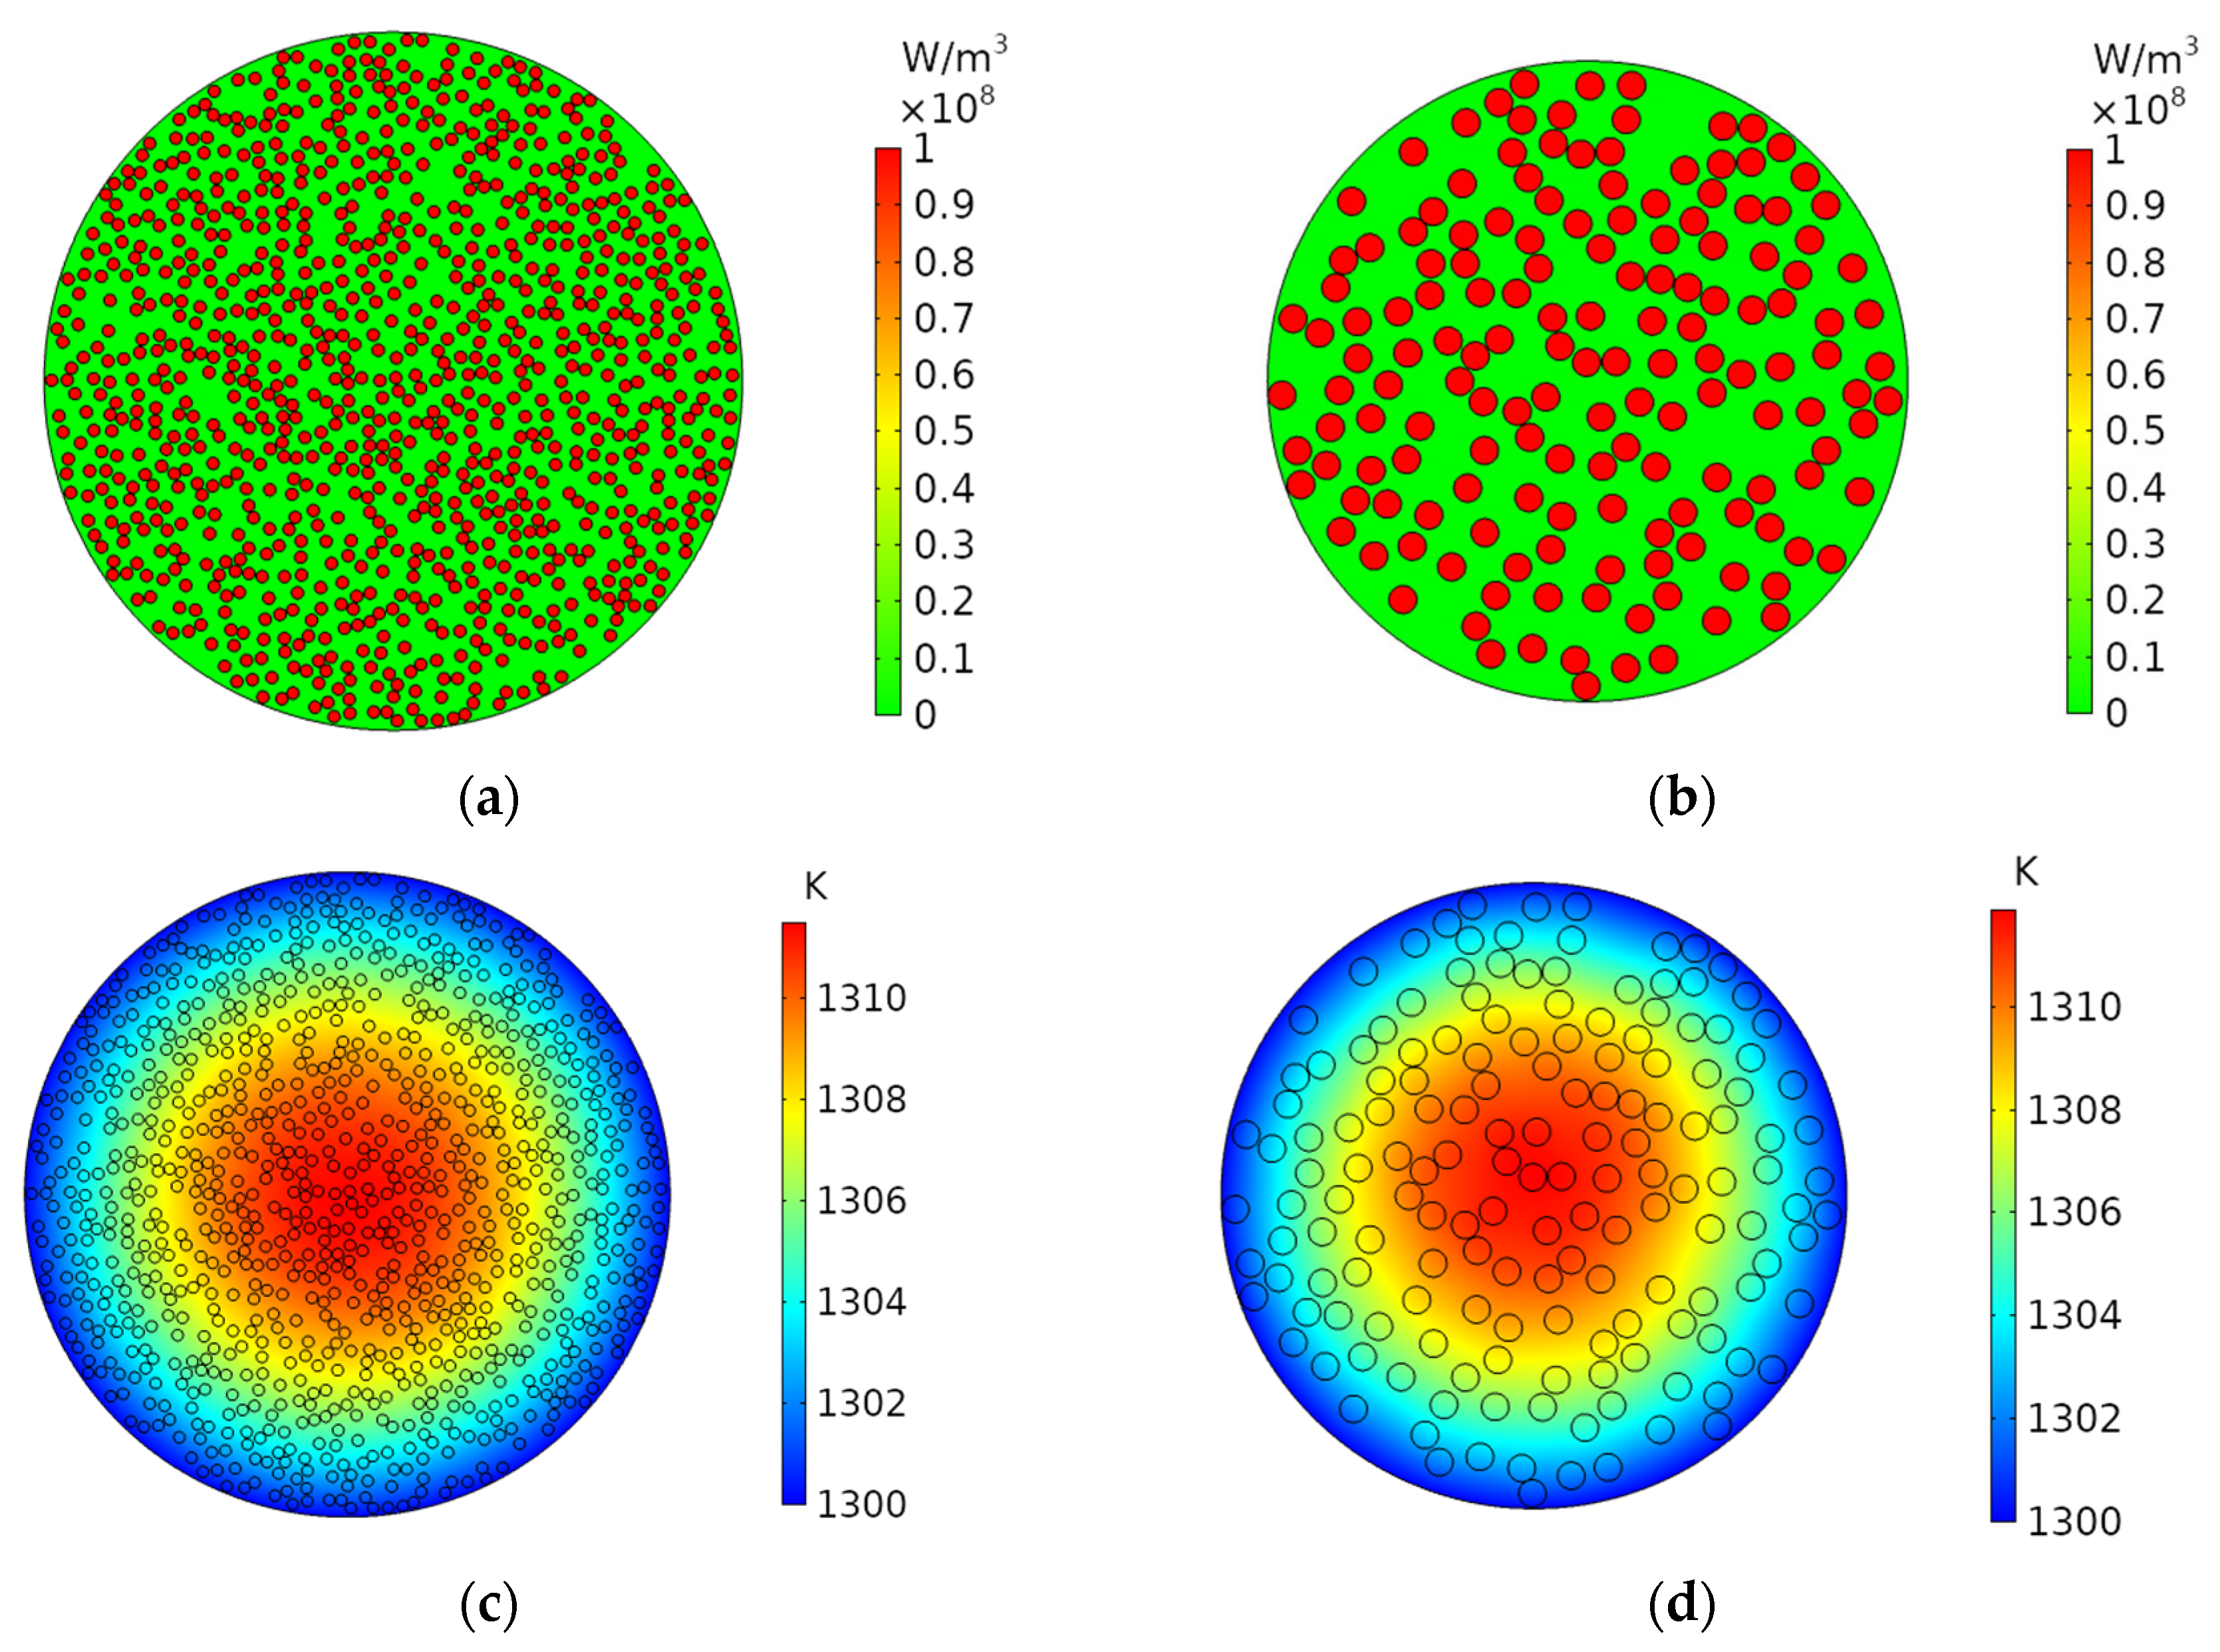
Figure 5 shows a randomly selected set of finite element results for two dispersed disks at κ 2   =   1 . Both cases have a filling fraction of ϕ 2   =   0.3 , with filling sizes of μ 2   =   0.017 and μ 2   =   0.043 , respectively. The boundary temperature was set to 1300 K, and the heat source power density was 1 × 10⁸ W/m3.
Figure 5a,b presents the power density distributions for two different μ 2 values. It can be observed that although both cases have the same filling fraction, the smaller μ 2 in Figure 5a leads to a more dispersed heat source. Figure 5c,d shows the corresponding temperature distributions of the dispersed disks.
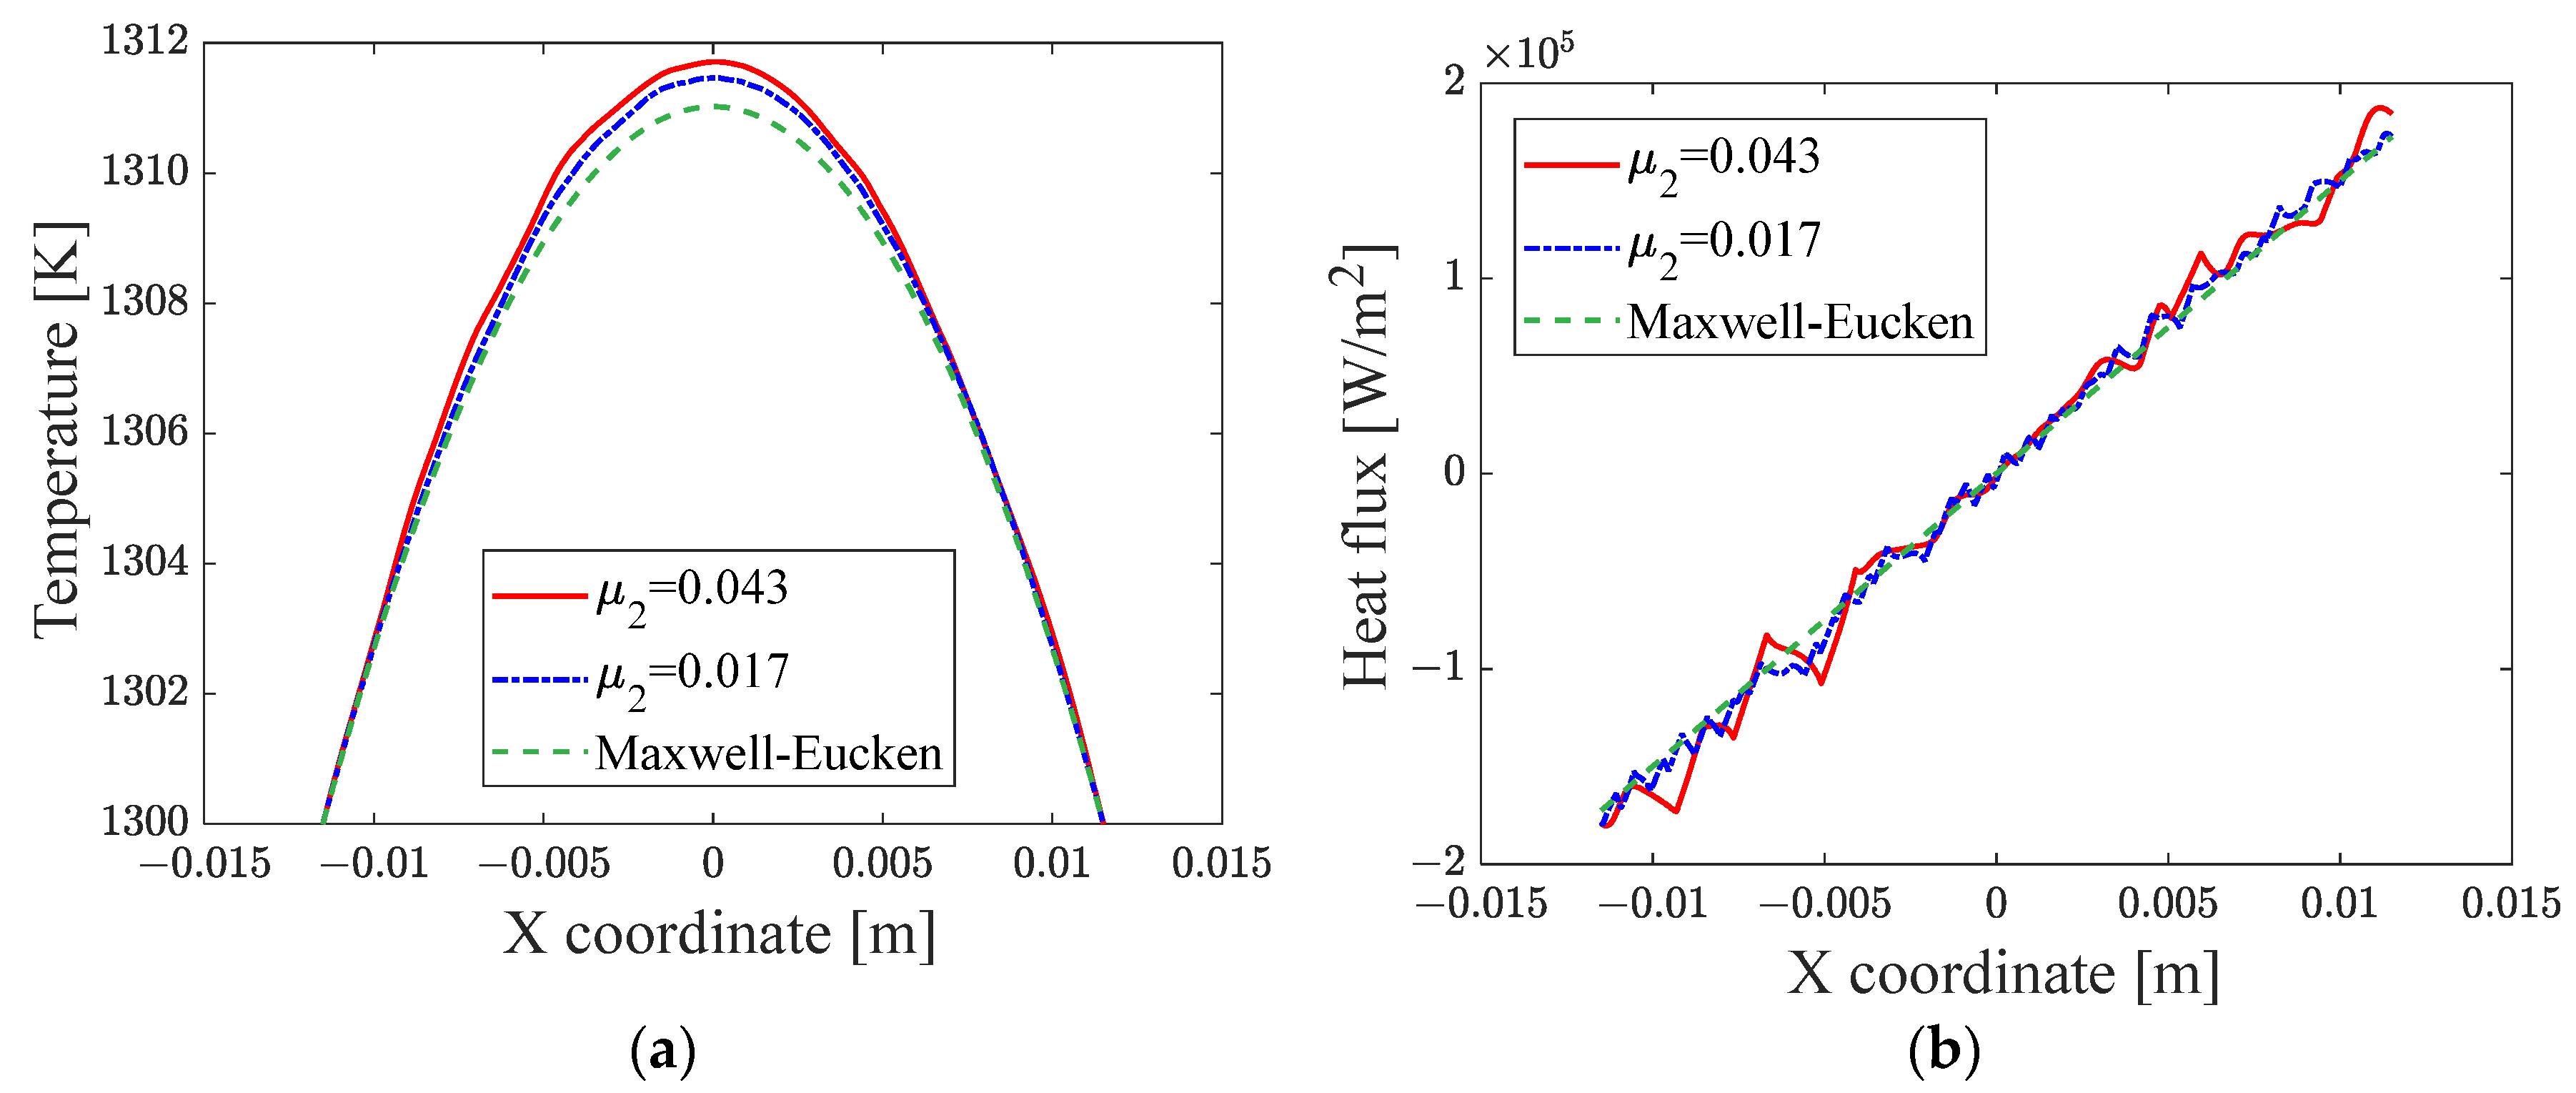
To examine the variations in temperature and heat flux in more detail, the diameter of the large disk along the x-axis was selected. The temperature distribution along this diameter and the heat flux in the positive x-axis direction were analyzed, as shown in Figure 6. In the figure, the red solid line represents the result for μ 2   =   0.043 , while the blue dash-dotted line corresponds to μ 2   =   0.017 . The green dashed line shows the result from the Maxwell–Eucken model. In fact, when κ 2   =   1 , the ETC values predicted by classical models, including the Maxwell–Eucken model, reduce to the thermal conductivity of the matrix, i.e., 90 W/(m·K).
Figure 6a shows the temperature distribution along the diameter. It can be seen that the conventional model predicts lower temperatures than the actual results and that larger μ 2 values correspond to higher temperatures. This directly demonstrates that the presence of internal heat sources and their size variations influence the ETC of the dispersed disks.
For the homogenized disk, the radial heat flux q ( r ) is expressed according to Equation (2) as
q ( r ) = λ e d T d r = S 2 r
Therefore, in Figure 6b, the green dotted line represents a straight line with a slope of S / 2 . However, the actual heat flux distribution is not linear; local fluctuations occur due to the presence of internal heat sources, and the amplitude of these fluctuations increases with a larger μ 2 . The greater the local temperature rise caused by the internal heat sources, the higher the overall temperature distribution and the average temperature, leading to a reduction in the ETC.
In this paper, by varying the combinations of μ 2 , ϕ 2 , and κ 2 , extensive numerical simulations were carried out to obtain the ETC results for dispersed disk domains. By holding two parameters constant and varying the third, the influence of each parameter on the ETC could be systematically examined. In addition, the Maxwell–Eucken model was used to compute the ETC within the same parameter space for comparison. The range of parameters covered in this study is as follows: 0.01 μ 2 0.17 , 0.01 ϕ 2 0.5 , and 10 3 κ 2 10 3 .
For ease of comparison, both the finite element results and the conventional model predictions are nondimensionalized by dividing the ETC values by the matrix thermal conductivity λ m .

3.2. Influence of Filler Size μ 2

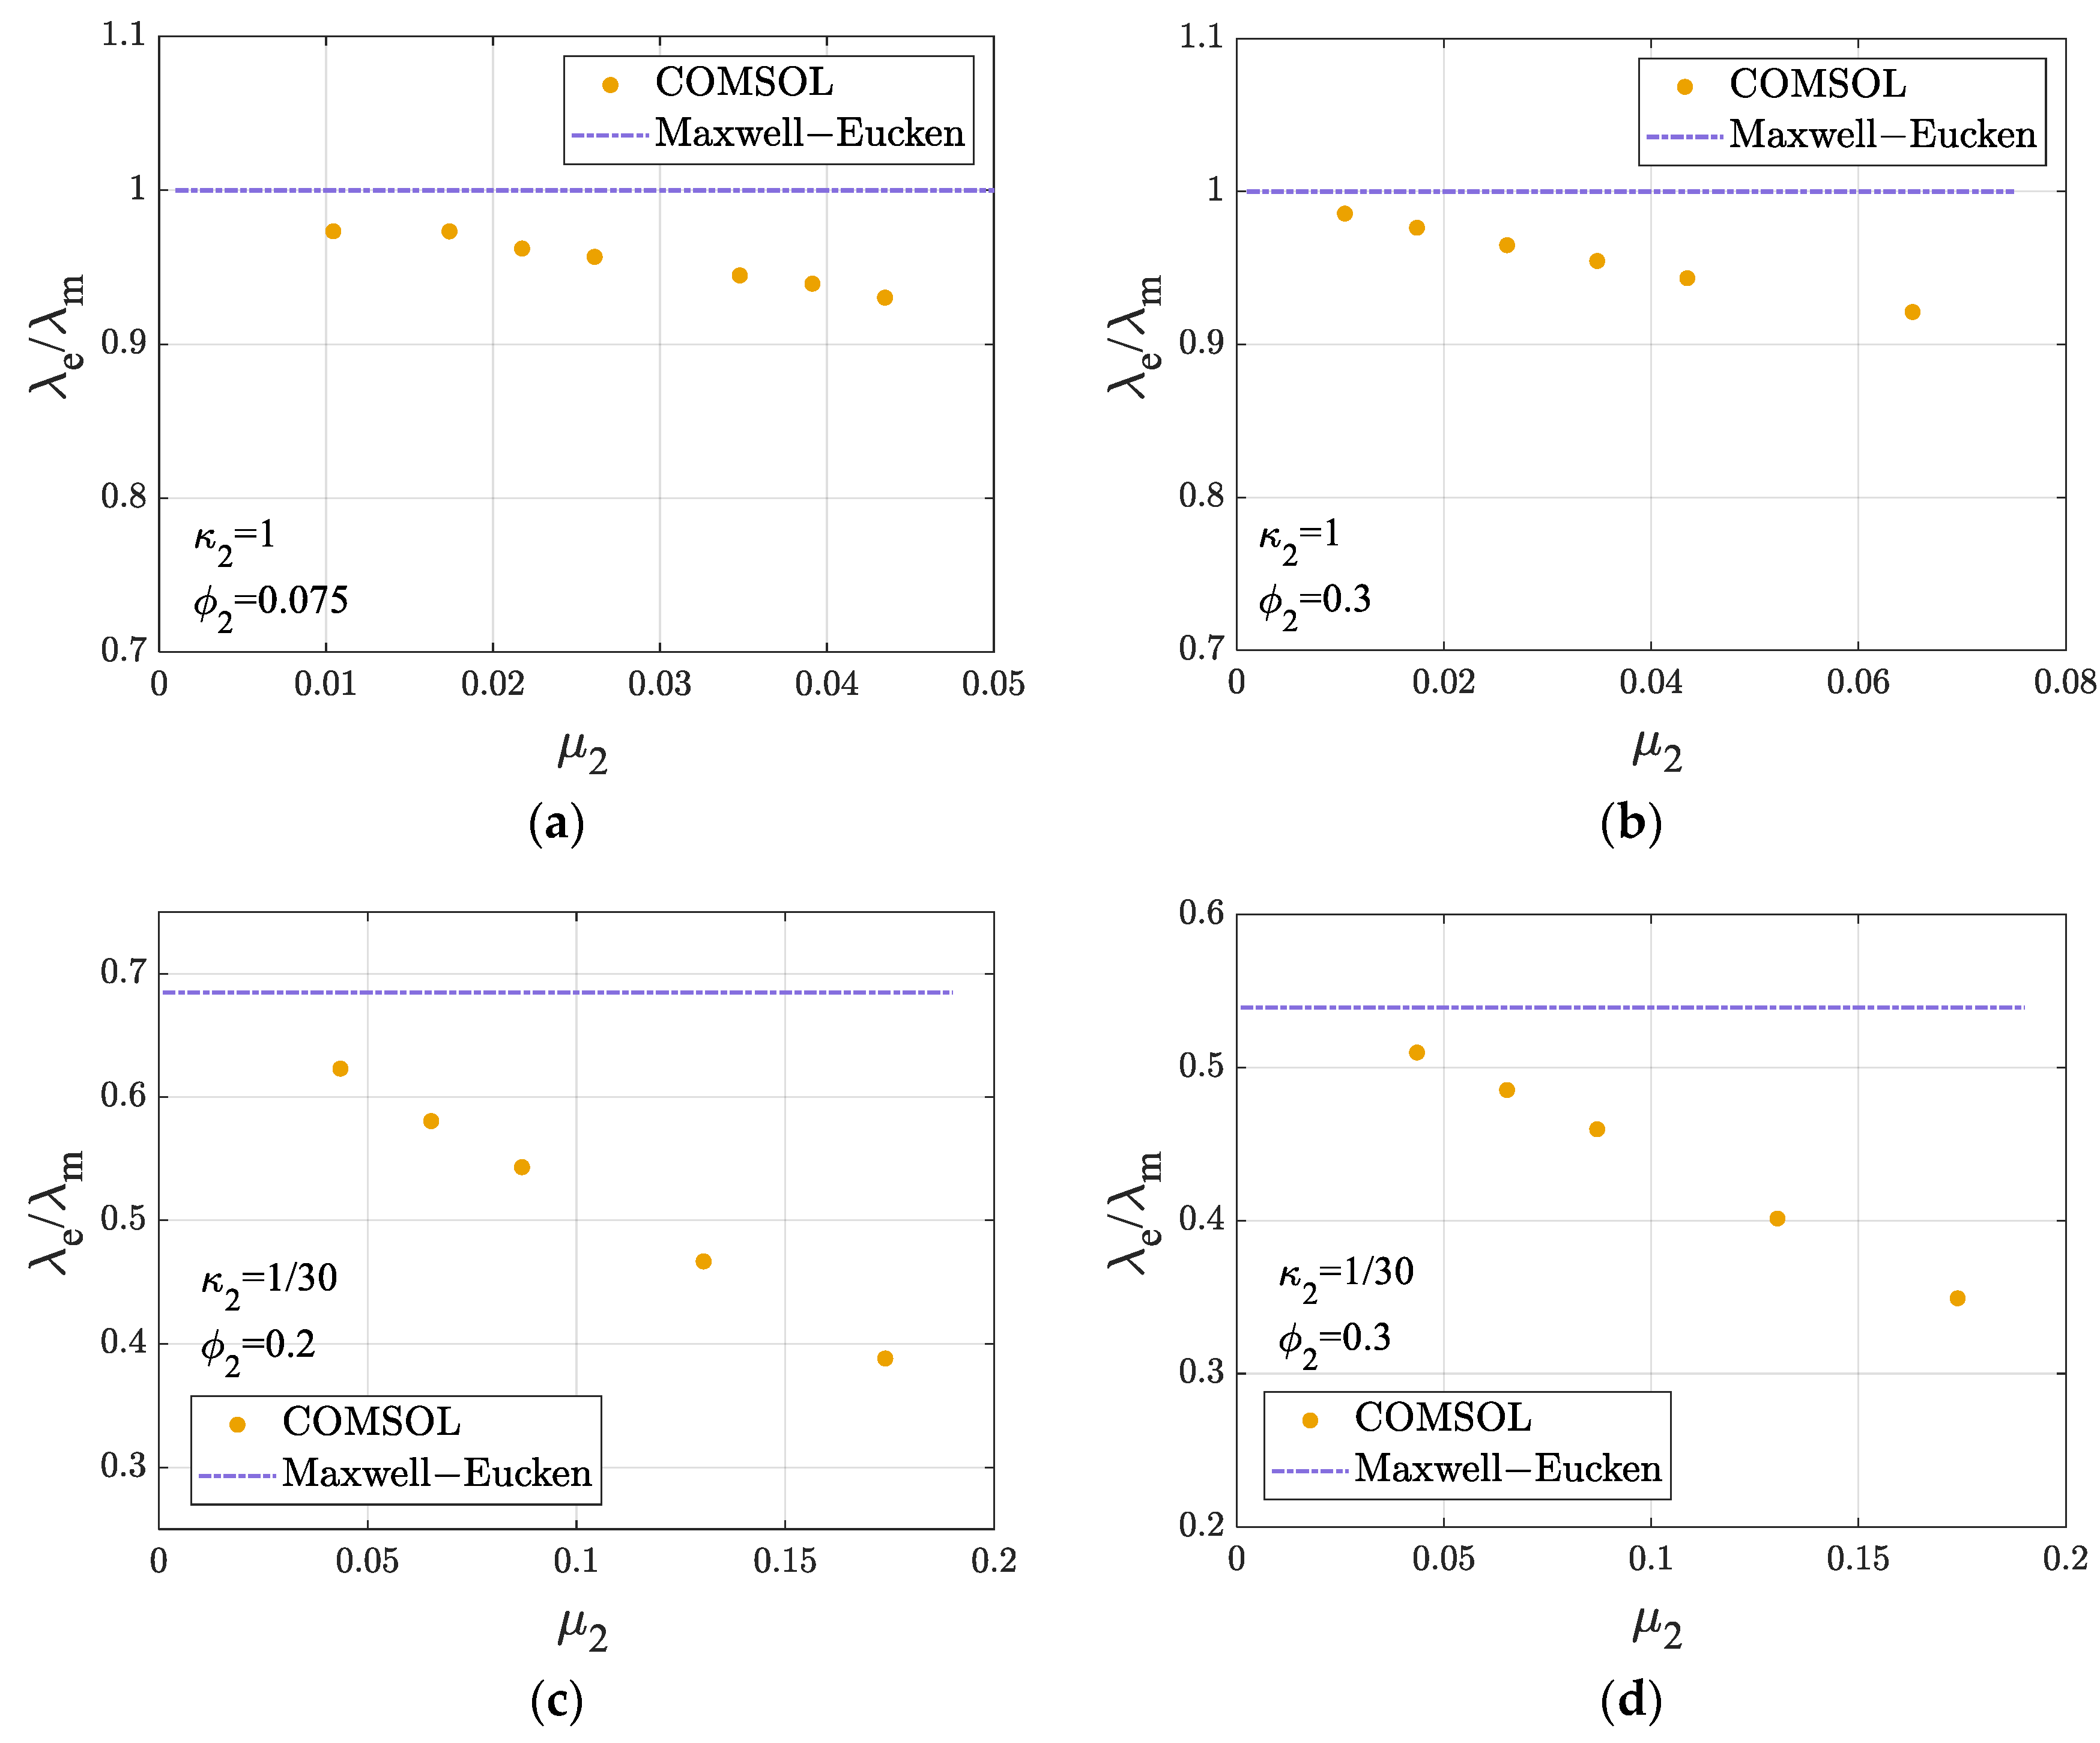
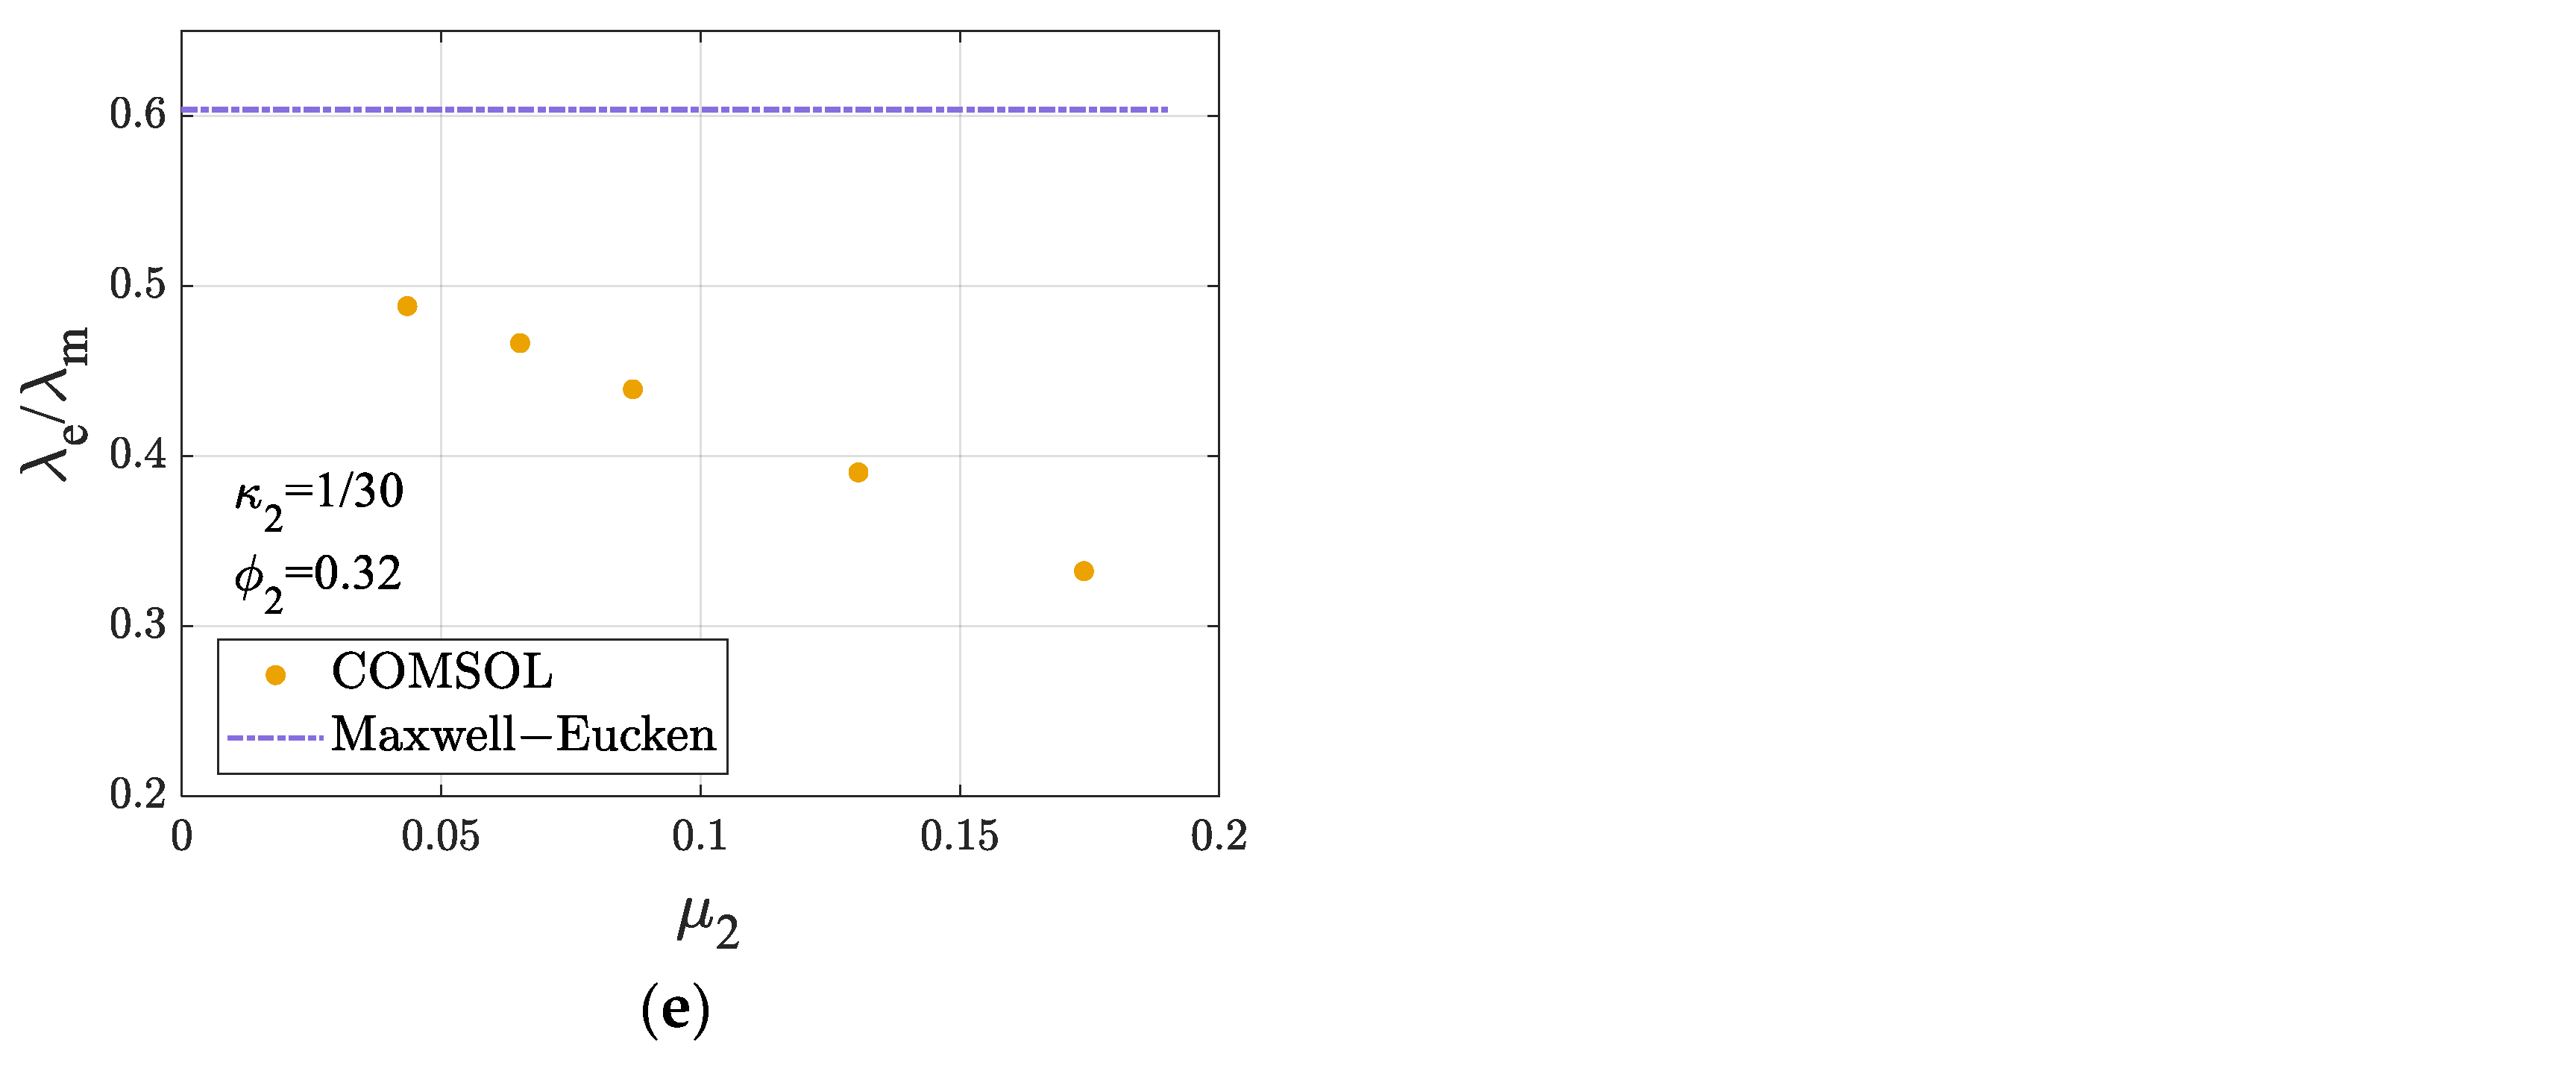
Figure 7 illustrates the variation in the dimensionless ETC with the internal heat source size μ 2 , while keeping κ 2   and ϕ 2 constant. Under different combinations of κ 2   and ϕ 2 , the ETC of the dispersed disk domain decreases as the μ 2 increases. Even when κ 2   =   1 —indicating that the dispersed phase and the matrix are made of the same material and the only effect arises from internal heat generation—the ETC still varies with the μ 2 .
When the filling fraction remains unchanged, the parameter μ 2 reflects the degree of clustering of internal heat sources: a larger μ 2 corresponds to more localized aggregation, which leads to a higher temperature rise in the heat source regions. This elevated local temperature increases the overall average temperature of the domain, thereby reducing the corresponding ETC.
The Maxwell–Eucken model yields a constant ETC when κ 2 and ϕ 2 are fixed, as it does not account for variations in the internal heat source size. This limitation arises because the model expression in Equation (8) only includes two parameters: κ 2 and ϕ 2 . A comparison between the FEM ETC and the values predicted by the Maxwell–Eucken model shows that the conventional model consistently overestimates the ETC. This overestimation is consistent with observations previously reported in composite plates, particle-dispersed spheres, and particle-dispersed cylinders.
Figure 7 also shows that as μ 2 decreases, the deviation between the Maxwell–Eucken model predictions and the numerical results becomes smaller. This suggests that the influence of the internal heat source size on the ETC diminishes as the source size becomes smaller.
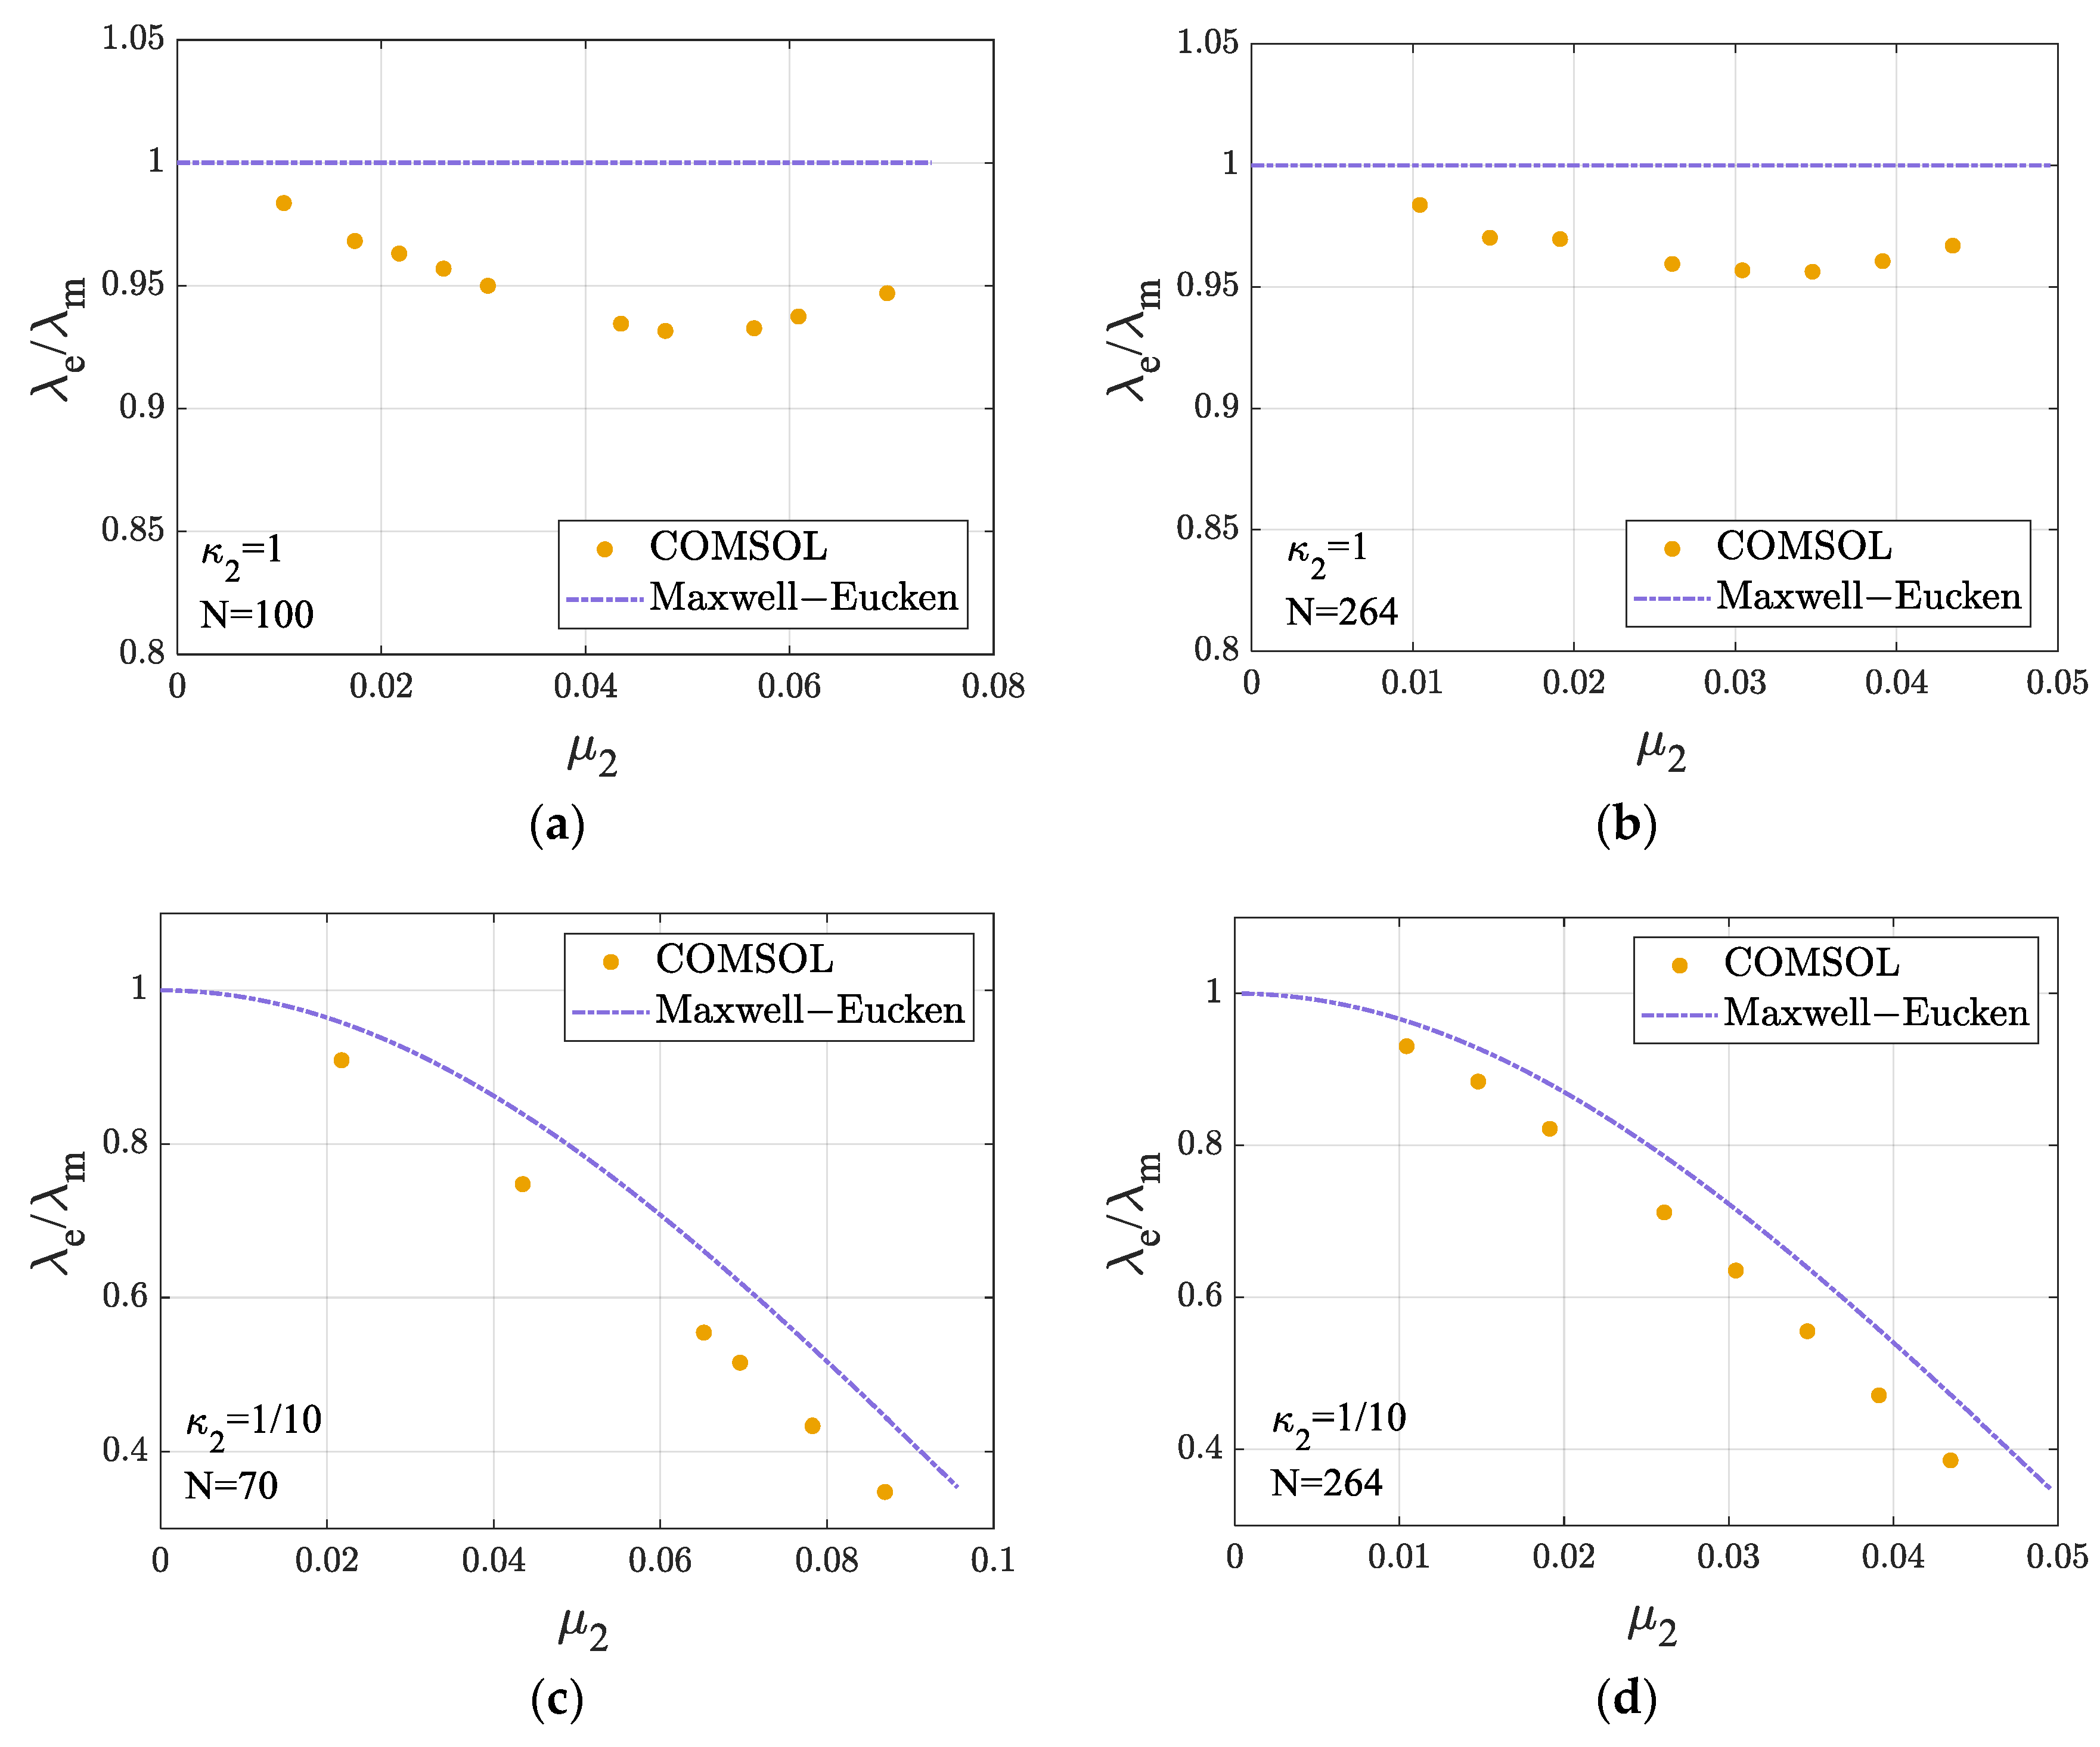
Figure 8 shows the variation in the ETC with μ 2 under a fixed number of particles N . It can be observed that the trend in the ETC with respect to μ 2 differs between κ 2   =   1 and κ 2   =   1 10 .
From Figure 8a,b, it can be observed that when κ 2   =   1 , the conventional model yields a constant ETC of 1, whereas the mean ETC of the actual disk domain first decreases and then increases with increasing μ 2 . Since the filling fraction in the disk domain is given by ϕ 2   =   N μ 2 2 , variations in μ 2 also lead to changes in ϕ 2 when N is fixed. As a result, the observed variation in the ETC reflects the combined influence of both μ 2 and ϕ 2 .
As shown in Figure 8c,d, when κ 2   =   1 10 , both the actual ETC and the values predicted by the Maxwell–Eucken model decrease monotonically with increasing μ 2 . However, the Maxwell–Eucken model still overestimates the ETC.
It is worth noting that under a fixed N , the actual ETC approaches the Maxwell–Eucken prediction as μ 2 tends toward zero.

3.3. Influence of Filling Fraction ϕ 2

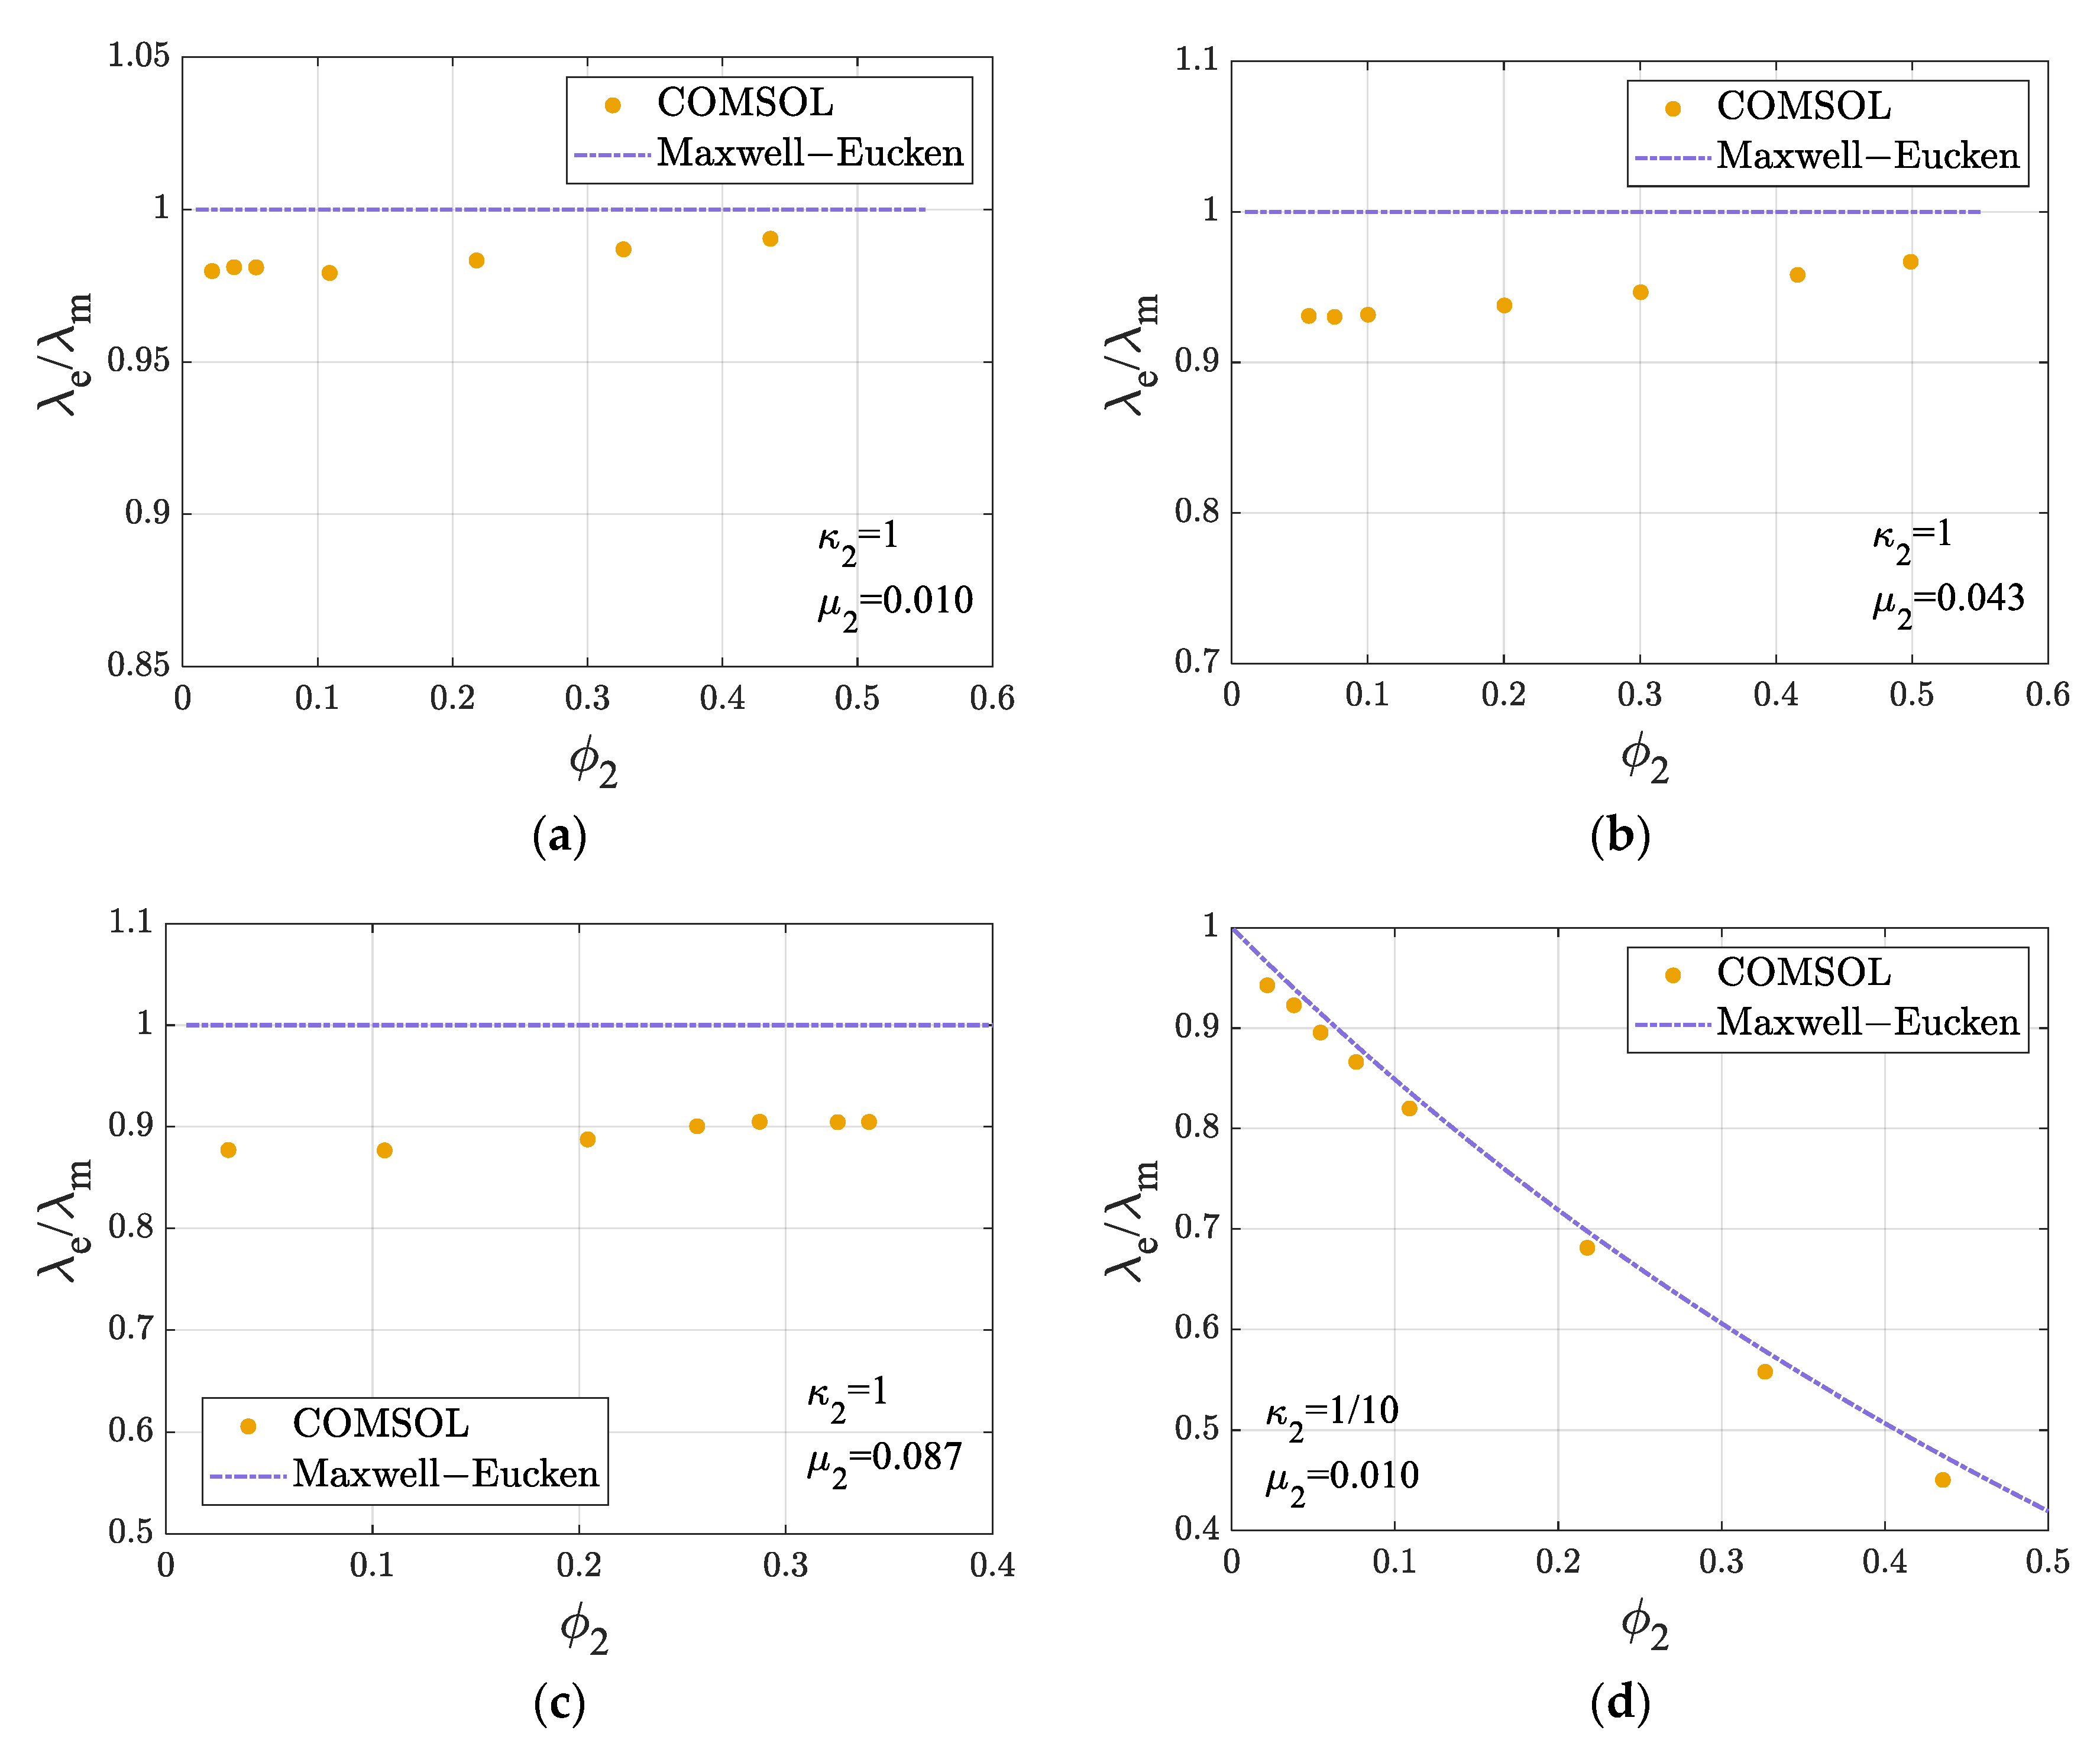
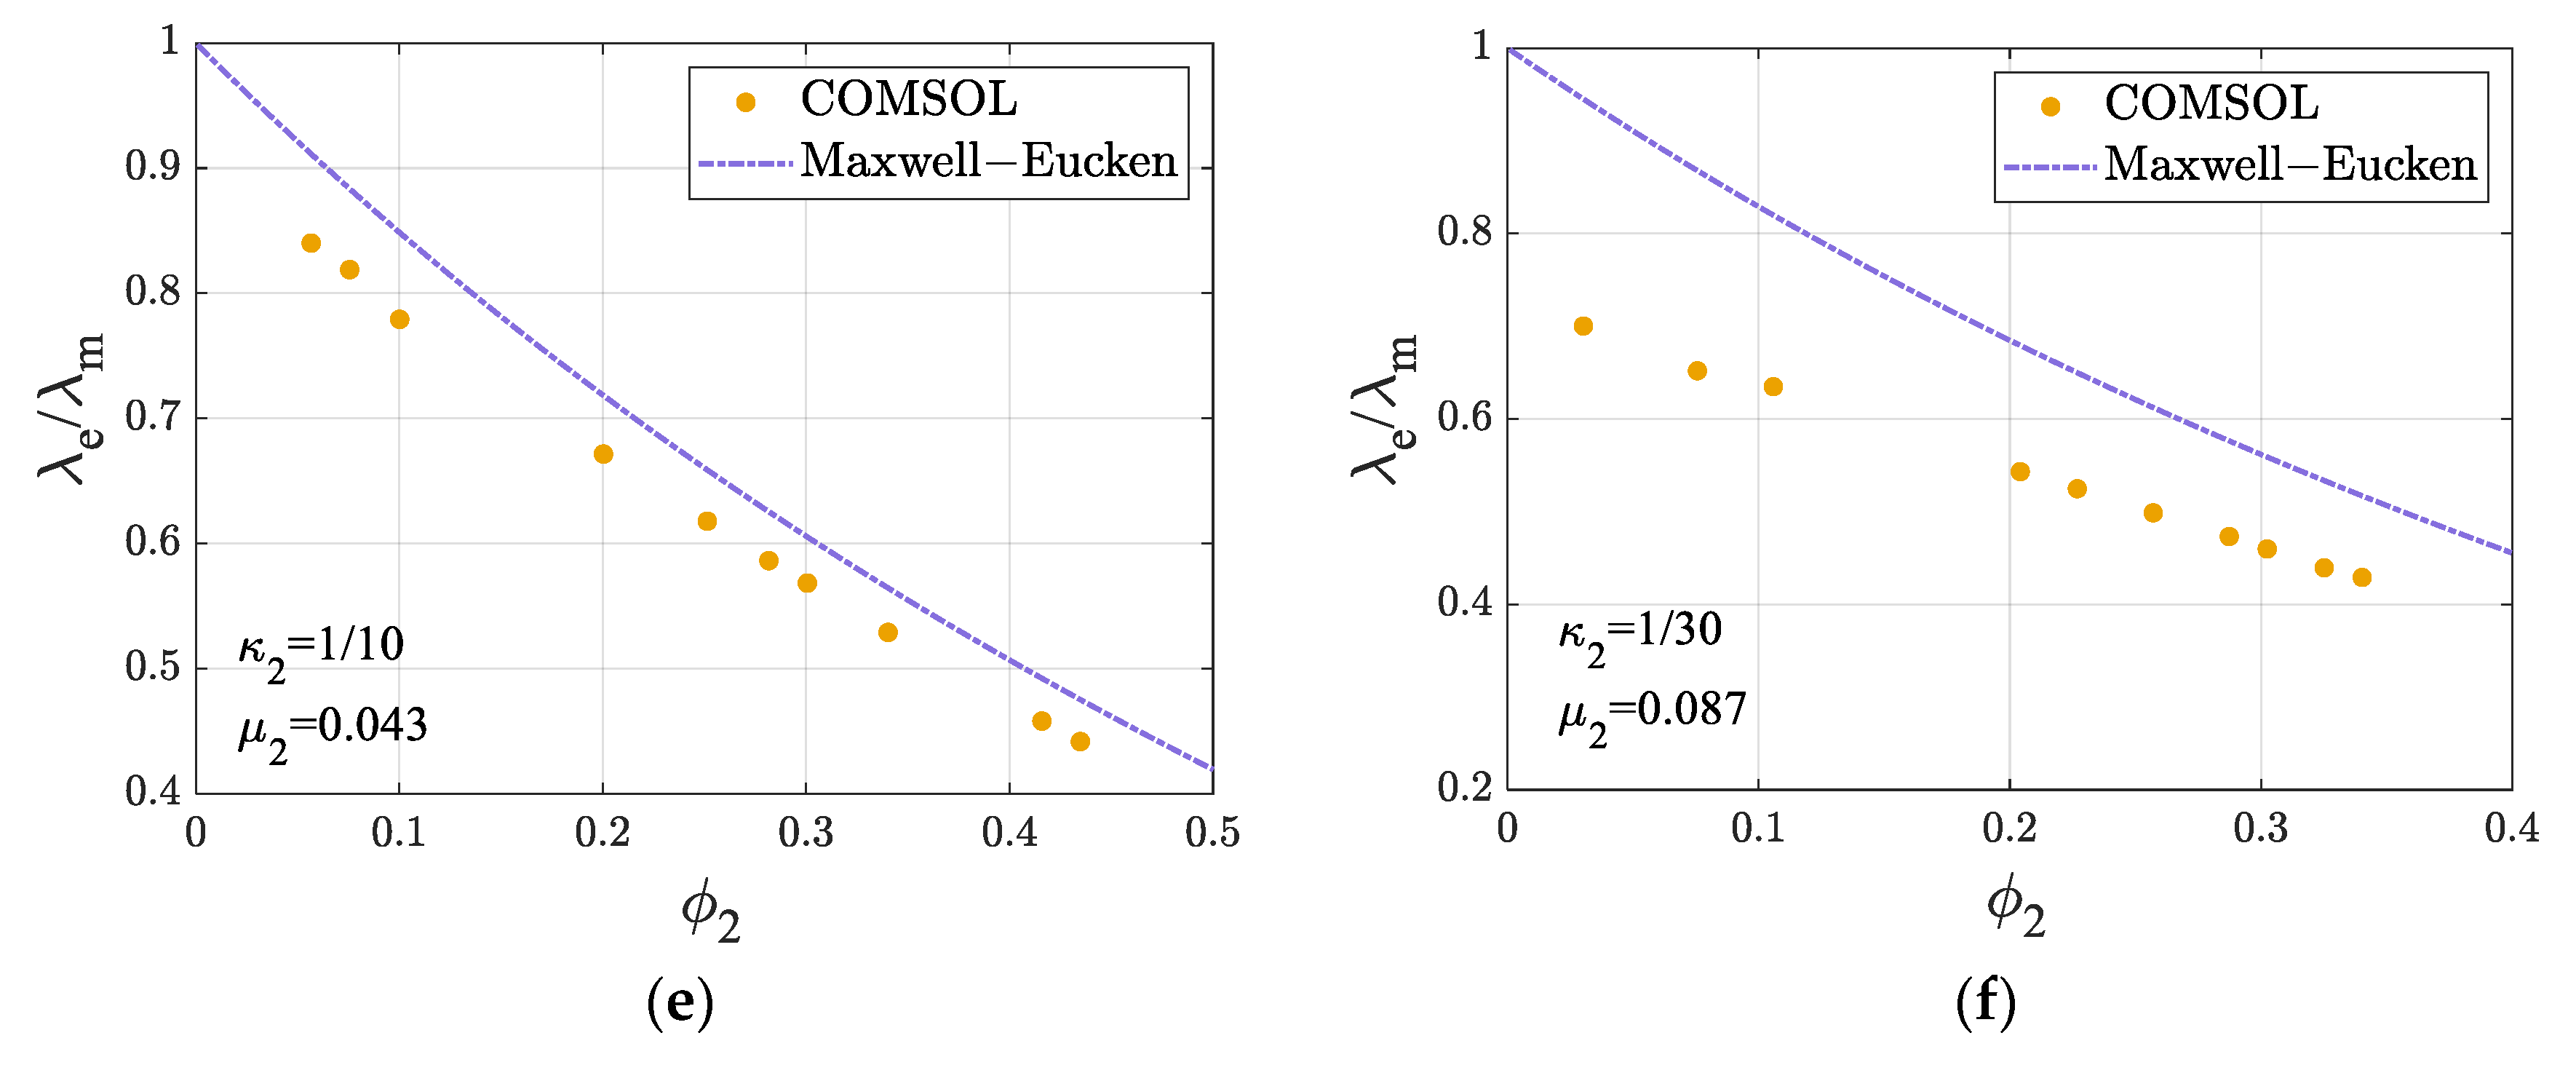
Figure 9 illustrates the variation in the dimensionless ETC with the filling fraction ϕ 2 . Overall, the Maxwell–Eucken model consistently overestimates the ETC. As shown in Figure 9a–c, when κ 2   =   1 , the ETC without internal heat sources remains constant at 1. However, the presence of internal heat sources—regardless of their proportion—reduces the ETC below that of the no-source case. Moreover, as ϕ 2 increases, the ETC tends to increase as well.
As shown in Figure 9d–f, when κ 2   <   1 , the ETC decreases with the increasing filling fraction ϕ 2 . This occurs because κ 2   <   1 indicates that the thermal conductivity of the dispersed phase is lower than that of the matrix. As the filling fraction of the dispersed phase increases, it naturally reduces the overall ETC.
By comparing the plots in Figure 9 for the same κ 2 with different μ 2 values—specifically Figure 9a–c for κ 2   =   1 and Figure 9d,e for κ 2   =   1 10 —it can be observed that a smaller μ 2 leads to closer agreement between the actual ETC and the predictions of the Maxwell–Eucken model. This trend is consistent with the behavior discussed in Section 3.2.

3.4. Influence of Thermal Conductivity κ 2

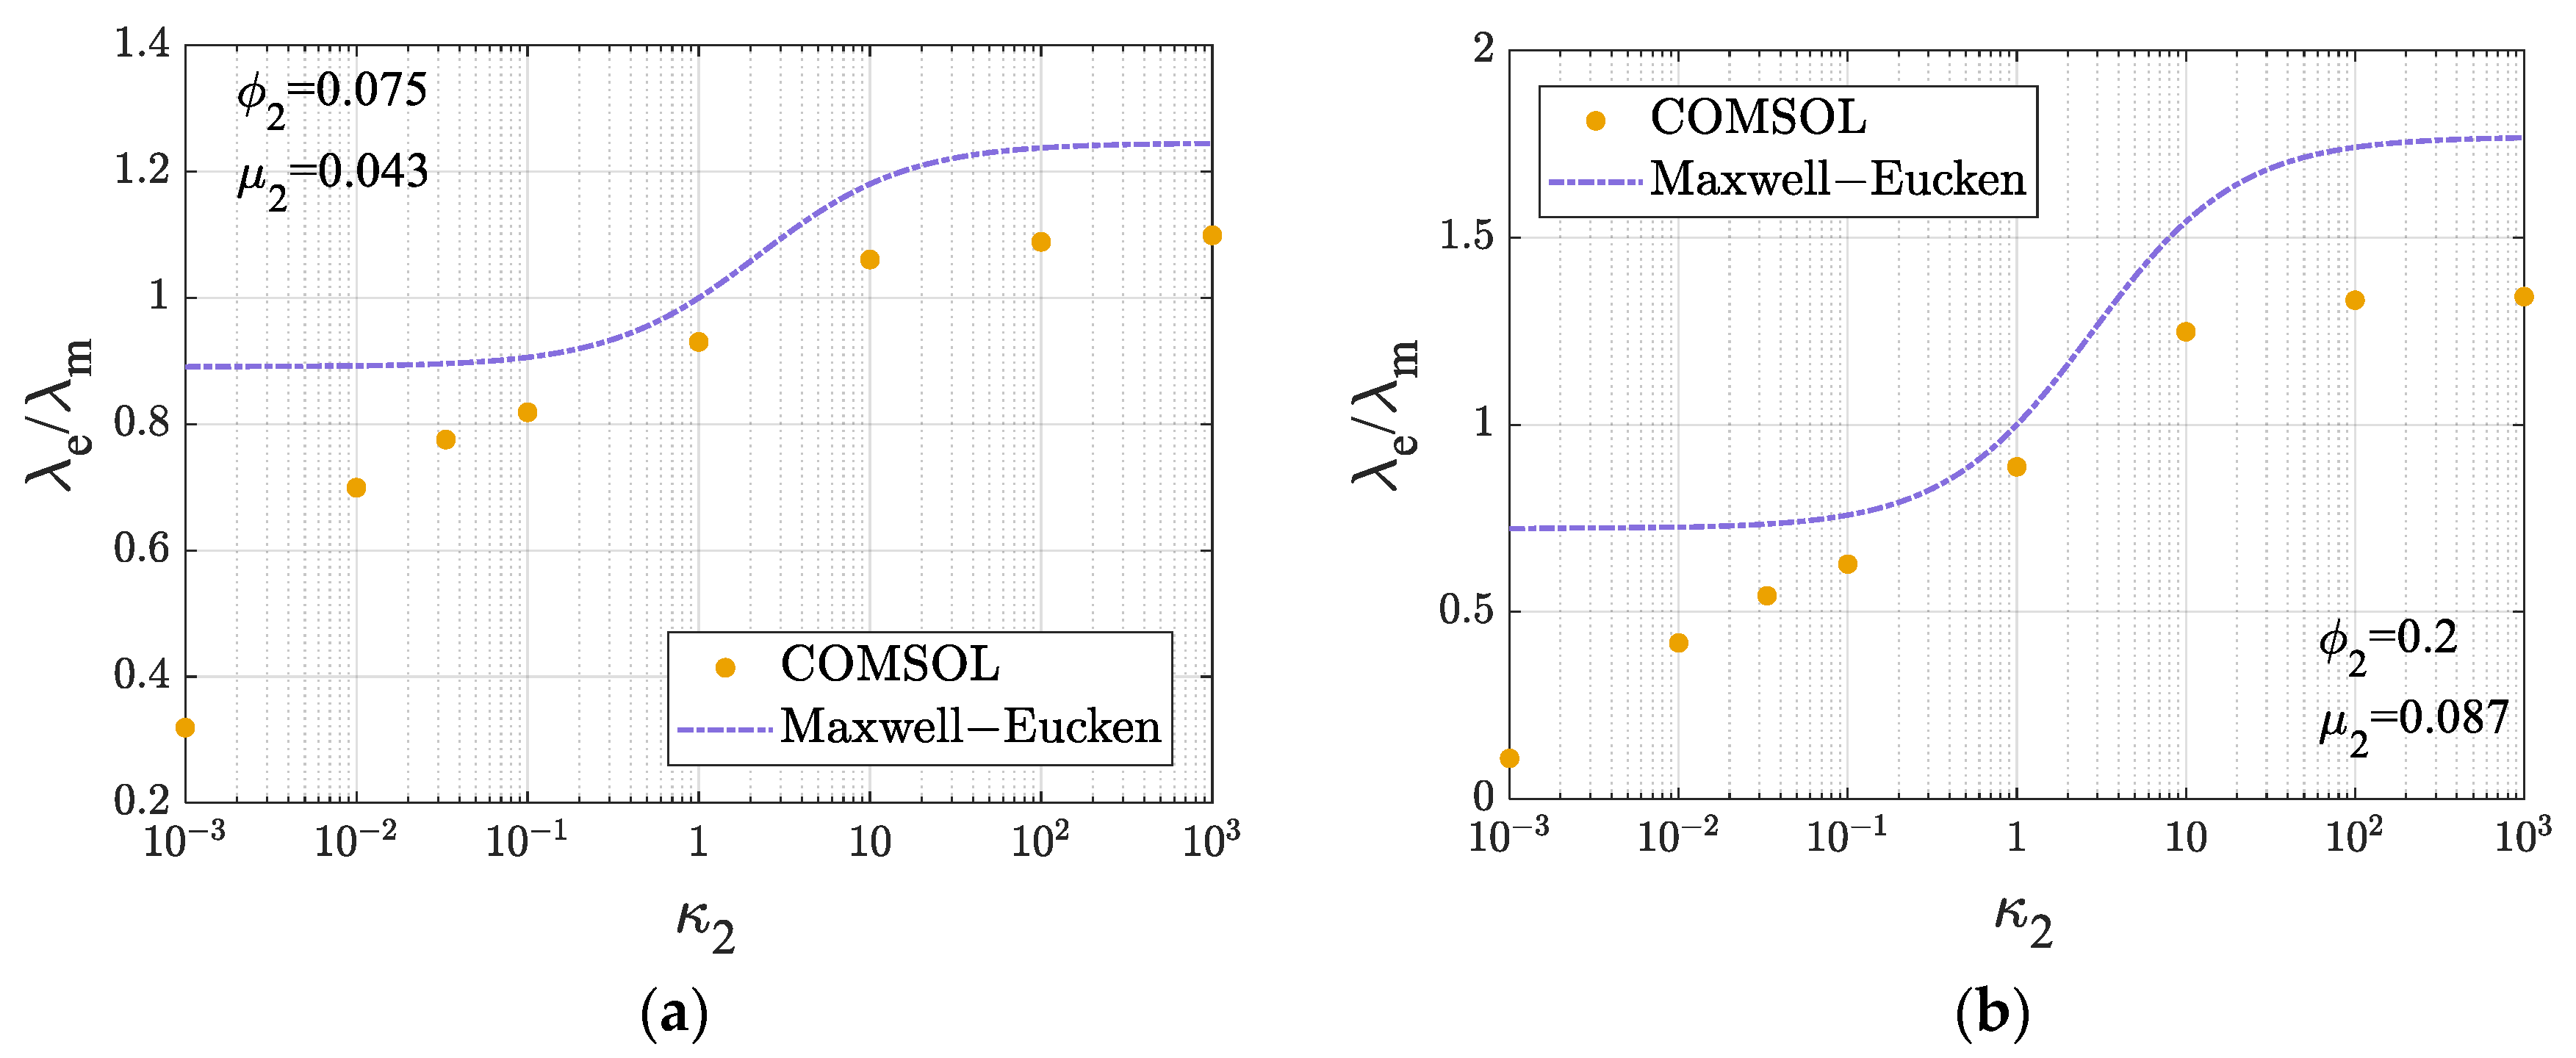
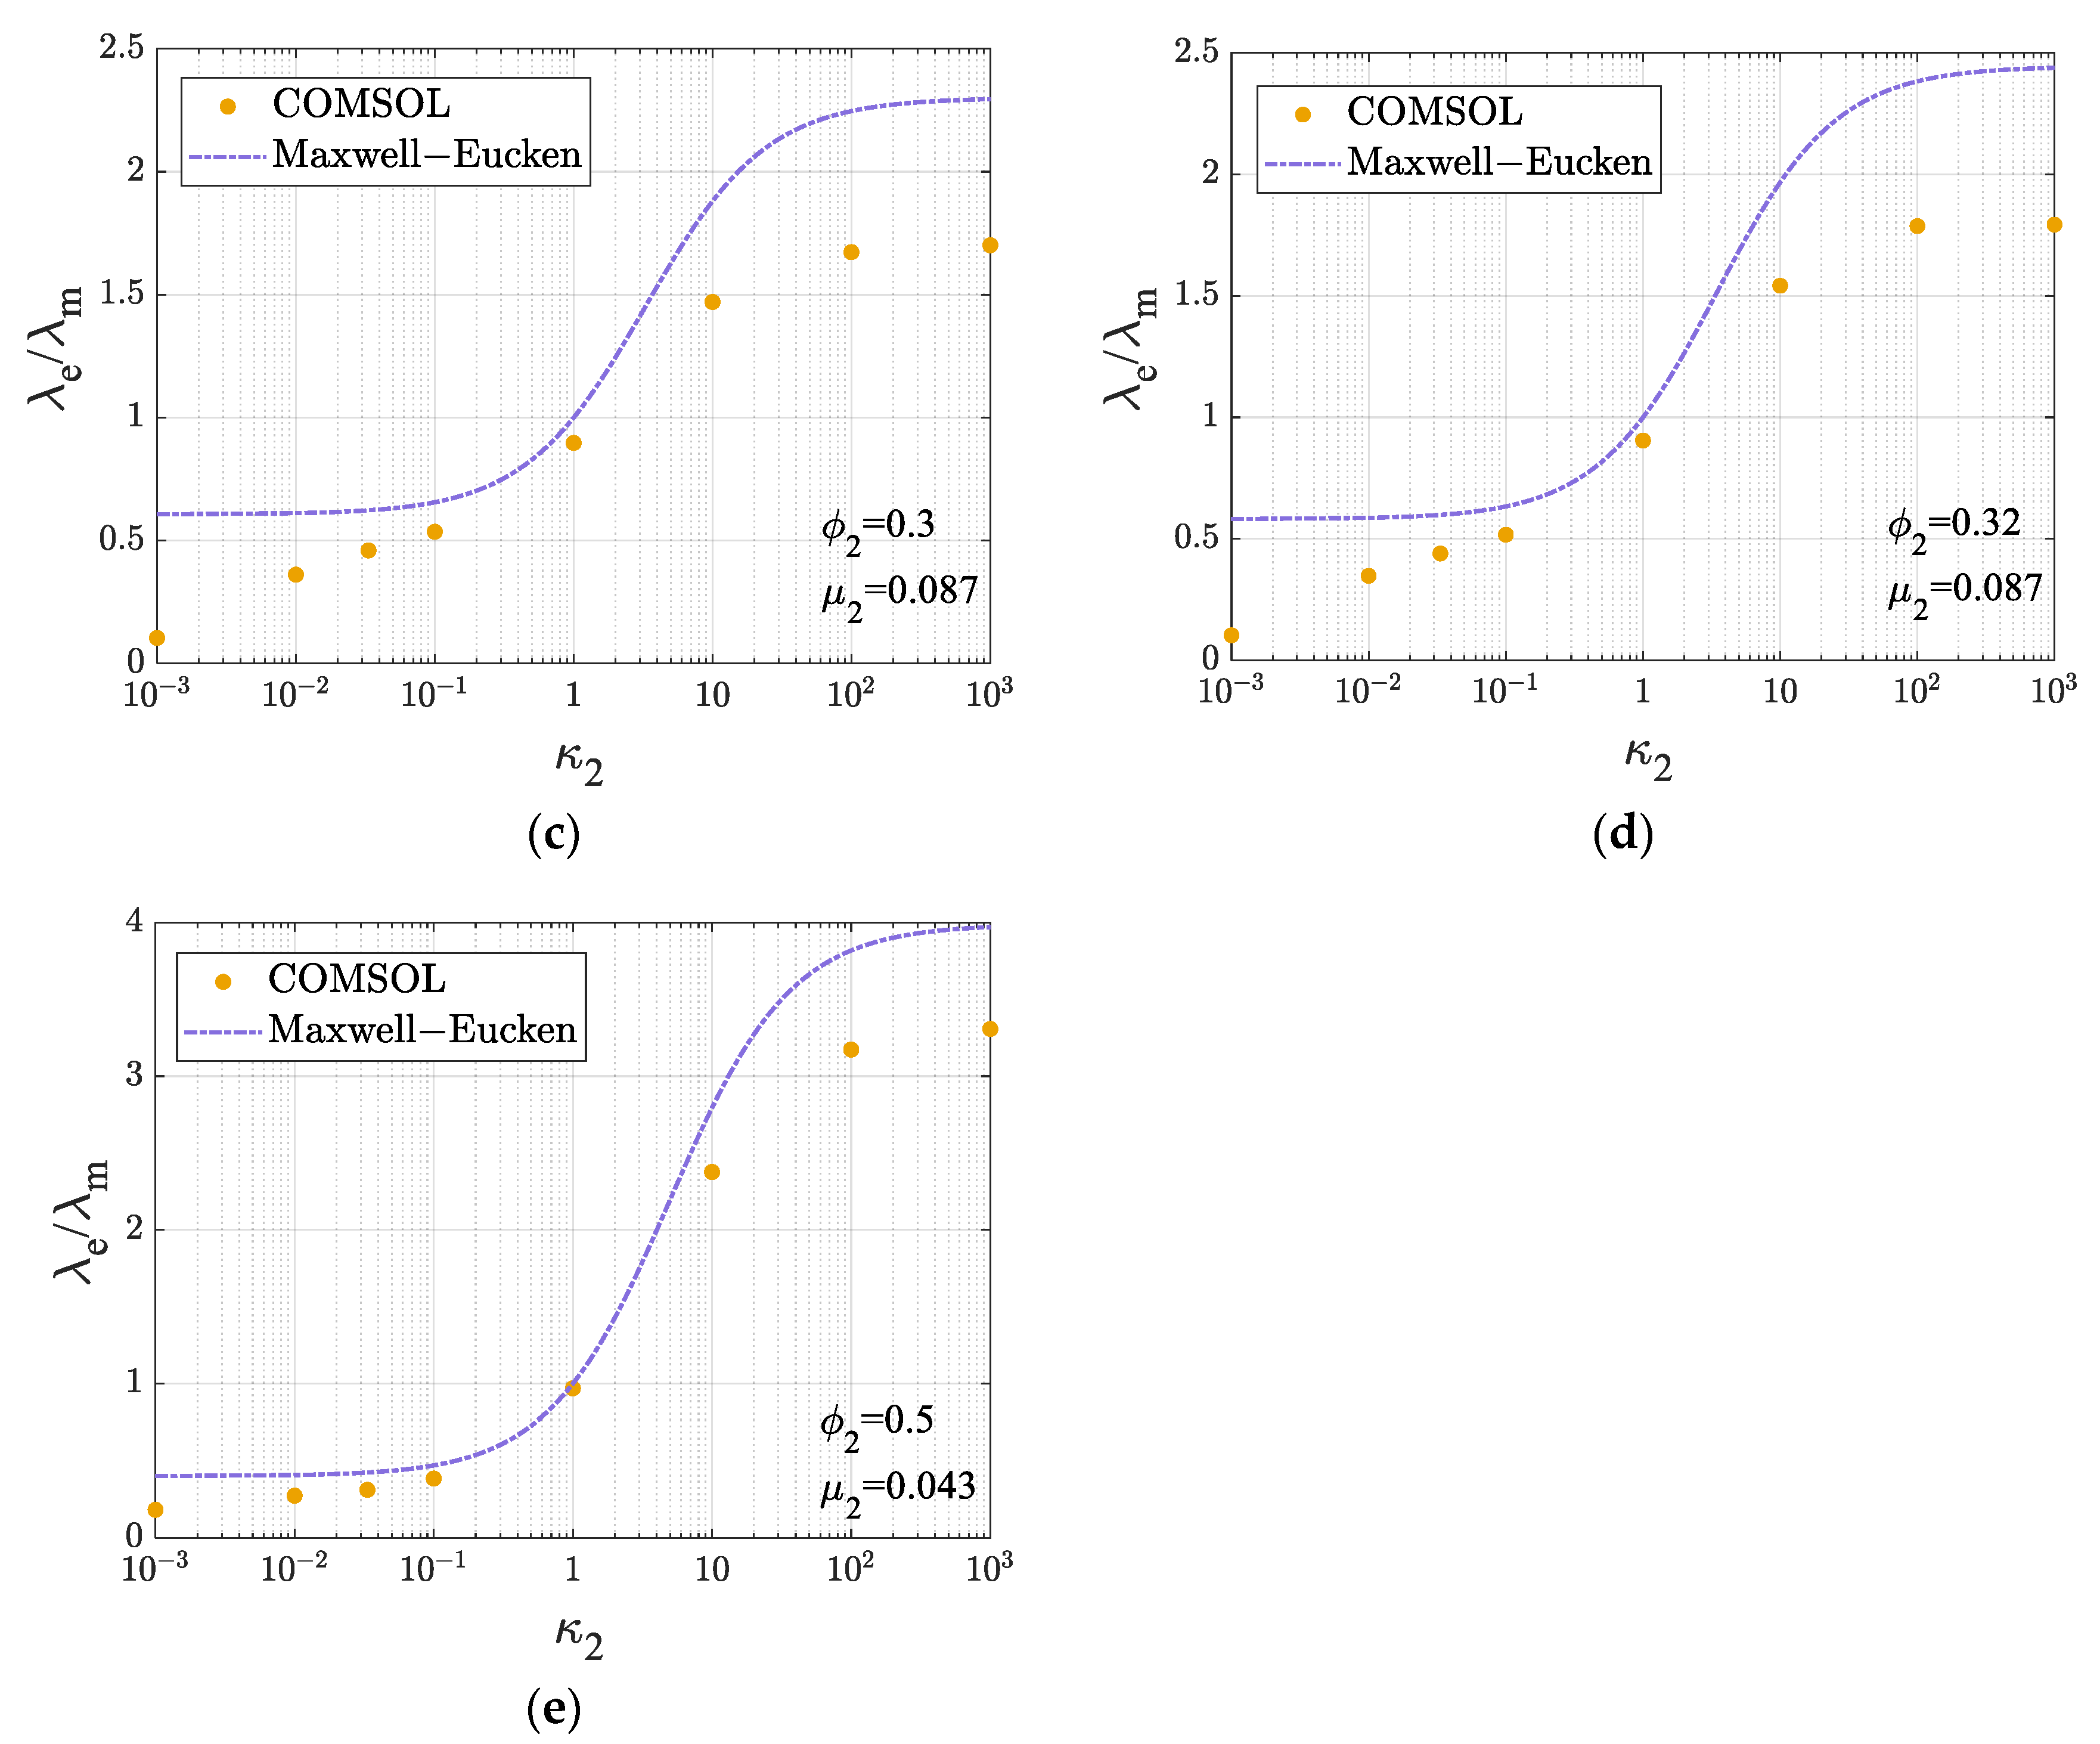
Figure 10 presents the variation in the ETC for the dispersed disk with respect to κ 2 , under fixed values of ϕ 2 and μ 2 . As part of the parametric investigation, κ 2 spans a wide range from 10−3 to 103. Overall, both the actual dimensionless ETC and the predictions of the Maxwell–Eucken model increase with increasing κ 2 . Consistently, the Maxwell–Eucken model consistently overestimates the ETC. Since κ 2 represents the dimensionless thermal conductivity of the filler phase, it is expected that the increasing κ 2 leads to a higher ETC.
As shown in Figure 10, the curve of the Maxwell–Eucken model gradually levels off as κ 2 approaches either 10−3 or 103. Taking the limits of the Maxwell–Eucken expression in Equation (8) yields
lim κ 2 0 λ e , N 2 λ m = 1 ϕ 2 1 + ϕ 2 = 1 2 ϕ 2 1 + ϕ 2
lim κ 2 λ e , N 2 λ m = 1 + ϕ 2 1 ϕ 2 = 1 + 2 ϕ 2 1 ϕ 2
The ETC predicted by the conventional Maxwell–Eucken model approaches a constant value as κ 2 tends toward either zero or infinity, and this value depends solely on the filling fraction ϕ 2 .
The FEM ETC also tends to level off as κ 2 approaches 103, indicating the existence of a limiting value. This behavior arises because the filler phase and the internal heat source are made of the same material. When the thermal conductivity of the filler phase becomes sufficiently large, the temperature rise within it becomes negligible. As a result, further increases in its thermal conductivity no longer produce a significant change in the overall average temperature. In the limiting case where the filler phase has infinite thermal conductivity, the temperature rise in the heat-generating region becomes zero, and the overall average temperature is determined solely by the filling fraction ϕ 2 and the geometric size μ 2 .
As κ 2 decreases, the FEM ETC continues to decline without leveling off toward a limiting value. This is because the filler phase itself serves as the internal heat source. When the thermal conductivity of the filler phase decreases, the temperature rise within the filler region increases accordingly, which raises the overall average temperature and leads to a further reduction in the ETC. This behavior is a distinct feature of systems with internal heat sources—conventional models are unable to capture this coupling effect between thermal conductivity variation and heat generation.

4. Discussion

Since an expression for the ETC of dispersed disks has not yet been derived, we choose to analyze the impact of internal heat sources by starting with the expression for the ETC of one-dimensional plates. This is because the one-dimensional composite plate is the simplest form of internal heat source problems. We investigate the relationship between the variations in the ETC of dispersed disks and the expression for composite plates.
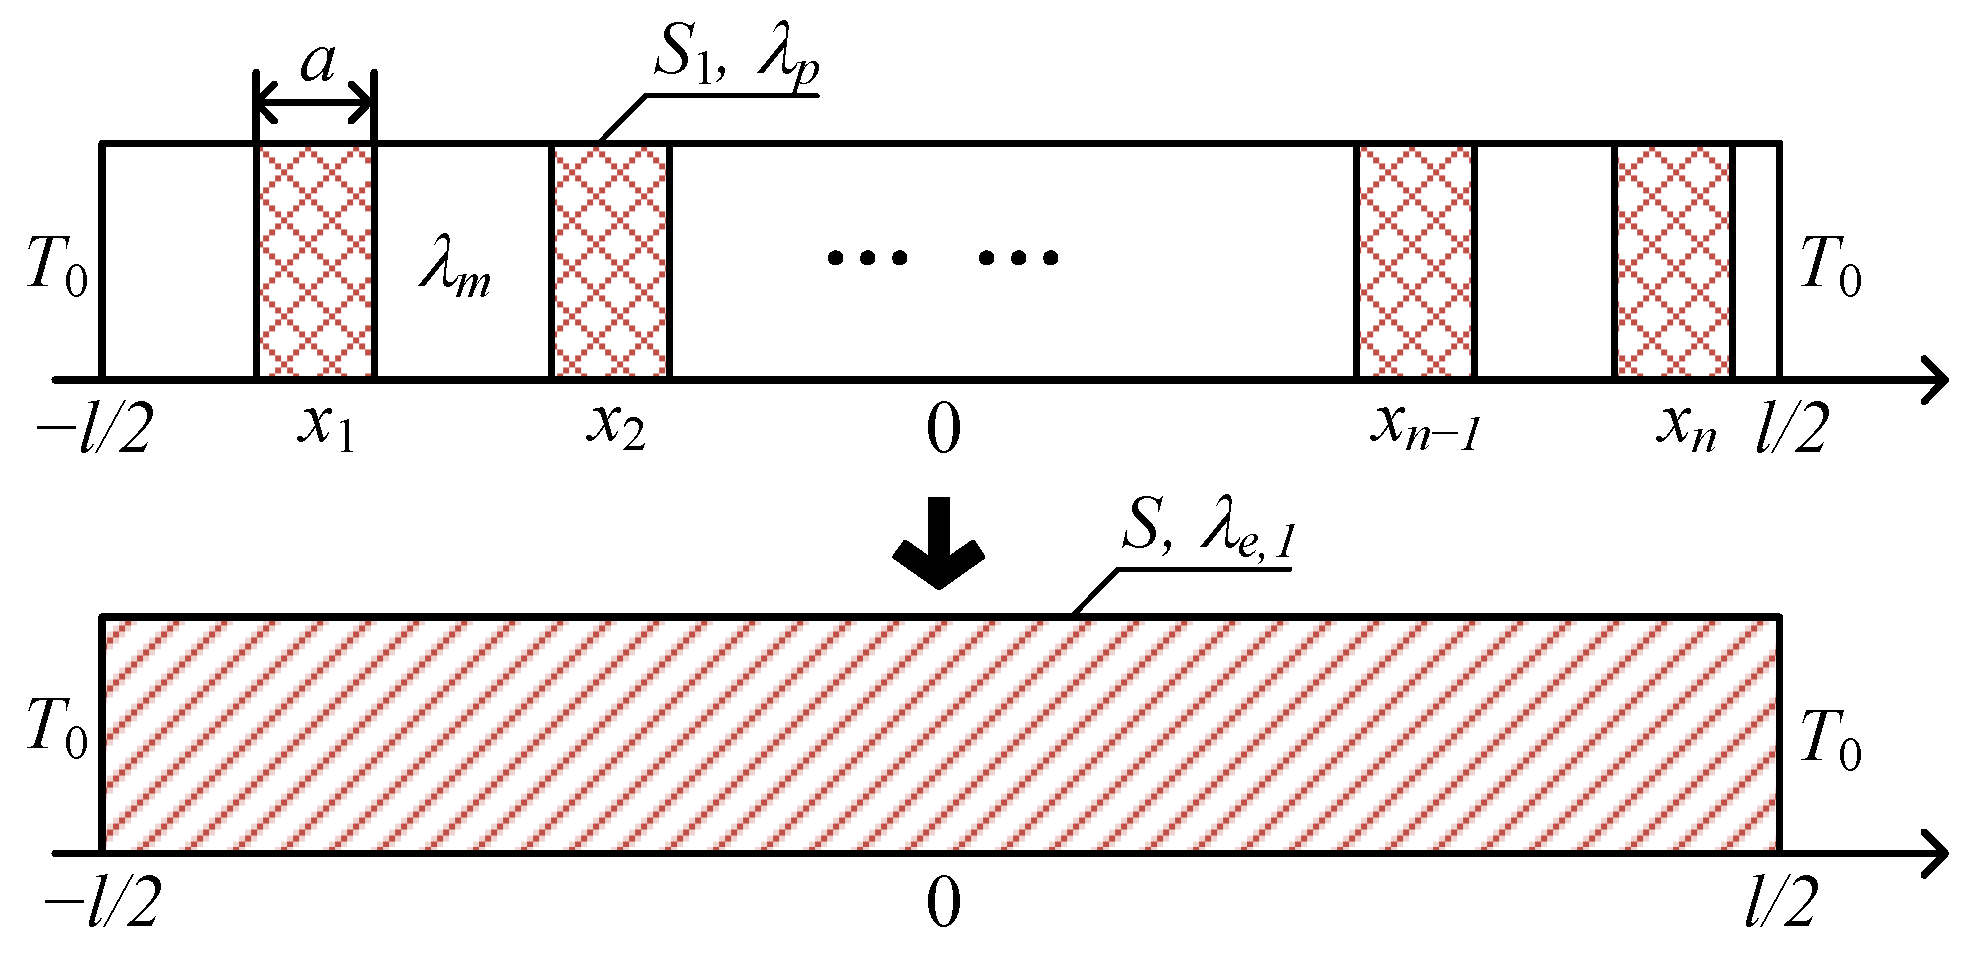
Liu Z. et al. derived the theoretical expression for the ETC of composite plates with internal heat sources [24,25]. Figure 11 shows a schematic of the composite plate problem with internal heat sources. The total thickness of the composite plate is l , containing N heat-generating filler plates, each with a thickness of a . The center positions of the filler plates are located at coordinates x 1 , x 2 , , x n . The power density of the heat-generating plates is S 1 , and the thermal conductivity is λ p . The thermal conductivity of the non-heating matrix is λ m .
After the equivalent transformation, the composite plate becomes a homogeneous material plate with uniform heat generation, with boundary temperatures fixed at T 0 . The equivalent power density is S , and the effective thermal conductivity is λ e , 1 . The dimensionless thermal conductivity κ 1 is defined as κ 1 = λ p / λ m , the dimensionless size μ 1 = a / l , and the filling fraction ϕ 1 = N μ 1 .
The conventional method for calculating the ETC of composite plates uses a series model, with the result as follows:
λ e , N 1 = 1 ϕ 1 λ p + 1 ϕ 1 λ m = l λ p λ m l λ p N a λ p λ m
The dimensionless form of the ETC obtained from the series model is
λ e , N 1 λ m = κ 1 κ 1 + 1 κ 1 ϕ 1
After homogenization of the composite plate, for the one-dimensional heat conduction problem in the Cartesian coordinate system, the relationship between the average temperature T a v g and the effective thermal conductivity λ e , 1 can be easily derived as:
λ e , 1 = S l 2 12 T a v g T 0 = S 1 N a l 12 T a v g T 0
Through mathematical derivation, the overall average temperature expression for a composite plate with N randomly distributed internal heat sources can be obtained as follows [26]:
T a v g T 0 = S 1 a l [ N a 2 12 λ p + N l 2 a 2 8 λ m 1 λ m 1 λ p a 2 i = 1 N x i 2 i n 1 1 2 λ m i = 1 N x i 2 a λ p λ m λ m l λ p N a λ p λ m i = 1 N x i 2 ]
When the filler plates are uniformly distributed, due to symmetry, the geometric centers of all plates coincide at the origin; therefore, we have the following:
i = 1 N x i = 0
The thickness of the matrix between two adjacent plates δ is
δ = l N a N + 1
The distance between the centers of two adjacent plates is δ   +   a , from which the summation of the following square terms can be calculated:
i = 1 N x i 2 = 2 i = 1 N / 2 δ + a 2 i 1 2 2 = l + a 2 N N 1 12 N + 1
i = 1 N x i 2 i N 1 = l + a N N 1 6
Substituting Equations (16), (18) and (19) into Equation (15), and then combining it with Equation (14), the expression for the ETC of the composite plate can be obtained as follows:
λ e , 1 λ m = μ 1 2 κ 1 + 3 1 μ 1 2 2 1 1 κ 1 μ 1 1 + μ 1 N 1 1 + μ 1 2 N 1 2 N + 1 1 = μ 1 2 κ 1 + 3 1 μ 1 2 2 1 1 κ 1 1 + μ 1 ϕ 1 μ 1 1 + μ 1 2 ϕ 1 μ 1 2 ϕ 1 + μ 1 1

4.1. Limit as the Size of Internal Heat Sources Approaches Zero

Starting from the Expression (20) for the composite plate with internal heat sources, limiting behavior can be observed. As dimensionless size μ 1 approaches 0, we have
lim μ 1 0 λ e , 1 λ m = 3 2 1 1 κ 1 ϕ 1 1 2 1 = κ 1 κ 1 + 1 κ 1 ϕ 1
It is easy to notice that the limiting value as μ 1 approaches 0 is precisely the conventional composite plate series model Equation (13). In other words, when the size of the internal heat sources approaches 0, the limiting value of the ETC with internal heat sources will converge to the ETC model without internal heat sources, as shown in the following equation:
lim μ 1 0 λ e , 1 = λ e , N 1
Although an expression for the ETC of dispersed disks with internal heat sources has not yet been obtained, based on the results for one-dimensional plates, it can be inferred that the limiting value of the two-dimensional dispersed disk’s ETC λ e   should also satisfy
lim μ 2 0 λ e = λ e , N 2
For the two-dimensional dispersed disk, when internal heat sources are not considered, the expression for the ETC λ e , N 2 corresponds to the Maxwell–Eucken model, as given by
lim μ 2 0 λ e λ m = 1 + κ 2 ϕ 2 1 κ 2 1 + κ 2 + ϕ 2 1 κ 2
The trends observed in the numerical calculations for the dispersed disk in Section 3.2 show that as μ 2 approaches zero, the ETC results approach those of the Maxwell–Eucken model, thereby validating the correctness of Equation (24).
This trend reflects the connection between heat conduction problems with and without internal heat sources and serves as one of the criteria for verifying the validity of the ETC model with internal heat sources.

4.2. Individual Effect of Internal Heat Source Filling Fraction

When κ 1 = 1 , it is equivalent to the dispersion phase and the matrix being made of the same material, eliminating the influence of two different thermal conductivities and leaving only the effect of the internal heat source. At this point, the expression for the ETC of the composite plate (Equation (20)) becomes
λ e , 1 λ m κ 1 = 1 = 3 2 μ 1 2 2 1 + μ 1 2 2 ϕ 1 μ 1 ϕ 1 + μ 1 1
Therefore, when κ 1 = 1 , the ETC of the composite plate increases monotonically with the increase in the filling fraction ϕ 1 . Taking the limits of Equation (25) as ϕ 1 approaches one, yields
lim ϕ 1 1 λ e , 1 λ m κ 1 = 1 = 1
These indicate that, in the absence of thermal conductivity contrast and under the sole influence of internal heat sources, the ETC gradually approaches unity as ϕ 2 increases. In the limiting case of ϕ 1   =   1 , the composite is entirely composed of the heat-generating filler phase, and the dimensionless ETC reaches one.
This trend is consistent with the case of heat-generating dispersed disks, shown in Figure 9a–c, when κ 2   =   1 . As ϕ 2 increases, the ETC increases monotonically and gradually approaches unity. However, unlike the composite plate, the filling fraction ϕ 2 in the dispersed disks cannot reach unity due to geometric constraints. Therefore, it is theoretically impossible to take the limit of the ETC expression as ϕ 2 → 1, in the case of dispersed disks.

4.3. Asymptotic Behavior of Filler Thermal Conductivity

The expression for the ETC of the composite plate with internal heat sources, given in Equation (20), can be rewritten by collecting the like terms of κ 1 as
λ e , 1 λ m = ϕ 1 μ 1 + ϕ 1 μ 1 1 κ 1 1 + μ 1 ϕ 1 μ 1 + 3 1 μ 1 2 2 1 + μ 1 2 ϕ 1 μ 1 2 ϕ 1 + μ 1 1
It can be seen that, since ϕ 1   >   μ 1 , the dimensionless ETC of the composite plate increases monotonically with the increasing κ 1 . In the limiting cases, as κ 1 approaches zero or infinity, the corresponding limits can be obtained as follows:
lim κ 1 λ e , 1 λ m = 1 + μ 1 ϕ 1 μ 1 + 3 1 μ 1 2 2 1 + μ 1 2 ϕ 1 μ 1 2 ϕ 1 + μ 1 1
lim κ 1 0 λ e , 1 λ m = 0
This implies that the increase in the dimensionless ETC induced by the increasing κ1 exhibits an upper limit, which depends on the filling fraction ϕ 1 and the filler size μ 1 . As κ 1 continues to decrease toward zero, the ETC also decreases continuously and approaches zero.
The variation in the ETC of the dispersed disks, with respect to κ 2 , as shown in Figure 10, follows a similar trend to that of the composite plate. As κ 2 increases, the ETC of the dispersed disks gradually rises and eventually levels off, approaching an upper limit. This limiting value varies with the filling fraction and particle size. Conversely, as κ 2 continues to decrease toward zero, the ETC of the dispersed disks also decreases continuously and approaches zero.
Based on the above discussion, the key trends derived from the theoretical expression for the ETC of the composite plate with internal heat sources are found to be consistent with those observed for the dispersed disks with respect to μ 2 ,   ϕ 2 , and κ 2 . Therefore, it can be inferred that the expression for the ETC of the dispersed disks should have a form similar to that of the composite plate, as given in Equation (20).

5. Conclusions

This study employs the finite element method to compute the average-temperature-based effective thermal conductivity (ETC) of dispersed disks with internal heat sources. The analysis focuses on how filler size, filling fraction, and constituent thermal conductivities affect the ETC. The investigated parameter ranges are ϕ 2   =   0.01 0.5 , μ 2   =   0.01 0.17 , and κ 2   =   0.001 1000 . The study also explains the physical reasons behind these effects. Furthermore, the theoretical ETC expression for one-dimensional composite plates with internal heat sources is used to discuss the shared influence of internal heat sources on the ETC of composite plates and dispersed disks. This helps to link the key ETC behaviors of dispersed disks with a potential analytical expression.
The main conclusions of this study are as follows:
(1)
The conventional Maxwell–Eucken model fails to capture the effects of the internal heat source presence and spatial distribution on the ETC of dispersed disks and is therefore not applicable to heat conduction problems involving internal heat sources in such systems.
(2)
When the filling fraction of the internal heat sources, i.e., the amount of the dispersed phase, remains constant, the ETC still decreases as the size of the internal heat sources increases. As the size of the internal heat sources approaches zero, the ETC model with internal heat sources converges to the conventional model.
(3)
The key trends in the ETC of dispersed disks are consistent with those reflected in the theoretical expression for one-dimensional composite plates. Therefore, in subsequent works, the analytical form of composite plates may serve as a reference for developing an ETC model for dispersed disks. This will also provide a basis for the eventual establishment of an ETC model for particle-dispersed cylinders.

Author Contributions

Conceptualization, Y.L. and J.S.; methodology, Y.L. and J.S.; software, Y.L.; validation, Y.L.; formal analysis, Y.L. and T.Q.; investigation, Y.L. and T.Q.; resources, J.S.; data curation, Y.L.; writing—original draft preparation, Y.L.; writing—review and editing, Y.L., T.Q., and J.S.; visualization, Y.L.; supervision, J.S.; project administration, J.S.; funding acquisition, J.S. All authors have read and agreed to the published version of the manuscript.

Funding

This research was supported by the CNSA program (D010102) and the Nuclear Technology R&D Program (No. HNKF202307(60)).

Data Availability Statement

Data are contained within the article.

Conflicts of Interest

The authors declare no conflicts of interest.

Nomenclature

a width of filling plates
l width of the composite plate
N number of fillers
R 0 radius of the large disk
R 1 radius of small filling disks
S homogenized heat source, W/m3
S 1 heat source of filling plate, W/m3
S d heat source of filling disk, W/m3
T a v g average temperature, K
T 0 boundary temperature, K
κ dimensionless thermal conductivity
κ 1 dimensionless thermal conductivity of composite plate
κ 2 dimensionless thermal conductivity of dispersed disk
λ e effective thermal conductivity, W/(m·K)
λ e , 1 effective thermal conductivity of composite plate, W/(m·K)
λ m thermal conductivity of matrix, W/(m·K)
λ p thermal conductivity of filler phase, W/(m·K)
λ e , N 1 effective thermal conductivity of composite plate without internal heat sources, W/(m·K)
λ e , N 2 effective thermal conductivity of dispersed disk without internal heat sources, W/(m·K)
λ e , N 3 effective thermal conductivity of particle dispersion without internal heat sources, W/(m·K)
μ 1 dimensionless width of filling plates
μ 2 dimensionless radius of filling disks
ϕ filling fraction
ϕ 1 line fraction of filling plates
ϕ 2 area fraction of filling disks

References

  1. Demkowicz, P.A.; Liu, B.; Hunn, J.D. Coated Particle Fuel: Historical Perspectives and Current Progress. J. Nucl. Mater. 2019, 515, 434–450. [Google Scholar] [CrossRef]
  2. Brown, N.R.; Ludewig, H.; Aronson, A.; Raitses, G.; Todosow, M. Neutronic Evaluation of a PWR with Fully Ceramic Microencapsulated Fuel. Part II: Nodal Core Calculations and Preliminary Study of Thermal Hydraulic Feedback. Ann. Nucl. Energy 2013, 62, 548–557. [Google Scholar] [CrossRef]
  3. Progelhof, R.C.; Throne, J.L.; Ruetsch, R.R. Methods for Predicting the Thermal Conductivity of Composite Systems: A Review. Polym. Eng. Sci. 1976, 16, 615–625. [Google Scholar] [CrossRef]
  4. Pietrak, K.; Wiśniewski, T.S. A Review of Models for Effective Thermal Conductivity of Composite Materials. J. Power Technol. 2015, 95, 14–24. [Google Scholar]
  5. Miller, J.V. Estimating Thermal Conductivity of Cermet Fuel Materials for Nuclear Reactor Application; NASA: Washington, DC, USA, 1967.
  6. Maxwell, J.C. A Treatise on Electricity and Magnetism; Cambridge University Press: Cambridge, UK, 1873. [Google Scholar]
  7. Landauer, R. The Electrical Resistance of Binary Metallic Mixtures. J. Appl. Phys. 1952, 23, 779–784. [Google Scholar] [CrossRef]
  8. Chiew, Y.C.; Glandt, E.D. The Effect of Structure on the Conductivity of a Dispersion. J. Colloid Interface Sci. 1983, 94, 90–104. [Google Scholar] [CrossRef]
  9. Wang, J.; Lu, G.; Ding, M. Parametric Study of Effective Thermal Conductivity for VHTR Fuel Pebbles Based on a Neutronic and Thermal Coupling Method. Ann. Nucl. Energy 2023, 181, 109530. [Google Scholar] [CrossRef]
  10. Liu, Z.; Sun, J. Preliminary Discussion on the Equivalent Thermal Conductivity Affected by the Inner Heat Source. In Proceedings of the International Topical Meeting on Advances in Thermal Hydraulics, Palaiseau, France, 20–23 October 2020. [Google Scholar]
  11. Liu, Z.; Ji, Y.; Zhang, H.; Sun, J. Effective Thermal Conductivity of Typical Composite Plate with Inner Heat Source and Temperature Difference. Nucl. Technol. 2022, 208, 1337–1351. [Google Scholar] [CrossRef]
  12. Belhaouzi, A.; Laaouidi, H.; Zyade, S.; Raji, Y.; Halimi, Y.; Tahiri, M. Exploring the Thermophysical Properties of the Thermal Conductivity of Pigmented Polymer Matrix Composites with Barium Titanate: A Comparative Numerical and Experimental Study. J. Compos. Sci. 2023, 7, 220. [Google Scholar] [CrossRef]
  13. Panchal, M.; Kang, C.; Ying, A.; Chaudhuri, P. Experimental Measurement and Numerical Modeling of the Effective Thermal Conductivity of Lithium Meta-Titanate Pebble Bed. Fusion Eng. Des. 2018, 127, 34–39. [Google Scholar] [CrossRef]
  14. Folsom, C.P. Effective Thermal Conductivity of Tri-Isotropic (TRISO) Fuel Compacts. Master’s Thesis, Utah State University, Logan, UT, USA, 2012. [Google Scholar] [CrossRef]
  15. Gong, J.; Yuan, R.; Song, X.; Wang, Y.; Liu, B.; Liu, M. Numerical Analysis of Effective Thermal Conductivity of FCM with Multilayer TRISO Particle. Nucl. Mater. Energy 2023, 36, 101501. [Google Scholar] [CrossRef]
  16. Kamalpour, S.; Salehi, A.A.; Khalafi, H.; Mataji-Kojouri, N.; Jahanfarnia, G. The Potential Impact of Fully Ceramic Microencapsulated (FCM) Fuel on Thermal Hydraulic Performance of SMART Reactor. Nucl. Eng. Des. 2018, 339, 39–52. [Google Scholar] [CrossRef]
  17. Folsom, C.; Xing, C.; Jensen, C.; Ban, H.; Marshall, D.W. Experimental Measurement and Numerical Modeling of the Effective Thermal Conductivity of TRISO Fuel Compacts. J. Nucl. Mater. 2015, 458, 198–205. [Google Scholar] [CrossRef]
  18. Liu, M.; Lee, Y.; Rao, D.V. Development of Effective Thermal Conductivity Model for Particle-Type Nuclear Fuels Randomly Distributed in a Matrix. J. Nucl. Mater. 2018, 508, 168–180. [Google Scholar] [CrossRef]
  19. Yu, D.; Wang, F.; Mei, H.; Cheng, X.; Duan, C. An Improved Two-Temperature Method for Computing the Temperature Distributions within a TRISO-Coated Particle Pebble Fuel. Nucl. Eng. Technol. 2025, 57, 103515. [Google Scholar] [CrossRef]
  20. Liu, M.; Thurgood, J.; Lee, Y.; Rao, D.V. Development of a Two-Regime Heat Conduction Model for TRISO-Based Nuclear Fuels. J. Nucl. Mater. 2019, 519, 255–264. [Google Scholar] [CrossRef]
  21. Wang, M.; Zhou, B.; Bu, S.; Li, Z.; Chen, D.; Ma, Z.; Zhang, L. A Multi-Annulus Heat Conduction Model for Predicting the Peak Temperature of Nuclear Fuels with Randomly Dispersed TRISO Particles. Prog. Nucl. Energy 2023, 158, 104602. [Google Scholar] [CrossRef]
  22. Wang, M.; Bu, S.; Zhou, B.; Li, Z.; Chen, D. Multi-Scale Heat Conduction Models with Improved Equivalent Thermal Conductivity of TRISO Fuel Particles for FCM Fuel. Nucl. Eng. Technol. 2023, 55, 1140–1151. [Google Scholar] [CrossRef]
  23. Liu, Z.; Ji, Y.; Zhang, H.; Sun, J. Numerical Calculations of the Effective Thermal Conductivity of the Dispersion Fuel Sphere with the Internal Heat Sources. In Proceedings of the 2021 28th International Conference on Nuclear Engineering, Online, 4–6 August 2021. [Google Scholar] [CrossRef]
  24. Liu, Z.; Sun, J. Research on the Equivalent Thermal Conductivity Coefficient of a Composite Plate with Inner Heat Sources. J. Harbin Eng. Univ. 2021, 42, 1832–1836+1842. (In Chinese) [Google Scholar] [CrossRef]
  25. Liu, Z.; Sun, J. An Effective Thermal Conductivity Model of Composite Plates with Distributed Inner Heat Sources. J. Tsinghua Univ. Sci. Technol. 2023, 63, 104–113. (In Chinese) [Google Scholar] [CrossRef]
  26. Liu, Z.; Ji, Y.; Zhang, H.; Sun, J. An Approximate Effective Thermal Conductivity Model in Predicting the Average Temperature of the Fuel Pebble. In Proceedings of the 19th International Topical Meeting on Nuclear Reactor Thermal Hydraulics (NURETH-19), Online, 6–11 March 2022. [Google Scholar]
  27. Qiu, T.; Sun, J. The Effective Thermal Conductivity Model of Dispersion Fuel Elements Based on Effective Matrix Approximation. In Proceedings of the 31st International Conference on Nuclear Engineering, Prague, Czech Republic, 4–8 August 2024. [Google Scholar] [CrossRef]
  28. Liu, Y.; Sun, J. Study on the Influence of Internal Heat Source Characteristics and Distribution on Effective Thermal Conductivity of Cylindrical Particle Dispersed Fuel. In Proceedings of the 31st International Conference on Nuclear Engineering, Prague, Czech Republic, 4–8 August 2024. [Google Scholar] [CrossRef]
  29. COMSOL Multiphysics, version 5.5; Livelink for MATLAB User’s Guide; COMSOL AB: Stockholm, Sweden, 2019.
  30. Eucken, A. Thermal Conductivity of Ceramics Refractory Materials. Forsch. Geb. Ing. 1932, B-3, 6–21. [Google Scholar]
  31. Stainsby, R. Investigation of Local Heat Transfer Phenomena in a Prismatic Modular Reactor Core; AMEC NSS Limited: Cheshire, UK, 2009. [Google Scholar]
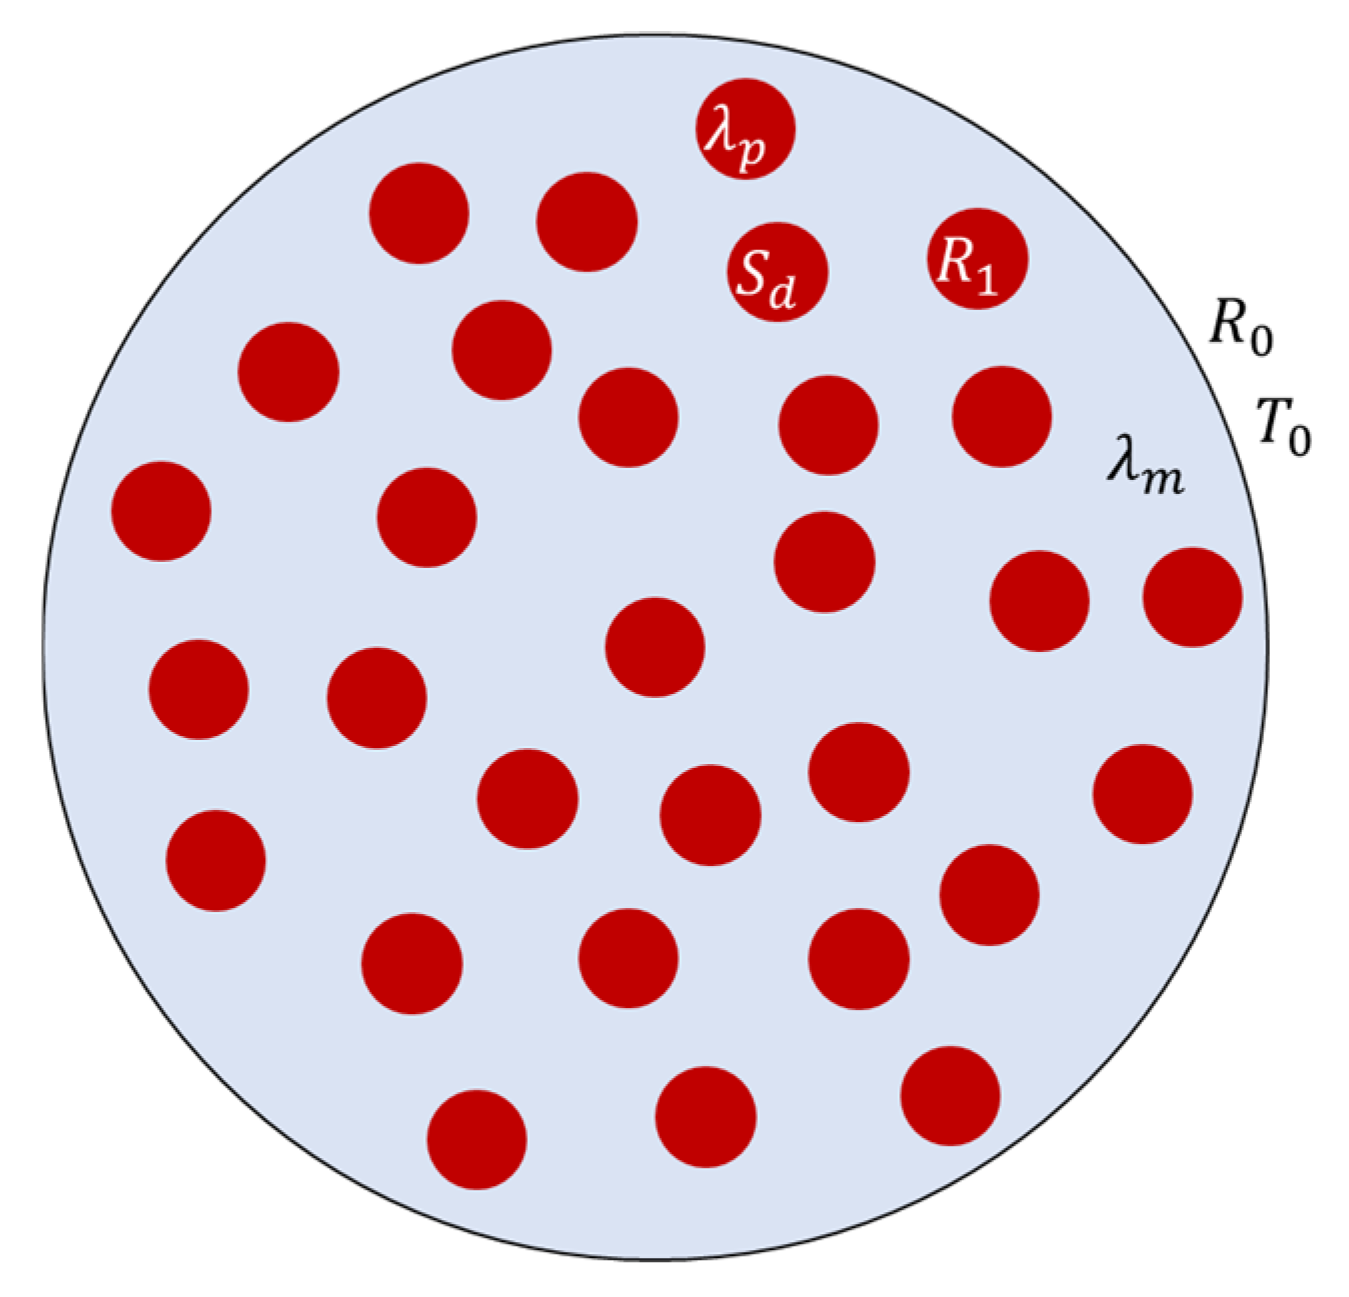
Figure 1. Schematic diagram of dispersed disks with internal heat sources.
Energies 18 04719 g001
Figure 2. Flowchart of FEM calculation for the ETC of dispersions.
Energies 18 04719 g002
Figure 3. ETC and maximum temperature of different mesh settings.
Energies 18 04719 g003
Figure 4. Enlarged view of the mesh at μ 2 = 0.010.
Energies 18 04719 g004
Figure 5. Two sets of FEM results. (a) Power density, μ 2   = 0.017; (b) power density, μ 2   = 0.043; (c) temperature profile, μ 2   = 0.017; and (d) temperature profile, μ 2   = 0.043.
Energies 18 04719 g005
Figure 6. Temperature and heat flux along the large disk diameter. (a) Temperature; (b) heat flux in the positive x-direction.
Energies 18 04719 g006
Figure 7. Comparison of ETC between FEM and conventional model under constant ϕ 2 as μ 2 varies. (a) κ 2 = 1 , ϕ 2 = 0.075 ; (b) κ 2 = 1 , ϕ 2 = 0.3 ; (c) κ 2 = 1 / 30 , ϕ 2 = 0.2 ; (d) κ 2 = 1 / 30 , ϕ 2 = 0.3 ; and (e) κ 2 = 1 / 30 , ϕ 2 = 0.32 .
Energies 18 04719 g007aEnergies 18 04719 g007b
Figure 8. Comparison of ETC between FEM and conventional model under constant N as μ 2 varies. (a) κ 2 = 1 ,   N = 100 ; (b) κ 2 = 1 ,   N = 264 ; (c) κ 2 = 1 / 10 ,   N = 70 ; and (d) κ 2 = 1 / 10 ,   N = 264 .
Energies 18 04719 g008
Figure 9. Comparison of ETC between FEM and conventional model as ϕ 2 varies. (a) κ 2 = 1 , μ 2 = 0.010 ; (b) κ 2 = 1 , μ 2 = 0.043 ; (c) κ 2 = 1 , μ 2 = 0.087 ; (d) κ 2 = 1 / 10 , μ 2 = 0.010 ; (e) κ 2 = 1 / 10 , μ 2 = 0.043 ; and (f) κ 2 = 1 / 30 , μ 2 = 0.087 .
Energies 18 04719 g009aEnergies 18 04719 g009b
Figure 10. Comparison of ETC between FEM and conventional model as κ 2 varies. (a) ϕ 2 = 0.075 , μ 2 = 0.043 ; (b) ϕ 2 = 0.2 , μ 2 = 0.087 ; (c) ϕ 2 = 0.3 , μ 2 = 0.087 ; (d) ϕ 2 = 0.32 , μ 2 = 0.087 ; and (e) ϕ 2 = 0.5 , μ 2 = 0.043 .
Energies 18 04719 g010aEnergies 18 04719 g010b
Figure 11. Schematic of the composite plate with internal heat sources.
Energies 18 04719 g011
Table 1. Mesh settings.
Mesh NumberSmall Disk Mesh SettingMatrix Mesh SettingMaximum Element Area [m2]
1Extra coarseExtra coarse6.22 × 10−8
2CoarserCoarser2.97 × 10−8
3CoarseCoarse8.75 × 10−9
4NormalNormal4.90 × 10−9
5FinerFiner3.99 × 10−9
6Extra fineExtra fine3.86 × 10−9
7Extra fineExtremely fine3.64 × 10−9
8Extremely fineExtremely fine1.70 × 10−9
Disclaimer/Publisher’s Note: The statements, opinions and data contained in all publications are solely those of the individual author(s) and contributor(s) and not of MDPI and/or the editor(s). MDPI and/or the editor(s) disclaim responsibility for any injury to people or property resulting from any ideas, methods, instructions or products referred to in the content.