Article

Study of NO and CO Formation Pathways in Jet Flames with CH4/H2 Fuel Blends

School of Materials Science and Engineering, Jingdezhen Ceramic University, Jingdezhen 333001, China
*
Author to whom correspondence should be addressed.
Energies 2024, 17(17), 4382; https://doi.org/10.3390/en17174382
Submission received: 12 August 2024 / Revised: 28 August 2024 / Accepted: 30 August 2024 / Published: 1 September 2024
(This article belongs to the Section B: Energy and Environment)

Abstract

The existing natural gas transportation pipelines can withstand a hydrogen content of 0 to 50%, but further research is still needed on the pathways of NO and CO production under moderate or intense low oxygen dilution (MILD) combustion within this range of hydrogen blending. In this paper, we present a computational fluid dynamics (CFD) simulation of hydrogen-doped jet flame combustion in a jet in a hot coflow (JHC) burner. We conducted an in-depth study of the mechanisms by which NO and CO are produced at different locations within hydrogen-doped flames. Additionally, we established a chemical reaction network (CRN) model specifically for the JHC burner and calculated the detailed influence of hydrogen content on the mechanisms of NO and CO formation. The findings indicate that an increase in hydrogen content leads to an expansion of the main NO production region and a contraction of the main NO consumption region within the jet flame. This phenomenon is accompanied by a decline in the sub-reaction rates associated with both the prompt route and NO-reburning pathway via CHi=0–3 radicals, alongside an increase in N2O and thermal NO production rates. Consequently, this results in an overall enhancement of NO production and a reduction in NO consumption. In the context of MILD combustion, CO production primarily arises from the reduction of CO2 through the reaction CH2(S) + CO2 ⇔ CO + CH2O, the introduction of hydrogen into the system exerts an inhibitory effect on this reduction reaction while simultaneously enhancing the CO oxidation reaction, OH + CO ⇔ H + CO2, this dual influence ultimately results in a reduction of CO production.

1. Introduction

Hydrogen is a clean source of energy; it is distinguished by its low pollution, ease of ignition, wide flammability limit, high energy density, elevated combustion temperature, and rapid combustion speed [1]. Incorporating hydrogen combustion into natural gas can improve flame stability and higher operating limits due to improved blow-off limits, augment reaction activity, reduce flame length, and mitigate the likelihood of flame extinguishment [2,3]. Incorporating hydrogen into natural gas results in a notable decrease in carbon emissions during combustion. Despite the benefits mentioned, the main challenges in using hydrogen blended fuels for combustion include difficulties storing hydrogen, its flammable and explosive nature, the high expenses associated with hydrogen production, and the rise in NO emissions caused by elevated maximum temperatures during conventional combustion [4]. The high-temperature and low-oxygen environment is established through strong dilution of reactants with the flue gas, resulting in an oxygen concentration in the fuel-air mixture that falls below 10%; concurrently, the mixture temperature exceeds the self-ignition temperature of the fuel [4,5,6,7], this process effectively suppresses the development of the flame front, lowers the flame temperature, and formation of moderate or intense low oxygen dilution (MILD) combustion, which is an effective way to solve the problem of Formation of high NO in hydrogen doped combustion of natural gas [8,9].
Since the 1990s [10], MILD combustion has been the focus of significant research, with natural gas hydrogen-doped MILD combustion gaining considerable interest over the past ten years due to its environmental benefits [11,12], stability [13,14], and efficiency [15,16]. The jet in hot coflow (JHC) Burner developed by Dally et al. [17] utilized an equal volume of methane and hydrogen as fuel. However, their research focused solely on how oxygen concentration influenced the properties of MILD Combustion without investigating the impact of adding hydrogen. In later research, Paul et al. [18] performed experiments with this burner to explore how hydrogenation influences the structure of the reaction zone. Mendez et al. [19] further elaborated on how hydrogen addition stabilizes MILD combustion. Since that time, research related to the JHC burner has concentrated on numerical analyses. For instance, Gao et al. [20] examined how adding hydrogen influences NO formation within the JHC flame, while Liao et al. [21] demonstrated how hydrogen addition and oxygen levels affect the flame structure and NO formation. Tu et al. [22] investigated the flame characteristics of CH4/H2 fuel MILD-oxy combustion in a JHC burner. Jiang et al. [23] conducted an in-depth study of the NO production characteristics of CH4/H2 blended fuels in CO2 diluents. Amir et al. [24] and Zhao et al. [25] extended the fuel to hydrogen syngas and NH3/CH4, respectively, and investigated their MILD combustion characteristics and NO production characteristics.
On the other hand, the production pathway of NO during the combustion of hydrogen-doped MILD has been the subject of considerable research interest. Li et al. [26] investigated the hydrogen mass fraction ranging from 0 to 15% and found that as hydrogen is added, the significance of the NNH pathway increases while the importance of the prompt pathway decreases. Ali et al. [27] investigated hydrogen volume fractions between 0 and 60% and found that the addition of hydrogen enhanced the NNH route while decreasing the prompt route and N2O intermediate route. Pan et al. [28] studied hydrogen volume fractions ranging from 0 to 100%; they discovered that hydrogen blending causes the thermal route to be suppressed and the N2O route to be promoted. Park et al. [29] showed that the effect of hydrogen on NO production was NNH and N2O intermediate routes. Mehmet et al. [30] conducted a comparative analysis of the effects of HCN intermediates and hydrogen content on the production of NO. Esmaeil et al. [31] discovered that in environments with abundant H2, the NNH route significantly contributes to the production of NO. In a recent study, Xu et al. investigated the impact of hydrogen doping on the pathway of NO production under varying conditions, including different residence times [32], heat-extracted [33], and wall temperatures [34].
Using existing natural gas pipeline systems to transport CH4/H2 blends is a cost-effective approach until advancements are made in hydrogen production and delivery technologies. Blending hydrogen at levels below 50% is practical without major safety issues [35], making it crucial to investigate the pollutant production pathways within this range. However, previous research on the NO production pathway, which utilized a zero-dimensional perfectly stirred reactor (PSR) reaction model in the JHC burner, did not develop a more accurate chemical reaction network model that reflects real operational conditions. Additionally, studies on the CO production pathway have primarily concentrated on methane fuels [36,37,38,39]. Although the research conducted by Amir et al. [40] used a mixture of methane and hydrogen, it did not explore how changes in hydrogen content specifically influence the process of CO production.
Further study about the mechanisms of NO and CO formation in CH4/H2 blended fuel jet flames and to determine the effect of hydrogen content on their production pathways is urgently required. In this paper, Section 3.1 presents the key reactions for the formation of NO and CO within the jet flame obtained through CFD simulations. The study further elucidates the influence of hydrogen-doped on the mechanisms of formation and consumption of NO and CO at various locations. The reaction kinetics and production pathways of NO and CO in hydrogen-doped MILD combustion are further elucidated through the use of CRN modeling in Section 3.2 and Section 3.3, which will provide new insights into hydrogen-doped MILD combustion technology.

2. Numerical Simulation

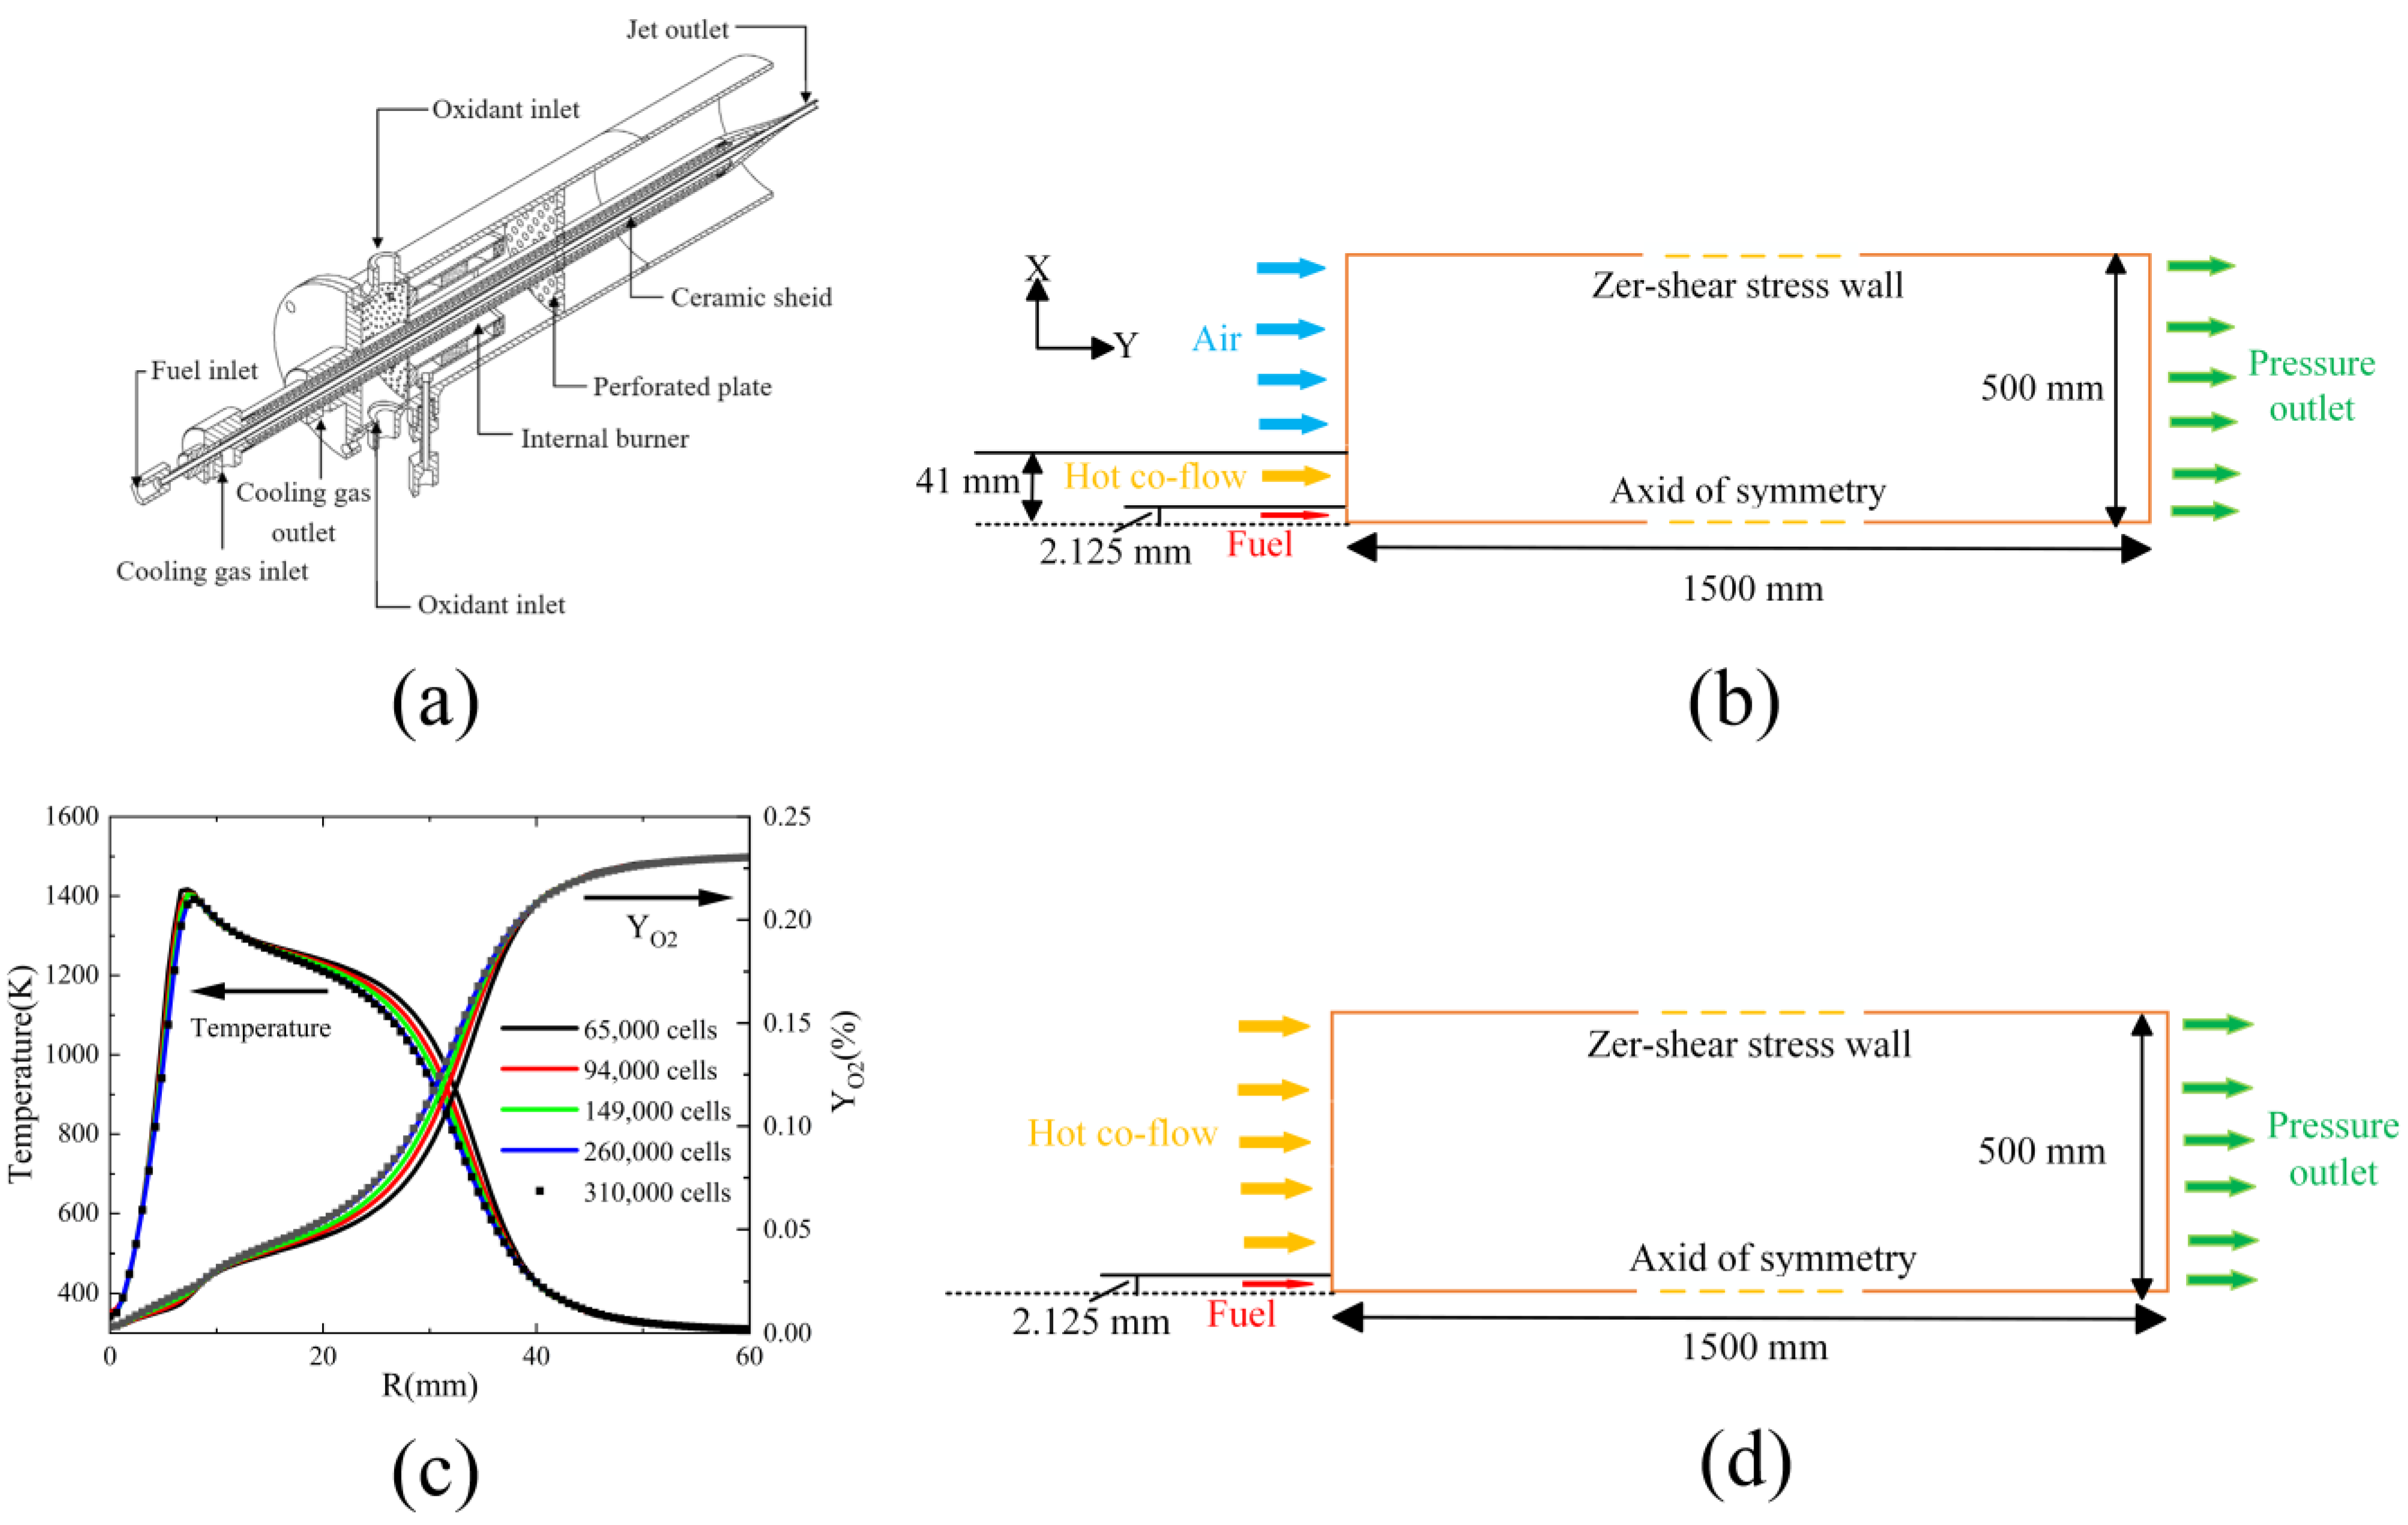
2.1. Computational Model

In this paper, the jet in hot coflow (JHC) burner proposed by Dally et al. [17] is simplified to a two-dimensional symmetric structure and investigated numerically. As shown in Figure 1a, the burner is centered on a high-velocity gas jet nozzle (i.d = 4.25 mm), surrounded by a low-velocity dilution hot coflow nozzle (i.d = 82 mm). The hot dilution gas is a mixture of the internal burner flue gas and an oxidizer (N2/air). In their experiments, the burner was situated in a wind tunnel with the same velocity as the hot dilution gas. Figure 1b presents a simplified model based on the experiments of Dally et al. [17], which includes fuel inlet, hot coflow inlet, and air inlet. If this model is used, MILD combustion can only be achieved within 100 mm of the nozzle [41,42]. To ensure that the flame is in MILD combustion throughout the computational domain, we have made modifications to the aforementioned model. In the modified model shown in Figure 1d, we have removed the outside cold air tunnel of the original system. This modification ensures that the properties of the coflow are not influenced by the outside tunnel and that the potential influences are eliminated. Figure 1c shows only the radial temperature and YO2 at a distance of 30 mm from the nozzle for five grids; no significant differences in the results are observed between the 260,000 and 310,000 grids. The final number of model meshes used is 260,000.
In this paper, the continuity, momentum, energy, and species conservation are solved using the commercially available software Ansys Fluent 2021. Turbulence is simulated through numerical methods employing the modified k-ε model with standard wall function. To enhance the accuracy of the k-ε model in predicting the entrainment, decay, and spread of round jet, the constant C has been adjusted from 1.44 to 1.6 [4,43]. Additionally, taking into account that in MILD combustion, the Damköhler (Da) number [44] is considered~1 [45], the Eddy Dissipation Concept (EDC) model was used to simulate the reaction, and the time constant Cτ was modified from its default value of 0.4082 to 1.5 [46,47,48] to more accurately reflect the reaction kinetics in MILD combustion. The Da number, a dimensionless number frequently utilized to investigate the MILD combustion regime, is defined as follows:
D a = τ f τ r
where τf and τr are the time scale of the flow and reaction, respectively.
The EDC model [49] posits that reactions take place at small scales. The parameters defining the fine scales, such as the characteristic length fraction denoted as ξ, and the chemical residence time scale denoted as τ, are expressed in the following manner:
ξ = C ξ ( v ε k 2 ) 1 4
τ = C τ ( v ε ) 1 2
where Cξ is the volume fraction constant, and Cτ is the time scale constant.
A pressure-based coupled solver is utilized, incorporating least squares cell-based discretization for the gradient components in the flow field. The pressure terms are discretized using a central difference method with second-order accuracy, while the other equations are discretized using the Second Order Upwind method. To speed up the solution process, we used Implicitly Coupled Adaptive Selective Time Advancement (ISAT). Furthermore, we utilized the Discrete Ordinates (DO) model for predicting radiative heat transfer, which is integrated with the Weighted Sum of Gray Gases (WSGG) model [50] to increase the precision of the radiative calculations. Convergence was deemed achieved when the residuals for all variables fell below 10−5, the maximum velocity change at the exit per iteration was under 0.1 m/s, and the maximum changes in CO and NO mass fractions were less than 0.1%.
The combustion reaction mechanism used in this paper is GRI-Mech 3.0, which is a mechanism file that consists of 53 components and 325 reactions, detailing the process of NO formation, and is widely used to study the production of NO under MILD combustion conditions [16,25,51]. Table 1 provides a detailed overview of the inlet conditions established by Dally et al. [17]; in their three sets of experiments, the fuel jet Reynolds number was maintained at 9482 (Vf = 61 m/s), the temperature at 305 K, and the temperature and velocity of the hot coflow at 1300 K and 3.2 m/s, respectively. In the subsequent hydrogen doping simulations, which involved hydrogen volume fractions between 0–50%, the fuel jet Reynolds number remained at 9482, and the hot coflow velocity stayed at 3.2 m/s; the equivalent ratio is 0.7, as indicated in Table 2. Figure 2 presents a comparison of the radial distributions of the experimental and simulated results at x = 30 mm. The turbulent kinetic energies at the fuel jet inlets are set at 60 m2/s2, while the jet in the hot coflow is set at 1.8 m2/s2 [52]. The temperature distribution, as well as YH2O and YOH, can be effectively represented at YO2 = 3%. However, the forecasts for YCO, YNO, and YO2 are skewed. This phenomenon results from overprediction of the life-off height in the 3% oxygen diffusion flame [43], likely due to the turbulence-chemistry coupling methods and the inherent limitations of the EDC model for the YO2 = 3% flame [19,20,25]. Consequently, this results in underestimations of YNO and YCO, while YO2 is overestimated. The simulation results are in general agreement with the experimental data at YO2 = 6% and YO2 = 9%. However, the simulation underestimates YCO in the R > 20 mm region, which may be attributed to the large amount of CO produced in the inner jet due to the cooling and quenching of the upstream secondary flame in the experiment [43]. In light of the aforementioned analysis, subsequent studies on hydrogen-doped combustion were conducted at YO2 = 9%.

2.2. Chemical Reaction Network Model

The JHC burner operates through two key processes. First, it produces high-temperature flue gases within the internal burner, which are then mixed with an oxidizer (Air/N2) to create a hot coflow. Second, this hot coflow interacts with the fuel jet, leading to the self-ignition of the gas. To conduct a basic investigation of MILD combustion in hydrogen-doped environments from a thermodynamic perspective, these processes were decoupled by establishing a Chemical Reaction Network (CRN) model through the chemical reaction kinetics software Chemkin-pro 2021. In Figure 3a, the section depicts the process of traditional combustion that produces high-temperature dilution gases. PSR1 represents the combustion process within the JHC internal burner, which produces high-temperature flue gas entering Mixer1. This flue gas is then mixed with the oxidizer (composed of a certain ratio of Air/N2) in Mixer1, representing the process of forming high-temperature dilution gases in the JHC burner. In Figure 3b, the depicted section illustrates the MILD combustion process. The fuel is mixed with the high-temperature dilution gases from Mixer1 in Mixer2 and enters PSR2 to achieve MILD combustion, where Mixer2 represents the mixing process before the fuel combustion reaction. The condition for determining that MILD combustion is valid is that the reactant temperature Tin must be higher than the fuel self-ignition temperature Tsi and at the same time, the fuel self-ignition temperature Tsi must be higher than the maximum temperature rise ∆Tmax(TmaxTin) during the reaction, i.e., Tin > Tsi > ∆Tmax, where Tin is the mixer2 outlet temperature and ∆Tmax is the PSR2 outlet temperature minus the mixer2 outlet temperature. To determine Tsi, the gas from mixer2 is introduced into a Closed Homogeneous Batch Reactor (CHBR) where the mixture is held for a residence time of 1 s. If the temperature within the reactor rises to a certain level and stays there for 1 s, and the outlet temperature matches the adiabatic temperature of the reactants, then the temperature inside the reactor at that moment is identified as the self-ignition temperature of the reactants, Tsi.

2.3. NO and CO Mechanisms

NO is produced mainly through four formation routes: thermal, prompt, N2O-intermediate, and NNH routes. NO is consumed through the NO-reburning route, with the pertinent reactions illustrated in Table 3.
Thermal route: Initially suggested by Zeldovich, this process plays a dominant role in high-temperature flames [53,54], with the O radical attacking N2 to produce N and NO, and N then reacting with oxygen and OH to produce NO.
Prompt route: The hypothesis was initially proposed by Fenimore and is primarily produced in rich combustion flames with an initial reaction of CHi=0–3 radicals attacking N2. Consequently, it exists exclusively in hydrocarbon fuel flames [55].
N2O-intermediate route: Initially suggested by Malte and Pratt [55], the process primarily entails the reaction of N2 with O2 to produce N2O, which subsequently reacts with O/H to form NO.
NNH route: Initially suggested by Bozzelli and Dean [56], the process centers on the combination of N2 and H to produce NNH, which is subsequently oxidized by O to form NO.
NO-reburning route: Albert et al. [57] were the first to propose that NO can be reduced by hydrocarbon radicals(e.g., CHi=0–3)and HCCOH [58]. Additionally, under specific conditions, NO can also be reduced by non-hydrocarbon radicals (e.g., H) [59].
CO primarily results from the incomplete burning of fuels and is transformed into CO2 through the reaction CO + OH ⇔ CO2 + H [38], with the pertinent reactions illustrated in Table 4.

3. Results and Discussion

3.1. Effect of Hydrogen Content on NO and CO Production in MILD Flames

Figure 4 illustrates how CO and NO are distributed in the MILD flame with varying hydrogen levels. As the hydrogen content rises, the production of CO in the flame tends to decrease gradually, whereas the production of NO increases correspondingly. In the MILD flame using pure methane as fuel, significant amounts of CO and NO are produced after X/D = 30. However, when hydrogen is added to methane, even at a hydrogen volume fraction of just 10%, the formation of CO and NO begins closer to the nozzle. This is due to the quicker turbulent combustion of hydrogen, which reduces the ignition delay time and results in a lower lift height in the reaction zone. Consequently, the production of NO and CO occurs earlier and is shifted closer to the nozzle, and the production of NO in the area near the nozzle keeps increasing as the hydrogen content rises further. Figure 4 specifically identifies a main NO/CO consumption region within the MILD flame and a main NO/CO production region at the flame front. With a rise in hydrogen content, the NO production area grows while the consumption area diminishes, resulting in a higher total NO production and an increase in the NO peak from 33.3 ppm to 56.6 ppm.
To further determine the impact of hydrogen doping on NO production, The main NO formation reactions for each of the kinetic mechanisms are included in the GRI-Mech 3.0. Based on the kinetic rates of NO production, Figure 5 illustrates the most dominant reactions of the four NO formation routes at various positions (X = 30, 400, and 700 mm), corresponding to the initial NO production area, the primary NO consumption area, and the main NO production area, respectively. In both the NO initiation area and the primary NO consumption area, the reaction rates for thermal, prompt, NNH, and N2O increased as hydrogen content rose. However, in the main NO consumption region, the reaction rate of R214 HNO + H ⇔ H2 + NO, which regulates the production of the prompt NO, decreases as the hydrogen content rises. This suggests that higher hydrogen levels inhibit the R214 reaction, leading to a decrease in the production of prompt NO. As the hydrogen content rises, the rate at which NO is consumed through the NO-reburning pathway via CHi=1–3 decreases, while the rate of NO consumption through the NO-reburning pathway via H radicals increases. However, the CHi=1–3 pathway continues to be the primary factor in the NO-reburning route. In the main NO consumption region, the rapid reaction rate of the NO-reburning route results in a higher NO consumption rate, which subsequently leads to a reduction in NO production in this region. However, as hydrogen concentration rises, the reaction rate of the NO-reburning pathway via CHi=1–3 drops significantly, thereby reducing the extent of the NO consumption region. In the main NO production region, even though the reaction rate of the prompt route decreased as hydrogen concentration increased, the NO-reburning route also diminished, while the reaction rates of all other NO production routes increased, leading to an overall rise in NO production.
Figure 6 shows the important reaction rates in the CO production area at the start, the main CO consumption region, and the main CO production region, which are situated at X = 30, 150, and 500 mm, respectively. In the main CO consumption region, the reaction R99 CO + OH ⇔ CO2 + H exhibits the most rapid rate, which indicates that the CO content is primarily determined by the rate of its oxidation to CO2. This is rapidly converted to CO2 in this region, which results in the production of CO in this region being maintained at a low level. In the main CO production region, the reaction rate R99 increases as the hydrogen content rises, which speeds up the conversion of CO to CO2. This results in a reduction in CO production.

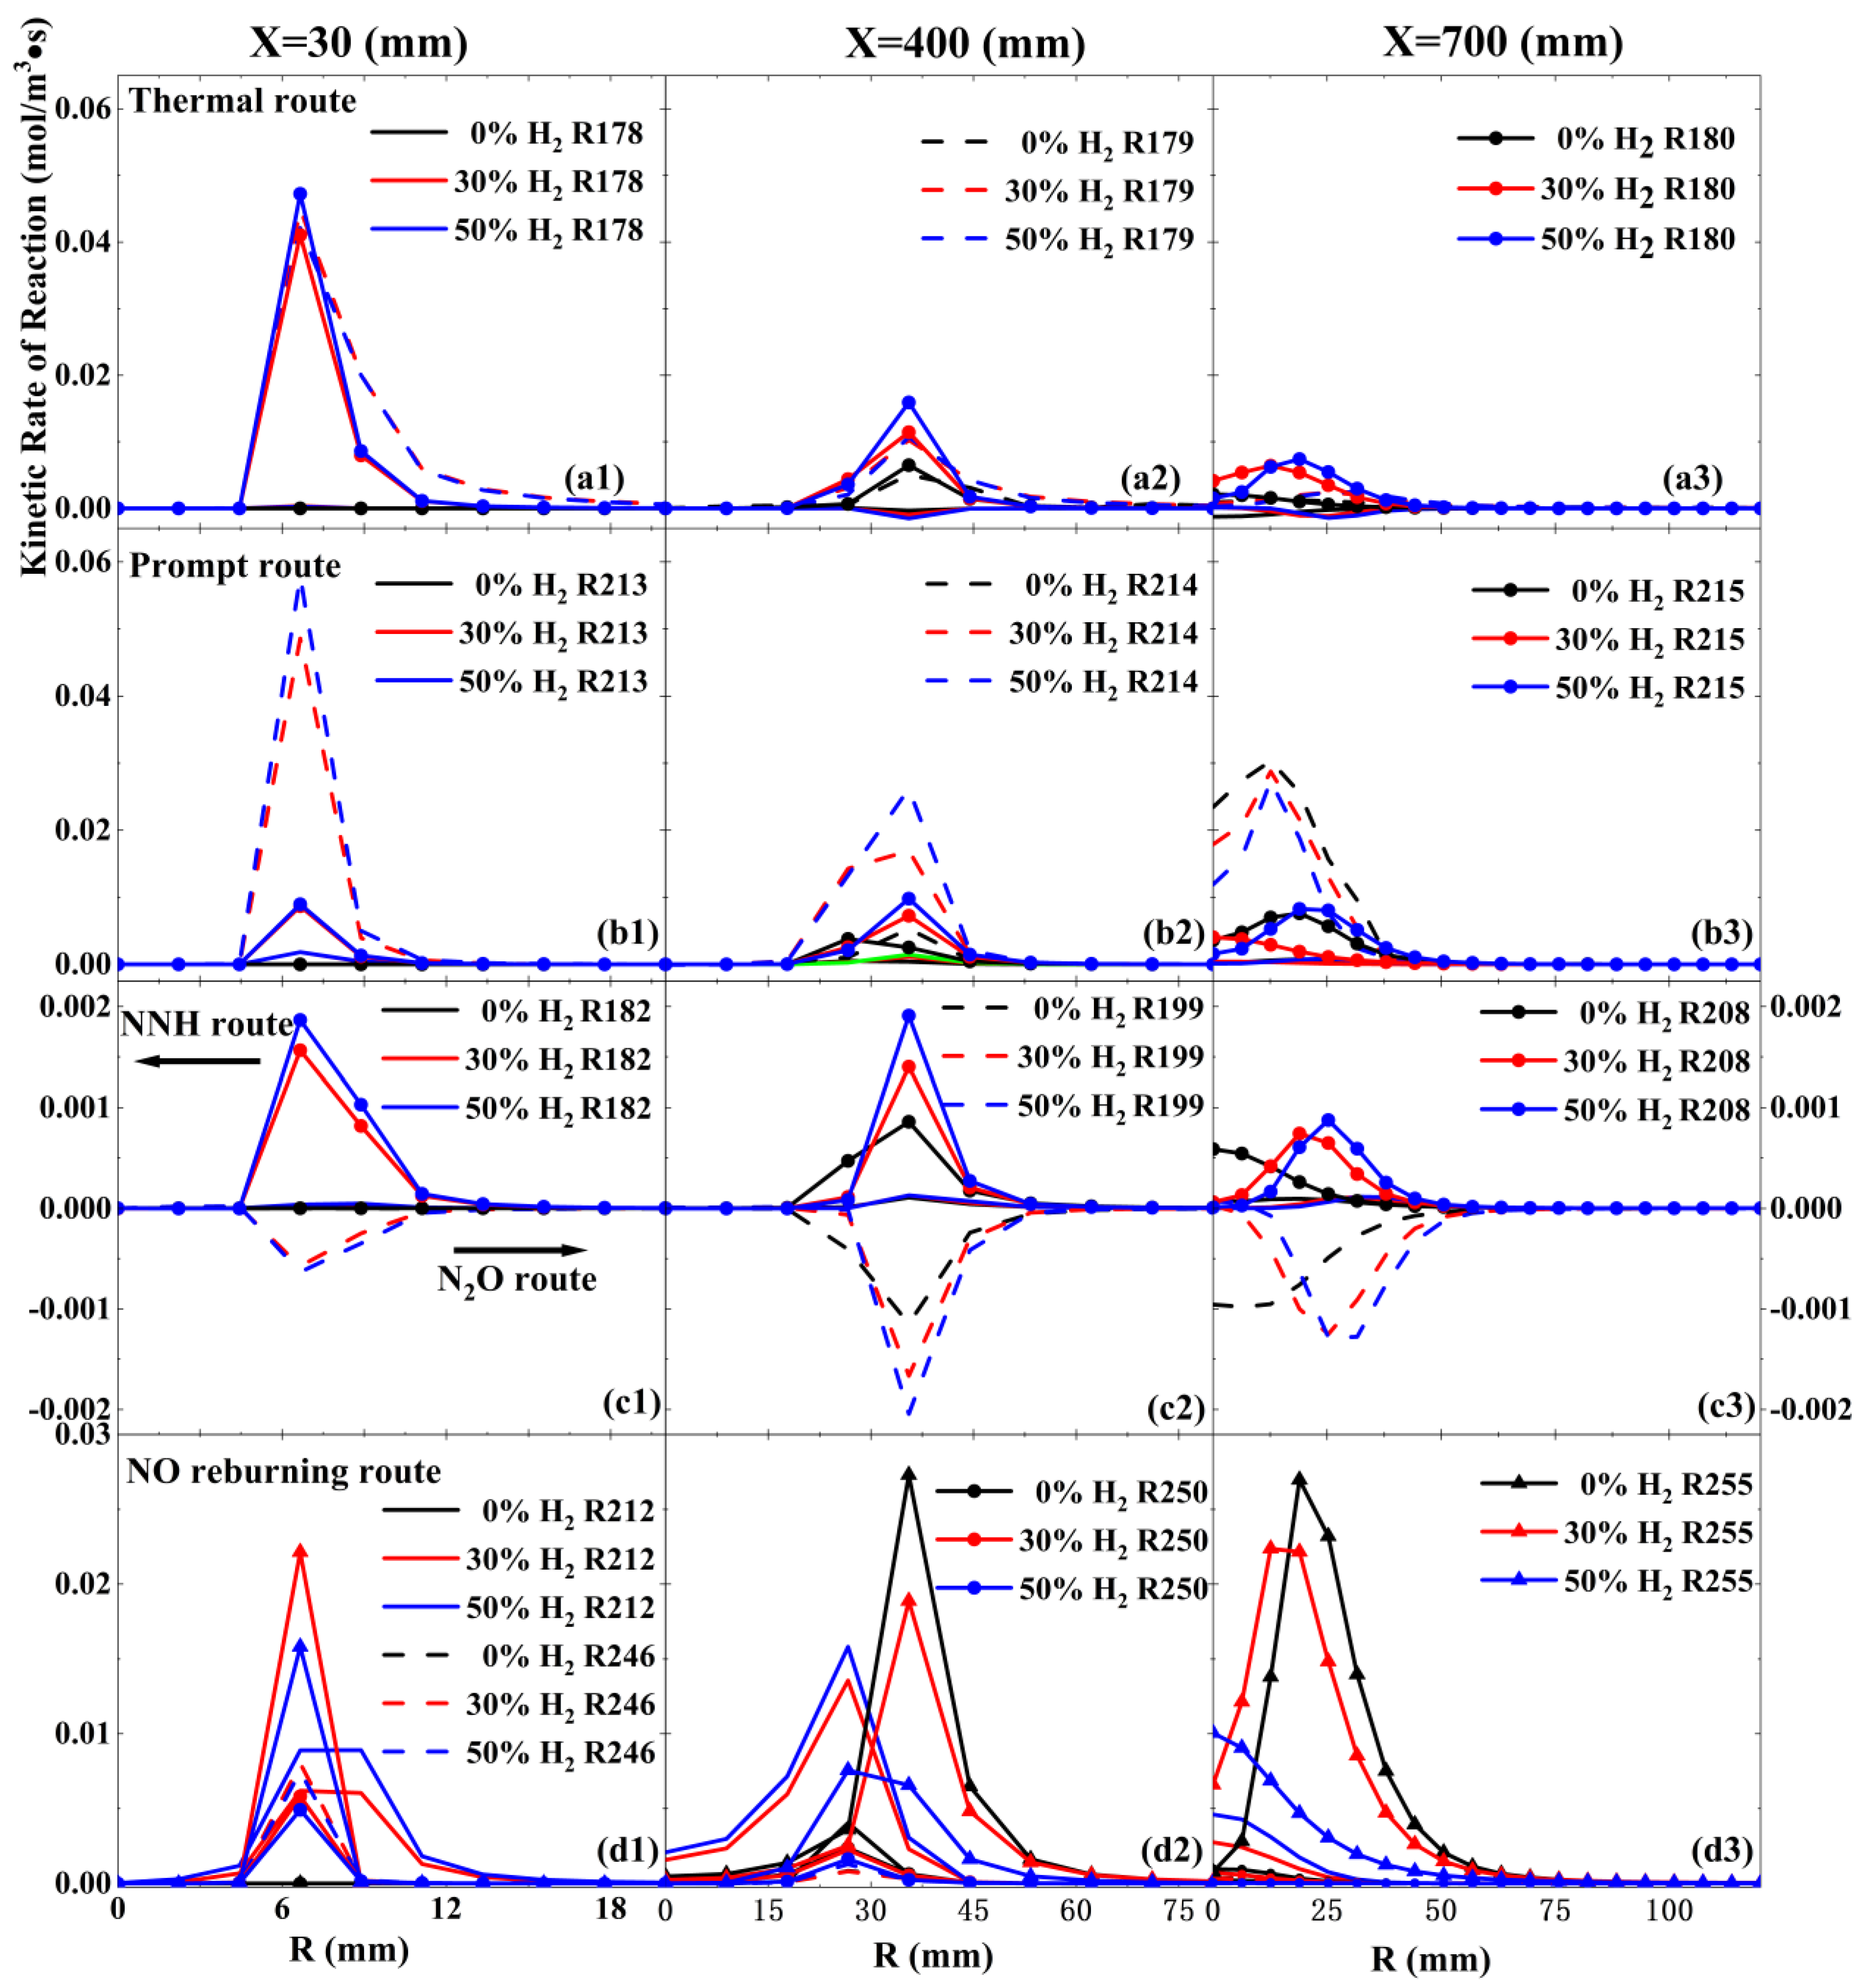
3.2. Effect of Hydrogen Content on the Pathway of NO Production

To ascertain the function of disparate reaction pathways in NO production, an enhanced NO calculation method [60] was employed to investigate the production and destruction of NO under distinct pathways individually, as illustrated in Table 5. The following steps are undertaken: firstly, the key reactions of the prompt route, the NNH route, the N2O route, and the NO-reburning route are identified. Thereafter, these steps are processed in order, with each step subjected to independent simulation analysis. The difference between step1 and step2, step2 and step3, step3 and step4, as well as step4 and step5, is attributed to the NO contribution from the NO-reburning, prompt, NNH, and N2O-intermediate pathways, respectively, the simulation result of Step 5 is the contribution of the thermal pathways.
For the NO emission, EINO represents the ratio between the rate of NO production and fuel consumption rate in the entire computational domain [55]. That is,
E I N O = M W N O ω N O d x M W j ω j d x ( k g N O / k g f u e l )
where MWj and ωj (j = CH4, H2) represent the molecular weight and production/consumption rate, respectively, of the species.
Figure 7 illustrates the mixture inlet temperature, reactants self-ignition temperature, maximum combustion temperature, and maximum temperature difference derived from CRN calculations. As the hydrogen content rises, the reactant’s self-ignition temperature decreases, while both the maximum combustion temperature and the maximum temperature difference increase. All the conditions satisfy the MILD combustion definition Tin > Tsi > ∆Tmax. Figure 8 illustrates the production and destruction of NO via various pathways and EINO at varying hydrogen levels. In this context, “Full” refers to the NO production derived from the complete mechanism file in Step 1 of Table 5, while “Sum” indicates the total NO production from all subpathways. The figure shows that the “Full” and “Sum” curves coincide, which validates the decoupling analysis of the NO sub-routes as reliable. As the hydrogen content increases, both NO emissions and EINO rise, while the proportion of NO production by the prompt pathway and consumption through the NO-reburning pathway gradually declines. In contrast, the contribution of the N2O pathway and the thermal pathway gradually increases. This finding is generally consistent with the trend observed in the MILD flame. Figure 9 illustrates the sensitivity analysis for NO at different hydrogen contents calculated by Chemkin-pro, to identify the key reactions responsible for the formation and reduction of NO. Positive coefficients indicate that the reaction promotes the production of NO, while negative coefficients indicate that the reaction inhibits the formation of NO, with the magnitude of the values representing the degree of importance. As the hydrogen content increases, the prompt pathway correlation reaction R240 gradually decreases in sensitivity coefficient. However, it remains the most important reaction for promoting NO production. In contrast, the thermal pathway correlation reaction R178 gradually increases in importance, approaching the role played by the N2O pathway. This results in the thermal NO production at a hydrogen content of 50%, which is approximately equal to the N2O pathway NO production. Furthermore, the rise in hydrogen levels results in higher production of H radicals and H2O within the components, inhibiting the NO-reburning reactions R249 and R255.
Figure 10 illustrates the NO production routes for reaction rates exceeding 10⁻12 mol/(m3·s) under combustion conditions of pure methane, as well as an equal volume of CH4/H2 fuel MILD. N2 converts to NO mainly through the thermal pathway: N2 → N → NO, the prompt pathway: N2 → HCN → HNCO → NH2 → NH → HNO → NO, the NNH pathway: N2 → NNH → NO, and the N2O-intermediate pathway: N2 → N2O → NO. Moreover, the NO is reduced through NO-reburning pathway via CHi=1–3: NO + CHi → N, HCN, and the NO-reburning pathway via H radicals: NO + H → HNO. In hydrogen-doped conditions, the rates of reactions R178 and R180 for the thermal pathway, reaction R208 for the NNH pathway, and reaction R199 for the N2O pathway were nearly doubled. This indicates a notable increase in the role of these particular reactions in NO production during hydrogen-doped combustion. While the rates of the prompt pathway in the hydrogen-doped combustion process, excluding those involving H and H2O, exhibit varying degrees of decline, their rate values remain significantly higher than those of the other three NO production pathways. This highlights that the prompt pathway still has a major influence on NO production, even in hydrogen-doped environments. In the presence of hydrogen doping, a significant conversion between NO2 and NO persists. It is particularly noteworthy that the reaction rate R212 for the NO-reburning pathway via H radicals has nearly tripled. However, this does not alter the predominance of the NO-reburning pathway via CHi=1–3.

3.3. Effect of Hydrogen Content on the Pathway of CO Production

Figure 11 shows the sensitivity analysis for CO at different hydrogen contents. It can be observed that the absolute value of the sensitivity coefficient of reaction R99 increases in tandem with the rise in the hydrogen doping ratio. This reaction plays a pivotal role in regulating the conversion process of CO to CO2. The findings indicate that the incorporation of hydrogen facilitates the oxidation of CO, thereby enhancing the rate of conversion of CO to CO2. Meanwhile, the sensitivity coefficients for other reactions associated with CO production, including R135, R153, R166, and R167, diminished as the hydrogen content increased. Notably, reaction R153, which depicts the conversion of CO2 to CO, has the highest sensitivity coefficient among these reactions. This indicates that in MILD combustion conditions, the primary source of CO is the reduction of CO2, and the introduction of hydrogen negatively impacts this reduction process, thereby slowing down the conversion of CO2 to CO.
Figure 12 illustrates the CO production pathways with reaction rates surpassing 10−10 mol/(m3·s) for both pure methane and MILD combustion conditions using an equal volume of CH4/H2 fuel. Under MILD combustion conditions, methane primarily produces CO through the pathway: CH4 → CH3 → CH2(s), CH2, CH3OH, CH2O, HCO → CO. The introduction of hydrogen led to a decrease in the reaction rate of CH4 → CH3, which is the initial step in CO production. This implies that the CH4 pyrolysis process was inhibited, with a 20% reduction in the reaction rate of the most prominent reaction, R98: OH + CH4 ⇔ CH3 + H2O. Additionally, there was an overall reduction in the rates of all reactions related to CO production with the addition of hydrogen, demonstrating that hydrogen significantly lowered the rate of CO production. CO is a product of incomplete combustion of methane and can be consumed by the reaction R99: OH + CO ⇔ H + CO2, the rate of this reaction increased by 28% when hydrogen was added, leading to a higher rate of CO consumption. Conversely, the rate of another reaction, R153: CH2(S) + CO2 ⇔ CO + CH2O, which involves the conversion of CO2 to CO, decreased by 32%. These analyses indicate that the increased rate of converting CO to CO2 during hydrogen-doped MILD combustion, along with the reduced rate of CO production, are the primary factors contributing to the decline in CO levels.

4. Conclusions

In this paper, the NO and CO production characteristics of CH4/H2 blended fuels in MILD flames in the 0–50% volume fraction range are comprehensively investigated using a JHC burner. Aiming at the actual operating conditions of the JHC burner, this paper constructs an exhaustive chemical reaction network model to study the MILD combustion process under methane doping conditions systematically and deeply analyzes the production pathways of NO and CO. The main conclusions obtained are as follows:
(1)
As the hydrogen content rises, the reaction rate of the NO-reburning pathway via CHi=1–3 tends to decrease. Conversely, the reaction rates for the thermal, NNH, and N2O increase, leading to a larger area for primary NO production and a smaller area for primary NO consumption in the JHC flame. This change results in higher NO production near the burner, with the peak NO concentration increasing from 33.3 ppm to 56.6 ppm.
(2)
In JHC flames, the reaction rate related to CO production varies across different areas and is not significant. The reaction OH + CO ⇔ H + CO2 is the primary one, and its rate increases with higher hydrogen levels. This boost in reaction rate speeds up the transformation of CO into CO2, resulting in reduced CO production.
(3)
The addition of hydrogen reduces the influence of the prompt pathway, the primary route for NO production, while boosting the roles of the thermal pathway and the N2O pathway in NO production. Even though the reaction rate of the NO-reburning pathway via H radicals tripled with 50% hydrogen content, However, the rate of the NO-reburning pathway dominated by the via CHi=1–3 decreases, ultimately leading to a decrease in the amount of NO consumed through NO-reburning.
(4)
In MILD combustion, the primary source of CO is the reaction CH2(S) + CO2 ⇔ CO + CH2O. The introduction of hydrogen reduces all reactions that produce CO while simultaneously increasing the CO oxidation reaction OH + CO ⇔ H + CO2. This inhibition of CO production and enhancement of CO oxidation is the key factor contributing to the reduction of CO levels in hydrogen-doped MILD combustion.

Author Contributions

Conceptualization, L.L. and H.J.; methodology, L.L.; software, H.J.; validation, L.L., H.J.; formal analysis, L.L.; investigation, H.J.; resources, L.L.; data curation, L.L.; writing—original draft preparation, H.J.; writing—review and editing, H.J.; visualization, H.J.; supervision, L.L.; project administration, L.L.; funding acquisition, L.L. All authors have read and agreed to the published version of the manuscript.

Funding

This research was funded by [Jiangxi Province Major Science and Technology R&D Special Projects] grant number [20214ABC28W003].

Data Availability Statement

The original contributions presented in the study are included in the article, further inquiries can be directed to the corresponding author.

Conflicts of Interest

The authors declare no conflict of interest.

Nomenclature

Acronyms
MILDModerate or intense low oxygen dilution
JHCJet in a hot coflow
CFDComputational fluid dynamics
CRNChemical reaction network
PSRPerfectly stirred reactor
DaDamköhler number
EDCEddy dissipation concept
ReReynolds number
CHBRClosed Homogeneous Batch Reactor
EINONO emissions index
Symbols
CConstant of k-ε model
CτTimescale constant of EDC model
YiMass fraction of species i
TfTemperature of fuel jet
TcTemperature of coflow jet
VcCoflow jet velocity
VfFuel jet velocity
XH2Hydrogen volume fraction in the fuel
XCH4Methane volume fraction in the fuel
TinInlet temperature
TsiSelf-ignition temperature of reactants
TmaxMaximum temperature
TmaxMaximum temperature rise, ∆Tmax = Tmax − Tin
MWjMolecular weigh
Greek letters
τfTurbulent flow time scale
τrReaction time scale
ξCharacteristic length fraction in EDC model

References

  1. Reed, R.J. North American Combustion Handbook; North American Manufacturing Company: Scranton, PA, USA, 2014. [Google Scholar]
  2. El-Ghafour, S.A.A.; El-dein, A.H.E.; Aref, A.A.R. Combustion Characteristics of Natural Gas–Hydrogen Hybrid Fuel Turbulent Diffusion Flame. Int. J. Hydrogen Energy 2010, 35, 2556–2565. [Google Scholar] [CrossRef]
  3. Schefer, R.W.; Wicksall, D.M.; Agrawal, A.K. Combustion of Hydrogen-Enriched Methane in a Lean Premixed Swirl-Stabilized Burner. Proc. Combust. Inst. 2002, 29, 843–851. [Google Scholar] [CrossRef]
  4. Mardani, A.; Tabejamaat, S. Effect of Hydrogen on Hydrogen–Methane Turbulent Non-Premixed Flame under MILD Condition. Int. J. Hydrogen Energy 2010, 35, 11324–11331. [Google Scholar] [CrossRef]
  5. Wünning, J.A.; Wünning, J.G. Flameless Oxidation to Reduce Thermal No-Formation. Prog. Energy Combust. 1997, 23, 81–94. [Google Scholar] [CrossRef]
  6. Dally, B.B.; Shim, S.H.; Craig, R.A.; Ashman, P.J.; Szegö, G. On the Burning of Sawdust in a MILD Combustion Furnace. Energy Fuels 2010, 24, 3462–3470. [Google Scholar] [CrossRef]
  7. Szegö, G.G.; Dally, B.B.; Nathan, G.J. Operational Characteristics of a Parallel Jet MILD Combustion Burner System. Combust. Flame 2009, 156, 429–438. [Google Scholar] [CrossRef]
  8. Li, P.F.; Mi, J.C.; Dally, B.B.; Wang, F.F.; Wang, L.; Liu, Z.H.; Chen, S.; Zheng, C.G. Progress and Recent Trend in MILD Combustion. Sci. China Technol. Sci. 2011, 54, 255–269. [Google Scholar] [CrossRef]
  9. Tsuji, H.; Gupta, A.; Hasegawa, T.; Katsuki, M.; Kishimoto, K.; Morita, M. High Temperature Air Combustion: From Energy Conservation to Pollution Reduction; CRC Press: Boca Raton, FL, USA, 2002; p. 402. [Google Scholar] [CrossRef]
  10. Cavaliere, A.; Joannon, M. Mild Combustion. Prog. Energy Combust. 2004, 30, 329–366. [Google Scholar] [CrossRef]
  11. Yu, Y.; Wang, G.F.; Lin, Q.Z.; Ma, C.B.; Xing, X.J. Flameless combustion for hydrogen containing fuels. Int. J. Hydrogen Energy 2010, 35, 2694–2697. [Google Scholar] [CrossRef]
  12. Ayoub, M.; Rottier, C.; Carpentier, S.; Villermaux, C.; Boukhalfa, A.M.; Honoré, D. An experimental study of mild flameless combustion of methane/hydrogen mixtures. Int. J. Hydrogen Energy 2012, 37, 6912–6921. [Google Scholar] [CrossRef]
  13. Fabián, E.C.A.; Julian, E.O.A.; Andrés, A.A.A. Emissions and dynamic stability of the flameless combustion regime using hydrogen blends with natural gas. Int. J. Hydrogen Energy 2021, 46, 1246–1258. [Google Scholar] [CrossRef]
  14. Marco, D.; Alessandro, V.; Renato, R. Sustainability of mild combustion of hydrogen-containing hybrid fuels. Proc. Combust. Inst. 2007, 31, 3393–3400. [Google Scholar] [CrossRef]
  15. Markus, M.; Michael, K.; Peter, S.; Hadi, B.; Rene, P.; Christoph, H. MILD combustion of hydrogen and air—An efficient modelling approach in CFD validated by experimental data. Int. J. Hydrogen Energy 2022, 47, 6349–6364. [Google Scholar] [CrossRef]
  16. Amin, K.; Ali, S.Z.; Mobin, M.; Seyyed, B.N.N.; Vahid, E. Effect of Hydrogen Enrichment on Pollutant and Greenhouse Gases Formation and Exergy Efficiency of Methane MILD Combustion. In Environmentally-Benign Energy Solutions; Springer: Cham, Switzerland, 2019; pp. 403–429. [Google Scholar] [CrossRef]
  17. Dally, B.B.; Karpetis, A.N.; Barlow, R.S. Structure of Turbulent Non-Premixed Jet Flames in a Diluted Hot Coflow. Proc. Combust. Inst. 2002, 29, 1147–1154. [Google Scholar] [CrossRef]
  18. Paul, R.M.; Dally, B.B. Effect of fuel composition on jet flames in a heated and diluted oxidant stream. Combust. Flame 2012, 159, 3138–3145. [Google Scholar] [CrossRef]
  19. Mendez, L.D.A.; Tummers, M.J.; Veen, E.H.; Roekaerts, D.J.E.M. Effect of hydrogen addition on the structure of natural-gas jet-in-hot-coflow flames. Proc. Combust. Inst. 2015, 35, 3557–3564. [Google Scholar] [CrossRef]
  20. Gao, X.; Duan, F.; Lim, S.C.; Yip, M.S. NOx formation in hydrogen–methane turbulent diffusion flame under the moderate or intense low-oxygen dilution conditions. Energy 2013, 59, 559–569. [Google Scholar] [CrossRef]
  21. Liao, H.H.; Hu, F.; Wu, X.Y.; Li, P.F.; Ding, C.J.; Yang, C.; Zhang, T.; Liu, Z.H. Effects of H2 addition on the characteristics of the reaction zone and NOx mechanisms in MILD combustion of H2-rich fuels. Int. J. Hydrogen Energy 2024, 58, 174–189. [Google Scholar] [CrossRef]
  22. Tu, Y.J.; Liu, O.H.; Yang, W.M. Flame Characteristics of CH4/H2 on a Jet-in-Hot-Coflow Burner Diluted by N2, CO2, and H2O. Energy Fuels 2017, 31, 3270–3280. [Google Scholar] [CrossRef]
  23. Jiang, X.D.; Li, P.F.; Guo, J.J.; Hu, F.; Wang, F.; Mi, J.; Liu, Z. Detailed investigation of NO mechanism in non-premixed oxy-fuel jet flames with CH4/H2 fuel blends. Int. J. Hydrogen Energy 2018, 43, 8534–8557. [Google Scholar] [CrossRef]
  24. Amir, M.; Hamed, K.M.M. Hydrogen enrichment of methane and syngas for MILD combustion. Int. J. Hydrogen Energy 2019, 44, 9423–9437. [Google Scholar] [CrossRef]
  25. Zhao, Z.H.; Zhang, Z.W.; Zha, X.J.; Gao, G.; Mao, W.C.; Wu, F.; Li, X.S.; Luo, C.; Zhang, L.Q. Fuel-NO formation mechanism in MILD-oxy combustion of CH4/NH3 fuel blend. Fuel 2023, 331, 125817. [Google Scholar] [CrossRef]
  26. Li, P.; Wang, F.; Mi, J.; Dally, B.B.; Mei, Z.; Zhang, J.; Parente, A. Mechanisms of NO formation in MILD combustion of CH4/H2 fuel blends. Int. J. Hydrogen Energy 2014, 39, 19187–19203. [Google Scholar] [CrossRef]
  27. Ali, G.; Zhang, T.Y.; Wu, W.D.; Zhou, Y.G. Effect of hydrogen addition on NOx formation mechanism and pathways in MILD combustion of H2-rich low calorific value fuels. Int. J. Hydrogen Energy 2020, 45, 9200–9210. [Google Scholar] [CrossRef]
  28. Pan, H.J.T.; Geng, S.J.; Yang, H.; Zhang, G.H.; Bian, H.; Liu, Y.H. Influence of H2 blending on NOx production in natural gas combustion: Mechanism comparison and reaction routes. Int. J. Hydrogen Energy 2023, 48, 784–797. [Google Scholar] [CrossRef]
  29. Park, J.; Kim, D.; Lee, Y. Experimental study on flameless combustion and NO emission with hydrogen-containing fuels. Int. J. Energy Res. 2022, 46, 2512–2528. [Google Scholar] [CrossRef]
  30. Mehmet, S.C. Flameless combustion investigation of CH4/H2 in the laboratory-scaled furnace. Int. J. Hydrogen Energy 2020, 45, 35208–35222. [Google Scholar] [CrossRef]
  31. Esmaeil, E.F.; Fateme, A.B. NO emission characteristics for the HTC and MILD combustion regimes with N2, N2/CO2 and CO2 diluents: Effect of H2 addition to CH4. Int. J. Hydrogen Energy 2023, 48, 36185–36210. [Google Scholar] [CrossRef]
  32. Xu, S.T.; Tong, Y.H.; Jin, S.C.; Ren, H.; Tu, Y.J.; Zhang, S.H.; Liu, H. NO formation and reduction during methane/hydrogen MILD combustion over a wide range of hydrogen-blending ratios in a well-stirred reactor. Fuel 2023, 346, 128324. [Google Scholar] [CrossRef]
  33. Xu, S.T.; Tian, Z.Y.; Tian, S.J.; Xi, L.Y.; Tu, Y.J.; Liu, H. Sustainability of hydrogen-enriched methane MILD combustion over a wide range of hydrogen-blending ratios in a strongly heat-extracted well-stirred reactor. Fuel 2024, 357, 130035. [Google Scholar] [CrossRef]
  34. Xu, S.T.; Tian, Z.Y.; Chen, Y.X.; Liang, S.Y.; Tu, Y.J.; Liu, H. Effect of hydrogen-blending ratio and wall temperature on establishment, NO formation, and heat transfer of hydrogen-enriched methane MILD combustion. Fuel 2024, 369, 131787. [Google Scholar] [CrossRef]
  35. Wang, H.T.; Tong, Z.; Zhou, G.J.; Zhang, C.; Zhou, H.Y.; Wang, Y.; Zheng, W.Y. Research and demonstration on hydrogen compatibility of pipelines: A review of current status and challenges. Int. J. Hydrogen Energy 2022, 47, 28585–28604. [Google Scholar] [CrossRef]
  36. Cheong, K.P.; Li, P.F.; Wang, F.F.; Mi, J.C. Emissions of NO and CO from counterflow combustion of CH4 under MILD and oxyfuel conditions. Energy 2017, 124, 652–664. [Google Scholar] [CrossRef]
  37. Zhu, Z.R.; Xiong, Y.; Zheng, X.L.; Chen, W.J.; Ren, B.H.; Xiao, Y.H. Experimental and Numerical Study of the Effect of Fuel/Air Mixing Modes on NOx and CO Emissions of MILD Combustion in a Boiler Burner. J. Therm. Sci. 2021, 30, 656–667. [Google Scholar] [CrossRef]
  38. He, Y.Z.; Zou, C.; Song, Y.; Luo, J.H.; Jia, H.Q.; Chen, W.Z.; Zheng, J.M.; Zheng, C.G. Comparison of the characteristics and mechanism of CO formation in O2/N2, O2/CO2 and O2/H2O atmospheres. Energy 2017, 141, 1429–1438. [Google Scholar] [CrossRef]
  39. Zou, C.; Cao, S.Y.; Song, Y.; He, Y.Z.; Guo, F.; Zheng, C.G. Characteristics and mechanistic analysis of CO formation in MILD regime with simultaneously diluted and preheated oxidant and fuel. Fuel 2014, 130, 10–18. [Google Scholar] [CrossRef]
  40. Amir, M.; Sadegh, T.; Shahla, H. Numerical study of CO and CO2 formation in CH4/H2 blended flame under MILD condition. Combust. Flame 2013, 160, 1636–1649. [Google Scholar] [CrossRef]
  41. Wang, F.; Mi, J.; Li, P.; Zheng, C. Diffusion Flame of a CH4/H2 Jet in Hot Low-Oxygen Coflow. Int. J. Hydrogen Energy 2011, 36, 9267–9277. [Google Scholar] [CrossRef]
  42. Mei, Z.; Mi, J.; Wang, F.; Zheng, C. Dimensions of CH4-Jet Flame in Hot O2/CO2 Coflow. Energy Fuels 2012, 26, 3257–3266. [Google Scholar] [CrossRef]
  43. Christo, F.C.; Dally, B.B. Modelling turbulent reacting jets issuing into a hot and diluted coflow. Combust. Flame 2005, 142, 117–129. [Google Scholar] [CrossRef]
  44. Li, P.; Wang, F.; Mi, J.; Dally, B.B.; Mei, Z. Mild combustion under different premixing patterns and characteristics of the reaction regime. Energy Fuel 2014, 28, 2211–2226. [Google Scholar] [CrossRef]
  45. Aanjaneya, K.; Cao, W.; Chen, Y.; Borgnakke, C.; Atreya, A. A numerical study of confined turbulent jets for homogeneous combustion with oxygen enrichment. Fuel 2020, 261, 116449. [Google Scholar] [CrossRef]
  46. Azarinia, A.; Mahdavy-Moghaddam, H. Comprehensive numerical study of molecular diffusion effects and eddy dissipation concept model in MILD combustion. Int. J. Hydrogen Energy 2021, 46, 2952–2965. [Google Scholar] [CrossRef]
  47. Mardani, A. Optimization of the Eddy Dissipation Concept (EDC) Model for Turbulence-Chemistry Interactions under Hot Diluted Combustion of CH4/H2. Fuel 2017, 191, 114–129. [Google Scholar] [CrossRef]
  48. Parente, A.; Malik, M.R.; Contino, F.; Cuoci, A.; Dally, B.B. Extension of the eddy dissipation concept for turbulence/chemistry interactions to MILD combustion. Fuel 2016, 163, 98–111. [Google Scholar] [CrossRef]
  49. Gran, I.R.; Magnussen, B.F. A numerical study of a bluff-body stabilized diffusion flame. Part 2. Influence of combustion modeling and finite-rate chemistry. Combust. Sci. Technol. 1996, 119, 191–217. [Google Scholar] [CrossRef]
  50. Guo, J.; Li, X.; Huang, X.; Liu, Z.; Zheng, C. A Full Spectrum K-Distribution Based Weighted-Sum-of-Gray-Gases Model for Oxy-Fuel Combustion. Int. J. Heat Mass Transf. 2015, 90, 218–226. [Google Scholar] [CrossRef]
  51. Li, P.F.; Mi, J.C. Influence of Inlet Dilution of Reactants on Premixed Combustion in a Recuperative Furnace. Flow Turbul. Combust. 2011, 87, 617–638. [Google Scholar] [CrossRef]
  52. Shu, Z.; Dai, C.; Li, P.; Mi, J. Nitric Oxide of MILD Combustion of a Methane Jet Flame in Hot Oxidizer Coflow: Its Formations and Emissions under H2O, CO2, and N2 Dilutions. Fuel 2018, 234, 567–580. [Google Scholar] [CrossRef]
  53. Beér, J.M. Minimizing NOx Emissions from Stationary Combustion; Reaction Engineering Methodology. Chem. Eng. Sci. 1994, 49, 4067–4083. [Google Scholar] [CrossRef]
  54. Skottene, M.; Rian, K.E. A Study of NOx Formation in Hydrogen Flames. Int. J. Hydrogen Energy 2007, 32, 3572–3585. [Google Scholar] [CrossRef]
  55. Turns, S.R. An Introduction to Combustion; McGraw-Hill: New York, NY, USA, 1996. [Google Scholar]
  56. Bozzelli, J.W.; Dean, A.M. O + NNH: A Possible New Route for NOX Formation in Flames. Int. J. Chem. Kinet. 1995, 27, 1097–1109. [Google Scholar] [CrossRef]
  57. Myerson, A.L.; Taylor, F.R.; Faunce, B.G. Ignition limits and products of the multistage flames of propane-nitrogen dioxide mixtures. Symp. (Int.) Combust. 1957, 6, 154–163. [Google Scholar] [CrossRef]
  58. Dagaut, P.; Lecomte, F. Experiments and Kinetic Modeling Study of NO-Reburning by Gases from Biomass Pyrolysis in a JSR. Energy Fuels 2003, 17, 608–613. [Google Scholar] [CrossRef]
  59. Glarborg, P.; Kristensen, P.G.; Dam-Johansen, K.; Alzueta, M.; Millera, A.; Bilbao, R. Nitric oxide reduction by non-hydrocarbon fuels. Implications for reburning with gasification gases. Energy Fuels 2000, 14, 828–838. [Google Scholar] [CrossRef]
  60. Xu, S.T.; Jin, S.C.; Tong, Y.H.; Shi, B.; Tu, Y.J.; Liu, H. Quantitative Evaluation of NO Formation and Destruction Routes during Methane MILD Combustion Using an Improved Calculation Method. Fuel 2022, 324, 124593. [Google Scholar] [CrossRef]
Figure 1. (a) Dally et al. [17] schematic of the JHC burner structure. (b) Simplified schematic of the original model. (c) Grid-independent verification. (d) Modified model.
Energies 17 04382 g001
Figure 2. For the HM1-3 flame, simulation results at X = 30 mm were compared with experimental measurements.
Energies 17 04382 g002
Figure 3. Chemical reaction network model.
Energies 17 04382 g003
Figure 4. Distribution of NO and CO at different hydrogen contents.
Energies 17 04382 g004
Figure 5. The NO formation rates through (a) the thermal route, (b) the prompt route, (c) the NNH route and N2O route, and (d) the NO reburning route (at distances (a1d1) X = 30 mm, (a2d2) X = 400 mm, and (a3d3) X = 700 mm).
Energies 17 04382 g005
Figure 6. The CO production rates at the distances of (a) X = 30 mm, (b) X = 150 mm, and (c) X = 500 mm.
Energies 17 04382 g006
Figure 7. Reactant parameters at different hydrogen contents.
Energies 17 04382 g007
Figure 8. At different hydrogen levels: (a) the amount of NO produced and the total EINO through different pathways, (b) contributions.
Energies 17 04382 g008
Figure 9. Sensitivity analysis for NO at different hydrogen contents.
Energies 17 04382 g009
Figure 10. NO production pathway. units: kmol/(m3·s).
Energies 17 04382 g010
Figure 11. Sensitivity analysis for CO at different hydrogen contents.
Energies 17 04382 g011
Figure 12. CO production pathway, units: kmol/(m3·s).
Energies 17 04382 g012
Table 1. Inlet conditions of Dally et al.’s experiments [17] (The mixture is expressed in wt%).
CaseFuel JetHot Coflow
ReTf(K)Tc(k)Vc(m/s)YO2YCO2YH2OYN2
HM1948230513003.235.56.585
HM2948230513003.265.56.582
HM3948230513003.295.56.579
Table 2. Operational conditions of fuel and Hot coflow inlet.
CaseFuel Inlet (Composition Vol%)Hot Coflow (Composition Mass%)
ReVf(m/s)Tf(K)XH2XCH4Vc(m/s)Tc(k)YO2YCO2YH2OYN2
1948236.130501003.2130095.56.579
2948239.530510903.2130095.56.579
3948243.230520803.2130095.56.579
4948247.830530703.2130095.56.579
5948253.530540603.2130095.56.579
694826130550503.2130095.56.579
Table 3. Key reactions for NO production under different pathways.
RouteReaction
ThermalR178: N + NO ⇔ N2 + OR179: N + O2 ⇔ NO + OR180: N + OH ⇔ NO + H
PromptR240: CH + N2 ⇔ HCN + NR242: CH2 + N2 ⇔ HCN + NHR243: CH2(S) + N2 ⇔ NH + HCN
N2O-intermediateR181: N2O + O ⇔ N2 + O2R182: N2O + O ⇔ 2NOR183: N2O + H ⇔ N2 + OH
R185: N2O( + M) ⇔ N2 + O( + M)R199: NH + NO ⇔ N2O + H
NNHR204: NNH ⇔ N2 + HR205: N2 + H + M ⇔ NNH + MR206: NNH + O2 ⇔ HO2 + N2
R207: NNH + O ⇔ OH + N2R208: NNH + O ⇔ NH + NO
NO-reburningR212: H + NO + M ⇔ HNO + MR244: C + NO ⇔ CN + OR245: C + NO ⇔ CO + N
R246: CH + NO ⇔ HCN + OR247: CH + NO ⇔ H + NCOR248: CH + NO ⇔ N + HCO
R249: CH2 + NO ⇔ H + HNCOR250: CH2 + NO ⇔ HCN + OHR251: CH2 + NO ⇔ H + HCNO
R252: CH2(S) + NO ⇔ H + HNCOR253: CH2(S) + NO ⇔ HCN + OHR254: CH2(S) + NO ⇔ H + HCNO
R255: CH3 + NO ⇔ HCN + H2OR256: CH3 + NO ⇔ H2CN + OHR274: HCCO + NO ⇔ HCNO + CO
Table 4. CO production-related reactions.
R10: O + CH3 ⇔ H + CH2OR11: C + CH4 ⇔ OH + CH3R15: O + CH2O ⇔ OH + HCO
RR53: H + CH4 ⇔ CH3 + H2R56: H + CH2O( + M) ⇔ CH2OH( + M)R57: H + CH2O( + M) ⇔ CH3O( + M)
R58: H + CH2O ⇔ HCO + H2R61: H + CH2OH ⇔ OH + CH3R92: OH + CH2 ⇔ H + CH2O
R93: OH + CH2 ⇔ CH + H2OR95: OH + CH3( + M) ⇔ CH3OH( + M)R97: OH + CH3 ⇔ CH2(S) + H2O
R98: OH + CH4 ⇔ CH3 + H2OR99: OH + CO ⇔ H + CO2R100: OH + HCO ⇔ H2O + CO
R101: OH + CH2O ⇔ HCO + H2OR104: OH + CH3OH ⇔ CH2OH + H2OR105: OH + CH3OH ⇔ CH3O + H2O
R125: CH + O2 ⇔ O + HCOR127: CH + H2O ⇔ H + CH2OR135: CH2 + O2 ⇔ OH + H + CO
R142: CH2(S) + N2 ⇔ CH2 + N2R144: CH2(S) + O2 ⇔ H + OH + COR148: CH2(S) + H2O ⇔ CH2 + H2O
R152: CH2(S) + CO2 ⇔ CH2 + CO2R153: CH2(S) + CO2 ⇔ CO + CH2OR156: CH3 + O2 ⇔ OH + CH2O
R166: HCO + H2O ⇔ H + CO + H2OR167: HCO + M ⇔ H + CO + MR168: HCO + O2 ⇔ HO2 + CO
R169: CH2OH + O2 ⇔ HO2 + CH2OR288: OH + CH3 ⇔ H2 + CH2OR291: CH2 + O2 ⇔ O + CH2O
Table 5. Steps for analyzing NO production sub-pathways.
StepMechanism Processing Method
1Full mechanism
2Removing the NO-reburning route
3Removing the NO-reburning and prompt routes
4Removing the NO-reburning, prompt, and NNH routes
5Removing the NO-reburning, prompt, NNH, and N2Ointermediate routes
Disclaimer/Publisher’s Note: The statements, opinions and data contained in all publications are solely those of the individual author(s) and contributor(s) and not of MDPI and/or the editor(s). MDPI and/or the editor(s) disclaim responsibility for any injury to people or property resulting from any ideas, methods, instructions or products referred to in the content.

