Article

A Two-Stage Hybrid Stochastic–Robust Coordination of Combined Energy Management and Self-Healing in Smart Distribution Networks Incorporating Multiple Microgrids

1
School of Engineering and Energy, Murdoch University, Perth 6150, Australia
2
Offshore Wind Power Research Institute, Shanghai University of Electric Power, Shanghai 200090, China
*
Authors to whom correspondence should be addressed.
Energies 2024, 17(17), 4281; https://doi.org/10.3390/en17174281
Submission received: 17 April 2024 / Revised: 2 August 2024 / Accepted: 22 August 2024 / Published: 27 August 2024

Abstract

This paper presents a two-stage hybrid stochastic–robust coordination of energy management and self-healing in smart distribution networks with multiple microgrids. A multi-agent systems approach is first used for coupling energy management and self-healing strategies of microgrids, based on expert system rules. The second stage problem, a framework similar to that of the first stage, is then established for the smart distribution networks. Then, hybrid stochastic–robust optimization is used to model the uncertainties of demand, energy price, power generation of renewable energy sources, demand of electric vehicles, and accessibility of zone agents. Further, the grey wolf algorithm is used to solve the formulated optimization problem and achieve an optimal and reliable solution. The proposal is validated on a 69-bus distribution network consisting of three microgrids. The results validate that the proposal minimizes microgrids’ utilization indices, such as energy costs, energy losses, and network voltage drops, while simultaneously managing a flexible distribution network. It is also verified that the proposed multi-agent system design provides a high-speed and optimized self-healing solution for the network.

1. Introduction

With the emergence of technologies such as electric vehicles (EVs), renewable energy systems (RESs), and energy storage systems (ESSs) in distribution networks, certain traditional features of these networks are changing, such as the traditionally expected unidirectional power flow [1]. According to the Smart Network Field Theory, the coordination of network elements and a distribution system operator (DSO) is required for optimal management and monitoring at the presence of various resources and active loads in a distribution network [2]. Nevertheless, since a distribution network covers a wide area, the amount of data in the network management section will be large, leading to complexity in the DSO’s decision making. To solve this issue, the distribution network is recommended to be divided into several microgrids (MGs), each responsible for the management of its network assets through the MG operators (MGOs) [3]. Furthermore, optimal conditions can be realized in the distribution network by coordinating the MGOs and the DSO using a two-stage energy management system in the network. As such, the speed of network responsiveness will be high due to the reduced amount of data in the MG’s management sections and the distribution network [4]. In general, more than 80% of the outages in power systems occur in distribution networks. Therefore, self-healing capability refers to the system’s ability to automatically detect and isolate faults, and subsequently restore power to the unaffected areas without human intervention, following which the fault location is determined and disconnected for the least time possible. Moreover, the downstream load points that cannot supply their power via the faulty path are connected to and supplied via the healthy (non-faulty) paths by the tie-lines [5,6]. Since the self-healing strategy requires network parameters before fault occurrence, these parameters can be calculated by the optimal power flow (OPF) in the presence of sources and active loads. Hence, the coordination design of energy management and self-healing strategies is crucial to achieve optimal operation and protection.
Energy management, a key focus of research in MGs, allows providing optimal planning for distributed generators (DGs) and ESSs to obtain high flexibility and reliability in distribution networks [7]. In [8], the optimal planning of RESs and ESSs is presented in a distribution network which follows the energy management strategy. The method of [8] is used in [9] at both the household and network levels to optimally manage the charging and discharging of EVs in proportion to the RESs’ scheduling. In [10], active power management of the virtual energy storage is used to achieve a flat load profile in smart distribution networks (SDNs). The other method is the simultaneous management of active and reactive power of sources and active loads, which has been also stated in [11,12,13,14] for the optimal management of multiple MGs, flat voltage profile, fuzzy cognitive maps theory, and a hybrid approach involving multi-agent systems, a secure distribution network, and the minimum energy cost of the network elements, respectively. Refs. [15,16] have proposed an energy management strategy to achieve the optimal operating conditions in multiple MGs with a SDN.
Distribution network restoration is an acceptable strategy for achieving a healthy path to feed the maximum unsupplied demand on a faulty feeder [17,18]. The restoration methods are grouped into centralized and decentralized categories. Decentralized architecture is more flexible and less complex, based on autonomous local controllers [19]. While decentralized methods have been widely used in the field of self-healing, due to their capabilities in achieving rapid network restoration compared to centralized methods [20], various decentralized methods exist which are generally based on multi-agent systems (MASs). Ref. [21] reported the automatic self-healing method in a distribution network operating based on a MAS, and [22] has employed this design for an islanded MG. It is noteworthy that the MAS is based on expert system rules and has several zone agents located throughout the distribution network. Finally, each of the zone agents performs different tasks to achieve fast restoration. In [23], four types of zone agents including fault zone agent (FZA), down zone agent (DZA), zone tie agent (ZTA), and healthy zone agent (HZA) are defined, where FZA determines the fault location, DZA specifies the load points at the downstream of the fault area, and ZTA and HZA consider the position of tie-lines and healthy feeder loads, respectively. By establishing optimal coordination between these zone agents, the MAS provides optimal and fast restoration in fault conditions. Ref. [24] presents a restoration method in the presence of synchronous DGs, aiming to evaluate the rapid restoration of the distribution network. In addition, a self-healing method is presented in [25], where various uncertainties in the distribution network are considered to achieve reliable restoration.
As observed in the literature review section, self-healing and energy management problems have been considered independently in various studies. However, the self-healing or restoration problem requires knowledge of network variables before the fault occurrence. In addition to conventional distribution networks, power flow analysis has been highly used in research in this field. In other words, today’s distribution networks include active loads and, accordingly, network variables are calculated based on the OPF problem. Thereby, it is necessary to design the self-healing problem based on OPF. Further, most of the research in the field of energy management in the distribution network has recommended single-stage management systems to these networks and/or MGs. However, energy management in distribution networks is complex, due to its widespread extent. Therefore, categorizing the distribution network into several MGs and then coordinating the distribution network and MG operators is the best way to achieve optimal network energy management with faster responses. It is worth noting that most of the articles have managed to define four to five different operation modes for zone agents in the MAS problem, such as FZA and DZA, which makes the decision-making process in MAS a complex task. Generally, few numbers of operators allow making simple decisions with fast execution time in MAS. By establishing and coordination between the zone agents, distribution network, MG operators, DSO, and MGO, it is possible to eliminate the HZA operator [23] and give its required information by the DOS and/or MGO to other operators such as the FZA, DZA, and ZTA. Thus, this is an advantage of combining energy management and self-healing problems.
To fill the gaps in the above-mentioned research, this paper proposes a two-stage coordination of energy management and self-healing in SDNs consisting of multiple MGs. In the first stage, the optimal problem of energy management and self-healing coupling in MGs is stated, in which we attempt to minimize the MG’s operating cost and the number of operations of circuit breakers and unsupplied load under fault situations. The problem constraints include daily OPF equations of the MG incorporating EVs, ESSs, and RESs, and equations governing the distribution network restoration based on a MAS. The proposed MAS design has different zone agents, including a FZA, DZA, and ZTA, which are placed across the MG and the distribution network. The FZA determines the fault location, the DZA specifies the load points at the downstream of the fault area, and the ZTA considers the position of tie-lines. Then, a design similar to that of the first-stage problem is applied to the distribution network, known as the second-stage problem. Additionally, the proposed design considers different uncertainties caused by prediction errors of various parameters of EVs, generation of RESs, energy price and load demand, and availability of zone agents. Hence, to model these parameters, a hybrid stochastic–robust optimization (HSRO) is proposed. The stochastic model is used to incorporate the uncertainty of zone agents’ availability while the bounded uncertainty-based robust optimization models the rest of the uncertainty parameters in the proposed method. Finally, a reliable and robust solver such as a grey wolf optimization (GWO) algorithm is applied to solve the problem and evaluate the optimal point of the method.
To further enhance the robustness of our proposed methodology, we introduce a dynamic adaptability feature that enables real-time adjustments based on fluctuating network conditions and unforeseen events. This feature leverages advanced machine learning algorithms to continuously analyze network performance data and predict potential faults or inefficiencies. By integrating this predictive capability, the system can proactively optimize energy distribution and self-healing processes, thereby minimizing downtime and ensuring a more resilient energy network. Additionally, we propose the incorporation of decentralized technology to enhance the security and transparency of data exchanges between MGOs, DSOs, and zone agents. This decentralized ledger system can prevent unauthorized access and ensure data integrity, further strengthening the reliability of the overall network management system. These enhancements not only address current challenges but also future-proof the distribution network against evolving technological and environmental demands. The integration of these cutting-edge technologies underscores the innovative nature of our approach and its potential to significantly advance the field of smart grid management.
The proposed research significantly advances the field by merging two crucial strategies—energy management and self-healing within software-defined networks (SDNs)—into a single, cohesive hybrid problem. This innovative approach enables the simultaneous assessment of both operational and self-healing indices, thus addressing the dual needs of efficient energy usage and system resilience. A key aspect of the proposal is the establishment of effective coordination among zone agents, the distribution network operator, and the microgrid (MG) operator. This coordination reduces the number of operators required in the multi-agent system (MAS) method, consequently enhancing the execution speed and efficiency of network operations. Furthermore, the research introduces a two-stage management method within SDNs that encompass multiple MGs. This method significantly simplifies the decision-making process for network operators and increases the response speed of the optimal design, thereby addressing the complexity and dynamism of modern energy networks. To ensure robustness and reliability, the proposed design incorporates hybrid stochastic–robust modeling of all uncertainty parameters, including consumption load, energy price, output power of renewable energy sources (RESs), electric vehicles (EVs), and the availability of zone agents. This comprehensive modeling approach guarantees a resilient and dependable solution, effectively bridging the research gap in current energy management and self-healing strategies in SDNs.
The remainder of the paper is organized as follows: Section 2 introduces and discusses the deterministic and HSRO models of the proposal. The performance of the proposal is demonstrated and validated through numerical studies in Section 3. Finally, the key highlights and findings of the research are presented in Section 4.

2. The Proposal

This section presents the mathematical model of the deterministic problem of two-stage coordination between energy management and self-healing in SDNs with multiple MGs. The problem has a two-stage management strategy, the first stage of which is related to the coordination design of energy management and self-healing for MGs, while the second stage concerns applying the proposed design to the SDN.

2.1. Coordination of Energy Management and Self-Healing in the MG (First-Stage Problem)

The objective function in the design considered for the MG is to minimize the operating cost of the MG and to decrease the performance of circuit breakers and unsupplied loads under fault conditions. This function is normalized as an objective function. Furthermore, the constraints of the proposed design include OPF equations of the MG in the presence of RESs, ESSs, EVs, and constraints governing the self-healing design based on a MAS. Consequently, the mathematical model of the suggested strategy is formulated as
M i n ω 1 t Ω S T λ t P r e f , t S + ω 2 s Ω S W s w s s w i 0 ω 3 n Ω B W n P n , t = faulttime D x n  
subject to
P n , t S + P n , t R + P n , t E S , d c h P n , t E S , c h + P n , t E V , d c h P n , t E V , c h j Ω B A n , j P n , j , t L = P n , t D             n , t
Q n , t S j Ω B A n , j Q n , j , t L = Q n , t D                                                                                                                                                                                             n , t
P n , j , t L = g n , j V n , t 2 V n , t V j , t g n , j cos δ n , t δ j , t + b n , j sin δ n , t δ j , t                         n , j , t
Q n , j , t L = b n , j V n , t 2 + V n , t V j , t b n , j cos δ n , t δ j , t g n , j sin δ n , t δ j , t                 n , j , t
V n , t = V r e f                                                                                                                                                                                                                                     n = r e f , t
δ n , t = 0                                                                                                                                                                                                                                               n = r e f , t
P n , j , t L 2 + Q n , j , t L 2 S ¯ n , j L                                                                                                                                                                                         n , j , t
P n , t S 2 + Q n , t S 2 S ¯ n S                                                                                                                                                                                   n = r e f , t
V _ V n , t V ¯                                                                                                                                                                                                                                                       n , t
E n , t + 1 E S = E n , t E S + η c h P n , t E S , c h 1 η d c h P n , t E S , d c h                                                                                                                           n , t < 24
E n , t E S = E _ n                                                                                                                                                                                                                                                   n , t = 1
E _ n E n , t E S E ¯ n                                                                                                                                                                                                                                             n , t
0 P n , t E S , c h C R n E S e s n , t                                                                                                                                                                                                               n , t
0 P n , t E S , d c h D R n E S 1 e s n , t                                                                                                                                                                                   n , t
E n , t + 1 E V = E n , t E V + η c h P n , t E V , c h 1 η d c h P n , t E V , d c h                                                                                                                         n , t < 24
E n , t E V = E n , t a r r                                                                                                                                                                                     n , t = Arrivaltime
E n , t E V = E n , t d e p                                                                                                                                                                                     n , t = Departuretime
0 P n , t E V , c h C R n , t E V e v n , t                                                                                                                                                                                                         n , t
0 P n , t E V , d c h D R n , t E V 1 e v n , t                                                                                                                                                                           n , t
MAS constraints based on expert system rules comprised of zone agents
Equation (1) states the objective function of the proposed design for an MG, which is equal to the minimization of operating cost of the MG and the minimization of the performance of circuit breakers and unsupplied load under fault conditions. In this section, the mentioned objective function is presented as a normalized objective function, by using coefficients ω1, ω2, and ω3. The problem is first solved separately for each of the functions given in (1). In other words, three problems will be solved such that the first term of (1) is considered as the objective function in only one of the functions. Consequently, the second and third terms of (1) are assumed as the objective functions in the second and third problems, respectively. Then, the minimum and maximum values of each term in (1) are obtained according to their values in the previous three problems. Now, the coefficients ω1, ω2, and ω3 are calculated in such a way that the variation ranges of ω 1 t Ω S T λ t P r e f , t S , ω 2 s Ω S W s w s s w i 0 , and ω 3 n Ω B W n P n , t = faulttime D x n are the same [12]. It should be noted that s w s s w i 0 = 1 if there is a change in the state (i.e., from 0 to 1 or from 1 to 0); otherwise, it is zero.
Constraints (2) to (7) present ac power flow equations in an MG, in which constraints (2) and (3) show the active and reactive power balance in the buses of the MG; (4) and (5) provide the calculation of active and reactive powers flowing on the distribution lines, and constraints (6) and (7) express the voltage amplitude and phase angle of the reference bus. It is also assumed that there is one reference bus in this method, which is connected to the upstream network and/or the SDN via the distribution substation. Moreover, the rest of the buses are addressed as the load bus or in short PQ buses. Hence, the variables P S and Q S have values only for the reference bus while their values are zero for other buses. Further, the technical constraints of the MG, such as limits of distribution lines capacity, the capacity of distribution substation, and voltage amplitude of buses are formulated in (8) to (10), respectively [13].
Constraints (11) to (15) are the equations governing the ESS, such that constraint (11) represents the energy stored in the ESS for hours 2 to 24; constraint (12) shows the initial energy of the ESS, and constraint (13) gives the limitation on the energy stored in the ESS. Furthermore, constraints (14) and (15) express the charging and discharging limits of the ESS [26]. The constraints related to the parking lot of EVs are presented in (16) to (20). Constraint (16) denotes the energy stored in EVs parked at the parking lot at hour t. The energy at the arrival and departure times of the EVs are given in (17) and (18), respectively [14]. It should be noted that Earr and Edep are equal to i = 1 N A t s o c i b c i and i = 1 N D t b c i , where soc and bc indicate the state of charge (SoC) and battery capacity of an EV. Moreover, NDt and NAt show the total number of EVs at their arrival and departure times. Finally, the limitations of the charging and discharging rates of EVs in the parking lot are presented in (19) and (20), where CREV and DREV are equal to the sum of the charging and discharging rates of EVs at time t, respectively [27].
Equation (21) considers the self-healing of the MG and acts under the MAS process, as shown in Figure 1. In this strategy, it is assumed that each bus is located between two circuit breakers, and the area between these two circuit breakers is known as the zone agent (ZA). Furthermore, three applications are defined for the ZA in this paper:
  • FZA: considered as the decision-making agent and is proportional to the fault location.
  • DZA: this ZA is related to zones that have lost their load due to the occurrence of a fault in the FZA.
  • ZTA: which is defined for a healthy zone with a tie switch.
Considering the proposed self-healing process shown in Figure 1, the design begins with detecting a fault in a zone and tripping the circuit breaker. Then, the status of each of the ZAs is determined based on the fault location and finally, each ZA performs its tasks based on their predefined rules and proportional to the minimization of the second and third terms of Equation (1). According to Figure 1, DZA has a unidirectional communication with the MGO, while the FZA and ZTA benefit a bidirectional communication with the MGO. Once the status of ZAs is known, the FZA turns off its circuit breakers to quickly clear the fault and inform the MGO about its status. In addition, the DZAs inform the MGO about their position and load loss in this situation. Then, the ZTA closes circuit breakers B and C to supply the load of the DZAs according to the constraints of the MG (i.e., meeting the radial structure (22)) and the healthy feeder (i.e., the capacity of current flowing on the healthy feeder and voltage constraint on healthy and faulty feeders as given in (23) to (25)). The MGO gives the ZTA the command to close the circuit breakers. In constraints (24) and (25), currents equivalent to the voltage constraint of the healthy and faulty feeders, i.e., Ivh and Ivf, are calculated from
N l i n e = N b u s 1
I j I max j
I v h = V h V m i n Z h
I v f = V t V m i n Z f
where Vh and Vt represent the voltage amplitude of buses h and t in Figure 1; Zh shows the impedance of the path between the distribution substation and bus h; Zf is equal to |Zst + 0.5 × Zt|, in which Zst is the impedance of the path between the distribution substation and bus t, and Zt is the impedance of the restored section or tie-line, as illustrated in Figure 1. The self-healing method is implemented in Algorithm 1.
Algorithm 1: MAS-based restoration method
  • Identify the fault position according to the operation of the circuit breaker.
2.
Send the fault location by FZA to the MGO.
3.
Send the lost load of DZAs by DZAs to the MGO.
4.
Send the data of Vh and Zh and free capacity of each distribution line in the healthy feeder (Ikavg) by ZTAs to the MGO, where the free capacity is calculated as IkmaxIk, in which Ikmax and Ik indicate the maximum allowed current flow on the distribution line k and the current flowing on the distribution line k, respectively.
5.
Calculate current Ivh at ZTA based on (24).
6.
Calculate available minimum capacity, Ich, related to the healthy feeder connected to ZTA, which is calculated as min (Ikavg) (this is carried out at ZTA).
7.
Calculate the power that can be fed by the healthy feeder connected to the ZTA, APh, which is equal to V × min I v h , I c h and V is equal to 1 pu (this is carried out at ZTA).
8.
Send Vt and APh by ZTA to the MGO.
9.
Send Vt, APh, Zst, and Zt by the MGO to FZA.
10.
Calculate current Ivf at FZA based on (25).
11.
Calculate each healthy tie allowed power without violating of voltage limit in restored zones (APf) as, where voltage magnitude of |V| is consider to 1 per-unit (pu)
12.
Send APf to MGO by FZA
13.
Calculate maximum allowed power that can be restored from healthy tie x without violating of voltage limit in healthy and restored zones, APx, as
A P T i = min A P h i , A P f i (26)
14.
Check the group restoration condition:
if 
max i n T A P T i j = 1 n z S j (nT and nz referring to number of tie and down zones, and S is load demand) then Send accept proposal massage to a ZTA that included allowed power of APT by FZA, and connect this ZTA to network
end 
 
15.
If the group restoration condition is impossible, multi ZTA will connect to MG based on limits (22)–(25).

2.2. Coordination of Energy Management and Self-Healing in SDN (Second Stage Problem)

The coordination of energy management and self-healing process for the SDN is the same as the problem (1) to (10) and (21), except that active and reactive power balance equations of distribution network buses are given by
P n , t S T P n Ω M G , t S j Ω B A n , j P n , j , t L = P n , t D                                                               n , t
Q n , t S T Q n Ω M G , t S j Ω B A n , j Q n , j , t L = Q n , t D                                                           n , t
In other words, the active and reactive power of each MG’s distribution substation is substituted in these equations. Further, PST and QST in the above equations are equal to the active and reactive powers sent from the sub-transmission substation to the SDN connected to the reference bus of the SDN. Therefore, these variables are zero at other buses of the SDN. Moreover, all variables and parameters in this section will correspond to the data of the SDN. Term PST in (1) is replaced by PS in this problem. Additionally, variables PS and QS in constraint (9) are substituted by PST and QST. For constraint (21), the term MGO is changed to the term DSO.

2.3. Proposed Hybrid Stochastic–Robust Optimization

In the proposed design, parameters including energy price, λ, consumption active and reactive loads, PD and QD, the output power of RESs, PR, charging and discharging rates of all EVs, D R E V and C R E V , energy at the turn on/off times of all EVs, Earr and Edep, and accessibility of ZA are uncertain. Thus, a stochastic, robust, or a combination of stochastic and robust methods should be used to model the abovementioned parameters. There are 9 uncertain parameters in this problem; as a result, it is necessary to have a high number of scenarios and identify the probability function of some of the uncertain parameters in order to achieve a reliable solution in the stochastic model. Since the accurate identification of the probability function, especially in solving the proposed problem for a high number of scenarios, is a time-consuming process, the stochastic method is not suitable option [14]. However, the robust model demands a scenario that is the worst-case scenario (WCS) in terms of the objective function of the problem among all generated scenarios in the stochastic model. Moreover, the values of uncertain parameters in this scenario and values of the main variables in the problem can be calculated corresponding to the WCS in an integrated optimization problem, known as the robust optimization [13]. Therefore, the robust model will have a short execution time than that of the stochastic model. To achieve accurate results for the proposed problem, however, this paper uses a hybrid stochastic–robust optimization model where several uncertain parameters are considered for the accessibility of ZAs based on the stochastic model, aiming to reach suitable results in the self-healing problem. This uncertain parameter behaves based on the Bernoulli distribution function and the forced outage rate parameter is required for ZAs to model this parameter [28]. In this paper, Monte Carlo Simulation is used for the mentioned parameter to produce a specific number of scenarios. If a DZA is inaccessible, the data are not given to the MGO and/or DSO and, thus, the load of this DZA is considered as lost load. If a ZTA is inaccessible, its corresponding tie-line cannot communicate with the MGO and/or DSO and it will always be disconnected in the circuit. Further, if a FZA is inaccessible, the first DZA at its downstream or the ZA at its upstream will report the fault to the MGO and/or DSO.
In the following, bounded uncertainty-based robust optimization is used to model other uncertain parameters and reduce the execution time of the problem [29]. In this method, the correct value of an uncertain parameter (u) is between 1 σ u ¯ and 1 + σ u ¯ , where u ¯ is the normal value or predicted value of u, and σ refers to the uncertainty level or the maximum prediction error value. In the bounded uncertainty-based robust optimization method, the correct value of u according to the objective function (min or max) is the indication of its coefficient in the objective function or the constraints and its place in the problem is equal to its upper or lower limit. If there is an uncertain parameter in the objective function with the term min and its coefficient is positive/negative, it is in its upper/lower limit in the WCS. Furthermore, if u is on the right side of the inequality constraint with the term ≤/= with a minimization objective function, it is in its upper/lower limit in the WCS [29]. The hybrid stochastic–robust optimization model for the proposed problem in the first stage is then described by
min ω 1 t Ω S T 1 + σ λ t P r e f , t S + ω 2 w S π w s Ω S W s w s s w i 0 ω 3 w S π w n Ω B W n 1 + σ P n , t = faulttime D x n
subject to
P n , t S + 1 σ P n , t R + P n , t E S , d c h P n , t E S , c h + P n , t E V , d c h P n , t E V , c h j Ω B A n , j P n , j , t L = 1 + σ P n , t D                                                     n , t
Q n , t S j Ω B A n , j Q n , j , t L = 1 + σ Q n , t D                                     n , t
E n , t E V = 1 + σ E n , t a r r                                                                                                 n , t = Arrival time
E n , t E V = 1 + σ E n , t d e p                                                                                                 n , t = Departure time
0 P n , t E V , c h 1 σ C R n , t E V e v n , t                                                   n , t
0 P n , t E V , d c h 1 σ D R n , t E V 1 e v n , t                     n , t
MAS constraints based on expert system rules consisting of zone agents for scenario w
Constraints (4) to (16)
In addition, the hybrid stochastic–robust optimization model for the second-stage problem is given by
min ω 1 t Ω S T 1 + σ λ t P r e f , t S T + ω 2 w S π w s Ω S W s w s s w i 0 ω 3 w S π w n Ω B W n P n , t = faulttime D x n
subject to
P n , t S T P n Ω M G , t S j Ω B A n , j P n , j , t L = 1 + σ P n , t D                                                   n , t
Q n , t S T Q n Ω M G , t S j Ω B A n , j Q n , j , t L = 1 + σ Q n , t D                                                 n , t
MAS constraints based on expert system rules consisting of zone agents for scenario w
Constraints (4) to (10) by substituting PS and QS with PST and QST
It should be noted that variables of the energy management problem, i.e., the first term of the objective function (1) and constraints (2) to (20), are independent of the accessibility uncertainty variable of ZAs. Therefore, index ω in problems (29)–(37) and (38)–(42) is not used in these equations and it appears in the self-healing problem, i.e., in the second and third terms of the objective function (1) and constraint (21).

3. Performance Evaluation

Consider Figure 2a, showing a 69-bus radial distribution network that consists of three MGs at buses 13, 14, and 15, as illustrated in Figure 2b–d, respectively. The distribution and peak demand data for the network and the MGs are reported in [30,31], respectively. The load consumption of all hours is also obtained from the multiplication of the peak load and the daily load coefficient curve, as demonstrated in Figure 3, following real data from Rafsanjan city, Iran [32]. The MGs have renewable solar and wind resources, whose capacity and location are illustrated in Figure 2. Additionally, the generation capacity of these sources is equal to the multiplication of their capacities and the daily power percentage curve, which is shown for various renewable sources based on data from the studied city (Figure 4). MGs have EV parking lots. Figure 2 illustrates the location of each parking lot and the number of EVs in these lots. It is assumed that EVs perform charging and discharging operations based on smart charging. However, they do not start charging as soon as they are connected to the network and carry out the charging/discharging according to the network conditions [13]. According to [13], the daily curve of the EV penetration rate will be proportional to the smart charge given in Figure 4. Hence, the number of EVs at any given moment for a parking lot is equal to the penetration rate of the EVs at that moment multiplied by the parking capacity (the total number of EVs that can be connected to the parking lot). Further, ref. [13] reports the specifications of any EV such as battery capacity, charging mode, all electric range, and others.
Ultimately, the location and capacity of each battery energy storage system in each MG is according to Figure 2, and the storage system’s other features, such as charge and discharge rates, minimum energy storage, efficiency, and more, have been presented in [31]. Energy prices are assumed as 16 $/MW for the period from 00:00 to 8:00, 24 $/MW for the period from 8:00 to 17:00, 30 $/MW for the period from 17:00 to 22:00, and 20 $/MW for the period from 22:00 to 24:00 [12]. It is also assumed that the permissible range for the bus voltage is 0.9 to 1.05 pu. Further, two circuit breakers are assumed around each bus. The circuit breakers on the right- and left-hand sides of the bus n are shown with sn and sn’, respectively. Hence, each bus will be a ZA.
The proposed method is coded in MATLAB and the GWO algorithm [33] is used for solving the formulated optimization problem. In this algorithm, the number of population and the maximum number of convergence iterations were set to 50 and 200, respectively. The feedback–feed forward method [34] is employed to calculate the variables of power flow constraints given in (2) to (7). In the end, a Monte Carlo Simulation is used to produce 30 scenarios for the uncertainty of the parameter of the inaccessibility of the ZAs.

3.1. Two-Stage Energy Management in an SDN with Multiple MGs

This section evaluates the optimal operation of power sources and active loads in the MG and discusses the effects of its performance on the SDN. Figure 5 demonstrates the daily power curve of renewables, EVs, and batteries for MGs 1 to 3 at different uncertainty levels. As shown in Figure 5a, renewable sources in the MGs generally inject higher power from 8:00 to 17:00, compared to other simulation hours. Based on Figure 3, the output power of photovoltaic sources is added to the power of wind sources at these hours, resulting in injecting higher power into the MGs by RESs at these times. It is observed that an increase in the uncertainty level in the WCS has reduced the capability of power generation by RESs compared to the deterministic model (σ = 0). The reason is that the power generation by RESs at local points reduces the cost of energy received from the upstream network. To evaluate the robust optimal point for the proposed problem, as in problems (29) to (37), the power generation capability of RES at the WCS should be reduced.
Figure 5b displays the time diagram of the power of EVs in different MGs. It is observed that EVs perform charging and discharging operations twice and once a day, respectively, according to the proposed energy management method. The first charging operation is performed in the low-cost hours when the energy price is low, i.e., from 00:00 to 8:00, which has a high energy level and is proportional to the energy consumption of EVs during their journey. EVs are recharged again at hours from 12:00 and 17:00 and then discharged between 17:00 and 22:00. According to Figure 5b, the energy level charged at 12:00 to 17:00 is approximately close to the discharged energy level of the EVs from 17:00 to 22:00. Therefore, it can be concluded that the proposed energy management method has caused the EVs to purchase energy from the network at hours with average energy prices and inject it into the network at peak hours at higher prices. This procedure can make financial profits for EVs and reduce their net cost of charging. Further, an increase in the uncertainty level increases the power demand of EVs from 00:00 to 8:00 in the WCS. Nonetheless, it has a lower charging capacity at 12:00 and 17:00 and, consequently, lower discharging capacity at 17:00 to 22:00 relative to the deterministic model because, in the WCS, the energy cost is higher than that of the deterministic model. Figure 5b provides the performance of EVs.
Figure 5c depicts the daily ESS power curve and shows that they charge from the network during hours with a low energy price, i.e., from 00:00 to 8:00, and then discharge the stored energy into the network at peak load hours when the energy price is high, i.e., from 17:00 to 22:00, aiming to minimize energy costs. As shown in Figure 5c, since the energy level charged or discharged for the deterministic model is approximately equal to EmaxEmin, increasing the uncertainty level does not alter the battery power because the batteries are designed to minimize the energy cost, according to the proposed model. Thus, to reduce the energy cost, batteries should increase charging and discharging levels. However, since the capacity of the battery is fully utilized in the deterministic model, it fails to change its charging and discharging power in the robust model, compared to the deterministic model.
Figure 6 illustrates the daily active and reactive power of MGs at different uncertainty levels with respect to the performance of active load sources given in Figure 5. As shown in Figure 6a, the daily changes in the active power of MGs are low, particularly as the first and second MGs are seen lower than the third MG in this case. It should be noted that the low changes in the active power of a network during different hours show higher flexibility of that network. Therefore, it can be said that the performance of different sources and active loads in proportion to the proposed energy management method has led to achieving optimal flexibility to MGs. Furthermore, as the uncertainty level increases, the daily active power curve of MGs moves upward because, according to Figure 5, it increases the energy demand of EVs and decreases power generation capacity of RESs in this case, with respect to the deterministic model. Compared to the deterministic model, more power is received from the upstream network in this case. Figure 6b depicts the daily reactive power curve of MGs, where the variation trend is similar to that of the daily load coefficient curve given in Figure 3 because sources and active loads available in the MGs are mostly used for energy control purposes. Moreover, an increase in the uncertainty level causes the daily reactive power curve of MGs to move upward. This is because higher uncertainty levels, typically due to fluctuations in renewable energy generation and varying load demands, lead to greater deviations from the expected power flow. These deviations result in increased consumption of reactive power to maintain voltage stability and support the power system. Specifically, in the WCS, higher uncertainty increases the need for reactive power compensation to manage voltage variations and power quality issues compared to the deterministic model, where such fluctuations are minimal.
Table 1 presents the capabilities of the proposed two-stage energy management method and shows that implementing the proposal decreases their energy cost and energy losses in the deterministic model (σ = 0). The reduction of energy cost for MGs 1 to 3 are, respectively, 91.8, 94.8, and 130.5%, while the reduction for distribution network is 17.9%. Further, the reduction of energy loss in the model with uncertainty is 27.5, 39, 22.6, and 25.6%, respectively, compared to the results for these networks in the deterministic model. The proposed method is compared to a conventional energy management model used in traditional distribution networks. This conventional model relies on a centralized approach without advanced optimization techniques and lacks the integration of real-time data and smart grid functionalities. It represents an old-styled distribution network that does not utilize the advanced capabilities of smart grids, such as demand response, distributed generation coordination, and real-time monitoring and control. As such, the study demonstrates that the proposal has successfully reduced the energy cost and energy losses to a high extent by optimal utilization of different sources and active loads. Additionally, setting a permissible overvoltage (less than 0.05 pu) in some buses of the MGs and the distribution network allows reducing the maximum voltage drop, because of feeding the local consumers through RESs and various active loads such as EVs and batteries. Based on Table 1, increasing the uncertainty level in the WCS has increased the energy cost, energy loss, and maximum voltage drop compared to those in the deterministic model, due to the increased energy demand of EVs, increased energy prices, and reduced generation capacity of RESs in proportion to the problem model given in (29) to (37) and results of Figure 5.

3.2. Self-Healing Strategy in the SDN with Multiple MGs

This section presents the results of the proposed self-healing method under Table 2. According to Table 2, in the deterministic model, the proposed MAS-based self-healing method can feed the total loads of DZAs in all networks in the proposed zones in the case of a fault, except when the fault occurs in Bus-60. If a fault occurs at this bus, the type of buses of 61 to 65 will be DZA. As shown in Figure 3, only the tie-line between buses 65 and 27 can connect these DZAs to the network. However, since the voltage at Bus-27 is close to 0.9 pu, which is on the lower limit of the permissible range, it is not sufficient to support the heavy loads at buses 61 to 63. As a result, these heavily loaded buses cannot be adequately supplied. In this study, DZAs were able to connect to the feeder of other SDNs via only one tie-line, in proportion to any fault location in the SDN. Therefore, the number of switchings is generally low in the SDN for the deterministic model and equal to four. For the fault location in Bus-16, two tie-lines are required to feed all loads of DZAs in the distribution network, and the number of switchings is seven in this case.
Based on Table 2, the uncertainty level of 0.1 indicates that the best and worst self-healing situations can be determined based on the accessibility of zones. The best situation for all fault locations, given in Table 2, provides results similar to those of the deterministic model. However, their WCS for fault locations in different networks is explained as follows:
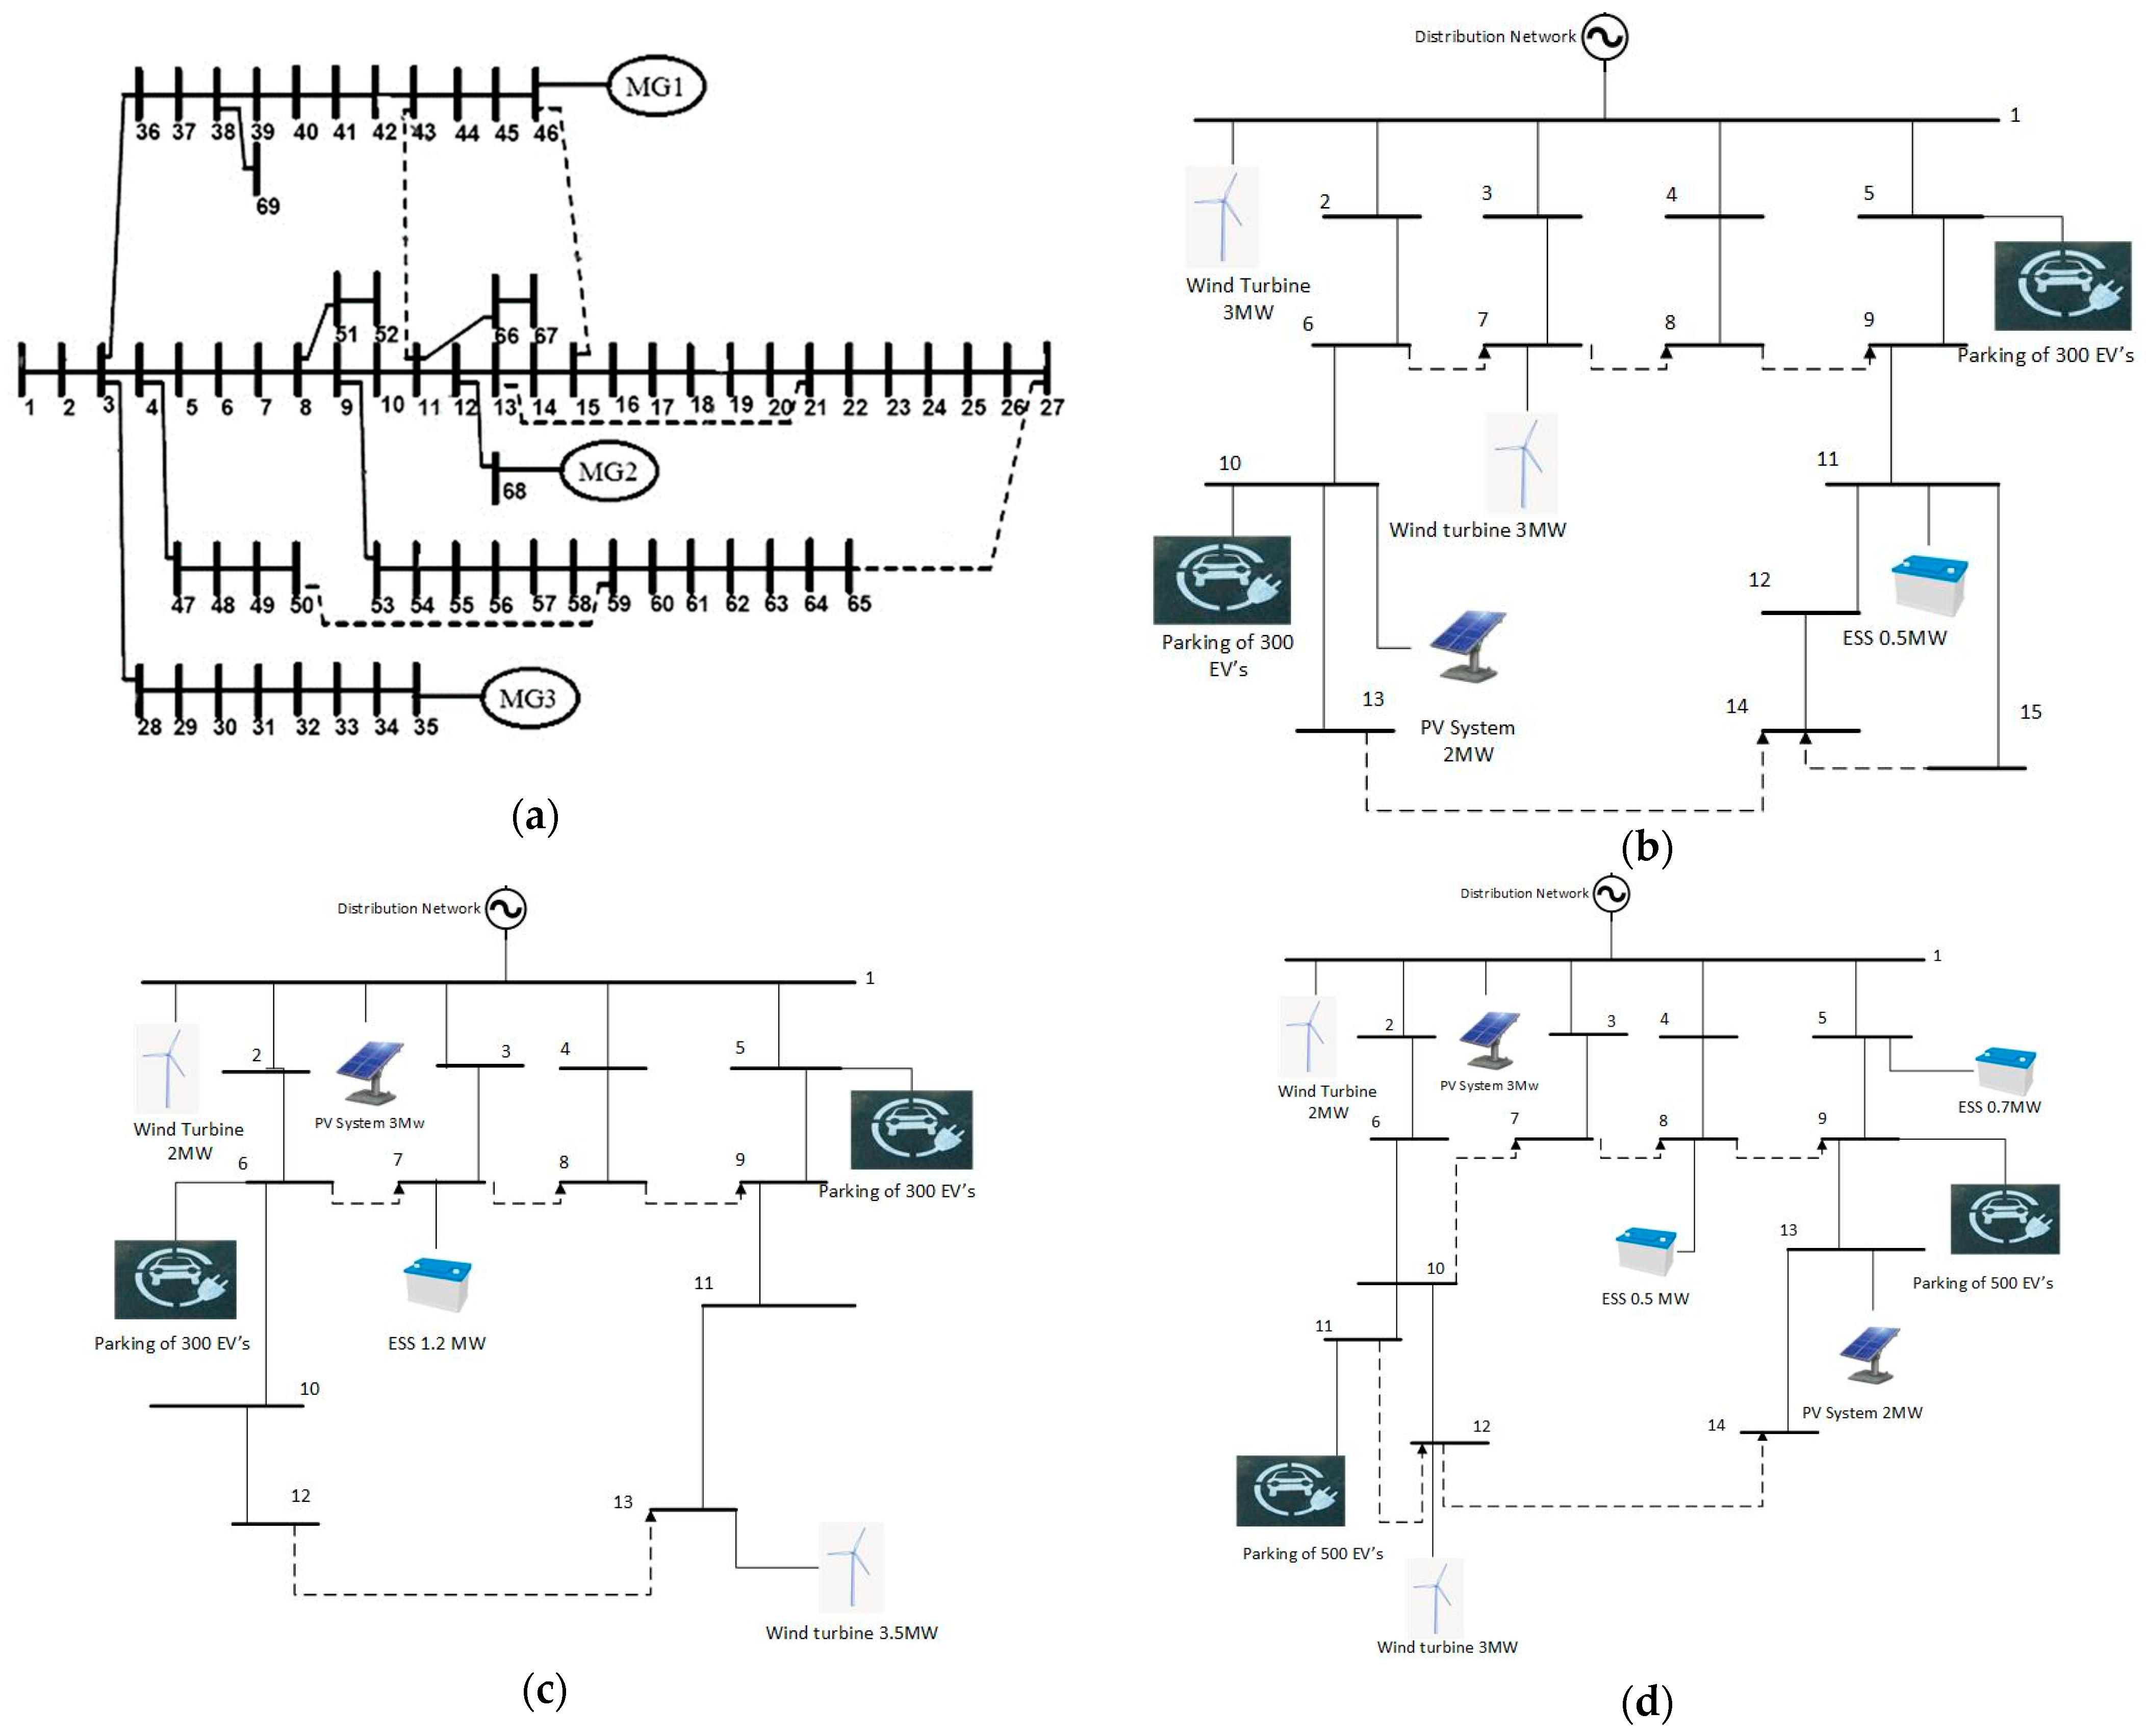
  • MG-1 and fault at Bus-4: The WCS occurs when the tie-line between buses 7 and 8 is inaccessible because the zone of Bus-7 is unavailable. In this case, the tie-line between buses 8 and 9 does not operate. Since the voltage of Bus-14 is close to 0.9 pu, part of the load of the DZAs is left unsupplied.
  • MG-1 and fault at Bus-2: In the WCS, zone-7 is inaccessible, and thus the tie-line between buses 6 and 7 is unavailable and the tie-line between buses 13 and 14 will be connected. Now, to prevent the voltage of Bus-14 from becoming less than 0.9 pu, the load with a value of 1.4534 kW is left unsupplied.
  • MG-2 and fault at Bus-6: In the WCS, zone-10 is inaccessible to inform its load to the MGP. Therefore, the real value of the load of the DZAs is not reported to the MGO.
  • MG-3 and fault at Bus-9: In the WCS, zone-7, which is a DZA, is inaccessible to report its load to the MGO. Consequently, the real value of the DZA’s load is not reported to the MGO.
  • MG-3 and fault at Bus-9: In the WCS, zone-14 is inaccessible and therefore, the tie-line between buses 12 and 14 cannot be connected. As only this tie-line can connect DZAs to Bus-14 to supply them, it is unavailable. Hence, the total load of the DZAs will be switched off.
  • Distribution network and fault at Bus-16: In the WCS, zone-65 is inaccessible, and thus the tie-line between buses 65 and 27 is not connected. Further, to prevent the voltage of Bus-17 being less than 0.9 pu, as it is fed from Bus-13 by the tie-line between buses 13 and 21, circuit breaker s21 is opened. Therefore, the load on buses 22 to 27 is unsupplied.
  • Distribution network and fault at Bus-60: In the WCS, zone-65 is inaccessible, so loads of the DZA cannot be supplied.

3.3. Capability of the Proposed Solver

To compare the performance of the utilized GWO for the proposed problem, its performance is compared with two other solvers, namely a Genetic Algorithm (GA) and Particle Swarm Optimization (PSO). Table 3 presents this comparison and shows that the GWO solver has been able to converge at a lower computational time with less iterations relative to the other two solvers, demonstrating a higher speed of solving and responding to the proposed problem. It is worth noting that the problem was repeated 10 times, and the mean and standard deviation of the objective function are presented. As presented in Table 3, this solver has successfully obtained the optimal or minimum point for the objective function (29) compared to the other two solvers. A lower standard deviation for the objective function using the GWO solver highlights that it has a more reliable response than the other two solvers in obtaining the closest-to-optimal solution.

4. Conclusions

This paper has proposed a hybrid stochastic–robust optimization method for the simultaneous coordination of energy management and self-healing in a SDN incorporating multiple MGs. Through the developed two-stage method, this paper addresses uncertainties in demand, energy prices, generation of renewable energy sources, and electric vehicle demand. Through numerical studies, it has been demonstrated that the proposed method with the energy management of different sources and active loads in the MG successfully minimizes the MG operation indices, such as energy cost, energy loss, and network voltage drop. Further, the method realizes a flexible distribution network by managing the operation of its assets. It is also verified that the proposed MAS-based self-healing method obtains a network with fast and optimized self-healing capability. Moreover, the comparison with other optimization solvers underscores the superiority of the employed grey wolf optimization in terms of convergence speed and reliability. The proposal has presented a significant contribution to the optimization of smart distribution networks, offering practical insights for enhancing the resilience and efficiency of modern energy systems amidst dynamic operational challenges and uncertainties. Further research could explore scalability and real-world implementation aspects to validate the method’s effectiveness under diverse network conditions and operational scenarios.

Author Contributions

Conceptualization, D.M.Z. and S.N.S.; methodology, D.M.Z. and S.N.S.; Formal analysis, F.S.; validation, D.M.Z. and S.N.S.; writing—original draft preparation, D.M.Z. and S.N.S.; writing—review and editing, F.S., H.W., and X.S. All authors have read and agreed to the published version of the manuscript.

Funding

This research received no external funding.

Data Availability Statement

Data is unavailable due to privacy restrictions.

Conflicts of Interest

The authors declare no conflict of interest.

Glossary

Abbreviations
BCSbest-case scenario
DGdistributed generator
DSOdistribution system operator
DZAdown zone agent
ESSenergy storage system
EVelectric vehicles
FZAfault zone agent
GAGenetic Algorithm
GWOgrey wolf optimization
HSROhybrid stochastic–robust optimization
HZAhealthy zone agent
MASmulti-agent system
MGmicrogrid
MGOmicrogrid operator
OPFoptimal power flow
PSOParticle Swarm Optimization
RESrenewable energy system
SDNsmart distribution networks
WCSworst-case scenario
ZTAzone tie agent
Indices
m, ΩMGIndex and set of MGs
n, ΩBIndex and set of buses
s, ΩSWIndex and set of switches
t, ΩSTIndex and set of simulation times
w, ΩSIndex and set of scenario samples
Variables
EES, EEVStored energy of EVs in the parking lot and ESS in per-unit (pu)
esBinary variable of ESS charging/discharging state
evBinary variable of EVs charging/discharging state
Ivh, IvfMaximum current of healthy and faulty feeder without violating the voltage limit (pu)
PES,ch, PES,dchCharging and discharging active power of ESS (pu)
PEV,ch, PEV,dchCharging and discharging active power of EVs (pu)
PL, QLActive and reactive power flow of distribution line (pu)
PS, QSActive and reactive power of MG station (pu)
PST, QSTActive and reactive power of distribution station (pu)
swBinary variable of switch status
V, δVoltage magnitude (pu), and voltage angles (rad)
xBinary variable of restoration status at each bus
Parameters:
AIncidence matrix of bus- line based on the current direction
BIncidence matrix of bus- MG
CRES, DRESCharge and discharge rate of ESS (pu)
CREV, DREVCharge and discharge rate of EVs (pu)
E ¯ , E _ The maximum and minimum energy of ESS (pu),
Earr, EdepInitial and final energy of EVs (pu)
g, bConductance and susceptance of a line (pu)
PD, QDActive and reactive load (pu)
PRActive power of RES (pu)
S ¯ L Maximum capacity of distribution line (pu)
S ¯ S Maximum capacity of distribution station (pu)
V ¯ , V _ Maximum and minimum of voltage magnitude (pu),
VrefVoltage of slack bus (pu)
WWeight to the priority of load
πProbability of scenario
λEnergy price ($/MWh)
ω1, ω2, ω3Weight factors of objective function parts
ηch, ηdchEfficiency of EV or ESS charger

References

  1. Meng, K.; Dong, Z.Y.; Xu, Z.; Zheng, Y.; Hill, D.J. Coordinated Dispatch of Virtual Energy Storage Systems in Smart Distribution Networks for Loading Management. IEEE Trans. Syst. Man Cybern. Syst. 2019, 49, 776–786. [Google Scholar] [CrossRef]
  2. Bui, V.H.; Hussain, A.; Kim, H.M. A Multiagent-Based Hierarchical Energy Management Strategy for Multi-Microgrids Considering Adjustable Power and Demand Response. IEEE Trans. Smart Grid 2018, 9, 1323–1333. [Google Scholar] [CrossRef]
  3. Aguero, J.R.; Khodaei, A.; Masiello, R. The utility and grid of the future: Challenges, needs, and trends. IEEE Power Energy Mag. 2016, 14, 29–37. [Google Scholar] [CrossRef]
  4. Aguero, J.R.; Khodaei, A. Industry trends and utility of the future roadmaps. Electr. J. Spec. Issue Energy Ind. Future 2015, 28, 7–17. [Google Scholar]
  5. Nagata, T.; Okamoto, K. A decentralized distribution power system restoration by using multi-agent Approach. In Proceedings of the International Electrical Engineering Congress (iEECON), Pattaya, Thailand, 19–21 March 2014; pp. 1–4. [Google Scholar]
  6. Felix, A.; Nunna, H.K.; Doolla, S.; Shukla, A. Multi agent-based restoration for smart distribution system with microgrids. In Proceedings of the IEEE Energy Conversion Congress and Exposition (ECCE), Montreal, QC, Canada, 20–24 September 2015; pp. 2341–2347. [Google Scholar]
  7. Azizivahed, A.; Naderi, E.; Narimani, H.; Fathi, M.; Narimani, M.R. A New Bi-Objective Approach to Energy Management in Distribution Networks with Energy Storage Systems. IEEE Trans. Sustain. Energy 2018, 9, 56–64. [Google Scholar] [CrossRef]
  8. Hooshmand, E.; Rabiee, A. Robust model for optimal allocation of renewable energy sources, energy storage systems and demand response in distribution systems via information gap decision theory. IET Gener. Transm. Distrib. 2019, 13, 511–520. [Google Scholar] [CrossRef]
  9. Kikusato, H.; Mori, K.; Yoshizawa, S.; Fujimoto, Y.; Asano, H.; Hayashi, Y.; Kawashima, A.; Inagaki, S.; Suzuki, T. Electric Vehicle Charge–Discharge Management for Utilization of Photovoltaic by Coordination Between Home and Grid Energy Management Systems. IEEE Trans. Smart Grid 2019, 10, 3186–3197. [Google Scholar] [CrossRef]
  10. Patnam, B.S.K.; Pindoriya, N.M. Centralized Stochastic Energy Management Framework of an Aggregator in Active Distribution Network. IEEE Trans. Ind. Inform. 2019, 15, 1350–1360. [Google Scholar] [CrossRef]
  11. Mohammad Zaheri, D.; Khederzadeh, M. Two-stage coupling of coordinated energy management and self-healing strategies in a smart distribution network considering coupling neighbouring microgrids according to autonomous decentralized restoration technique. Int. Trans. Electr. Energy Syst. 2020, 30, e12596. [Google Scholar] [CrossRef]
  12. Akbari-Dibavar, A.; Mohammadi-Ivatloo, B.; Zare, K.; Anvari-Moghaddam, A. Optimal scheduling of a self-healing building using hybrid stochastic-robust optimization approach. IEEE Trans. Ind. Appl. 2022, 58, 3217–3226. [Google Scholar] [CrossRef]
  13. Boglou, V.; Karavas, C.-S.; Karlis, A.; Arvanitis, K.G.; Palaiologou, I. An Optimal Distributed RES Sizing Strategy in Hybrid Low Voltage Networks Focused on EVs’ Integration. IEEE Access 2023, 11, 16250–16270. [Google Scholar] [CrossRef]
  14. Khederzadeh, M. A Decentralized Technique for Autonomous Distribution Network Restoration in Presence of Coupling Neighboring Microgrids. J. Iran. Assoc. Electr. Electron. Eng. 2022, 19, 213–225. [Google Scholar] [CrossRef]
  15. Arefifar, S.A.; Ordonez, M.; Mohamed, Y.A.R.I. Energy Management in Multi-Microgrid Systems-Development and Assessment. IEEE Trans. Power Syst. 2017, 32, 910–922. [Google Scholar]
  16. Zou, H.; Mao, S.; Wang, Y.; Zhang, F.; Chen, X.; Cheng, L. A Survey of Energy Management in Interconnected Multi-Microgrids. IEEE Access 2019, 7, 72158–72169. [Google Scholar] [CrossRef]
  17. Azarhooshang, A.; Sedighizadeh, D.; Sedighizadeh, M. Two-stage stochastic operation considering day-ahead and real-time scheduling of microgrids with high renewable energy sources and electric vehicles based on multi-layer energy management system. Electr. Power Syst. Res. 2021, 201, 107527. [Google Scholar] [CrossRef]
  18. Shahnia, F. Operation of the System of Coupled Low-Voltage Feeders during Short-Circuit Faults. Energies 2023, 16, 6009. [Google Scholar] [CrossRef]
  19. Karavas, C.-S.; Arvanitis, K.; Papadakis, G. A Game Theory Approach to Multi-Agent Decentralized Energy Management of Autonomous Polygeneration Microgrids. Energies 2017, 10, 1756. [Google Scholar] [CrossRef]
  20. Eriksson, M.; Armendariz, M.; Vasilenko, O.O.; Saleem, A.; Nordstrom, L. Multiagent-based distribution automation solution for self-healing grids. IEEE Trans. Ind. Electron. 2015, 62, 2620–2628. [Google Scholar] [CrossRef]
  21. Shirazi, E.; Jadid, S. Autonomous self-healing in smart distribution grids using multi agent system. IEEE Trans. Ind. Inform. 2018, 15, 6291–6301. [Google Scholar] [CrossRef]
  22. Sun, W.; Ma, S.; Alvarez-Fernandez, I.; Roofegari nejad, R.; Golshani, A. Optimal self-healing strategy for microgrid islanding. IET Smart Grid 2018, 1, 143–150. [Google Scholar] [CrossRef]
  23. Hafez, A.A.; Omran, W.A.; Hegazy, Y.G. A Decentralized Technique for Autonomous Service Restoration in Active Radial Distribution Networks. IEEE Trans. Smart Grid 2018, 9, 1911–1919. [Google Scholar] [CrossRef]
  24. Ghorbani, M.J.; Choudhry, M.A.; Feliachi, A. A multiagent design for power distribution systems automation. IEEE Trans. Smart Grid 2016, 7, 329–339. [Google Scholar] [CrossRef]
  25. Sharma, A.; Srinivasan, D.; Trivedi, A. A decentralized multi-agent approach for service restoration in uncertain environment. IEEE Trans. Smart Grid 2018, 9, 3393–3405. [Google Scholar] [CrossRef]
  26. Fortenbacher, P.; Ulbig, A.; Andersson, G. Optimal Placement and Sizing of Distributed Battery Storage in Low Voltage Grids using Receding Horizon Control Strategies. IEEE Trans. Power Syst. 2017, 33, 2383–2394. [Google Scholar] [CrossRef]
  27. Shoeb, M.A.; Shahnia, F.; Shafiullah, G.; Wen, F. A Technique to Optimally Prevent the Voltage and Frequency Violation in Renewable Energy Integrated Microgrids. Energies 2023, 16, 5774. [Google Scholar] [CrossRef]
  28. Aghaei, J.; Amjady, N.; Baharvandi, A.; Akbari, M.A. Generation and transmission expansion planning: MILP–based probabilistic model. IEEE Trans. Power Syst. 2014, 29, 1592–1601. [Google Scholar] [CrossRef]
  29. Bozorgavari, S.A.; Aghaei, J.; Pirouzi, S.; Vahidinasab, V.; Farahmand, H.; Korpås, M. Two-Stage Hybrid Stochastic/Robust Optimal Coordination of Distributed Battery Storage Planning and Flexible Energy Management in Smart Distribution Network. J. Energy Storage 2019, 26, 100970. [Google Scholar] [CrossRef]
  30. Kavousi-Fard, A.; Niknam, T. Optimal distribution feeder reconfiguration forreliability improvement considering uncertainty. IEEE Trans. Power Deliv. 2014, 29, 1344–1354. [Google Scholar] [CrossRef]
  31. Aghdam, F.H.; Ghaemi, S.; Kalantari, N.T. Evaluation of loss minimization on the energy management of multi-microgrid based smart distribution network in the presence of emission constraints and clean productions. J. Clean. Prod. 2018, 196, 185–201. [Google Scholar] [CrossRef]
  32. Maleki, A.; Askarzadeh, A. Optimal sizing of a PV/wind/diesel system with battery storage for electrification to an off-grid remote region: A case study of Rafsanjan, Iran. Sustain. Energy Technol. Assess. 2014, 7, 147–153. [Google Scholar] [CrossRef]
  33. Mohanty, S.; Subudhi, B.; Ray, P.K. A New MPPT Design Using Grey Wolf Optimization Technique for Photovoltaic System Under Partial Shading Conditions. IEEE Trans. Sustain. Energy 2016, 7, 181–188. [Google Scholar] [CrossRef]
  34. Babu, P.R.; Rakesh, C.P.; Kumar, M.N.; Srikanth, G.; Reddy, D.P. A novel approach for solving distribution networks. In Proceedings of the 2009 Annual IEEE India Conference, Ahmedabad, India, 18–20 December 2009; Volume 3, pp. 154–196. [Google Scholar]
Figure 1. Proposed MAS-based self-healing method.
Energies 17 04281 g001
Figure 2. System under study: (a) 69-bus distribution network [30], (b) MG1, (c) MG2, and (d) MG3 [31].
Energies 17 04281 g002
Figure 3. Assumed daily curve of power consumption and renewable resources generation capacity [32].
Energies 17 04281 g003
Figure 4. Assumed daily EV penetration rate curve in accordance with smart charging strategy [13].
Energies 17 04281 g004
Figure 5. Daily active power curve of MGs’ devices, (a) RESs, (b) EVs, and (c) batteries.
Energies 17 04281 g005
Figure 6. Daily power curve of MGs, (a) active power, and (b) reactive power.
Energies 17 04281 g006
Table 1. Values of operation indices in MGs and the SDN.
NetworkUncertainty LevelEnergy Cost ($)Energy Loss (MWh)Maximum Voltage Drop (pu)Maximum Overvoltage (pu)
MG1Load flow39938.180.09380
0326.95.930.08200.0252
0.110636.50.09050.0252
MG2Load flow38076.40.07460
0197.53.90.06440.0375
0.18984.270.07110.0315
MG3Load flow26373.50.05160
0−803.52.710.03500.0242
0.1−299.42.380.03870.0173
SDNLoad flow477348.10.09190
0391735.80.06980.0492
0.1460848.20.09640.0473
Table 2. Results of the proposed self-healing during the peak load hour (20:00).
MG1
Unsupplied Loads
(MVA)
Closed SwitchesOpened
Switches
Total Load of DZAs
(MVA)
HSRO
(σ)
Fault Location
(Bus)
0Tie-line between s7, s8s4, s4′2.236104
0Tie-line between s7, s8s4, s4′2.4597BCS ➀0.14
0.5521Tie-line between s8, s9s4, s4′WCS ➁
0Tie-line between s6, s7s2, s2′2.012502
0Tie-line between s6, s7s2, s2′2.2138BCS0.12
1.4534Tie-line between s13, s14s2, s2′WCS
MG2
0Tie-line between s12, s13s6, s6′1.677106
0Tie-line between s12, s13s6, s6′1.8448BCS0.16
1.1339Tie-line between s12, s13s6, s6′WCS
0-s7′007
0-s7′00.17
MG3
0Tie-line between s7, s8s3, s3′0.670803
0Tie-line between s7, s8s3, s3′0.7379BCS0.13
0.7379-s3, s3′WCS
0Tie-line between s12, s14s9, s9′2.259709
0Tie-line between s12, s14s9, s9′2.7057BCS0.19
2.7057-s9, s9′WCS
SDN
0Tie-line between s13, s21′, and 65, 27′s16, s16′, s210.3545016
0Tie-line between s13, s21′, and 65, 27′s16, s16′, s210.3900BCS0.116
0.1521Tie-line between s13, s21′s16, s16′, s21WCS
1.4435Tie-line between s65, s27s60, s60′, s631.9191060
1.4435Tie-line between s65, s27s60, s60′, s632.1110BCS0.160
2.1110-s60, s60′WCS
➀ BCS = best-case scenario, ➁ WSC = worst-case scenario.
Table 3. The convergence of the proposed problem.
AlgorithmGWOPSOGA
Population505050
Max. No. of Iterations100010001000
Computation Time (s)322378491
Convergence Repetition593621865
Average of two-stage objective functions121.26134.71163.84
Standard Deviation (%)1.122.425.64
Disclaimer/Publisher’s Note: The statements, opinions and data contained in all publications are solely those of the individual author(s) and contributor(s) and not of MDPI and/or the editor(s). MDPI and/or the editor(s) disclaim responsibility for any injury to people or property resulting from any ideas, methods, instructions or products referred to in the content.

