
Thermodynamic Performance Investigation of a Small-Scale Solar Compression-Assisted Multi-Ejector Indoor Air Conditioning System for Hot Climate Conditions


Department of Mechanical Engineering, Khalifa University, Abu Dhabi P.O. Box 127788, United Arab Emirates
*
Author to whom correspondence should be addressed.
Energies 2021, 14(14), 4325; https://doi.org/10.3390/en14144325
Submission received: 24 May 2021
/
Revised: 2 July 2021
/
Accepted: 14 July 2021
/
Published: 18 July 2021
(This article belongs to the Special Issue Sustainable Buildings: Heating, Ventilation and Air-Conditioning)
Abstract
:In year-round hot climatic conditions, conventional air conditioning systems consume significant amounts of electricity primarily generated by conventional power plants. A compression-assisted, multi-ejector space cooling system driven by low-grade solar thermal energy is investigated in terms of energy and exergy performance, using a real gas property-based ejector model for a 36 kW-scale air conditioning application, exposed to annually high outdoor temperatures (i.e., up to 42 °C), for four working fluids (R11, R141b, R245fa, R600a). Using R245fa, the multi-ejector system effectively triples the operating condenser temperature range of a single ejector system to cover the range of annual outdoor conditions, while compression boosting reduces the generator heat input requirement and improves the overall refrigeration coefficient of performance (COP) by factors of ~3–8 at medium- to high-bound condenser temperatures, relative to simple ejector cycles. The system solar fraction varies from ~0.2 to 0.9 in summer and winter, respectively, with annual average mechanical and overall COPs of 24.5 and 0.21, respectively. Exergy destruction primarily takes place in the ejector assembly, but ejector exergy efficiency improves with compression boosting. The system could reduce annual electric cooling loads by over 40% compared with a conventional local split air conditioner, with corresponding savings in electricity expenditure and GHG emissions.
1. Introduction
Building energy consumption accounts for 20–40% of the total delivered energy consumed worldwide [1]. Hot climate regions are characterized by elevated building cooling loads, the majority of which are fulfilled using fossil energy, particularly in developing economies [2]. In, for example, the Middle East Basin, approximately 30% of yearly electricity consumption is for residential buildings, of which approximately half is for building cooling, reaching over 60% in summer [3]. Building cooling loads are expected to increase with growth in populations and prosperity in developing economies and climate change [4,5]. Electrically-powered vapor compression refrigeration equipment, which is the most widely-used space cooling system worldwide, consume significant amounts of primary energy with consequent greenhouse gas (GHG) emissions and contribute to high peak electrical loads in hot climate conditions.
Solar air conditioning is a sustainable alternative to conventional space cooling and has the advantage of correlating solar energy availability and demand time-wise in solar abundant regions. Solar ejector-based refrigeration systems, which are the focus of this study, can convert low-grade thermal energy gained using solar collectors into mechanical work to compress the working fluid of a thermodynamic refrigeration cycle, and can deliver refrigerant evaporation temperatures in the 5–10 °C range [6]. In such systems, the electricity-driven mechanical compressor used in conventional vapor compression cycles (VCCs) is replaced by a generator–ejector–pump assembly [6], which acts as a thermal compressor, thereby reducing cooling electricity consumption. The basic operating principle of an ejector is the use of a high-pressure motive fluid to induce flow from a lower pressure source (i.e., suction fluid) and eject the mixture at an intermediate pressure [7]. Ejector-based refrigeration systems offer simplicity of assembly and installation, compatibility with low-temperature renewable/excess heat (e.g., solar, geothermal, waste heat) and a range of working fluids, the absence of moving parts, low maintenance requirements, and affordability [6,8]. Their disadvantages are the complexity of detailed ejector geometric design optimization associated with a complex flow field, limited ejector operating range, and overall coefficient of performance (COP)—typically less than 0.3 [6,8]. In general, the performance of solar ejector refrigeration systems is constrained by the low-temperature heat input (i.e., 85–95 °C), and degrades at increasing condenser temperatures [9] imposed by the ambient temperature. These limitations can be addressed through ejector cycle enhancements, and/or by hybridizing or applying ejector-based refrigeration driven by a sustainable heat source in parallel with another air conditioning technology [6] for primary energy savings or cooling capacity/performance augmentation relative to ejector-based-only refrigeration. In this study, a compression-assisted multi-ejector air conditioning concept is investigated to provide supplemental cooling in yearly-elevated ambient temperature conditions and thus, reduce the electric load and associated GHG impact of a conventional VCC at an extended operational range relative to a simple ejector refrigeration system.
Complex cycles previously proposed to improve the performance of ejector refrigeration systems include cascaded, hybrid (e.g., compression-, absorption-, adsorption-based), regenerative, multi-ejector, and multi-stage ejector cycles and variable geometry ejectors [7,8,10]. Despite the variety of cycle configurations proposed, few specifically tackle the limited operating range of ejectors, and hence the ability to cope with varying off-design conditions in actual space cooling conditions. Furthermore, none of the configurations proposed have targeted specifically hot ambient conditions, nor have the annual energy and exergy performance in such conditions for actual air conditioning applications been investigated. Studies aimed at addressing ejector operational range constraints are reviewed as follows.
Sokoloz and Hershgal [11] proposed a parallel ejector assembly concept in which each effective ejector area is geometrically sized using an analytical one-dimensional (1-D) model to operate at a specific condenser pressure. Using CFC R-114 refrigerant, in moderate climate conditions, the thermal COP of a single ejector sub-cycle (i.e., the ratio of evaporator cooling output to generator heat input) was estimated to range from 0.28 to 0.52 at condensation, generation, and evaporation temperatures of 30–35 °C, 102 °C, and 4 °C, respectively [11]. However, no annual performance analysis was reported for the multi-ejector refrigeration concept. It was also envisaged to extend the system operation to a heating mode for the heating season, using a bypass connection to divert the heat collected by the generator to the evaporator for heat rejection to the surroundings. Arbel and Sokolov [12] evaluated the use of compression boosting to increase secondary ejector flow inlet pressure, which can either improve the secondary to primary ejector mass flow ratio (i.e., entrainment ratio, a measure of ejector efficiency [13]) and thermal COP, raise the ejector back (i.e., condenser) pressure, or enable operation at lower evaporator pressures. In parallel, an intercooler heat exchanger was introduced between the booster outlet and secondary ejector inlet to reduce the booster work. For a low-ozone depletion (ODP) refrigerant (i.e., R-142b, as a substitute to R-114), at 50–150 °C generation and 4 °C evaporator temperatures, thermal COPs up to three times higher than for the corresponding simple ejector cycle were reported. Mansour et al. [14] observed a 21% enhancement of the COPs of an R134a ejector refrigeration cycle using compression boosting relative to the simple cycle, at 30 °C, 10 °C, and 90 °C condenser, evaporator, and generator temperatures. Takleh and Zare [15] optimized the exergy efficiency of a booster compressor-assisted, single ejector cycle, for six low-ODP working fluids at refrigeration evaporation temperatures (i.e., −5 to +5 °C). With ejector cycle exergy efficiency expressed as the ratio of evaporator cooling exergy output to the mechanical (compression) exergy input (i.e., without including the generator thermal exergy input), exergy efficiency improvements of 5.5–11% were obtained relative to the corresponding simple (i.e., non-compression-assisted) ejector cycles. The cycle COPs and mechanical exergy efficiency were found to exhibit a mild peak within an optimum range of booster pressure ratios (i.e., ~1.4–1.6 for a 5 °C evaporation temperature depending on the working fluid), however, with less than a 3% loss in COP or exergy efficiency observed within a larger range of booster pressure ratios (i.e., 1.2–2). Compression-assisted ejector sub-cycles have also recently been reported as part of hybrid (e.g., absorption-ejector [16], thermoelectric-ejector [17]) co-generation (e.g., power and cooling) cycles, and found to improve the cooling capacity and co-generation first-law efficiency, but reduce the co-generation exergy efficiency due to reduced power output [16,17]. Variable ejector geometries (i.e., adjustable effective area ratios) have also been proposed for improved performance in variable operating conditions [7,8]. However, annual system performance evaluation for practical air conditioning applications was not the focus of the above studies [11,12,15,16,17].
Thus, the performance assessment of ejector-based refrigeration systems has generally focused on fixed boundary conditions and either parametric analysis or mathematical optimization, rather than annual or seasonal performance evaluation with time-variable conditions in practical space cooling applications. Only a few such studies have been reported [18,19] with attention to harsh climatic conditions, such as are representative of the Middle East and North Africa (MENA). Tashtoush et al. [18] performed an annual dynamic hourly energy analysis of a simple 7 kW R134a solar ejector cooling cycle for Jordanian climatic conditions, focusing on the solar collector and hot water storage system design. The evacuated tube collector solar fraction was found to range from 0.52 to 0.542, and the overall ejector cooling cycle COP from 0.52 to 0.547. Allouche et al. [19] performed a dynamic analysis of a 3.5 kW solar simple ejector air conditioning cycle with integrated phase change material storage using an ideal gas ejector model during the summer cooling period in Tunisia. The overall ejector cycle COP was found to range from 0.0094 to 0.195 at a constant evaporator temperature of 15 °C, based on which it was recommended to improve the ejector cycle time-averaged performance in variable operating conditions.
With regard to ejector modeling, the majority of solar ejector cooling studies published to date have employed 1-D analytical models with ideal gas properties, which may not reliably represent refrigerant behavior [20], and which have focused on the critical operation (i.e., condensing pressure lower than the critical condensing pressure) [21]. Ejector cycle analytical model development efforts were extended to real gas properties and sub-critical operation by Chen et al. [20], and to unconstant-pressure mixing for off-design performance and variable geometry analysis [7] by Wang et al. [22]. However, the design of variable ejector geometries and their control is considered even more challenging than for fixed ejector geometries [22], and may require more computationally expensive computational fluid dynamics methods.
In this study, to reduce the energy intensity of air conditioning in small-scale individual building applications exposed to harsh variable climatic conditions, such as in the Middle East Basin, and to address the above research gaps, a solar ejector refrigeration system was thermodynamically investigated. The system integrates a low-grade solar thermal energy collector and thermal storage system with a compression-assisted multi-ejector cycle operated with environmentally-friendly refrigerants, to adjust cooling provision to seasonal and daily fluctuating requirements. Rather than a cascaded multi-stage or hybrid refrigeration cycle to cope with large evaporator–condenser temperature lifts in hot climate conditions, the use of compression boosting, in conjunction with a limited number of ejectors, was adopted in this study to avoid prohibitive cycle complexity. The system is designed to provide supplemental cooling, in parallel with auxiliary generator heating, or a conventional refrigeration system. The refrigeration sub-system mathematical model is based on a validated analytical 1-D real gas ejector model with the ability to analyze both critical and sub-critical ejector operation modes. The system year-round energy and exergy performance, and GHG emission savings potentials, are evaluated. The solar space cooling scheme and its thermodynamic modeling are described in Section 2 and Section 3, respectively. The modeling results are presented and discussed in Section 4, with the main conclusions of this study summarized in Section 5.
2. Solar-Assisted Ejector Space Cooling System
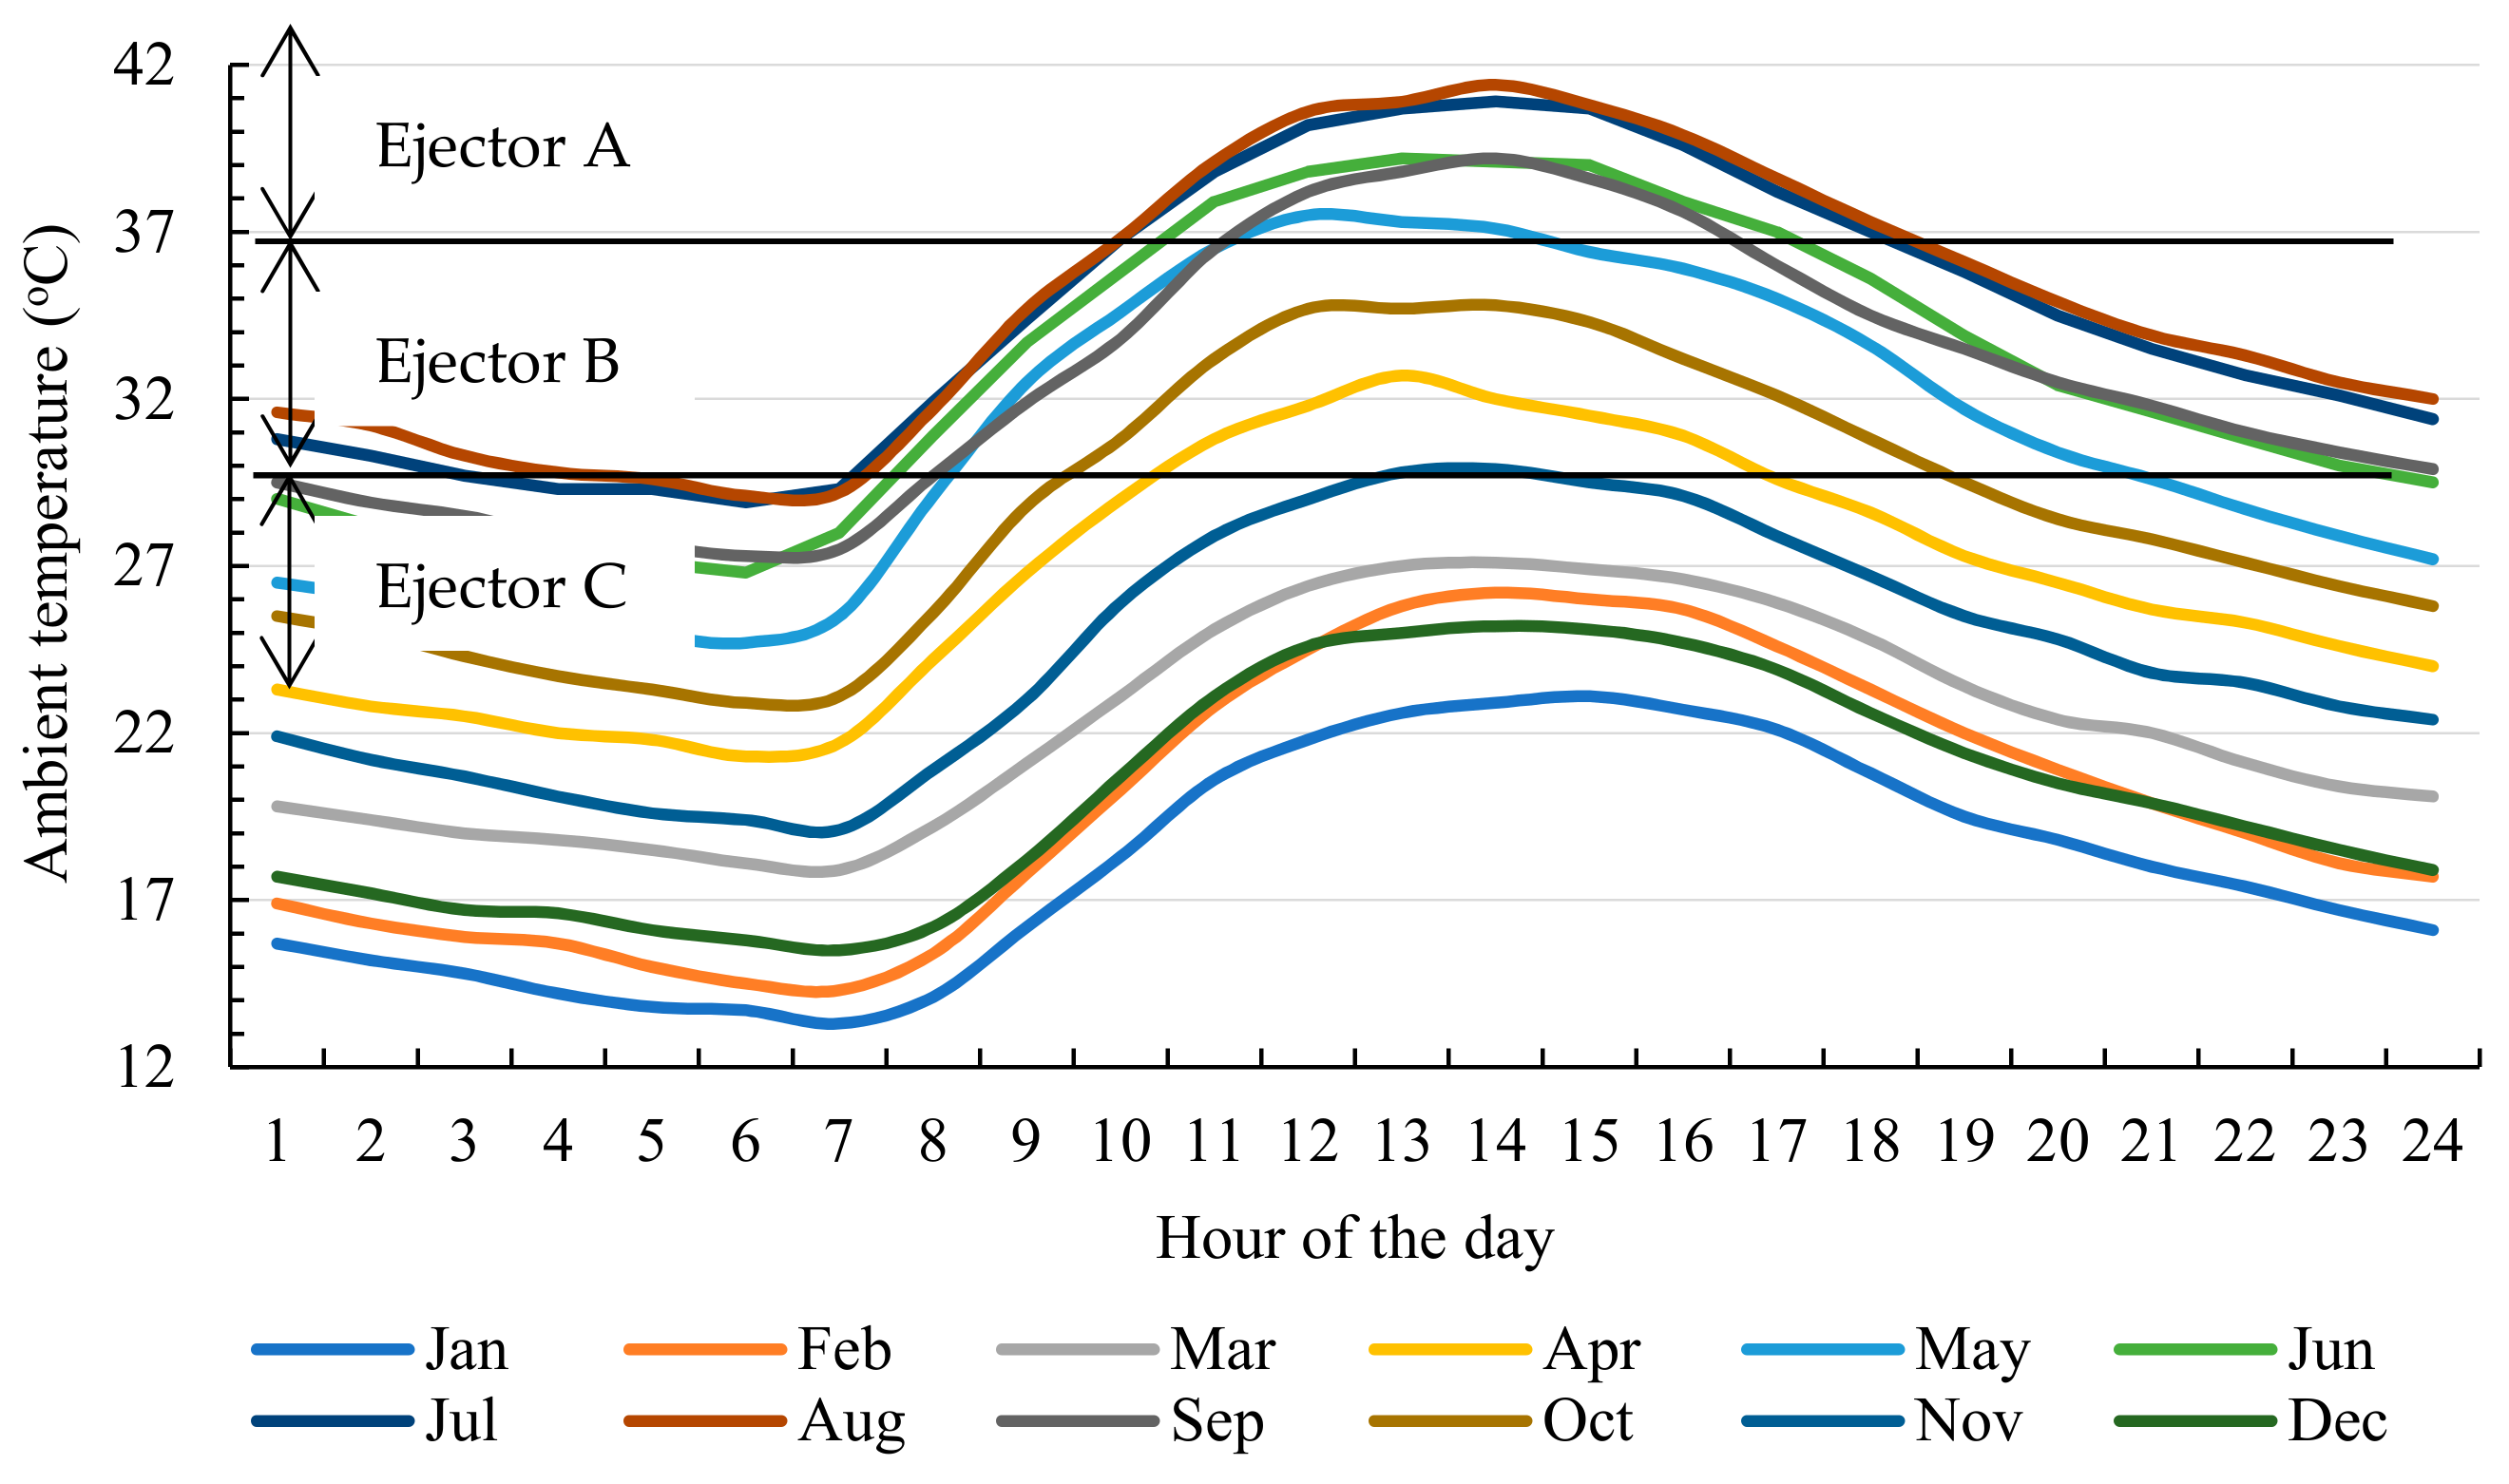
The solar ejector refrigeration system, illustrated in Figure 1, is designed to provide supplemental indoor refrigeration to small-scale residential buildings at variable condenser heat rejection temperatures, representative of ambient hourly temperatures in hot climates. The system performance is investigated for a representative space cooling application consisting of a villa in the Middle East Basin (i.e., UAE (24°28′ N 54°22′ E)) with an annual monthly cooling load profile as illustrated in Figure 2. The local global horizontal irradiance (GHI) and ambient temperature data are presented in Figure A1 and Figure 3, respectively [23]. The monthly average GHI varies from 3.9 kWh/day/m2 in December to 7.8 kWh/day/m2 in June, with values exceeding 7.2 m2 kWh/day/m2 from May to August (Figure A1). The daily GHI distribution peaks between 11:00 a.m. and 13:00 p.m., at 0.61–0.62 kWh/hour/m2 in December and at 0.99–1.02 kWh/hour/m2 in June (Figure 2). Hourly ambient temperatures typically range from 13 °C to 42 °C (Figure 3).
The refrigeration sub-system configuration consists of a compression-assisted, triple parallel ejector cooling sub-system, driven by thermal energy provided by a solar thermal collector sub-system. The number of parallel ejector sub-cycles is intended to limit the system layout complexity while providing sufficient flexibility to adjust the system cooling capacity to hourly fluctuating requirements. The solar sub-system includes a water solar thermal collector, two electrically-driven hydraulic pumps (Pumps 1 and 2), an auxiliary water heater, and a hot water storage tank. Two candidate types of collector were initially considered, namely the flat plate (FP) and evacuated tube (ET), which were compared in terms of performance. Thermal energy absorbed by the solar collector water during irradiation periods is transferred to the working fluid of the power/refrigeration sub-system in the generator heat exchanger. The vaporized working fluid exits the generator at a high pressure/temperature and saturated conditions (State 1, Figure 1a). Excess solar thermal energy collected during high solar irradiation periods is stored in the hot water tank to supply refrigeration during low or zero (e.g., nighttime) solar irradiation periods. The auxiliary heater can provide additional heat input if the water temperature at the generator inlet is below its design value (i.e., 95 °C), when insufficient collected/stored thermal energy is available. Alternatively, the ejector refrigeration system may be operated as a supplemental air conditioning system in time periods when collected thermal energy is sufficient to maintain the generator water inlet temperature at its design value. In other hourly periods (i.e., when insufficient solar thermal energy is gained), a conventional refrigeration system may be employed. In this operating strategy, the system acts as a peak shaver.
The power/refrigeration sub-system extracts power and refrigeration from the working fluid and includes the generator, evaporator, condenser, pump (i.e., Pump 3), throttling valve, three ejectors, and two booster compressors. The generator, ejectors, compression boosters, and pump effectively replace the mechanical compressor of a conventional vapor compression refrigerator [6]. Each ejector is assumed to operate in critical mode (i.e., condenser pressure lower than condenser critical back pressure) to maintain a constant entrainment ratio. Constant pressure ejectors were adopted, as they can maintain their critical mode at higher condenser pressures (and hence, ambient temperatures) than constant area ejectors [7]. However, due to limitations of the ejector operating range [6,8,10], a simple ejector cycle would not permit the range of variable building cooling loads to be met over the range of condenser heat rejection (sink) conditions considered (i.e., 22–42 °C) without significant ejector performance degradation. The compression-assisted, triple parallel ejector configuration of Figure 1 is intended to provide variable indoor cooling capacities over the range of condenser heat rejection temperatures considered, with improved ejector and refrigeration sub-system performance, relative to a simple ejector cycle operated in the same conditions. Only one ejector is activated at a time, depending on the condenser saturation pressure, and hence, outdoor temperature, which primarily determines the space cooling load [24]. Thus, although humidity also partly contributes to the cooling load, temperature-only based models are considered viable because of the strong correlation between humidity and temperature [24]. Ejectors A, B, and C are geometrically sized for operation at relatively low-, medium-, and high-bound condenser heat rejection temperatures, respectively. This triple parallel ejector configuration avoids the sudden drop in performance of a simple ejector cycle at back pressures exceeding the critical back pressure, thereby extending the range of operating condenser temperatures [10]. In parallel, the booster compressors placed between the evaporator and secondary flow inlets of ejectors B and C, by producing a moderate increase in secondary flow inlet pressure, reduce the secondary ejector inlet-to-back pressure ratio (i.e., pressure lift ratio) to prevent the degradation in secondary ejector mass flow, and hence, entrainment ratio, refrigeration capacity, and refrigeration sub-system thermal COP at elevated ejector back pressures (i.e., elevated condenser pressures) [10,11,12,25]. In parallel, the mechanical COP of the compression-assisted system remains elevated [11].
In the refrigeration sub-system, the high-pressure, high-temperature (primary) motive fluid stream from the generator (State 1, Figure 1b) enters one ejector and passes through the converging nozzle section, where its pressure energy is converted to kinetic energy to reach supersonic speed, with an accompanying pressure reduction. The refrigerant stream passing through the evaporator is vaporized using the heat gained from the cooled space and enters the secondary inlet of the ejector. The high-speed, high-pressure primary motive stream and the low-pressure secondary stream enter the mixing chamber, where the momentum of the motive stream is transferred to, entrains, and accelerates the secondary stream to sonic velocity. The supersonic flow zone ends with a shock wave, either in the mixing chamber or diffuser. The kinetic energy of the mixed stream is converted to pressure energy in the diffuser to reach a pressure higher than the back pressure (State 2, Figure 1b), and then exits the ejector (State 2, Figure 1b) at an intermediate pressure (i.e., between the primary (State 1, Figure 1b) and secondary flow pressures (State 6, Figure 1b)). The mixed stream condenses to a saturated liquid (State 3, Figure 1b) after rejecting heat (Qc) to the environment in the condenser. To complete the power sub-cycle, a portion of the fluid exiting the condenser (State 3, Figure 1b) is pumped back to the generator. The remaining fluid is expanded in a throttling valve to a saturated vapor–liquid mixture and enters the evaporator (State 5, Figure 1b) to complete the refrigeration sub-cycle.
The system components, including the parallel ejectors, solar collector, and hot water storage, were sized and system performance evaluated for a representative residential villa with a floor area of approximately 400 m2 and an occupancy of 5 users. The building indoor air temperature was assumed to be maintained at a constant setpoint, with air conditioning available only when outdoor temperatures exceed a given threshold temperature, as adopted by, for example, the authors of [26], based on building regulations, and reflecting observations that local space cooling loads are primarily determined by outdoor temperature, with temperature-only-based models considered viable [24]. A threshold temperature of 22 °C was assumed in this study, which is considered to be representative of consumers in the region [27,28,29]. The total annual cooling demand is approximately 140 MWh/year, with the corresponding monthly cooling load distribution illustrated in Figure 2. Peak hourly cooling loads are up to 15% higher than monthly average hourly loads, and peak at approximately 36 kWh in summer. So as to implement three ejector cooling sub-cycles and determine their respective cooling capacity requirements, hourly cooling loads were grouped into three ranges. The system cooling capacities for sub-cycle ejectors A, B, and C were determined to be 9 kW, 28 kW, and 36 kW, respectively, to meet the peak hourly cooling load requirements. Figure 3 presents the hourly operational map of each ejector, superposed onto local hourly ambient temperatures for Abu Dhabi [23]. The effective cross-sectional areas of each primary ejector nozzle throat (A1), primary nozzle exit (A2), and constant area section (A3) (Figure 1b) were determined to meet the above cooling capacity requirements using the one-dimensional real gas ejector model developed in this study and described in Section 3.4 and Appendix B.
Figure 3.
Monthly average hourly ambient temperature distribution in Abu Dhabi, UAE (24°28′ N 54°22′ E), based on the TRNSYS TMY2 database [23], with the range of activation of refrigeration sub-system Ejector A, B, and C branches (Figure 1b) also shown.
The following four dry-type candidate refrigerants, characteristics of which are summarized in Table 1, were identified for performance evaluation of the solar cooling system: R11, R141b, R245fa, and R600a. These refrigerants are suitable to operate at typical generation, evaporation, and condensation conditions for ejector-assisted air conditioning cycles [30]. Hydrochlorofluorocarbon (HFC) R245fa and hydrocarbon (HC) R600a, which have zero ozone depletion potential (ODP) and relatively low to moderate global warming potential (GWP), are the primary candidates, while R11 and R141b, which have been widely used in both actual air conditioning systems and experimental and numerical ejector refrigeration studies [31], thereby providing performance and model validation data (e.g., [20,21,32,33]), serve as a benchmark. Due to their low or zero ODP, HCFs, including R245fa, have served as transition working fluids to replace CFCs and HCFCs [16,34]. R245fa is widely employed in actual low-grade thermal energy conversion systems, and has been investigated in recent ejector refrigeration performance studies, such as [35,36]. Although, given their GWPs, HFCs are planned to be phased out globally by 2025‒2040 [16,34] according to the Montreal Protocol Kigali agreement and Kyoto Protocol [37,38], different baseline and delayed phase-down periods have been granted to developing and/or high ambient temperature countries, including, for example, India [16] and GCC countries [39,40]. Certain nations may not be prepared for compliance due to a lack of commitment, financial means, or knowledge [34]. While R600a may be considered the preferred working fluid based on the ODP and GWP criteria in this study, it is classified as highly flammable, which has raised safety concerns for residential air conditioning applications [20,31,41,42]. In addition, although new HFOs with near-zero or zero ODP and GWP appear to be, overall, less flammable than hydrocarbons [43], they are currently up to eight times more expensive than HFCs [41] and, consequently, may not be affordable in certain developing economies with a high demand of air conditioning in hot climates.
3. Mathematical Modeling
The modeling equations for the solar refrigeration system processes are based on mass, momentum, and energy conservation, and exergy balances. A real gas, transonic ejector model was developed based on the framework by Chen et al. [20], and implemented in Engineering Equation Solver (EES) [45]. The model is based on one-dimensional mass, momentum, and energy conservation with the use of effective ejector geometric cross-sectional areas, and constant pressure mixing. Although the model developed is capable of predicting ejector critical and sub-critical mode operations, its application focuses on critical mode operation in this study. The solar collector and refrigeration sub-systems models were implemented in the TRNSYS 18 software [46] and EES software, respectively. The solar and refrigeration sub-systems modeling assumptions were as follows:
- Isenthalpic expansion in the throttling valve [19]
The ejector-specific modeling assumptions were as follows:
- One-dimensional steady flow [20]
The ejector modeling equations are detailed in Appendix B, and the model validation is documented in Section 3.4. The solar collector and refrigeration sub-systems thermodynamic models are described in Section 3.1 and Section 3.2 for energy and exergy analysis, respectively, and the system performance metrics in Section 3.3. The input modeling parameters are listed in Table 2.
Boosters B and C compressor pressure ratios in Table 2 were selected to provide the maximum ejector entrainment ratio and overall COP at the ejector loop operating conditions considered. These pressure ratios are within the ranges (~1–3) previously considered in [12,15,17]. Increasing Boosters B and C pressure ratios above their values in Table 2 would result in the evaporator cooling output exceeding its cooling requirement, thereby producing unnecessary cooling.
3.1. First Law Analysis
The first law analysis for the solar collector and refrigeration sub-systems is based on the following general mass and energy conservation for each system component in steady-state conditions [51]:
Mass conservation:
First law:
The solar collector sub-system model, implemented in TRNSYS 18 [46], evaluates the quantity of solar thermal energy available and supplied to the refrigeration sub-system, so as to provide indoor cooling.
The FP and ET collectors were modeled using the TRNSYS Type 1 and 71 models, respectively. The thermal energy gained by the solar collector heat transfer fluid (i.e., water) is expressed as the following equation:
where ηsc is the collector thermal efficiency, Asc is the collector surface aperture area, It is the incident solar radiation, and is the collector heat transfer fluid mass flow rate. The collector efficiency is evaluated using the Hottel–Whillier–Bliss equation [46]:
where ΔT is the average temperature difference between the collector fluid temperature and ambient air temperature, and a0 and a1 are the collector performance parameters determined from standard testing procedures [46,52]. The collector fluid mass flow rate in Equation (3), , was set at 2000 kg/hr, above which the useful thermal energy collected did not improve significantly, and to avoid an adverse impact on the energy consumption of the source-side pump (i.e., Pump 1, Figure 1a).
The hot water storage tank was modeled as a constant volume stratified storage tank using TRNSYS Type 158. The model assumes that the tank comprises N fully mixed equal volume segments, with N = 6 nodes assumed here. The nodal segments’ temperatures (i = 1 to N) were evaluated from the following unsteady energy balance, given for the ith tank segment [46]:
where Mi and Ti are the masses of the fluid and the fluid temperature in the tank i-th section, respectively, Cpf is the specific heat of the fluid in the tank, and Th are the fluid mass flow rate and the temperatures of the fluid flowing from the heat source (i.e., solar collector), respectively, and and TL are the fluid mass flow rate and the temperature of the fluid flowing to the load (i.e., generator), respectively. Tamb is the temperature of the environment surrounding the tank. and are control functions equal to 1 if the tank segment (i) is where the fluid from the heat source and load enter, respectively, and equal to 0 otherwise. UAi denotes the conductance for heat loss for the i-th node. Based on parametric analyses and space constraints, a base-case hot storage volume of 5 m3 was employed, above which no significant improvement in useful thermal energy collected was obtained.
The solar collector sub-system source-side Pump 1 is a single-speed pump, modeled using the TRNSYS Type 114 model [46]. This circulation pump is controlled by an ON/OFF differential controller modeled using the TRNSYS Type 165 model.
By controlling the water flow rate on the load-side of the solar collector sub-system, the heat delivered to the ejector refrigeration sub-system is adjusted depending upon the ejector branch activated (i.e., either A, B, or C). Thus, the solar collector sub-system load-side Pump 2 is a variable speed pump, the maximum flow rate of which is determined from the required generator heat transfer capacity, calculated as the following [46]:
The variable speed Pump 2 outlet mass flow rate in Equation (10) is calculated as the following [46]:
where is the variable speed pump control function (0 ≤ γ ≤ 1) and is the pump maximum flow rate. The Pump 2 outlet mass flow rate, , is varied with respect to the required generator heat capacity at the given overall system operating conditions (i.e., to meet a given evaporator load in the refrigeration sub-system at a given outdoor temperature, g). The values of the Pump 2 control function, , are calculated as the ratio of the desired generator flow rate to the maximum flow rate, , which delivers the highest required generator heat capacity. The Pump 2 control function, , is specified by the Time-Dependent Forcing Function, and was modeled using the TRNSYS Type 14 model, which is used to control the fluid mass flow rate entering the auxiliary fluid heater and then the generator.
The auxiliary heater was modeled using the TRNSYS Type 138 model. The heater maximum heating rate (max) is defined by the user to maintain the heater outlet temperature at the desired set temperature (i.e., 95 °C). The heater maximum heating rate is selected to be the highest required generator heat capacity, g. The auxiliary heater outlet fluid temperature is expressed using the heater steady-state energy balance [46]:
where is the heater’s maximum heating rate, and the heater energy conversion efficiency value, which was taken as 90% [53]. The heater heat transfer rate may also be expressed as the difference between the useful solar thermal energy and generated heat transfer rate [54]:
A controller for Tempering Valves, modeled using the TRNSYS Type 115 model, is used to control the fluid flow rate on the load side of the solar collector sub-system. The water flow exiting the generator either flows back to the storage tank or to the auxiliary heater. If the storage tank outlet fluid temperature is lower than the generator water inlet temperature, the fluid exiting the generator directly flows into the heater. If the storage tank outlet fluid temperature is higher than the generator water inlet temperature, using the diverter (controlled flow diverter—TRNSYS Type 11), a fraction of the flow exiting the generator is mixed with the storage outlet water using the mixer (mixer—TRNSYS Type 11) to maintain the generator water inlet temperature at its design value (i.e., 95 °C).
The mass and energy relations for the refrigeration sub-system units derived from the generic relations (1)–(2) are listed in Table 3.
3.2. Exergy Analysis
The exergy analysis is based on the following general exergy balance for each refrigeration sub-system component (k) in steady-state conditions [51], with the corresponding exergy relations listed in Table 4:
Neglecting kinetic and potential exergies, the specific exergy of a stream is the sum of its specific physical and chemical exergies:
With no chemical or combustion reactions, the chemical exergy of each stream is set to zero. The specific physical exergy of stream is defined as:
The total exergy flow rate of stream is:
3.3. Performance Indices
Typical performance indicators for solar and ejector cooling systems include the solar fraction (SF), the ejector entrainment ratio (ω), refrigeration sub-system mechanical and overall COPs, and exergy efficiency [19]. The SF is the ratio of the useful solar thermal energy transferred to the generator to the generator total thermal energy input, which includes the useful and auxiliary heat input:
The ejector entrainment ratio ( is expressed as the ratio of the secondary to the primary mass flow rate, and reflects the ejector efficiency [13]:
The refrigeration sub-system mechanical COP [10,12] is the ratio of the cooling output to the mechanical energy input (i.e., pumping and compression work):
The overall refrigeration sub-system COP is equal to the ratio of the cooling output () to the total energy input to system (i.e., to the generator, pump, and booster compressors) [10]:
The exergetic efficiency of the refrigeration sub-system is the ratio of the exergetic product (i.e., exergy of evaporator heat transfer) to the exergetic inputs to the generator, pump, and booster compressors [32,56]:
The exergy destruction ratio of each system component, , is expressed as the ratio of the exergy destruction in the component () to the system total exergy destruction () [55]:
The exergy efficiency of a component, , can be defined as the ratio of the exergy rates of the component product, , and fuel supplied to the component, , when a fuel and product can be meaningfully defined for the component [55]:
The exergy rates of the component fuel, product, destruction, and loss, , can be related as the following [55]:
3.4. Ejector Model
The real gas ejector model, described in Appendix B, was validated for several ejector geometries and three working fluids (i.e., R141b, R245fa, and R11) in critical operation mode, in comparison with referenced experimental and numerical data from [20,21,33,35,57]. A portion of the model validation results is included in Figure 4 for 39 cases, combining a range of ejector geometries and primary (generation) and secondary flow (evaporator) pressures and temperatures, in comparison with the corresponding experimental data of Huang et al. [21] and the numerical data of Chen et al. [20,57] for fluid R141b. Prediction discrepancies in the ejector critical back pressure relative to the experimental data of Huang et al. [21] and numerical data of Chen et al. [20,57] are generally less than 6%. Prediction discrepancies in the entrainment ratio relative to the experimental data of Huang et al. [21], numerical data of Chen et al. [20], and numerical data of Chen et al. [57] are on average 5%, 2%, and 2.5%.
Additional ejector model validation results are presented for R245fa in Figure 5, which compares the critical entrainment ratio predictions as a function of the critical back temperature for a range of primary (generation) and secondary flow inlet (evaporation) temperatures with the corresponding experimental and numerical data of Shestopalov et al. [35]. These data illustrate the reduction in the critical entrainment ratio with increasing condensing temperatures and increasing generation temperatures. Prediction discrepancies in the ejector critical entrainment ratio are, on average, 1.8% and 6.0%, relative to the experimental and numerical data, respectively, of Shestopalov et al. [35].
3.5. Refrigeration Sub-System Model Validation
The refrigeration sub-system model was validated for a single ejector refrigeration cycle operated with R11, in comparison with the experimental COP data of Aphornratana et al. [33] and numerical data of Chen et al. [20] in ejector critical mode operation. A portion of these results, representing the COP as a function of the evaporator temperature (i.e., ejector secondary flow inlet temperature), are presented in Figure 6, at a fixed generator/boiler temperature of 110 °C and for two different ejector back (i.e., condenser) pressures. Both the reference data and present predictions denote a linear variation in the COP with evaporator pressure in ejector critical mode operation. Prediction discrepancies in the COP cycle are generally less than ±0.012 (10%) and ±0.009 (6%) relative to the experimental data of Aphornratana et al. [33] and real gas numerical data of Chen et al. [20], respectively.
4. Results and Discussion
The refrigeration sub-system thermodynamic performance was analyzed for each working fluid (i.e., R245fa, R600a, R141b, and R11). Section 4.1 presents the base case operating conditions (Table 2), and Section 4.2 presents the off-design conditions relevant to low-grade heat-driven air conditioning applications.
4.1. Refrigeration Sub-System Performance at Typical Operating Conditions
The performance of the simple ejector cycles (A, B, C) and compression-assisted ejector cycles (B, C) is represented in terms of the ejector entrainment ratio and refrigeration sub-system overall COP in Figure 7. Considering the simple ejector cycles without compression boosting, the ejector entrainment ratio and overall COP would degrade by approximately 2–4 times (depending on the working fluid) for Ejector B, and 6–17 times for Ejector C, relative to Ejector A (Figure 7). These reductions are related to higher ejector back pressure (i.e., ambient air temperature), that is, higher pressure lift ratios Pc/Ps [8,58]. Thus, Ejectors B and C were sized to meet medium- and high-bound ejector critical temperatures/pressures, respectively, which is at the expense of a reduced ejector entrainment ratio and overall refrigeration sub-system COP. For R245fa, less entrainment ratio and overall COP sensitivities to ejector back pressure are overall observed than for the other working fluids (Figure 7).
With the addition of booster compressors, the Ejector B and C entrainment ratios and overall refrigeration cycle COPs significantly improve relative to the corresponding simple cycles, to a level comparable to that of Ejector A (depending on the working fluid), which operates at a lower back pressure. These improvements in the entrainment ratio and overall COP for compression-assisted Ejectors B and C, relative to the corresponding simple ejector cycles, result from a reduction in the pressure lift ratio (i.e., Pc/Ps) that the ejector had to overcome [10]. R11 and R245fa led to overall higher ejector entrainment ratios and overall COPs than the other two working fluids (Figure 7). For R245fa, compression boosting improves the overall COP by factors of 3.4 and 8.2 for Ejector B and C cycles, respectively, relative to the simple Ejector B and C loops with no compression boosting that would deliver the same cooling output at the same operating conditions. For this fluid, the overall COPs range from 0.17 for Ejector A cycle, to 0.20 and 0.28 for compression-assisted Ejector C and B cycles, respectively. The associated generator heat input requirement is reduced by factors of 3.5 and 8.5 with compression boosting for Ejectors B and C, respectively, relative to the corresponding simple ejector cycles. In parallel, despite the additional booster compression work, high mechanical COPs are achieved for compression-assisted Ejector B and C cycles (e.g., 12.1 and 7.5, respectively, for R245fa). Such mechanical COPs are an advantage of ejector refrigeration over electricity-driven vapor compression cycles when a low-cost source of thermal energy is available to drive the ejector cycle. Based on the overall COP and safety/environmental attributes, R245fa is considered the most suitable refrigerant in this instance.
Effective ejector area dimensions increase with an increasing ejector back pressure, that is, with an increasing condenser temperature, due to corresponding increased cooling capacity requirements, when comparing Ejectors A, B, and C for a given working fluid (Table 5). However, compression boosting reduces the effective ejector cross-sectional areas for Ejector B and C sub-cycles, relative to the corresponding simple ejector sub-cycles providing the same system cooling output at the same operating conditions. This size reduction effect for the compression-assisted cycles is associated with increased secondary flow inlet pressure. Comparing the compression-assisted ejector cycles for each working fluid, R600a leads to the most compact cross-sectional area dimensions, followed by R245fa, while R141b leads to the largest ejector dimensions.
The exergy rates of the components’ fuel, product, destruction, and relative destruction (yk), as well as exergy efficiencies (εex,k), are given in Table 6. For the simple Ejector A cycle and compression-assisted Ejector B cycle, the largest single irreversibility rate occur in the ejector, followed by irreversibilities in the generator and condenser. In the case of the compression-assisted Ejector C cycle, irreversibilities in the ejector and condenser dominate at a comparable rate, followed by generator irreversibilities. Ejector irreversibilities are attributable to fluid friction losses in expansion and contraction within the primary divergent and convergent nozzle, mixing, and compression shock conditions in the ejector constant-area mixing section, while heat exchanger exergy losses are contributed by heat transfer through finite temperature differences. Differences in exergy destruction rates amongst Ejectors A, B, and C are attributable to differences in effective ejector geometries to meet different back pressure requirements (i.e., different ambient temperatures and cooling capacities), and differences in secondary ejector flow inlet and outlet conditions. The compression-assisted Ejectors B and C process a higher amount of fuel exergy than the simple Ejector A cycle. However, compression boosting at the secondary Ejector B and C inlets reduce the pressure lift ratio (i.e., Pc/Ps), and contributes to reduced ejector losses. Ejector exergy efficiency, defined as the ratio of ejector product exergy (i.e., outlet flow exergy rate) to ejector exergy input (i.e., fuel, consisting of the primary and secondary flow exergy rates), improves from Ejector A (40%), to compression-assisted Ejectors B (54%) and C (63%). Ejector C operates at the highest back pressure, with the condenser processing a large amount of input exergy, leading to a large exergy drop through the condenser and thus, high internal exergy losses. As the condenser temperature and total mass flow increase from Ejector A to Ejectors B and C cycles, and despite a reduction in generator heat exergy input from the collector water flow, the generator fuel exergy increases, and consequently, the generator internal exergy losses increase. However, the working fluid temperature is closer to the water temperature, and the generator exergy efficiency improves. The fraction of saturated vapor at the evaporator inlet is higher in the compression-assisted B and C cycles than in the simple A cycle, resulting in higher specific enthalpy and entropy, and lower specific exergy, which is offset by a higher mass flow, resulting in higher total flow exergy at the evaporator inlet. In parallel, the evaporator exergy of heat transfer increases in magnitude, leading to a higher fuel exergy input to the generator. Combining these effects, the evaporator exergy efficiency slightly decreases for the compression-assisted cycle relative to the simple cycle. In terms of the relative ejector exergy destruction (yk), the above trends are consistent with those obtained for single ejector refrigeration cycles, both for simple [32,47,49] and booster-assisted ejectors [49], where the largest exergy destruction rates are typically observed in the ejector. Exergy losses in the booster compressor, pump, and expansion valve may be considered unavoidable [49]. On the other hand, exergy losses in the ejector, generator, condenser, and evaporator could be reduced through geometry optimization using detailed component models, which is outside the scope of this work, and formal optimization of the operating conditions [49]. The overall exergy efficiency of the refrigeration sub-system ranges from 0.9% for Ejector A to 1.4% and 1% for the compression-assisted Ejector B and C cycles, respectively.
On an annual basis in the air conditioning application considered (Figure 1), one of three ejector refrigeration sub-cycles is activated in each hourly period of the year, depending on the hourly cooling load requirement. The monthly system solar fractions (SFs), which are the ratios of the useful solar energy collected to the total thermal energy required to drive the refrigeration cycle, are presented in Figure 8 for the FP and ET solar collectors, each with a surface area equal to approximately 75% of the building rooftop surface area. The SFs range from approximately 0.16 in June to 0.88 in January for the FP collector, and from 0.21 to 0.91, respectively, for the ET collector. Although solar irradiance and ambient temperature rise in summer relative to cooler months (Figure 3 and Figure A1), resulting in a larger amount of water thermal energy available to the generator, monthly cooling loads, and hence, the generator heat input requirement, increase more significantly (Figure 2). On an annual basis, the system SFs average 0.38 and 0.44 for the FP and ET collectors, respectively. These results may be considered conservative, considering the limited collector surface area relative to the cooling requirement in the harsh climatic conditions considered. Building ejector refrigeration applications typically have peak cooling loads that do not exceed 10 kW in less extreme ambient conditions than in this study [6,18,19]. The annual SFs of the present system could be improved using cooling load management, a larger collector field, subject to space availability, a larger number of ejector loops to more closely follow the annual cooling load distribution at the expense of increased system complexity, or potentially, variable ejector geometries.
On a yearly basis in elevated condenser temperatures (Figure 3), the compression-assisted parallel ejector assembly reaches an annual average entrainment ratio of 0.28. The annual average refrigeration sub-system overall and mechanical COPs are 0.21 and 24.5, respectively, and exergy efficiency is 1.2%. These figures are comparable to those previously reported for simple ejector refrigeration cycles at comparable generator and evaporator conditions (e.g., [32]), albeit at higher condenser heat rejection temperatures in this study. Thus, the multi-ejector refrigeration system effectively triples the operating condenser temperature range of a single ejector system to cover the range of annual outdoor conditions, while avoiding a severe degradation in performance at high condenser temperatures through compression boosting.
Based on the yearly solar energy collected with the 300 m2 ET collector, and using a typical electric vapor compression refrigeration COP of 2.5 for split units used in local small-scale buildings [59], a local grid emission factor of 0.655 kgCO2/kWhe [60], and a local subsidized electricity sale price of 83 USD/MWhe, the solar-based refrigeration system could reduce yearly electrical power consumption by approximately 24 MWhe (42%) compared with a conventional split system air conditioner, which is equivalent to 2000 USD electricity expenditure and 15.7 tCO2-eq emissions avoided annually.
4.2. Refrigeration System Performance at Off-Design Conditions
Performance maps, representing the sensitivity of the system cooling capacity (Qe), the ejector entrainment ratio (ω), overall COP, and exergy efficiency () to the generation and evaporation temperatures representative of solar air conditioning applications, are presented in Figure 9, Figure 10 and Figure 11, relative to the baseline performance described in Section 4.1 for R245fa. The range of generator temperatures considered is 80–100 °C, which represents a low-grade heat source from non-concentrated solar collectors. Evaporation temperatures of 5–16 °C are considered, which reflect typical indoor temperatures, hot–cold side temperature differences in the evaporator, and near-atmospheric evaporation pressures to avoid air bleeding into the refrigeration system. These maps are presented for the simple Ejector A cycle and compression-assisted Ejector C cycle, which encompass the bounds of outdoor temperatures and cooling capacities. Ejector B performance maps were found to display similar trends as those of Ejector C, and are therefore not included in Figure 9, Figure 10 and Figure 11 for brevity.
Effect of generation temperature: As the generation temperature increases, the generation pressure (Pg) also increases, resulting in an increased primary mass flow rate and effective primary flow cross-sectional area at the inlet of the mixing section [35]. This leads to a reduction in both the effective secondary flow cross-sectional area at the inlet of the mixing section and the secondary mass flow rate. The combined increase in primary mass flow and reduction in secondary mass flow result in a reduced entrainment ratio, cooling capacity, and overall COP (Figure 9 and Figure 10).
As the evaporator cooling capacity reduces with the increasing generation temperature, the exergy of heat transferred to the evaporator reduces. In parallel, as both the generator heat transfer rate and exergetic temperature factor (1 − T0/TH,g) increase with the increasing generator temperature, the exergy transferred by heat to the generator increases. Pumping work also increases with an increasing generator temperature, due to an increased primary mass flow. Although, for Ejector C, the booster compressor power consumption reduces with an increasing generator temperature, its effect on exergy efficiency is offset by the rise in the exergy transferred by heat to the evaporator. Consequently, for both the simple and compression-assisted ejector cycles, the exergy efficiency reduces with an increasing generator temperature (Figure 11).
Effect of evaporator temperature: In this analysis, the evaporator saturation temperature is varied while the generator outlet temperature is fixed, which is equal to the ejector primary flow inlet temperature, and consequently, the ejector primary mass flow rate also remains fixed. For Ejector A, which is not pressure-boosted, the secondary flow inlet temperature is equal to the evaporator exit temperature.
When Ejector A is activated, and as the evaporator pressure is increased, the pressure difference between the primary stream and secondary stream at the nozzle exit increases, which increases the secondary mass flow rate flowing through the evaporator, as reflected by the improvement in the entrainment ratio (Figure 10). The specific enthalpy difference through the evaporator also increases. Consequently, the cooling capacity significantly rises (Figure 9). In parallel, an increase in the secondary flow inlet pressure increases the mixed stream pressure in the ejector mixing section, thereby lowering the ejector pressure lift ratio (i.e., Pc/Ps), and slightly raising the ejector critical back pressure, which also contributes to improving the cooling capacity and overall COP (Figure 9 and Figure 10). As the evaporator temperature increases, the exergy efficiency increases for Ejector A (Figure 11). This is due to (i) an increase in the cooling capacity (i.e., Qe) with the increasing evaporator temperature, which leads to an increase in the exergy of heat transferred to the evaporator, (ii) a reduction in the exergy of heat transferred to the generator (due to the generator heat transfer rate decreasing with an increasing evaporator temperature), and (iii) a slight reduction in pumping work with an increasing evaporator temperature.
To avoid degradation of the entrainment ratio at high condenser temperatures, Ejector C pressure booster raises and maintains the secondary flow inlet pressure at a constant level, independent of evaporator conditions, thereby maintaining a constant secondary mass flow through the evaporator, and a constant entrainment ratio (since the primary mass flow is fixed, the generator outlet conditions being fixed), independent of the evaporator conditions. Therefore, for the pressure-assisted Ejector C, when the evaporator temperature is increased, the mass flow rate through the evaporator remains constant, while the working fluid specific enthalpy difference through the evaporator increases, resulting in a slight increase in the cooling capacity and, consequently, the COP (Figure 9 and Figure 10). For the pressure-assisted Ejector C cycle, the system exergy output (i.e., the exergy of heat transferred to the evaporator) slightly increases with the increasing evaporator temperature, due to the slight increase in the cooling capacity (Figure 9). In addition, the booster power consumption decreases with the increasing evaporator pressure, while both the exergy of heat transferred to the generator and pump work remain constant (i.e., do not change with evaporator pressure), as the primary flow inlet conditions are unchanged. Combined, these factors result in a slight improvement in exergy efficiency with an increasing evaporator pressure for compression-assisted Ejector C cycle (Figure 11).
5. Conclusions
A low-grade solar thermal energy-driven compression-assisted parallel ejector air conditioning system was investigated to reduce the electrical cooling loads of small-scale buildings in hot climate conditions. The multi-ejector system effectively triples the operating condenser temperature range of a single ejector system to cover the range of annual outdoor conditions while maintaining comparable performance through compression boosting.
Using R245fa and evaporation and generation temperatures of 10 °C and 85 °C, respectively, the monthly average system solar fraction using an evacuated tube collector varies from 0.21 to 0.91 in summer and winter, respectively. With an evacuated tube collector, yearly average mechanical and overall COPs of 24.5 and 0.21 are obtained, respectively, for the refrigeration system. Such mechanical COPs are an advantage over electricity-driven vapor compression when an affordable low-carbon heat source is available to drive the ejector cycle. Compression boosting reduces the generator heat input requirement and improves the refrigeration sub-system overall COP by factors of approximately 3–8 for ejectors operated at medium- to high-bound condenser temperatures, relative to the corresponding simple ejector sub-cycles that would deliver the same cooling output at the same operating conditions. Exergy destruction primarily takes place in the ejector assembly, condenser, and generator. The ejector exergy efficiency improves with compression boosting in ejector sub-cycles operated at mid and high-bound back pressures.
The proposed compression-assisted multi-ejector system could reduce annual electric cooling loads by approximately 24 MWhe (42%) compared with a conventional local split air conditioner, which is equivalent to 2000 USD of saved electricity expenditure and 15.7 tons of CO2-equivalent GHG emissions avoided annually.
The refrigeration sub-system cooling capacity and overall COP improve with an increasing evaporator temperature and reducing generator temperature. The system annual solar fraction could be enhanced using a larger collector field, subject to space availability, cooling load management, and additional ejector branches, to more closely follow the annual cooling load distribution, at the expense of increased system complexity. Finally, additional emerging working fluids, with zero or near zero-ODPs and GWPs and promising properties from technical performance, safety, high ambient temperature compatibility, and affordability perspectives, should be investigated for the present ejector air conditioning concept.
Author Contributions
V.E.: conceptualization, data curation, formal analysis, investigation, methodology, project administration, resources, supervision, visualization, writing—original draft. Y.A.: conceptualization, data curation, formal analysis, investigation, methodology, software, validation, visualization. All authors have read and agreed to the published version of the manuscript.
Funding
This research was funded by Khalifa University, and the APC was funded by the first author.
Conflicts of Interest
The authors declare no conflict of interest.
Abbreviations
| BAC | booster-assisted cycle |
| CFC | chlorofluorocarbon |
| ET | evacuated tube |
| FP | flat plate |
| GHG | greenhouse gas |
| GWP | global warming potential |
| HC | hydrocarbon |
| HCFC | hydrochlorofluorocarbon |
| HFC | hydrofluorocarbon |
| N | normal shock |
| ODP | ozone depletion potential |
| SC | simple cycle |
| VCC | vapor compression cycle |
| Main Notations | |
| a | sonic velocity (m/s) or solar collector performance constant (-) |
| A | area (m2) |
| AL | atmospheric life (year) |
| COP | coefficient of performance (-) |
| Cp | specific heat capacity (kJ/kg-K) |
| D | diameter (m) |
| It | incident solar radiation (kW/m2) |
| GHI | global horizontal irradiance (Wh/m2) |
| h | specific enthalpy (kJ/kg) |
| M | mass (kg) or molecular weight (k/mol) |
| Ma | Mach number (-) |
| mass flow rate (kg/s) | |
| P | pressure (kPa) |
| heat transfer rate (kW) | |
| s | specific entropy (kJ/kg-K) |
| T | temperature (°C) |
| U | overall heat transfer coefficient (kW/m2-K) |
| specific volume (m3/kg) | |
| V | velocity (m/s) |
| y | exergy destruction ratio (-) |
| electrical or mechanical power (kW) | |
| SF | solar fraction (-) |
| Greek | |
| α | storage tank control function (-) |
| β | storage tank control function (-) |
| Δ | difference |
| ε | component exergy efficiency (-) |
| ϕ | frictional loss coefficient (-) |
| γ | variable speed pump control function (-) |
| ∑ | summation |
| ω | ejector entrainment ratio (-) |
| η | device isentropic efficiency or system thermodynamic efficiency (-) |
| mixing loss coefficient (-) | |
| Superscript | |
| * | ejector critical mode operation |
| Subscript | |
| amb | ambient |
| aux | auxiliary heater |
| b | booster compressor |
| booster | booster compressor |
| c | condenser, critical, or ejector back |
| ch | chemical |
| D | destruction or destroyed |
| e | evaporator |
| ex | exergy |
| f | solar collector source-side fluid |
| F | fuel |
| g | generator |
| h | heat source |
| H | high temperature reservoir |
| heater | heater |
| hs | heat source |
| i | storage tank segment or stream |
| is | isentropic |
| in | inlet |
| k | component |
| L | load or low temperature reservoir or loss |
| m | mixing |
| max | maximum |
| mech | mechanical |
| mfe | mixed flow exit |
| out | outlet |
| overall | overall |
| p | ejector primary flow or product |
| ph | physical |
| pfe | primary flow exit |
| pump1 | source-side single-speed water Pump 1 |
| pump2 | load-side variable speed water Pump 2 |
| pump3 | refrigeration sub-system Pump 3 |
| s | ejector secondary inlet |
| sat | saturation |
| sc | solar collector |
| sys | system |
| t | ejector primary nozzle throat |
| u | useful energy |
| w | water |
| y | ejector hypothetical throat |
| 0 | reference state |
| 1 | generator outlet or ejector primary nozzle throat |
| 2 | condenser inlet or ejector primary nozzle exit |
| 3 | Pump 3 inlet or ejector constant-area section exit |
| 4 | expansion valve inlet |
| 5 | evaporator inlet |
| 6 | evaporator outlet |
| 7′ | Ejector A secondary inlet |
| 7″ | Ejector B secondary inlet |
| 7‴ | Ejector C secondary inlet |
| 8 | generator inlet |
Appendix A. Global Horizontal Irradiation
Figure A1 presents the monthly hourly average solar global horizontal irradiation (GHI) in Abu Dhabi, UAE (24°28′ N 54°22′ E), based on TRNSYS database (TMY2).
Figure A1.
Monthly hourly average solar global horizontal irradiation (GHI) in Abu Dhabi, UAE (24°28′ N 54°22′ E), based on the TRNSYS database (TMY2) [23].
Figure A1.
Monthly hourly average solar global horizontal irradiation (GHI) in Abu Dhabi, UAE (24°28′ N 54°22′ E), based on the TRNSYS database (TMY2) [23].

Appendix B. Ejector Model
The transonic vapor ejector numerical model is based on the modelling framework of Chen et al. [20] for one-dimensional mass, momentum, and energy conservation, with the use of effective ejector geometric cross-sectional areas, assuming constant pressure mixing. The ejector modelling equations for critical mode operation are documented in Appendix B.1, Appendix B.2, Appendix B.3, Appendix B.4, Appendix B.5 and Appendix B.6.
Appendix B.1. Primary Flow in the Convergent and Divergent Nozzle
For a given primary flow pressure (Pp) and temperature (Tp), the enthalpy and entropy of the working fluid at the primary nozzle inlet can be found with the following equations:
The enthalpy and entropy of the primary stream at the nozzle exit (State pfe, Figure 1b) are calculated using an isentropic efficiency,, for the processes occurring in both the converging and diverging nozzle sections:
where and are the isentropic state enthalpies at the primary flow nozzle throat and exit, respectively, and and are the isentropic state entropies at the primary flow nozzle throat and exit, respectively. Energy conservation applied to the processes in the converging and diverging nozzle sections yields the following relations:
where and are the velocities of the primary stream at the nozzle throat and exit, respectively. With the first choking condition occurring at the nozzle throat, equals the sound speed, , which can be evaluated based on the working fluid thermodynamic properties:
The primary mass flow rate can then be calculated based on the density,, and entropy, , of the working fluid at the nozzle throat:
where
where is the nozzle throat cross-section area. From the governing mass balance, the primary flow velocity at the nozzle exit, , can be obtained as:
where is the nozzle exit cross-sectional area, and is the density of the working fluid at the nozzle exit, which can be evaluated based on the corresponding pressure and enthalpy with the following equation:
Appendix B.2. Primary Flow Core from Primary Flow Nozzle Exit (pfe) to Hypothetical Throat (y)
The primary flow core (i.e., from the nozzle exit plane, pfe, to the hypothetical throat, y, Figure 1b) is considered to be an extension of the working fluid expansion process as the stream exits the divergent part of the primary nozzle. The thermodynamic properties of the fluid at State y are obtained as follows, with the working fluid pressures of the primary and secondary streams at State y, and , respectively, assumed to be the same as that of the mixed flow at Section m,:
Losses associated with the primary flow process between Sections pfe and y are accounted for using an isentropic efficiency:
The fluid velocity at State y is derived from energy conservation and related to mass flow rate:
Appendix B.3. Entrained Flow from Secondary Flow Inlet (s) to Hypothetical Throat (y)
According to the constant-pressure ejector model, the second choking condition occurs in the induced secondary stream at the hypothetical throat (i.e., State y, Figure 1b), where the stream velocity, , equals the sound speed, which can be calculated based on the secondary stream thermodynamic properties:
The secondary stream thermodynamic properties at the hypothetical throat (enthalpy, and density, ) can be found based on those at the secondary flow inlet (i.e., State s) and the isentropic efficiency coefficient of the secondary flow before mixing with the primary flow, :
The secondary mass flow rate, , can be calculated as the following:
The cross sectional area of the constant area section, A3, is expressed as the following:
Appendix B.4. Mixed Flow at Section m, Upstream of the Normal Shock at Section (N)
The equations describing the mixing process occurring between the hypothetical throat at Section (y) and Section (m) are the mass balance (Equation (A30)), momentum balance (Equation (A31)), energy balance (Equation (A32)), and State (m) density (Equation (A33)):
In Equation (A31), φm is a coefficient representing mixing losses associated with inefficient momentum transfer between the primary and secondary streams induced by friction between streams and between the working fluid and the ejector wall.
Appendix B.5. Mixed Flow across the Shock from Section (m) to (mfe)
The normal shock occurring in the constant-area section between Section (m) and the mixed flow exit (mfe) is represented by a mass balance (Equation (A34)), momentum balance (Equation (A35)), energy balance (Equation (A36)), and State (mfe) properties (Equations (A37) and (A38)).
Appendix B.6. Mixed Flow through Diffuser from Section (mfe) to the Diffuser Outlet at Section (Out)
The diffusion process is described by an energy balance (Equation (A39)) between Section (mfe) and the diffuser outlet section (out), and the properties of the diffuser outlet state (out) (Equations (A40) and (A41)):
References
- Cao, X.; Dai, X.; Liu, J. Building enersolgy consumption status worldwide and the state-of-the-art technologies for zero-energy buildings during the past decade. Energy Build. 2016, 128, 198–213. [Google Scholar] [CrossRef]
- Eveloy, V.; Ayou, D.S. Sustainable District Cooling Systems: Status, Challenges, and Future Opportunities, with Emphasis on Cooling-Dominated Regions. Energies 2019, 12, 235. [Google Scholar] [CrossRef] [Green Version]
- Ministry of Energy. The UAE State of Energy Report; Ministry of Energy: Dubai, United Arab Emirates, 2015.
- BP. BP Energy Outlook. 2020 Edition. 2020. Available online: https://www.bp.com (accessed on 7 May 2021).
- Ayou, D.S.; Eveloy, V. Integration of Municipal Air-Conditioning, Power, and Gas Supplies Using an LNG Cold Exergy-Assisted Kalina Cycle System. Energies 2020, 13, 4599. [Google Scholar] [CrossRef]
- Allouhi, A.; Kousksou, T.; Jamil, A.; Bruel, P.; Mourad, Y.; Zeraouli, Y. Solar driven cooling systems: An updated review. Renew. Sustain. Energy Rev. 2015, 44, 159–181. [Google Scholar] [CrossRef]
- Braimakis, K. Solar ejector cooling systems: A review. Renew. Energy 2021, 164, 566–602. [Google Scholar] [CrossRef]
- Zeyghami, M.; Goswami, D.Y.; Stefanakos, E. A review of solar thermo-mechanical refrigeration and cooling methods. Renew. Sustain. Energy Rev. 2015, 51, 1428–1445. [Google Scholar] [CrossRef]
- Pollerberg, C.; Ali, A.H.H.; Dotsch, C. Experimental study on the performance of a solar driven steam jet ejector chiller. Energy Convers. Manag. 2008, 49, 3318–3325. [Google Scholar] [CrossRef]
- Chen, J.; Jarall, S.; Havtun, H.; Palm, B. A review on versatile ejector applications in refrigeration systems. Renew. Sustain. Energy Rev. 2015, 49, 67–90. [Google Scholar] [CrossRef]
- Sokolov, M.; Hershgal, D. Optimal coupling and feasibility of a solar-powered year-round ejector air conditioner. Sol. Energy 1993, 50, 507–516. [Google Scholar] [CrossRef]
- Arbel, A.; Sokolov, M. Revisiting solar-powered ejector air conditioner—The greener the better. Sol. Energy 2004, 77, 57–66. [Google Scholar] [CrossRef]
- Besagni, G.; Mereu, R.; Inzoli, F. Ejector refrigeration: A comprehensive review. Renew. Sustain. Energy Rev. 2016, 53, 373–407. [Google Scholar] [CrossRef] [Green Version]
- Mansour, R.B.; Ouzzane, M.; Aidoun, Z. Numerical evaluation of ejector-assisted mechanical compression systems for refrigeration applications. Int. J. Refrig. 2014, 43, 36–49. [Google Scholar] [CrossRef]
- Takleh, H.R.; Zare, V. Performance improvement of ejector expansion refrigeration cycles employing a booster compressor using different refrigerants: Thermodynamic analysis and optimization. Int. J. Refrig. 2019, 101, 56–70. [Google Scholar]
- Wang, Y.; Chen, T.; Liang, Y.; Sun, H.; Zhu, Y. A novel cooling and power cycle based on the absorption power cycle and booster-assisted ejector refrigeration cycle driven by a low-grade heat source: Energy, exergy and exergoeconomic analysis. Energy Convers. Manag. 2020, 204, 112321. [Google Scholar] [CrossRef]
- Takleh, H.R.; Zare, V. Employing thermoelectric generator and booster compressor for performance improvement of a geothermal driven combined power and ejector-refrigeration cycle. Energy Convers. Manag. 2019, 186, 120–130. [Google Scholar] [CrossRef]
- Tashtoush, B.; Alshare, A.; Al-Rifai, S. Hourly dynamic simulation of solar ejector cooling system using TRNSYS for Jordanian climate. Energy Convers. Manag. 2015, 100, 288–299. [Google Scholar] [CrossRef]
- Allouche, Y.; Varga, S.; Bouden, C.; Oliveira, A.C. Dynamic simulation of an integrated solar-driven ejector based air conditioning system with PCM cold storage. Appl. Energy 2017, 190, 600–611. [Google Scholar] [CrossRef]
- Chen, W.; Shi, C.; Zhang, S.; Chen, H.; Chong, D.; Yan, J. Theoretical analysis of ejector refrigeration system performance under overall modes. Appl. Energy 2017, 185, 2074–2084. [Google Scholar] [CrossRef]
- Huang, B.J.; Chang, J.M.; Wang, C.P.; Petrenko, V.A. 1-D analysis of ejector performance. Int. J. Refrig. 1999, 22, 354–364. [Google Scholar] [CrossRef]
- Wang, F.; Yang, Y.N.; Ding, W.W.; Yin, S.P. Performance analysis of ejector at off-design condition with an unconstant-pressure mixing model. Int. J. Refrig. 2019, 99, 204–212. [Google Scholar] [CrossRef]
- National Renewable Energy Laboratory (NREL). User’s Manual for TMY2s (Typical Meteorological Years), NREL/SP-463-7668, and TMY2s, Typical Meteorological Years Derived from the 1961–1990 National Solar Radiation Data Base, June 1995, CD-ROM. Golden: NREL. Available online: http://sel.me.wisc.edu/trnsys/weather/tmy2data.htm (accessed on 1 May 2018).
- Ali, M.T.; Mokhtar, M.; Chiesa, M.; Armstrong, P. A cooling change-point model of community-aggregate electrical load. Energy Build. 2011, 43, 28–37. [Google Scholar] [CrossRef]
- Eldakamawy, M.H.; Sorin, M.V.; Brouillette, M. Energy and exergy investigation of ejector refrigeration systems using retrograde refrigerants. Int. J. Refrig. 2017, 78, 176–192. [Google Scholar] [CrossRef]
- Marugán-Cruz, C.; Sánchez-Delgado, S.; Rodríguez-Sánchez, M.R.; Venegas, M.; Santana, D. District cooling network connected to a solar power tower. Appl. Therm. Eng. 2015, 79, 174–183. [Google Scholar] [CrossRef]
- Atalla, N.; Hunt, L.C. Modelling residential electricity demand in the GCC countries. Energy Econ. 2016, 59, 149–158. [Google Scholar] [CrossRef] [Green Version]
- Bayram, S.; Al-Qahtani, M.; Saffouri, F.; Koç, M. Estimating the cost of summer cooling in Bahrain. In Proceedings of the 9th IEEE-GCC Conference and Exhibition 2017 (GCCCE), Manama, Bahrain, 8–11 May 2017. [Google Scholar] [CrossRef]
- Salameh, T.; Assad, M.E.H.; Tawalbeh, M.; Ghenai, C.; Merabet, A.; Öztop, H.F. Analysis of cooling load on commercial building in UAE climate using building integrated photovoltaic façade system. Sol. Energy 2020, 199, 617–629. [Google Scholar] [CrossRef]
- Chen, J.; Havtun, H.; Palm, B. Screening of working fluids for the ejector refrigeration system. Int. J. Refrig. 2014, 47, 1–14. [Google Scholar] [CrossRef]
- Lillo, G.; Mastrullo, R.; Mauro, A.W.; Trinchieri, R.; Viscito, L. Thermo-economic analysis of a hybrid ejector refrigerating system based on a low grade heat source. Energies 2020, 13, 562. [Google Scholar] [CrossRef] [Green Version]
- Sadeghi, M.; Mahmoudi, S.M.S.; Saray, R.K. Exergoeconomic analysis and multi-objective optimization of an ejector refrigeration cycle powered by an internal combustion (HCCI) engine. Energy Convers. Manag. 2015, 96, 403–417. [Google Scholar] [CrossRef]
- Aphornratana, S.; Chungpaibulpatana, S.; Srikhirin, P. Experimental investigation of an ejector refrigerator: Effect of mixing chamber geometry on system performance. Int. J. Energy Res. 2001, 25, 397–411. [Google Scholar] [CrossRef]
- Abas, N.; Kalair, A.R.; Khan, N.; Haider, A.; Saleem, Z.; Saleem, M.S. Natural and synthetic refrigerants, global warming: A review. Renew. Sustain. Energy Rev. 2018, 90, 557–569. [Google Scholar] [CrossRef]
- Shestopalov, K.; Huang, B.; Petrenko, V.; Volovyk, O. Investigation of an experimental ejector refrigeration machine operating with refrigerant R245fa at design and off-design working conditions. Part 2. Theoretical and experimental results. Int. J. Refrig. 2015, 55, 212–223. [Google Scholar] [CrossRef]
- Yu, W.; Xu, Y.; Wang, H.; Ge, Z.; Wang, J.; Zhu, D.; Xia, Y. Thermodynamic and thermoeconomic performance analyses and optimization of a novel power and cooling cogeneration system fueled by low-grade waste heat. Appl. Therm. Eng. 2020, 179, 115667. [Google Scholar] [CrossRef]
- UNEP. Montreal Protocol on Substances That Deplete the Ozone Layer; United Nations Environment Program: New York, NY, USA, 1987. [Google Scholar]
- GECR. Kyoto Protocol to the United Nations Framework Conservation on Climate Change; Global Environmental Change Report: New York, NY, USA, 1997. [Google Scholar]
- United Nations Environment Programme (UNEP), Ozone Secretariat. The Montreal Protocol on Substances That Deplete the Ozone Layer. Article 5: Special Situation of Developing Countries. Available online: https://ozone.unep.org/treaties/montreal-protocol/articles/article-5-special-situation-developing-countries (accessed on 22 May 2021).
- Multimedia.3m.com. United Nations Environment Programme (UNEP) Factsheet. The Kigali Amendment to the Montreal Protocol: HFC Phase-Down. Available online: https://multimedia.3m.com/mws/media/1365924O/unep-fact-sheet-kigali-amendment-to-mp.pdf (accessed on 30 June 2021).
- Booten, C.; Nicholson, S.; Mann, M.; Abdelaziz, O. Refrigerants: Market Trends and Supply Chain Assessment. Technical Report NREL/TP-5500-70207. February, 2020. Available online: https://www.nrel.gov/docs/fy20osti/70207.pdf (accessed on 30 June 2021).
- Roy, Z.; Halder, G. Replacement of halogenated refrigerants towards sustainable cooling system: A review. Chem. Eng. J. Adv. 2020, 3, 100027. [Google Scholar] [CrossRef]
- Nair, V. HFO refrigerants: A review of present status and future prospects. Int. J. Refrig. 2021, 122, 156–170. [Google Scholar] [CrossRef]
- American Society of Heating, Refrigerating and Air-Conditioning Engineers (ASHRAE). ANSI/ASHRAE Standard 34-2019. Designation and Safety Classification of Refrigerants. Available online: https://www.ashrae.org (accessed on 5 May 2021).
- EES. Engineering Equation Solver. F-Chart Software, 1992–2016. Available online: www.fchart.com (accessed on 5 May 2021).
- Klein, S.A.; Beckman, W.A.; Mitchell, J.W.; Duffie, J.A.; Duffie, N.A.; Freeman, T.L.; Mitchell, J.C.; Braun, J.E.; Evans, B.L.; Kummer, J.P.; et al. TRNSYS 18, a TRaNsient SYstem Simulation Program; Mathematical Reference; Solar Energy Laboratory, University of Wisconsin-Madison: Madison, WI, USA, 2017. [Google Scholar]
- Mansuriya, K.; Patel, V.K.; Desai, N.B.; Vora, N.M. Performance evaluation of the ejector refrigeration system based on thermo-economic criteria through multi-objective approach. Clean Technol. Environ. Policy 2012, 23, 1087–1103. [Google Scholar] [CrossRef]
- Sarbu, I.; Sebarchievici, C. Review of solar refrigeration and cooling systems. Energy Build. 2013, 67, 286–297. [Google Scholar] [CrossRef]
- Zhao, H.; Zhang, K.; Wang, L.; Han, J. Thermodynamic investigation of a booster-assisted ejector refrigeration system. Appl. Therm. Eng. 2016, 104, 274–281. [Google Scholar] [CrossRef]
- Pridasawas, W.; Lundqvist, P. A year-round dynamic simulation of a solar-driven ejector refrigeration system with iso-butane as a refrigerant. Int. J. Refrig. 2007, 30, 840–850. [Google Scholar] [CrossRef]
- Moran, M.J.; Shapiro, H.N. Fundamentals of Engineering Thermodynamics, 6th ed.; Wiley: Hoboken, NJ, USA, 2007; ISBN 9780471787358. [Google Scholar]
- Duffie, J.A.; Beckman, W.A. Solar Engineering of Thermal Processes; Wiley-Interscience: New York, NY, USA, 1980. [Google Scholar]
- Sarbu, I.; Sebarchievici, C. Solar Collectors. In Solar Heating and Cooling Systems. Fundamentals, Experiments and Applications; Academic Press: Cambridge, MA, USA, 2017; Chapter 3; pp. 29–97. ISBN 9780128116623. [Google Scholar]
- Vidal, H.; Colle, S. Modeling and hourly simulation of a solar ejector cooling system. Appl. Therm. Eng. 2006, 26, 663–672. [Google Scholar] [CrossRef]
- Bejan, A.; Tsatsaronis, G.; Moran, M.J. Thermal Design and Optimization; John Wiley & Sons, Inc.: New York, NY, USA, 1996. [Google Scholar]
- Pektezel, O.; Acar, H.I. Energy and Exergy Analysis of Combined Organic Rankine Cycle-Single and Dual Evaporator Vapor Compression Refrigeration Cycle. Appl. Sci. 2019, 9, 5028. [Google Scholar] [CrossRef] [Green Version]
- Chen, W.; Liu, M.; Chong, D.; Yan, J.; Little, A.B.; Bartosiewicz, Y. A 1D model to predict ejector performance at critical and sub-critical operational regimes. Int. J. Refrig. 2013, 36, 1750–1761. [Google Scholar] [CrossRef]
- Shestopalov, K.O.; Huang, B.J.; Petrenko, V.O.; Volovyk, O.S. Investigation of an experimental ejector refrigeration machine operating with refrigerant R245fa at design and off-design working conditions. Part 1. Theoretical analysis. Int. J. Refrig. 2015, 55, 201–211. [Google Scholar] [CrossRef]
- International Renewable Energy Agency (IRENA). Renewable Energy Markey Analysis: GCC, 2019. Available online: https://www.irena.org/-/media/Files/IRENA/Agency/Publication/2019/Jan/IRENA_Market_Analysis_GCC_2019.pdf (accessed on 5 May 2021).
- Treyer, K.; Bauer, C. The environmental footprint of UAE’s electricity sector: Combining life cycle assessment and scenario modeling. Renew. Sustain. Energy Rev. 2016, 55, 1234–1247. [Google Scholar] [CrossRef]
Figure 1.
Schematic representation of the solar compression-assisted, triple parallel ejector refrigeration system: (a) system layout; (b) schematic ejector geometry. D1, D2, and D3 refer to the effective area diameters of the ejector nozzle throat, nozzle exit, and mixing chamber, respectively.
Figure 1.
Schematic representation of the solar compression-assisted, triple parallel ejector refrigeration system: (a) system layout; (b) schematic ejector geometry. D1, D2, and D3 refer to the effective area diameters of the ejector nozzle throat, nozzle exit, and mixing chamber, respectively.
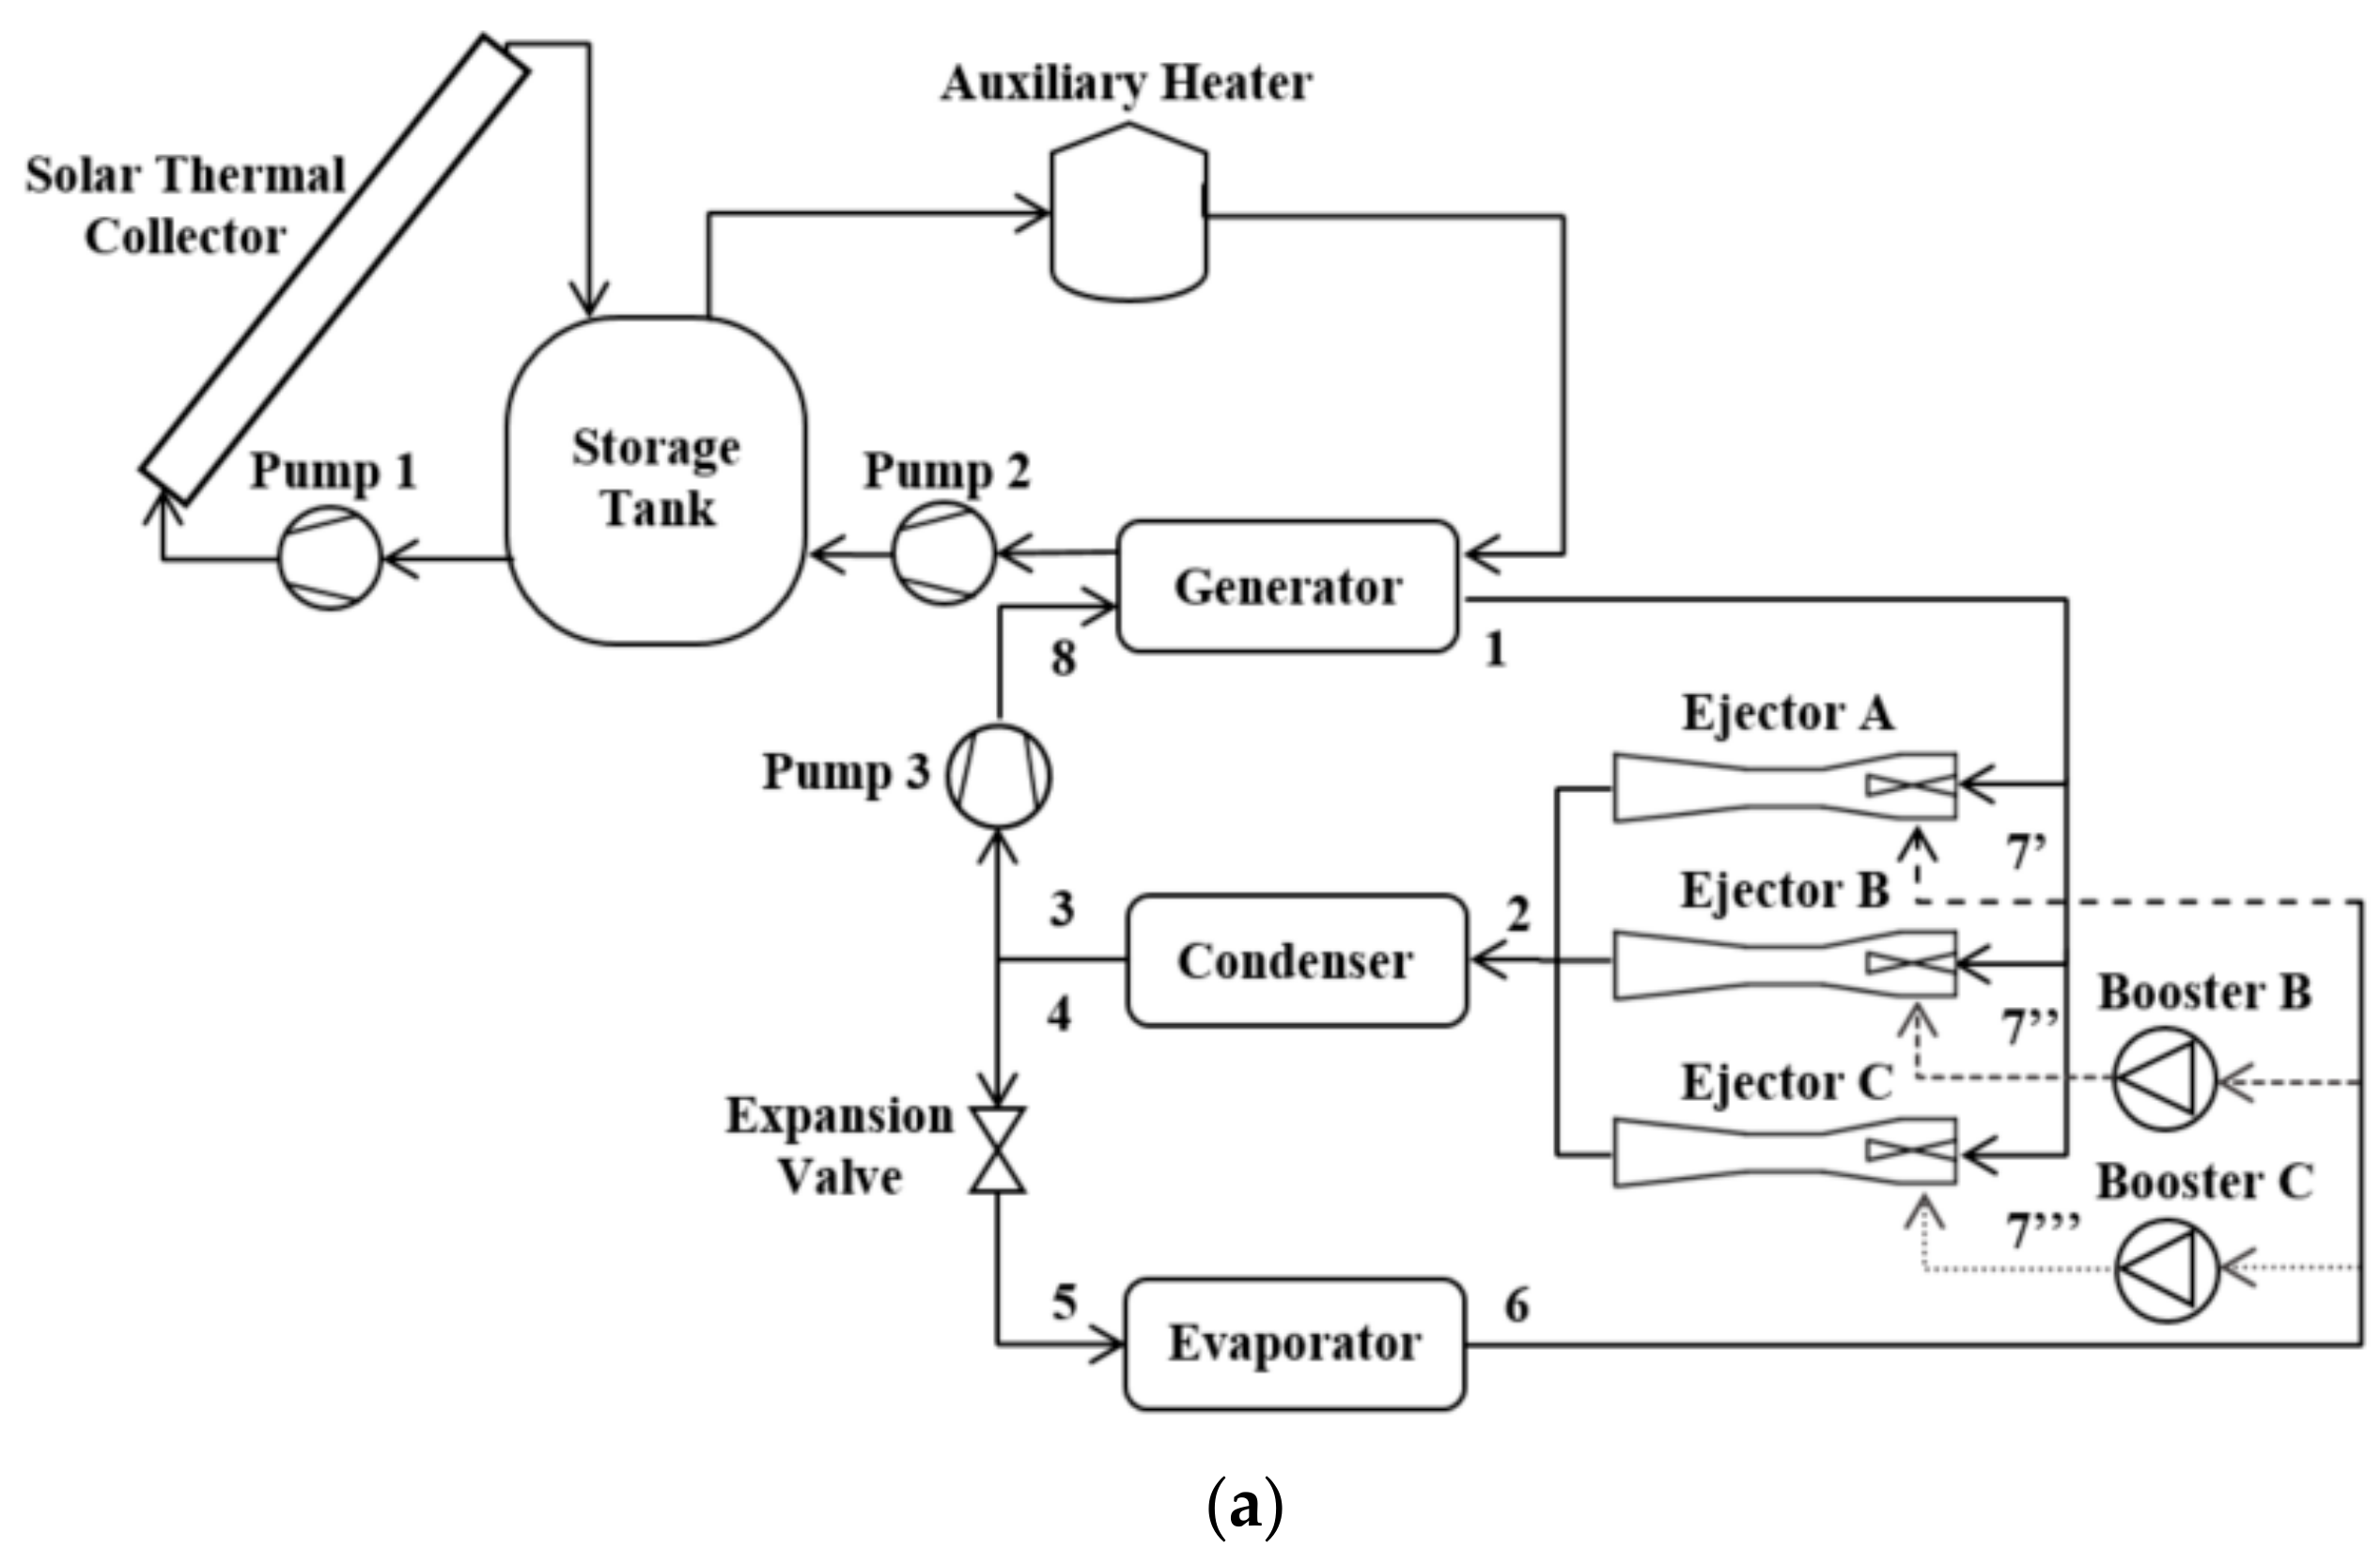
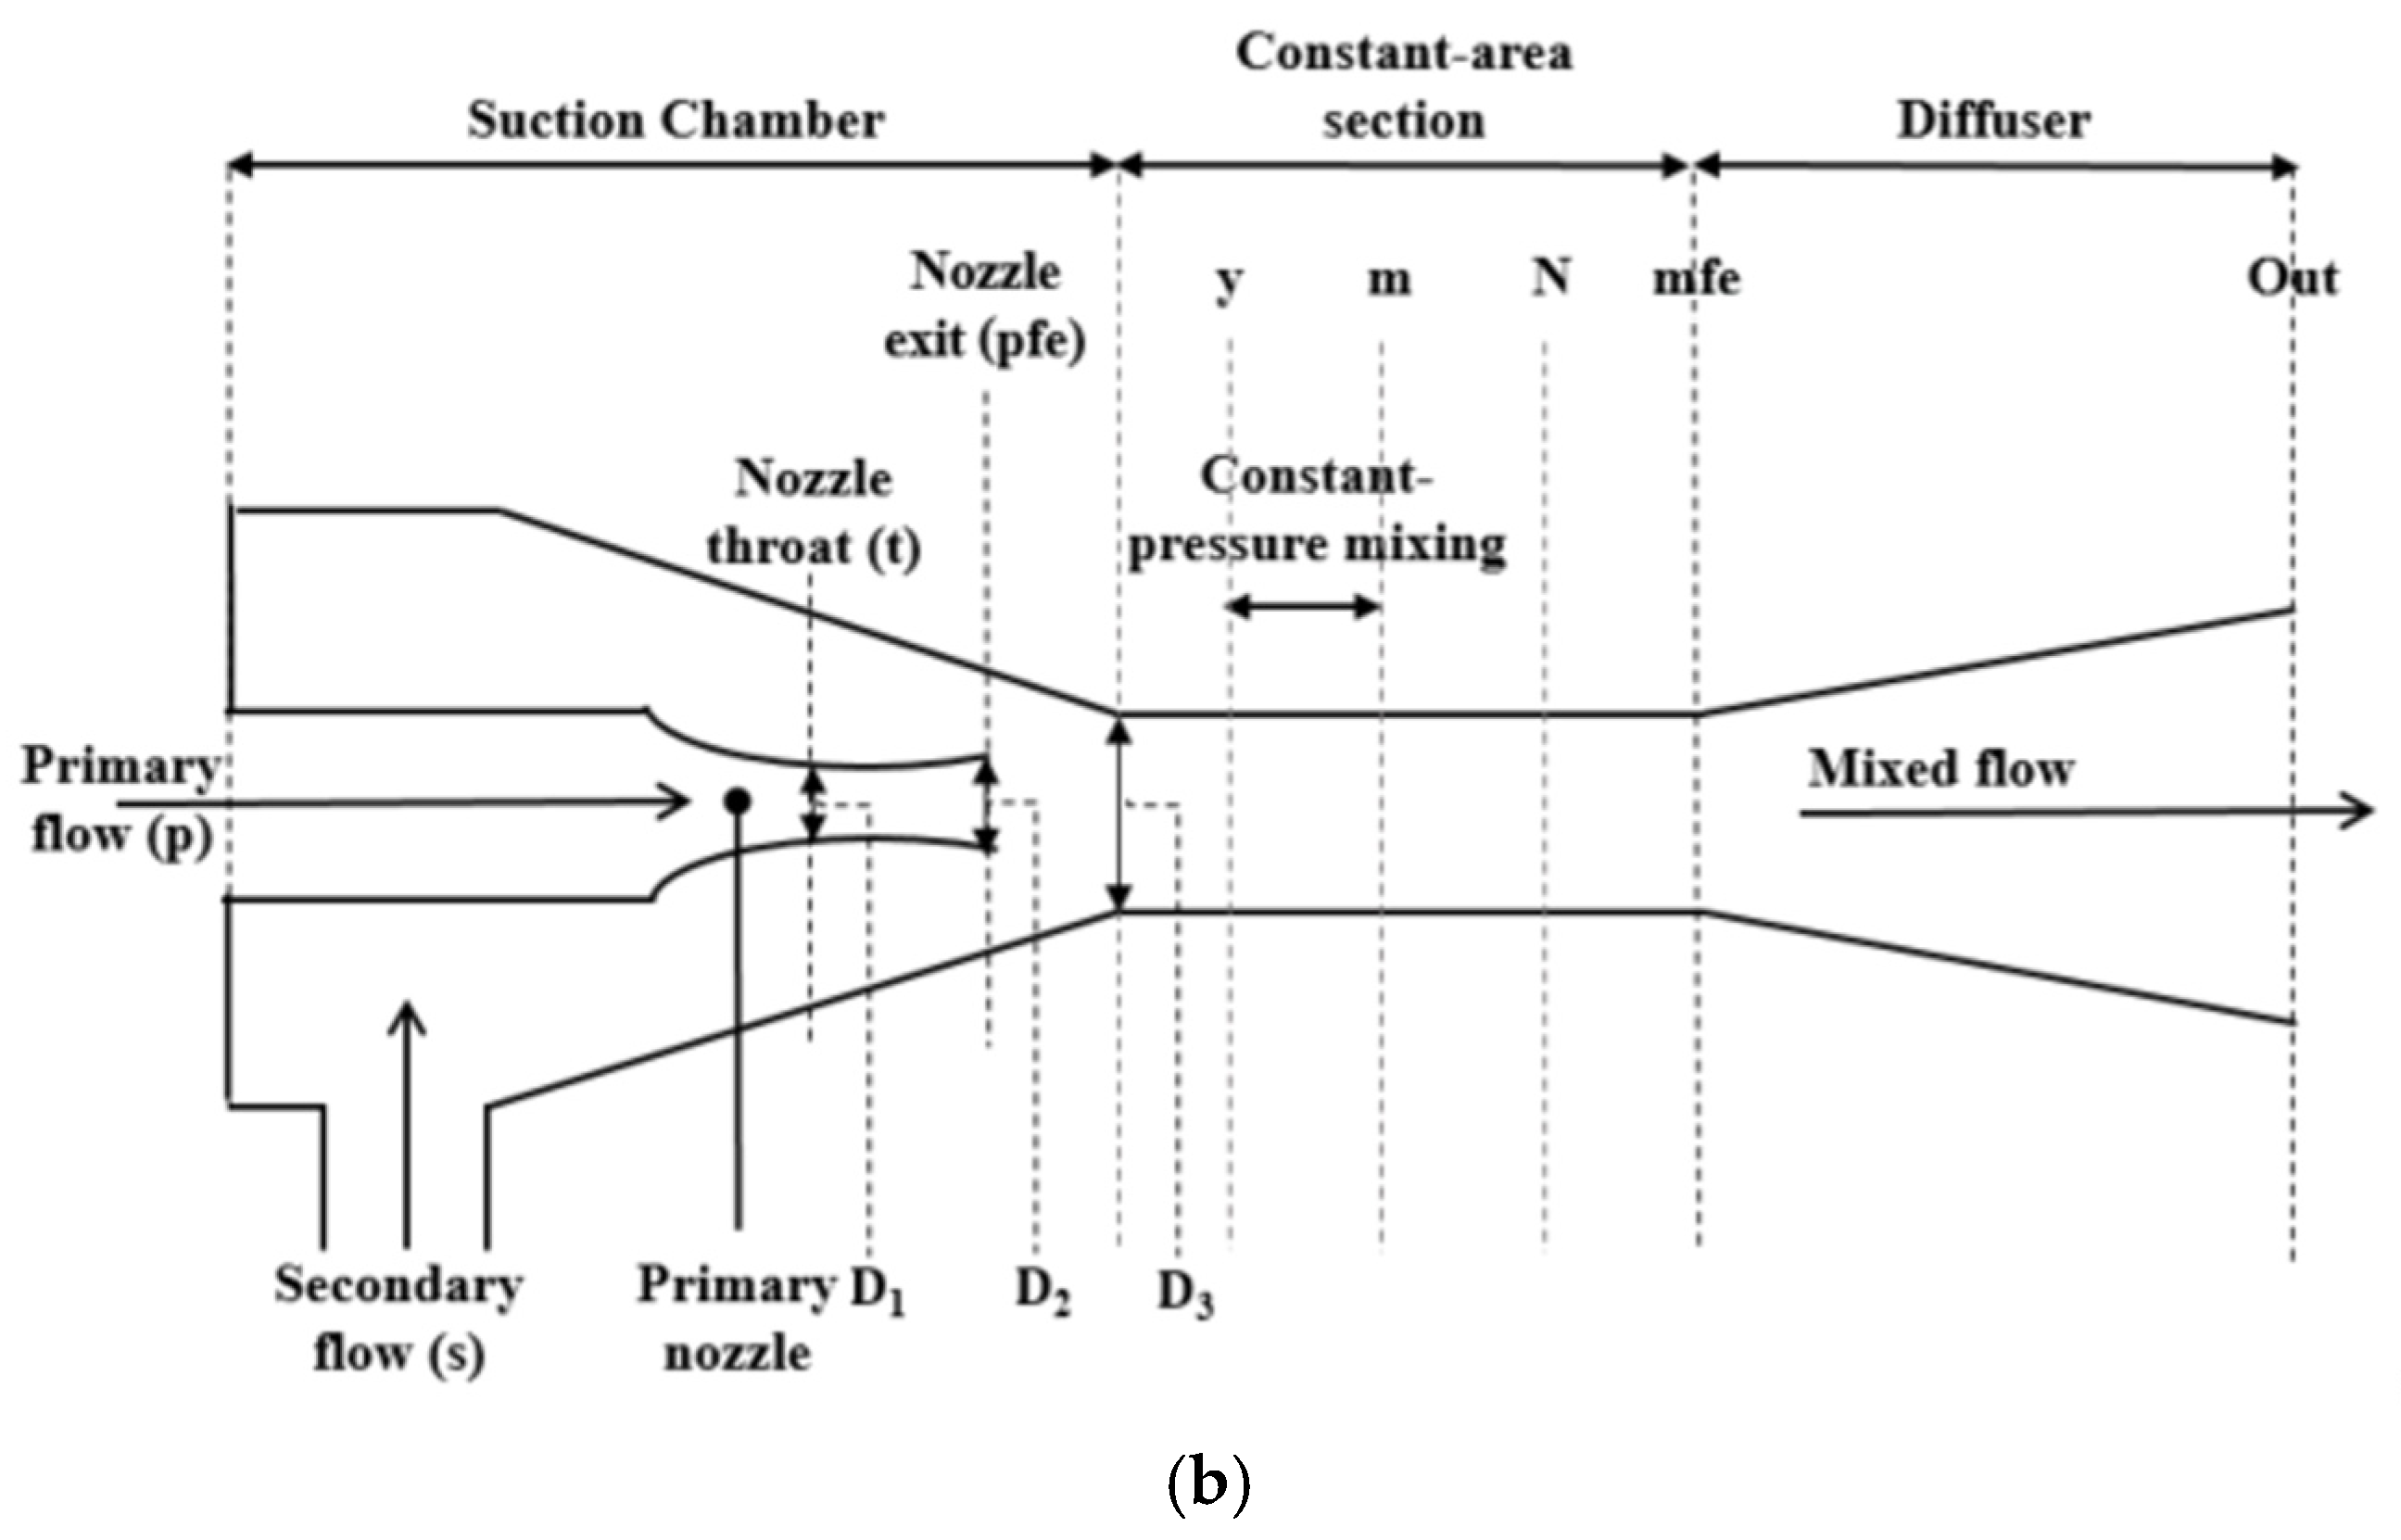
Figure 2.
Monthly cooling load distribution of small-scale building air conditioning application.

Figure 4.
Comparison of ejector critical back pressure and entrainment ratio predictions in critical operation mode as a function of primary and secondary flow pressures and temperatures, critical condenser inlet pressure and temperature, and ejector primary nozzle geometrical parameters, with the corresponding experimental data of Huang et al. [21], and numerical data of Chen et al. [20,57], for R141b. AA, AB, AC, AD, AG, EC, ED, EE, EF, EG, and EH refer to the ejector geometries of Huang et al. [21].

Figure 5.
Comparison of ejector critical entrainment ratio predictions as a function of critical condenser temperature for several primary inlet (generation) and secondary inlet (evaporation) temperatures, with the corresponding experimental and numerical data of Shestopalov et al. [35] for R245fa.
Figure 5.
Comparison of ejector critical entrainment ratio predictions as a function of critical condenser temperature for several primary inlet (generation) and secondary inlet (evaporation) temperatures, with the corresponding experimental and numerical data of Shestopalov et al. [35] for R245fa.
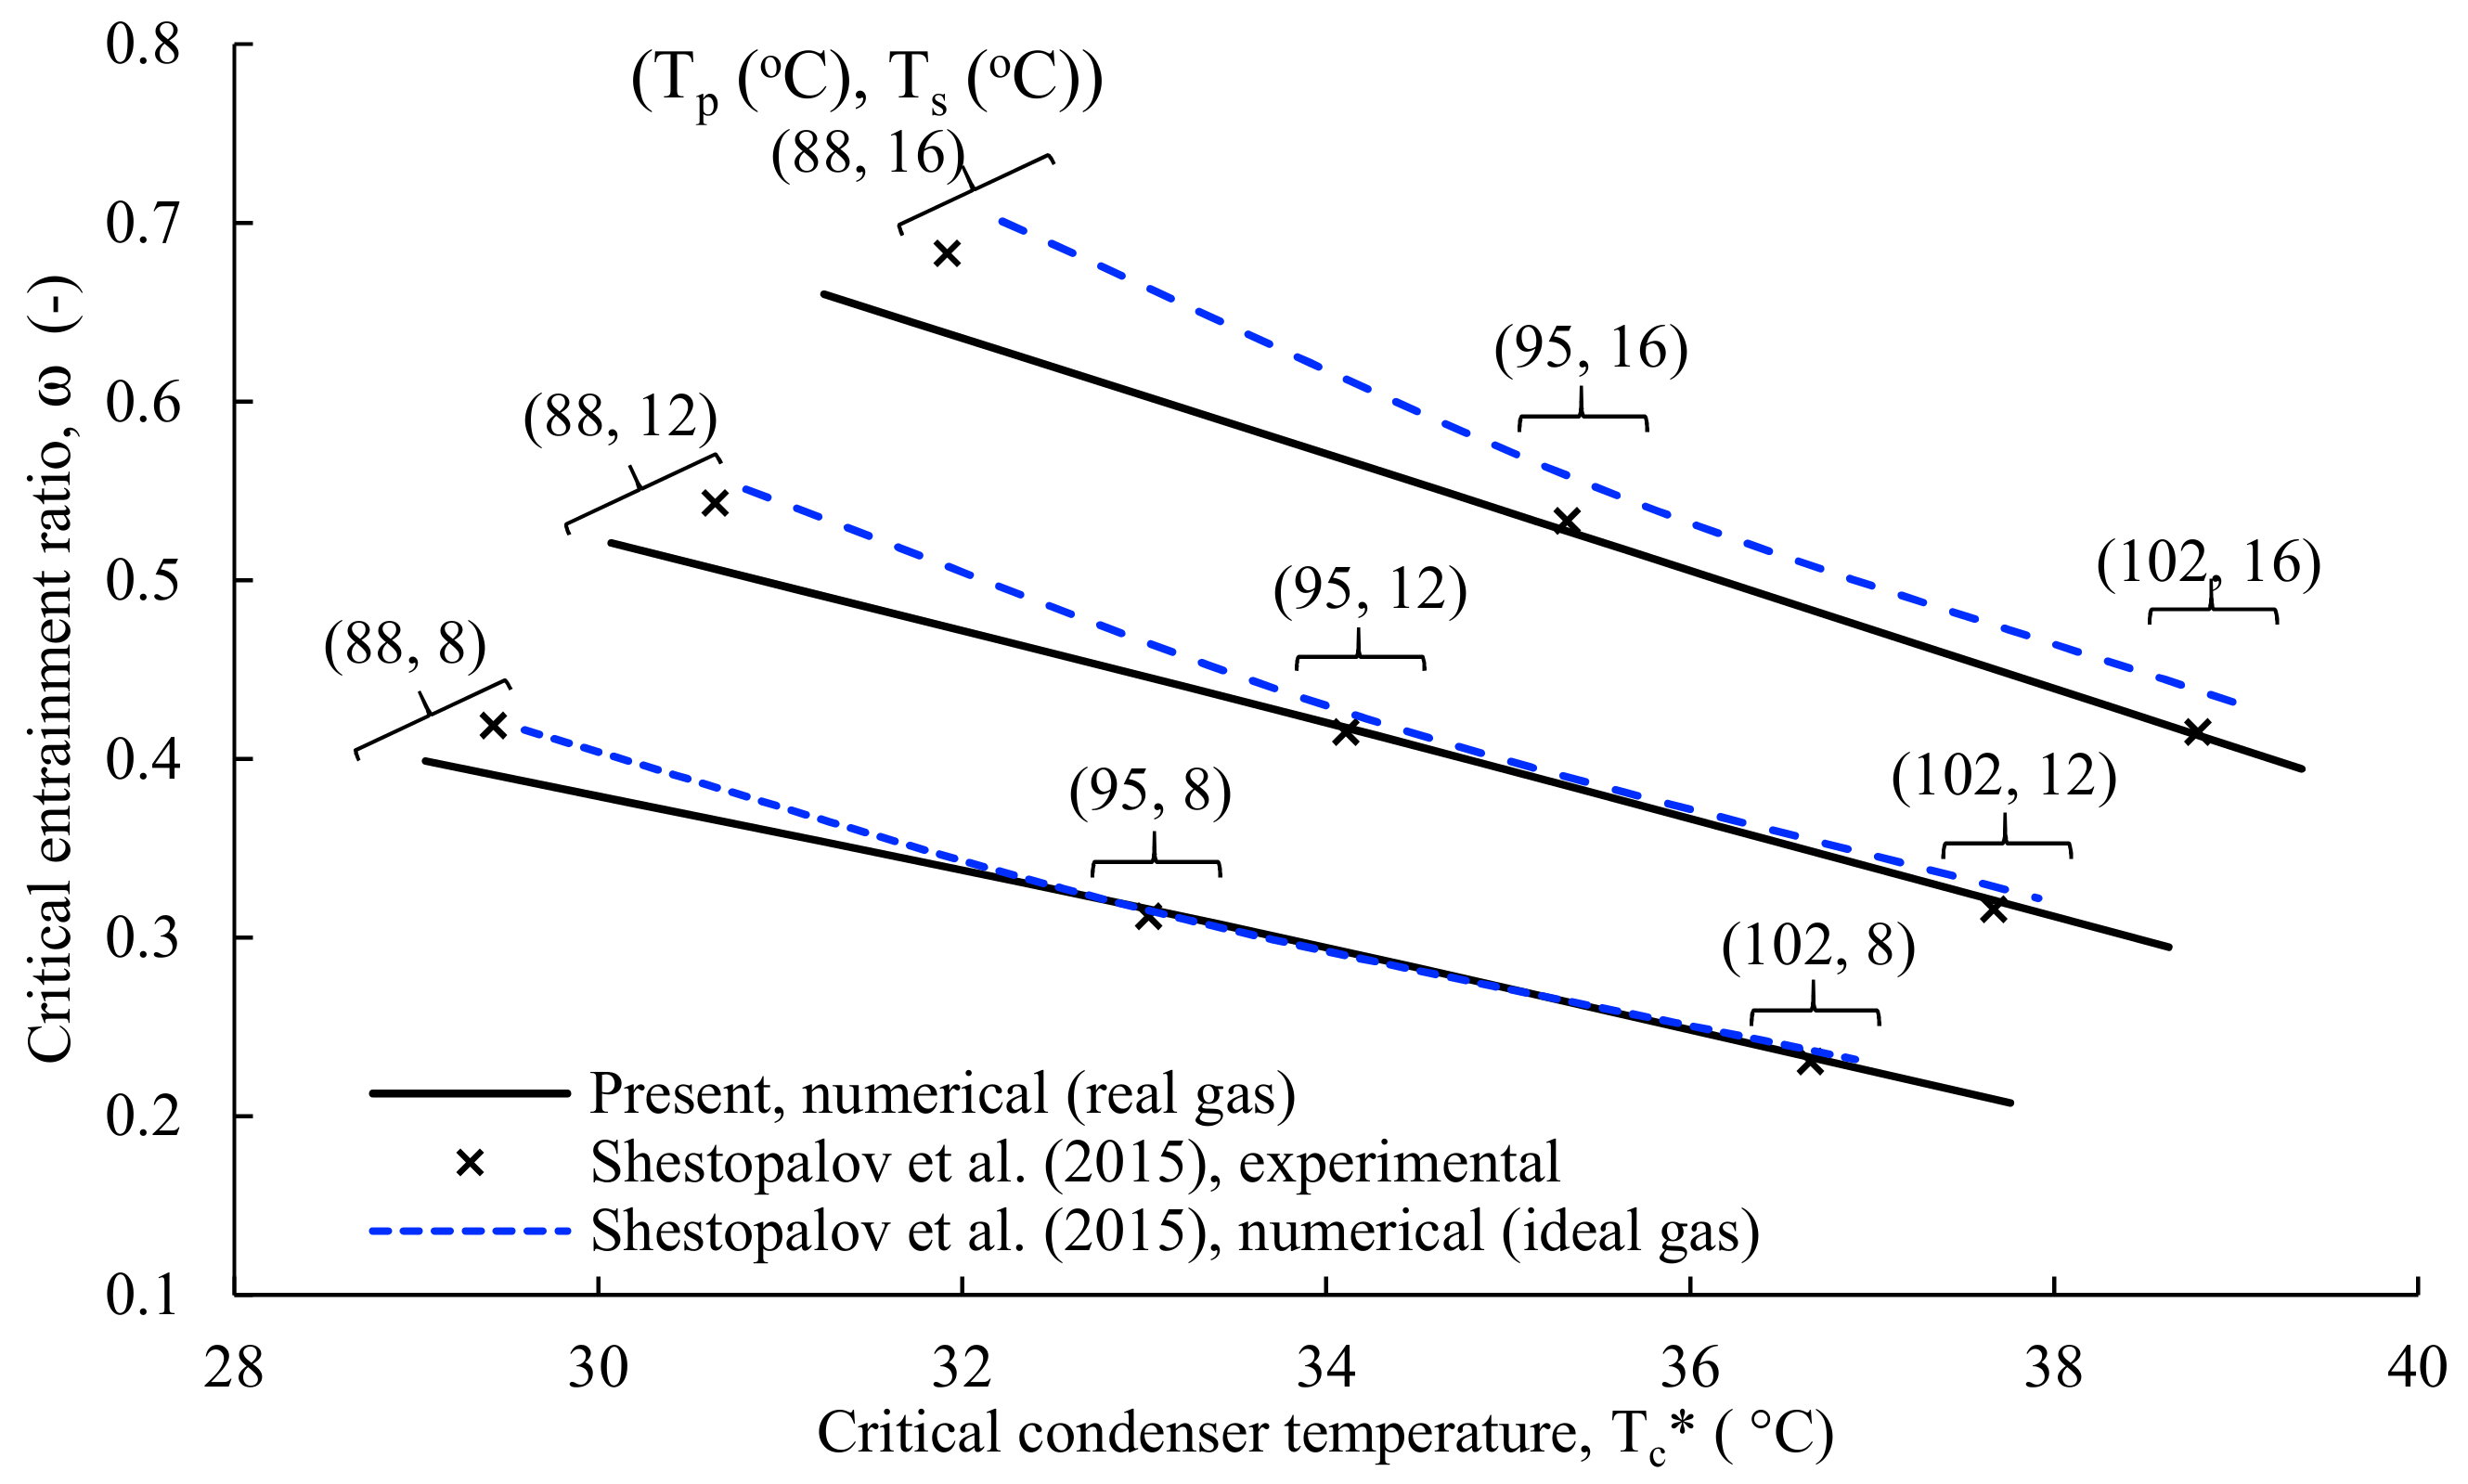
Figure 6.
Comparison of predicted ejector refrigeration system COP in critical mode operation as a function of the evaporator pressure, with the corresponding experimental data of Aphornratana et al. [33], and numerical data of Chen et al. [20], at a generation (i.e., primary flow inlet) temperature of 110 °C and condenser pressure of either (a) 160 kPa or (b) 170 kPa.
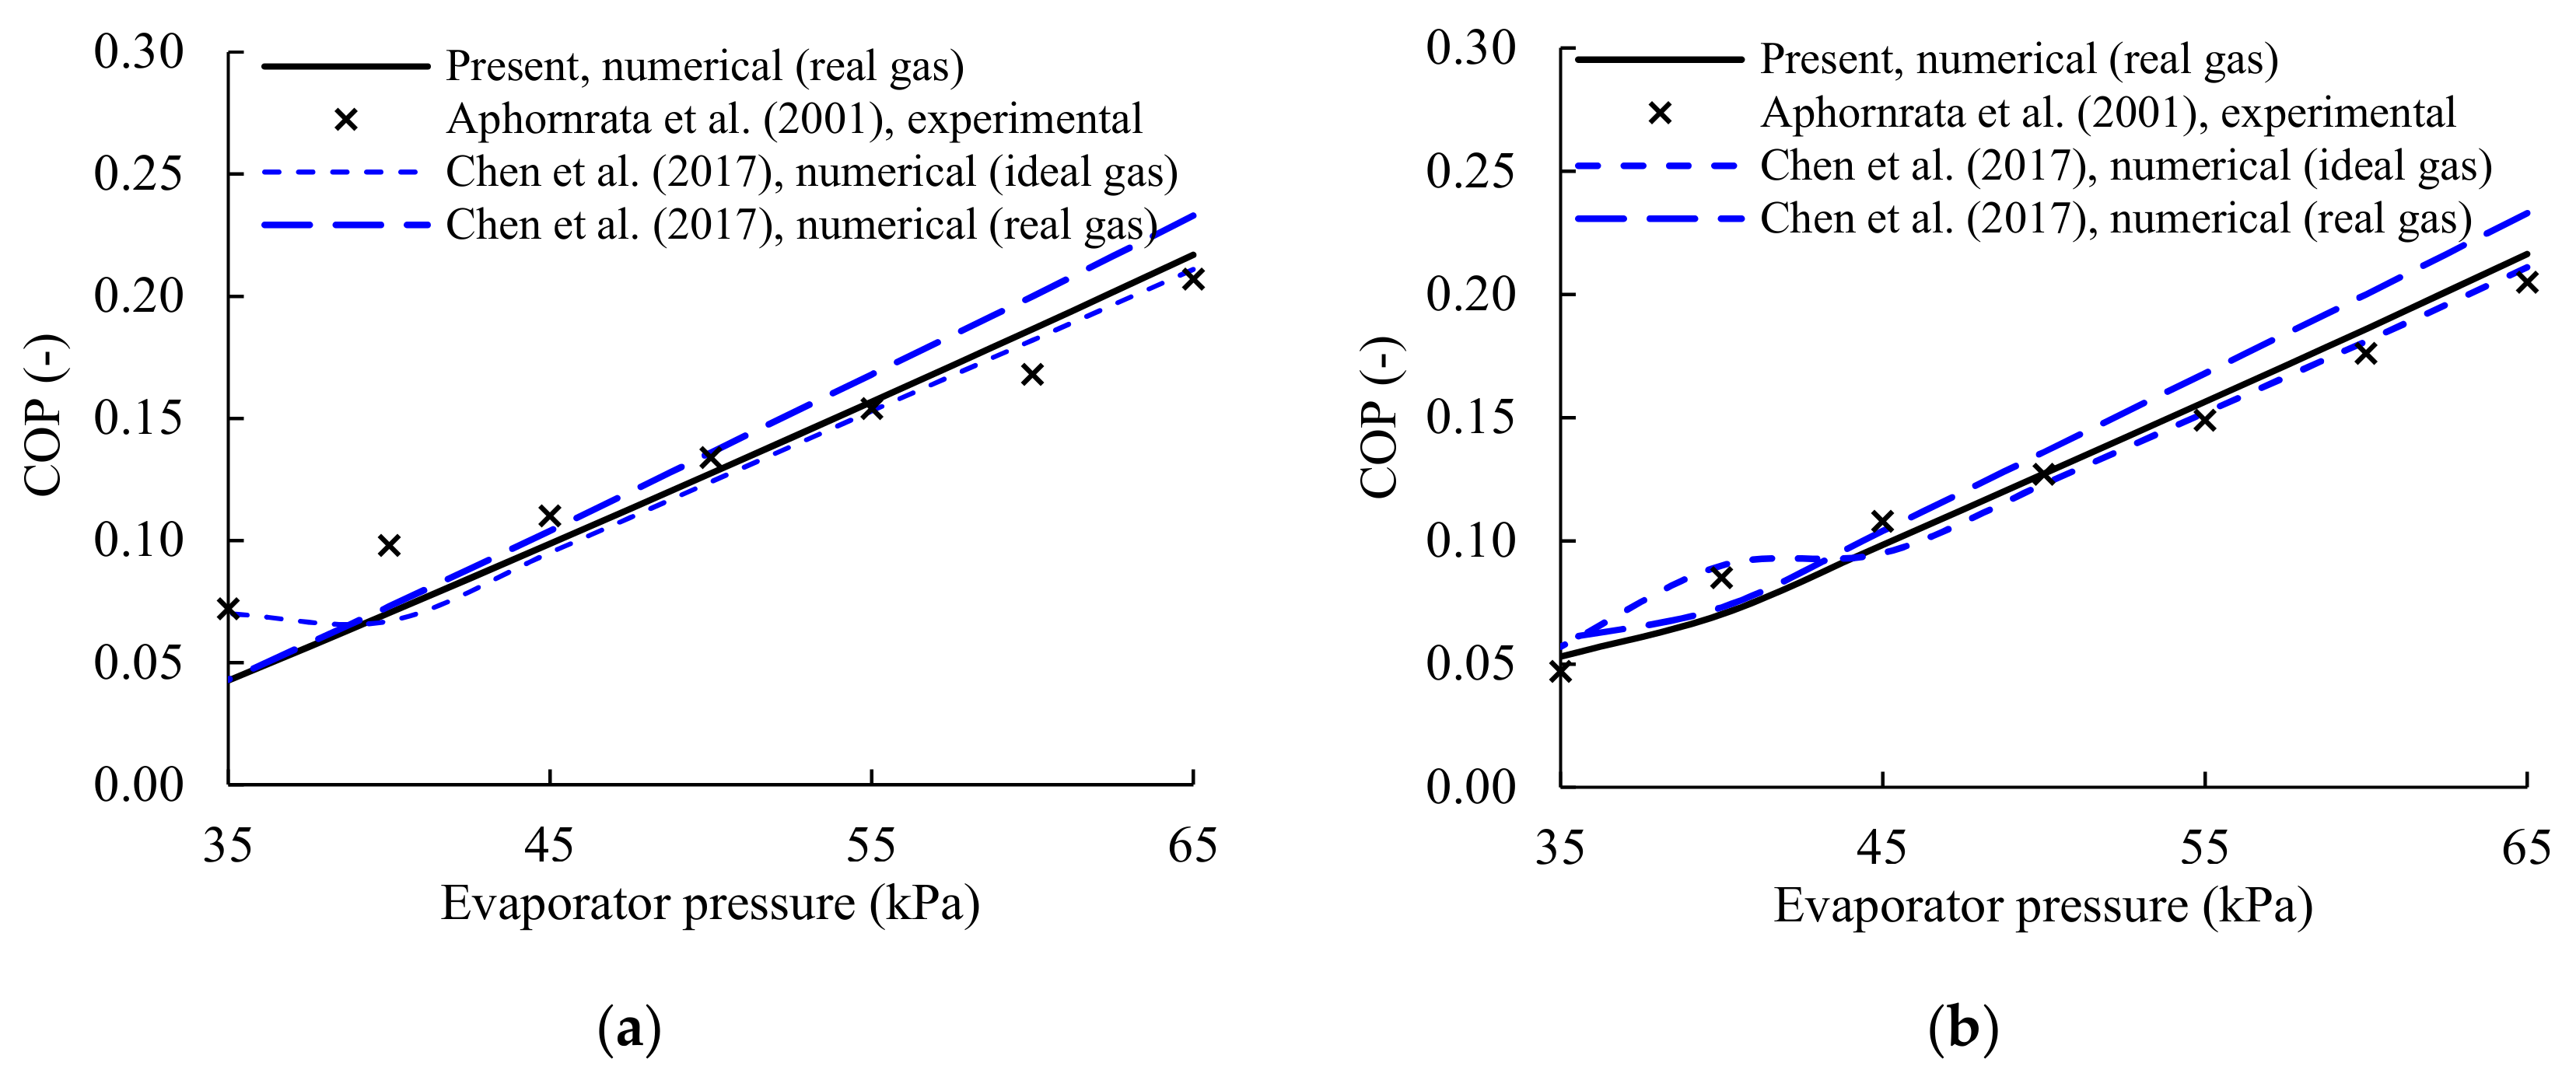
Figure 7.
Entrainment ratio and overall refrigeration sub-system COP for each ejector sub-cycle in Figure 1b. SC = simple ejector cycle. BAC = booster-assisted ejector cycle.
Figure 7.
Entrainment ratio and overall refrigeration sub-system COP for each ejector sub-cycle in Figure 1b. SC = simple ejector cycle. BAC = booster-assisted ejector cycle.

Figure 8.
System monthly solar fractions for FP and ET collectors. ET = evacuated tube. FP = flat plate.
Figure 8.
System monthly solar fractions for FP and ET collectors. ET = evacuated tube. FP = flat plate.

Figure 9.
Sensitivity of refrigeration sub-system cooling capacity as a function of the evaporator and primary flow inlet (generation) temperature for the simple Ejector A cycle and the compression-assisted Ejector C cycle with R245fa as the working fluid, normalized to a baseline capacity of Tp = 85 °C and Te = 10 °C: (a) Ejector A (SC); (b) Ejector C (BAC).
Figure 10.
Sensitivity of the ejector entrainment ratio and refrigeration sub-system overall COP to the evaporator and primary flow inlet (generation) temperature for the simple Ejector A cycle and the compression-assisted Ejector C cycle with R245fa as the working fluid, normalized to a baseline entrainment ratio and overall COP of Tp = 85 °C and Te = 10 °C: (a) Ejector A (SC); (b) Ejector C (BAC).

Figure 11.
Sensitivity of the refrigeration sub-system exergy efficiency to the evaporator and primary flow inlet (generation) temperatures for the simple Ejector A cycle and compression-assisted Ejector C cycle with R245fa as the working fluid, normalized to a baseline exergy efficiency of Tp = 85 °C and Te = 10 °C: (a) Ejector A (SC); (b) Ejector C (BAC).

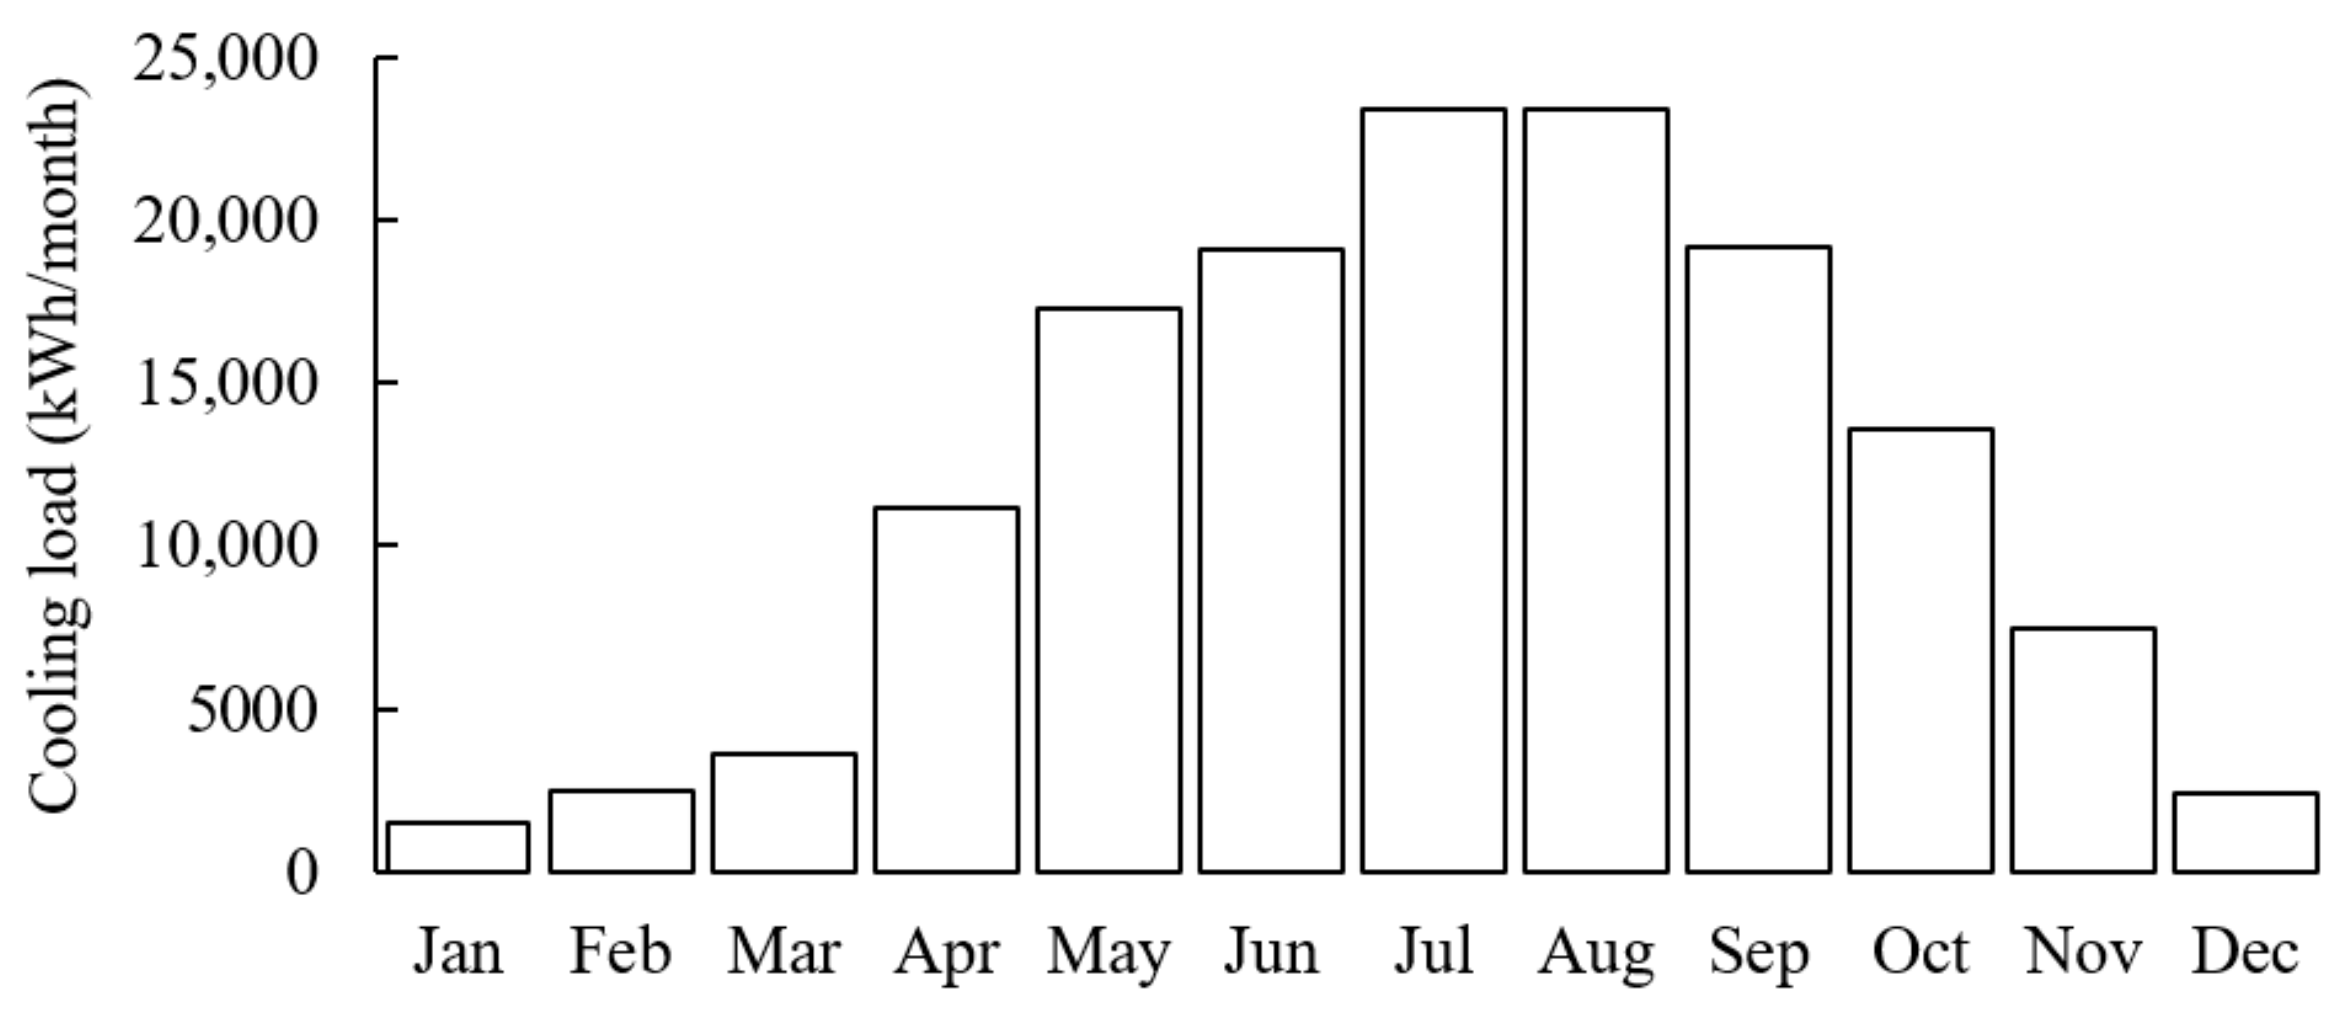
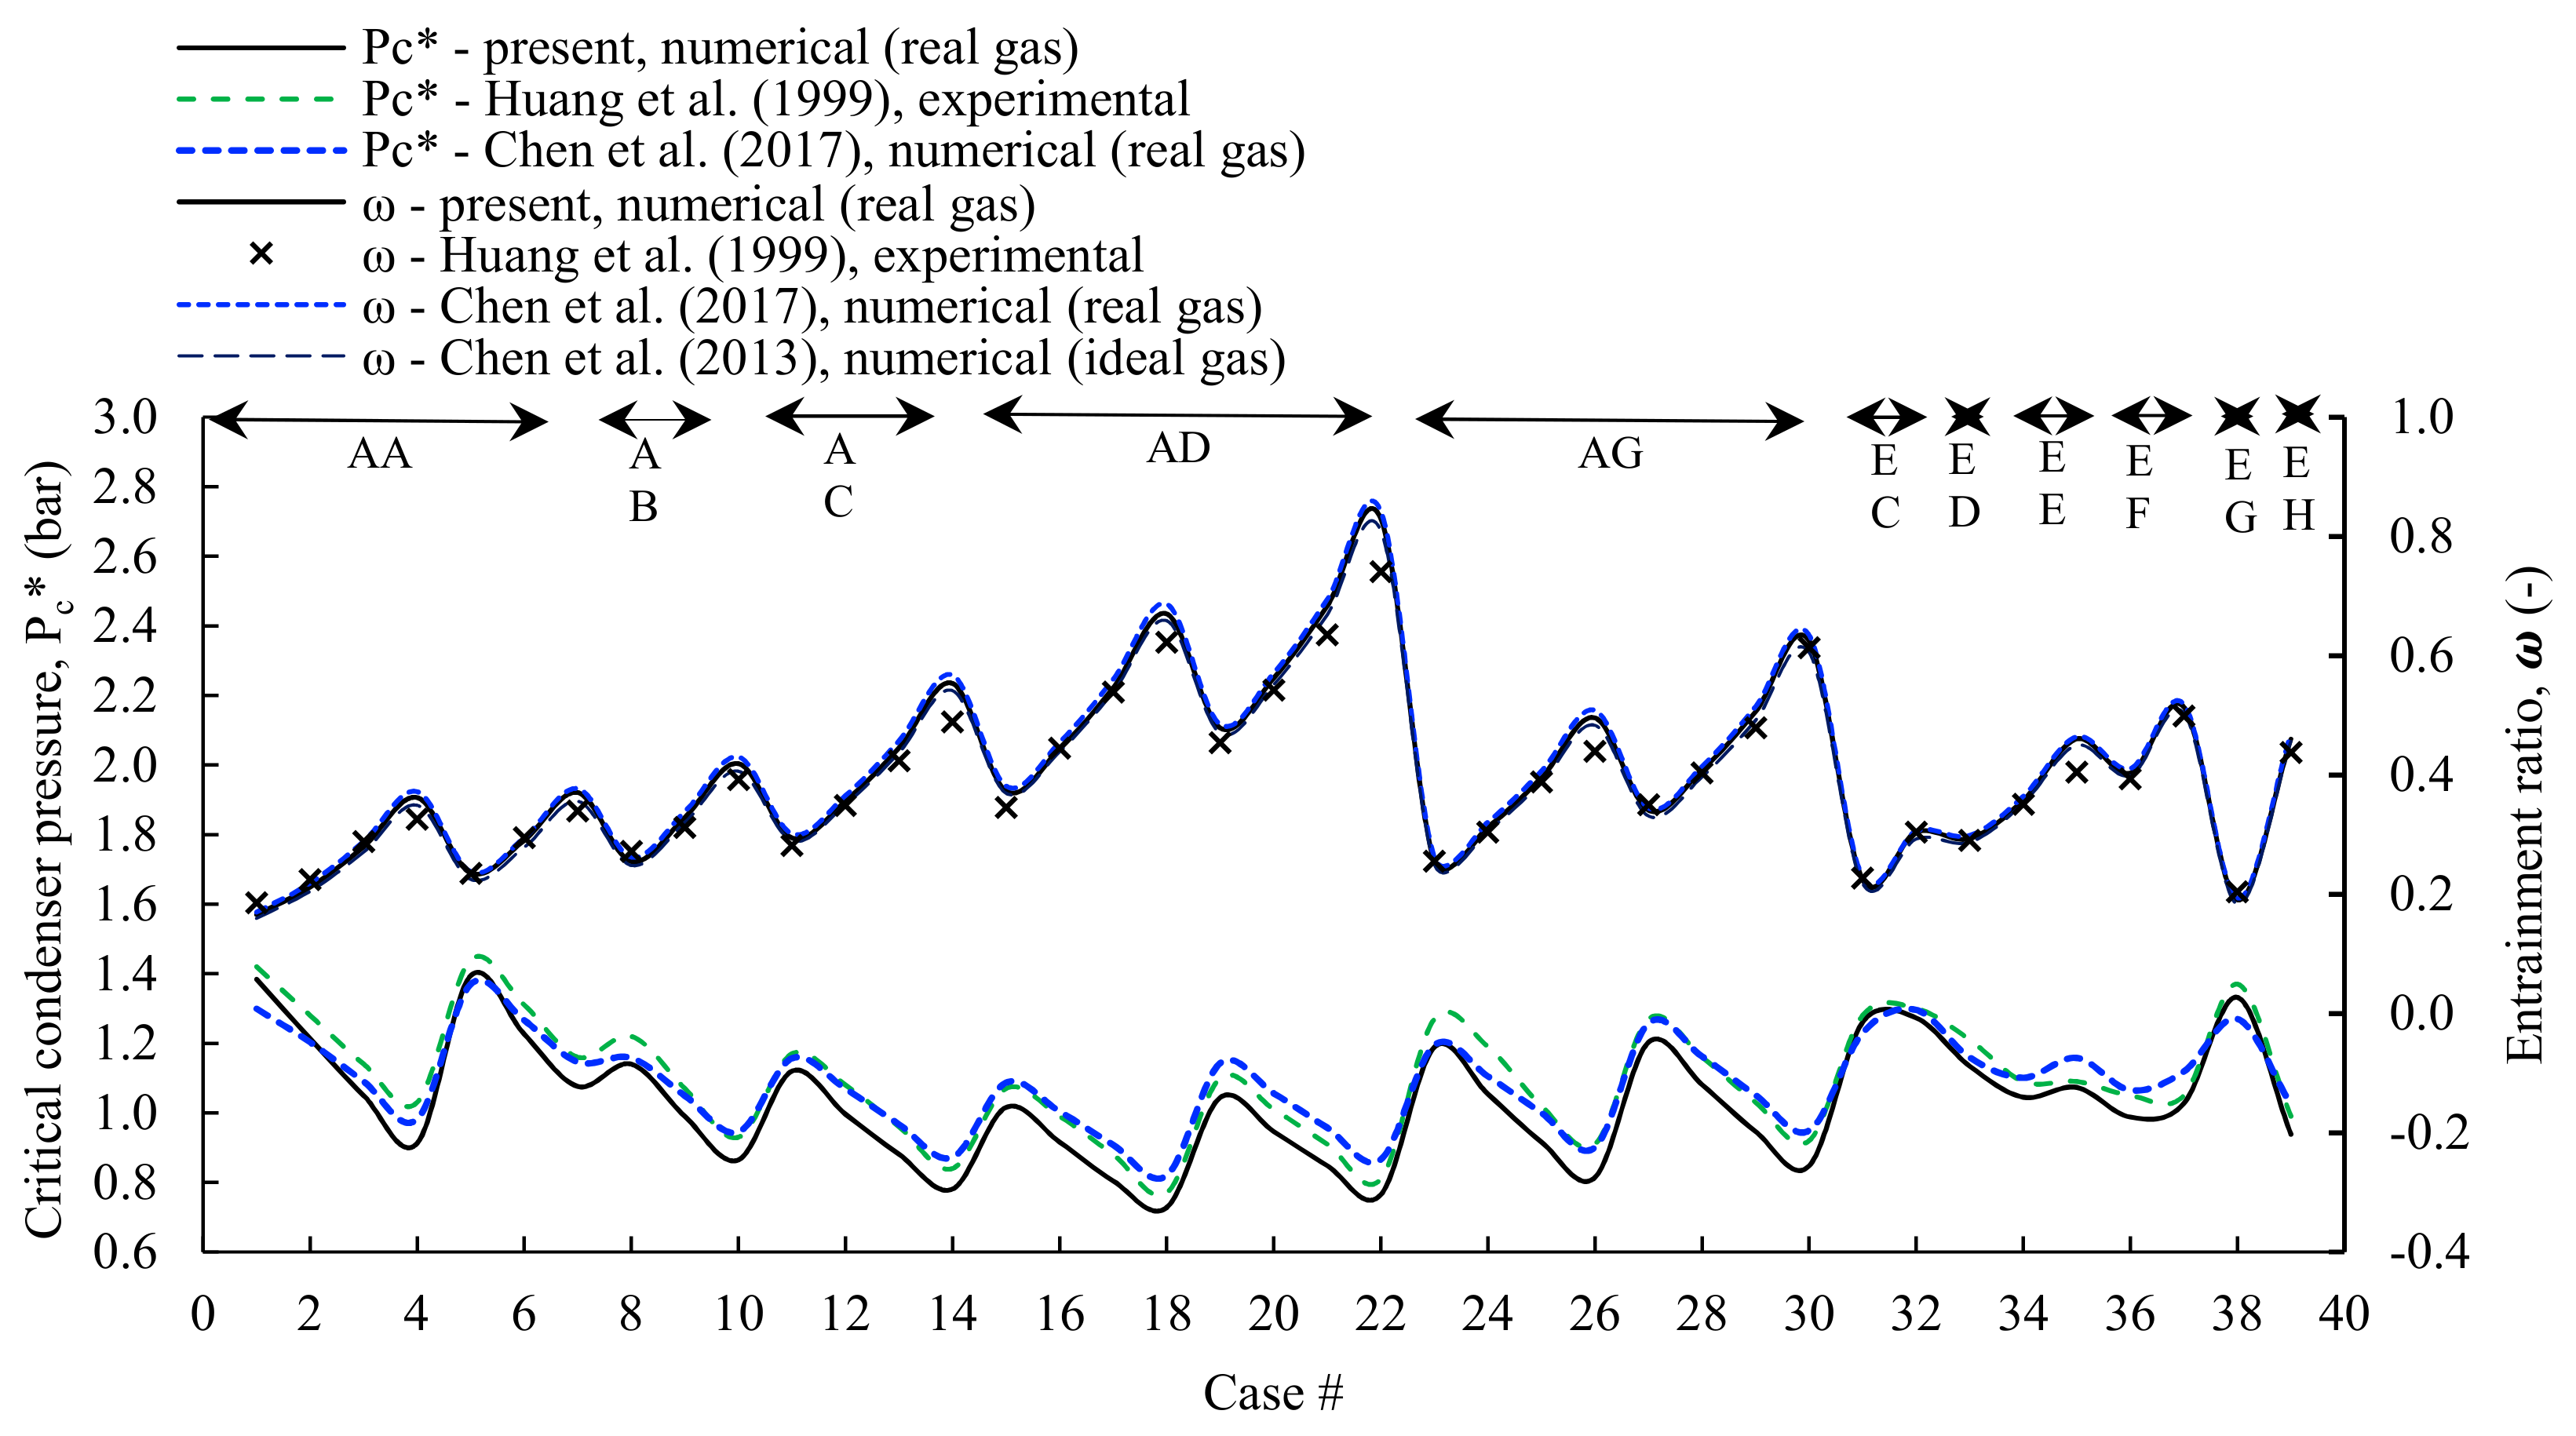
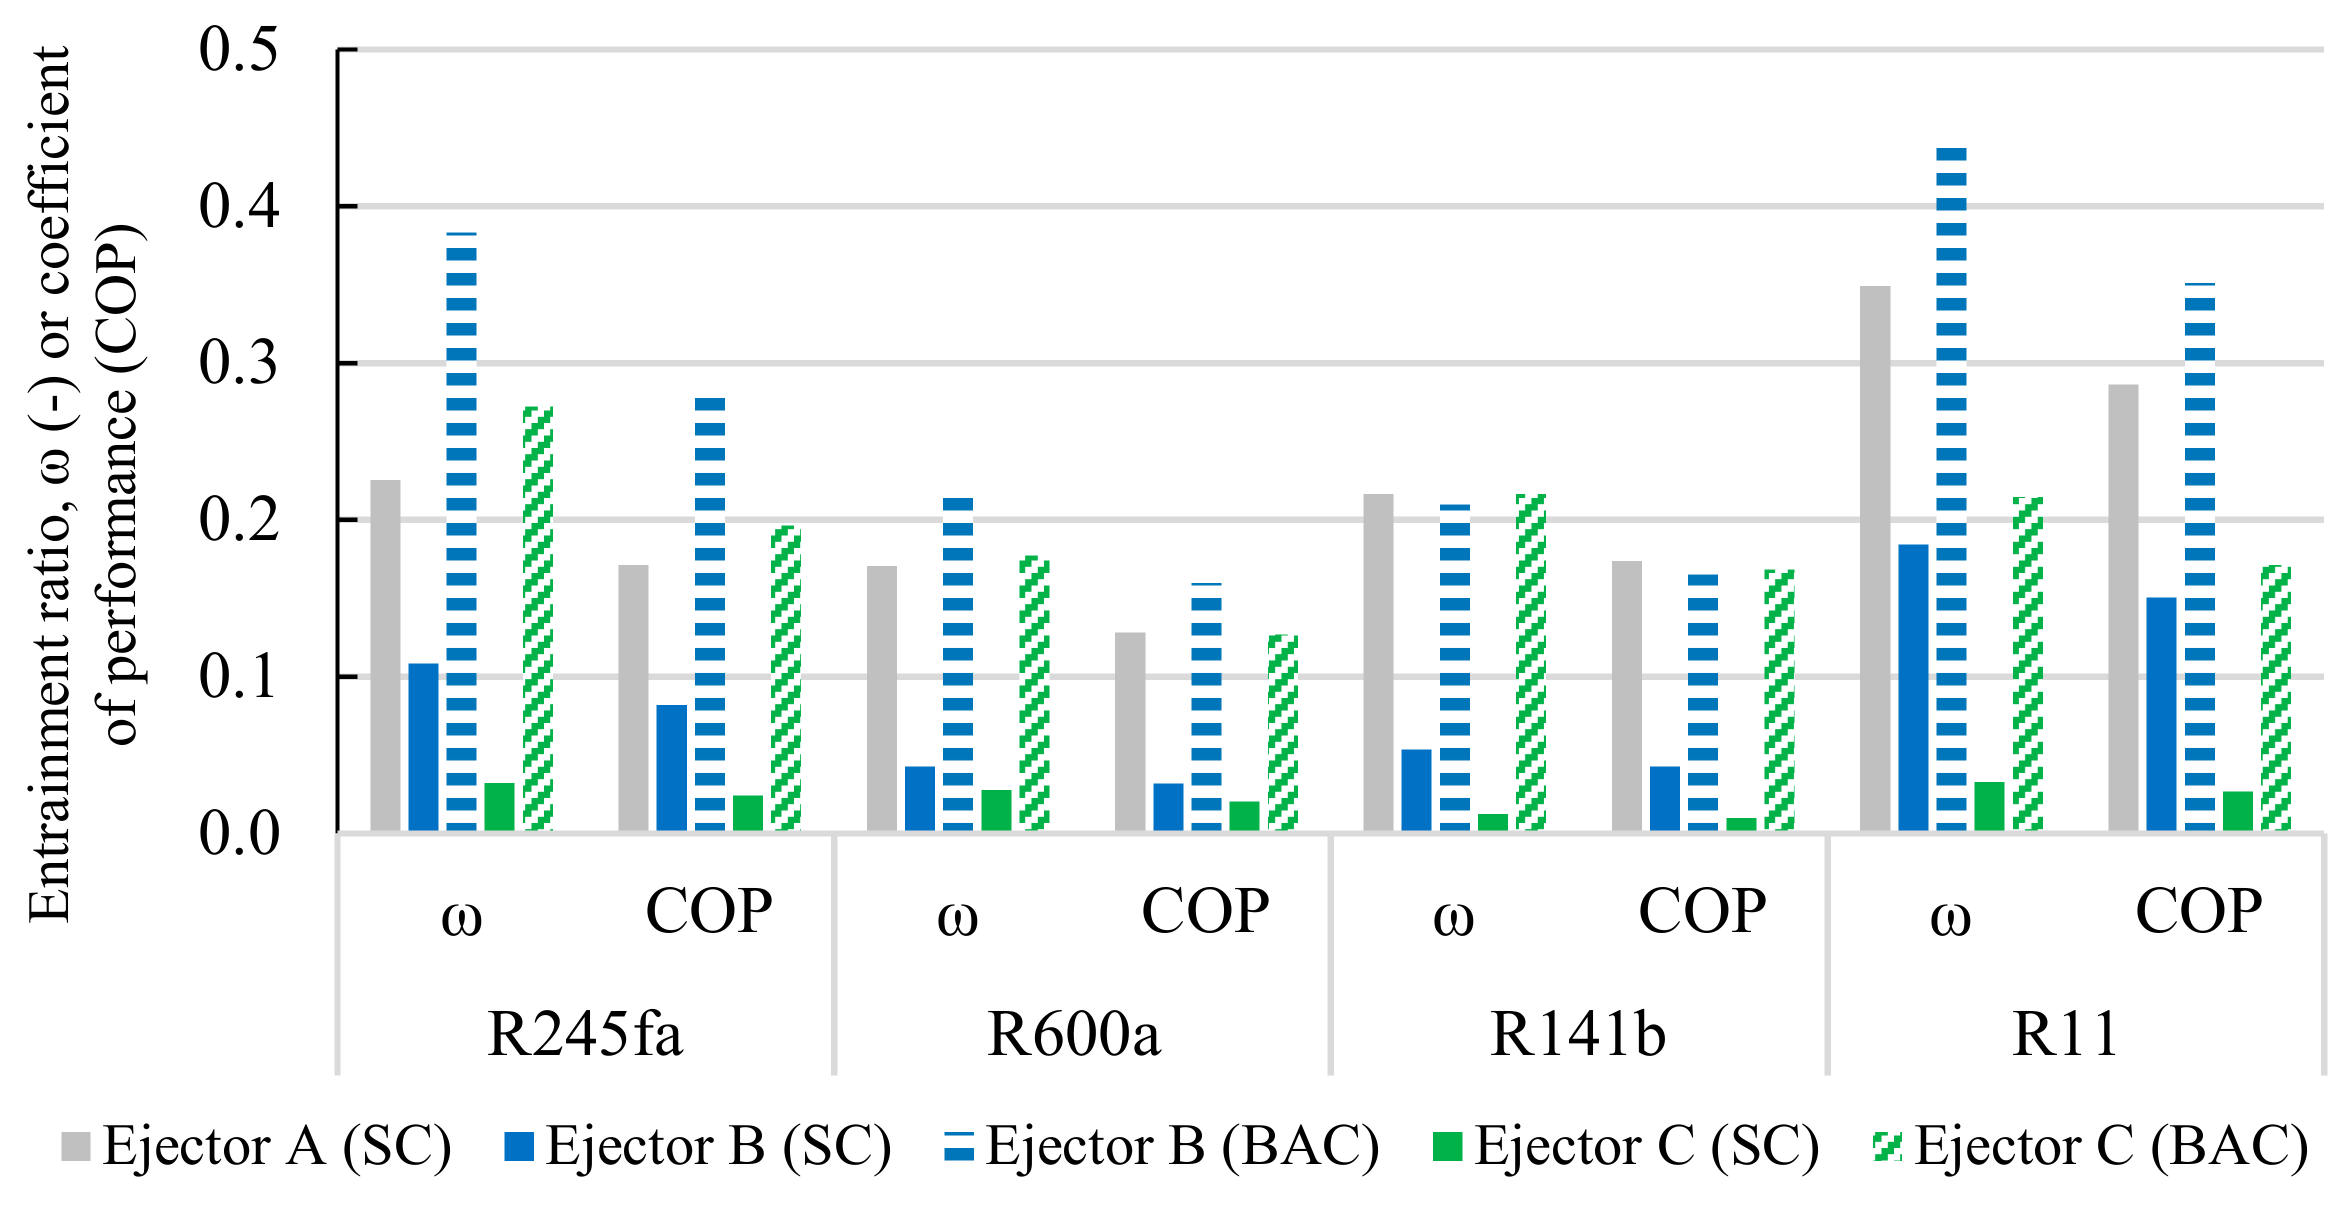
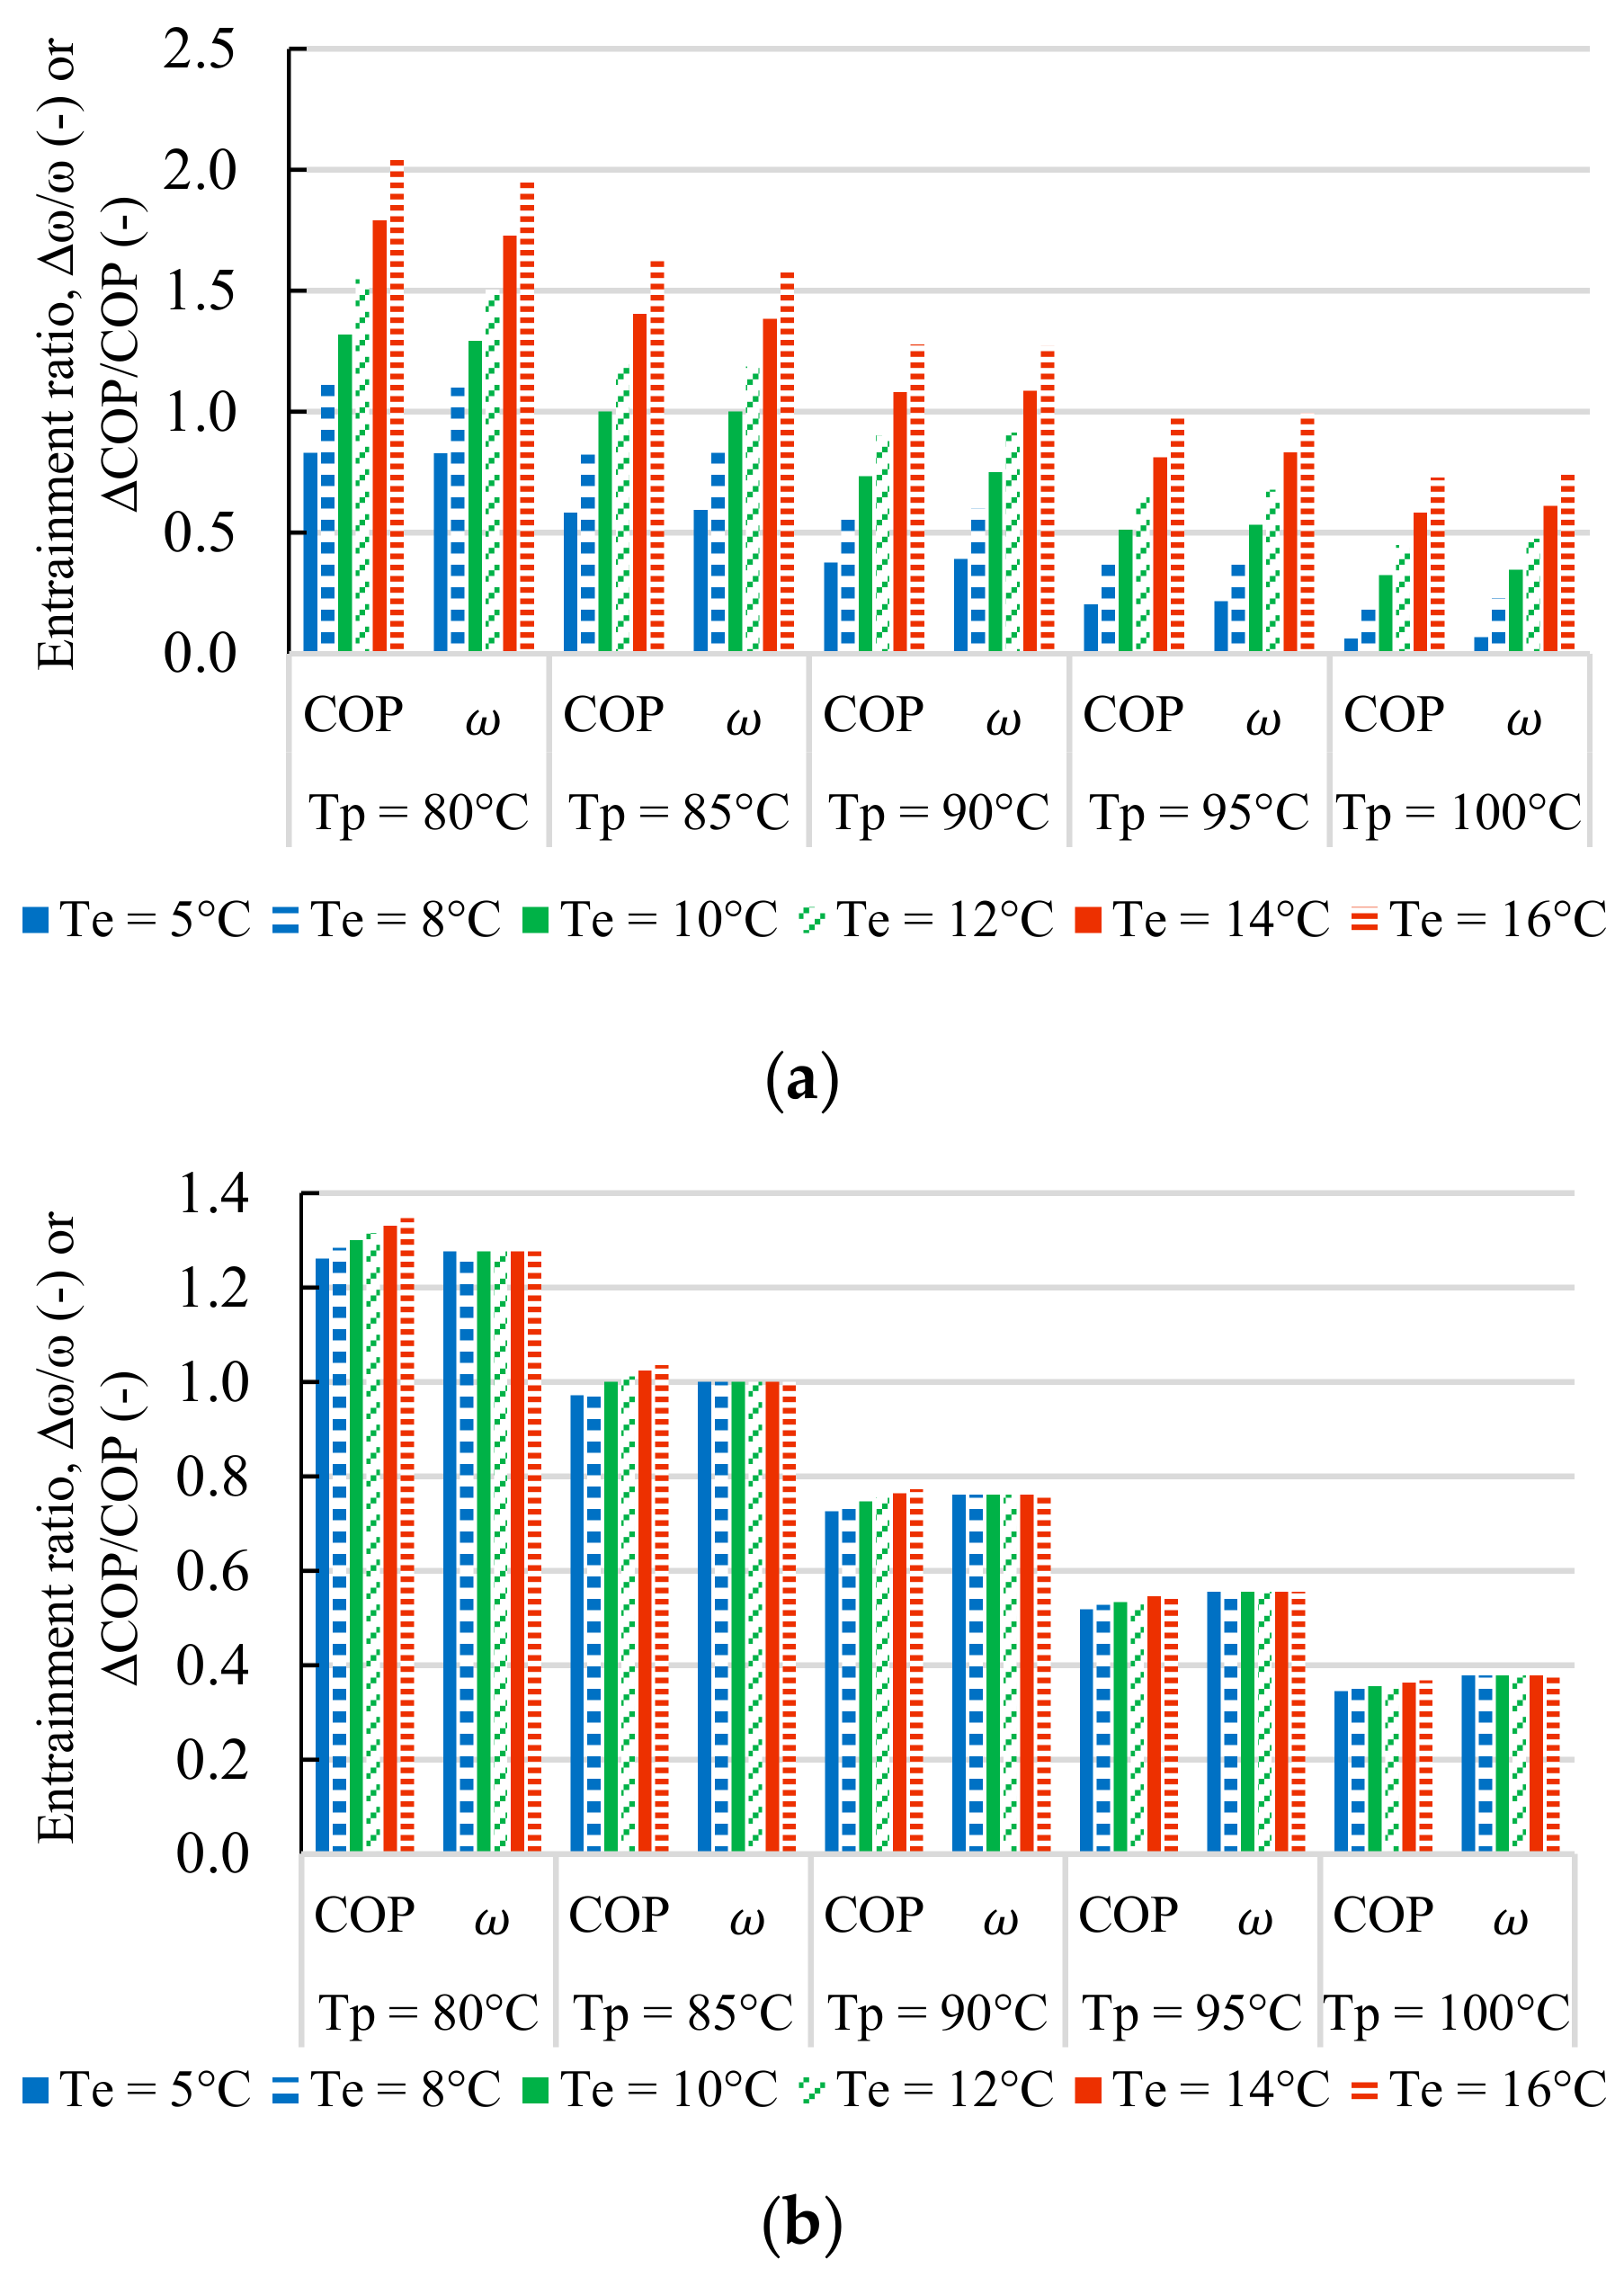
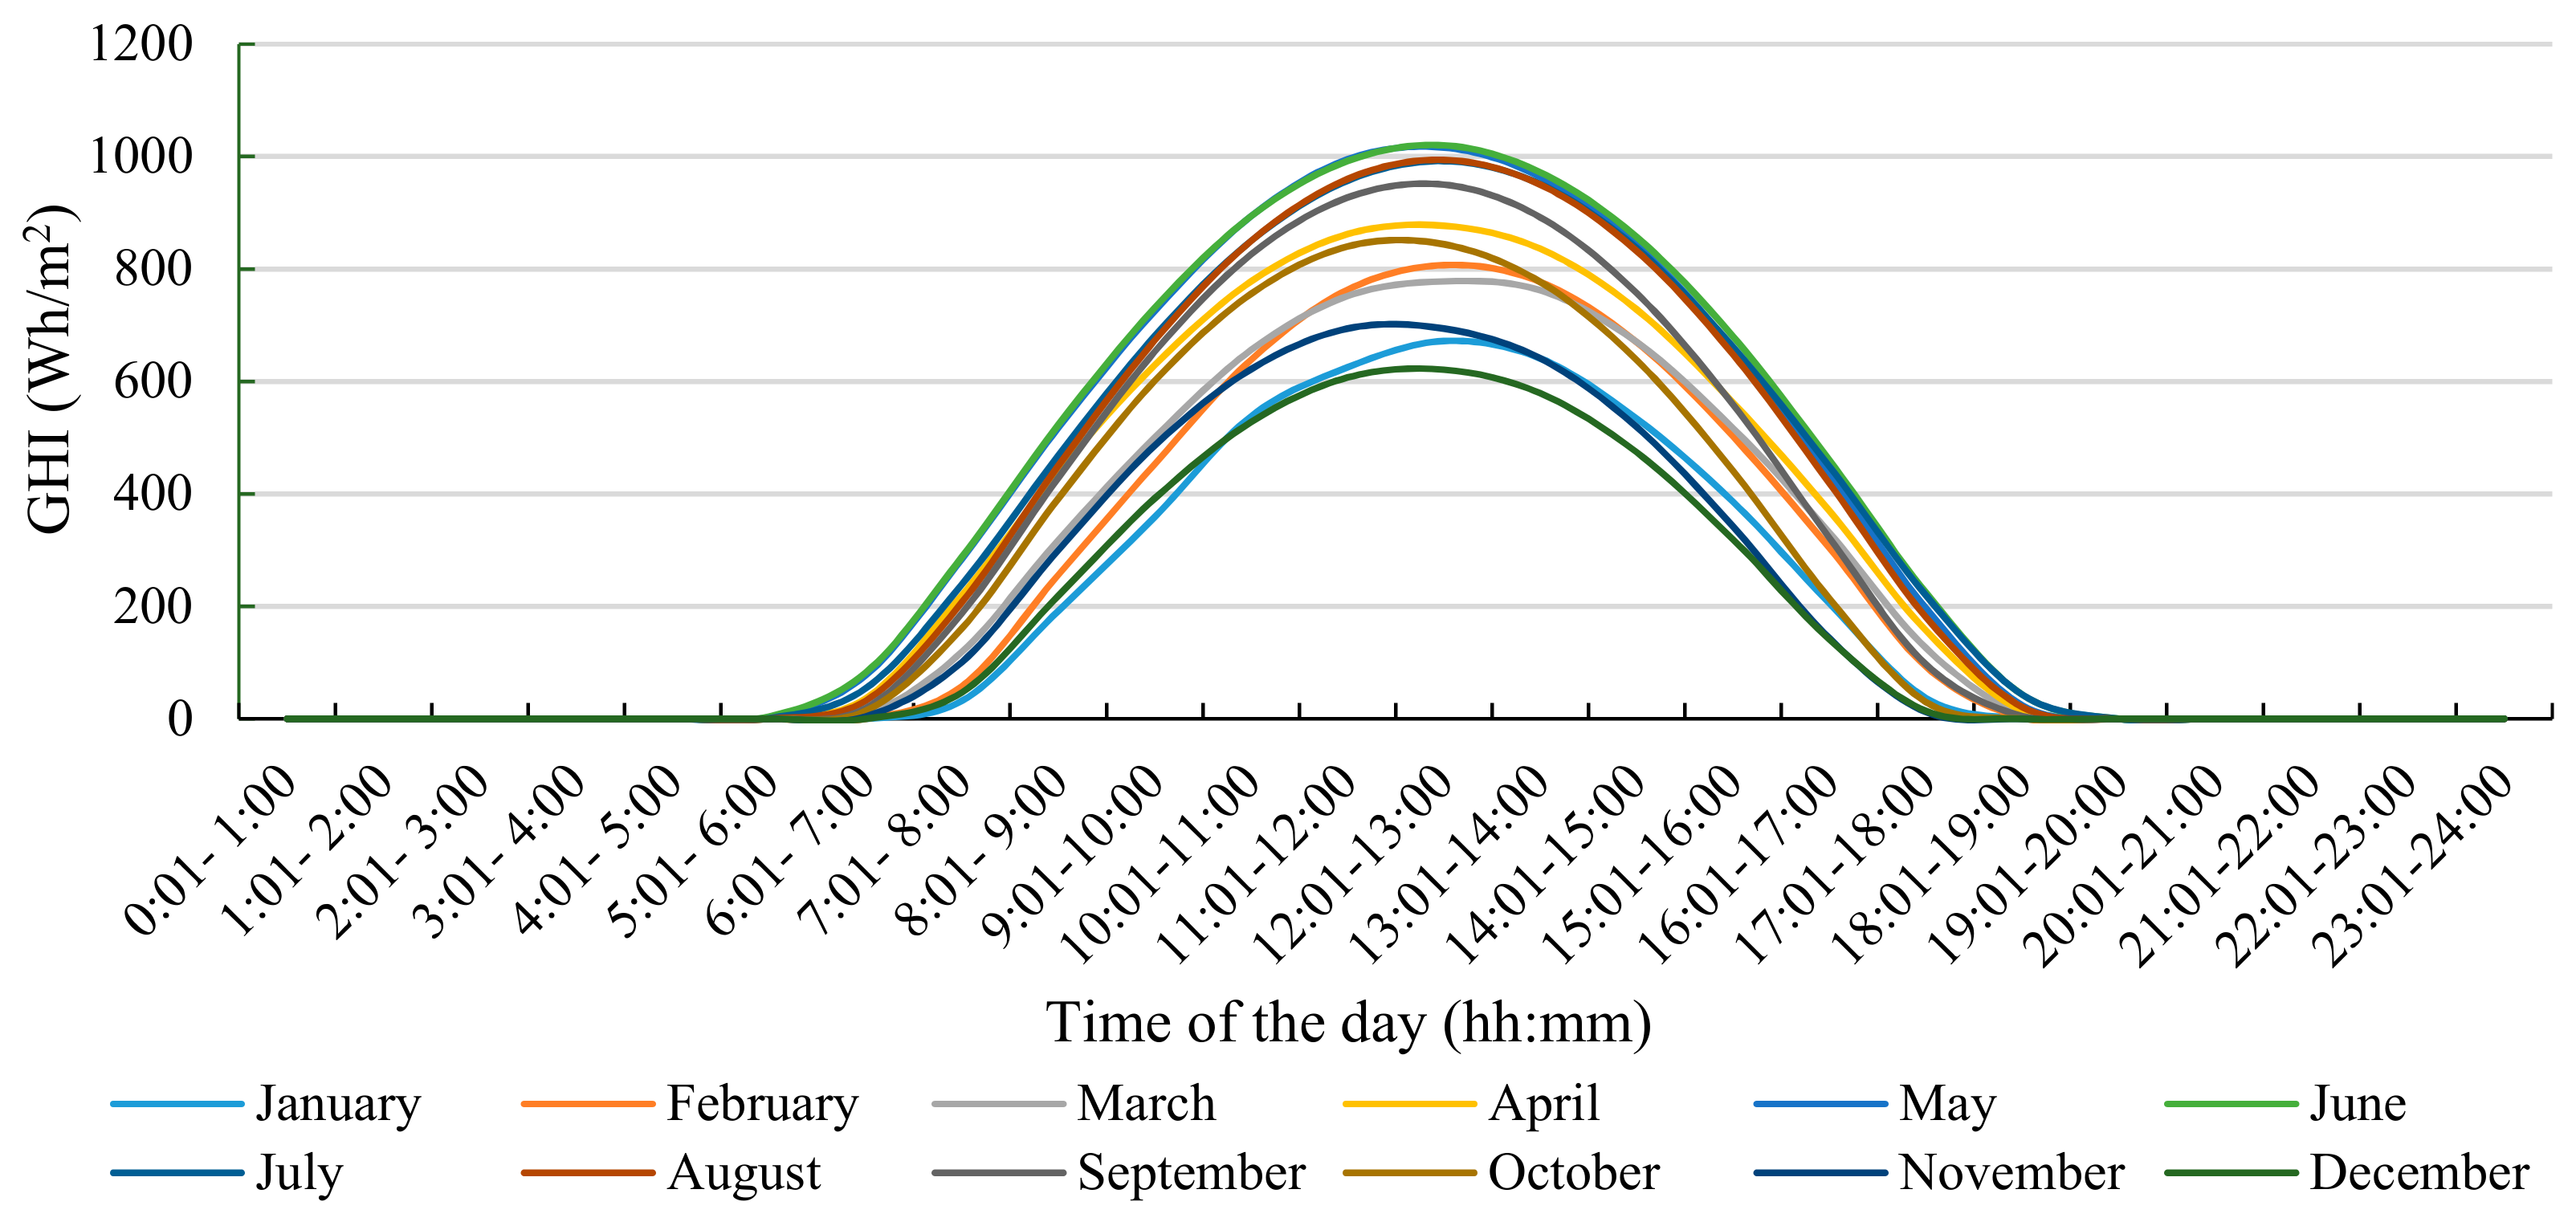
Table 1.
Thermodynamic, safety, and environmental properties of candidate refrigerants for the solar-assisted refrigeration system [13,30].
| Working Fluid | Molecular Structure | M (g/mol) | TC (°C) | Pc (MPa) | Tsat at 1 atm (°C) | Safety | AL (year) | ODP (-) | GWP (-) |
|---|---|---|---|---|---|---|---|---|---|
| R11 | CCL3F | 137.37 | 198 | 4.41 | 23.7 | A1 | 45 | 1 | 4600 |
| R141b | CH3CCL2F | 116.95 | 204.2 | 4.25 | 32 | - | 9.3 | 0.086 | 700 |
| R245fA | CHF2CH2CF3 | 134.05 | 154.1 | 4.43 | 15.1 | B1 | 7.2 | 0 | 950 |
| R600a | CH(CH3)2-CH3 | 58.12 | 134.7 | 3.64 | −11.7 | A3 | - | 0 | ∼20 |
Note: AL = atmospheric life. GWP = global warming potential (100 year). M = molecular weight. ODP = ozone depletion potential. Pc = critical pressure. Tc = critical temperature. Tsat = saturation temperature. Safety classification as per ASHRAE [44].
Table 2.
Input modeling parameters for the refrigeration sub-system and ejector assembly.
| Parameter and Unit | Value |
|---|---|
| Refrigeration sub-system | |
| Generator refrigerant outlet temperature, Tg (°C) | 85 (range of variation: 80−100) [18,20,21,35,48] |
| Evaporator refrigerant outlet temperature, Te (°C) | 10 (range of variation: 5−16) [18,20,21,25,35,48] |
| Minimum temperature difference (°C) | |
| Generator | 10 [25,36] |
| Condenser | 3 [32] |
| Ejector | |
| Primary nozzle exit to throat effective area diameter ratio, D2/D1 (-) 1 | 1.7 [20,21] |
| Isentropic efficiency coefficient for primary nozzle, (-) | 0.95 [25,35,47] |
| Isentropic efficiency coefficient from nozzle exit to section y, (-) | 0.88 (this study, based on [20,35]) |
| Isentropic efficiency coefficient for secondary, flow (-) | 0.85 [20,47] |
| Frictional loss coefficient in mixing section, (-) | 0.86 (this study, based on [17,20,25]) |
| Booster compressor pressure ratio (-) 2 | 1.7 (bB), 2.3 (bC) (this study, based on [12,15]) |
| Booster compressor isentropic efficiency, (-) | 0.65 [49] |
| Pump 3 isentropic efficiency, (-) | 0.50 [50] |
| Solar collector sub-system | |
| Surface area (m2) | 300 |
| Source-side mass flow rate, (kg/hr) | 2000 |
| Storage tank volume (m3) | 5 |
| Auxiliary heater efficiency (-) | 0.9 |
1 Primary flow nozzle referred to as Type A in [21], with the effective nozzle diameter ratio corresponding to the effective area ratio A2/A1 = 2.9. 2 Booster compressor pressure ratios = P7″/P6 and P7‴/P6 for Boosters B (bB) and C (bC), respectively.
Table 3.
Mass and energy relations for the refrigeration sub-system components [55].
Table 3.
Mass and energy relations for the refrigeration sub-system components [55].
| Component | Energy Relation | Mass Relation |
|---|---|---|
| Generator | ||
| Evaporator | ||
| Condenser | ||
| Ejector | Section 3.1 | |
| Booster compressor B | ||
| Booster compressor C | ||
| Pump 3 | ||
| Expansion valve |
| Component | |||
|---|---|---|---|
| Generator | |||
| Evaporator | |||
| Condenser | = | ||
| Ejector | |||
| Booster compressor B | |||
| Booster compressor C | |||
| Pump 3 | |||
| Expansion valve |
Table 5.
Effective ejector area dimensions (m2) for simple and compression-assisted ejector sub-cycles at nominal conditions.
Table 5.
Effective ejector area dimensions (m2) for simple and compression-assisted ejector sub-cycles at nominal conditions.
| Working Fluid | Simple Cycle | Compression-Assisted Cycle | ||
|---|---|---|---|---|
| and Ejector | A2 (m2) | A3 (m2) | A2 (m2) | A3 (m2) |
| R245fa | ||||
| A | 0.000215 | 0.000453 | --- | --- |
| B | 0.001455 | 0.002426 | 0.000425 | 0.000709 |
| C | 0.006790 | 0.009370 | 0.000836 | 0.000935 |
| R600a | ||||
| A | 0.000121 | 0.000154 | --- | --- |
| B | 0.001971 | 0.001923 | 0.000389 | 0.000380 |
| C | 0.004042 | 0.003795 | 0.000676 | 0.000514 |
| R141b | ||||
| A | 0.000288 | 0.000532 | --- | --- |
| B | 0.002062 | 0.002569 | 0.001320 | 0.001644 |
| C | 0.029104 | 0.031827 | 0.001698 | 0.001693 |
| R11 | ||||
| A | 0.000158 | 0.000337 | --- | --- |
| B | 0.001037 | 0.001547 | 0.000565 | 0.000842 |
| C | 0.010424 | 0.009376 | 0.001604 | 0.001442 |
Table 6.
Exergy rates of the fuel, product, destroyed exergy, exergy loss, and exergy efficiency for the simple Ejector A refrigeration sub-cycle and compression-assisted Ejector B and C sub-cycles at nominal conditions, with R245fa as the working fluid.
Table 6.
Exergy rates of the fuel, product, destroyed exergy, exergy loss, and exergy efficiency for the simple Ejector A refrigeration sub-cycle and compression-assisted Ejector B and C sub-cycles at nominal conditions, with R245fa as the working fluid.
| Unit | εex,k (%) | ||||
|---|---|---|---|---|---|
| Ejector A (SC) | |||||
| Generator | 9.578 | 7.357 | 2.221 | 22.8 | 76.8 |
| Ejector | 8.840 | 3.565 | 5.275 | 54.2 | 40.3 |
| Condenser | 1.658 | 0 | 1.658 | 17.0 | 0 |
| Evaporator | 0.477 | 0.088 | 0.389 | 4.0 | 18.5 |
| Pump | 0.248 | 0.114 | 0.135 | 1.4 | 45.8 |
| Expansion valve | 0.35 | 0.29 | 0.061 | 0.6 | 82.7 |
| Overall cycle | 9.827 | 0.088 | 9.739 | 100.0 | 0.9 |
| Ejector B (BAC) | |||||
| Generator | 18.202 | 14.391 | 3.811 | 18.9 | 79.1 |
| Ejector | 18.828 | 10.158 | 8.670 | 42.9 | 54.0 |
| Condenser | 5.623 | 0 | 5.623 | 27.8 | 0 |
| Evaporator | 1.682 | 0.281 | 1.401 | 6.9 | 16.7 |
| Pump | 0.447 | 0.180 | 0.266 | 1.3 | 40.4 |
| Expansion valve | 1.256 | 0.889 | 0.357 | 1.8 | 71.6 |
| Booster compressor | 1.838 | 1.7613 | 0.077 | 0.4 | 95.8 |
| Overall cycle | 20.487 | 0.281 | 20.206 | 100.0 | 1.4 |
| Ejector C (BAC) | |||||
| Generator | 34.015 | 27.885 | 6.13 | 16.0 | 82.0 |
| Ejector | 37.632 | 23.726 | 13.906 | 36.2 | 63.1 |
| Condenser | 14.896 | 0 | 14.896 | 38. 8 | 0 |
| Evaporator | 2.414 | 0.367 | 2.048 | 5.3 | 15.2 |
| Pump | 0.79 | 0.267 | 0.523 | 1.4 | 33.7 |
| Expansion valve | 1.890 | 1.106 | 0.784 | 2.0 | 58.5 |
| Booster compressor | 3.971 | 3.8479 | 0.123 | 0.3 | 96.9 |
| Overall cycle | 38.776 | 0.367 | 38.410 | 100.0 | 1.0 |
Note: Exergy relations for system units given in Table 4.
Publisher’s Note: MDPI stays neutral with regard to jurisdictional claims in published maps and institutional affiliations. |
© 2021 by the authors. Licensee MDPI, Basel, Switzerland. This article is an open access article distributed under the terms and conditions of the Creative Commons Attribution (CC BY) license (https://creativecommons.org/licenses/by/4.0/).
Share and Cite
MDPI and ACS Style
Eveloy, V.; Alkendi, Y. Thermodynamic Performance Investigation of a Small-Scale Solar Compression-Assisted Multi-Ejector Indoor Air Conditioning System for Hot Climate Conditions. Energies 2021, 14, 4325. https://doi.org/10.3390/en14144325
AMA Style
Eveloy V, Alkendi Y. Thermodynamic Performance Investigation of a Small-Scale Solar Compression-Assisted Multi-Ejector Indoor Air Conditioning System for Hot Climate Conditions. Energies. 2021; 14(14):4325. https://doi.org/10.3390/en14144325
Chicago/Turabian StyleEveloy, Valerie, and Yusra Alkendi. 2021. "Thermodynamic Performance Investigation of a Small-Scale Solar Compression-Assisted Multi-Ejector Indoor Air Conditioning System for Hot Climate Conditions" Energies 14, no. 14: 4325. https://doi.org/10.3390/en14144325
Note that from the first issue of 2016, this journal uses article numbers instead of page numbers. See further details here.