
State-of-the-Art of Establishing Test Procedures for Real Driving Gaseous Emissions from Light- and Heavy-Duty Vehicles


 , , , ,
Abstract
:
1. Introduction
2. Vehicle and Engine Test Cycle Basics
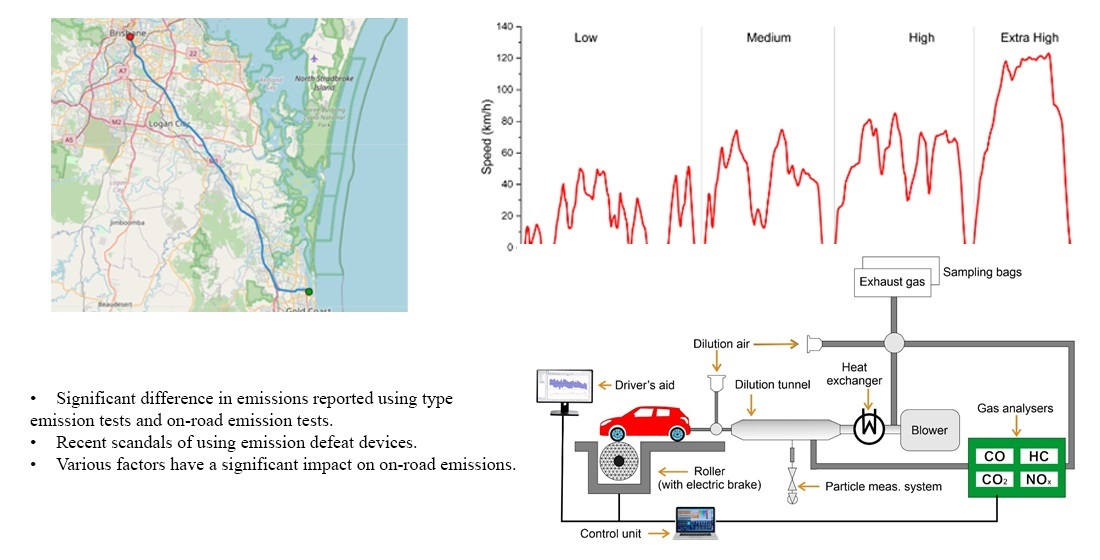
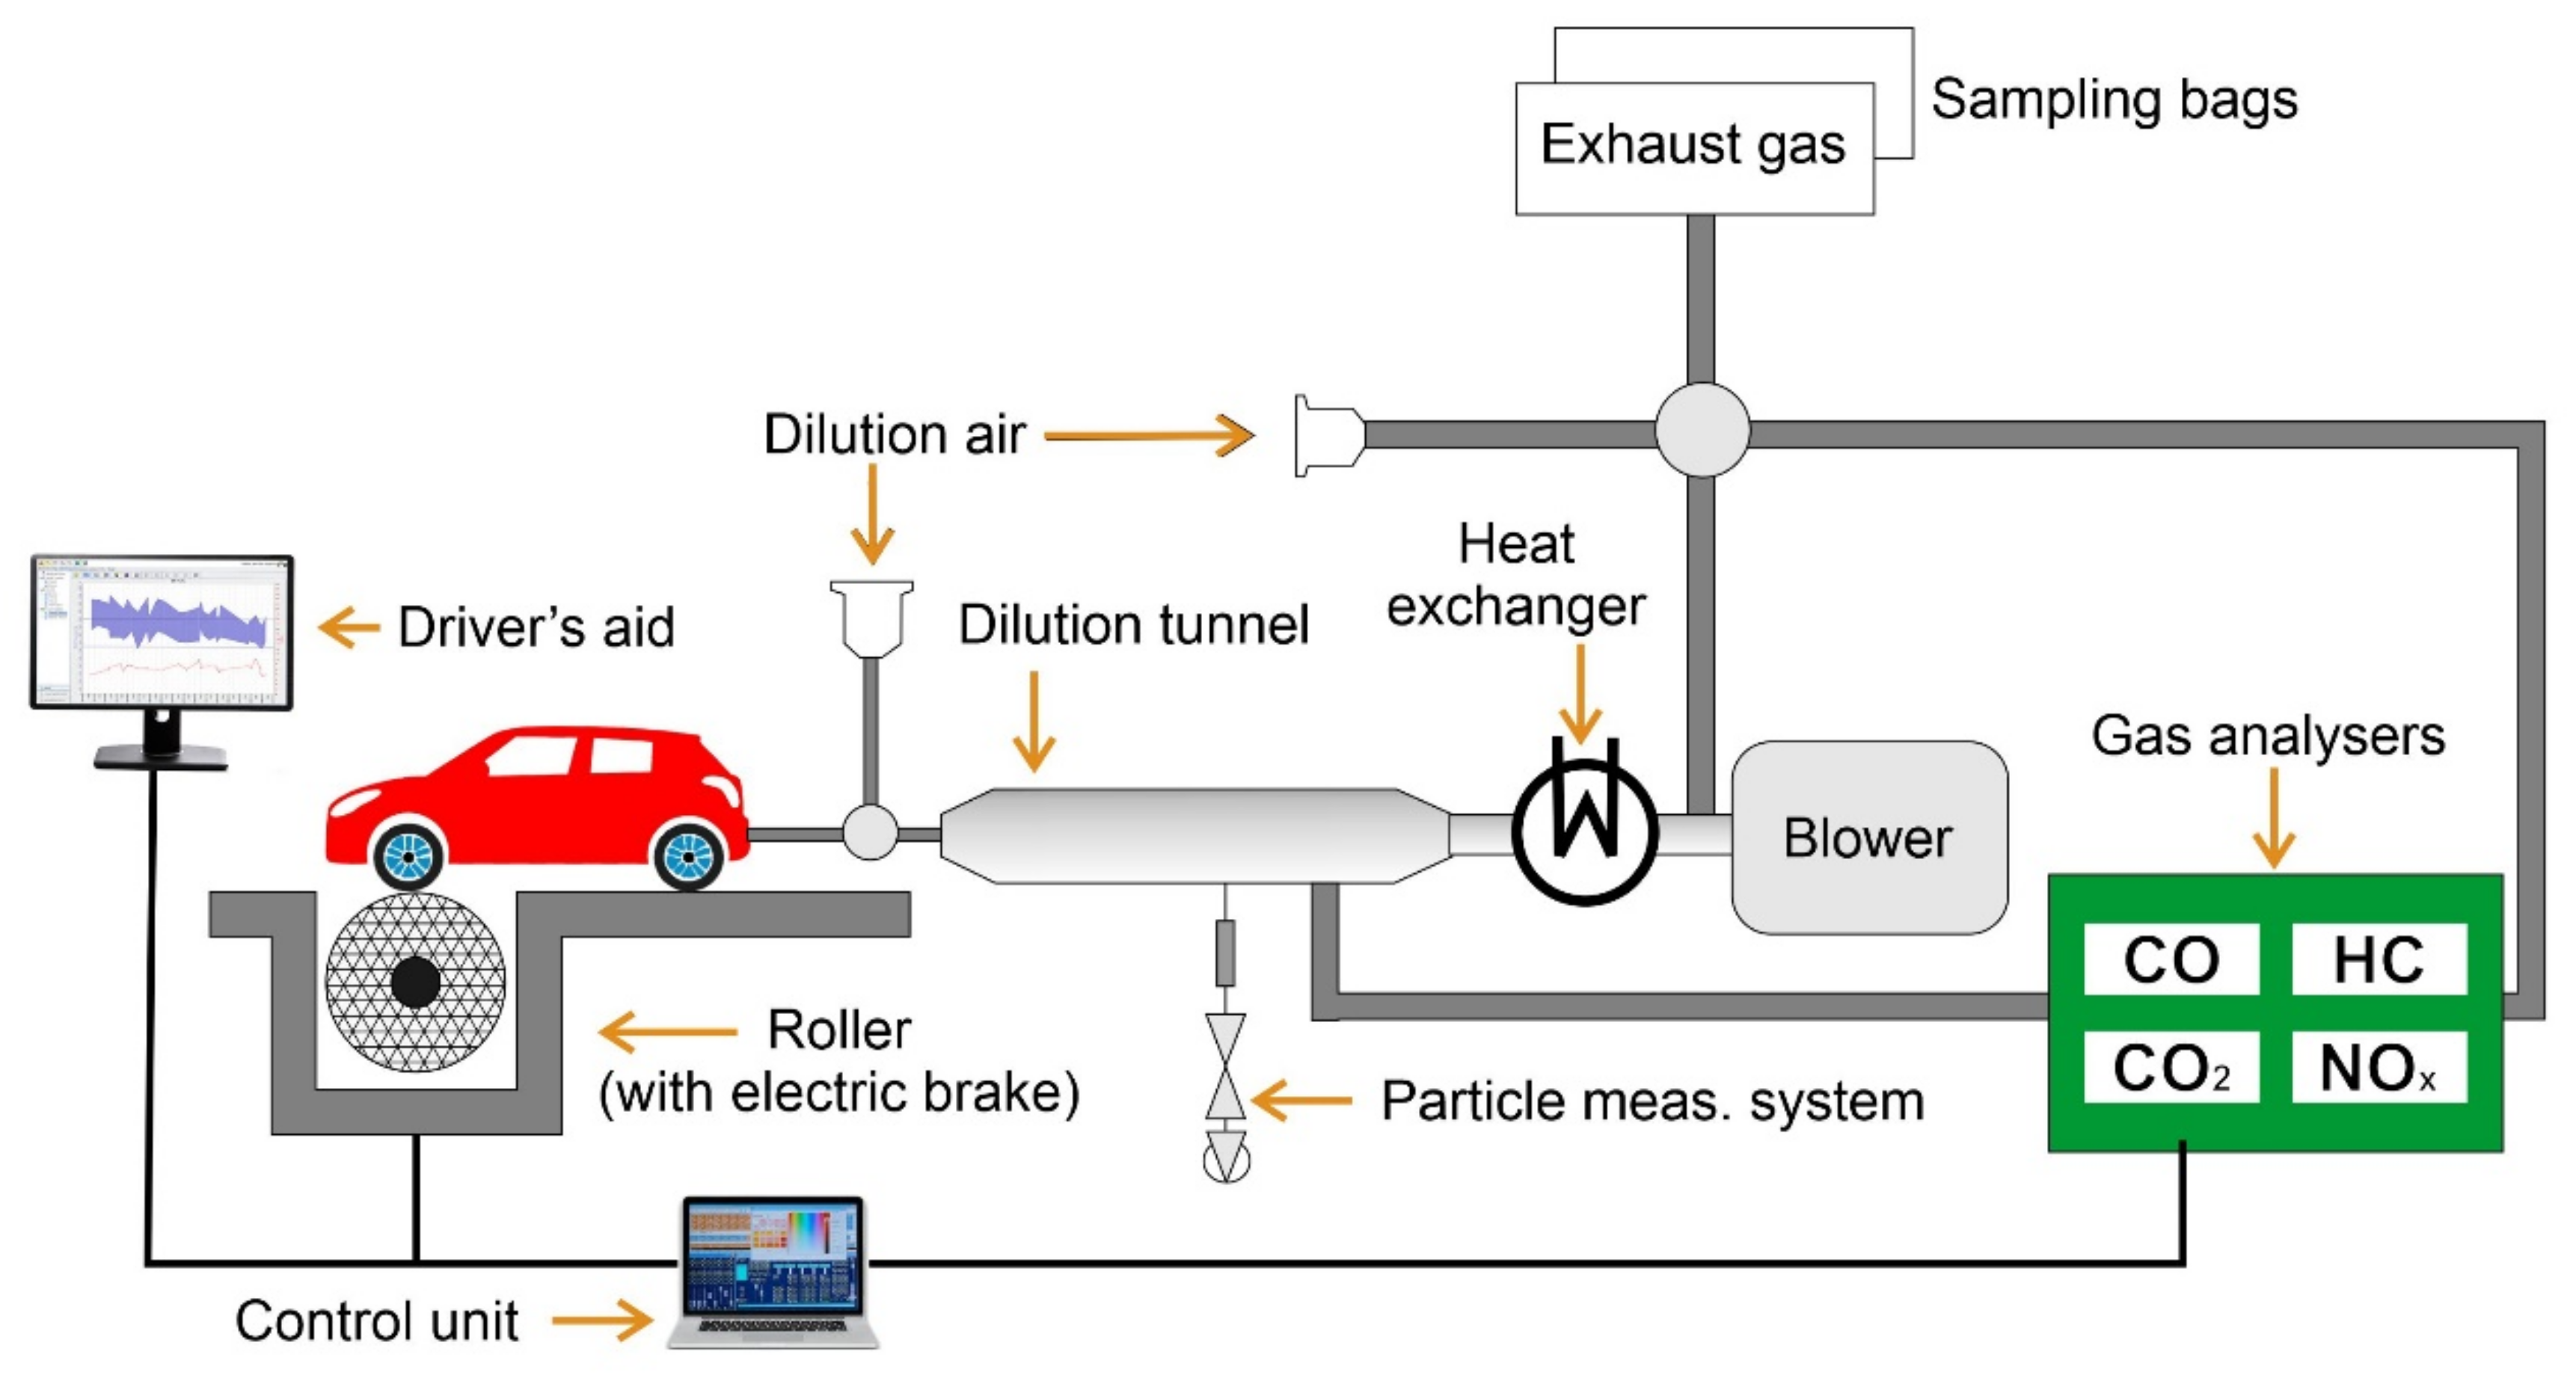
2.1. Chassis Dynamometer Cycle
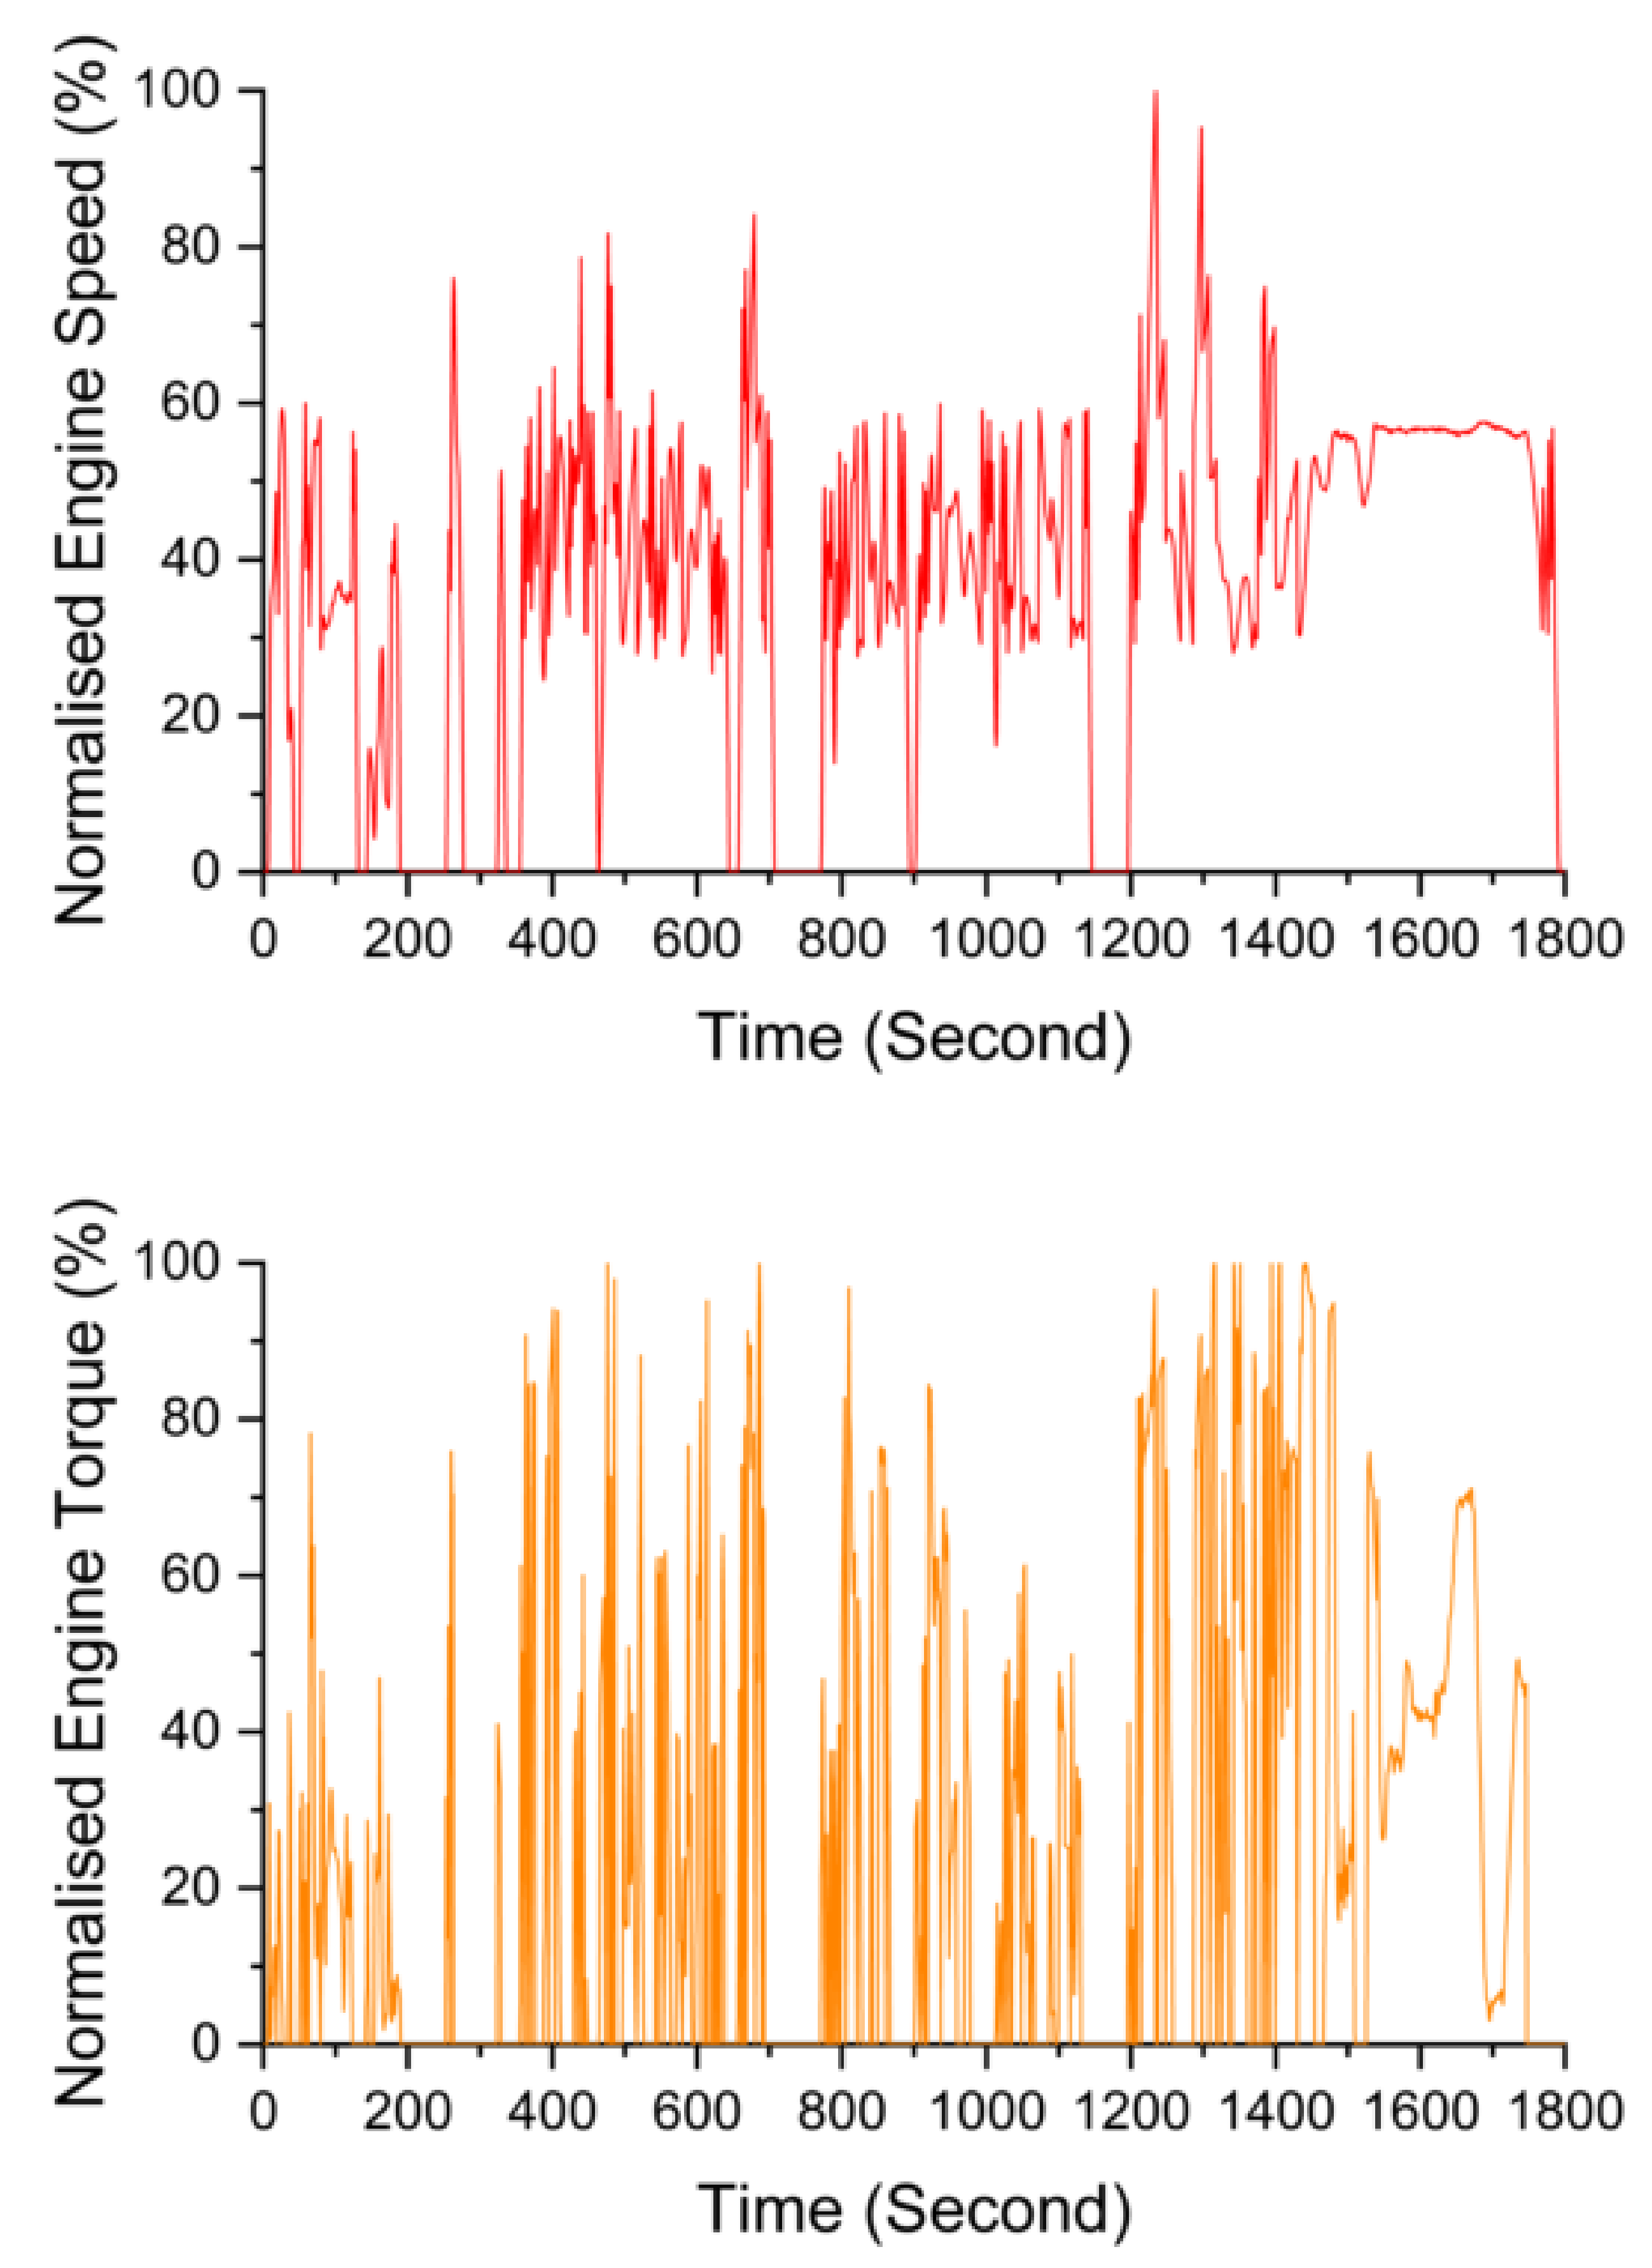
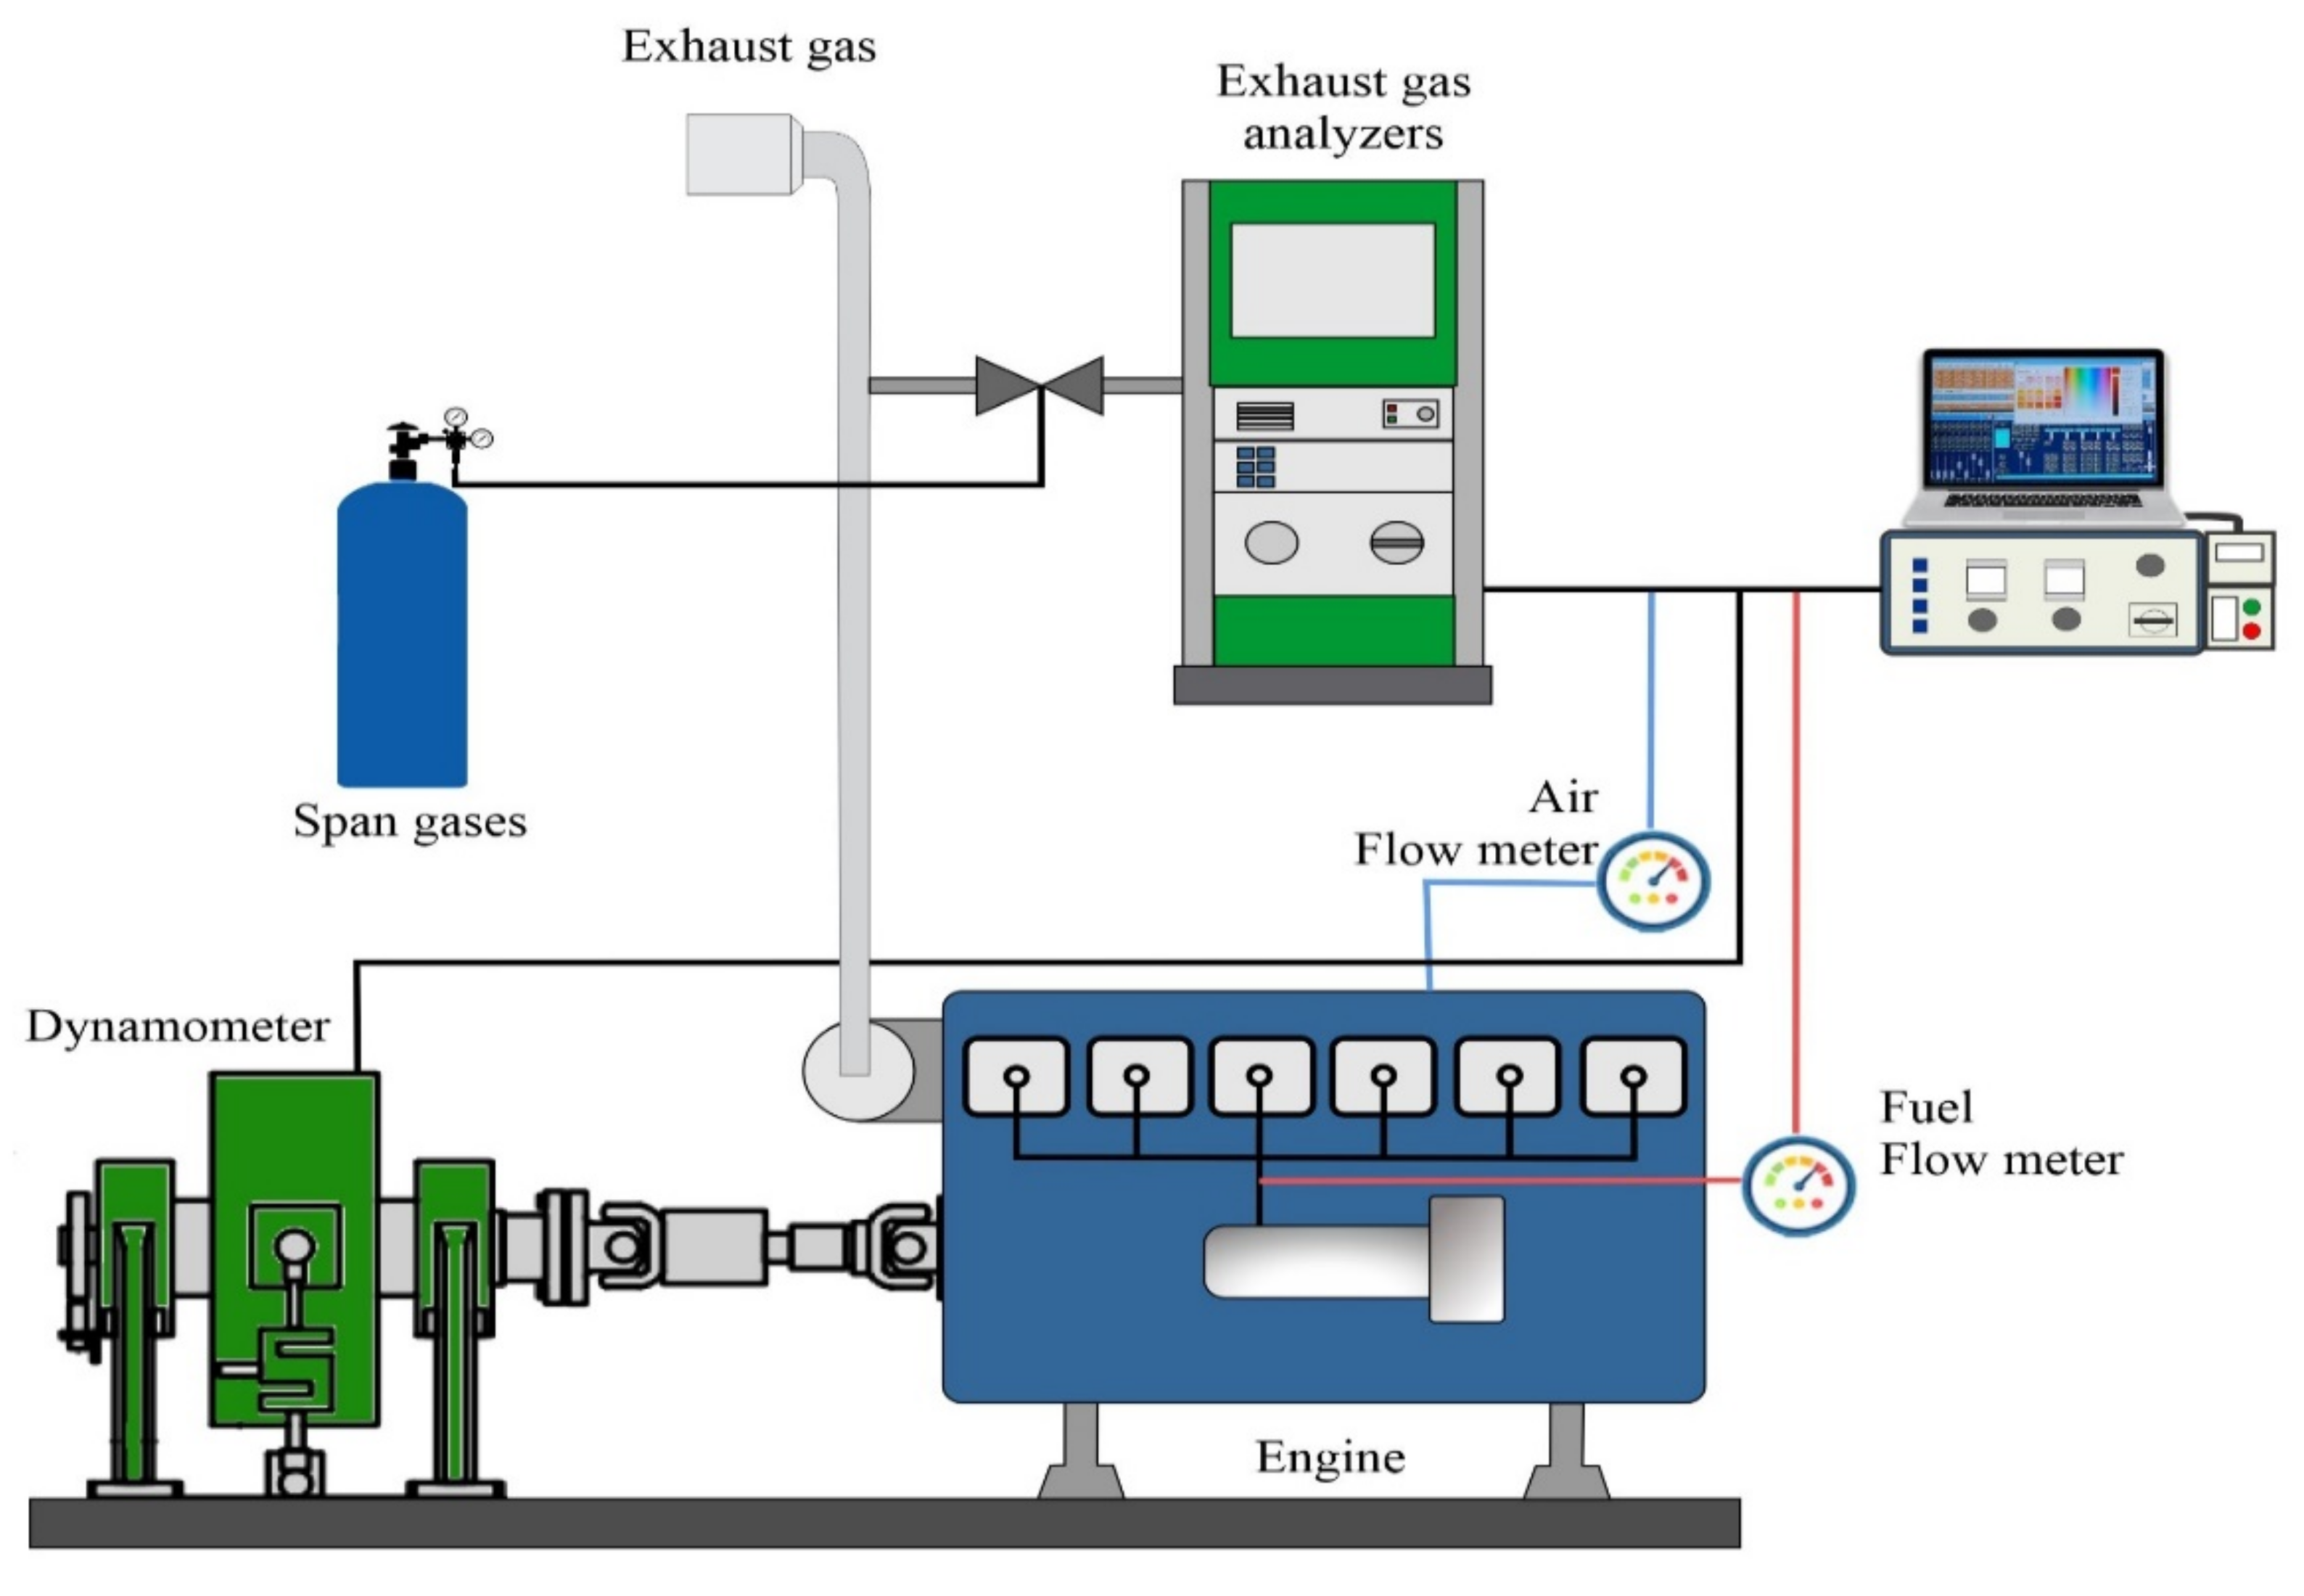
2.2. Engine Dynamometer Cycle
3. Legislative Test Drive Cycles for the Emission Type Approval
3.1. Passenger and Light-Duty Vehicles
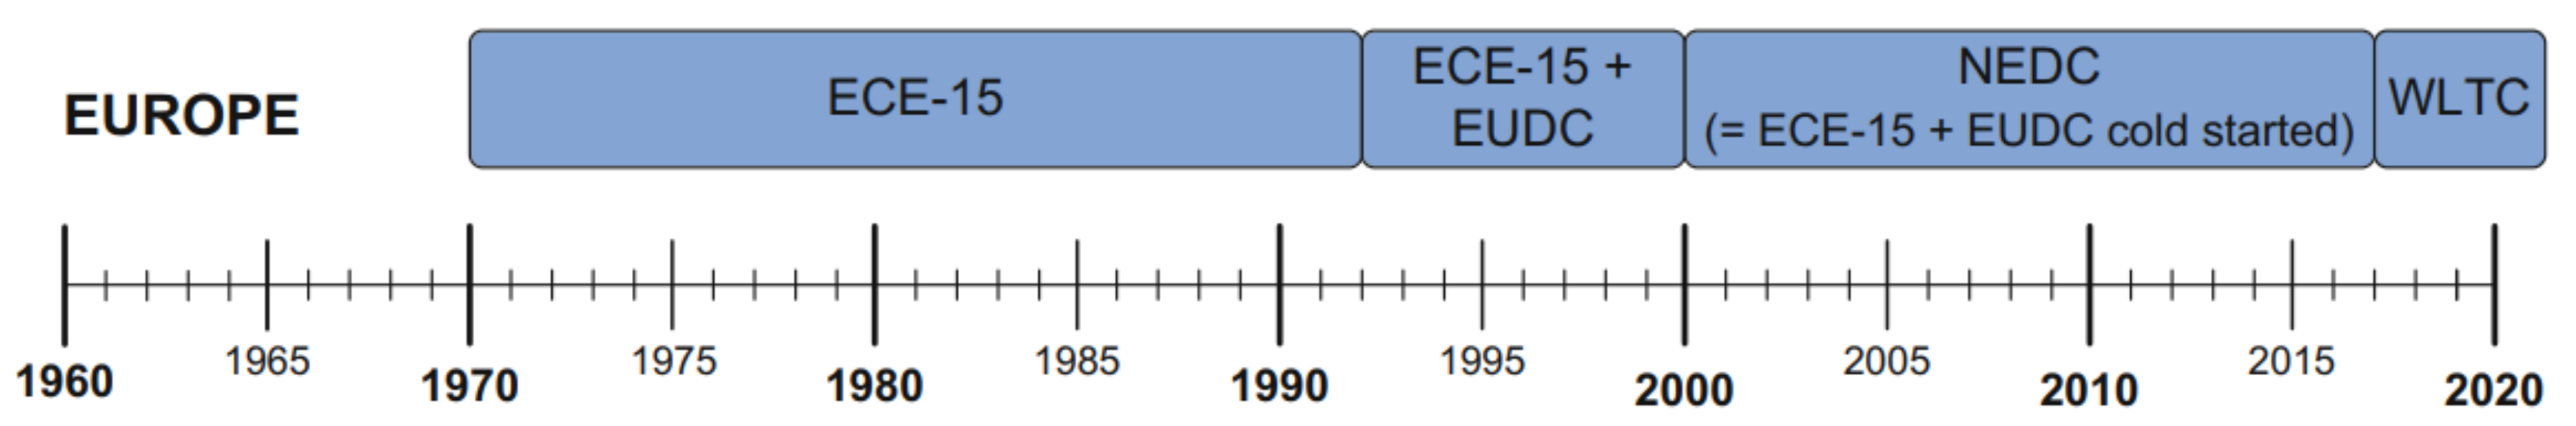
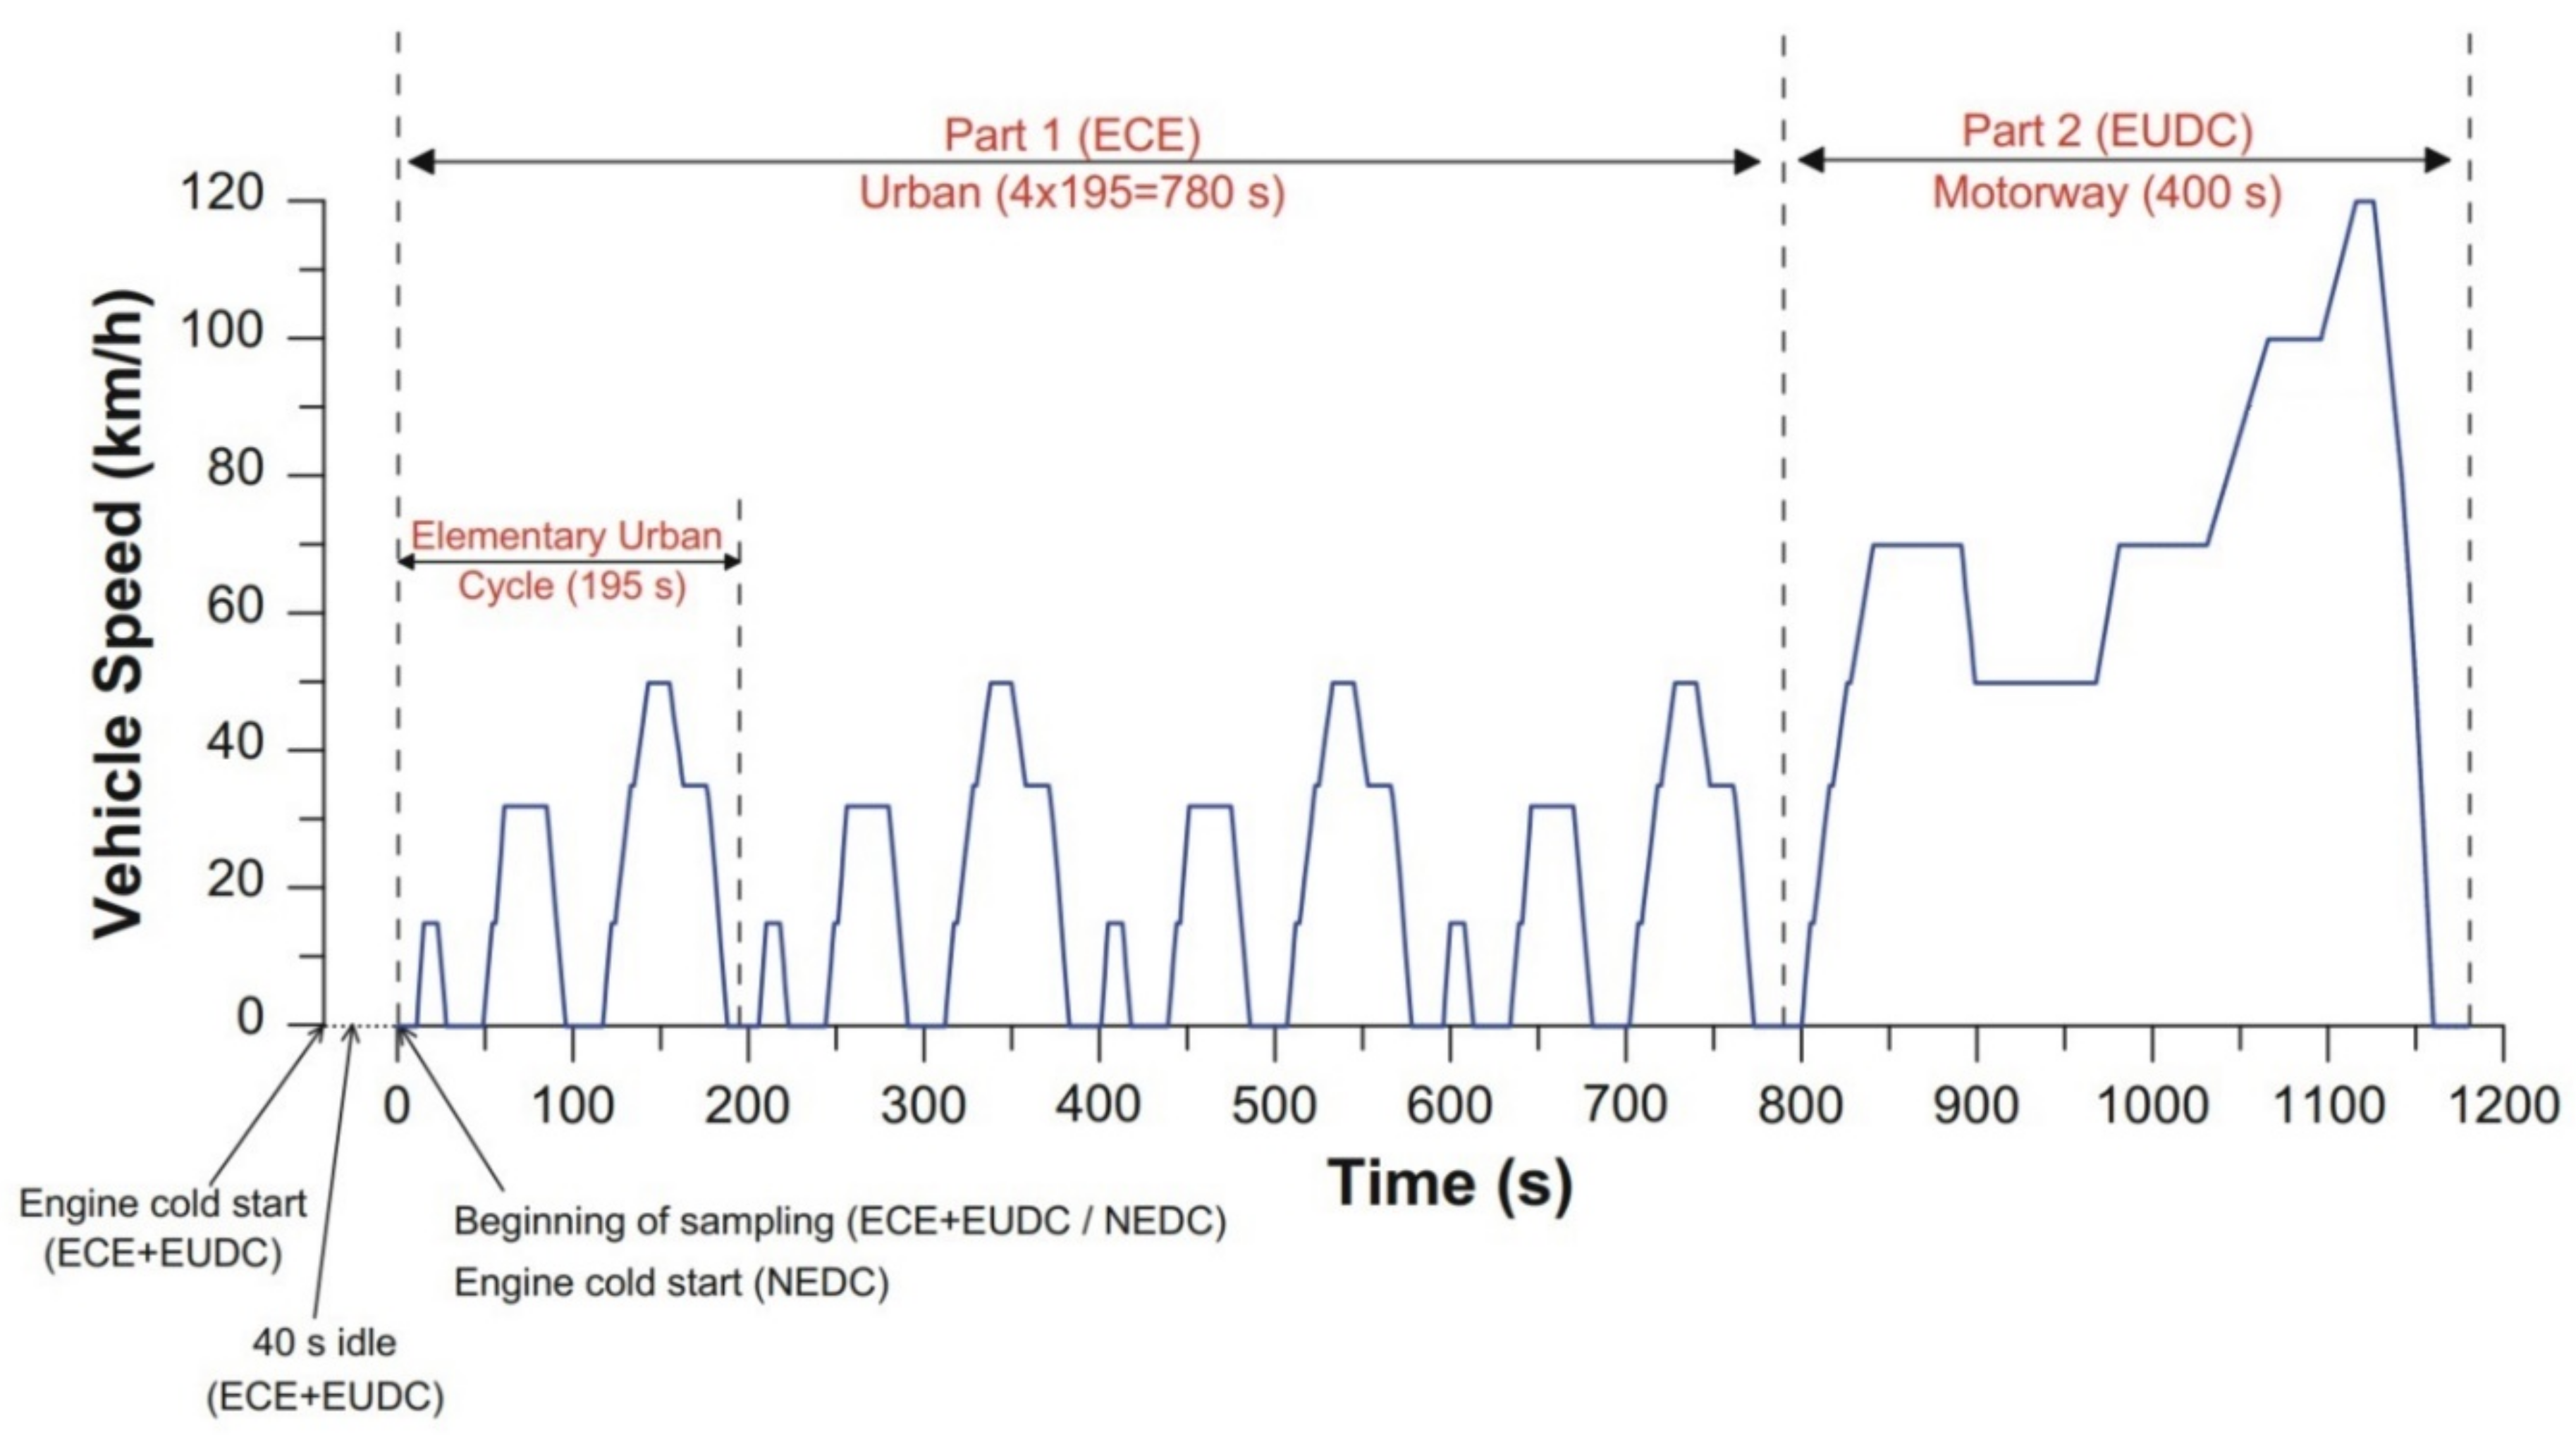
3.1.1. European Union
3.1.2. United States
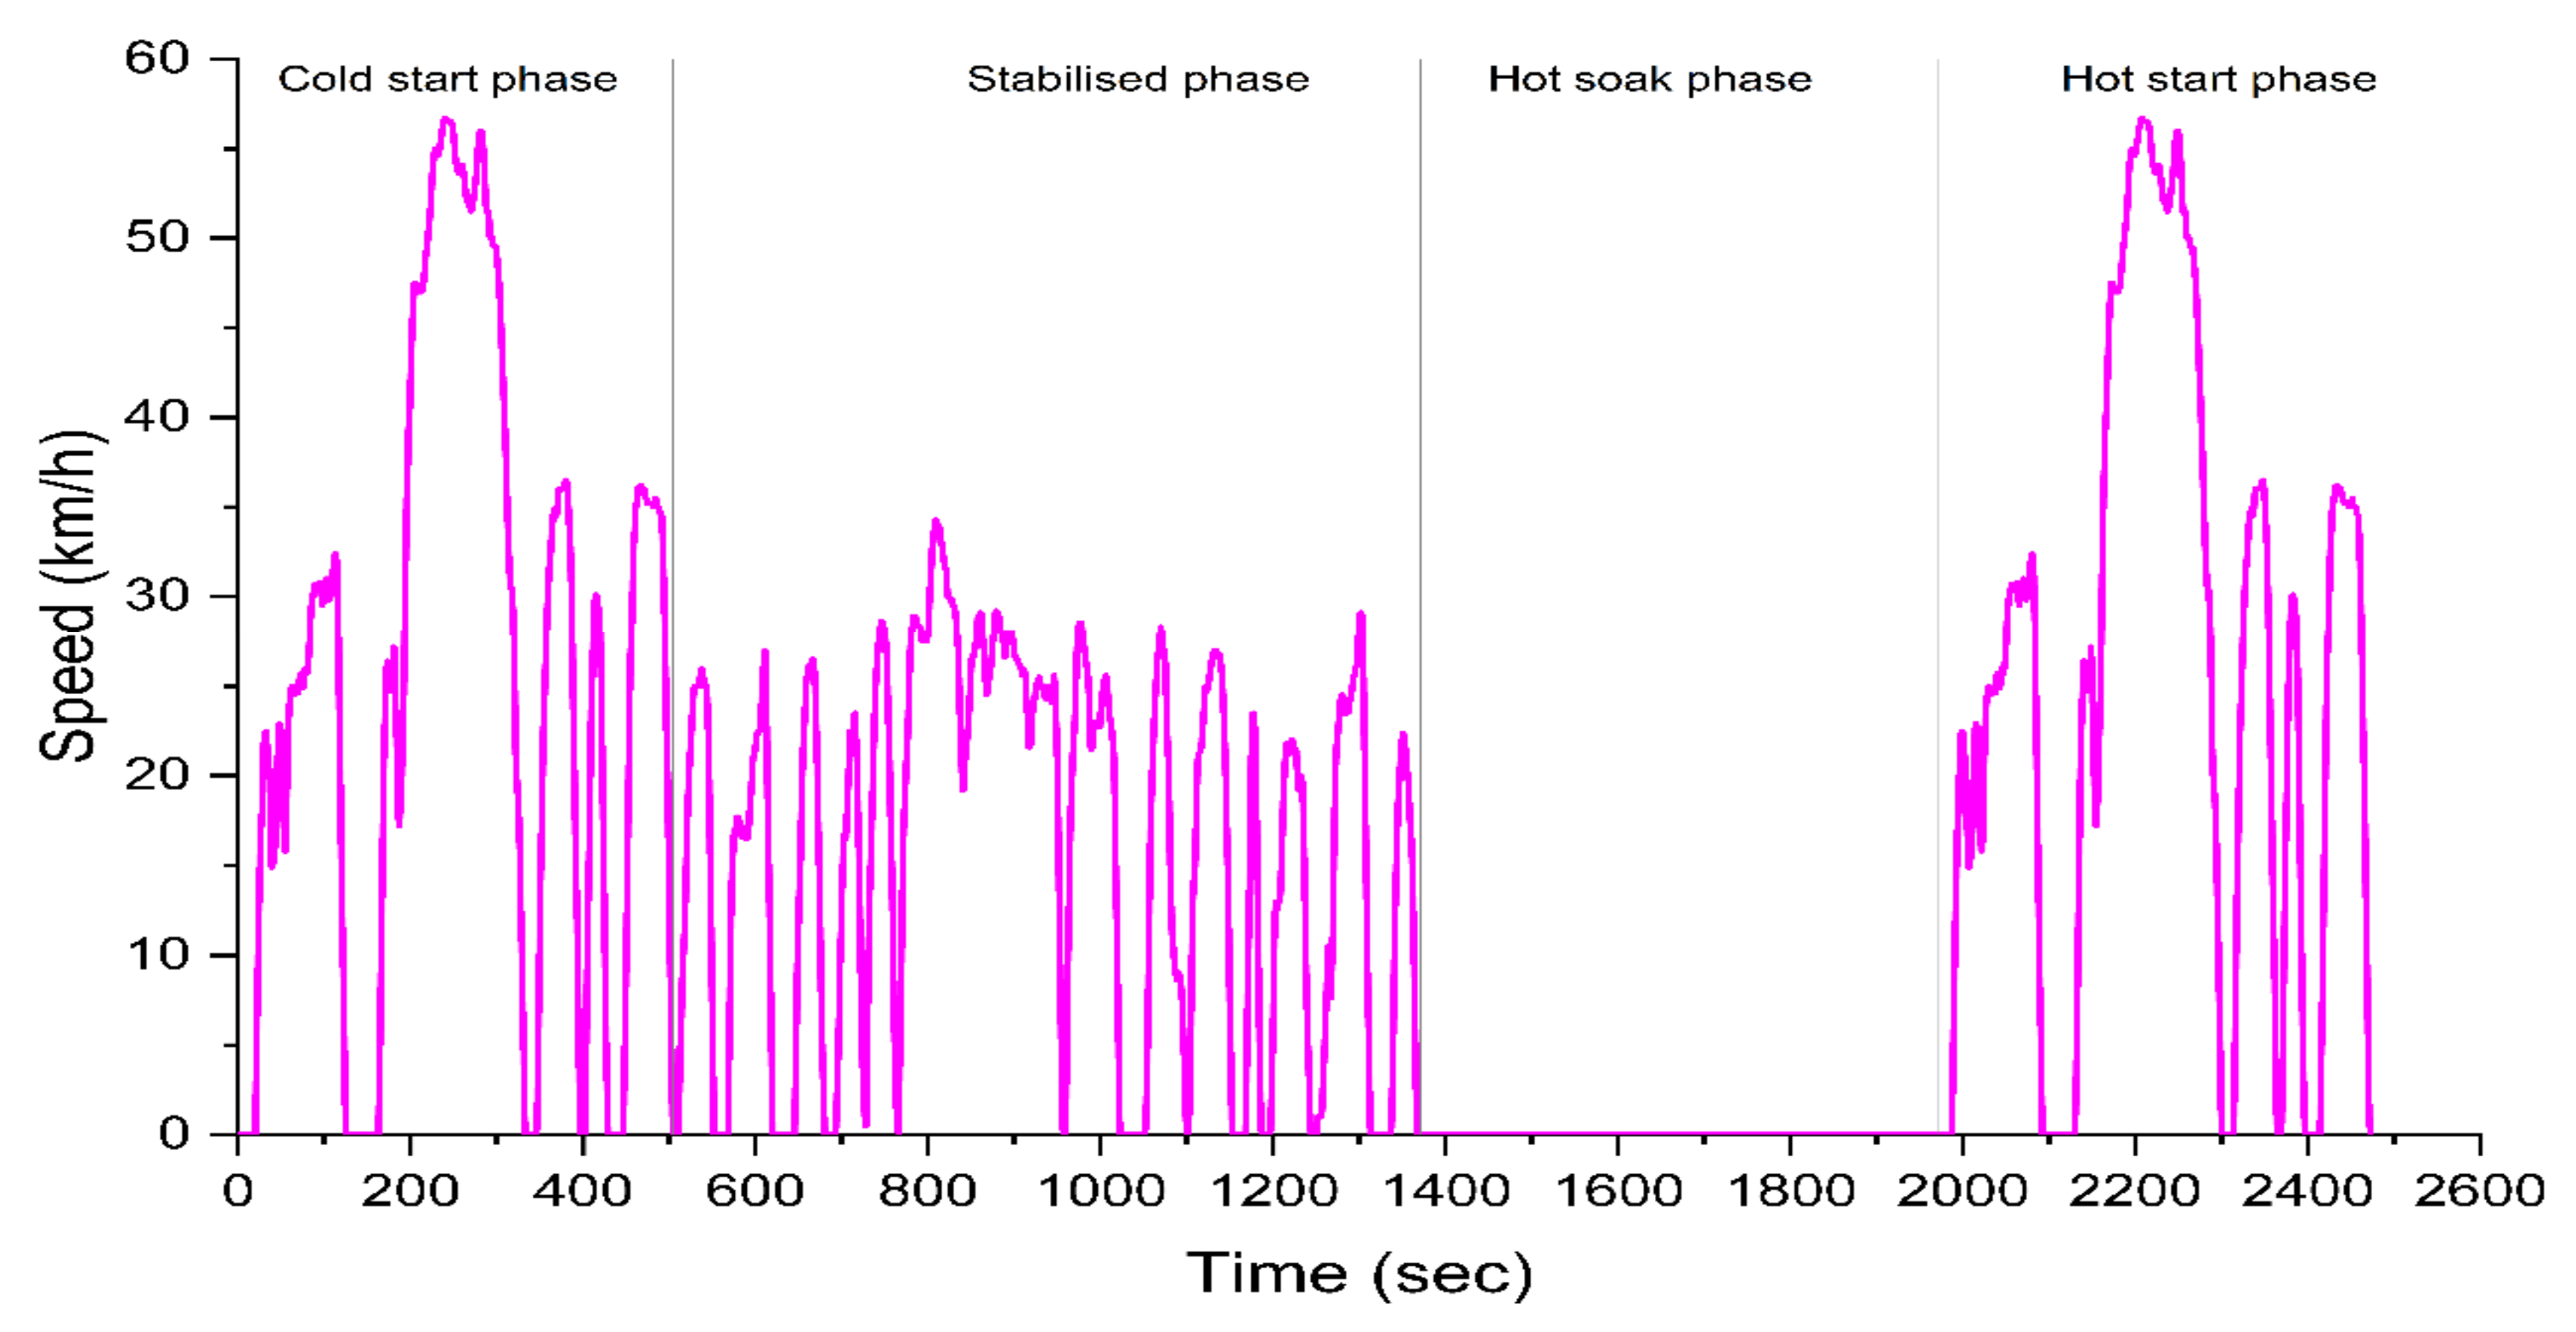
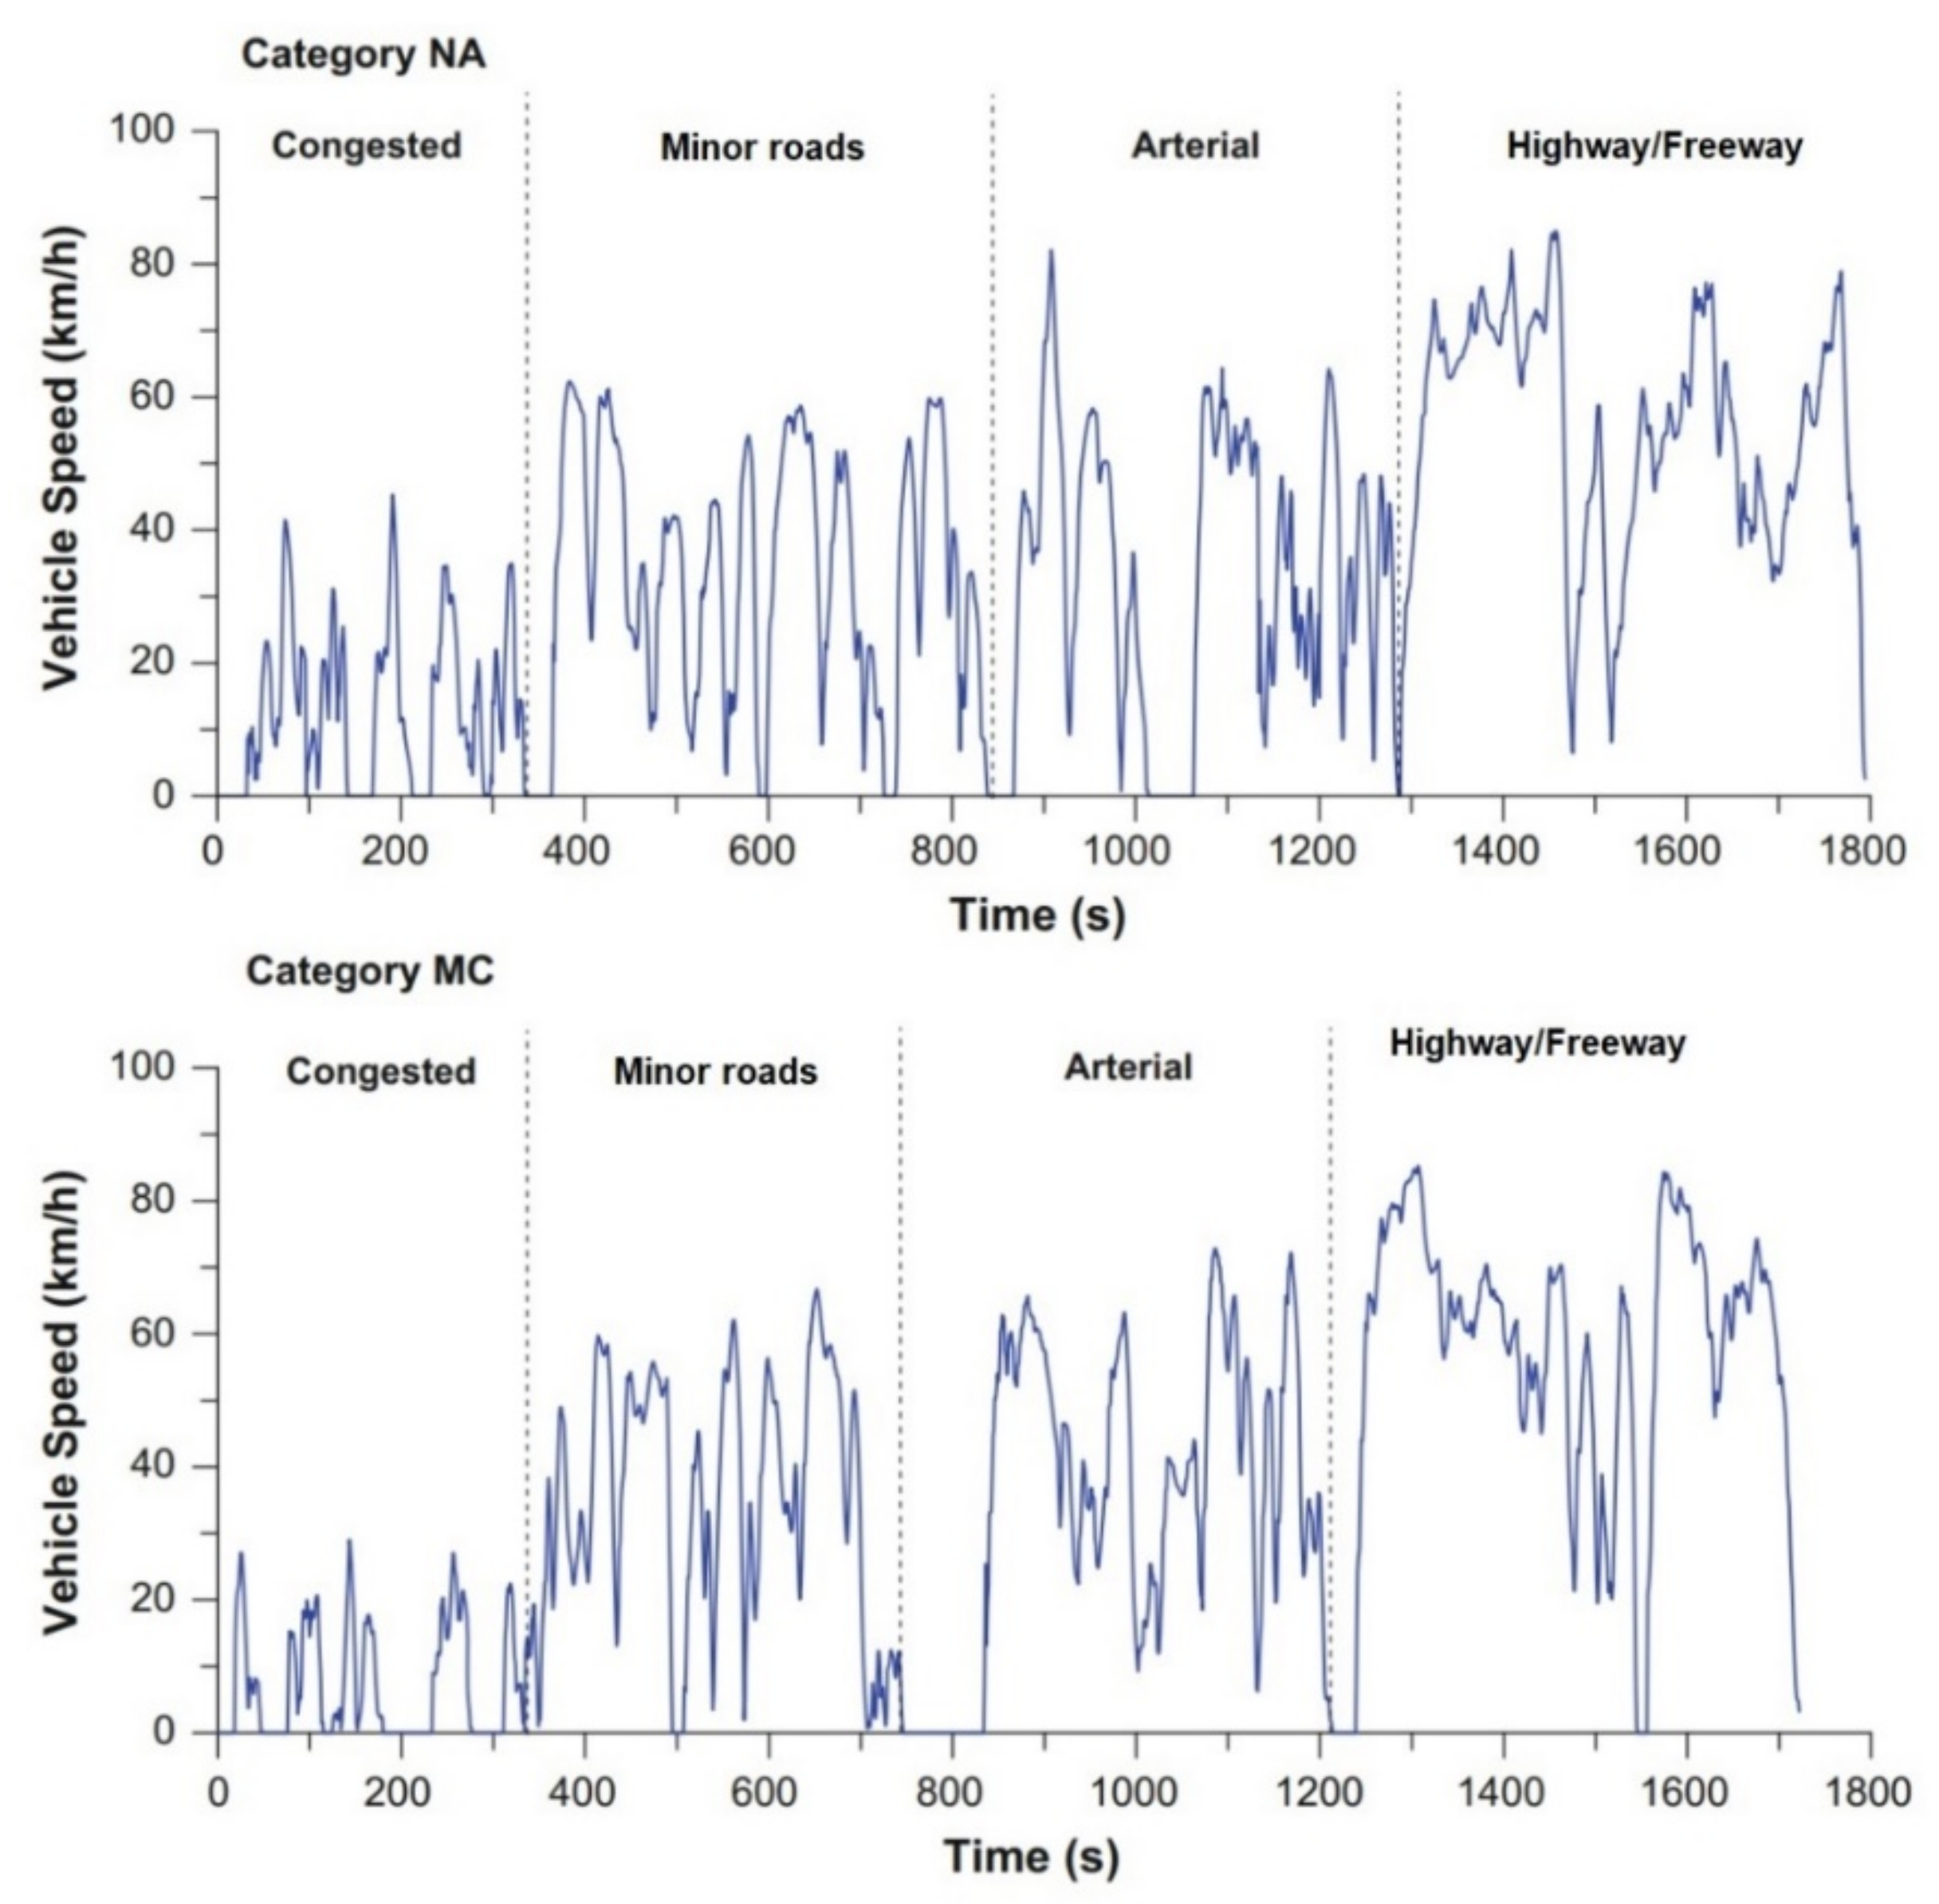
3.1.3. Australia
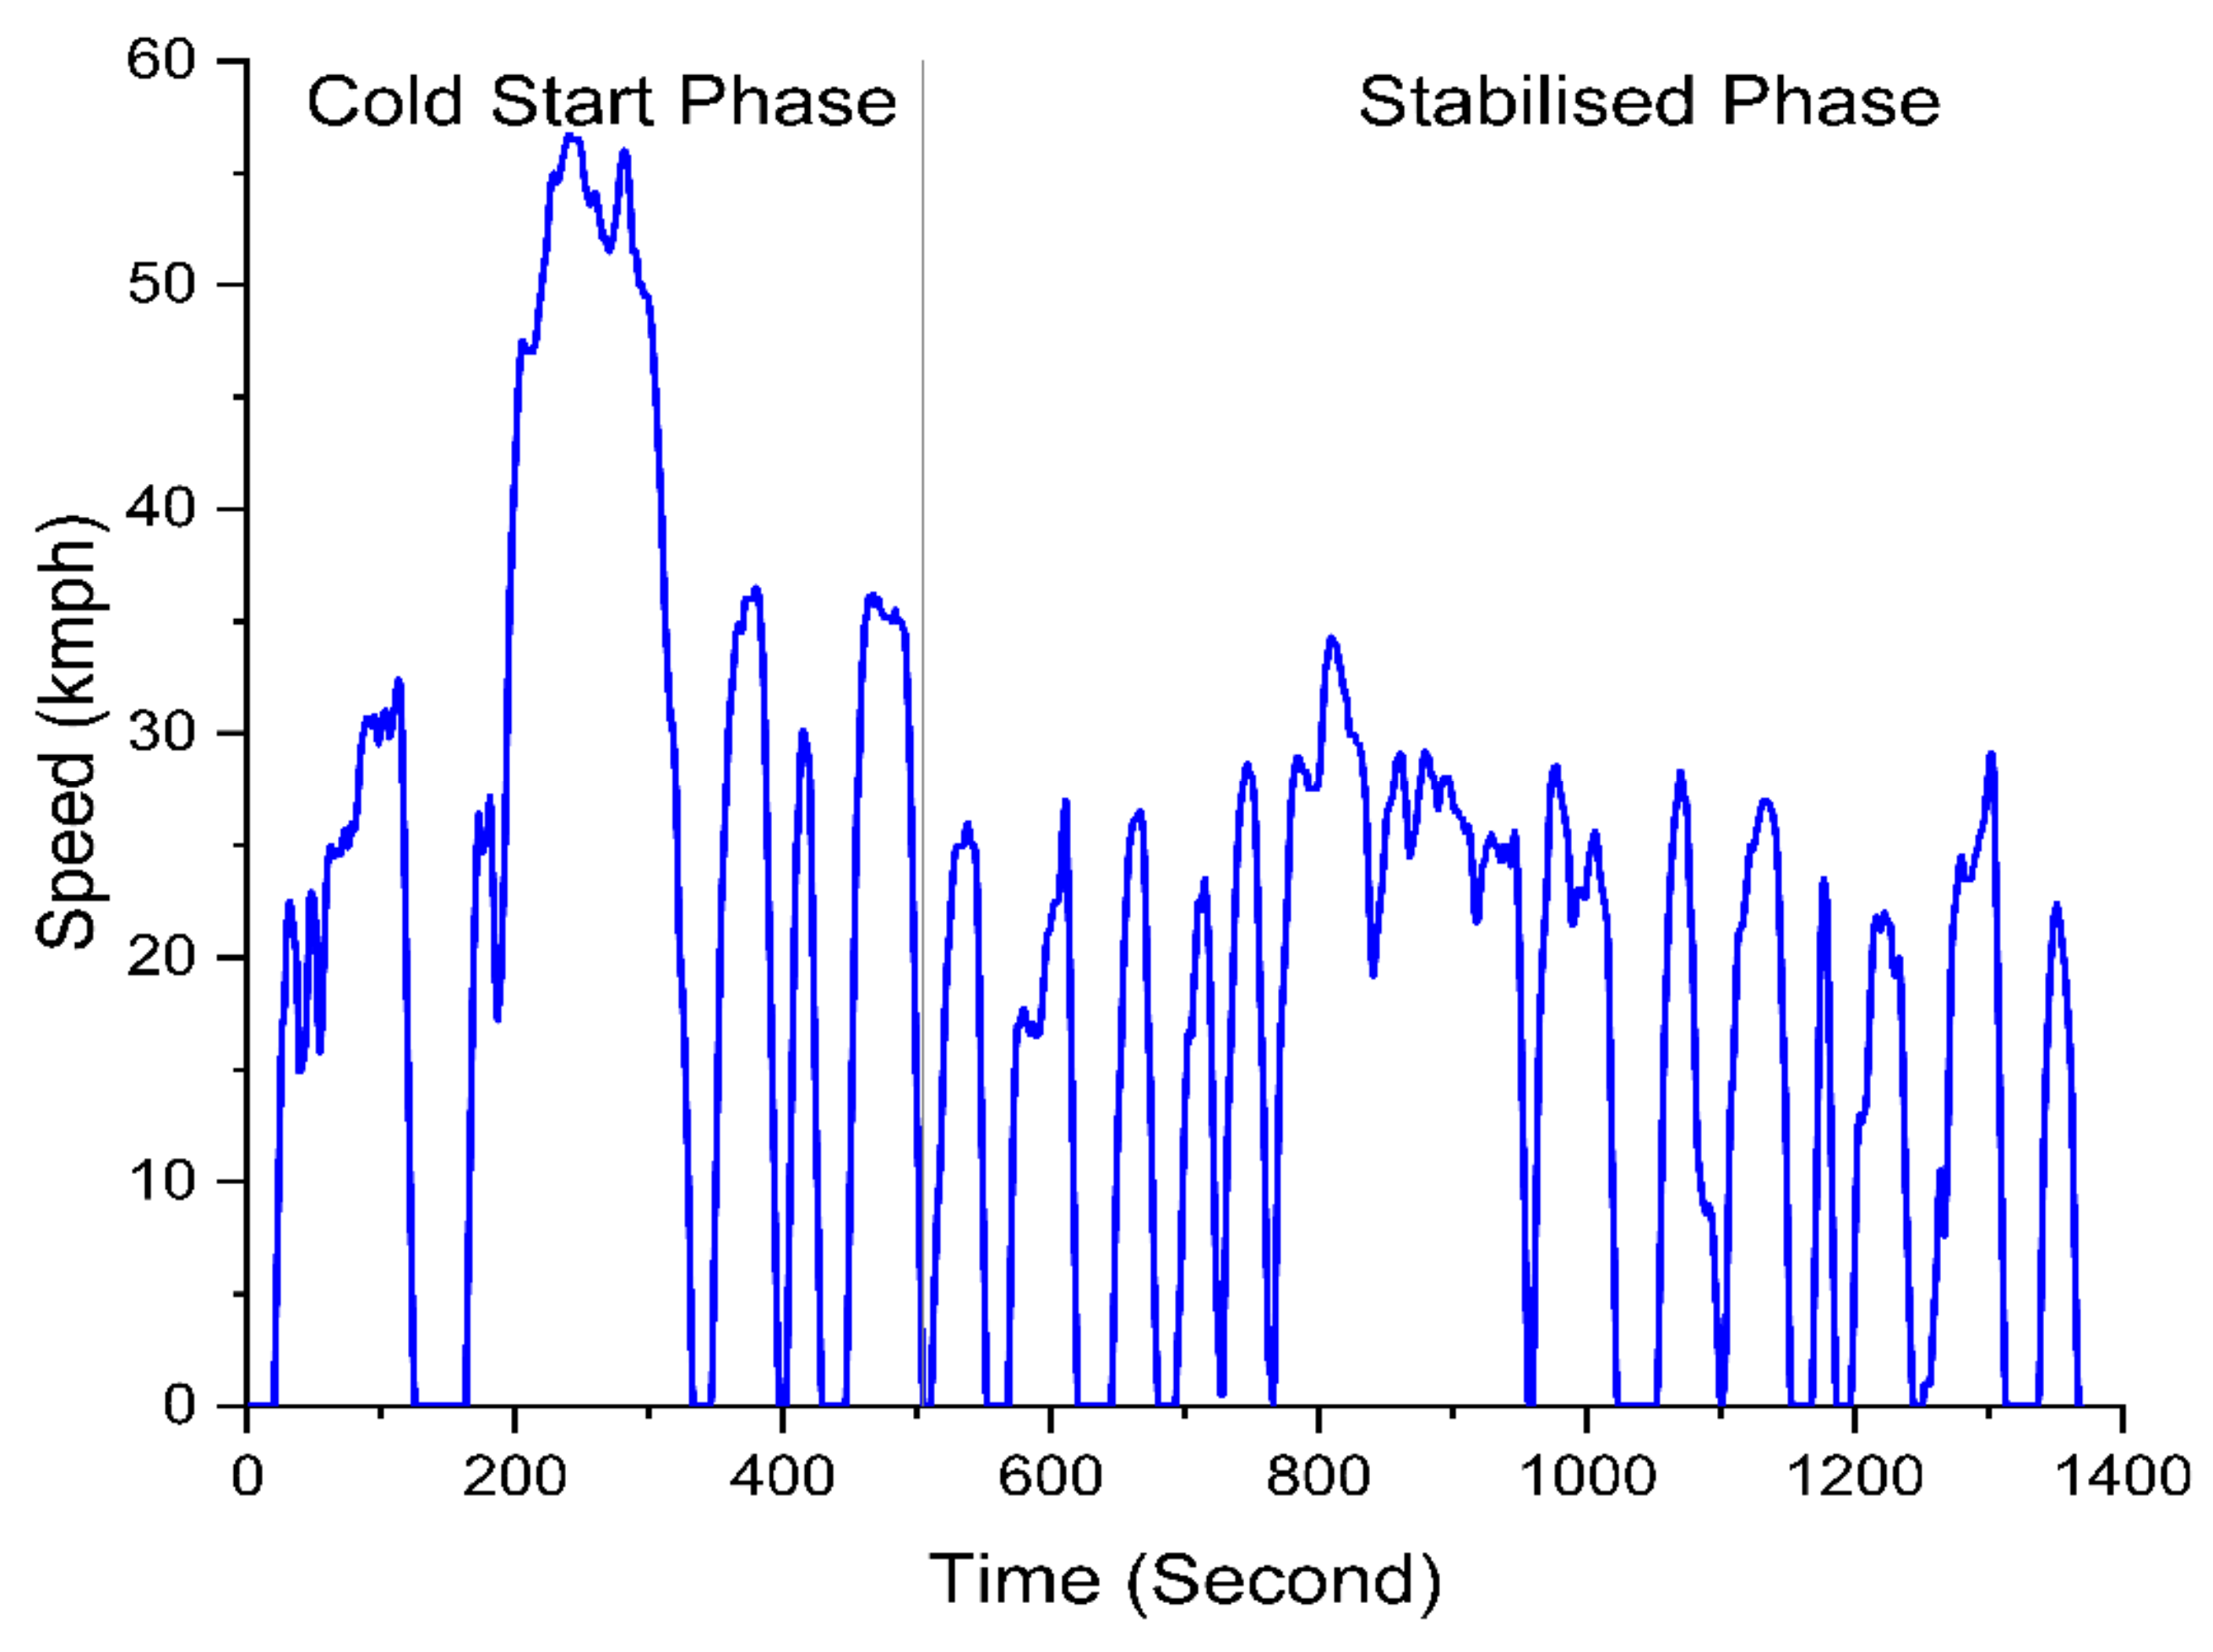
3.1.4. Japan
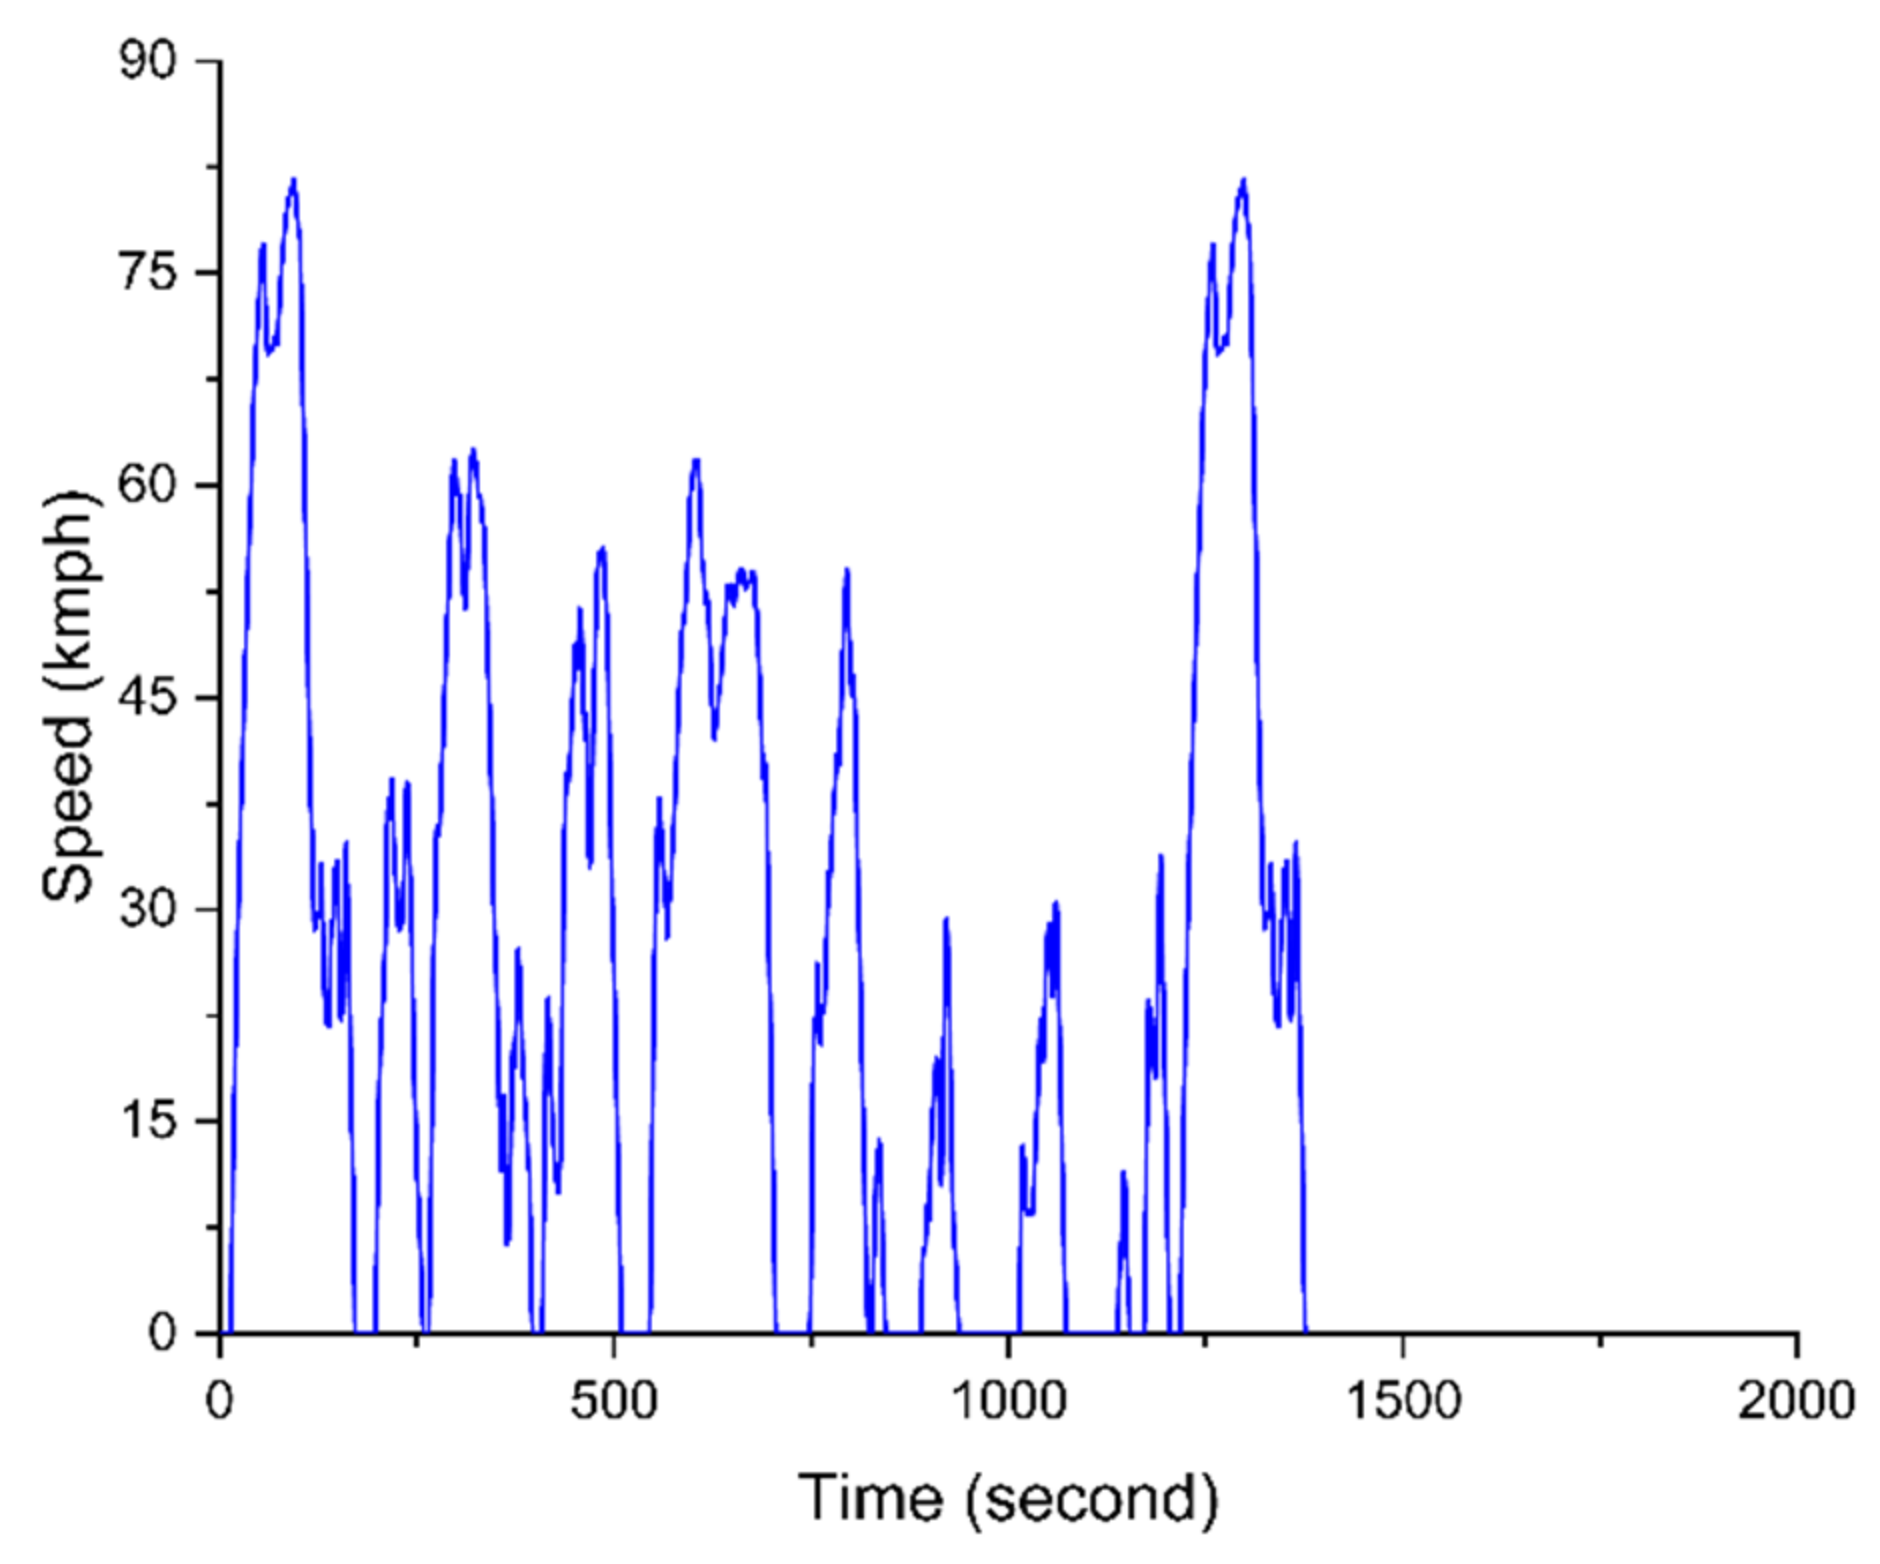
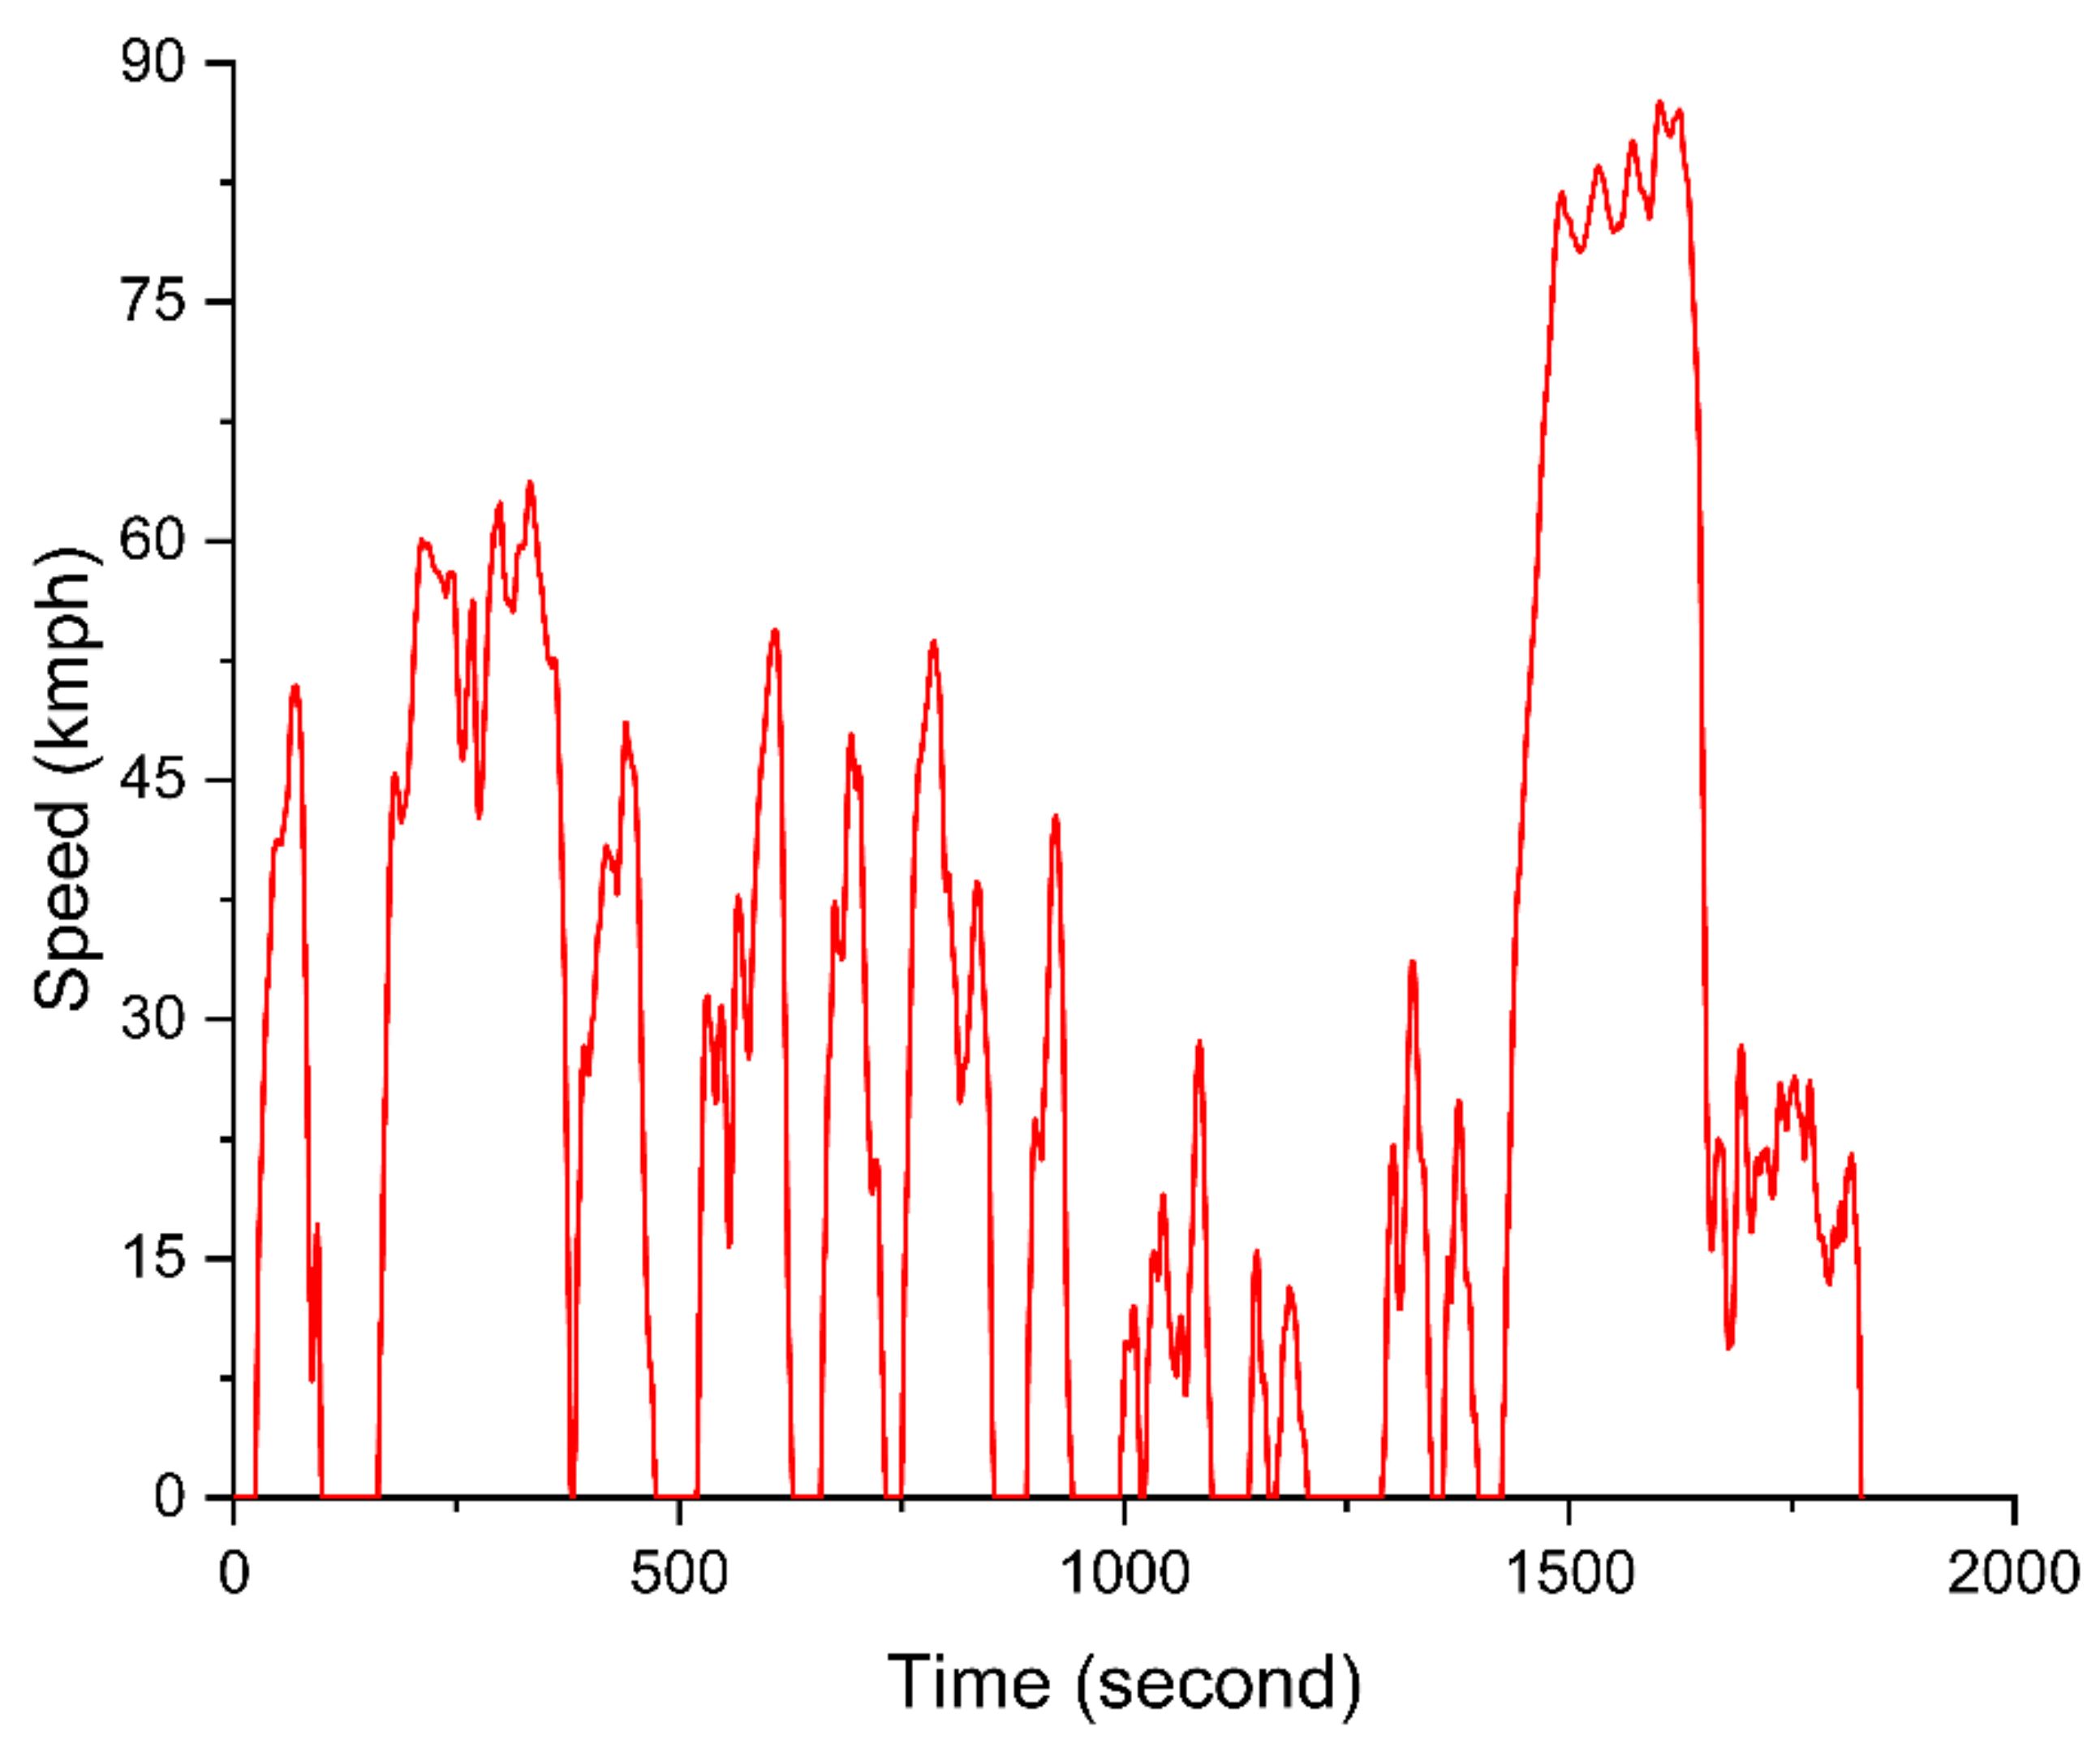
- Duration: 1204 s
- Total distance: 8.171 km
- Average speed: 24.4 km/h (34.8 km/h excluding idle)
- Maximum speed: 81.6 km/h
- Load ratio: 29.7%
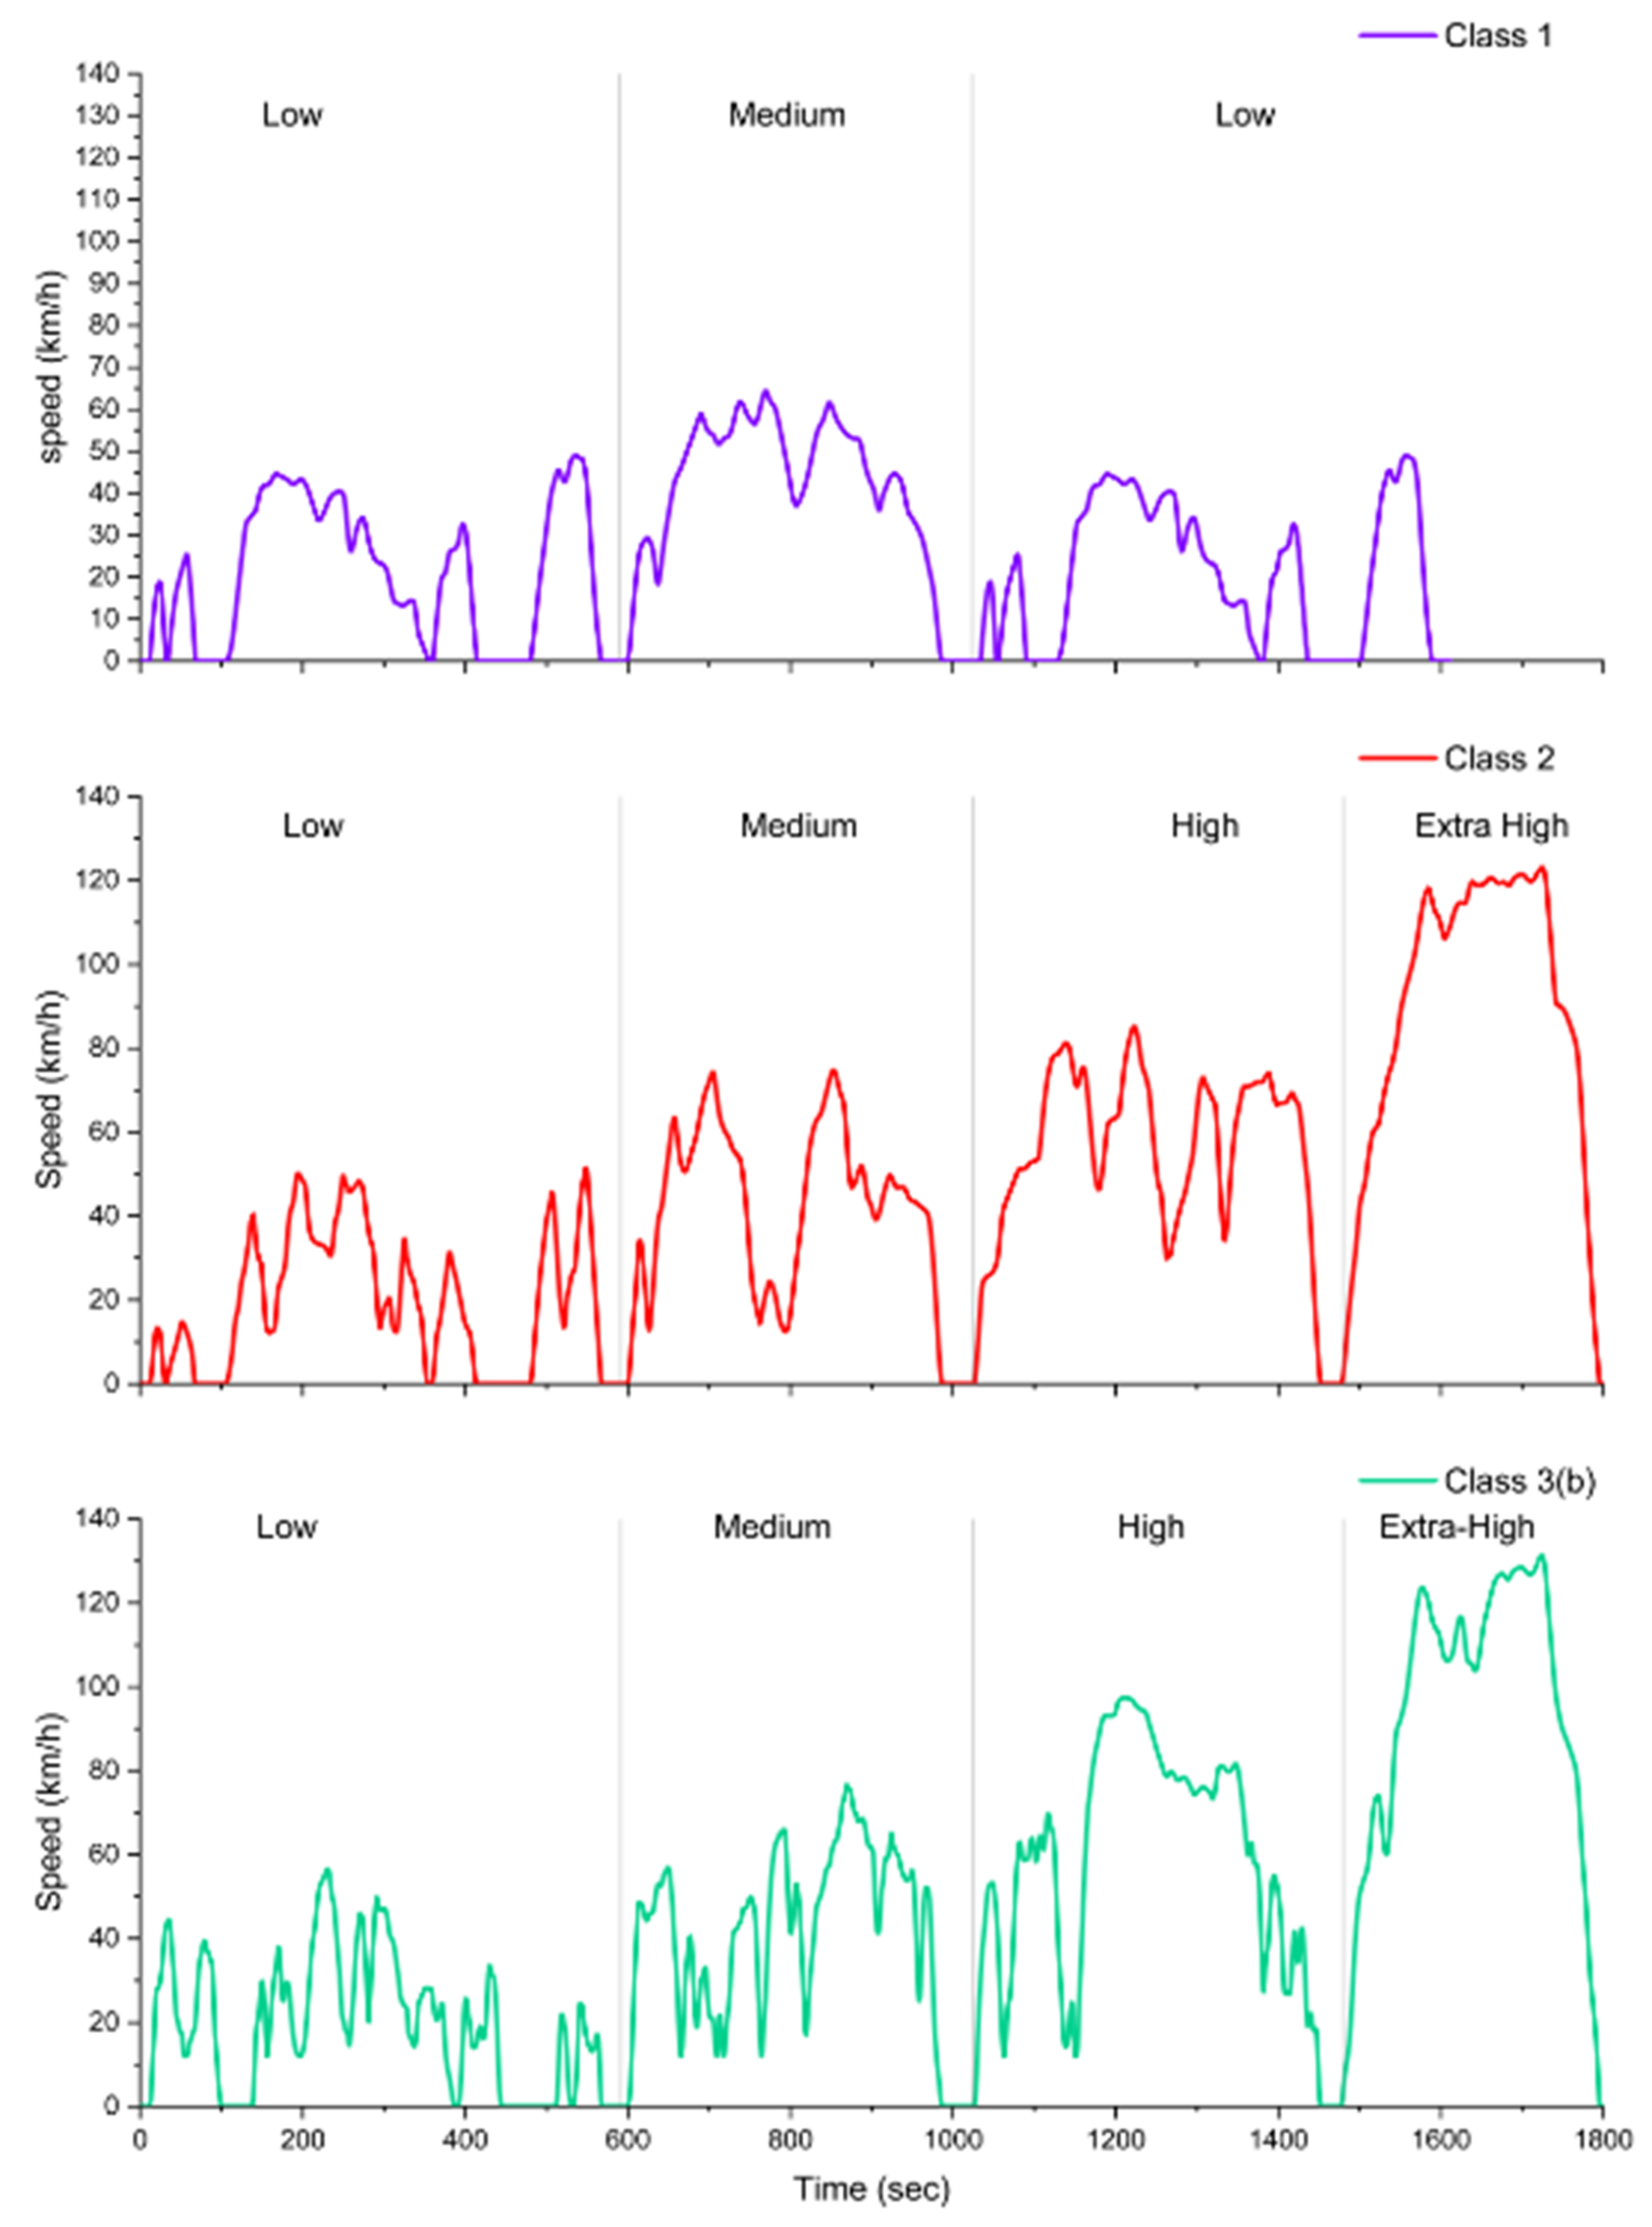
3.1.5. Worldwide
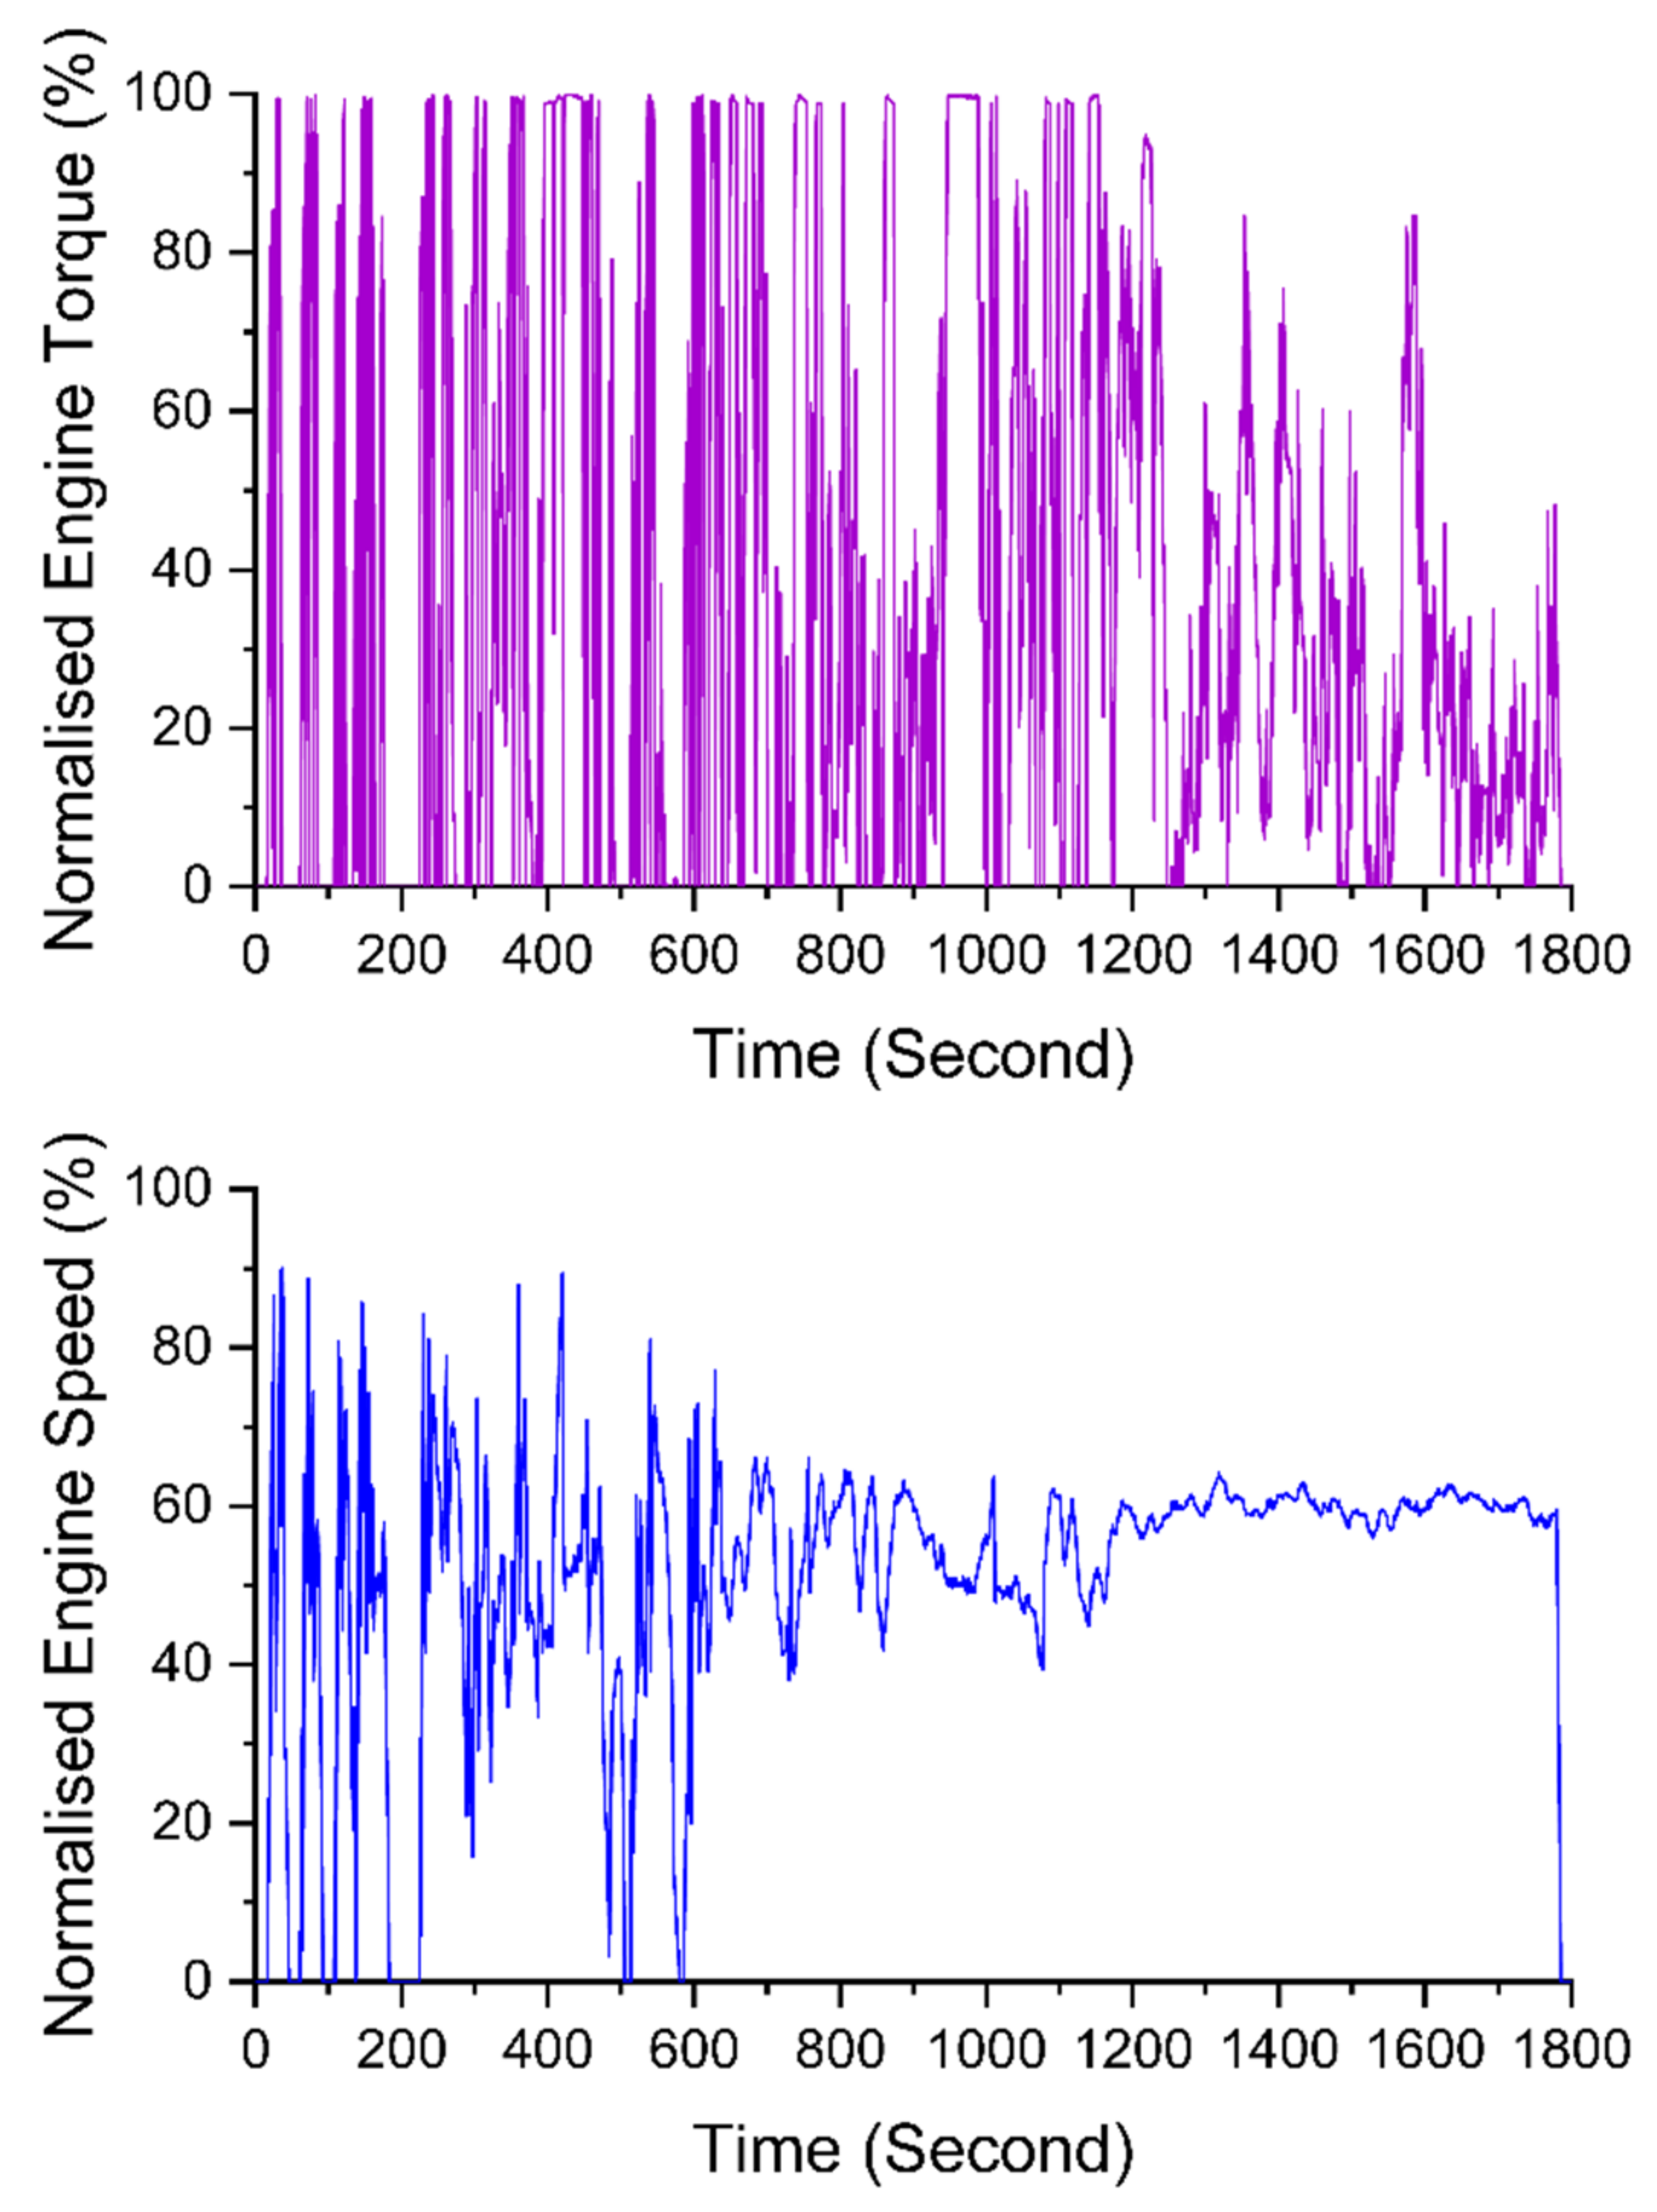
3.2. Heavy-Duty Vehicles
3.2.1. European Union
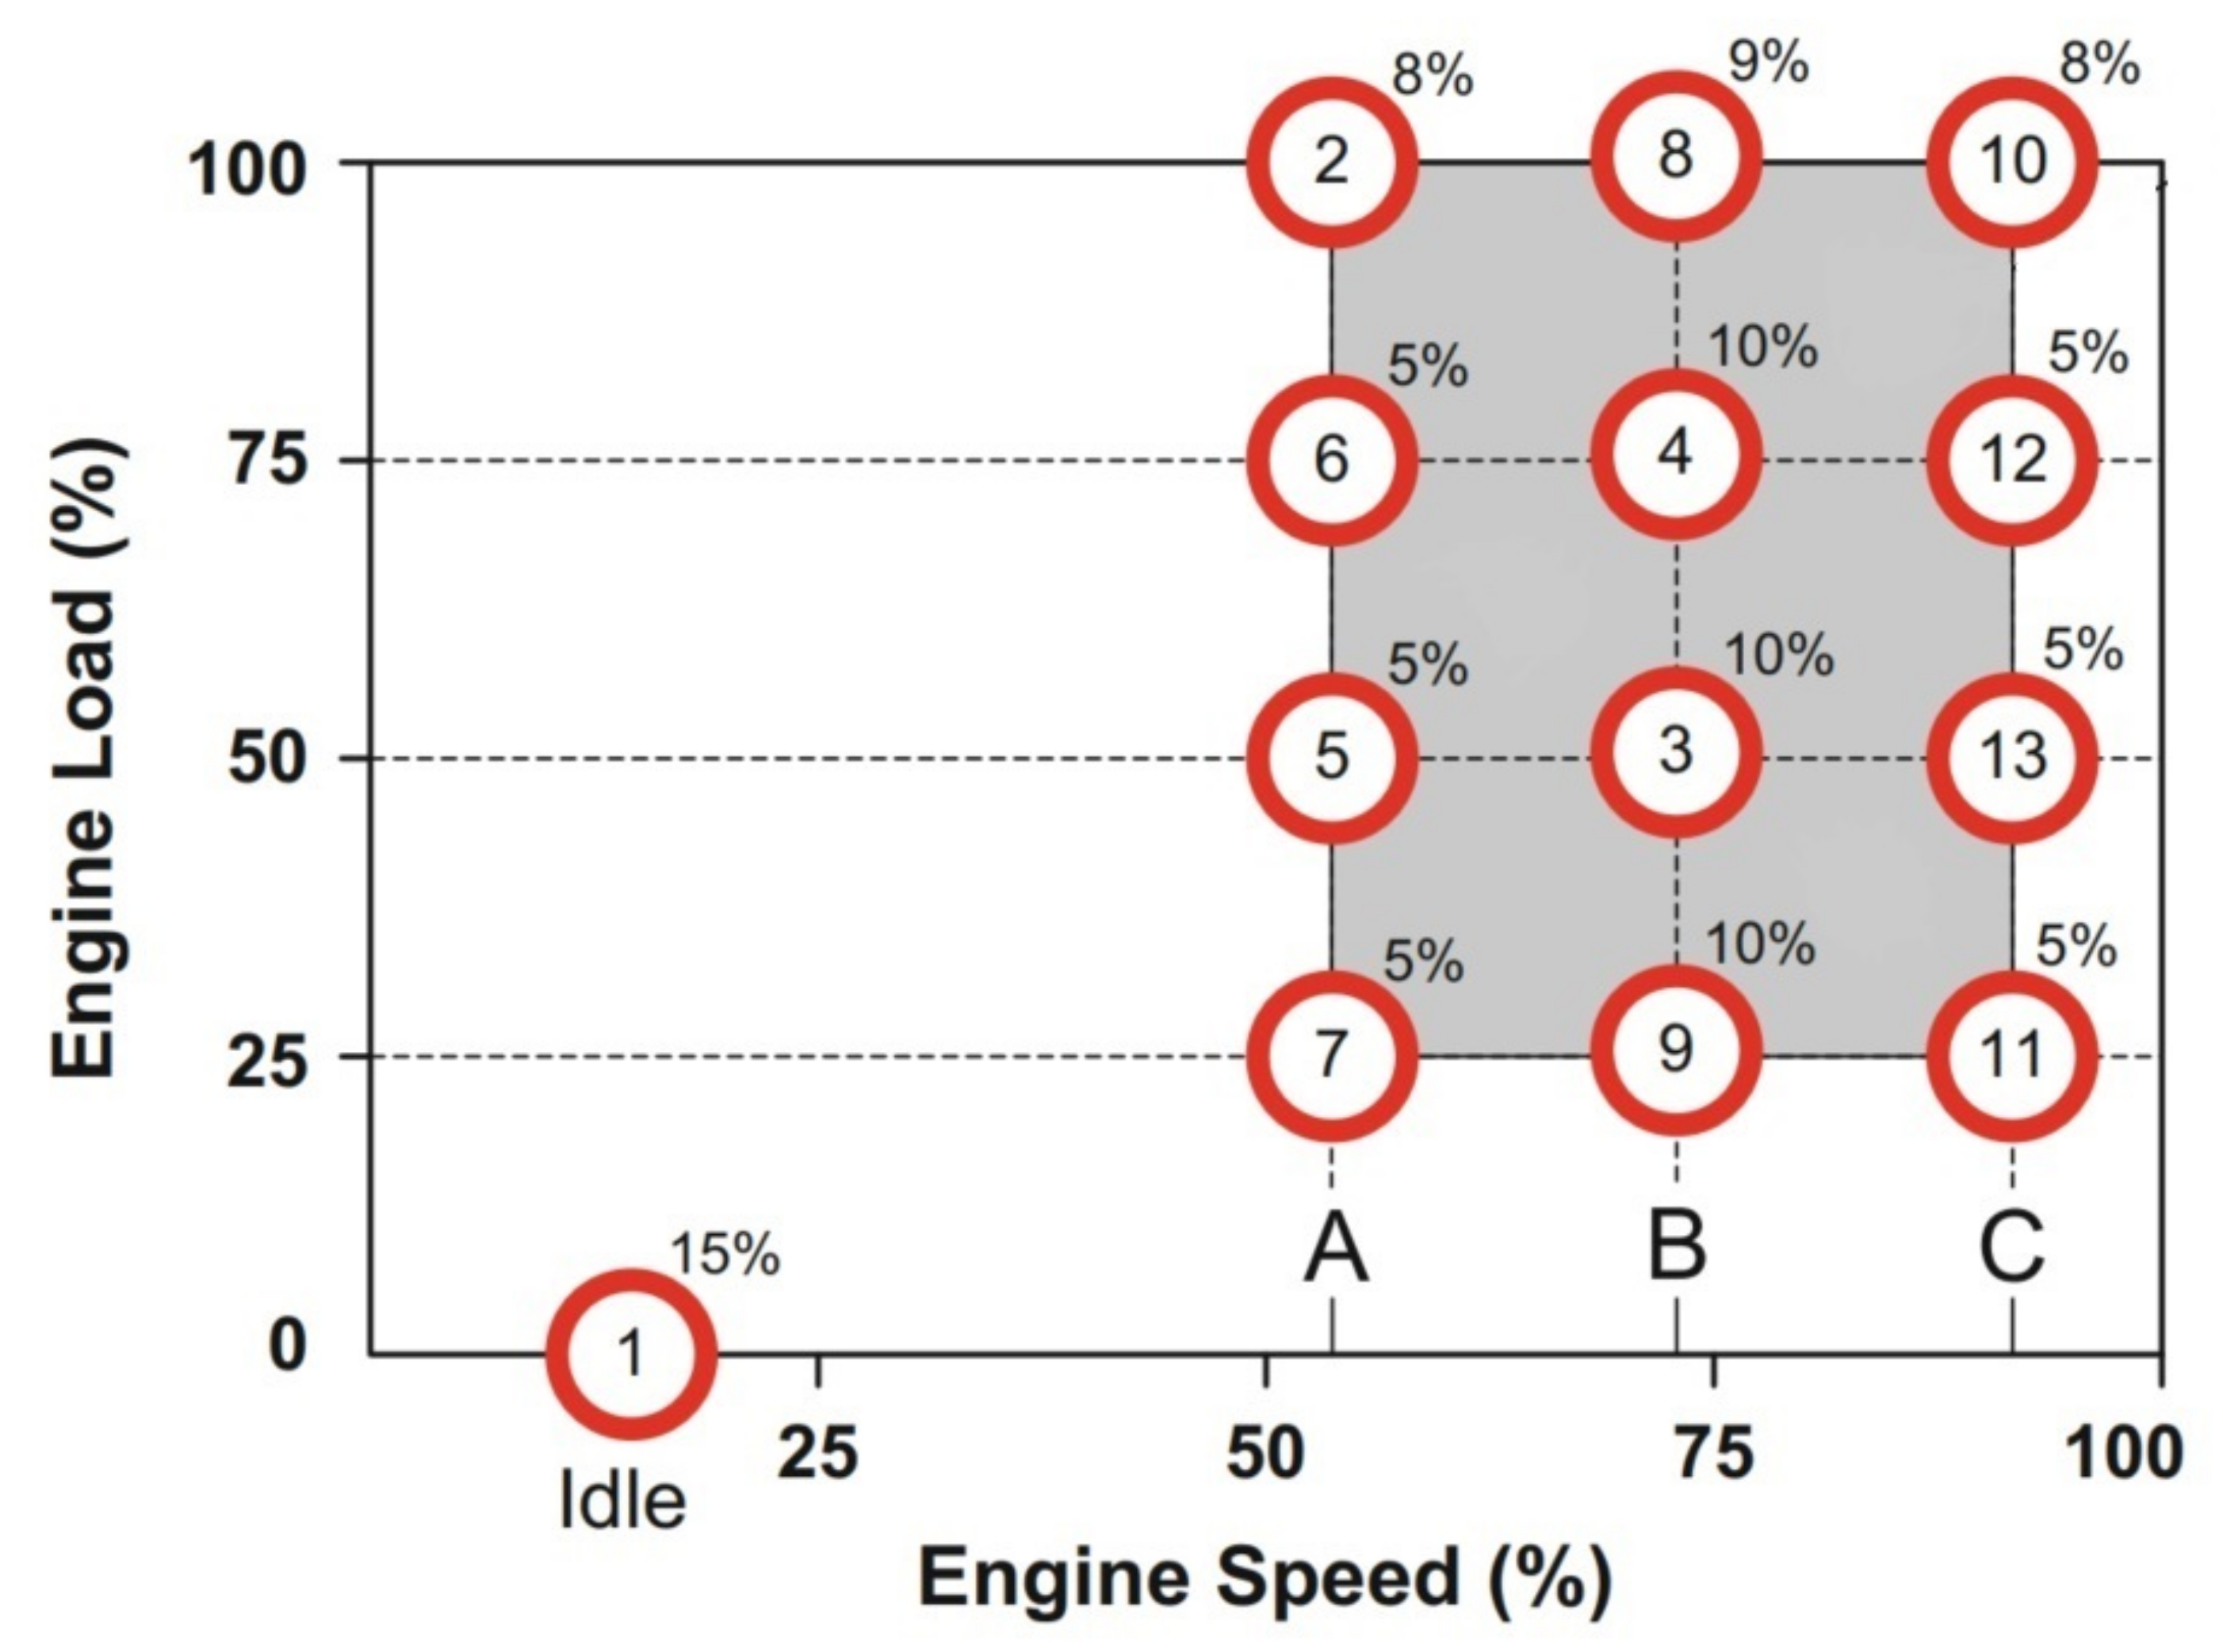
European Stationary Cycle (ESC)
European Transient Cycle (ETC)
3.2.2. United States
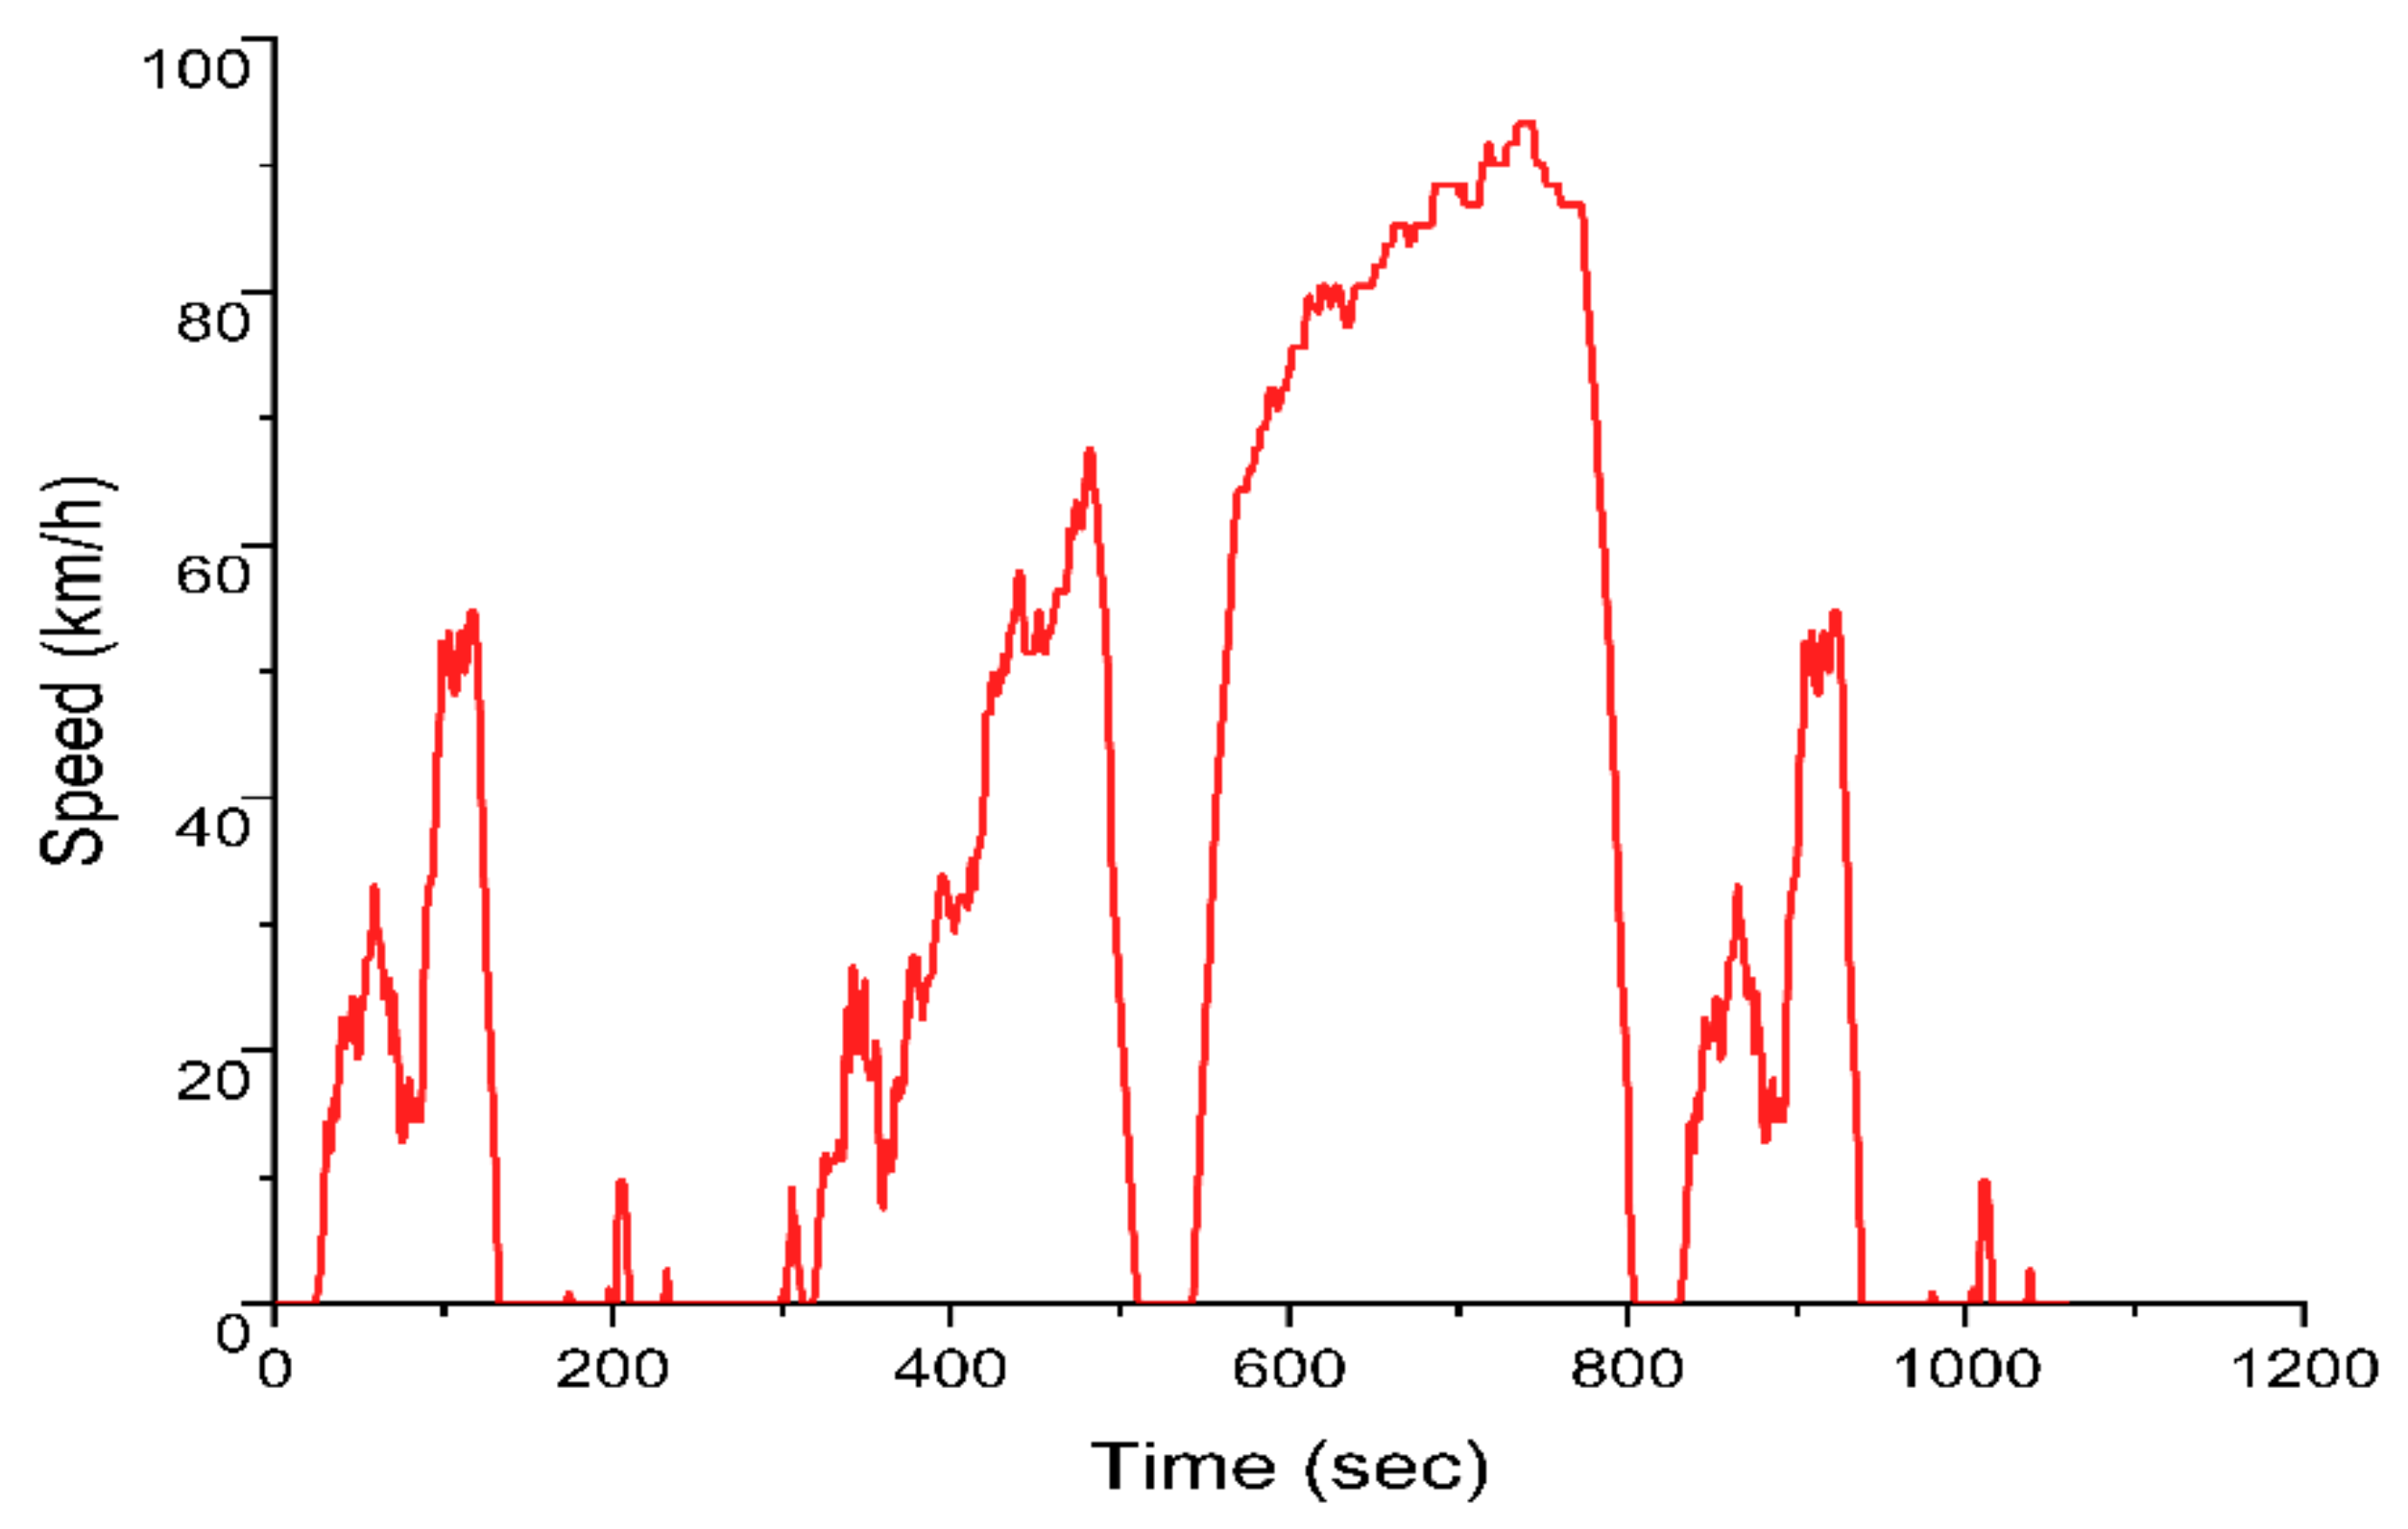
Heavy-Duty-Urban Dynamometer Driving Schedule (HD-UDDS)
- Duration: 1060 s
- Distance: 5.55 miles ≈ 8.9 km
- Vavg: 18.86 mi/h ≈ 30.4 km/h
- Vmax: 58 mi/h ≈ 93.3 km/h
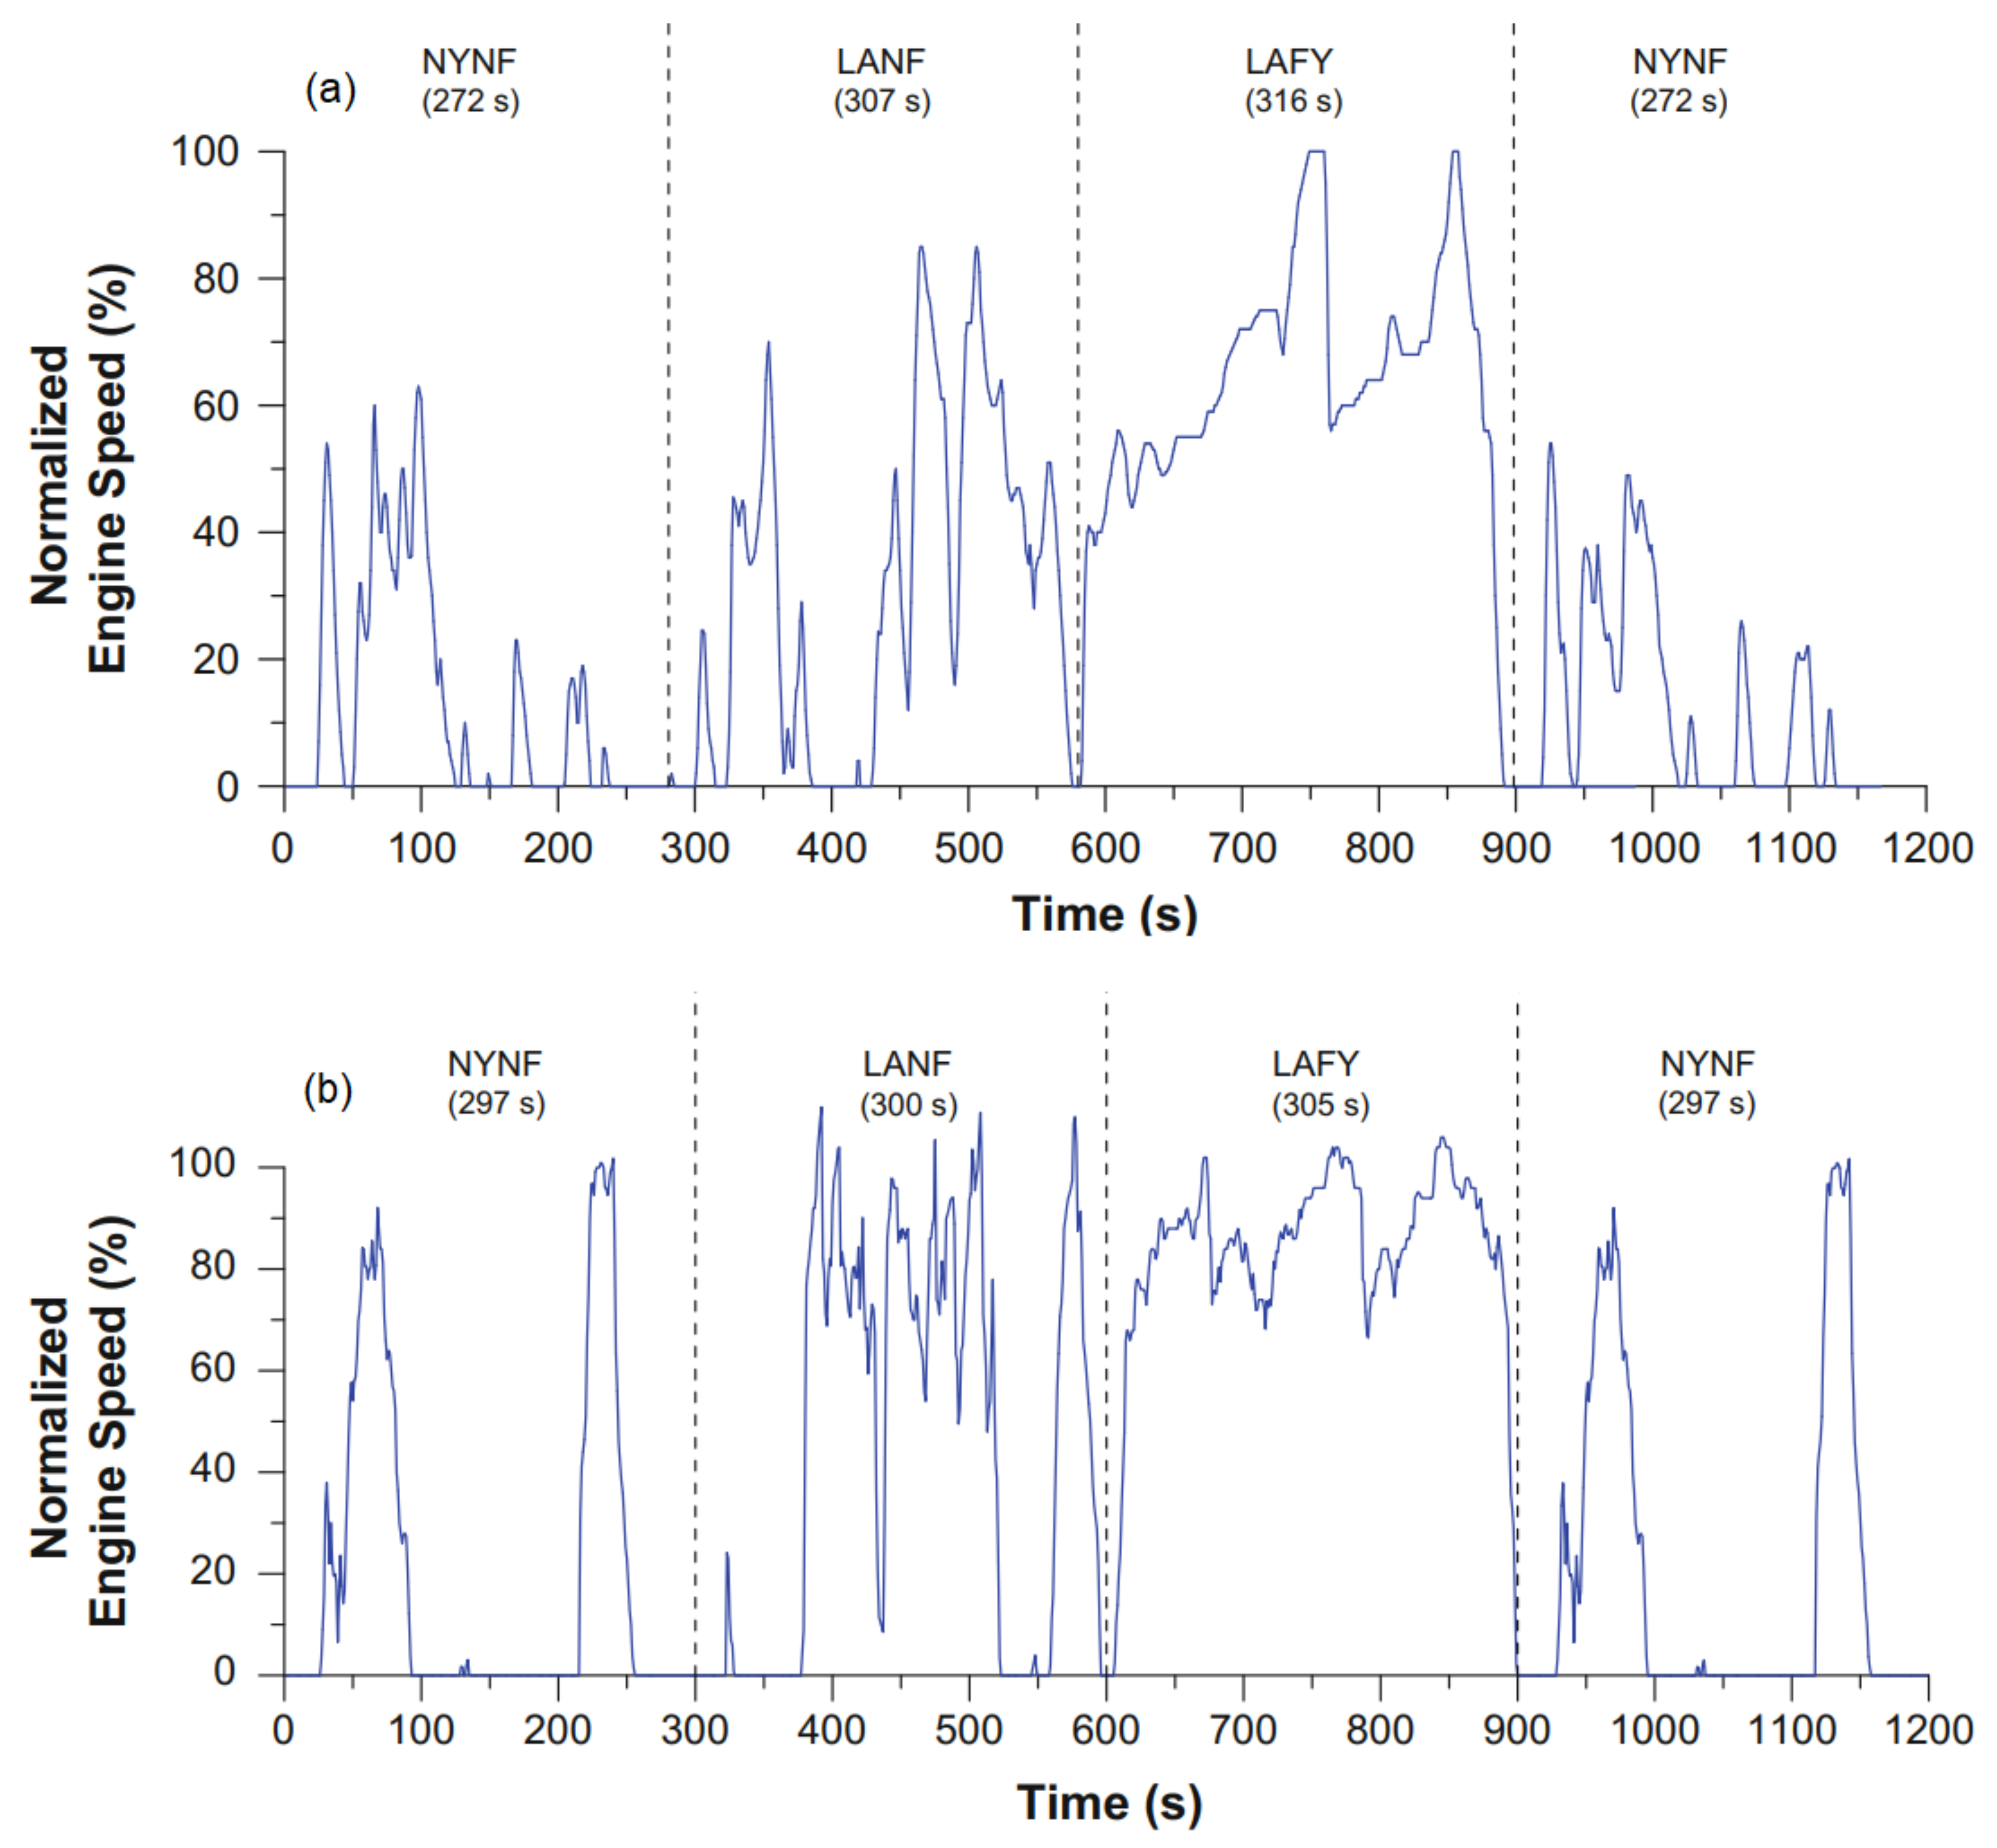
Transient FTP
- (1)
- NYNF phase representing light urban traffic with frequent starts and stops,
- (2)
- LANF phase representing dense urban traffic with few stops,
- (3)
- LAFY phase representing dense freeway traffic in Los Angeles,
- (4)
- a repetition of the first NYNF phase [72].
3.2.3. Japan
3.2.4. Worldwide
3.3. The Controversy over Defeat Devices
4. Development of Real Drive Emission Tests and Cycle
- Urban driving must be achieved on routes with a maximum speed limit of 60 km/h.
- If the urban driving segment includes any road with a speed limit greater than 60 km/h for any reason, the vehicle speed shall not exceed 60 km/h.
- Roads with speed limits lower than the classification can exist in rural and freeway sections.
- The road must be built such that the urban segment is travelled first, then the rural, and eventually the highway sections (using a topographical map).
- It is necessary to operate the vehicle above 100 km/h (measured by the GPS) at least for 5 min.
- The car must be capable of travelling at speeds ranging between 90 to 110 km/h.
5. Real Drive Emission Cycle Tests
- Gasoline cars: i-pentane, acetone, propane, and toluene.
- Light-duty diesel truck: mainly long-chain alkanes- dodecane, n-undecane, naphthalene and n-decane, which in total contributes to 70.4% of total species
- Heavy-duty diesel truck: naphthalene contributed 31.8% of total VOC, which might be due to the engine operating conditions and the pyrolysation from incomplete combustion (Lin et al., 2019a, 2019b).
- LPG bus: short-chain hydrocarbons, acetone, i-pentane, i-butane, n-butane and propane (46.7% of the total VOCs).
6. Comparison of RDE and Laboratory Testing
7. Conclusions
Author Contributions
Funding
Institutional Review Board Statement
Informed Consent Statement
Conflicts of Interest
Nomenclature
| ACC | Adaptive cruise control |
| ADR | Australian Design Rules |
| AEMS | Aerosol Emission Measurement System |
| ARHR | Arterial road hot running |
| ARHS | Arterial road hot start |
| CADC | Common Artemis Drive Cycle |
| CNG | Compressed natural gas |
| CUEDC | Composite Urban Emissions Drive Cycle |
| DNEPM | Diesel National Environment Protection Measure |
| ECE | Economic Commission for Europe |
| EGR | Exhaust Gas Recirculation |
| ELR | European Load Response |
| ESC | European Stationary Cycle |
| ETC | European Transient Cycle |
| EUDC | Extra Urban Driving Cycle |
| FTP | Federal Test Procedure |
| GPF | Gasoline particle filter |
| HDV | Heavy-duty vehicle |
| LANF | Los Angeles Non-Freeway |
| LDV | Light-duty vehicles |
| LNG | Liquid natural gas |
| LPG | Liquified petroleum gas |
| MPS | Micro proportional sampling system |
| NEDC | New European Driving Cycle |
| NEPC | National Environment Protection Commission |
| NRMM | Non-Road Mobile Machinery |
| NYNF | New York Non-Freeway |
| PEMS | Portable Emission Measurement System |
| PFI | Port fuel injection |
| PM | Particulate matter |
| PN | Particle Number |
| RDE | Real driving emission |
| SCR | Selective Catalytic Reduction |
| TA | Type approval |
| TWC | Three-way catalytic converter |
| UDC | Urban driving cycle |
| UDDS | Urban Dynamometer Driving Schedule |
| UNECE | United Nations Economic Commission for Europe |
| VOC | Volatile Organic Compound |
| WHDC | Worldwide harmonised Heavy-Duty Certification |
| WHTC | Worldwide harmonised Transient Cycle |
| WHVC | Worldwide harmonised vehicle cycle |
| WLTC | Worldwide harmonised Light-duty Test Cycle |
| WLTP | Worldwide harmonised Light-duty Test Procedure |
| WTVC | Worldwide transient vehicle cycle |
References
- Mofijur, M.; Fattah, I.R.; Alam, A.; Islam, A.S.; Ong, H.C.; Rahman, S.A.; Najafi, G.; Ahmed, S.; Uddin, A.; Mahlia, T. Impact of COVID-19 on the social, economic, environmental and energy domains: Lessons learnt from a global pandemic. Sustain. Prod. Consum. 2021, 26, 343–359. [Google Scholar] [CrossRef] [PubMed]
- International Energy Agency (IEA). Global Energy Review. 2021. Available online: https://www.iea.org/reports/global-energy-review-2021 (accessed on 1 July 2021).
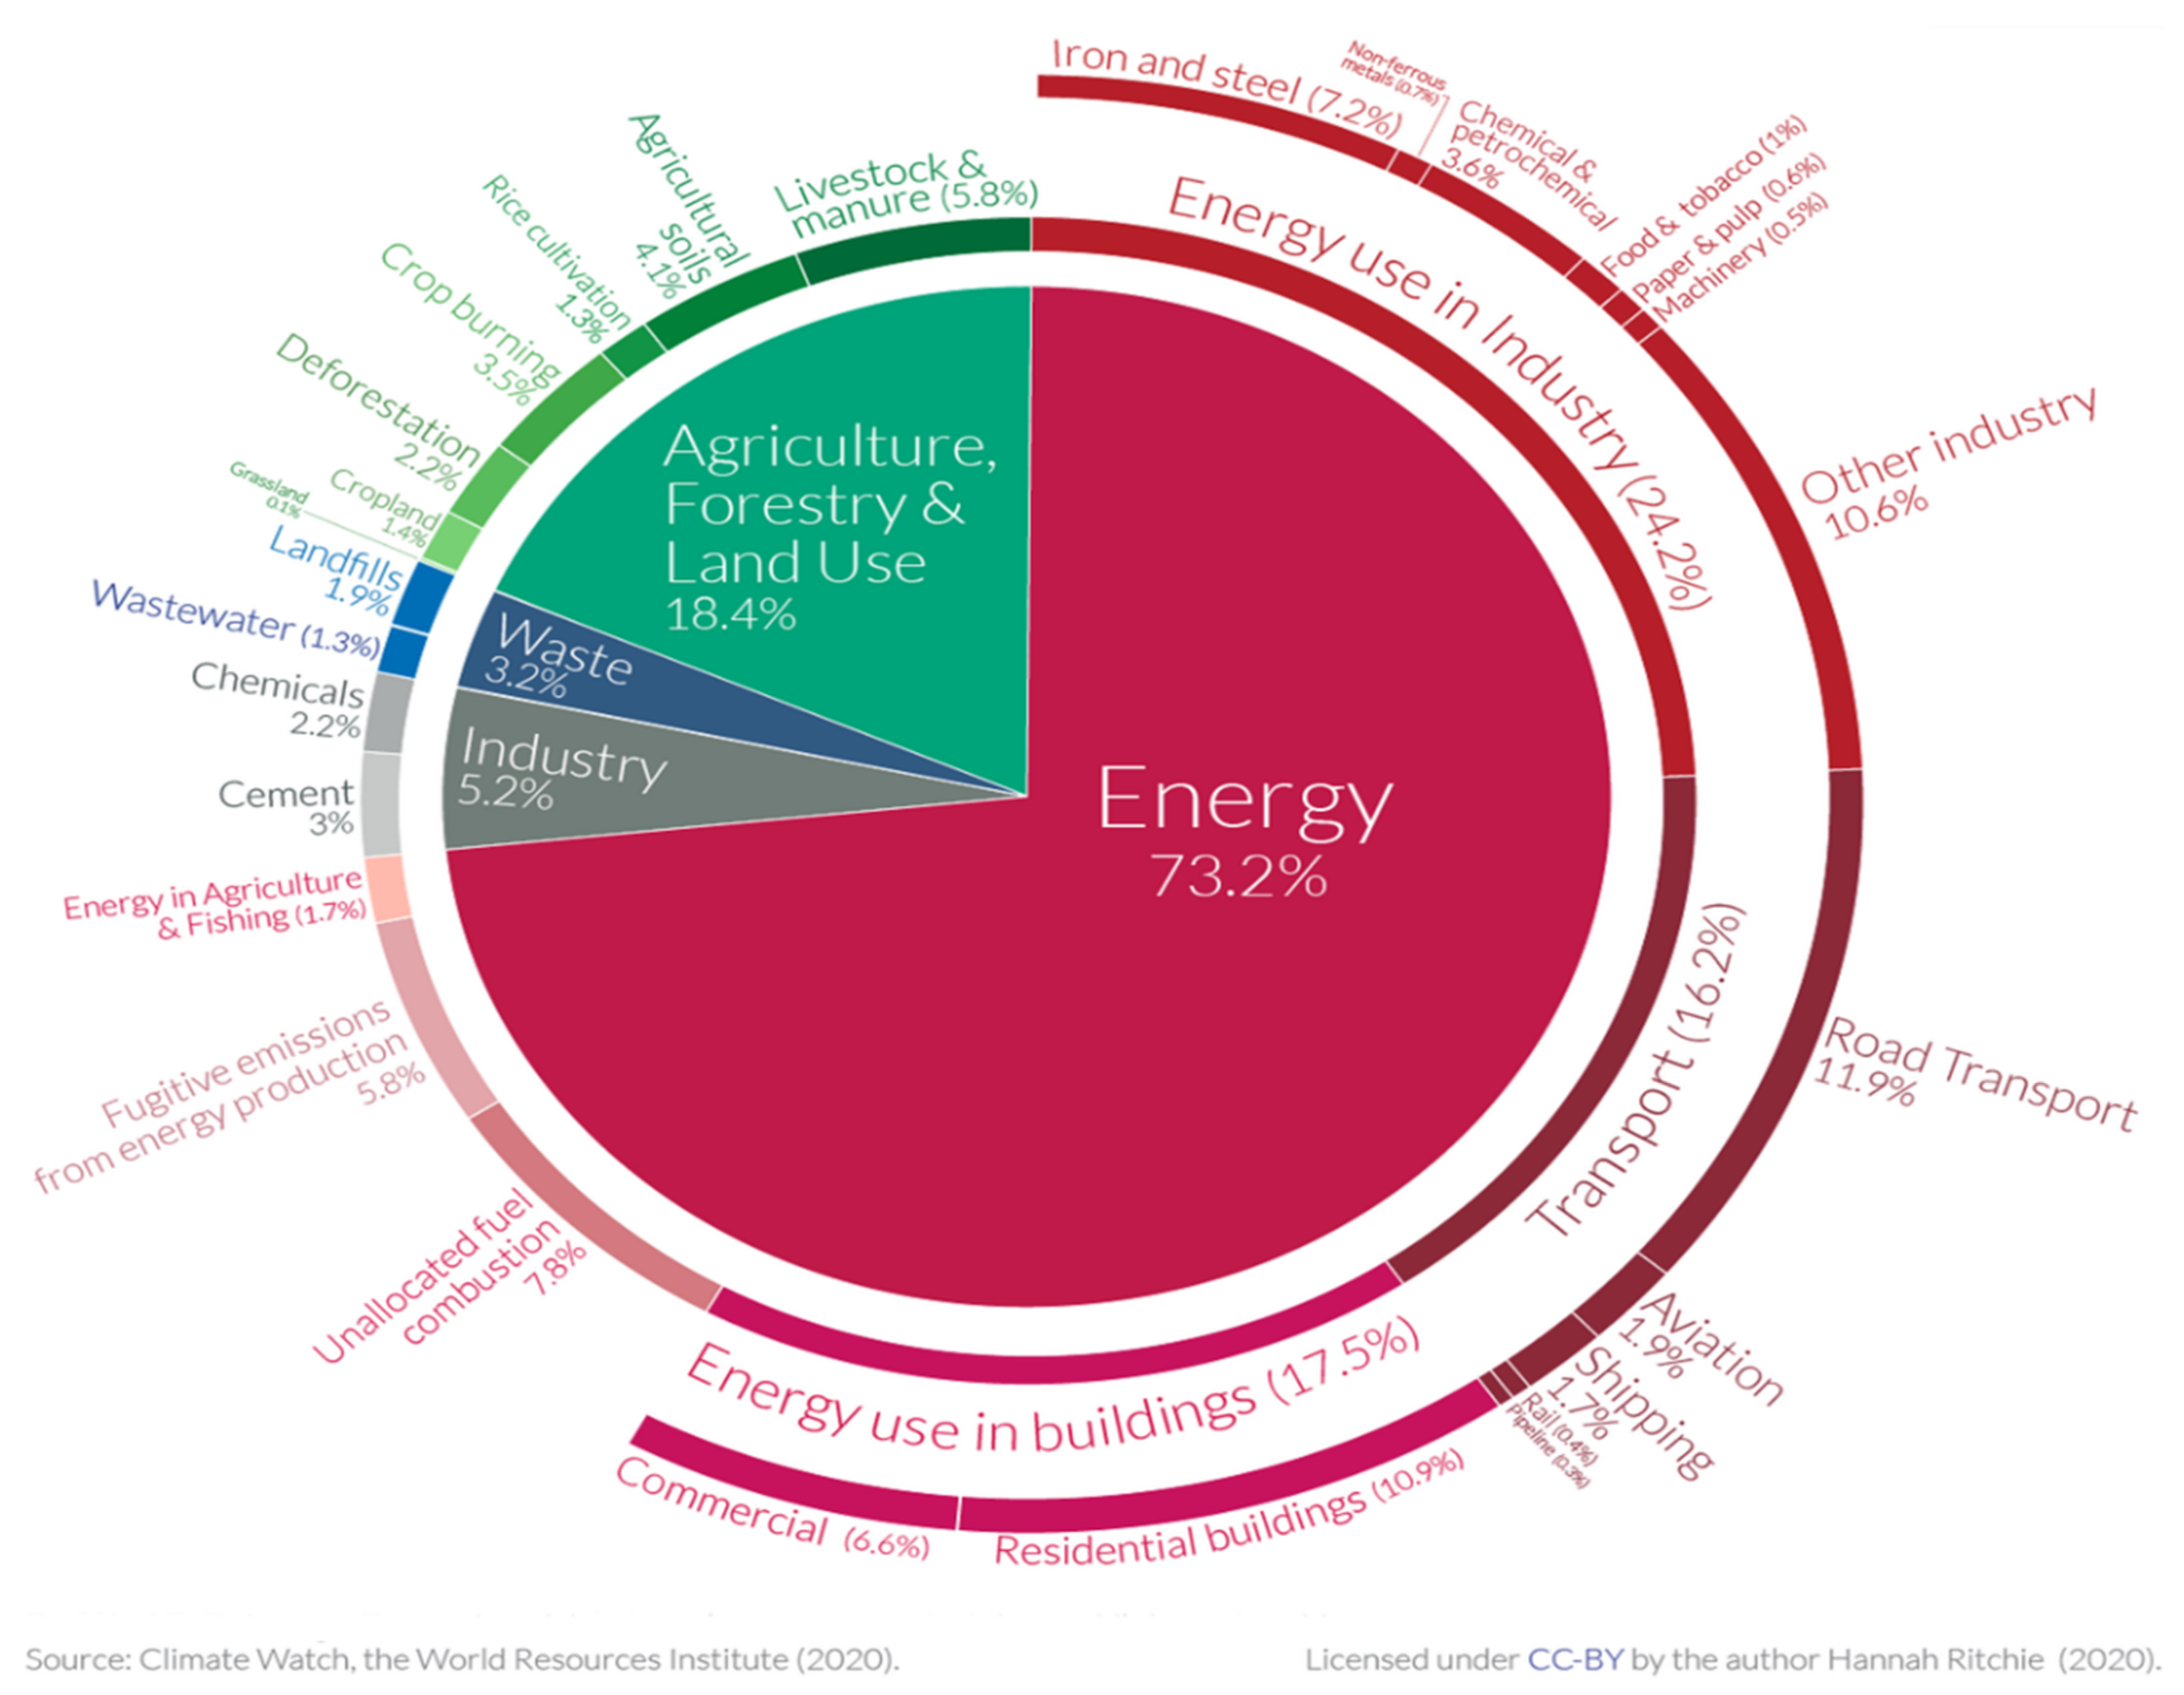
- Ritchie, H.; Roser, M. Emissions by Sector. Available online: https://ourworldindata.org/emissions-by-sector (accessed on 1 July 2021).
- Mengpin, G.; Johannes, F. 4 Charts Explain Greenhouse Gas Emissions by Countries and Sectors. Available online: https://www.climatewatchdata.org/ (accessed on 1 July 2021).
- McGrath, M. Climate Change and Coronavirus: Five Charts about the Biggest Carbon Crash. Available online: https://www.bbc.com/news/science-environment-52485712 (accessed on 24 September 2020).
- Johns Hopkins University (JHU). COVID-19 Dashboard by the Center for Systems Science and Engineering (CSSE) at Johns Hopkins Coronavirus Resource Center. Global Map. Available online: https://coronavirus.jhu.edu/map.html. (accessed on 3 July 2021).
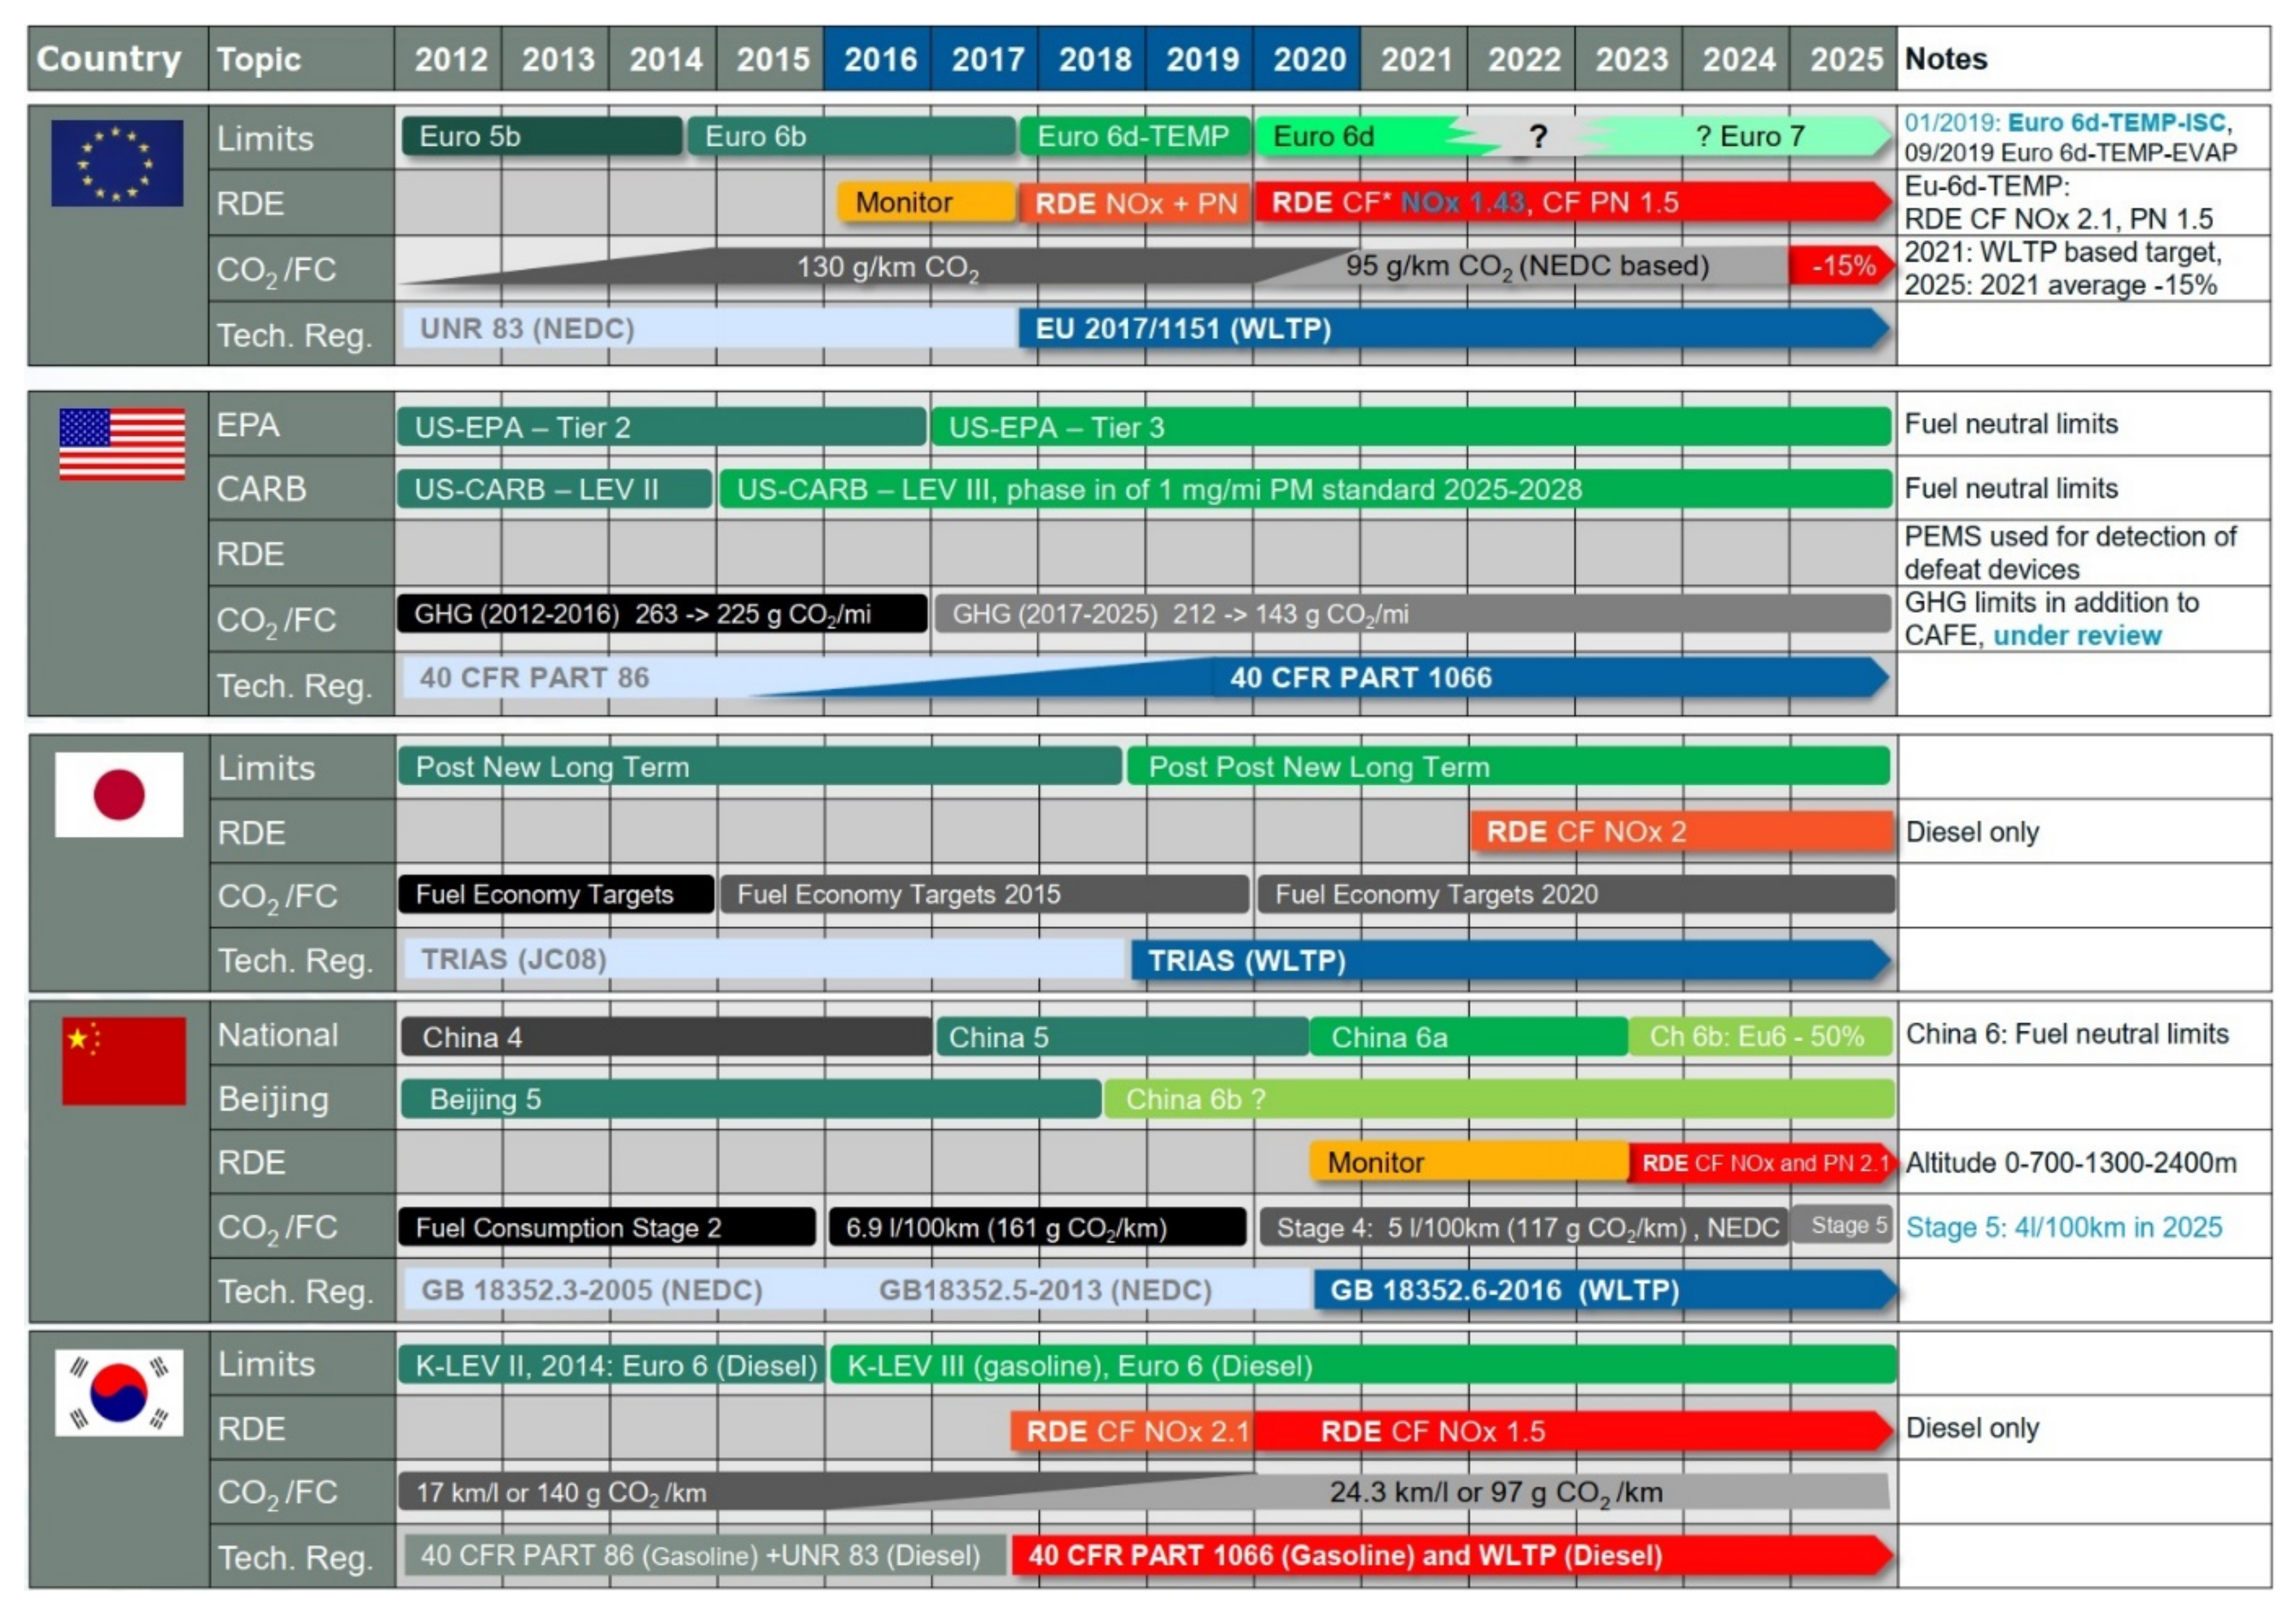
- Delphi Technologies. Current Emissions Standard Guides. Available online: https://www.delphi.com/innovations/emissions-standards-booklets (accessed on 24 September 2020).
- Engeljehringer, K. Emission Regulation Trends. Available online: https://www.avl.com/documents/1982862/8084402/01+-+AVL-TechDay+Mattsee+-+Emission+Regulations+-+2018-04-05b.pdf (accessed on 6 July 2021).
- Al-Kindi, S.G.; Brook, R.D.; Biswal, S.; Rajagopalan, S. Environmental determinants of cardiovascular disease: Lessons learned from air pollution. Nat. Rev. Cardiol. 2020, 17, 656–672. [Google Scholar] [CrossRef] [PubMed]
- Xie, J.; Teng, J.; Fan, Y.; Xie, R.; Shen, A. The short-term effects of air pollutants on hospitalizations for respiratory disease in Hefei, China. Int. J. Biometeorol. 2019, 63, 315–326. [Google Scholar] [CrossRef] [PubMed]
- Van Mierlo, J.; Maggetto, G.; Van de Burgwal, E.; Gense, R. Driving style and traffic measures-influence on vehicle emissions and fuel consumption. Proc. Inst. Mech. Eng. Part D J. Automob. Eng. 2004, 218, 43–50. [Google Scholar] [CrossRef]
- Perry, R.; Gee, I. Vehicle emissions in relation to fuel composition. Sci. Total Environ. 1995, 169, 149–156. [Google Scholar] [CrossRef]
- Noland, R.B.; Quddus, M.A. Flow improvements and vehicle emissions: Effects of trip generation and emission control technology. Transp. Res. Part D Transp. Environ. 2006, 11, 1–14. [Google Scholar] [CrossRef] [Green Version]
- Drozd, G.T.; Zhao, Y.; Saliba, G.; Frodin, B.; Maddox, C.; Weber, R.J.; Chang, M.-C.O.; Maldonado, H.; Sardar, S.; Robinson, A.L.; et al. Time Resolved Measurements of Speciated Tailpipe Emissions from Motor Vehicles: Trends with Emission Control Technology, Cold Start Effects, and Speciation. Environ. Sci. Technol. 2016, 50, 13592–13599. [Google Scholar] [CrossRef]
- Franco, V.; Kousoulidou, M.; Muntean, M.; Ntziachristos, L.; Hausberger, S.; Dilara, P. Road vehicle emission factors development: A review. Atmos. Environ. 2013, 70, 84–97. [Google Scholar] [CrossRef]
- Samuel, S.; Austin, L.; Morrey, D. Automotive test drive cycles for emission measurement and real-world emission levels-a review. Proc. Inst. Mech. Eng. Part D J. Automob. Eng. 2002, 216, 555–564. [Google Scholar] [CrossRef]
- Kleeman, P. A fresh look at predicting carbon monoxide impacts at highway intersections. In Proceedings of the Transport Research Board A1 FC03-AIF06 Joint Summer Meeting, Ann Arbor, MI, USA, 11–15 January 1998. [Google Scholar]
- Varella, R.A.; Duarte, G.; Baptista, P.; Sousa, L.; Villafuerte, P.M. Comparison of Data Analysis Methods for European Real Driving Emissions Regulation. SAE Tech. Pap. Ser. 2017, 1, 997. [Google Scholar] [CrossRef]
- Ashtari, A.; Bibeau, E.; Shahidinejad, S. Using Large Driving Record Samples and a Stochastic Approach for Real-World Driving Cycle Construction: Winnipeg Driving Cycle. Transp. Sci. 2014, 48, 170–183. [Google Scholar] [CrossRef]
- Gong, Q.; Midlam-Mohler, S.; Marano, V.; Rizzoni, G. An Iterative Markov Chain Approach for Generating Vehicle Driving Cycles. SAE Int. J. Engines 2011, 4, 1035–1045. [Google Scholar] [CrossRef]
- Nyberg, P.; Frisk, E.; Nielsen, L. Driving Cycle Equivalence and Transformation. IEEE Trans. Veh. Technol. 2017, 66, 1963–1974. [Google Scholar] [CrossRef] [Green Version]
- Merkisz, J.; Pielecha, J. Comparison of Real Driving Emissions tests. IOP Conf. Ser. Mater. Sci. Eng. 2018, 421, 042055. [Google Scholar] [CrossRef]
- Kamińska, M.; Rymaniak, Ł.; Lijewski, P.; Szymlet, N.; Daszkiewicz, P.; Grzeszczyk, R. Investigations of Exhaust Emissions from Rail Machinery during Track Maintenance Operations. Energies 2021, 14, 3141. [Google Scholar] [CrossRef]
- Warguła, Ł.; Kukla, M.; Lijewski, P.; Dobrzyński, M.; Markiewicz, F. Influence of Innovative Woodchipper Speed Control Systems on Exhaust Gas Emissions and Fuel Consumption in Urban Areas. Energies 2020, 13, 3330. [Google Scholar] [CrossRef]
- Waluś, K.J.; Warguła, Ł.; Krawiec, P.; Adamiec, J.M. Legal regulations of restrictions of air pollution made by non-road mobile machinery—The case study for Europe: A review. Environ. Sci. Pollut. Res. 2018, 25, 3243–3259. [Google Scholar] [CrossRef] [Green Version]
- Rymaniak, Ł.; Lijewski, P.; Kamińska, M.; Fuć, P.; Kurc, B.; Siedlecki, M.; Kalociński, T.; Jagielski, A. The role of real power output from farm tractor engines in determining their environmental performance in actual operating conditions. Comput. Electron. Agric. 2020, 173, 105405. [Google Scholar] [CrossRef]
- Warguła, Ł.; Kukla, M.; Lijewski, P.; Dobrzyński, M.; Markiewicz, F. Impact of Compressed Natural Gas (CNG) Fuel Systems in Small Engine Wood Chippers on Exhaust Emissions and Fuel Consumption. Energies 2020, 13, 6709. [Google Scholar] [CrossRef]
- Warguła, Ł.; Kukla, M.; Lijewski, P.; Dobrzyński, M.; Markiewicz, F. Influence of the Use of Liquefied Petroleum Gas (LPG) Systems in Woodchippers Powered by Small Engines on Exhaust Emissions and Operating Costs. Energies 2020, 13, 5773. [Google Scholar] [CrossRef]
- Mahlia, T.M.I.; Tohno, S.; Tezuka, T. A review on fuel economy test procedure for automobiles: Implementation possibilities in Malaysia and lessons for other countries. Renew. Sustain. Energy Rev. 2012, 16, 4029–4046. [Google Scholar] [CrossRef]
- Hooftman, N.; Messagie, M.; Van Mierlo, J.; Coosemans, T. A review of the European passenger car regulations—Real driving emissions vs local air quality. Renew. Sustain. Energy Rev. 2018, 86, 1–21. [Google Scholar] [CrossRef]
- Agarwal, A.K.; Mustafi, N.N. Real-world automotive emissions: Monitoring methodologies, and control measures. Renew. Sustain. Energy Rev. 2021, 137, 110624. [Google Scholar] [CrossRef]
- Graham, L.A.; Rideout, G.; Rosenblatt, D.; Hendren, J. Greenhouse gas emissions from heavy-duty vehicles. Atmos. Environ. 2008, 42, 4665–4681. [Google Scholar] [CrossRef]
- Ashraful, A.M.; Masjuki, H.H.; Kalam, M.A.; Fattah, I.M.R.; Imtenan, S.; Shahir, S.A.; Mobarak, H.M. Production and comparison of fuel properties, engine performance, and emission characteristics of biodiesel from various non-edible vegetable oils: A review. Energy Convers. Manag. 2014, 80, 202–228. [Google Scholar] [CrossRef]
- Fattah, I.R.; Masjuki, H.; Liaquat, A.; Ramli, R.; Kalam, A.; Riazuddin, V. Impact of various biodiesel fuels obtained from edible and non-edible oils on engine exhaust gas and noise emissions. Renew. Sustain. Energy Rev. 2013, 18, 552–567. [Google Scholar] [CrossRef]
- Giakoumis, E.G. Driving and Engine Cycles; Springer Science and Business Media LLC: Cham, Switzerland, 2017. [Google Scholar]
- Tzirakis, E.; Pitsas, K.; Zannikos, F.; Stournas, S. Vehicle emissions and driving cycles: Comparison of the Athens Driving Cycle (ADC) with ECE-15 and European Driving Cycle (EDC). Glob. NEST J. 2006, 8, 282–290. [Google Scholar] [CrossRef]
- Lyons, T.; Kenworthy, J.; Austin, P.; Newman, P. The development of a driving cycle for fuel consumption and emissions evaluation. Transp. Res. Part A Gen. 1986, 20, 447–462. [Google Scholar] [CrossRef]
- Kühler, M.; Karstens, D. Improved Driving Cycle for Testing Automotive Exhaust Emissions. SAE Tech. Pap. Ser. 1978. [Google Scholar] [CrossRef]
- Tong, H.; Hung, W.; Cheung, C. Development of a driving cycle for Hong Kong. Atmos. Environ. 1999, 33, 2323–2335. [Google Scholar] [CrossRef]
- Giakoumis, E.; Rakopoulos, C.; Dimaratos, A.M.; Rakopoulos, D.C. Exhaust emissions with ethanol or n-butanol diesel fuel blends during transient operation: A review. Renew. Sustain. Energy Rev. 2013, 17, 170–190. [Google Scholar] [CrossRef]
- Andreae, M.; Salemme, G.; Kumar, M.; Sun, Z. Emissions Certification Vehicle Cycles Based on Heavy Duty Engine Test Cycles. SAE Int. J. Commer. Veh. 2012, 5, 299–309. [Google Scholar] [CrossRef]
- Watson, H.; Milkins, E.; Braunsteins, J. Development of the Melbourne peak cycle. In Proceedings of the Second Conference on Traffic Energy and Emissions, Melbourne, Australia, 19–21 May 1982. [Google Scholar]
- Metwalley, S.M.; Abouel-Seoud, S.; Farahat, A.M. Determination of the catalytic converter performance of bi-fuel vehicle. J. Pet. Technol. Altern. Fuels 2011, 2, 111–131. [Google Scholar]
- Bullock, K.J. Driving cycles. In Proceedings of the Second Conference on Traffic, Energy and Emissions, Melbourne, Australia, 19–21 May 1982; pp. 1–18. [Google Scholar]
- Yang, Z.; Deng, B.; Deng, M.; Huang, S. An Overview of Chassis Dynamometer in the Testing of Vehicle Emission. MATEC Web Conf. 2018, 175, 02015. [Google Scholar] [CrossRef]
- McCormick, R.L.; Ryan, L.B.; Daniels, T.L.; Yanowitz, J.; Graboski, M.S. Comparison of Chasis Dynamometer In-Use Emissions with Engine Dynamometer FTP Emissions for Three Heavy-Duty Diesel Vehicles. SAE Tech. Pap. Ser. 1998. [Google Scholar] [CrossRef]
- Sharpe, B. Testing Methods for Heavy-Duty Vehicle Fuel Efficiency: Trends from Regulatory Programs Around the World and Implications for India; International Council on Clean Transportation: Washington, DC, USA, 2015. [Google Scholar]
- Fattah, I.M.R.; Masjuki, H.; Kalam, A.; Mofijur, M.; Abedin, M. Effect of antioxidant on the performance and emission characteristics of a diesel engine fueled with palm biodiesel blends. Energy Convers. Manag. 2014, 79, 265–272. [Google Scholar] [CrossRef]
- Fattah, I.M.R.; Masjuki, H.; Alam, M.A.; Wakil, M.; Ashraful, A.; Shahir, S. Experimental investigation of performance and regulated emissions of a diesel engine with Calophyllum inophyllum biodiesel blends accompanied by oxidation inhibitors. Energy Convers. Manag. 2014, 83, 232–240. [Google Scholar] [CrossRef]
- May, J.; Favre, C.; Bosteels, D. Emissions from Euro 3 to Euro 6 light-duty vehicles equipped with a range of emissions control technologies. In Internal Combustion Engines: Performance, Fuel Economy and Emissions; Woodhead Publishing: Sawston, UK, 2013; pp. 55–65. [Google Scholar]
- Martyr, A.J.; Plint, M.A. Engine Testing: Theory and Practice; Elsevier: Amsterdam, The Netherlands, 2011. [Google Scholar]
- Joumard, R.; André, M.; Vidon, R.; Tassel, P.; Pruvost, C. Influence of driving cycles on unit emissions from passenger cars. Atmos. Environ. 2000, 34, 4621–4628. [Google Scholar] [CrossRef]
- Triantafyllopoulos, G.; Dimaratos, A.; Ntziachristos, L.; Bernard, Y.; Dornoff, J.; Samaras, Z. A study on the CO2 and NOx emissions performance of Euro 6 diesel vehicles under various chassis dynamometer and on-road conditions including latest regulatory provisions. Sci. Total Environ. 2019, 666, 337–346. [Google Scholar] [CrossRef] [PubMed]
- Pavlovic, J.; Ciuffo, B.; Fontaras, G.; Valverde, V.; Marotta, A. How much difference in type-approval CO2 emissions from passenger cars in Europe can be expected from changing to the new test procedure (NEDC vs. WLTP)? Transp. Res. Part A: Policy Pr. 2018, 111, 136–147. [Google Scholar] [CrossRef]
- Pelkmans, L.; Debal, P. Comparison of on-road emissions with emissions measured on chassis dynamometer test cycles. Transp. Res. Part D Transp. Environ. 2006, 11, 233–241. [Google Scholar] [CrossRef]
- Berg, W. Legislation for the Reduction of Exhaust Gas Emissions. In The Handbook of Environmental Chemistry; Springer Science and Business Media LLC: Berlin/Heidelberg, Germany, 2003; pp. 175–253. [Google Scholar]
- Australian Automobile Association. Fuel Economy and Emissions Report. 2017. Available online: https://www.accc.gov.au/system/files/Australian%20Automobile%20Association%20-%20supplementary%20submission%201%20-%20October%202017_0.pdf (accessed on 1 July 2021).
- Brown, S.; Bryett, C.; Mowle, M. In-Service Emissions Performance—Drive Cycles. Available online: http://nepc.gov.au/system/files/resources/45fee0f3-1266-a944-91d7-3b98439de8f8/files/dve-prepwk-project2-1.pdf (accessed on 1 July 2021).
- Anyon, P.; Brown, S.; Pattison, D.; Beville-Anderson, J.; Walls, G.; Mowle, M. In-Service Emissions Performance—Phase 2: Vehicle Testing. Available online: http://www.nepc.gov.au/system/files/resources/45fee0f3-1266-a944-91d7-3b98439de8f8/files/dve-prepwk-project2-2.pdf (accessed on 1 July 2021).
- DieselNet. Petrol CUEDC & SPC240. Available online: https://dieselnet.com/standards/cycles/cuedc_spc240.php (accessed on 1 July 2021).
- Ciuffo, B.; Maratta, A.; Tutuianu, M.; Anagnostopoulos, K.; Fontaras, G.; Pavlovic, J.; Serra, S.; Tsiakmakis, S.; Zacharof, N. The development of the World-Wide Harmonized Test Procedure for Light Duty Vehicles (WLTP) and the Pathway for its Implementation into the EU Legislation. Transp. Res. Rec. J. Transp. Res. Board 2015, 2503, 110–118. [Google Scholar] [CrossRef]
- Tsokolis, D.; Tsiakmakis, S.; Dimaratos, A.; Fontaras, G.; Pistikopoulos, P.; Ciuffo, B.; Samaras, Z. Fuel consumption and CO2 emissions of passenger cars over the New Worldwide Harmonized Test Protocol. Appl. Energy 2016, 179, 1152–1165. [Google Scholar] [CrossRef]
- Tutuianu, M.; Bonnel, P.; Ciuffo, B.; Haniu, T.; Ichikawa, N.; Marotta, A.; Pavlovic, J.; Steven, H. Development of the World-wide harmonized Light duty Test Cycle (WLTC) and a possible pathway for its introduction in the European legislation. Transp. Res. Part D Transp. Environ. 2015, 40, 61–75. [Google Scholar] [CrossRef]
- Tutuianu, M.; Marotta, A.; Steven, H.; Ericsson, E.; Haniu, T.; Ichikawa, N.; Ishii, H. Development of a World-wide Worldwide harmonized Light duty driving Test Cycle (WLTC). UN/ECE/WP.29/GRPE/WLTP-IG. In Proceedings of the 3rd VPSD Meeting, Geneva, Switzerland, 7 January 2014. [Google Scholar]
- Steven, H. Development of a Worldwide Harmonised Heavy-Duty Engine Emissions Test Cycle. TRANS/WP29/GRPE/2001/2. Available online: http://www.unece.org.net4all.ch/fileadmin/DAM/trans/doc/2001/wp29grpe/TRANS-WP29-GRPE-42-inf02.pdf (accessed on 1 July 2021).
- De Jong, E.; Vijlbrief, T.; Hijkoop, R.; Gruter, G.-J.M.; Van Der Waal, J.C. Promising results with YXY Diesel components in an ESC test cycle using a PACCAR Diesel engine. Biomass Bioenergy 2012, 36, 151–159. [Google Scholar] [CrossRef]
- Aarnink, T.J.; Flöysand, S.Å.; Gadd, P.; Le Breton, D.; Mann, N.; Marotta, A.; Skårdalsmo, K.; Snelgrove, D.G.; Sunderbrink, T. Motor Vehicle Emission Regulations and Fuel Specifications: Part 2 Detailed Information and Historic Review (1970–1996). Report no. 6/97. Available online: https://www.concawe.eu/wp-content/uploads/2017/01/2002-00203-01-e.pdf (accessed on 1 July 2021).
- De Melo, T.C.C.; De Brito, M.F.M.; Moreira, M.F.; Machado, G.B.; Fleischman, R. Calculation of Uncertainty of Measurement for Diesel Engine ESC Test Emissions. SAE Tech. Pap. Ser. 2013. [Google Scholar] [CrossRef]
- Giakoumis, E.; Alafouzos, A. Study of diesel engine performance and emissions during a Transient Cycle applying an engine mapping-based methodology. Appl. Energy 2010, 87, 1358–1365. [Google Scholar] [CrossRef]
- United States Environmental Protection Agency. Dynamometer Drive Schedules. Available online: https://www.epa.gov/vehicle-and-fuel-emissions-testing/dynamometer-drive-schedules (accessed on 11 February 2021).
- Zhen, F.; Clark, N.N.; Bedick, C.R.; Gautam, M.; Wayne, W.S.; Thompson, G.J.; Lyons, D.W. Development of a heavy heavy-duty diesel engine schedule for representative measurement of emissions. J. Air Waste Manag. Assoc. 2009, 59, 950–959. [Google Scholar] [CrossRef]
- DieselNet. Heavy-Duty FTP Transient Cycle. Available online: https://dieselnet.com/standards/cycles/ftp_trans.php (accessed on 18 October 2020).
- Rakopoulos, C.D.; Giakoumis, E. Diesel Engine Transient Operation Principles of Operation and Simulation Analysis, 1st ed.; Springer Science and Business Media LLC: London, UK, 2009. [Google Scholar] [CrossRef]
- Zacharof, N.; Tietge, U.; Franco, V.; Mock, P. Type approval and real-world CO2 and NOx emissions from EU light commercial vehicles. Energy Policy 2016, 97, 540–548. [Google Scholar] [CrossRef]
- Brand, C. Beyond ‘Dieselgate’: Implications of unaccounted and future air pollutant emissions and energy use for cars in the United Kingdom. Energy Policy 2016, 97, 1–12. [Google Scholar] [CrossRef] [Green Version]
- Krall, J.R.; Peng, R.D. The Volkswagen scandal: Deception, driving and deaths. Significance 2015, 12, 12–15. [Google Scholar] [CrossRef] [Green Version]
- Chossière, G.P.; Malina, R.; Ashok, A.; Dedoussi, I.C.; Eastham, S.D.; Speth, R.L.; Barrett, S.R.H. Public health impacts of excess NOx emissions from Volkswagen diesel passenger vehicles in Germany. Environ. Res. Lett. 2017, 12, 034014. [Google Scholar] [CrossRef]
- Snavely, B. Volkswagen Must Pay $2.8 B Criminal Fine for Emissions Cheating. USA Today, 21 April 2017. [Google Scholar]
- Bishop, J.D.; Molden, N.; Boies, A.M. Using portable emissions measurement systems (PEMS) to derive more accurate estimates of fuel use and nitrogen oxides emissions from modern Euro 6 passenger cars under real-world driving conditions. Appl. Energy 2019, 242, 942–973. [Google Scholar] [CrossRef]
- Duarte, G.; Gonçalves, G.; Farias, T. Analysis of fuel consumption and pollutant emissions of regulated and alternative driving cycles based on real-world measurements. Transp. Res. Part D Transp. Environ. 2016, 44, 43–54. [Google Scholar] [CrossRef]
- Pang, Y.; Fuentes, M.; Rieger, P. Trends in the emissions of Volatile Organic Compounds (VOCs) from light-duty gasoline vehicles tested on chassis dynamometers in Southern California. Atmos. Environ. 2014, 83, 127–135. [Google Scholar] [CrossRef]
- Chen, L.; Wang, Z.; Liu, S.; Qu, L. Using a chassis dynamometer to determine the influencing factors for the emissions of Euro VI vehicles. Transp. Res. Part D Transp. Environ. 2018, 65, 564–573. [Google Scholar] [CrossRef]
- Zhou, H.; Zhao, H.; Feng, Q.; Yin, Z.; Li, J.; Qin, K.; Li, M.; Cao, L. Effects of environmental parameters on real-world nox emissions and fuel consumption for heavy-duty diesel trucks using an OBD approach; 0148-7191. SAE Tech. Pap. 2018, 1, 1817. [Google Scholar] [CrossRef]
- Betageri, V.; Mahesh, R. Effects of the Real Driving Conditions on the NOx Emission of a Medium Duty Diesel Commercial Vehicle. SAE Tech. Pap. Ser. 2017. [Google Scholar] [CrossRef]
- Bodisco, T.; Zare, A. Practicalities and Driving Dynamics of a Real Driving Emissions (RDE) Euro 6 Regulation Homologation Test. Energies 2019, 12, 2306. [Google Scholar] [CrossRef] [Green Version]
- The Association for Emissions Control by Catalyst (AECC). Real Driving Emissions. Available online: https://www.aecc.eu/legislation/light-duty-vehicles/real-driving-emissions/ (accessed on 5 February 2021).
- Donateo, T.; Giovinazzi, M. Building a cycle for Real Driving Emissions. Energy Procedia 2017, 126, 891–898. [Google Scholar] [CrossRef]
- Roberts, P.J.; Mumby, R.; Mason, A.; Redford-Knight, L.; Kaur, P. RDE Plus—The Development of a Road, Rig and Engine-in-the-Loop Test Methodology for Real Driving Emissions Compliance. SAE Tech. Pap. Ser. 2019. [Google Scholar] [CrossRef]
- Zhang, Y.; Tian, D.; Du, H.; Pan, H.; Fang, W.; Wang, Y. Design and Research of RDE Test Routes. In Advances in Intelligent Systems and Computing; Springer Science and Business Media LLC: Cham, Switzerland, 2019; pp. 1160–1169. [Google Scholar]
- Tong, H.; Tung, H.; Hung, W.-T.; Nguyen, H. Development of driving cycles for motorcycles and light-duty vehicles in Vietnam. Atmos. Environ. 2011, 45, 5191–5199. [Google Scholar] [CrossRef]
- Yang, Z.; Liu, Y.; Wu, L.; Martinet, S.; Zhang, Y.; Andre, M.; Mao, H. Real-world gaseous emission characteristics of Euro 6b light-duty gasoline- and diesel-fueled vehicles. Transp. Res. Part D Transp. Environ. 2020, 78, 102215. [Google Scholar] [CrossRef]
- Thomas, D.; Li, H.; Wang, X.; Song, B.; Ge, Y.; Yu, W.; Ropkins, K. A Comparison of Tailpipe Gaseous Emissions for RDE and WLTC Using SI Passenger Cars. SAE Tech. Pap. Ser. 2017, 1. [Google Scholar] [CrossRef]
- Wang, M.; Li, S.; Zhu, R.; Zhang, R.; Zu, L.; Wang, Y.; Bao, X. On-road tailpipe emission characteristics and ozone formation potentials of VOCs from gasoline, diesel and liquefied petroleum gas fueled vehicles. Atmos. Environ. 2020, 223, 117294. [Google Scholar] [CrossRef]
- Du, B.; Zhang, L.; Geng, Y.; Zhang, Y.; Xu, H.; Xiang, G. Testing and evaluation of cold-start emissions in a real driving emissions test. Transp. Res. Part D Transp. Environ. 2020, 86, 102447. [Google Scholar] [CrossRef]
- Jaiprakash; Habib, G. On-road assessment of light duty vehicles in Delhi city: Emission factors of CO, CO2 and NOX. Atmos. Environ. 2018, 174, 132–139. [Google Scholar] [CrossRef]
- Cao, X.; Yao, Z.; Shen, X.; Ye, Y.; Jiang, X. On-road emission characteristics of VOCs from light-duty gasoline vehicles in Beijing, China. Atmos. Environ. 2016, 124, 146–155. [Google Scholar] [CrossRef]
- Daham, B.; Li, H.; Andrews, G.E.; Ropkins, K.; Tate, J.E.; Bell, M. Comparison of Real World Emissions in Urban Driving for Euro 1-4 Vehicles Using a PEMS. SAE Tech. Pap. Ser. 2009. [Google Scholar] [CrossRef]
- Roso, V.; Martins, M.E.S. Simulation of Fuel Consumption and Emissions for Passenger Cars and Urban Buses in Real-World Driving Cycles. SAE Tech. Pap. Ser. 2016, 1. [Google Scholar] [CrossRef]
- Akard, M.; Gramlich, N.; Nevius, T.; Porter, S. Comparison of Real-World Urban Driving Route PEMS Fuel Economy with Chassis Dynamometer CVS Results. SAE Tech. Pap. Ser. 2019. [Google Scholar] [CrossRef]
- Ren, Y.; Lou, D.; Zhang, Y.; Tan, P.; Hu, Z. Study on Real-World NOx and Particle Emissions of Bus: Influences of VSP and Fuel. SAE Tech. Pap. Ser. 2019. [Google Scholar] [CrossRef]
- Gallus, J.; Kirchner, U.; Vogt, R.; Börensen, C.; Benter, T. On-road particle number measurements using a portable emission measurement system (PEMS). Atmos. Environ. 2016, 124, 37–45. [Google Scholar] [CrossRef]
- Braisher, M.; Stone, R.; Price, P. Particle Number Emissions from a Range of European Vehicles. SAE Tech. Pap. Ser. 2010. [Google Scholar] [CrossRef]
- Khalfan, A.; Andrews, G.; Li, H. Real World Driving: Emissions in Highly Congested Traffic. SAE Tech. Pap. Ser. 2017, 1. [Google Scholar] [CrossRef]
- Rosenblatt, D.; Stokes, J.; Caffrey, C.; Brown, K.F. Effect of Driving Cycles on Emissions from On-Road Motorcycles. SAE Tech. Pap. Ser. 2020. [Google Scholar] [CrossRef]
- Fonseca, N.; Casanova, J.; Valdés, M. Influence of the stop/start system on CO2 emissions of a diesel vehicle in urban traffic. Transp. Res. Part D Transp. Environ. 2011, 16, 194–200. [Google Scholar] [CrossRef] [Green Version]
- Warguła, Ł.; Krawiec, P.; Waluś, K.J.; Kukla, M. Fuel Consumption Test Results for a Self-Adaptive, Maintenance-Free Wood Chipper Drive Control System. Appl. Sci. 2020, 10, 2727. [Google Scholar] [CrossRef] [Green Version]
- Zsiga, N.; Ritzmann, J.; Soltic, P. Practical Aspects of Cylinder Deactivation and Reactivation. Energies 2021, 14, 2540. [Google Scholar] [CrossRef]
- Parker, M.C.; Jiang, C.; Butcher, D.; Spencer, A.; Garner, C.P.; Witt, D. Impact and observations of cylinder deactivation and reactivation in a downsized gasoline turbocharged direct injection engine. Int. J. Engine Res. 2021, 22, 1367–1376. [Google Scholar] [CrossRef] [Green Version]
- Savickas, D.; Steponavičius, D.; Domeika, R. Analysis of Telematics Data of Combine Harvesters and Evaluation of Potential to Reduce Environmental Pollution. Atmosphere 2021, 12, 674. [Google Scholar] [CrossRef]
- Dvorkin, W.; King, J.; Gray, M.; Jao, S. Determining the Greenhouse Gas Emissions Benefit of an Adaptive Cruise Control System Using Real-World Driving Data. SAE Tech. Pap. Ser. 2019. [Google Scholar] [CrossRef]
- Laberteaux, K.; Hamza, K. A Study of Greenhouse Gas Emissions Reduction Opportunity in Light-Duty Vehicles by Analyzing Real Driving Patterns. SAE Tech. Pap. Ser. 2017, 1. [Google Scholar] [CrossRef]
- Andersson, J.; May, J.; Favre, C.; Bosteels, D.; De Vries, S.; Heaney, M.; Keenan, M.; Mansell, J. On-Road and Chassis Dynamometer Evaluations of Emissions from Two Euro 6 Diesel Vehicles. SAE Int. J. Fuels Lubr. 2014, 7, 919–934. [Google Scholar] [CrossRef] [Green Version]
- Wang, H.; Wu, Y.; Zhang, K.M.; Zhang, S.; Baldauf, R.W.; Snow, R.; Deshmukh, P.; Zheng, X.; He, L.; Hao, J. Evaluating mobile monitoring of on-road emission factors by comparing concurrent PEMS measurements. Sci. Total Environ. 2020, 736, 139507. [Google Scholar] [CrossRef]
- Park, J.; Shin, M.; Lee, J.; Lee, J. Estimating the effectiveness of vehicle emission regulations for reducing NOx from light-duty vehicles in Korea using on-road measurements. Sci. Total Environ. 2021, 767, 144250. [Google Scholar] [CrossRef]
- Bischoff, G.; Keller, S.; Heubuch, A. Portable Emission Measurement Technology and RDE on Motorcycles as Instruments for Future Challenges. MTZ Worldw. 2020, 81, 54–59. [Google Scholar] [CrossRef]
- Geng, W.; Lou, D.; Xu, N.; Tan, P.; Hu, Z. Chassis Dynamometer and On-Road Evaluations of Emissions from a Diesel-Electric Hybrid Bus. SAE Tech. Pap. Ser. 2017, 1. [Google Scholar] [CrossRef]
- Williams, R.; Andersson, J.; Hamje, H.; Ziman, P.; Kar, K.; Fittavolini, C.; Pellegrini, L.; Gunther, G.; Oliva, F.; Van de Heijning, P. Impact of Demanding Low Temperature Urban Operation on the Real Driving Emissions Performance of Three European Diesel Passenger Cars. SAE Tech. Pap. Ser. 2018. [Google Scholar] [CrossRef]
- Degraeuwe, B.; Weiss, M. Does the New European Driving Cycle (NEDC) really fail to capture the NOX emissions of diesel cars in Europe? Environ. Pollut. 2017, 222, 234–241. [Google Scholar] [CrossRef]
- Mathews, L.T.; Neti, R.M. Vehicle Emissions Testing System. Google Patents 5,753,185, 19 May 1998. [Google Scholar]
- BMVI (Bundesministerium Für Verkehr und Digitale Infrastruktur). Bericht der Untersuchungskommission Volkswagen. Available online: https://www.autoevolution.com/pdf/news_attachements/630000-diesel-cars-of-german-origin-to-be-recalled-in-europe-more-to-follow-106820.pdf (accessed on 1 July 2021).
- Pirjola, L.; Rönkkö, T.; Saukko, E.; Parviainen, H.; Malinen, A.; Alanen, J.; Saveljeff, H. Exhaust emissions of non-road mobile machine: Real-world and laboratory studies with diesel and HVO fuels. Fuel 2017, 202, 154–164. [Google Scholar] [CrossRef] [Green Version]
- Valverde, V.; Mora, B.; Clairotte, M.; Pavlovic, J.; Suarez-Bertoa, R.; Giechaskiel, B.; Astorga-Llorens, C.; Fontaras, G. Emission Factors Derived from 13 Euro 6b Light-Duty Vehicles Based on Laboratory and On-Road Measurements. Atmosphere 2019, 10, 243. [Google Scholar] [CrossRef] [Green Version]
- Besch, M.C.; Chalagalla, S.H.; Carder, D. On-Road and Chassis Dynamometer Testing of Light-duty Diesel Passenger Cars. Available online: https://www.cafee.wvu.edu/files/d/c586c1dd-b361-410d-a88d-d34e8834eda6/testing-of-light-duty-diesel-passenger-cars.pdf (accessed on 1 July 2021).


| Test Type | Merits | Demerits |
|---|---|---|
| Chassis dynamometer |
|
|
| Engine dynamometer |
|
|
| ADR Category | Mass Category (Tonnes GVM or GCM) | Vehicle Description |
|---|---|---|
| MA/MB/MC | Passenger car (MA), forward control passenger vehicle (MB), and off-road passenger ≤ 9 seats (MC) | |
| NA/MD | ≤3.5 | Light goods vehicle (NA) and light buses (MD) |
| NB/MD | >3.5 ≤ 12 | Medium goods vehicle (NB) and light buses (MD) |
| ME | >5 | Heavy bus |
| NC | >12 ≤ 25 | Goods vehicle |
| NCH | >25 | Heavy goods vehicle |
| NEDC | WLTC (Class 3b) | |
|---|---|---|
| Cycle Time | 20 min | 30 min |
| Cycle Distance | 11 kilometres (6.83 miles) | 23.25 km (14.44 miles) |
| Driving | 2 phases: urban driving 66%/extra-urban driving 34%. | 4 phases: urban driving 52%/extra-urban driving 48% |
| Average Speed | 34 km/h (21.12 mph) | 46.5 km/h (28.89 mph) |
| Maximum Speed | 120 km/h (74.56 mph) | 131 km/h (81.39 mph) |
| Influence of Optional Equipment | The options and their impact on regulated emissions and consumption are not taken into account. | Options and their impact on regulated emissions and consumption are taken into account. |
| Temperature Testing | Measurements are taken at temperatures between 20 and 30 °C | Measurements are taken at 23 °C, then at 14 °C for CO2 emissions |
| 2015 | 2016 | 2017 | 2018 | 2019 | 2020 | 2021 | 2022 | |
| Euro 6b | Euro 6c | Euro 6d | ||||||
| NEDC | WLTC | |||||||
| Development & Measurement Phase | Conformity Factor (CF) | |||||||
| CFNOx = 2.1, CFPN = 1.5 | CFNOx, PN = 1.5 | |||||||
| RDE for CO, NOX, PN emissions: EC 427/2016 and EC 646/2016 | CO, NOX, PN and CO2 | |||||||
| Unit | Urban | Rural | Motorway | Notes | |
|---|---|---|---|---|---|
| Speed (V) | km/h | V ≤ 60 | 60 < V | 90 ≤ V ≤ 145 | V > 100 for at least 5 min in motorway |
| Distance | % of total distance | 29–44 | 33 ± 10 | 33 ± 10 | |
| Minimum distance | km | 16 | 16 | 16 | |
| Avg speed (Vavg) | km/h | 15 ≤ Vavg ≤ 40 | - | - | |
| Number of stops | s | several > 10 | - | - | |
| Max speed | km/h | 60 | 90 | 145 | |
| Total test time | min | 90 to 120 | |||
| Elevating difference | m | 100 | Between the start and endpoint |
| Reference | Vehicle | Comparison Criteria | Route Information | Impact on Primary Emission | Remarks |
|---|---|---|---|---|---|
| [116] | Diesel-electric hybrid bus | China City Bus Cycles | 1270 s Average speed 24.3 km/h Proportions: Idle 14.6%, Cruise 13.3%, Acceleration 43.6% and Deceleration 28.6% | NOX ↓ THC, CO, PM & PN ↑ | |
| [101] | EURO V, gasoline, passenger vehicle | NEDC, WLTC | 90 min, Avg engine rpm: 1494-2256 Idle time variation: 4–24.8% 2 × Urban route & 1 Autobahn route Equal distance Cold-start test: Urban route 8–28 °C | PN in similar range compared to cycles | Driving style significantly increased PN emission on the same route |
| [91] | Gasoline and diesel passenger vehicle | Vehicles | 60 km consist of urban, rural and motorway | THC and CO ↓ for all NOX: Gasoline: ↑ for rural and motorway Diesel: significantly ↑ for all roads | Gasoline emission ↑ motorway Diesel emission ↑ urban |
| [93] | Gasoline cars, light-duty diesel trucks, heavy-duty diesel trucks and liquefied petroleum gas-electric hybrid bus | Vehicles VOC | Route A: 68 km Route B: 18 km, 29 stops of 10s | VOC: highest- Heavy-duty diesel truck. Lowest- Gasoline Emission of urban roads significantly higher compared to rural and highway | |
| [95] | Diesel, gasoline and CNG | Vehicles | 10 km consisting of heavy traffic, lean traffic and traffic signals | Gasoline vehicles produced the highest CO and NOX | CO2 of gasoline vehicles varied significantly with acceleration and deceleration |
| [96] | light-duty gasoline vehicles | China emission standard | Route 33.7 km (arterial road and highway), divided into 3 cycle Duration: arterial road hot start (ARHS): 21 min, highway hot running (HWHR):17 min and arterial road hot running (ARHR): 21 min Avg speed: ARHS 17.7–22.9 km/h HWHR 42.8–54.9 km/h ARHR 29.6–42.4 km/h | hot start resulted in the highest VOC emission, and highway hot running produced the lowest emission | |
| [94] | Gasoline vehicles | Cold-start vs. hot start | 75.4 km: urban section (32.6%), rural (32.4%), and the motorway section (35.0%). Altitude variation: 192.7–313.2 m. The authors reported a significant increase of CO, CO2 and PN emission at the cold-start compared to a hot start. | CO, CO2 and PN: Significant ↑ for cold-start | NOX emission depends on driving behaviour |
| [97] | SI gasoline cars with compliance to EURO I to IV | Euro I to IV | Four left-hand turns and the total circuit length was 0.6 km with very little other traffic | THC and CO: within legislation limits NOX and CO increase for aggressive driving | |
| [112] | light-duty diesel Euro 6b standards | New European Drive Cycle (NEDC), Common Artemis Drive Cycle (CADC), WLTC and 3 ‘Random cycles’ | 60 min (minimum) Route 1: 60% urban Route 2: 60% motorway | NOX ↑ THC and CO: similar CO2: Significant ↑ | |
| [98] | Bus Passenger car | Average vs. Cumulative cycle FTP-75 | 11.8 km including varied driving conditions including ascents, descents, urban and highway traffics Bus: 2674–8321 s, Acceleration 50.86–52.54%, Deceleration 47.46–49.145 Car: 2016–6013 s, Acceleration 38.25–50%, Deceleration 50–61.25% | Car: Significant increase of NOX, THC and CO for a cumulative cycle, compared to FTP-75 Bus: Significant increase of NOX, HC, CO and soot for a cumulative cycle, compared to FTP-75 | |
| [117] | Euro 6 standard vehicles | NEDC, WLTP, Transport for London Urban Inter-Peak Cycle | 105 min | NOX: ↓ compared to EURO 6, ↑ compared to NEDC, WLTP CO: ↓ PN: ↓ compared to EURO 6 CO2: ↑ compared to EURO 6 | CO2 higher than EURO 6 limits. Depending on the vehicle technology, some cars were able to control NOX emission from cold-start, and some were able to control NOX after 2–3 min of warm-up |
| [99] | Light-duty vehicle | Grade variation | Two routes duration 40 min and 45 min 90 m altitude change | Altitude difference 10 g/mile of CO2 | |
| [110] | 2018 Cadillac CT6 | Adaptive Cruise Control | Most of the driving occurred at highway speeds; over 66% of the data were captured at and above 55 mph | CO2: ↓ for active ACC | |
| [104] | compact sport bike (296 cc), cruising bike (749 cc) and high performance touring bike (1198 cc) | 1.1 h cold-start phase (505 s and 7.47 km), intermediate speed (525 s and 8.45 km) and high speed (832 s and 14.72 km) | NOX, THC, CO, PM: significant ↑ | PM emission below the current Tier 3/LEV III light-duty highway vehicle limit | |
| [92] | Spark ignition passenger vehicles of class M1 (3-way catalyst) | WLTC | 34% urban 33% rural 33% motorway | NOX, CO, and CO2: ↓ | |
| [103] | Euro4 emission compliant manual transmission petrol | Traffic congestion | 5 km, Speed limit 48 km/h Route A: 8 right and 3 left turn Route B: 5 right and 6 left turn 3 sets of traffic lights 4 pedestrian crossing | NOX, CO, THC: higher at lower speeds and reduced as the speed increased CO2 were higher than the limit | |
| [100] | Bus | Waste cooking biodiesel & LPG | Daily operating route | NOX, PN: ↑ PM: ↓ | |
| [83] | Diesel truck | Environmental constraint | Altitude ranges < 1000 m, 1000~1500 m and 3000~4000 temperature range: 10~20 °C | NOX: high altitude reduces emission | |
| [114] | 109 diesel and gasoline vehicles | On-road NOX vs. lab-based tests | Average speed 15-40 km/h Metropolitan area (50–60 km/h), Downtown areas (80–90 km/h) & Rural areas (100–110 km/h) | On-road emissions 5 times lab-based experiments |
Publisher’s Note: MDPI stays neutral with regard to jurisdictional claims in published maps and institutional affiliations. |
© 2021 by the authors. Licensee MDPI, Basel, Switzerland. This article is an open access article distributed under the terms and conditions of the Creative Commons Attribution (CC BY) license (https://creativecommons.org/licenses/by/4.0/).
Share and Cite
Rahman, S.M.A.; Fattah, I.M.R.; Ong, H.C.; Ashik, F.R.; Hassan, M.M.; Murshed, M.T.; Imran, M.A.; Rahman, M.H.; Rahman, M.A.; Hasan, M.A.M.; et al. State-of-the-Art of Establishing Test Procedures for Real Driving Gaseous Emissions from Light- and Heavy-Duty Vehicles. Energies 2021, 14, 4195. https://doi.org/10.3390/en14144195
Rahman SMA, Fattah IMR, Ong HC, Ashik FR, Hassan MM, Murshed MT, Imran MA, Rahman MH, Rahman MA, Hasan MAM, et al. State-of-the-Art of Establishing Test Procedures for Real Driving Gaseous Emissions from Light- and Heavy-Duty Vehicles. Energies. 2021; 14(14):4195. https://doi.org/10.3390/en14144195
Chicago/Turabian StyleRahman, S. M. Ashrafur, I. M. Rizwanul Fattah, Hwai Chyuan Ong, Fajle Rabbi Ashik, Mohammad Mahmudul Hassan, Md Tausif Murshed, Md Ashraful Imran, Md Hamidur Rahman, Md Akibur Rahman, Mohammad Al Mahdi Hasan, and et al. 2021. "State-of-the-Art of Establishing Test Procedures for Real Driving Gaseous Emissions from Light- and Heavy-Duty Vehicles" Energies 14, no. 14: 4195. https://doi.org/10.3390/en14144195