A Transient Behavior Study of Polymer Electrolyte Fuel Cells with Cyclic Current Profiles


1
Forschungszentrum Jülich GmbH, Institute of Energy and Climate Research (IEK-3), 52425 Jülich, Germany
2
Faculty of Mechanical Engineering, RWTH Aachen University, 52072 Aachen, Germany
*
Author to whom correspondence should be addressed.
Energies 2019, 12(12), 2370; https://doi.org/10.3390/en12122370
Submission received: 22 May 2019
/
Revised: 14 June 2019
/
Accepted: 19 June 2019
/
Published: 20 June 2019
(This article belongs to the Special Issue Advanced Materials and Technologies for Fuel Cells)
Abstract
:This paper reports on the effects of different load profiles on the transient behavior of a polymer electrolyte fuel cell (PEFC). A protocol of six tests, each with different current density ramps, was conducted. The corresponding cell voltage, pressure drop response, and ohmic resistance were then experimentally investigated. The time-dependent voltage profiles were applied to represent the cell performance. The cathodic pressure drop and ohmic resistance were utilized to analyze the water dynamic behavior inside the cell. The voltage overshoot and undershoot behavior were observed throughout the experiment. It was found that with an increase of the current change rates, the magnitude of voltage over/undershoots also increased. When the holding time at the constant current density was zero, the overshoot or undershoot behavior disappeared. The results of the pressure drop analysis showed that the load ramp did not have a significant effect on the average pressure drop in the tests. During the load cyclic operation in each test, the two-phase flow tended to reach equilibrium in the cell. Impedance analysis showed that the ohmic resistance changed with the change in the current density; however, the difference between the tests was not obvious.
1. Introduction
The internal combustion engine has been used for decades as a means of locomotion, but it releases many pollutants, such as NOx, CO, and soot, etc. These contribute to environmental problems, including climate change and local pollution in cities [1]. Thus, car makers supported by research groups have focused their research on new technologies, such as fuel cell electric vehicles, to displace traditional internal combustion engine locomotion [2]. By using fuel cell technology, the energy-carrying fuel can be electrochemically transformed into electric energy [3]. Amongst many different kinds of fuel cells, the polymer electrolyte fuel cell (PEFC), with a relatively low operating temperature of up to 80 °C, has attracted significant attention due to its high efficiency, high power density, and 100 percent environmentally friendly output when operated with hydrogen. PEFC systems were regarded as promising alternatives and clean energy converters for automotive applications [4,5]. A variety of studies on PEFCs have focused on steady-state behavior at different operating conditions, including the effect of temperature, the humidification level, and the stoichiometric ratio of reactants, as well as the flow-field structure of single cells or stack performance [6,7,8]. However, in the real application of PEFC systems for vehicles, the fuel cell should satisfy the requirements of fast response during the start-up, stop, acceleration, and braking processes in a short time. Thus, thorough research on the PEFC transient response to continuous load change is necessary.
In 1996, Amphlett et al. [9] created a dynamic model to investigate the transient behavior of PEFCs. This model was coupled to an electrochemical and a thermal model, which takes the mass and heat transfer features into consideration. By means of this, the researchers calculated the cell voltages and heat losses for predicting fuel-cell performance. Um et al. [10] numerically studied the transient behavior of PEFCs. The model they proposed takes the electrochemical reaction kinetics, current density distributions, as well as multi-substance transport, into consideration. The results showed that the current density increased correspondingly as the voltage decreased from 0.6 V to 0.55 V, and the current overshoot behavior was observed in the first few seconds. They determined that compared to the electrochemical reaction, the reactant gas concentration required more time to reach its equilibrium, causing this transient behavior. Hamelin et al. [11] experimentally studied the transient behavior of PEFCs. They performed experiments on Ballard Mk5-E fuel cells and observed rapid voltage transient behavior, which was determined to be an overshoot and undershoot behavior. The system response time was less than 0.15 s.
In 2004, Kim et al. [12] experimented on a PEFC with a 25 cm2 triple serpentine flow field. They studied the effects of voltage change and stoichiometric ratio on the current density overshoot and undershoot behavior. The results showed that an increase in the stoichiometric ratio caused a decrease in the current overshoot amplitude. It proved the experimental results from Hamelin et al. [11], as well as the numerical simulation results from Um et al. [10]. Shen et al. [13] investigated the effect of an air stoichiometric ratio on the voltage undershoot behavior and found that increasing the stoichiometric ratio reduced the voltage undershoot tendency. The reason for this is that an increased stoichiometric ratio leads to reduced water accumulation in the gas diffusion layer and the flow channel, which consequently increases the reactant concentration on the reaction site and improves the reactant distribution.
In 2005, Yan et al. [14] numerically analyzed the effects of flow channel width and catalyst layer overpotential on the mass transport transient behavior. The results showed that a higher value of the channel width and catalyst layer overpotential caused a faster dynamic response behavior during the startup phase. Yan et al. [15] experimentally studied the transient behavior of single cell during cyclic load changes and different operating conditions, including inlet gas temperature, operating temperature, stoichiometric ratio, and inlet gas pressure. They found that a higher cathodic reactant humidity caused a lower voltage undershoot amplitude. Also, a higher stoichiometric ratio and higher pressure resulted in a reduction in the transient behavior of the cell.
In 2006, Liu et al. [16] investigated the long-term durability of PEFCs under different current cycles to simulate the real driving conditions for vehicular applications. Cell polarization curves, electrochemical impedance spectra, as well as hydrogen crossover rates, were used to characterize the MEAs (Membrane Electrode Assembly). They found that the hydrogen crossover rate was kept nearly stable during constant current operation. However, under cyclic current conditions, a pinhole was formed on the MEA after 500 h of operation, which led to dramatically increased hydrogen crossover. In 2009, Lin et al. [17] investigated the degradation of PEFC performance under cyclic load operating conditions. It was noticed that after 280 h of operation, the cell performance starts to decrease. Furthermore, the gaps and cracks were formed on the catalyst layer after 370 h of operation. In 2014, Lin et al. [18] studied the influence of dynamic load changes on the durability of a segmented cell. Their results showed that the performance of the cell decreased dramatically after 200 cycles of operation. Moreover, the current density decreased much faster at the inlet and outlet region than in other positions. By analyzing the impedance spectroscopy, they found that the ohmic resistance increased after 200 cycles, especially on the cathode side.
These mentioned above can be classified into electrochemical transients. Banerjee and Kandlikar [19] confirmed that, apart from the electrochemical transients, the PEFCs’ transient behavior also included the thermal and two-phase flow transients. The two-phase behavior of PEFCs has been investigated by several researchers [20,21,22]. However, most of their work has focused on steady-state instead of transient behavior in PEFCs. Therefore, an investigation of the two-phase behavior of PEFCs for automotive drivetrains is necessary.
The pressure drop inside fuel cells has been used as an effective tool to analyze the dynamic water behavior in channels [23,24,25]. In 2014, Banerjee and Kandlikar [26] investigated the impact of two-phase flow pressure drops on cell performance. They studied the effects of temperatures and load changes on cathodic pressure drops and observed the pressure drop overshoot and undershoot behavior. During their later work [27,28], the pressure drop overshoot behavior could only be observed at lower temperatures due to the generated liquid water presented in the flow channels. In comparison, the overshoot behavior became insignificant at higher temperatures because of the higher water vapor fraction. They also found that the current change amplitude had more effects on the overshoot behavior of a pressure drop compared to the current change ramps.
Despite the changing load and operating conditions having been studied by many research groups, limited attention has focused on the relationship between voltage responses, two-phase flow pressure drops, and cell resistance under transient conditions. Furthermore, the effect of different load cycles has also not been investigated. In this paper, different current density profiles were imposed on the cell, and its effects on the voltage response, pressure drop, as well as cell ohmic resistance, were observed and analyzed.
2. Experimental Preparation
2.1. Test Cell Components
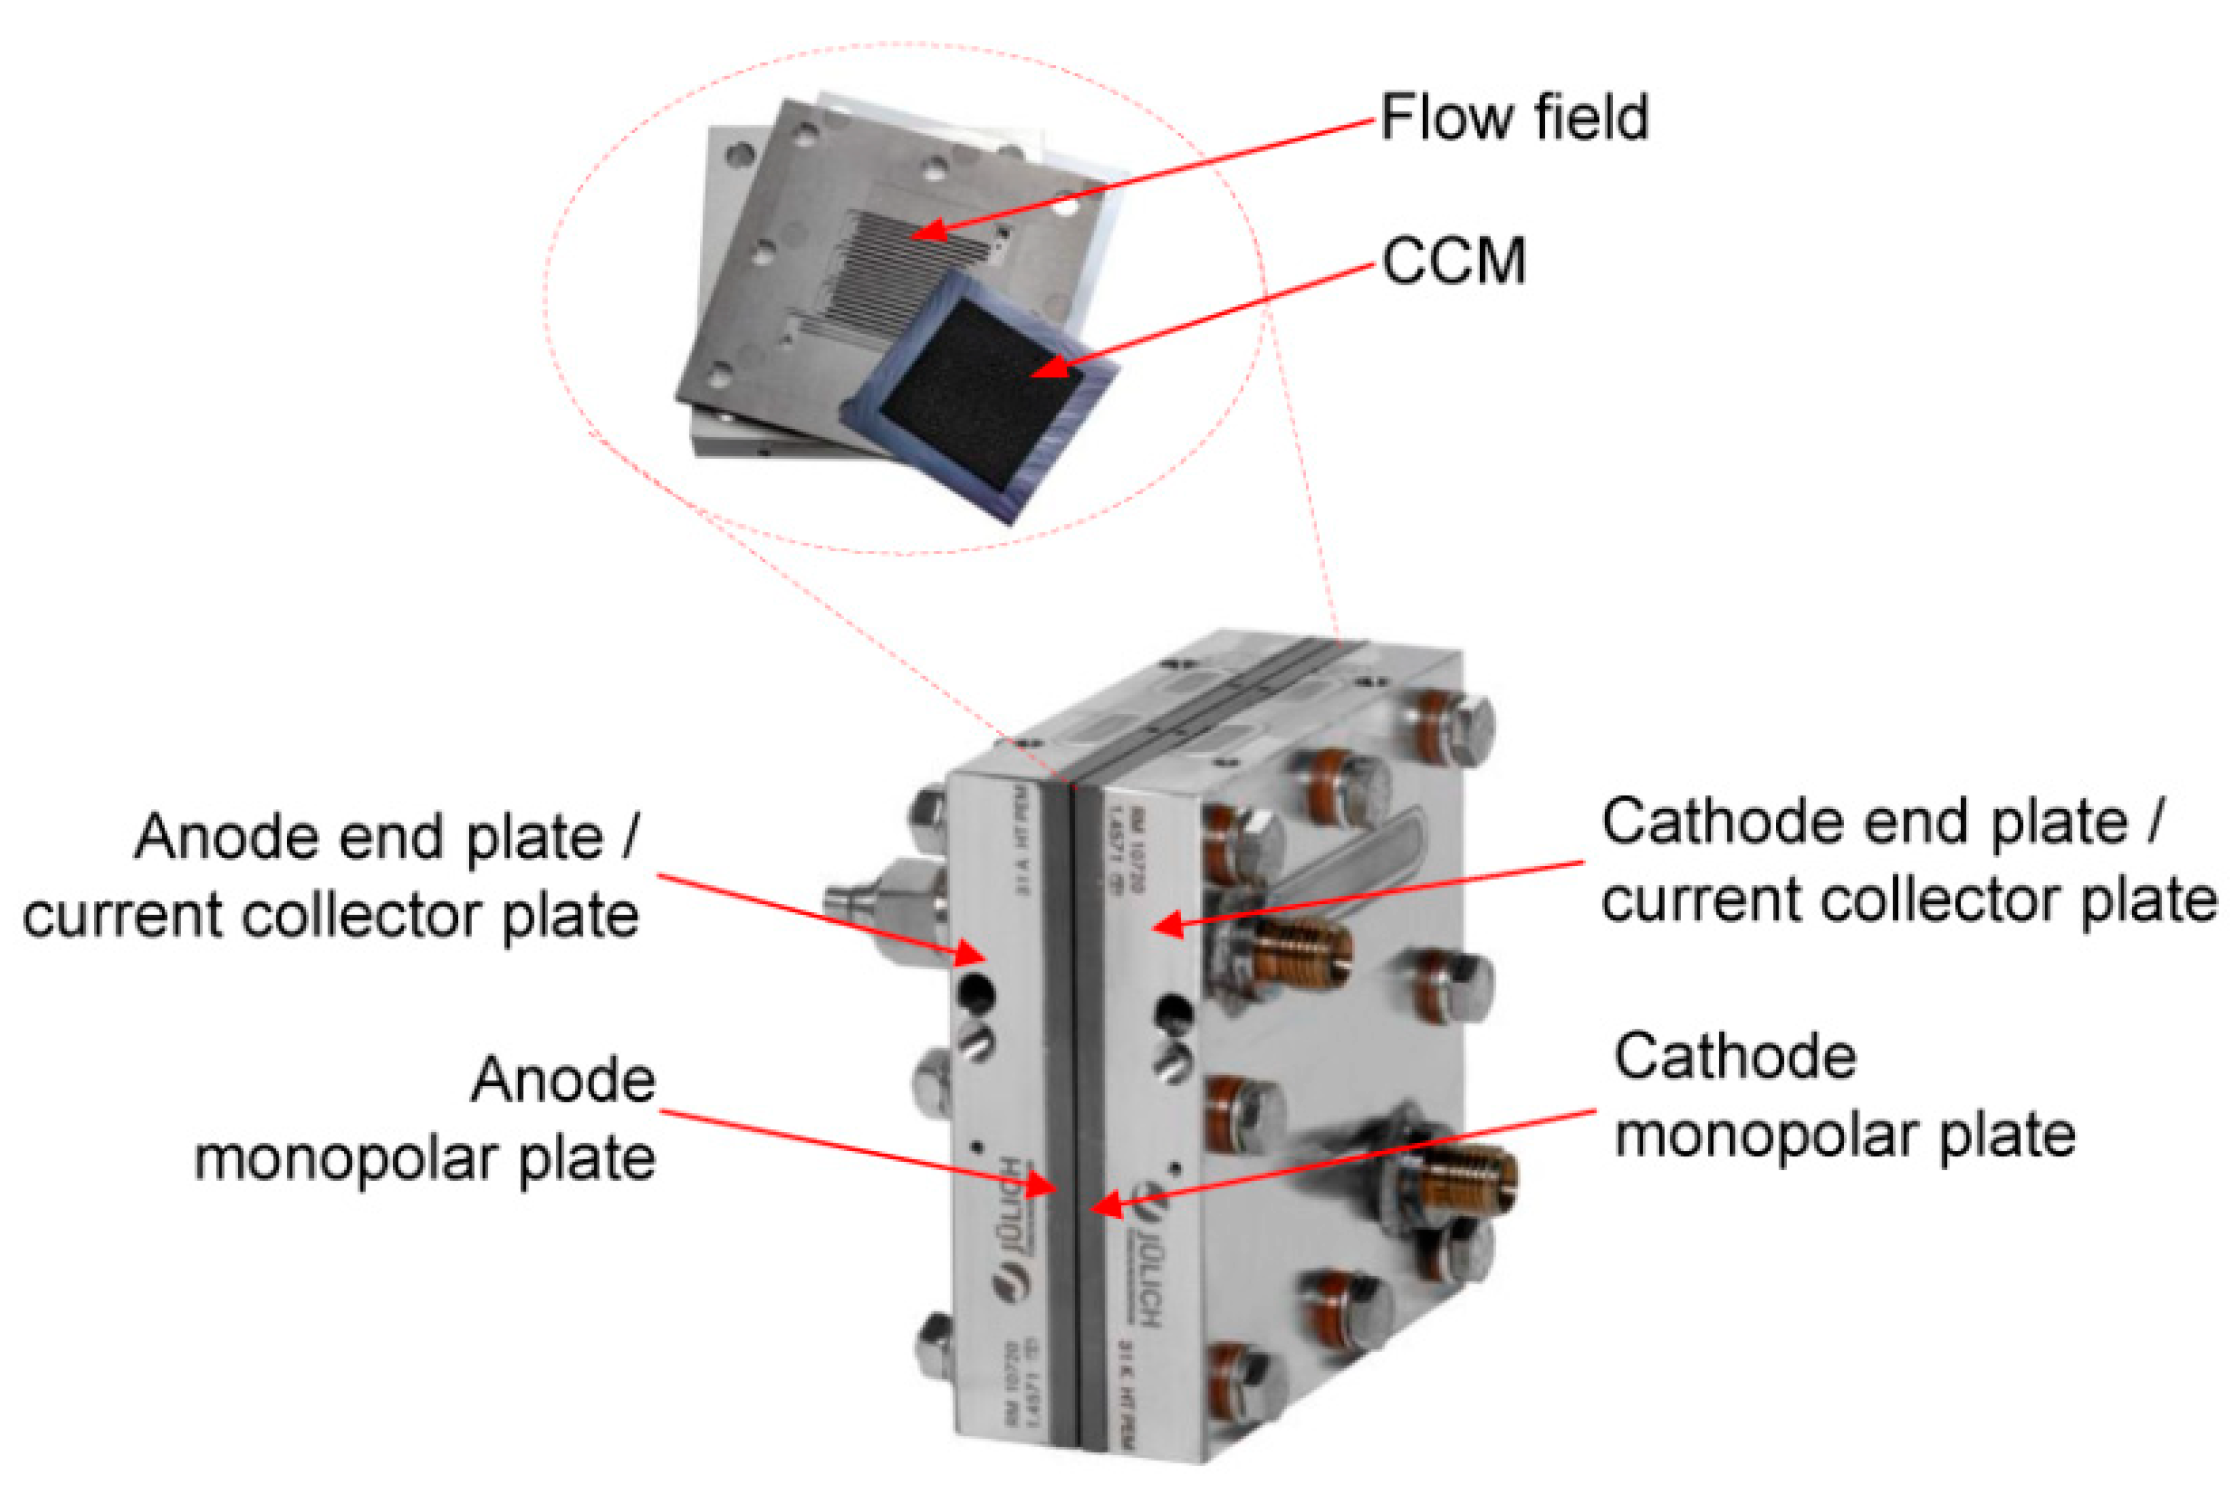
The test cell, as shown in Figure 1, was manufactured and assembled at Forschungszentrum Jülich. The active area of the Gore catalyst-coated membrane (CCM) is 17.64 cm2. The non-woven Gas Diffusion Layer (GDL), Freudenberg H23Cx165, which was coated with a microporous layer (MPL) with 40 wt% polytetrafluoroethylene (PTFE) loading, was added on both sides of the CCM. The detailed drawing of the in-house-designed monopolar plate applied in the present work is shown in Figure 2, where the flow field is also presented. The monopolar plate was fabricated from graphite composite. The flow field consists of three parallel serpentine channels, each of which has a quadratic cross-section with 1 mm width and 1 mm depth, and a land width that is also 1 mm. The flow fields at both monopolar plates have symmetrical designs. The reactant gas flow direction was arranged as a co-flow configuration. The end plate was also used as the current collector plate and was fabricated from stainless steel type 1.4571 (316 Ti).
2.2. Test Equipment
The experimental operating conditions were controlled by Greenlight Technology’s G40 test station, which could supply a stable reactant gas flow rate, temperature, and relative humidity based on the experimental requirements. As is shown in Figure 3, the voltage test ports are inserted into the monopolar plate to record the cell voltage. Two heater tubes are inserted into the end plates to control the cell temperature. Two thermocouples are inserted into each end plate to measure the cell temperature. A manometer is used to measure the two-phase flow pressure drops on the cathode side. The ohmic resistance of the cell was measured by means of an Electrochemical Impedance Spectroscopy (EIS) device (Zahner Zennium, ZAHNER-elektrik GmbH & Co. KG, Kronach, Germany).
2.3. Test Procedures
In order to maintain stable performance of the test cell for subsequent testing, a repeatable break-in procedure needed to be performed for the new CCM [29]. During the break-in procedure [30], the test cell was conditioned at 70 °C, with fully saturated (relative humidity (RH) = 100%) hydrogen at 1.2 stoichiometric ratio and fully saturated air at 2.5 stoichiometric ratio. The current was increased until the cell voltage reached 0.6 V. Then, the voltage was cycled between 0.6 V (30 min), 0.4 V (30 min), and OCV (1 min) approximately 6–8 times until there was no further increase in cell performance.
The conditioning procedure was performed before each test in order to set the equal start condition. During the conditioning process, the test cell temperature was set at 70 °C, with fully saturated hydrogen at a stoichiometric ratio of 1.2, and fully saturated air at λ = 2.5. The cell voltage was set to 0.6 V for the 30 min of operation. This step was used to make sure that the membrane was fully hydrated and that the test cell had the same historic situation before each test [31]. During the testing process, the voltage response, cathodic pressure drop response, and ohmic resistance of the cell under each operating condition were recorded. The cell temperature and reactant relative humidity were considered to be constant in the test, while the flow rate of the gas was correspondingly adjusted to the change of the current density.
2.4. Test Conditions
During the test process, the cell operating temperature was set to 60 °C and the reactant’s relative humidity was set to 90% on both sides. The stoichiometric ratio of hydrogen (λH2) and air (λAir) were set to 2. The test operating conditions are shown in Table 1.
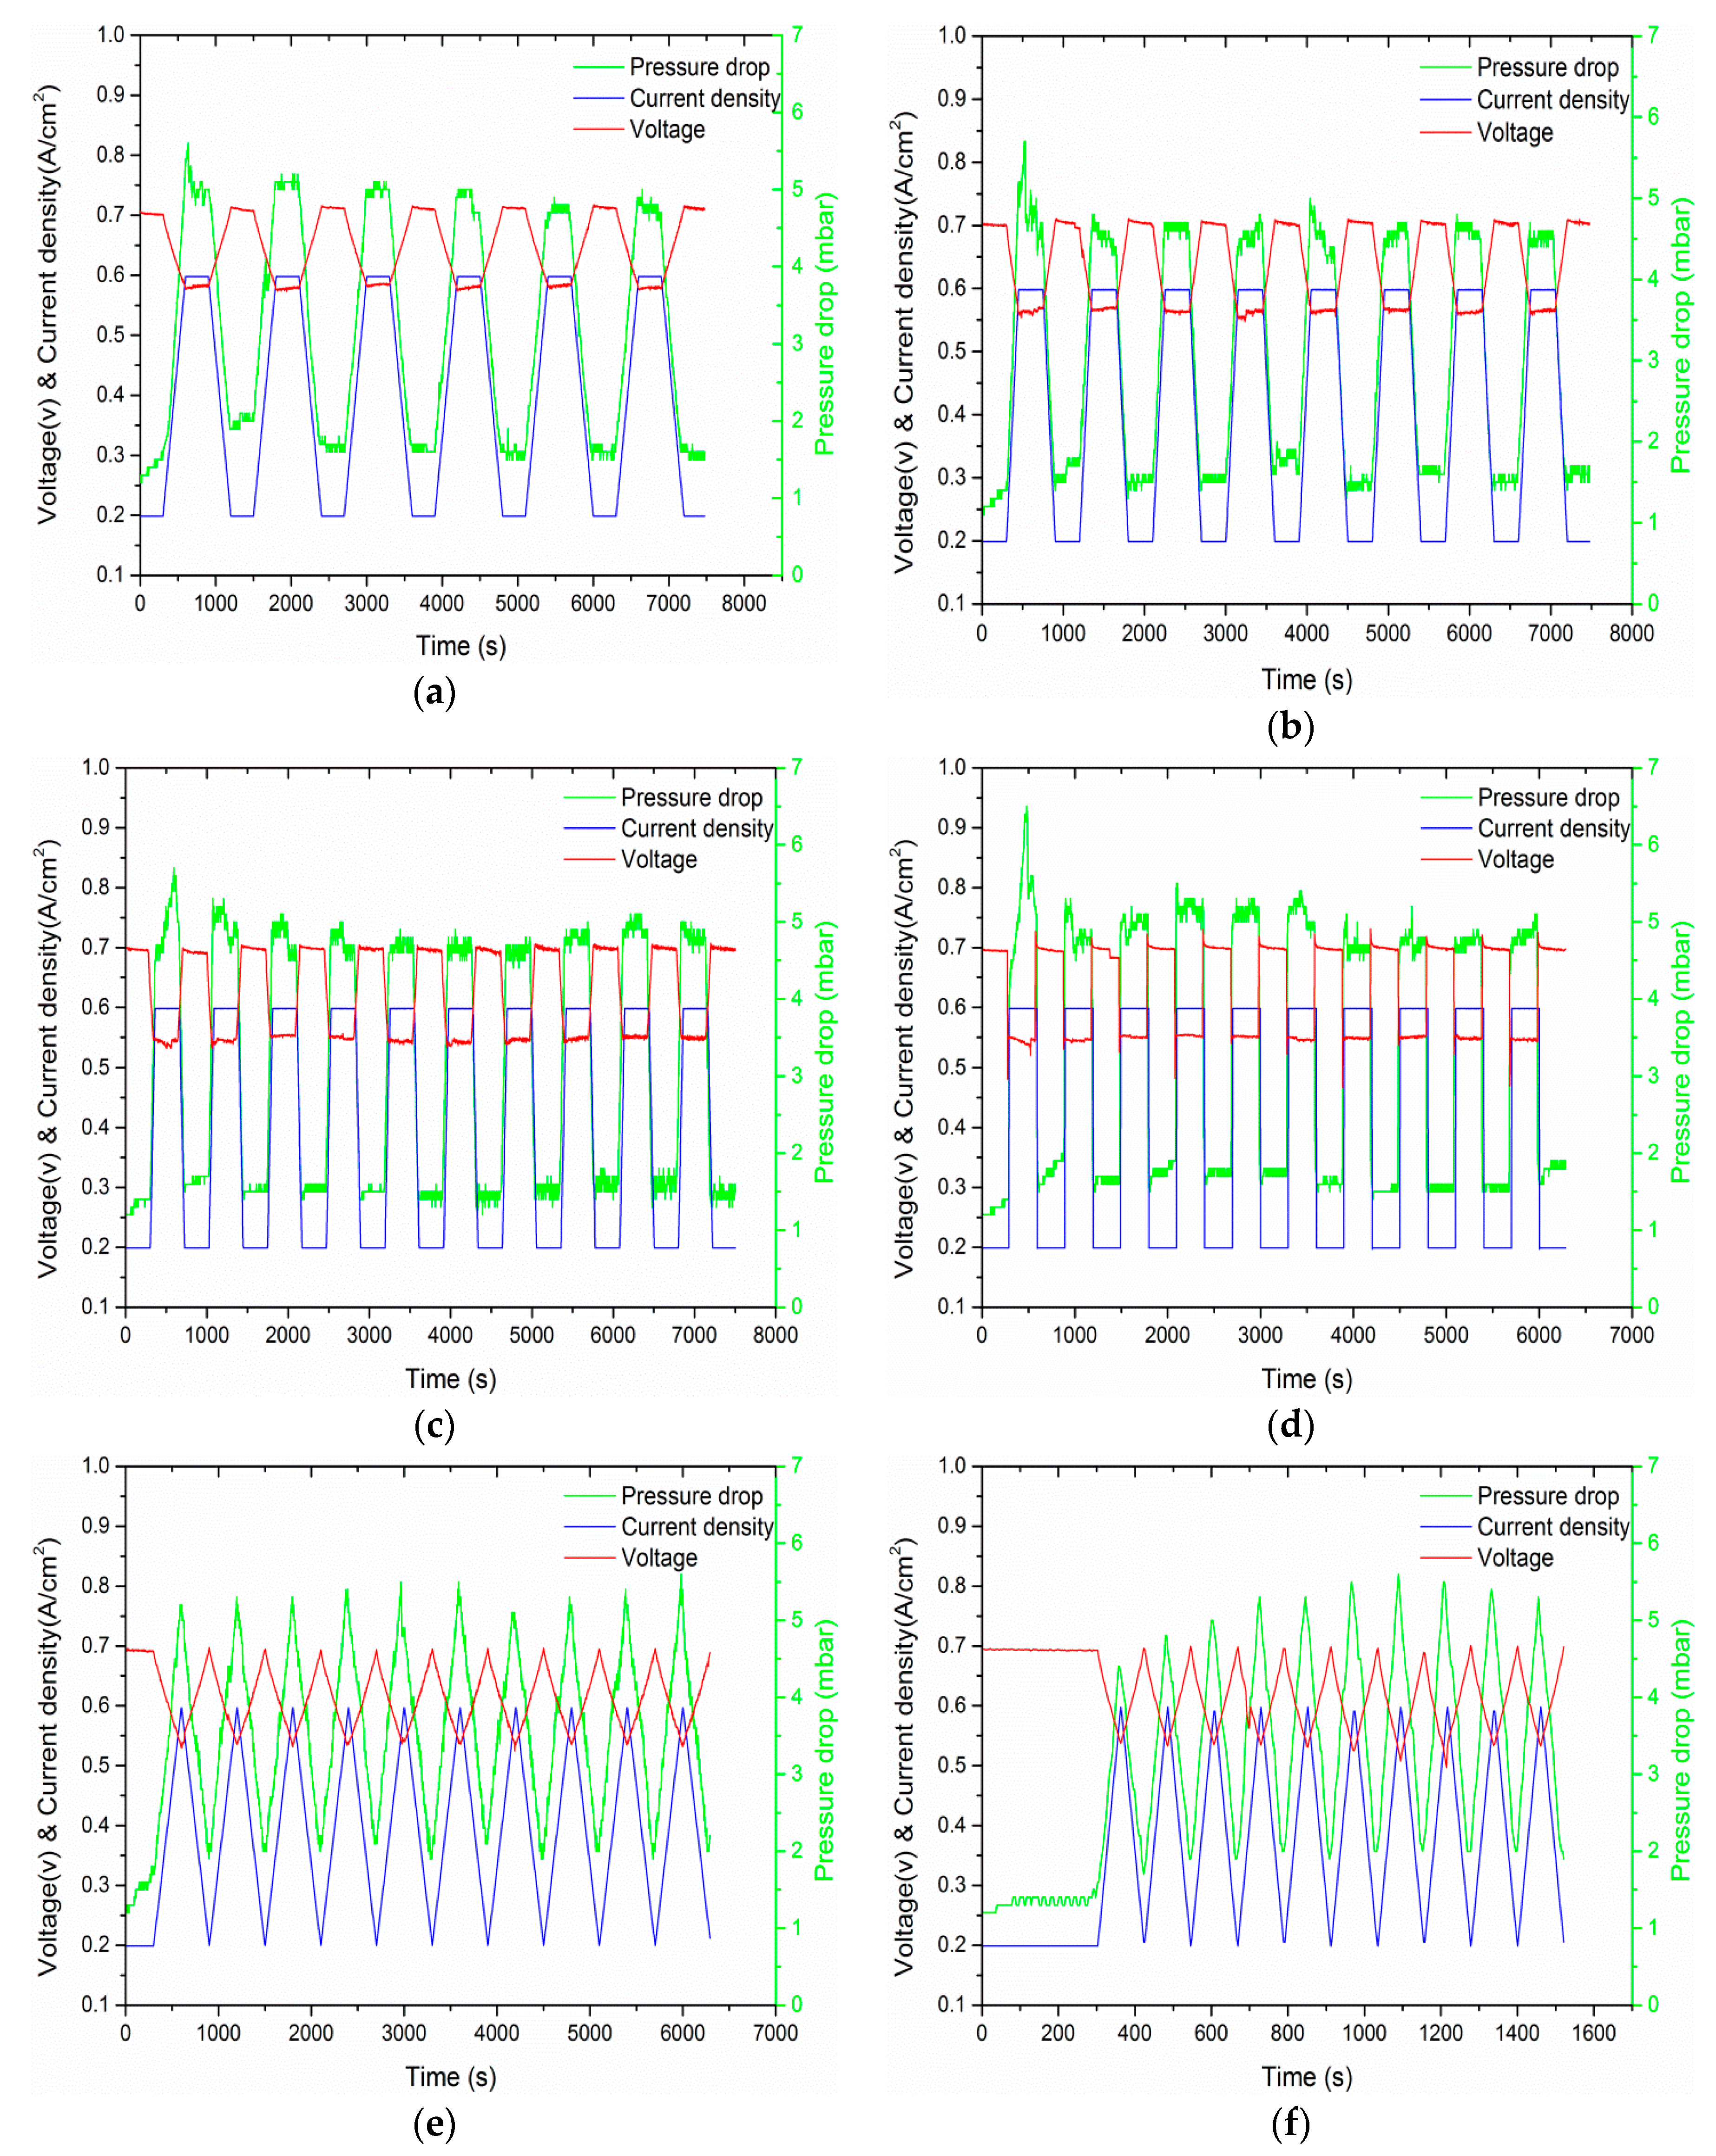
Six sets of experiments were conducted in this study. The maximum duration of each test was no more than two hours. The maximum number of cycles of each test was no more than 10. Figure 4 shows the first load-cycle curve of each load-cycling profile. The starting current density is always 0.2 A/cm2 and remains so for five minutes, which is the so-called startup phase. The load ramps in test No. 1 can be described by four repeated steps, each with a duration of five minutes (indicated by 5-5-5-5):
- Linear current increase from 0.2 A/cm2 to 0.6 A/cm2
- Constant current at 0.6 A/cm2
- Linear current decrease from 0.6 A/cm2 to 0.2 A/cm2
- Constant current at 0.2 A/cm2
This is the first load cycle for test No. 1. The other tests have similar load-cycling profiles but with different times for the load ramps and constant current phases. The load ramps in test No. 2 are represented by 2.5-5-2.5-5, in test No. 3 it is 1-5-1-5, in test No. 4 it is 0-5-0-5, in test No. 5 it is 5-0-5-0, and in test No. 6 it is 1-0-1-0.
3. Results and Discussion
The cathodic pressure drop response and the cell voltage profile of test No. 1 to test No. 6 are shown in Figure 5. In the first cycle of each test, the cell voltages changed in correspondence with the changes of the current density, as well as the cathodic pressure drop. When the load decreased from 0.6 A/cm2 to 0.2 A/cm2, the pressure drop on the cathode side began to decrease. It reached the minimum value when the load reached 0.2 A/cm2. The cell voltage also reached the maximum corresponding value. A similar pattern was also observed in the subsequent cycles in each test.
3.1. Effect of Load Changes on Voltage Overshoot and Undershoot Behavior
The voltage overshoot and undershoot behavior were observed from test No. 1 to test No. 4. The reason for this is that the mass transfer is slower than the electrochemical reaction [19]. When increasing the current density, the gas consumption rate increases alongside the water generation rate. The increase in gas consumption leads to a decrease in the gas concentration on the catalyst layer. At the same time, the generated water accumulates in the GDL so that the reactant transport pathways are blocked and unable to reach the reaction site on time. This will cause sudden starvation as the voltage starts to decrease. The voltage achieves a constant value again as soon as the mass transfer process reaches a new equilibrium. When the current suddenly decreases, the gas consumption rate decreases, as well as the water generation rate, with excess water generated by the larger current making the membrane sufficiently hydrated. At the same time, the oxygen concentration on the cathode’s electrode is relatively large, which leads to the voltage overshoot behavior. When the mass transfer process reaches the new balance, the voltage achieves a constant value. When the holding time at the constant current density was zero, the overshoot or undershoot behavior was no longer observed—see test No. 5 and test No. 6.
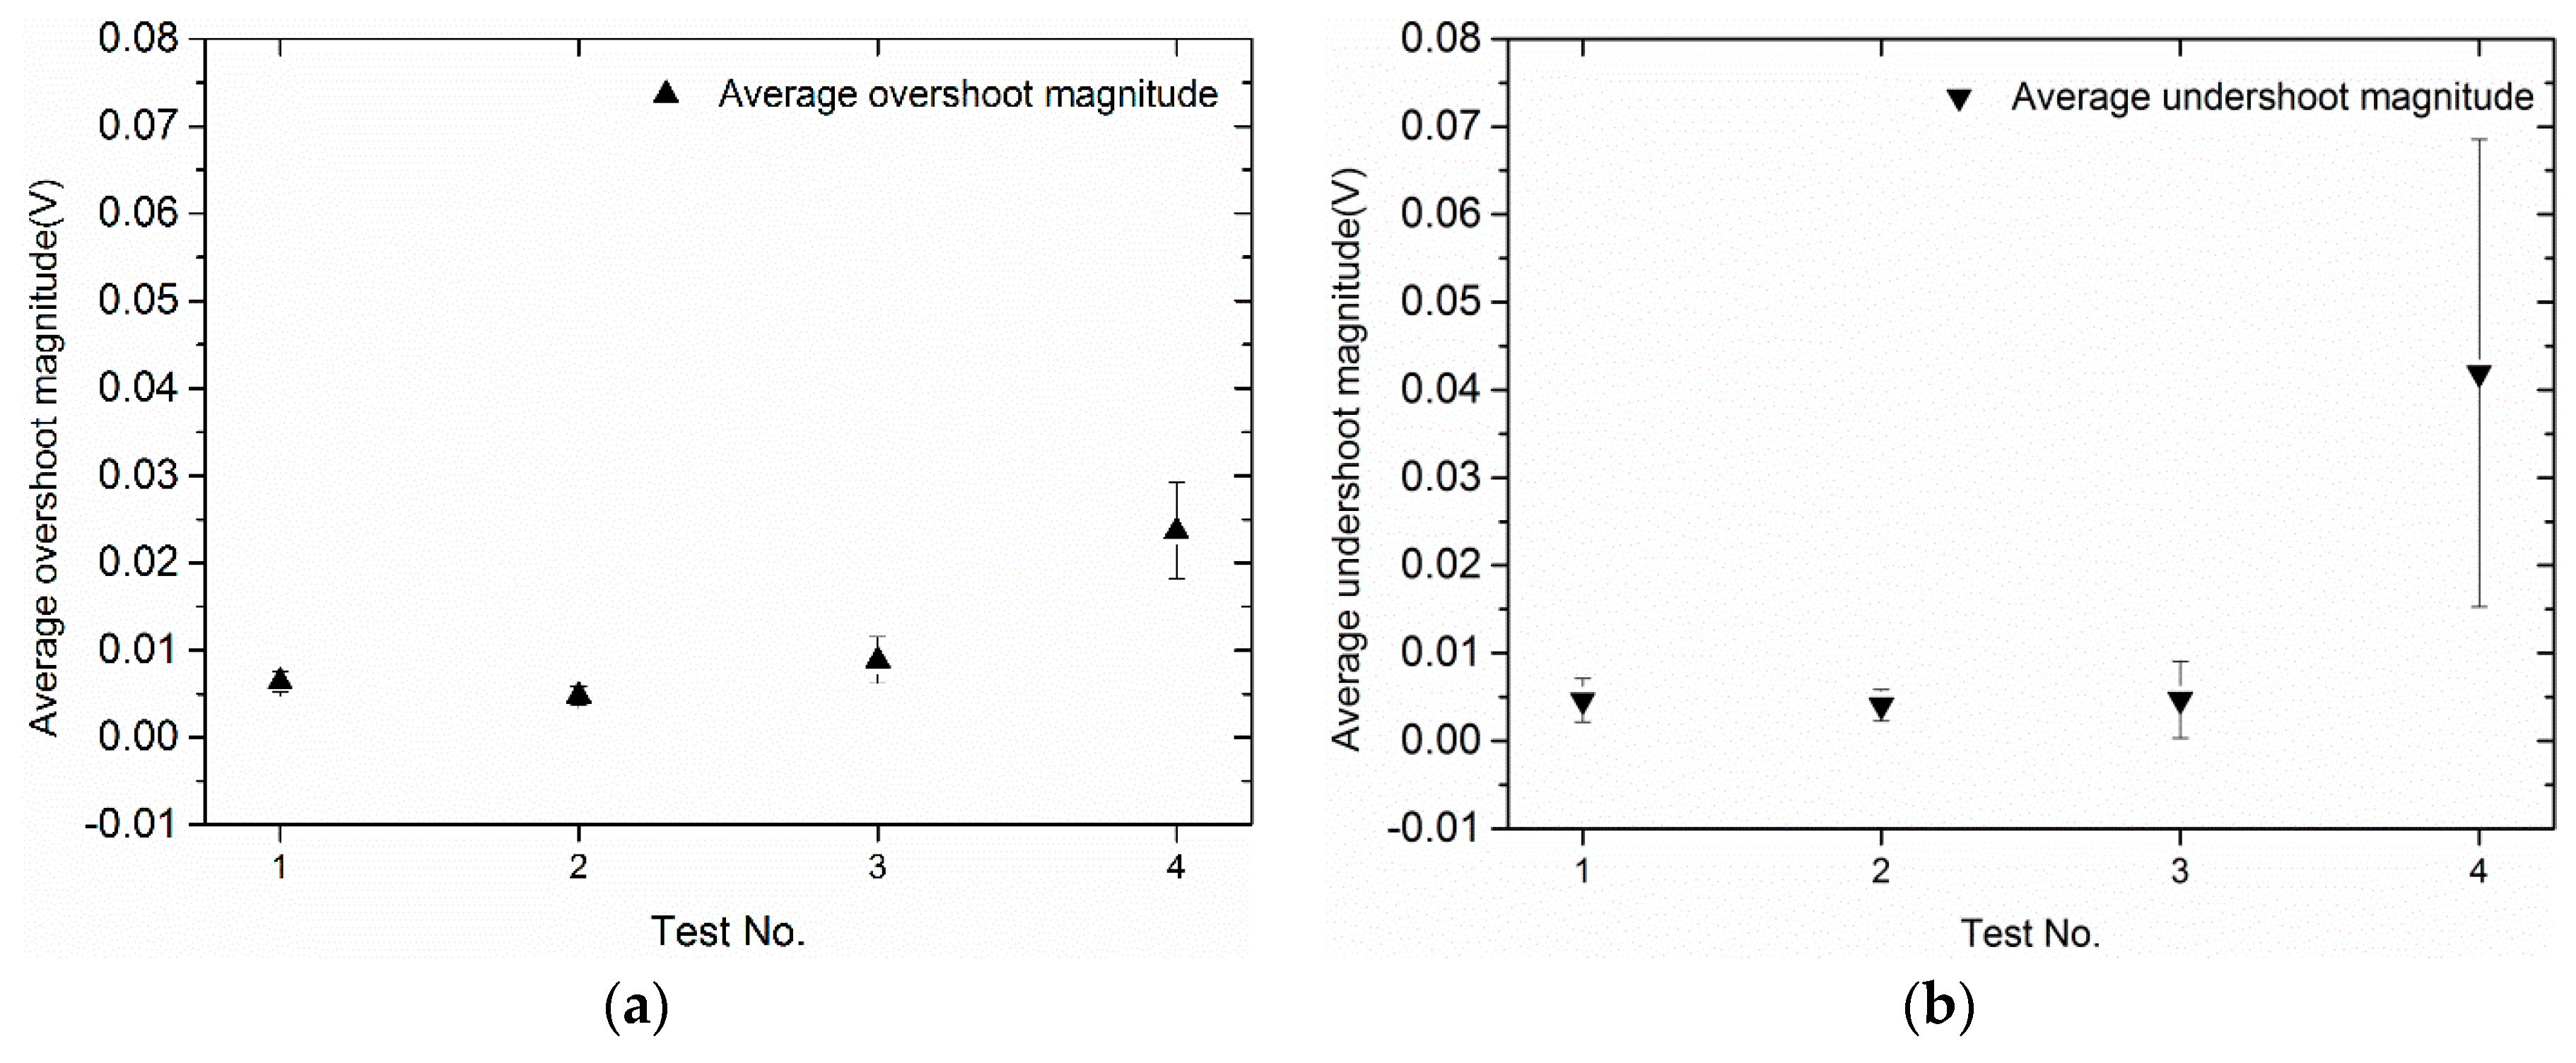
The average overshoot/undershoot magnitude (/) was studied to characterize the impact of load ramps on the voltage overshoot and undershoot behavior. The overshoot magnitude () is defined as the difference between the peak voltage and the steady state voltage. Similarly, the magnitude of undershoot () is defined as the difference between the minimum voltage value and the steady state voltage value. The VAOM can be calculated by the following equation:
where n means the number of cycles in each test. Equation (1) can also be used for the calculation. Figure 6 shows the impact of load ramps on the and . In Figure 6a, it can be seen that the of tests No. 1, No. 2, and No. 3 are in the same range, but for test No. 4, the is increased. Similarly, in Figure 6b, the of tests No. 1, No. 2, and No. 3 are nearly unchanged, while for test No. 4, the is increased with a large deviation. It can be noticed that when the load ramp rates () are not infinite (test No. 1 to test No. 3), this has a strong impact on the voltage overshoot and undershoot behavior. The load profiles with non-infinite ramps can help the mass transfer process to easily and quickly achieve equilibrium.
3.2. Effect of Load Ramps on Cathodic Pressure Drop Change
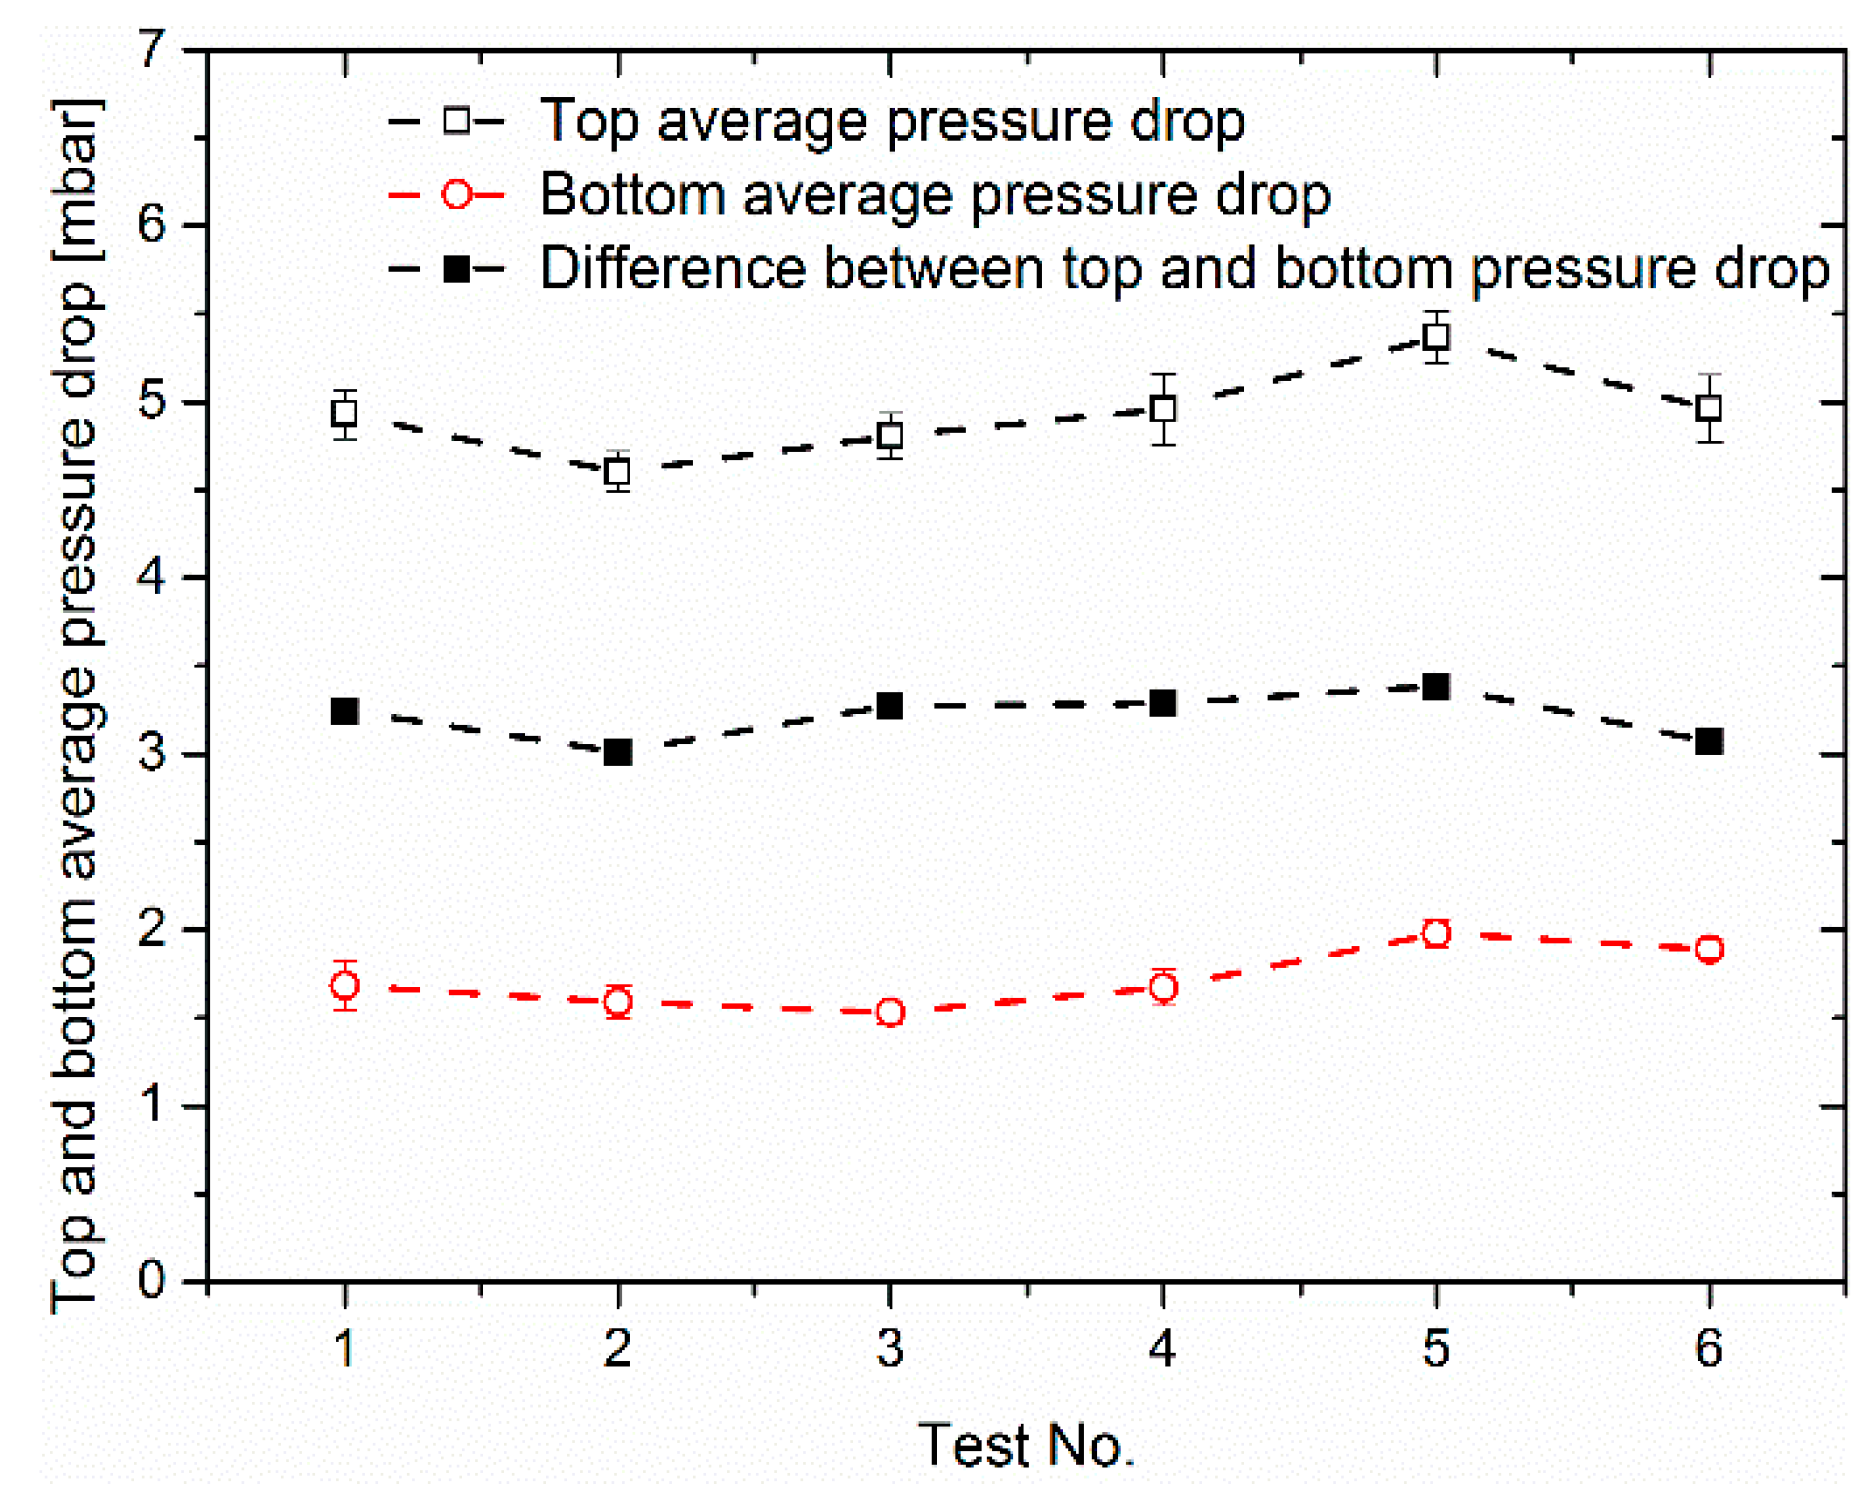
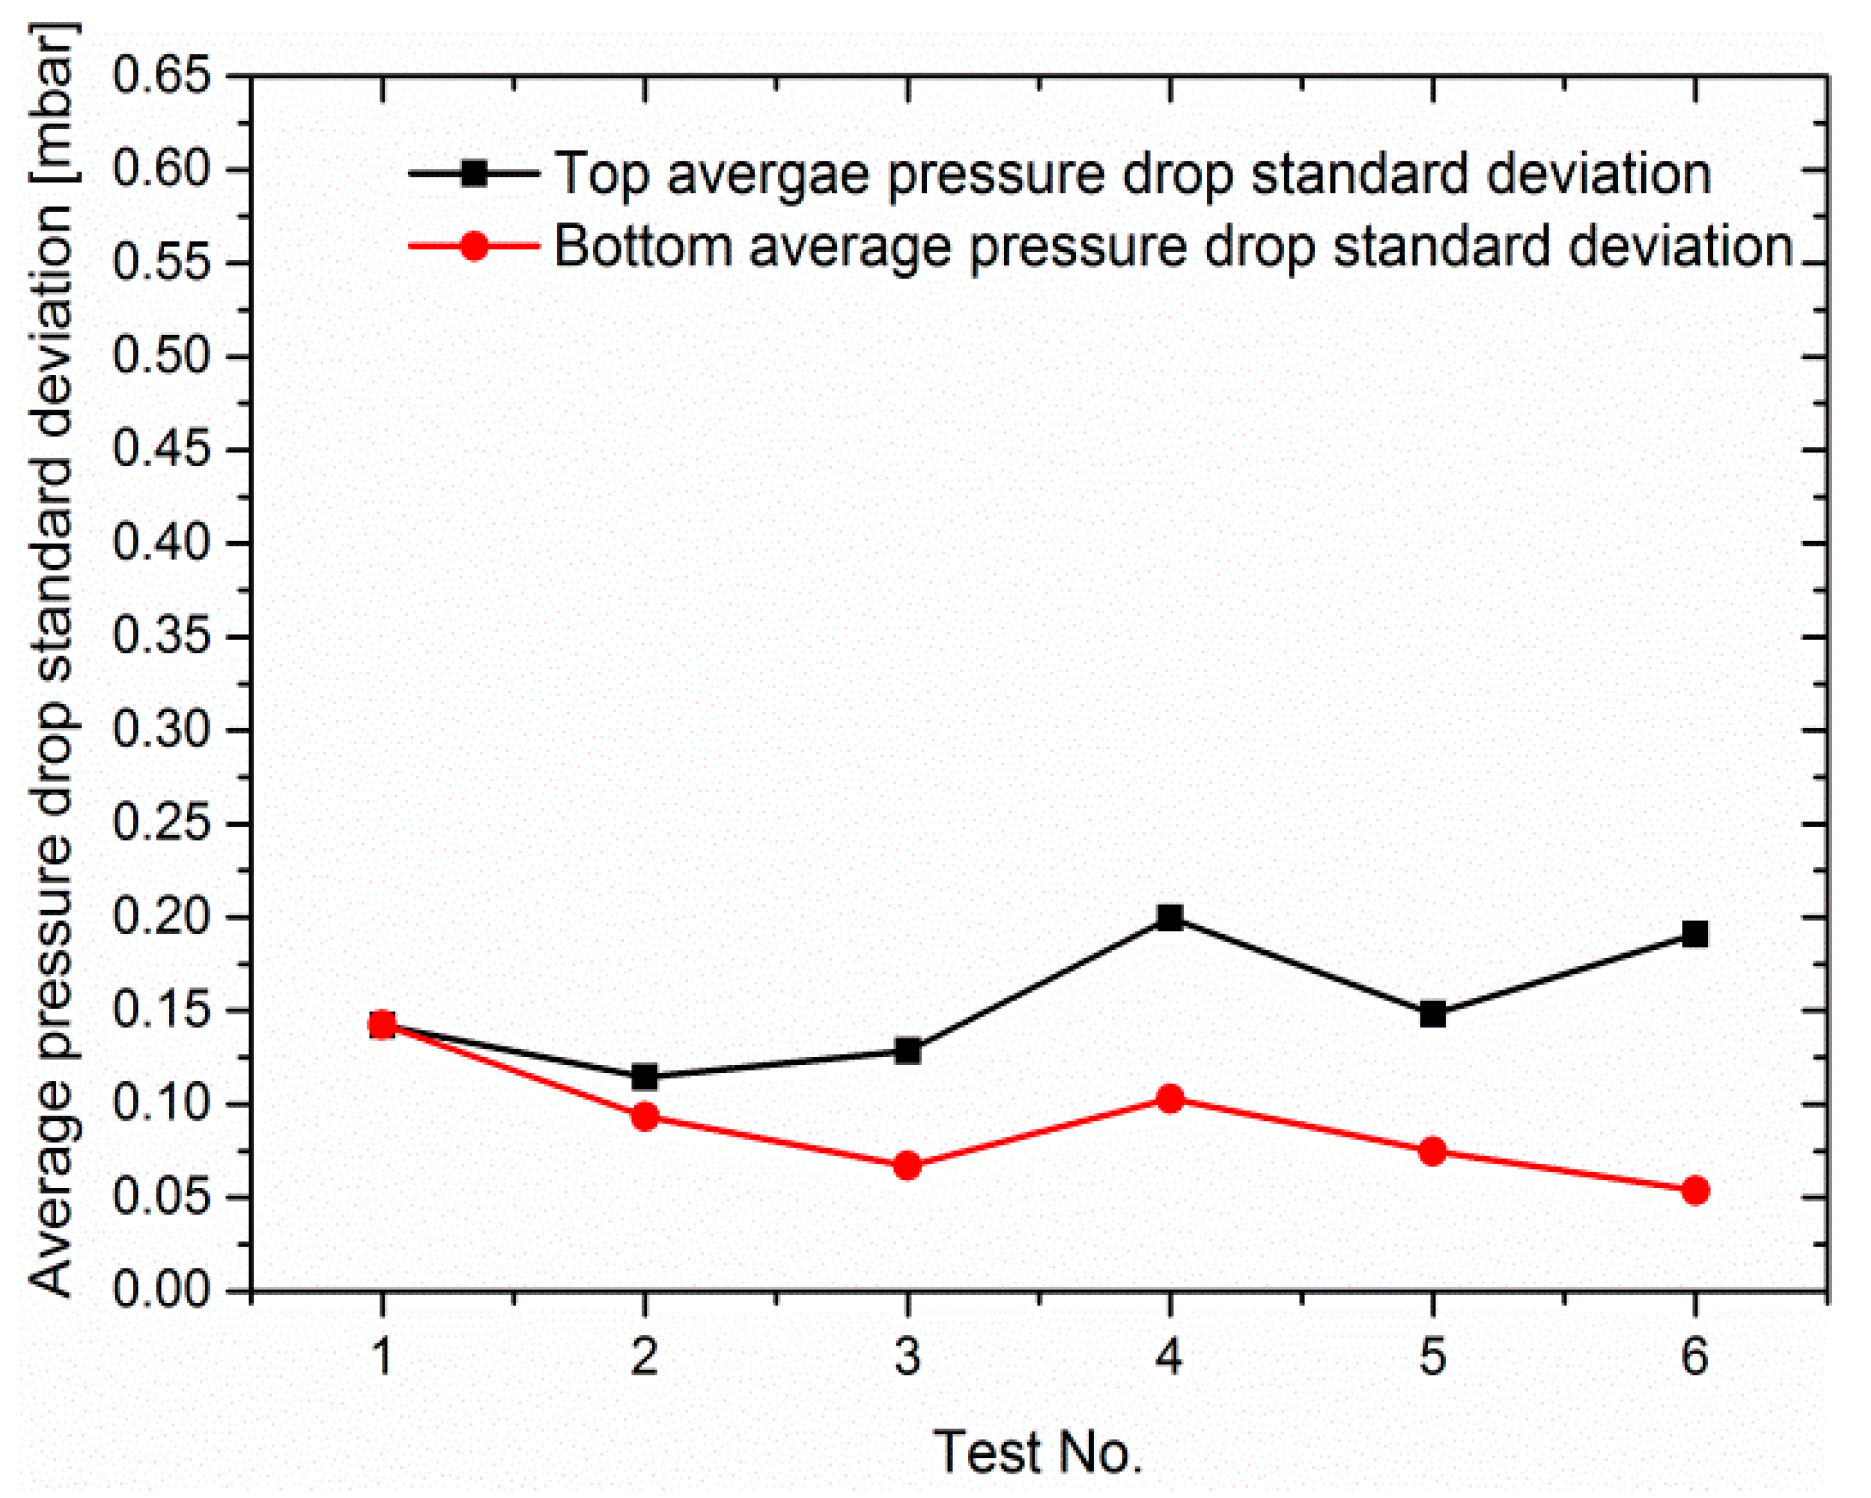
In order to characterize the cathodic pressure drop of the cell at different load ramps, we studied the top average pressure drop value () at 0.6 A/cm2 (constant current phase) and the bottom average pressure drop value () at 0.2 A/cm2 (constant current phase) in each test. As is shown in Figure 7, in tests No. 2 to No. 4, the increases slightly with the increase of the load ramp rates (). However, the corresponding changes in were not obvious, nor were the changes in the difference between and . Figure 8 shows the standard deviation of and with different load ramp rates. It can be observed that with an increase in the load ramp, the difference between the top and bottom pressure drop standard deviation becomes more significant. In tests No. 2 to No. 4 and tests No. 5 to No. 6, an increase of load ramp rates will lead to a increase in the standard deviation of . The reason for this might be that the smaller load ramp rates cause slower changing rates in the pressure drop, and the pressure drop reaches its equilibrium in the constant current phase. However, with the higher load ramp rates, the change of water flow produced is also higher, so that the equilibrium of the two-phase flow is harder to reach. This causes a higher pressure drop fluctuation.
Figure 9 shows the top and bottom pressure drop standard deviation in tests No. 1 to No. 4. In test No. 1, it can be observed that in the first cycle, the difference between the top and bottom pressure drop standard deviation is the largest, with cycles going on, then starting to decrease. A similar pattern can also be found in tests No. 2 to No. 4, although there was some fluctuation in this trend. It can be noted that during the cyclic operation, the two-phase flow tends to reach equilibrium in the cell. It was impossible to calculate the top and bottom pressure drop standard deviation in test No. 5 and test No. 6 because of the lack of a constant current phase in these cycles.
3.3. Effect of Load Ramps on Ohmic Resistance
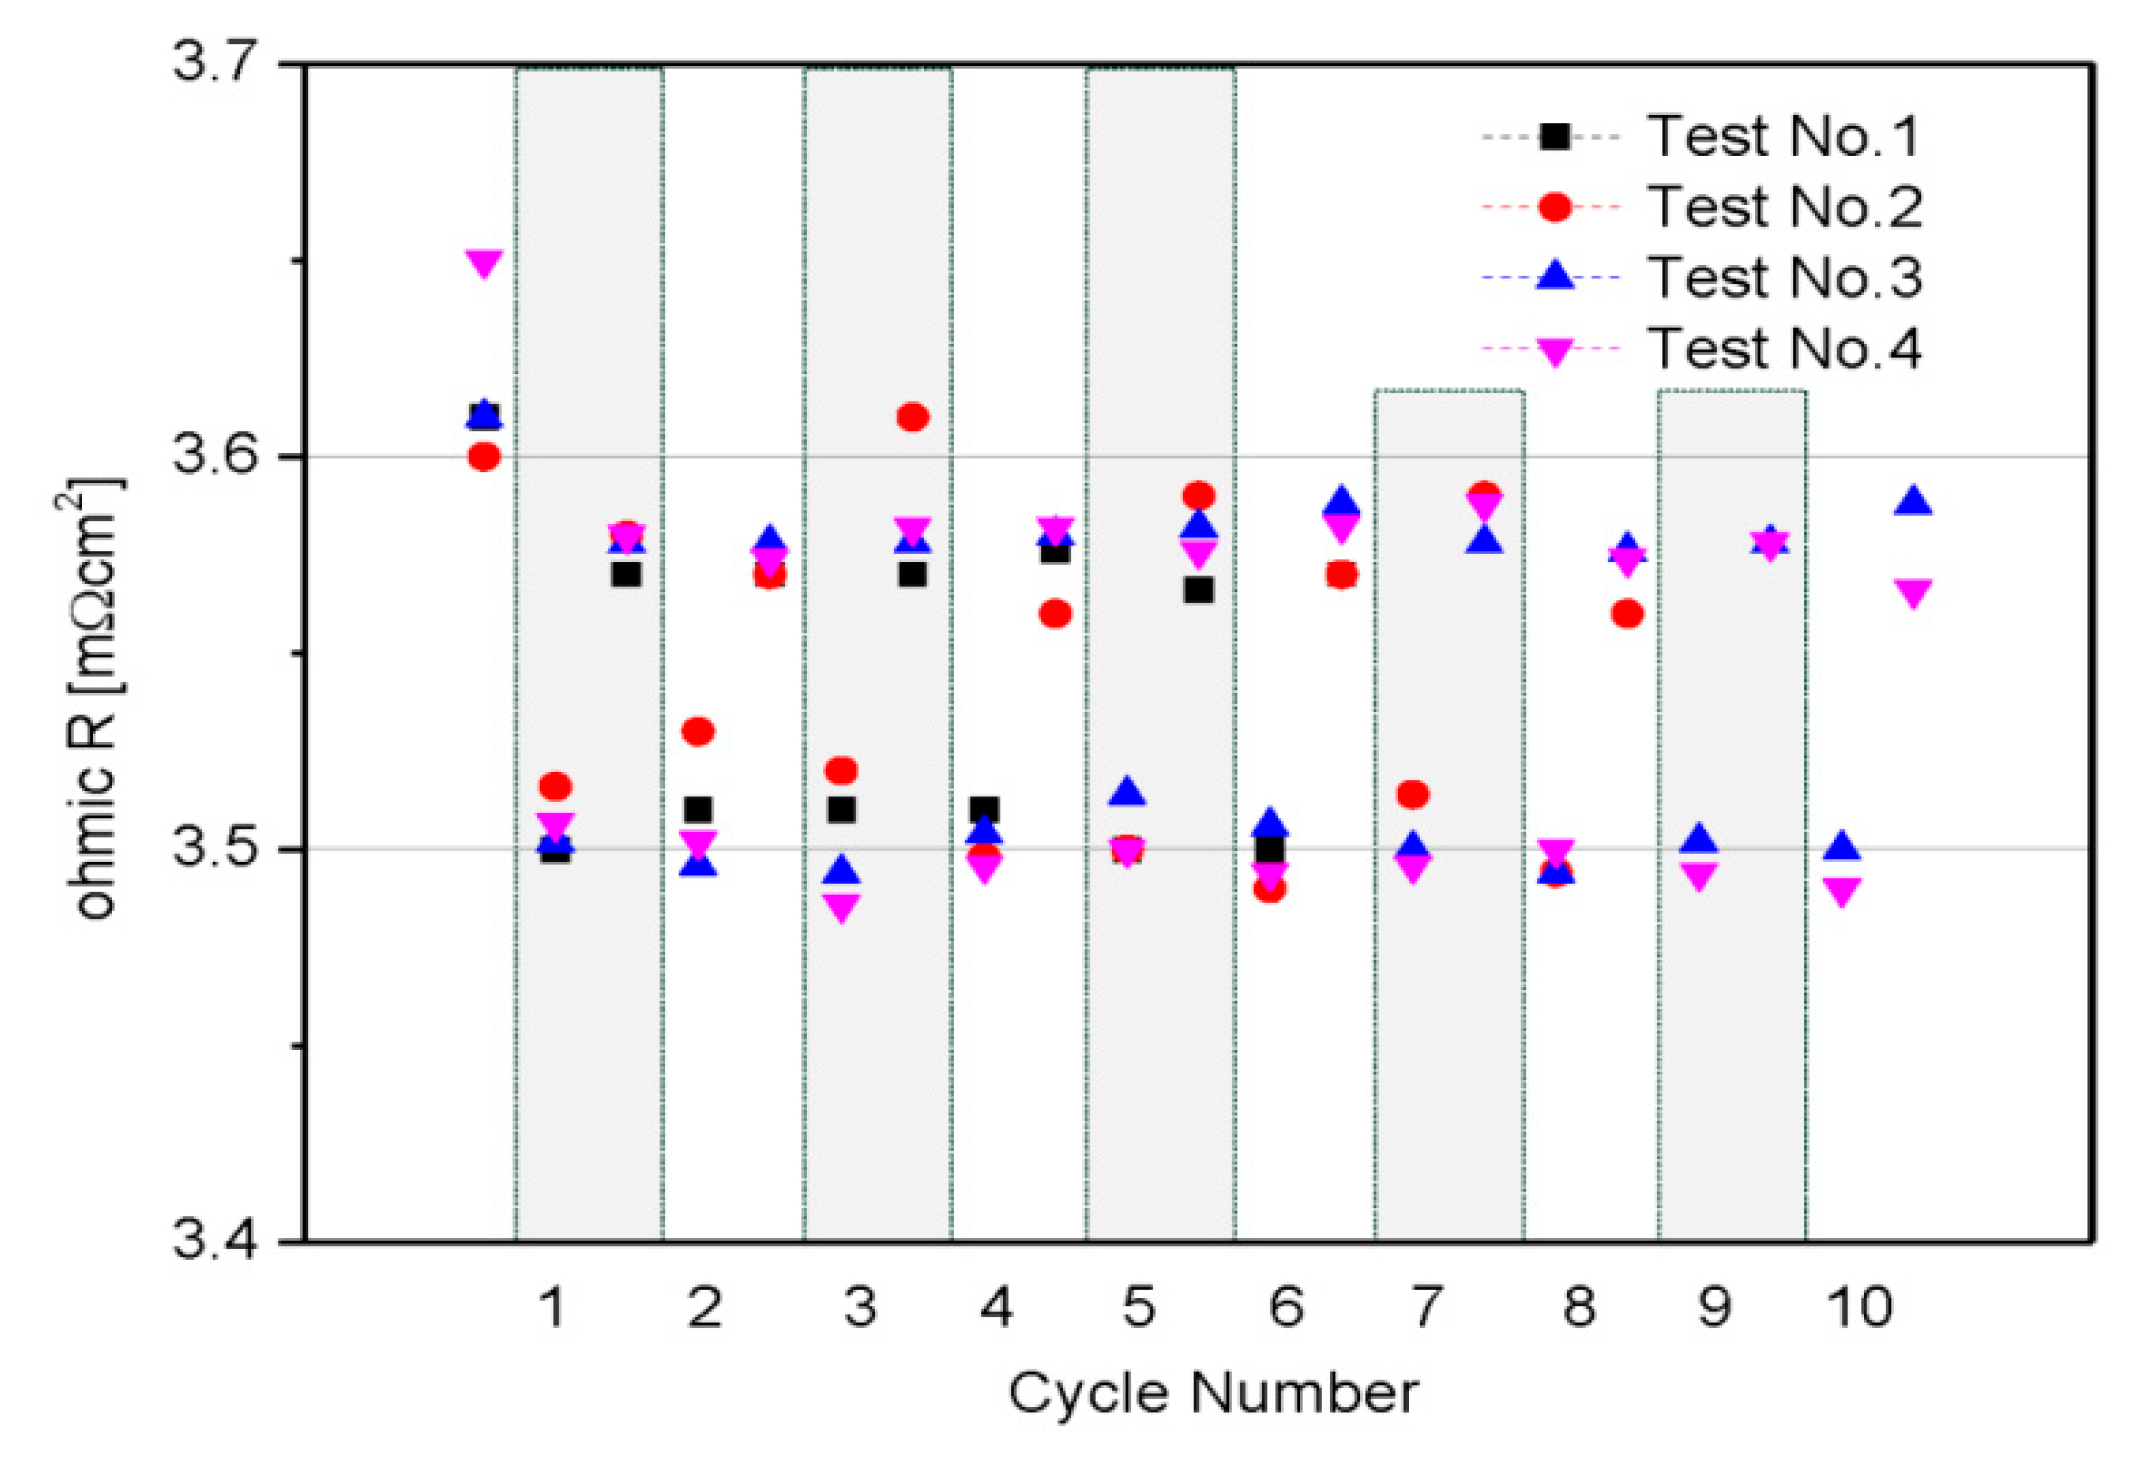
The galvanostatic mode was applied during resistance measurements. The amplitude of the AC voltage was set to 10 mV. The cell impedance was measured at a frequency of 3 kHz and can be considered as the cell ohmic resistance, which is the intercept on the high-frequency part of the real axis in the impedance spectra. Figure 10 shows the ohmic resistance in each cycle (indicated by the white and grey stripes) for tests No. 1 to No. 4. The ohmic resistance was measured in each cycle, first at 0.6 A/cm2 and then at 0.2 A/cm2. Before the first cycle was started, the ohmic resistance was measured during the start phase of each cycle at 0.2 A/cm2. It was clearly observed that the ohmic resistance is significantly higher at the lower current density. This is expected because at a higher current density value, more water is generated and the membrane has higher water content. This results in higher protonic conductivity. It was also observed that the ohmic resistance difference between each test is less than obvious. The reason for this might be that there is enough water inside the cell that the membrane is sufficiently humidified. The ohmic resistance was only measured from test No. 1 to No. 4, as it was impossible to measure the ohmic resistance in test No. 5 and No. 6 because of the lack of constant current phase in these cycles.
4. Conclusions
In this paper, experiments on the transient behavior of a PEFC under different load profiles were conducted. The cell voltage, pressure drop response, and ohmic resistance were measured and studied.
Voltage overshoot and undershoot behavior were observed during the tests. When the load ramp rate was infinite (load change time was zero), it had a strong effect on the voltage overshoot and undershoot behavior compared to other load ramp rates, for which the load change time was not zero. When the constant load holding time was zero, the voltage overshoot or undershoot behavior was no longer observed.
The load ramp did not have an obvious impact on the average pressure drop differences between each test. During the cyclic operation in each test, the difference between the top and bottom pressure drop standard deviation was gradually decreasing, which meant that the two-phase flow tended to reach equilibrium in the cell with the cyclic operation.
Finally, the impedance analysis showed that the ohmic resistance changes with the change of the current density and the lower current caused higher ohmic resistance. The larger current will cause lower ohmic resistance of the membrane. The reason for this was that under the higher load, the cell generated more water. The membrane was sufficiently humidified and increased the ionic conductivity of the membrane. Furthermore, the difference between each test was not obvious. The reason for this may have been that there was always enough water inside the cell.
Overall, this study provides information about how the cyclic load profile influences the cell performance and water dynamics behavior in the cell. It can be concluded that the cyclic operation seemed to have no obvious influence on the cell’s overall performance. The pressure drop had a larger fluctuation in the first cycle and became smaller as the cycles went on. This represented the water-related dynamic behavior of the cell without affecting the cell’s performance. Other operational parameters or cell and flow field designs than chosen in this study led to different results and conclusions. Furthermore, when changing the load, it was necessary to adjust operating conditions such as relative humidity in order to keep the membrane at a lower ohmic resistance. All of this information could help improve the control strategy of the fuel cell system for the real vehicular application.
Author Contributions
Conceptualization, W.L.; Methodology: Y.S., H.J. and W.L.; Investigation, Y.S. and H.J.; Writing—Original Draft Preparation, Y.S.; Writing—Review & Editing, Y.S., H.J. and W.L.; Funding Acquisition: Y.S. and W.L.; Supervision, H.J. and W.L.
Funding
This research was funded by the China Scholarship Council (CSC), grant number 201608110140.
Acknowledgments
We are thankful to Christopher Wood for proofreading the manuscript.
Conflicts of Interest
The authors declare no conflict of interest. The funders had no role in the design of the study; in the collection, analyses, or interpretation of data; in the writing of the manuscript, or in the decision to publish the results.
References
- Liu, Y.; Jia, X.; Pei, P.; Lu, Y.; Yi, L.; Shi, Y. Simulation and experiment for oxygen-enriched combustion engine using liquid oxygen to solidify CO2. Chin. J. Mech. Eng. 2016, 29, 188–194. [Google Scholar] [CrossRef]
- Niakolas, D.K.; Daletou, M.; Neophytides, S.G.; Vayenas, C.G. Fuel cells are a commercially viable alternative for the production of “clean” energy. J. Hum. Environ. 2016, 45, 32–37. [Google Scholar] [CrossRef] [PubMed]
- Liu, Y.; Lehnert, W.; Janßen, H.; Samsun, R.C.; Stolten, D. A review of high-temperature polymer electrolyte membrane fuel-cell (HT-PEMFC)-based auxiliary power units for diesel-powered road vehicles. J. Power Sources 2016, 311, 91–102. [Google Scholar] [CrossRef]
- Wang, F.-C.; Gao, C.-Y.; Li, S.-C. Impacts of power management on a PEMFC electric vehicle. Int. J. Hydrog. Energy 2014, 39, 17336–17346. [Google Scholar] [CrossRef]
- Zhang, C.; Zhou, W.; Zhang, L.; Chan, S.H.; Wang, Y. An experimental study on anode water management in high temperature PEM fuel cell. Int. J. Hydrog. Energy 2015, 40, 4666–4672. [Google Scholar] [CrossRef]
- Urbani, F.; Barbera, O.; Giacoppo, G.; Squadrito, G.; Passalacqua, E. Effect of operative conditions on a PEFC stack performance. Int. J. Hydrog. Energy 2008, 33, 3137–3141. [Google Scholar] [CrossRef]
- Ahn, S.-Y.; Shin, S.-J.; Ha, H.Y.; Hong, S.-A.; Lee, Y.-C.; Lim, T.W.; Oh, I.H. Performance and lifetime analysis of the kW-class PEMFC stack. J. Power Sources 2002, 106, 295–303. [Google Scholar] [CrossRef]
- Scholta, J.; Häussler, F.; Zhang, W.; Küppers, L.; Jörissen, L.; Lehnert, W. Development of a stack having an optimized flow field structure with low cross transport effects. J. Power Sources 2006, 155, 60–65. [Google Scholar] [CrossRef]
- Amphlett, J.C.; Mann, R.F.; Peppley, B.A.; Roberge, P.R.; Rodrigues, A. A model predicting transient responses of proton exchange membrane fuel cells. J. Power Sources 1996, 61, 183–188. [Google Scholar] [CrossRef]
- Um, S.; Wang, C.-Y.; Chen, K.S. Computational Fluid Dynamics Modeling of Proton Exchange Membrane Fuel Cells. J. Electrochem. Soc. 2000, 147, 4485. [Google Scholar] [CrossRef]
- Hamelin, J.; Agbossou, K.; Laperrière, A.; Laurencelle, F.; Bose, T.K. Dynamic behavior of a PEM fuel cell stack for stationary applications. Int. J. Hydrog. Energy 2001, 26, 625–629. [Google Scholar] [CrossRef]
- Kim, S.; Shimpalee, S.; van Zee, J.W. The effect of stoichiometry on dynamic behavior of a proton exchange membrane fuel cell (PEMFC) during load change. J. Power Sources 2004, 135, 110–121. [Google Scholar] [CrossRef]
- Shen, Q.; Hou, M.; Yan, X.; Liang, D.; Zang, Z.; Hao, L.; Shao, Z.; Hou, Z.; Ming, P.; Yi, B. The voltage characteristics of proton exchange membrane fuel cell (PEMFC) under steady and transient states. J. Power Sources 2008, 179, 292–296. [Google Scholar] [CrossRef]
- Yan, W.-M.; Soong, C.-Y.; Chen, F.; Chu, H.-S. Transient analysis of reactant gas transport and performance of PEM fuel cells. J. Power Sources 2005, 143, 48–56. [Google Scholar] [CrossRef]
- Yan, Q.; Toghiani, H.; Causey, H. Steady state and dynamic performance of proton exchange membrane fuel cells (PEMFCs) under various operating conditions and load changes. J. Power Sources 2006, 161, 492–502. [Google Scholar] [CrossRef]
- Liu, D.; Case, S. Durability study of proton exchange membrane fuel cells under dynamic testing conditions with cyclic current profile. J. Power Sources 2006, 162, 521–531. [Google Scholar] [CrossRef]
- Lin, R.; Li, B.; Hou, Y.P.; Ma, J.M. Investigation of dynamic driving cycle effect on performance degradation and micro-structure change of PEM fuel cell. Int. J. Hydrog. Energy 2009, 34, 2369–2376. [Google Scholar] [CrossRef]
- Lin, R.; Xiong, F.; Tang, W.C.; Técher, L.; Zhang, J.M.; Ma, J.X. Investigation of dynamic driving cycle effect on the degradation of proton exchange membrane fuel cell by segmented cell technology. J. Power Sources 2014, 260, 150–158. [Google Scholar] [CrossRef]
- Banerjee, R.; Kandlikar, S.G. Two-phase flow and thermal transients in proton exchange membrane fuel cells–A critical review. Int. J. Hydrog. Energy 2015, 40, 3990–4010. [Google Scholar] [CrossRef]
- Sergi, J.M.; Lu, Z.; Kandlikar, S.G. In Situ Characterization of Two-Phase Flow in Cathode Channels of an Operating PEM Fuel Cell With Visual Access. In Proceedings of the ASME 2009 7th International Conference on Nanochannels, Microchannels and Minichannels (ASME), Pohang, Korea, 22–24 June 2009; pp. 303–311. [Google Scholar]
- Zhang, L.; Du, W.; Bi, H.T.; Wilkinson, D.P.; Stumper, J.; Wang, H. Gas–liquid two-phase flow distributions in parallel channels for fuel cells. J. Power Sources 2009, 189, 1023–1031. [Google Scholar] [CrossRef]
- Adroher, X.C.; Wang, Y. Ex situ and modeling study of two-phase flow in a single channel of polymer electrolyte membrane fuel cells. J. Power Sources 2011, 196, 9544–9551. [Google Scholar] [CrossRef] [Green Version]
- Pei, P.; Li, Y.; Xu, H.; Wu, Z. A review on water fault diagnosis of PEMFC associated with the pressure drop. Appl. Energy 2016, 173, 366–385. [Google Scholar] [CrossRef]
- Stumper, J.; Löhr, M.; Hamada, S. Diagnostic tools for liquid water in PEM fuel cells. J. Power Sources 2005, 143, 150–157. [Google Scholar] [CrossRef]
- Chen, J. Dominant frequency of pressure drop signal as a novel diagnostic tool for the water removal in proton exchange membrane fuel cell flow channel. J. Power Sources 2010, 195, 1177–1181. [Google Scholar] [CrossRef]
- Banerjee, R.; Kandlikar, S.G. Experimental investigation of two-phase flow pressure drop transients in polymer electrolyte membrane fuel cell reactant channels and their impact on the cell performance. J. Power Sources 2014, 268, 194–203. [Google Scholar] [CrossRef]
- Banerjee, R.; Kandlikar, S.G. Two-Phase Pressure Drop Characteristics During Low Temperature Transients in PEMFCs. In Proceedings of the ASME 2014 12th International Conference on Nanochannels, Microchannels and Minichannels (ASME), Chicago, IL, USA, 3–7 August 2014. [Google Scholar]
- Banerjee, R.; Kandlikar, S.G. Two-phase pressure drop response during load transients in a PEMFC. Int. J. Hydrog. Energy 2014, 39, 19079–19086. [Google Scholar] [CrossRef] [Green Version]
- US Fuel Cell Council. USFCC Single Cell Test Protocol # 05-014. Available online: http://www.members.fchea.org/core/import/PDFs/Technical%20Resources/MatComp%20Single%20Cell%20Test%20Protocol%2005-014RevB.2%20071306.pdf (accessed on 20 July 2018).
- Cleghorn, S. TECHNICAL DATA–PRIMEA SERIES MEAs. Available online: https://www.dropbox.com/s/lzmrz9t4vuafhi1/2000%20Gore_Primea_NT-PEM_MEA_Einfahrprozedur.pdf (accessed on 20 July 2018).
- Banerjee, R.; See, E.; Kandlikar, S.G. Pressure Drop and Voltage Response of PEMFC Operation under Transient Temperature and Loading Conditions. ECS Trans. 2013, 58, 1601–1611. [Google Scholar] [CrossRef] [Green Version]
Figure 1.
The single cell used in the experiment.

Figure 2.
Detailed drawing of the monopolar plate and the flow field.
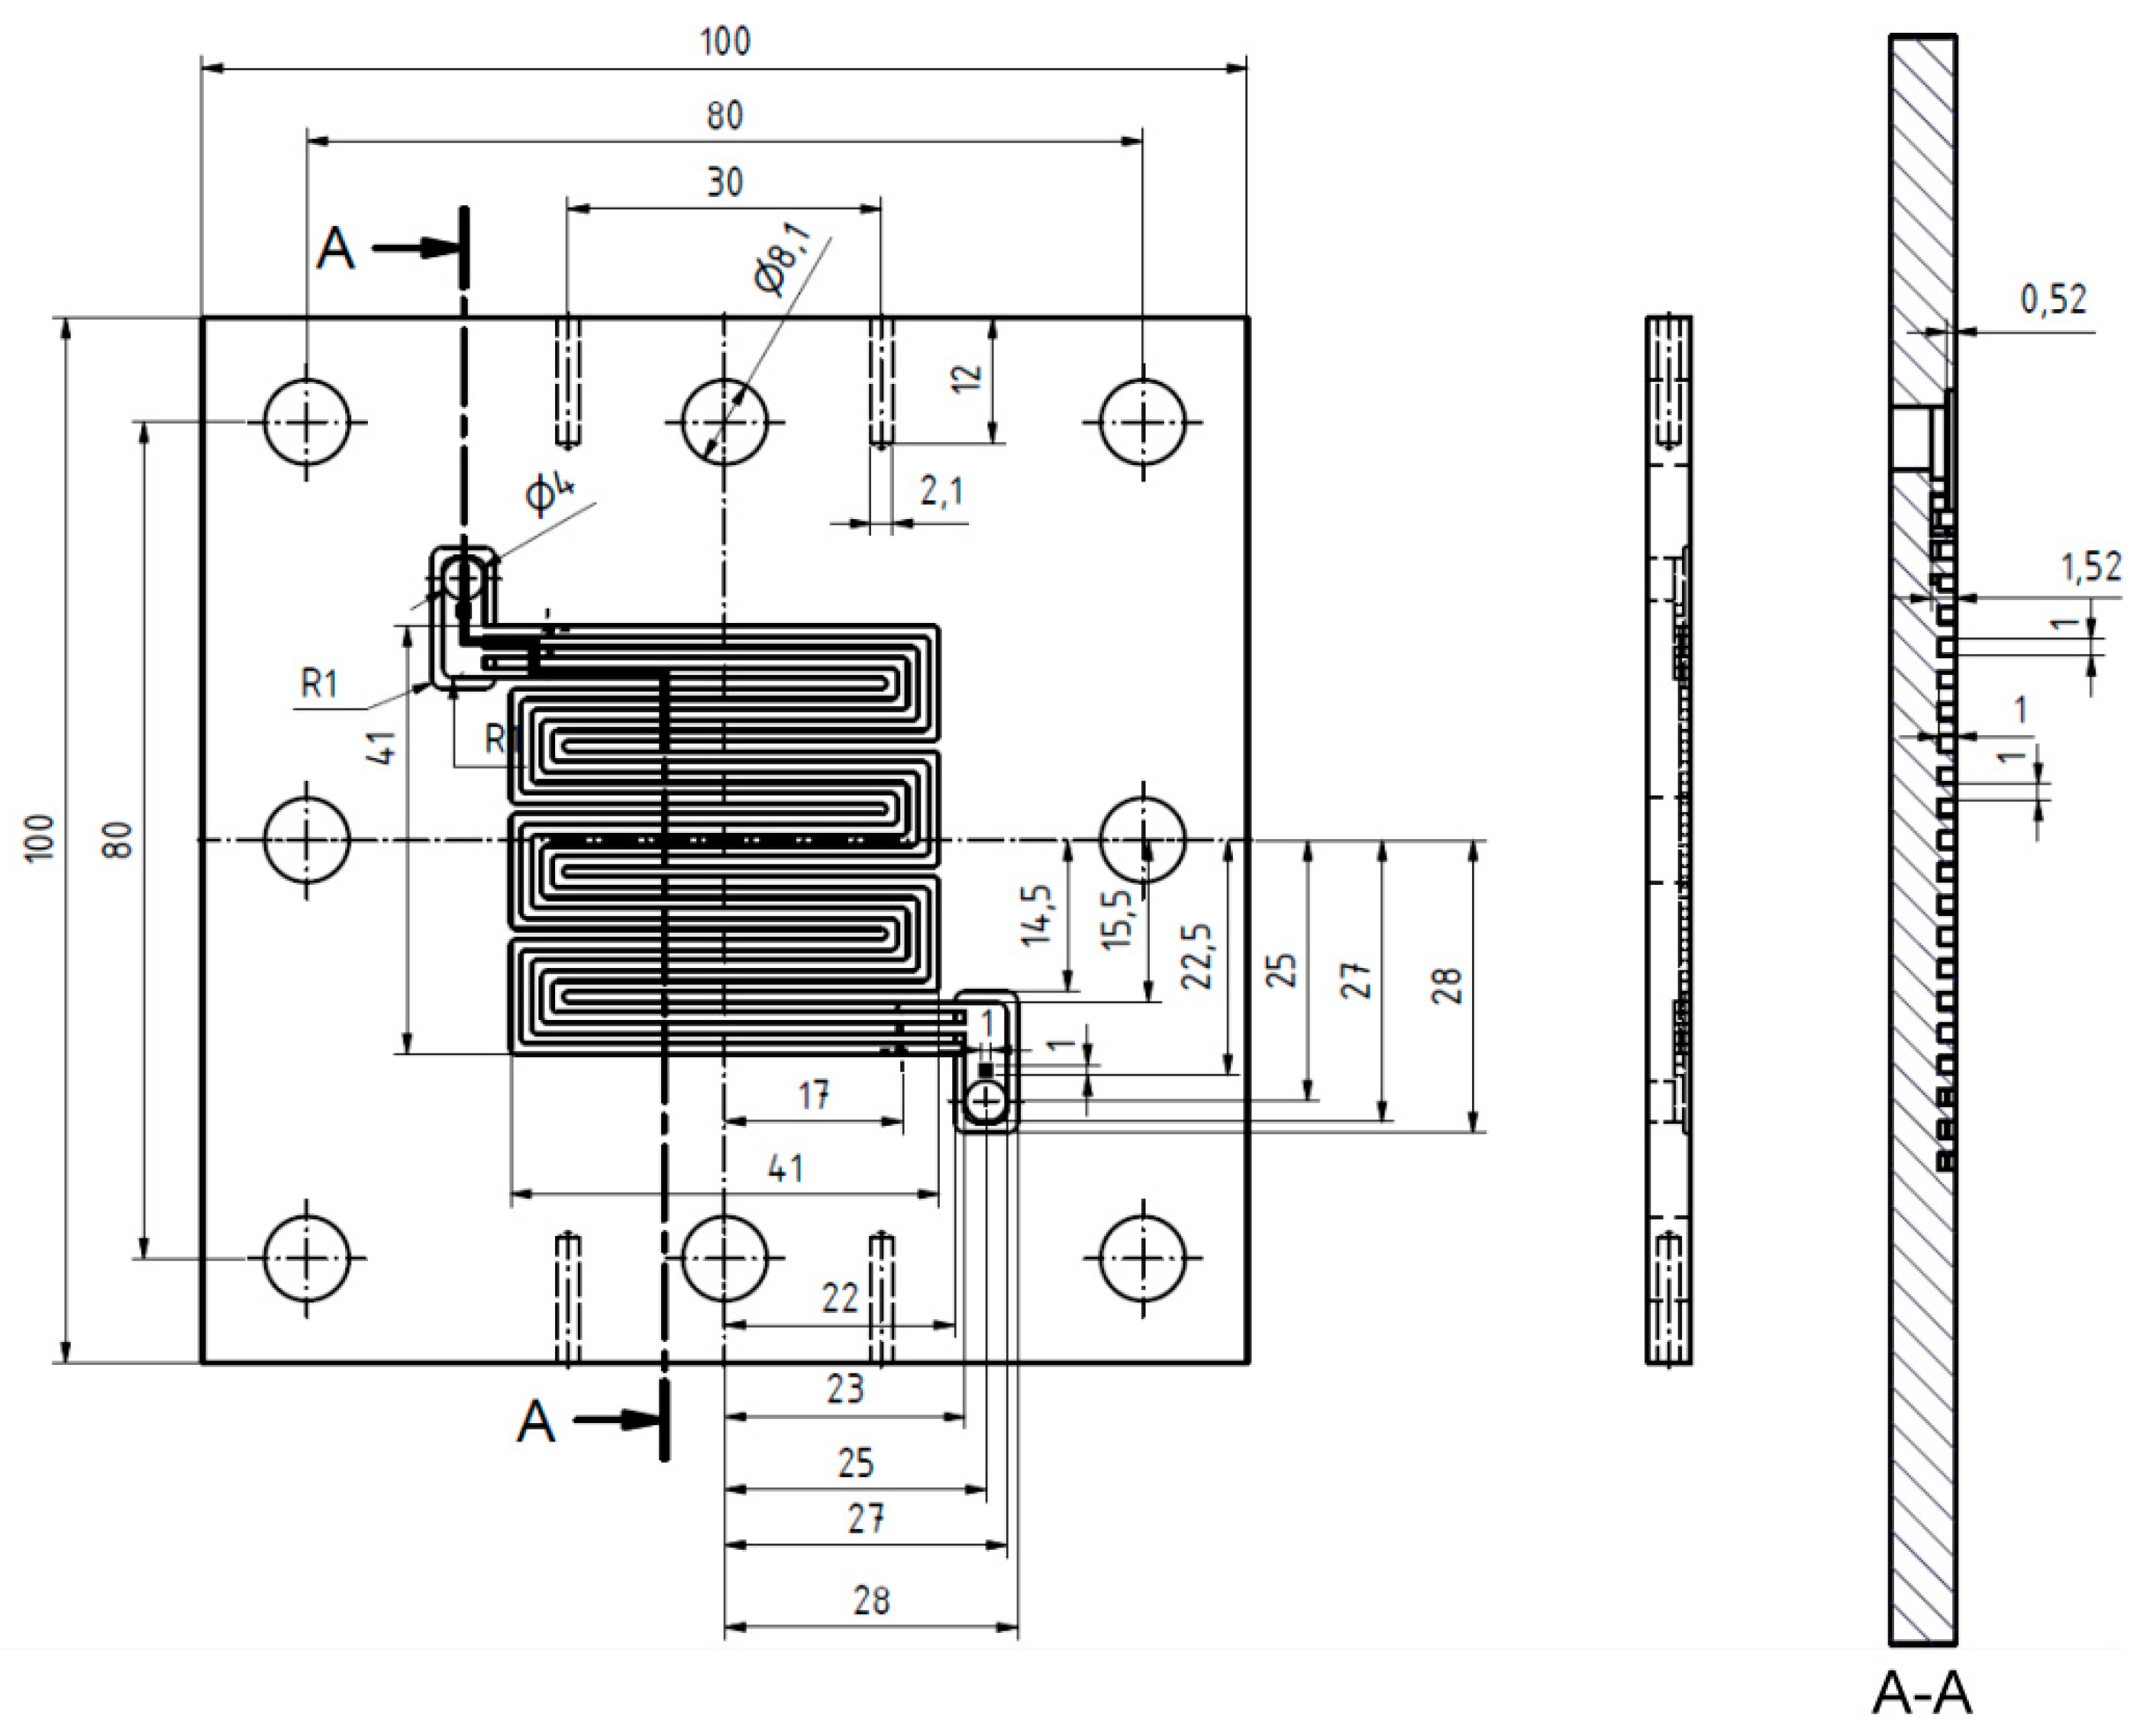
Figure 3.
Picture of test cell connected to the test stand.
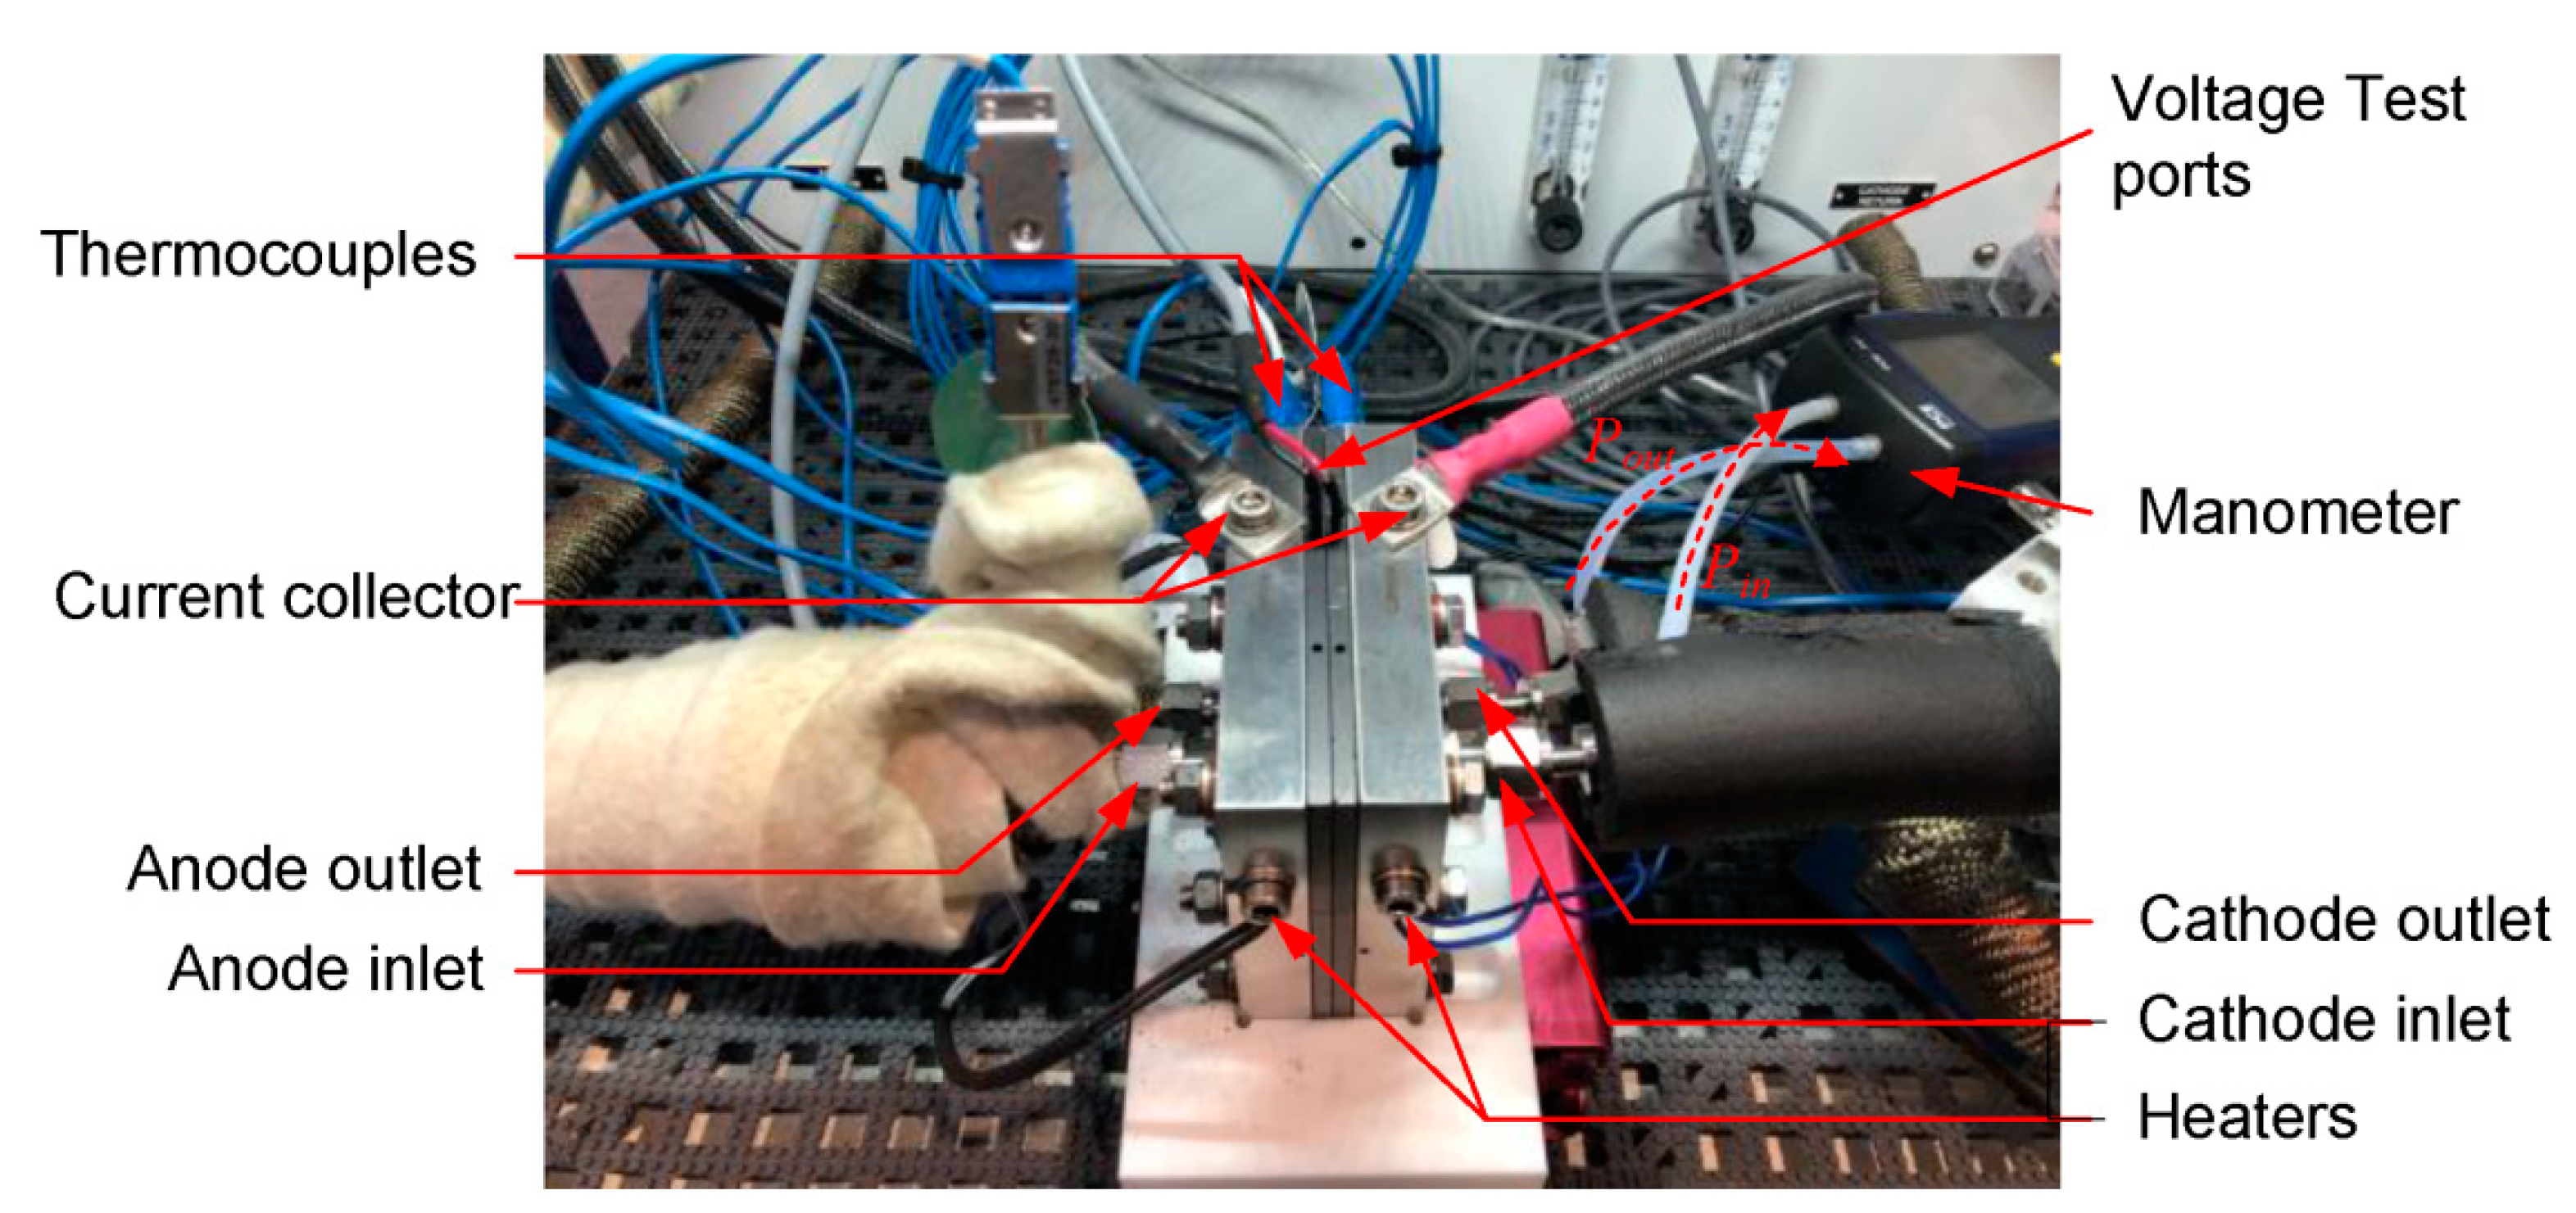
Figure 4.
The first cycle of the load-cycling profile in (a) test No. 1; (b) test No. 2; (c) test No. 3; (d) test No. 4; (e) test No. 5; and (f) test No. 6.
Figure 4.
The first cycle of the load-cycling profile in (a) test No. 1; (b) test No. 2; (c) test No. 3; (d) test No. 4; (e) test No. 5; and (f) test No. 6.
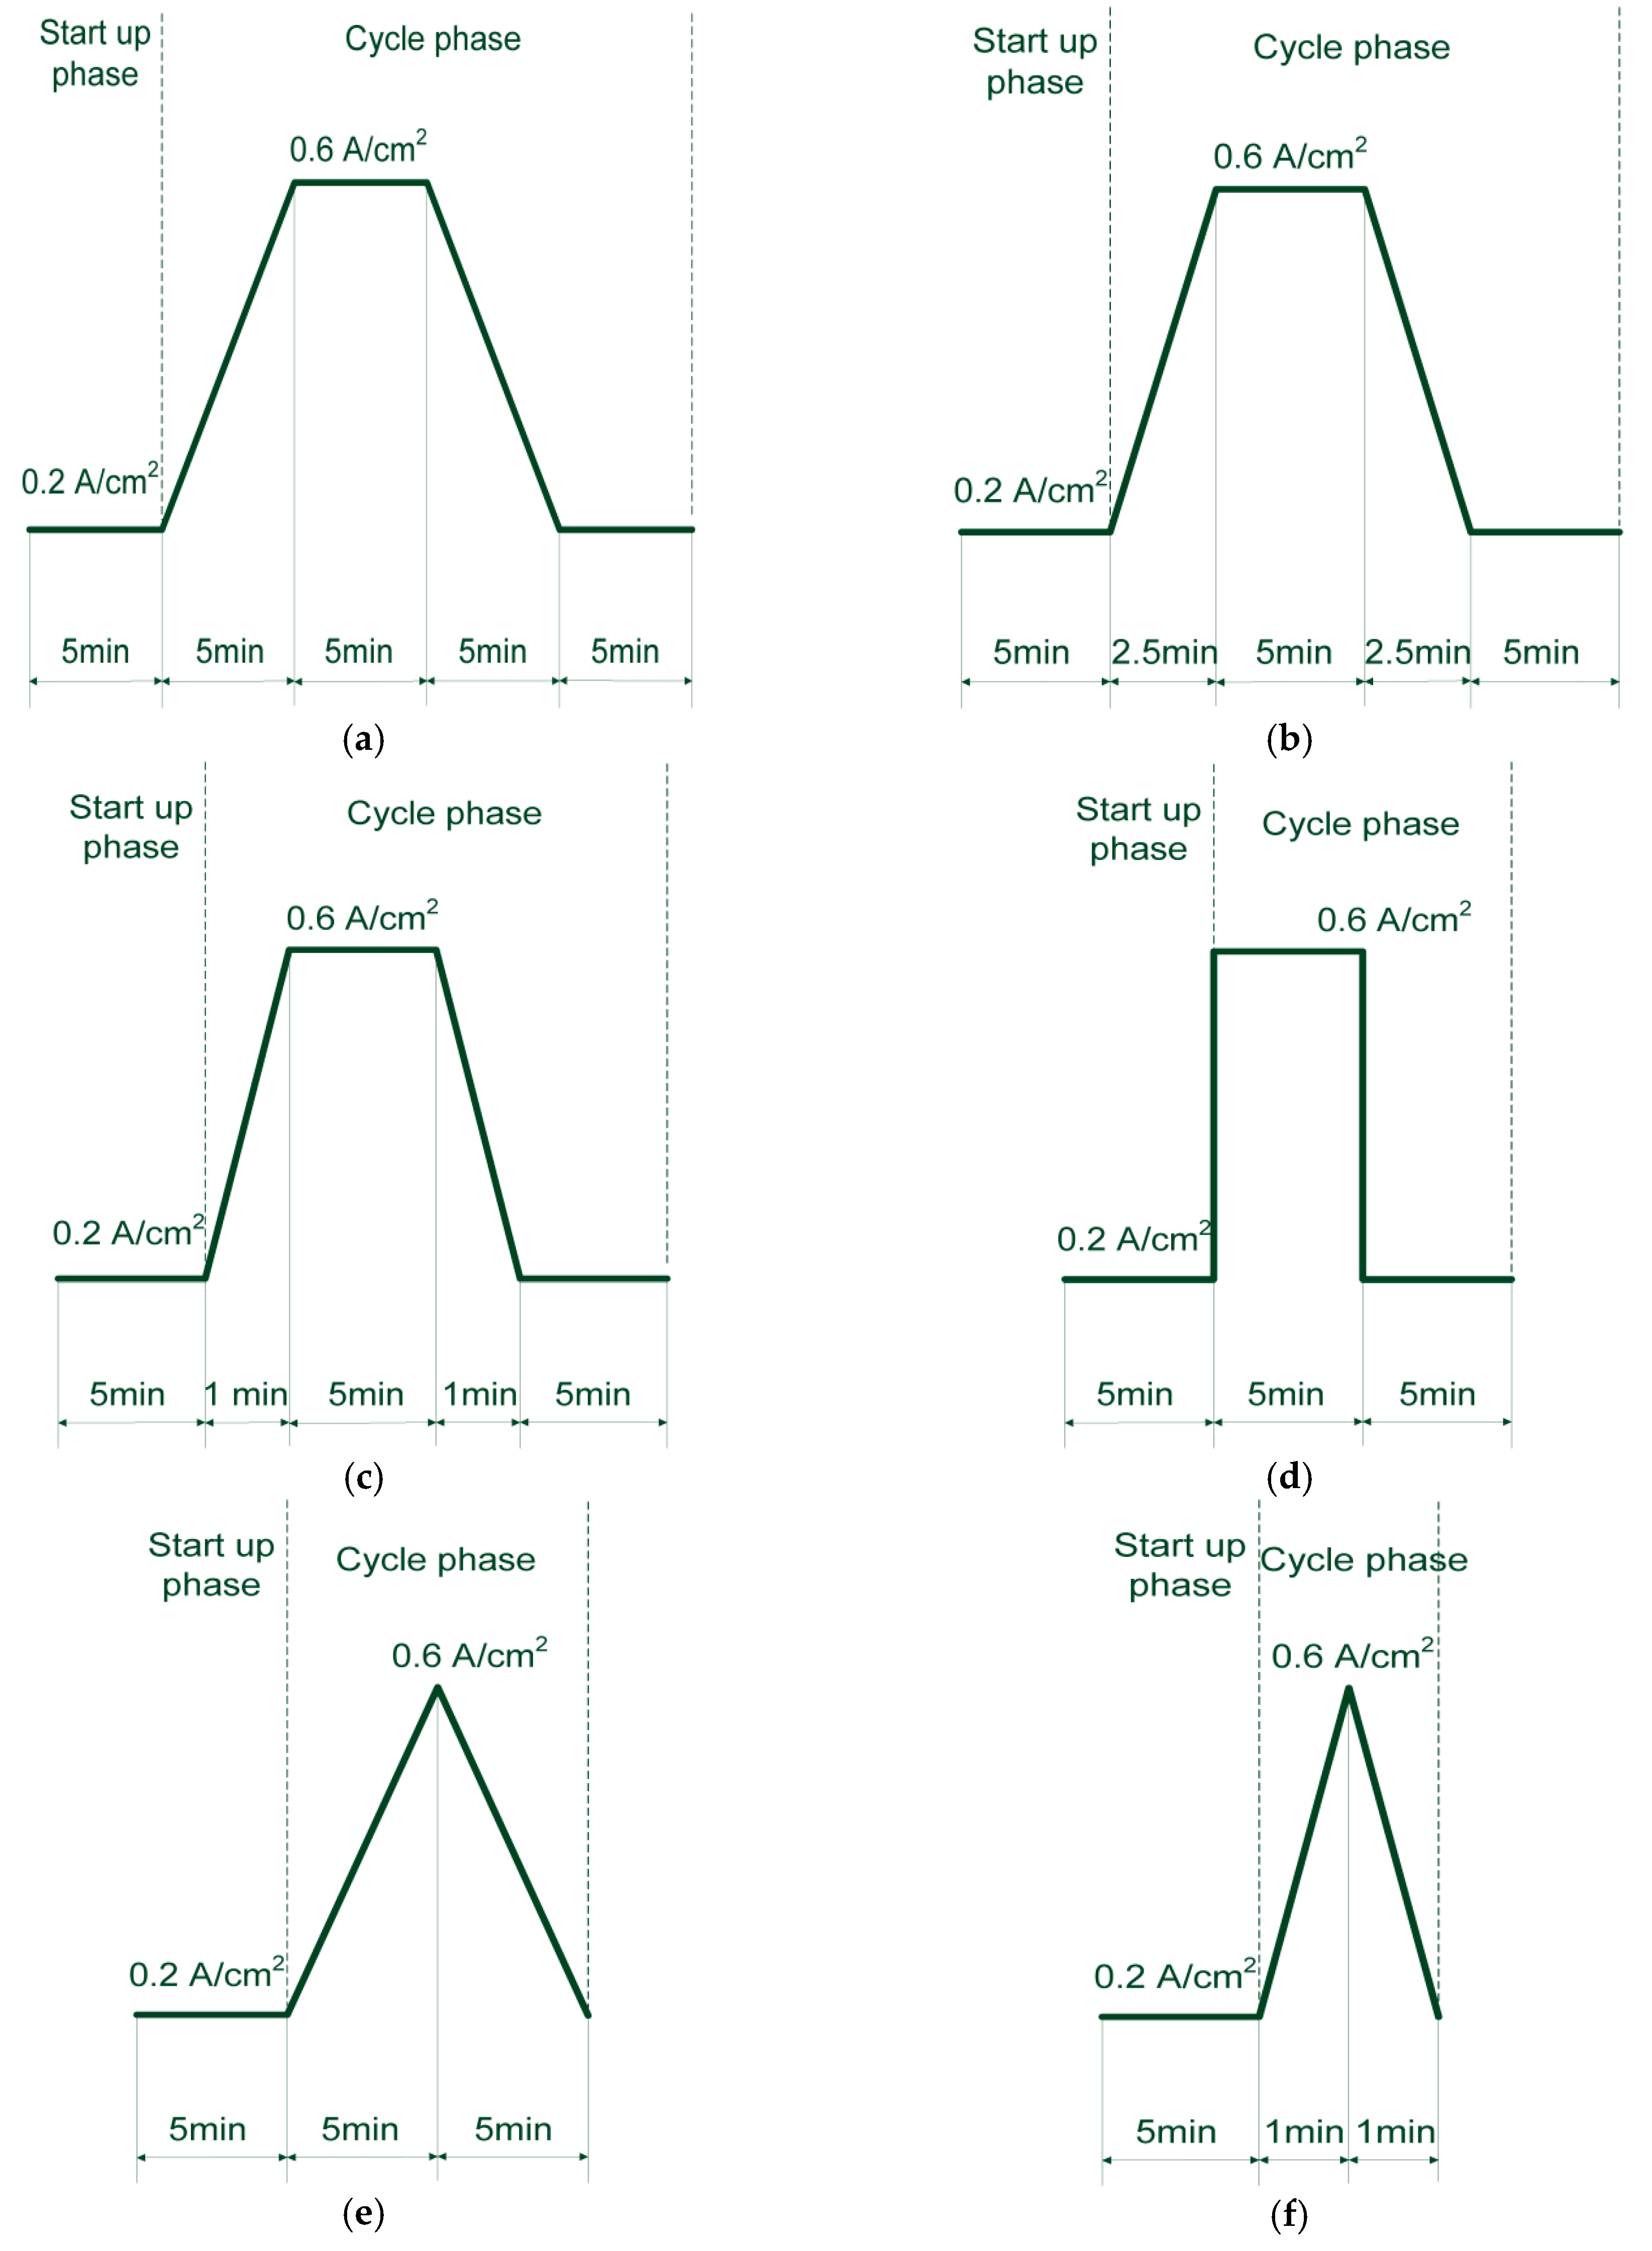
Figure 5.
The results of the cathodic pressure drop response and the cell voltage response according to the load-cycling profile in (a) test No. 1; (b) test No. 2; (c) test No. 3; (d) test No. 4; (e) test No. 5; and (f) test No. 6.
Figure 5.
The results of the cathodic pressure drop response and the cell voltage response according to the load-cycling profile in (a) test No. 1; (b) test No. 2; (c) test No. 3; (d) test No. 4; (e) test No. 5; and (f) test No. 6.

Figure 6.
Effect of load ramps on the average magnitude (a) average overshoot magnitude, (b) average undershoot magnitude.
Figure 6.
Effect of load ramps on the average magnitude (a) average overshoot magnitude, (b) average undershoot magnitude.

Figure 7.
Top and bottom average pressure drop and the difference between them.

Figure 8.
Top and bottom average pressure drop standard deviation.

Figure 9.
Top and bottom pressure drop standard deviation in (a) test No. 1, (b) test No. 2, (c) test No. 3, and (d) test No. 4.
Figure 9.
Top and bottom pressure drop standard deviation in (a) test No. 1, (b) test No. 2, (c) test No. 3, and (d) test No. 4.
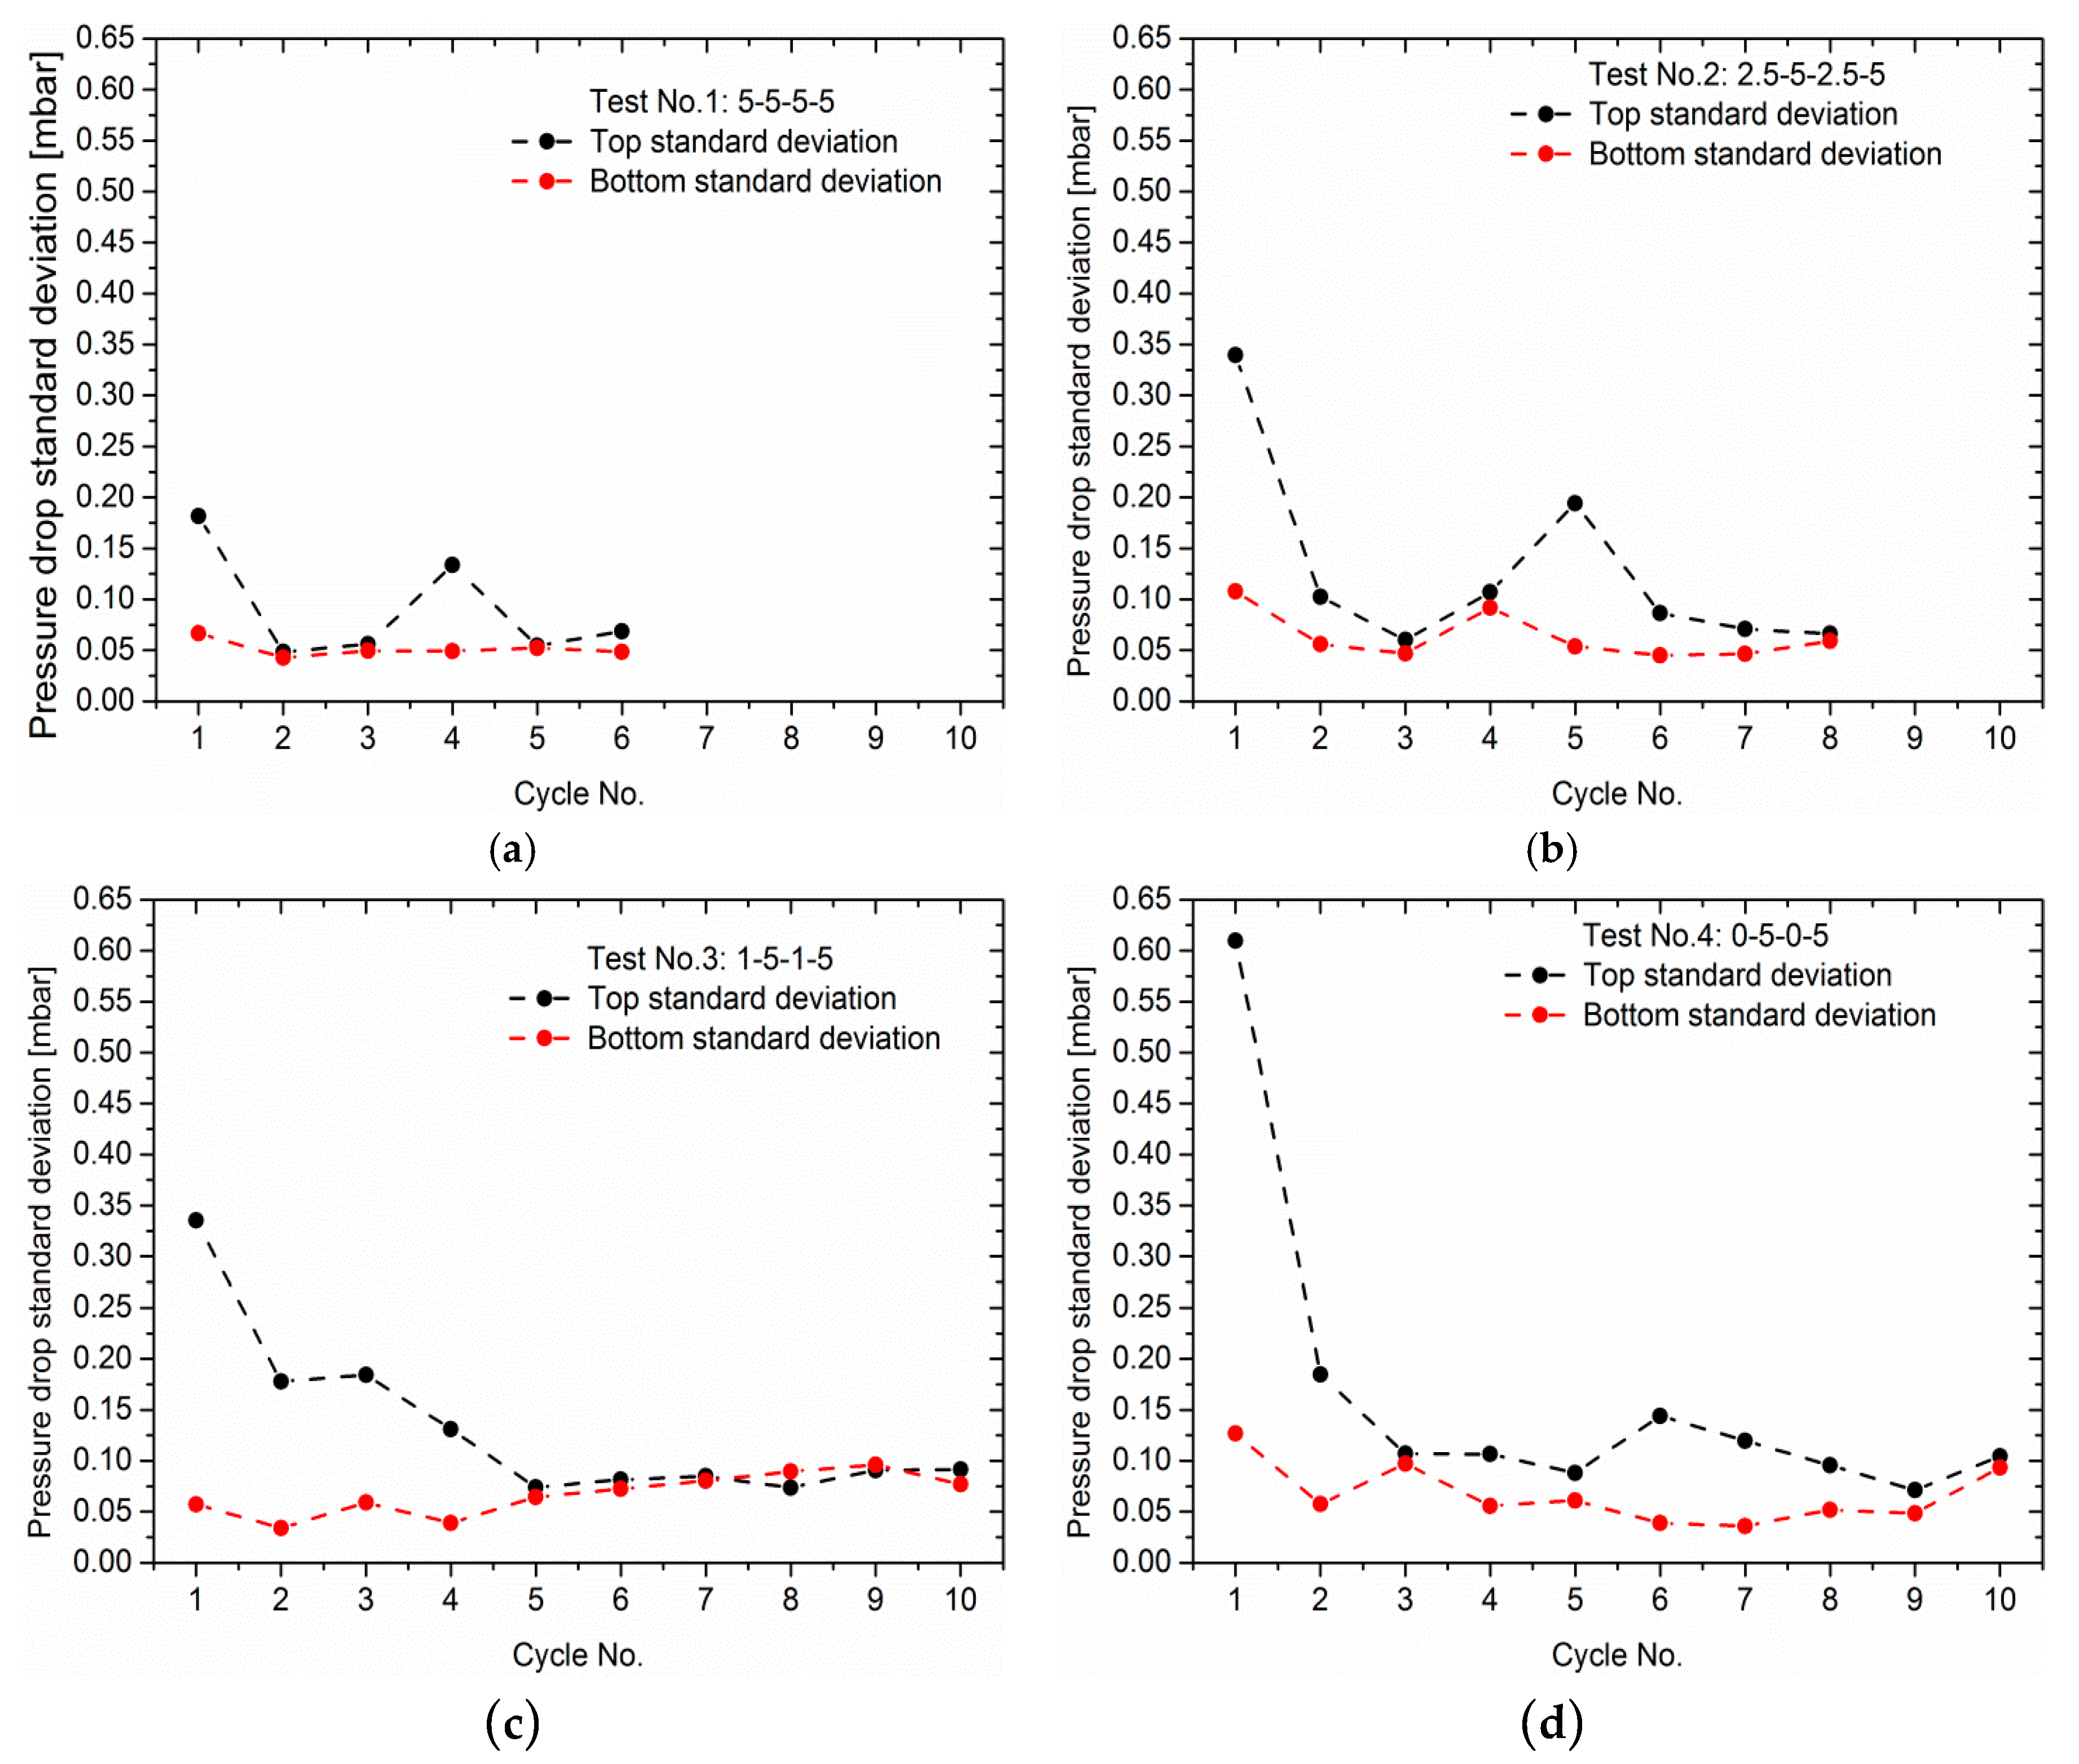
Figure 10.
Ohmic resistance of different tests and cycles (upper values at 0.2 A/cm2, lower values at 0.6 A/cm2).
Figure 10.
Ohmic resistance of different tests and cycles (upper values at 0.2 A/cm2, lower values at 0.6 A/cm2).


Table 1.
Test conditions.
| Anode Reactant Gas | Hydrogen |
| Rel. Humidity | 90% |
| λH2 | 2 |
| Cathode reactant gas | Air |
| Rel. Humidity air | 90% |
| λAir | 2 |
| Cell Temperature | 60 °C |
| Flow Direction | Co-flow, top to bottom |
© 2019 by the authors. Licensee MDPI, Basel, Switzerland. This article is an open access article distributed under the terms and conditions of the Creative Commons Attribution (CC BY) license (http://creativecommons.org/licenses/by/4.0/).
Share and Cite
MDPI and ACS Style
Shi, Y.; Janßen, H.; Lehnert, W. A Transient Behavior Study of Polymer Electrolyte Fuel Cells with Cyclic Current Profiles. Energies 2019, 12, 2370. https://doi.org/10.3390/en12122370
AMA Style
Shi Y, Janßen H, Lehnert W. A Transient Behavior Study of Polymer Electrolyte Fuel Cells with Cyclic Current Profiles. Energies. 2019; 12(12):2370. https://doi.org/10.3390/en12122370
Chicago/Turabian StyleShi, Yan, Holger Janßen, and Werner Lehnert. 2019. "A Transient Behavior Study of Polymer Electrolyte Fuel Cells with Cyclic Current Profiles" Energies 12, no. 12: 2370. https://doi.org/10.3390/en12122370
Note that from the first issue of 2016, this journal uses article numbers instead of page numbers. See further details here.