Energy Demand Forecast Models for Commercial Buildings in South Korea


1
Architectural Engineering, Hanyang University, 55 Hanyangdaehak-ro, Sangrok-gu, Ansan 15588, Korea
2
Department of Architecture & Architectural Engineering, Hanyang University, 55 Hanyangdaehak-ro, Sangnok-gu, Ansan 15588, Korea
3
Sustainable Building Research Center, Hanyang University, 55 Hanyangdaehak-ro, Sangnok-gu, Ansan 15588, Korea
*
Authors to whom correspondence should be addressed.
Energies 2019, 12(12), 2313; https://doi.org/10.3390/en12122313
Submission received: 23 April 2019
/
Revised: 23 May 2019
/
Accepted: 12 June 2019
/
Published: 17 June 2019
(This article belongs to the Special Issue Sustainable Use of Energy in Buildings)
Abstract
:With the Paris Agreement entering into full force, South Korea must submit its target greenhouse gas emissions for commercial buildings by 2030 to the United Nations Framework Convention on Climate Change. To determine this target, the annual energy demands must be forecasted through appropriate models; the development of these models is the focus of our study. We developed a system to calculate energy demand forecasts by searching for suitable methods. We built distinct energy forecast models for petroleum, city gas, electricity, heat, and renewable energies. The results show that the most appropriate variable for the petroleum energy model is energy trend. Moreover, the annual increase rate of petroleum energy demand from 2019 to 2030 was forecasted to be −1.7%. The appropriate variable for city gas energy model was the floor area of commercial buildings, which was forecasted to increase at an annual average growth rate of 0.4% from 2019 to 2030. According to the forecast results of energy demand from 2019 to 2030, the annual average growth rates of electricity, heat, and renewable energy demands were 2.1%, −0.2%, and 1.3%, respectively.
1. Introduction
Energy is an indispensable part of our daily lives. Its consumption has increased exponentially over the last 1990 years, with a significant increase in national greenhouse gas emissions, thereby affecting the environment negatively.
To address this problem, the Paris Agreement was adopted by global consensus in December 2015 within the United Nations Framework Convention on Climate Change. As a signatory to this agreement, South Korea is obligated to submit its sector-wise target greenhouse gas emissions for the period until 2030 [1].
In South Korea, the building sector accounts for approximately 20% and 40% of the national total energy and electricity consumption, respectively. Given the large contributions of this industry, its target requires further examination [2] through the use of energy demand forecasts. Forecasts form the foundation for calculating target emissions, but research in this area is currently insufficient. Thus, studies on energy demand forecasts, particularly for the building sector, are essential [3,4].
While the South Korean government has been conducting research on the national total energy demand forecast, it does not possess demand forecasts by sector. Studies on its total national energy demand forecasts generally focus on the Energy Basic Plan, Electricity Demand and Supply Basic Plan, and Long-Term Natural Gas Demand and Supply Plan.
First, every five years, the Energy Basic Plan releases its 20-year demand forecasts for electricity, city gas, petroleum, heat, and renewable energy at the government level. However, it does not provide these forecasts by sector and year [5]. Second, every two years, the Electricity Demand and Supply Basic Plan releases its 15-year demand forecasts for electric energy. The panel model for electricity is used based on the analysis results of electricity demand panel data of over 100 countries. Nevertheless, this plan only provides demand forecasts for electricity, and not for petroleum, city gas, heating, and renewable energy [6]. Third, every two years, the Long-Term Natural Gas Demand and Supply Plan establishes national natural gas demand plans for a period of 15 years, but does not include forecasts for energies other than natural gas [7,8].
Outside of South Korea, the U.S. Energy Information Administration uses the National Energy Modeling System model, and the International Energy Agency (IEA) model is used by the Organization for Economic Cooperation and development (OECD) [9,10]. The IEA model is structured as shown in Figure 1 [11] and uses specific data for each application. Figure 1 refers to the IEA report and requires technical data on cooling, heating, hot water, cooking, and lighting. The U.S. National Energy Modeling System model divides commercial buildings into 11 types and requires technical data such as energy prices, floor area growth rate, cooling, heating, ventilation and lighting.
These models can forecast energy demand efficiently; however, lack of technical data on commercial buildings means they are of no use for South Korean research.
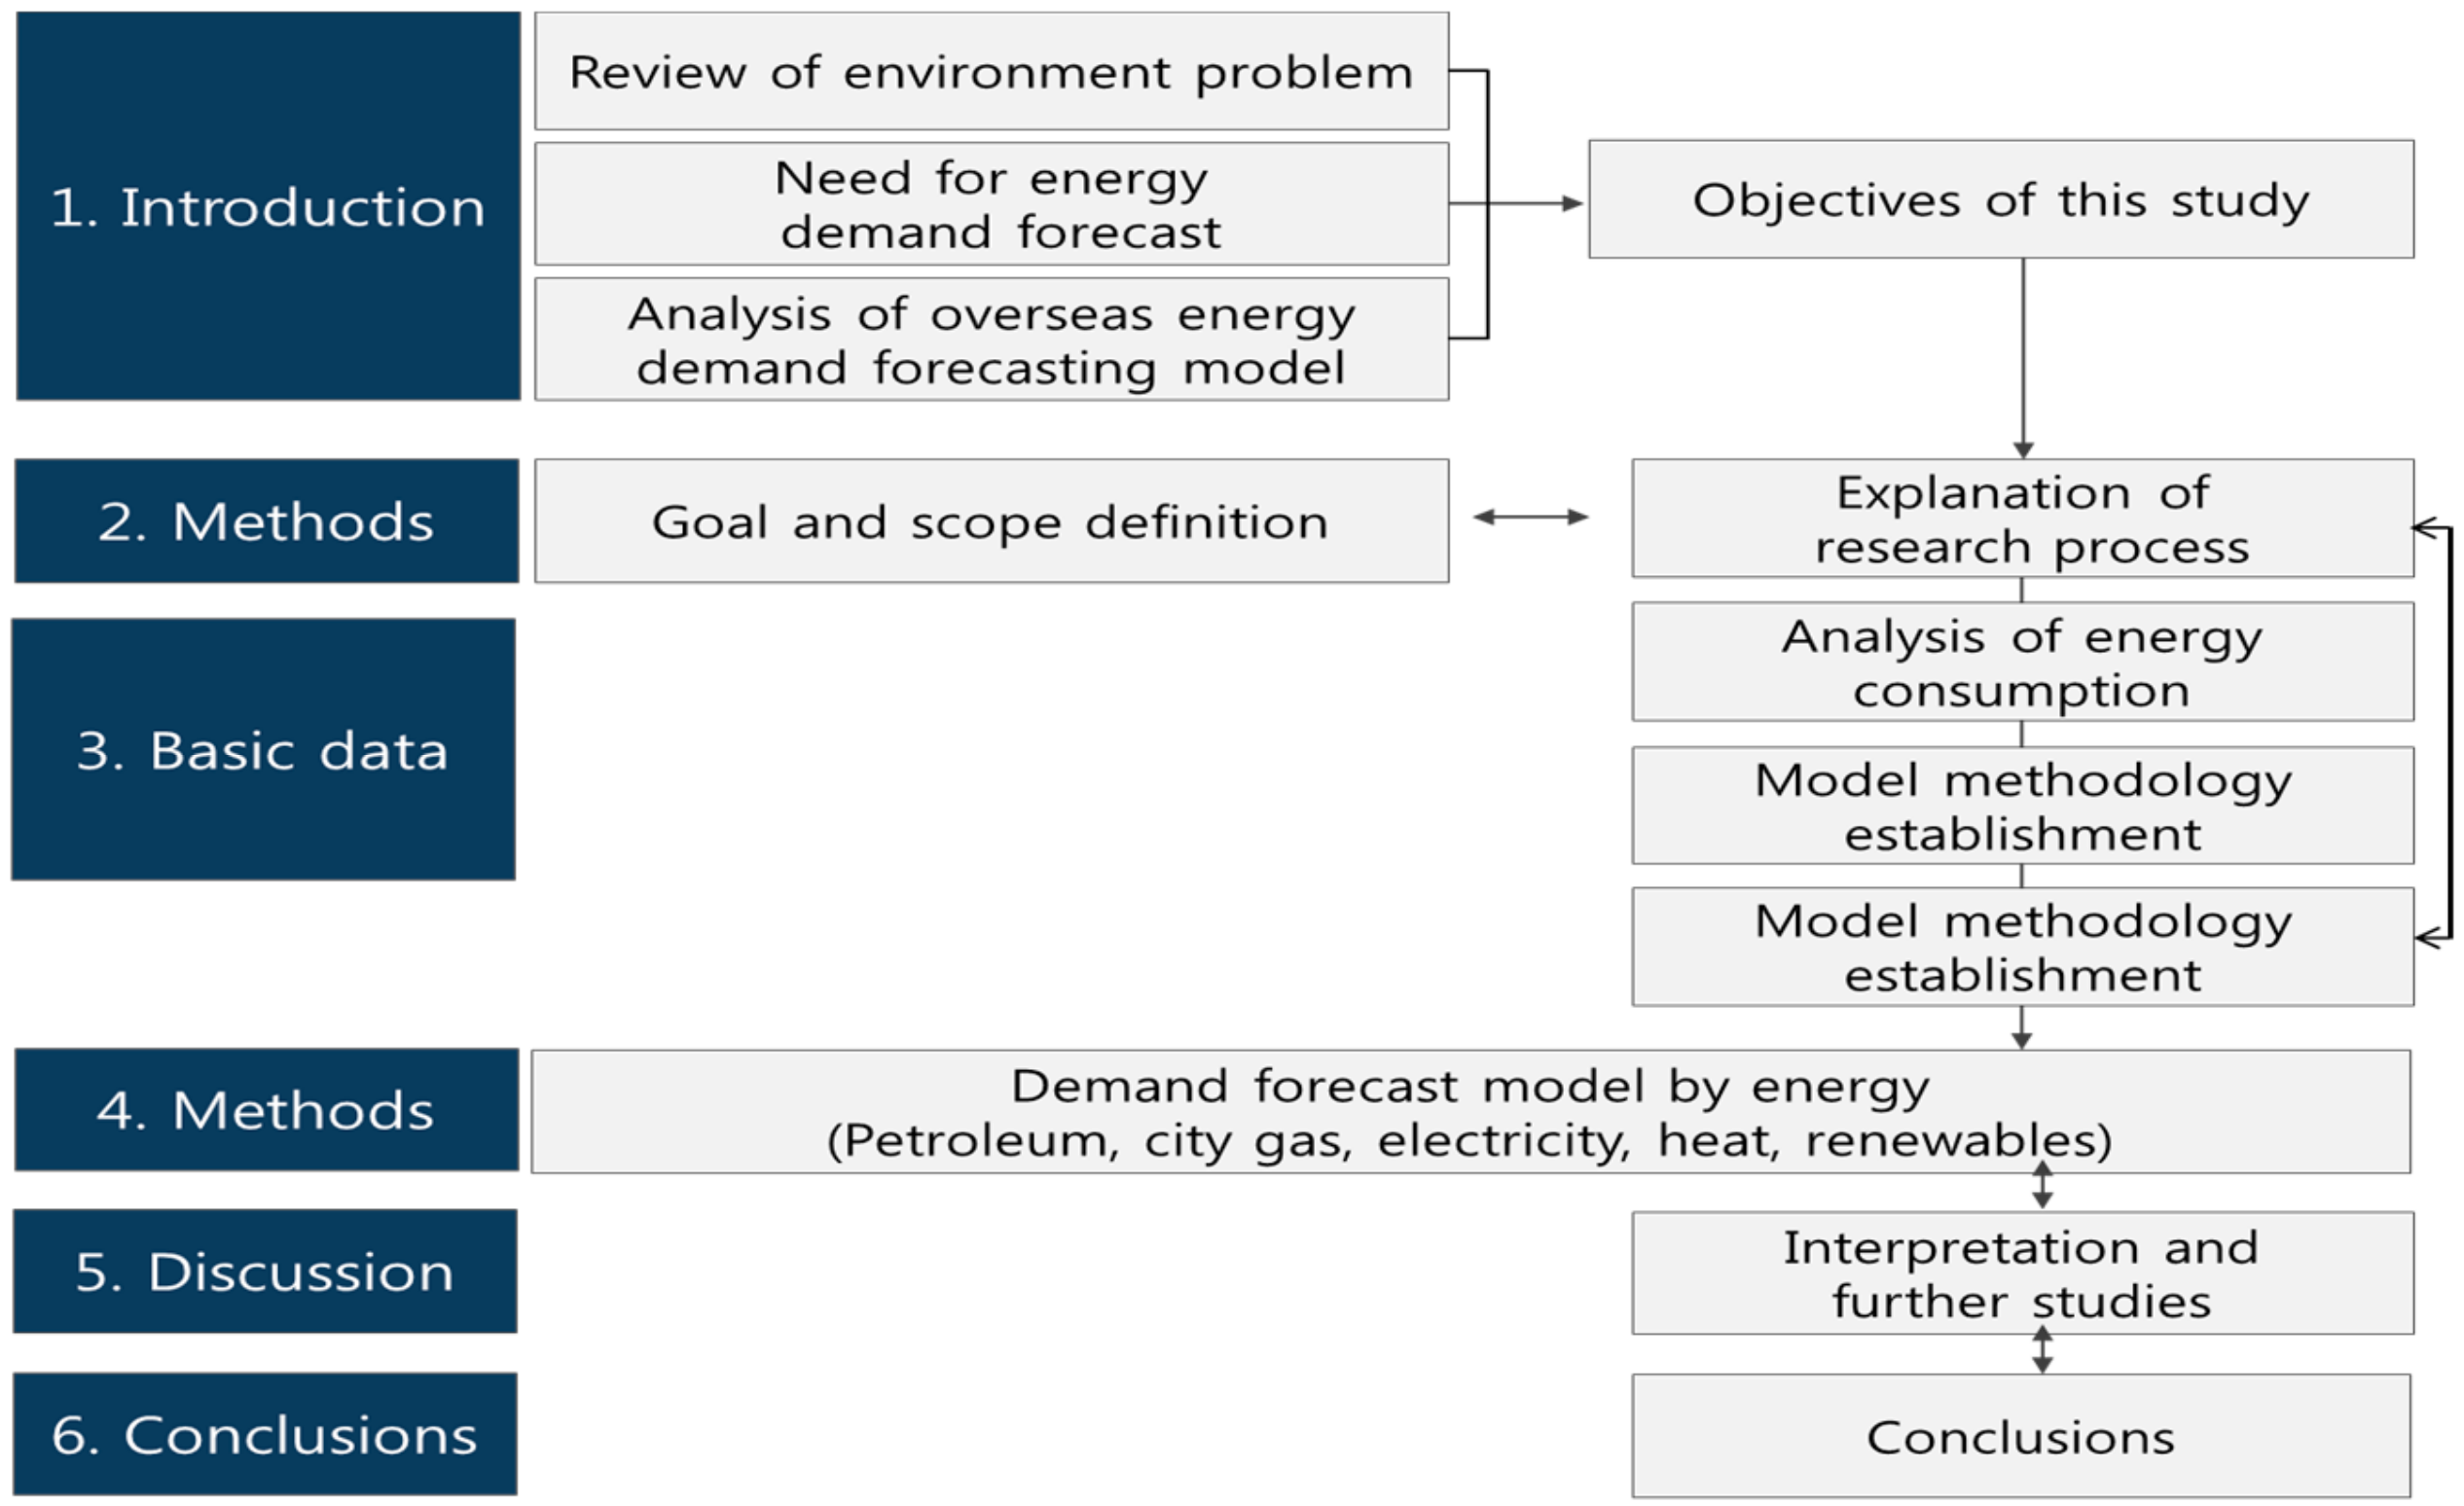
Therefore, we constructed a model to forecast energy demand for the period until 2030 in South Korea that accounts for commercial buildings. We conducted a time-series analysis of energy consumption data by energy source and collected basic data for gross domestic product (GDP), population, and floor area, which are prerequisites for model construction. Then, energy demand forecast models were constructed by deriving variables that have high correlations with energy consumption [12,13]. The flow of this study is shown in Figure 2.
2. Methods
We require an energy consumption model based on building use, because residential, commercial, and public buildings have different energy consumption patterns. For example, heating energy dominates household energy use, whereas commercial buildings use energy disproportionately for cooling [14]. In this way, energy consumption differs by building use, and consequently, residential, commercial, and public buildings require separate energy demand forecasts. We chose to study commercial buildings because they have the largest energy consumption. The research method was proceeded through the process as shown in Figure 3, and the concrete explanation is as follows.
In this study, we analyzed energy consumption in buildings by energy source to investigate historical energy consumption trends. The South Korean government publishes energy input standard data in the Yearbook of Energy Statistics, which allows us to use time-series data from 1990 onward for petroleum, electricity, heat, city gas, and renewable energies used in buildings. We then explored methodologies for developing energy demand forecast models for commercial buildings to construct an appropriate research framework. These forecast models can be generally classified into econometrics and end-use account models. The former is a top-down approach based on historical energy consumption results, whereas the latter is a bottom-up approach based on energy consumption by energy-consuming devices [15].
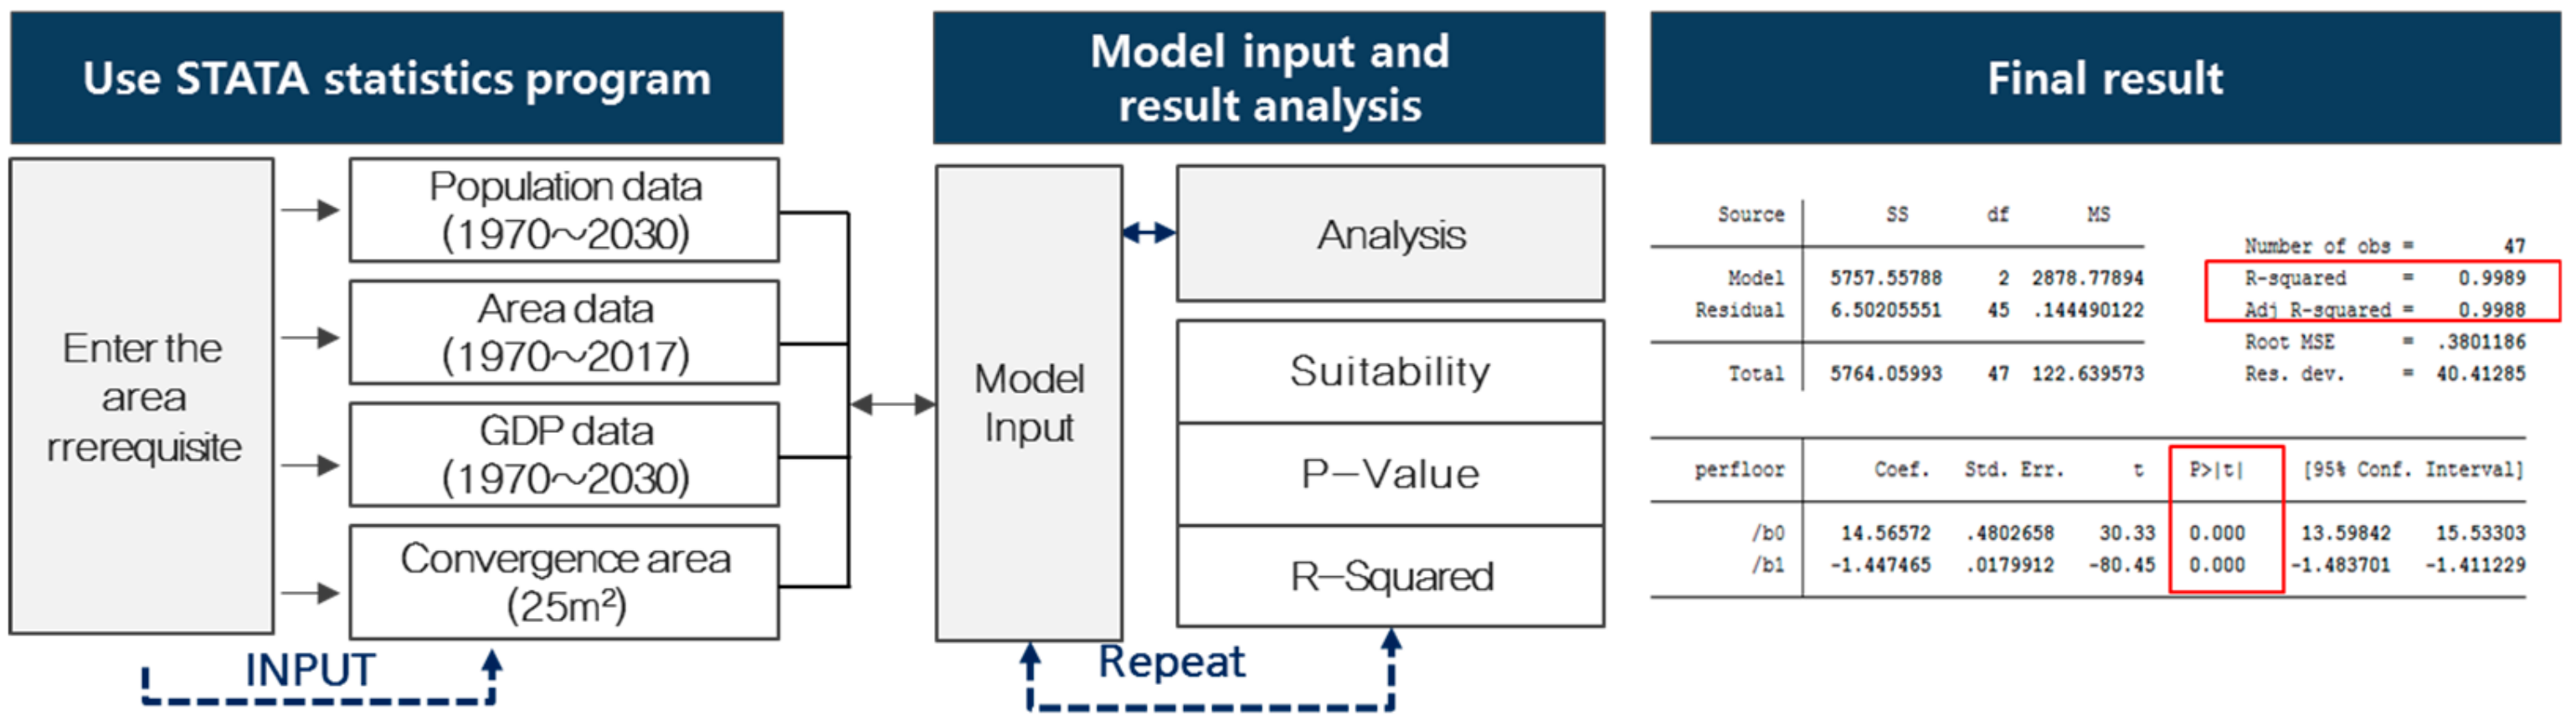
Finally, we established population forecasts until 2030, the future GDPs of South Korea, and the future floor areas of commercial buildings to set up the basic data for constructing an energy demand forecast model. Please note that the floor area of commercial buildings highly correlates with the energy consumption of buildings, so it must be estimated for a period until 2030. However, because there are few studies on the forecasts of commercial floor areas in South Korea, we researched the forecasts of building floor areas. We thus analyzed historical floor area trends using existing statistics based on building registers; a floor area forecast model was constructed by searching for variables showing high correlations with floor area. The floor area forecast results for commercial buildings were used in the energy demand forecast models for petroleum, electricity, heat, city gas, and renewable energy. Furthermore, the models for energy source were constructed using the statistics application STATA, and the statistical significance of the model developed in this study was verified using STATA [16].
3. Analysis of Energy Consumption in Commercial Buildings
3.1. Energy Statistical Analysis
To develop the energy demand forecasts model, it is necessary to analyze past energy usage. Analysis of energy usage requires statistical analysis of domestic energy. In this study, we analyzed the domestic energy statistics.
In South Korea, energy statistics, including the energy consumption of commercial buildings, are provided by the Yearbook of Energy Statistics and Energy Consumption Survey. Table 1 compares the characteristics of the Energy Statistical Yearbook and the Energy Consumption Survey. The Yearbook of Energy Statistics is published every year by the Ministry of Trade, Industry and Energy, two years later than the year of the data. These statistics are considered the most accurate total statistics on energy in South Korea, because they are based on monthly reports of energy suppliers’ total energy production and sales results. They are used when various energy policies are established. However, these statistics do not include energy consumptions of buildings by use and energy source. For example, the consumption statistics for heating by energy source are absent, despite the use of petroleum, electricity, city gas, and heat energies for heating [2].
The Energy Consumption Survey is also published by the Ministry of Trade, Industry and Energy every three years. Unlike the Yearbook of Energy Statistics, it surveys approximately 5400 sample buildings using self-enumeration and interviewing methods. It includes buildings that consume 2000 toe (i.e., tonnes of oil equivalent) of energy or more. To our benefit, these data include statistics by building use and energy source—that is, for each energy source used for heating, such as petroleum, electricity, heat, and city gas. However, the reliability of the total energy consumption is low. They are mainly used for the proportions of each energy source than for calculating totals in policy formulation [17].
In this study, historical energy consumption trends were analyzed based on the Yearbook of Energy Statistics, which has a higher reliability of total energy data for energy demand forecasts by energy source.
3.2. Trend of Energy Consumption in Commercial Buildings
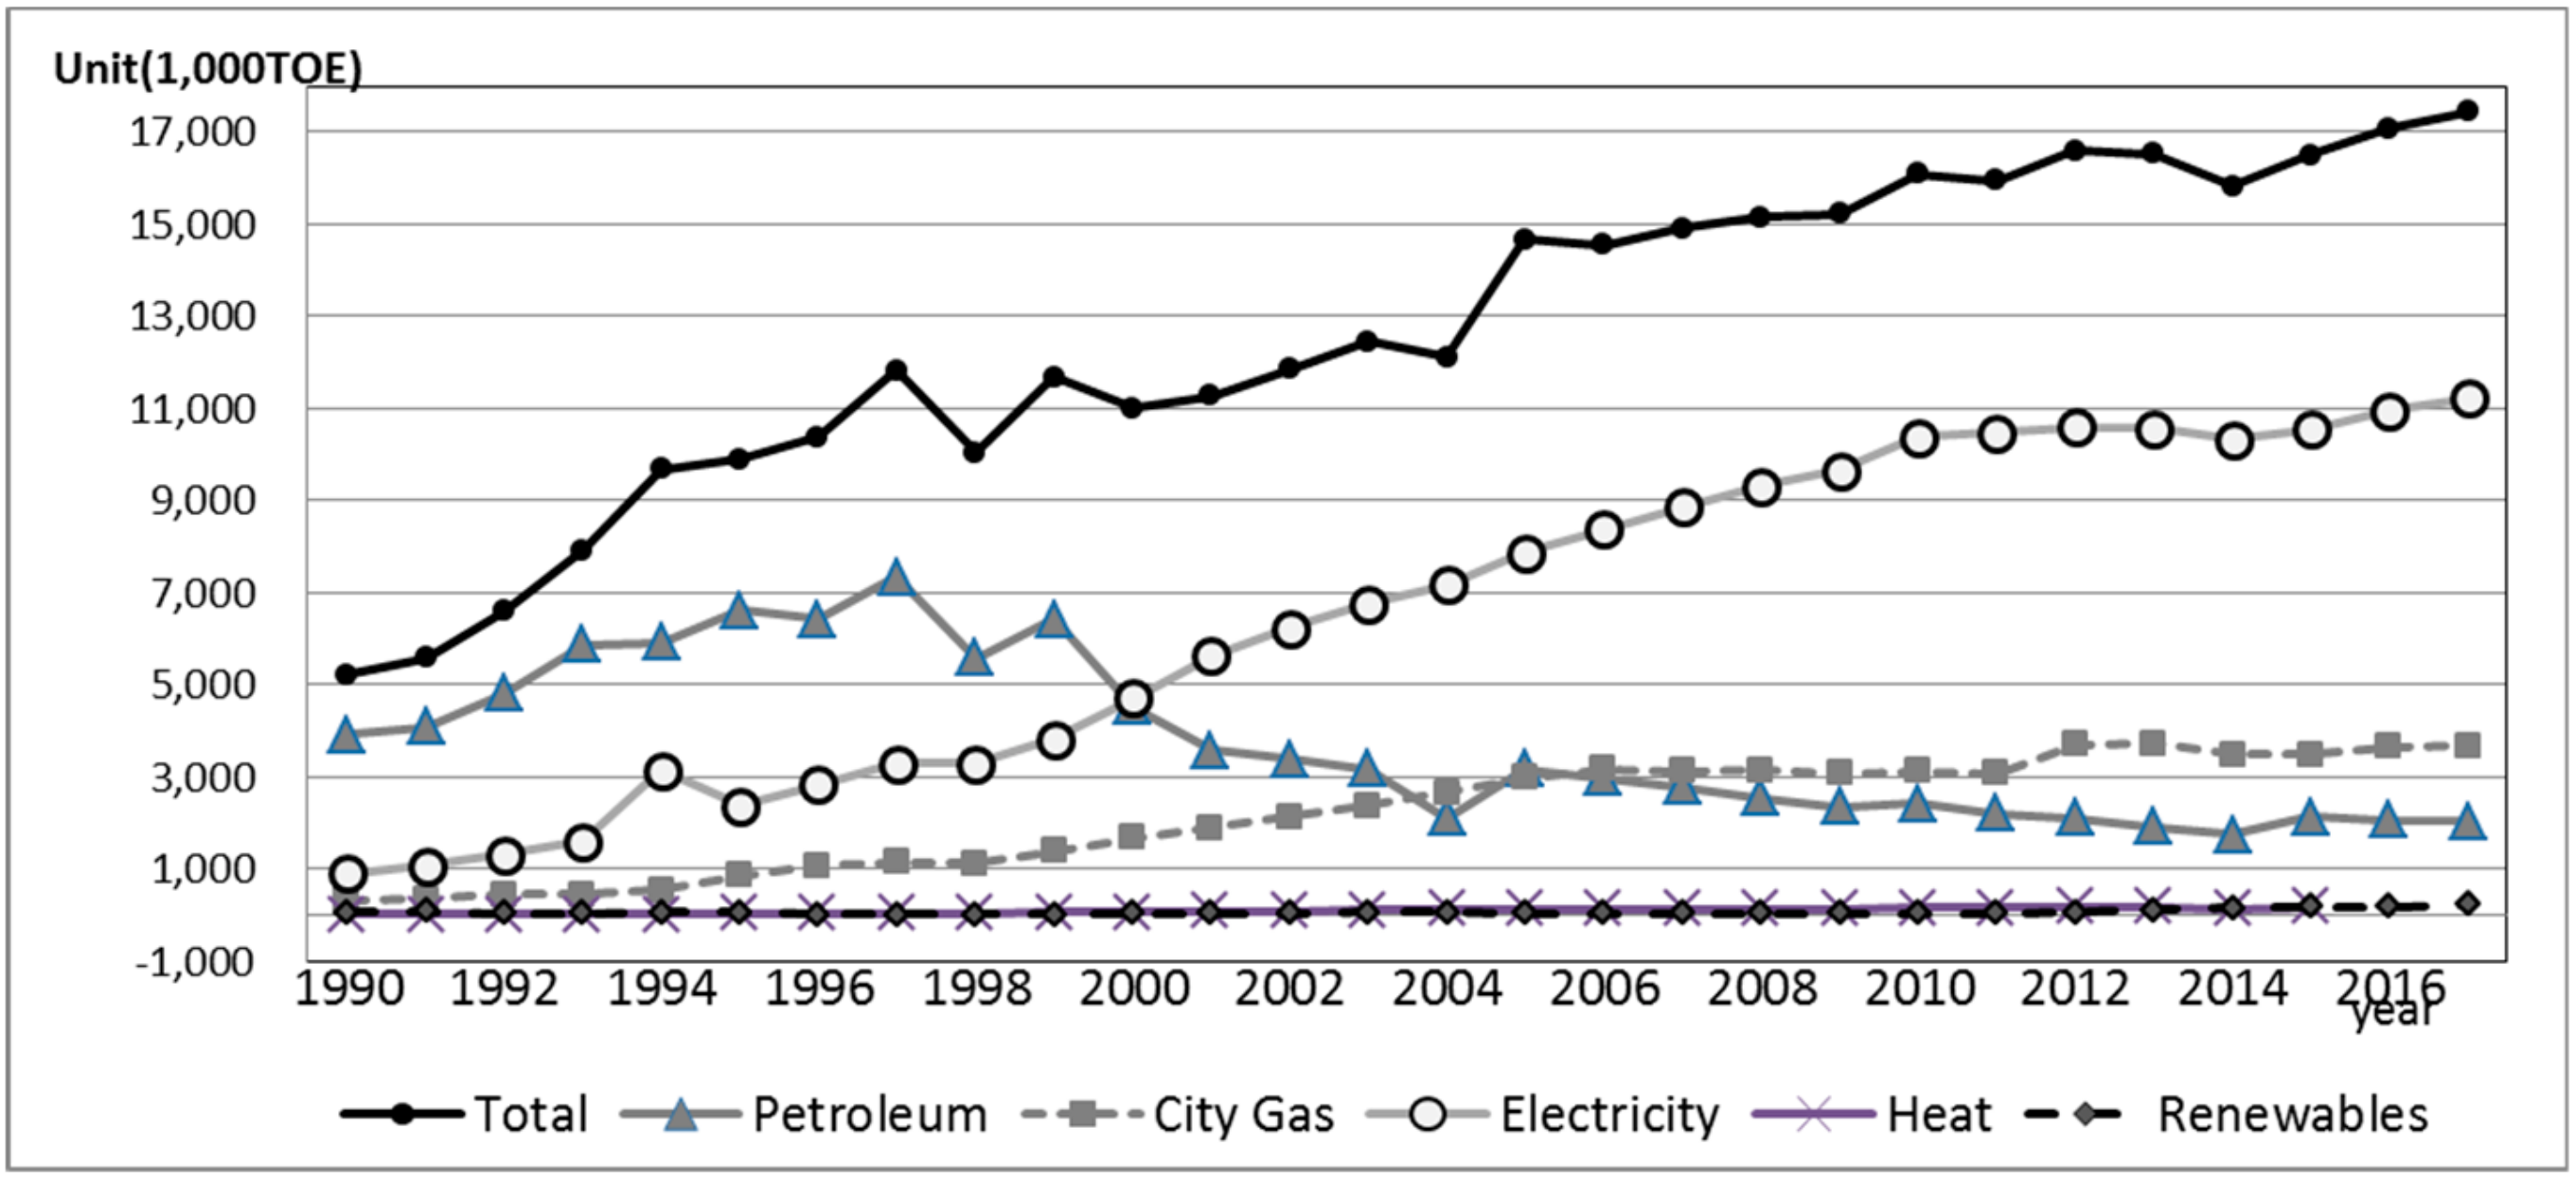
The energy demand forecast is based on historical energy consumption trends. Thus, the analysis of these trends is critical to forecasting. To analyze the energy consumption of commercial buildings in South Korea, the most recent Yearbook of Energy Statistics from 2018 was used. As shown in Figure 4, this report provides energy consumption statistics for petroleum, electricity, city, gas, heat, and renewable energy between 1990 and 2017. The total annual energy consumption increased by 235% at the annual average growth rate of 4.6% between 1990 and 2017 from 5206 thousand toe to 17,428 thousand toe. The total annual energy consumption in 1997 and 1998 decreased because the Korean economy declined sharply due to the then current foreign exchange crisis.
Petroleum energy showed a decreasing trend, whereas city gas, electricity, heat, and renewable energy steadily increased. Furthermore, electricity accounted for 64% of energy by source, followed by city gas (21%), petroleum (12%), heat (2%), and renewable energy (1%) for commercial buildings in 2017.
Petroleum energy is predominantly used for heating and hot water in commercial buildings. Its consumption decreased at an annual average rate of 2.4% between 1990 and 2017, but until 1997, it increased sharply at an annual average rate of 9.4%. However, we observed a decreasing trend during the foreign exchange crisis and petroleum price hike. Furthermore, most buildings used petroleum boiler, which were later changed to gas boiler to curb issues such as air pollution. This decreased the overall petroleum consumption.
City gas is used for heating, hot water, cooking, and recently, for cooling in some large buildings. Its consumption showed a high annual increase rate of 9.4% between 1990 and 2017. After 1999, the city gas supply network expanded to the suburbs. The supply of city gas boiler has increased gradually, while the supply of petroleum boiler has decreased, resulting in increased consumption of the former. Supply penetration of city gas in city areas has already reached saturation at 95% or higher, with little change in total consumption since 2006.
Electricity is used for cooling, heating, hot water, lighting, and power. Its consumption has increased sharply at an annual average rate of 9.8% between 1990 and 2017. It temporarily decreased in 1995 due to the South Korean economic crisis, but has shown steady progress since. Electricity consumption has increased steadily with the economic growth of South Korea. After the 2011 South Korea blackout due to large-scale power failure, the government implemented policies to introduce passive and zero-energy buildings to reduce building energy consumption, resulting in a marginal decrease of the otherwise increasing rate of electricity energy.
Heat energy is used for heating and hot water. It has increased at an annual average rate of 15.2% between 1990 and 2017, much higher than other energies. However, the proportion of heat energy in all energies is exceedingly small: 2%. This energy is also limited, because it can be supplied only if there is a power plant that supplies heat sources. The difficulty of building power plants in city centers makes it difficult to increase the supply of heat energy. However, its recent supply has increased marginally due to improved efficiency of equipment and devices generating heat energy.
Renewable energy is produced through solar heat, solar cells, and wind power. They have been gradually replacing petroleum, electricity, city gas, and heat energies in commercial buildings. So far, the proportion of renewable energy has been the smallest: 1%. However, in 2018, the South Korean government announced the difficult goal of increasing this to 20% by 2030 through the Renewable Energy 3020 policy.
4. Development of Demand Forecasting Model
4.1. Methodology Establishment
We analyzed the methods for developing an energy demand forecast model by energy source, and selected an appropriate methodology. As mentioned earlier, there are two methods to accomplish this: the econometrics model and the end-use account model (see Figure 5) [18]. The econometric model uses a top-down approach that estimates based on past energy usage performance. On the other hand, the accounting model is a bottom-up method of building energy consumption based on energy consumption devices. To apply the bottom-up method, technical data such as cooling, heating, hot water supply, and lighting are required. Using the accounting model, quantitative energy demand prediction is possible compared to econometrics. However, for the accounting model, we need technical data that matches the actual situation in Korea. A detailed explanation is as follows.
4.1.1. Analysis of the Econometrics Model
The econometrics model is a top-down method that forecasts energy demand based on historical results. These historical data are analyzed based on energy consumption statistics; this includes the use of major social variables such as GDP, population, and energy prices. Korea is good at building social statistics such as GDP, population, and energy prices. The population of Korea is also available as forecast data until 2050. This model allows easier data collection for building and managing the model. However, it is difficult to analyze detailed information such as the change in the efficiency of individual devices and the introduction of new technology.
If there are technology changes in a building, it is necessary to modify the model. For example, if the bpetroleumer efficiency changes, a new model construction of the heating part is required. In addition, energy demand forecasts for power, city gas, and energy demand forecasts will change.
A representative example of the econometrics model is the Energy Basic Plan model, which is a top-down method that predicts the total energy consumption of South Korea. It is used for establishing Korean energy policies and has easy model management, but detailed analysis of future energy consumption is impossible [19,20].
4.1.2. Analysis of End-Use Model
The end-use account model is a bottom-up method for predicting energy consumption by individual energy-consuming device and use. Importantly, it allows detailed analysis of future data because it is based on segmented data. However, it is difficult to build and operate the model because it requires concrete data, such as the efficiency of each device and the proportion of energy consumption by energy source and use. One representative example of the end-use account model is the National Energy Modeling System, which is based on the penetration rates of home appliances, the efficiency of cooling and heating systems, aging of equipment, and the floor areas of existing and new buildings. The National Energy Modeling System also classifies commercial buildings into 11 types (assembly, healthcare, mercantile, education, lodging, warehouse, food-sale, food-services, office-large, office-small, other).
It provides detailed energy analysis of commercial buildings. This model is also difficult to manage because it requires the collection and management of concrete data [21,22].
In South Korea, the end-use account model cannot be used due to limitations in detailed data on commercial buildings, such as the penetration of cooling systems according to their efficiency, floor area data by construction years of buildings, and number of bulbs sold by type.
To address this issue, we developed the energy demand forecast model using the econometrics model. However, instead of applying the top-down method, a hybrid method that combines the top-down and bottom-up methods was used. Our rationale is that, if the top-down method is used, it is impossible to use the data for national greenhouse gas reduction policy for 2030. At the same time, in the bottom-up method, we only have limited basic statistics of South Korea. Therefore, a hybrid model is more suitable. Figure 6 shows a hybrid model, which represents a configuration for predicting demand by energy.
In this study, the hybrid model does not improve the error by deriving the generally meaningful bottom-up and top-down. Korea has to use the top-down method as its data limit. However, using the top-down methodology, it is possible to predict the total energy demand of commercial buildings, but it is not possible to distinguish by energy such as petroleum, city gas, and electricity. The bottom-up methodology should be applied for the energy-dependent prediction, but the bottom-up method cannot be applied because of the limitation of the data as described above.
Therefore, this study has a top-down view of petroleum, city gas, electricity, and heat energy. We also defined this as a hybrid model. The methodology is generally top-down and bottom-up because it has limitations that cannot be clearly distinguished.
To build the energy demand forecast model for commercial buildings, the existing energy consumption trends were analyzed (see Section 3.2). Next, the data of major variables for the model were collected, such as GDP, population, floor area, and energy prices. Finally, the energy demand forecast models for petroleum, electricity, city gas, heat, and renewable energy were constructed [23].
4.2. Building Basic Data
4.2.1. Variable Base Data
To forecast the energy demand of commercial buildings using the modified econometrics model, we need basic data on energy demand. We thus constructed time-series data for population, GDP, floor area, cooling/heating days, and energy prices. These data begin from 1990, with historical energy statistics until 2030, the point until which energy demand forecasts are required.
For population, the future trend forecast data by Statistics Korea for national policy development were used; these data are naturally representative. According to Statistics Korea, the population of South Korea is expected to increase from 51.81 million in 2019 to 52.94 million in 2030, followed by a gradual decrease from 2032 onward.
For GDP, the increasing and decreasing rates published by the Korea Development Institute were used. These data are also representative, because they are used in national energy demand policies, such as the Energy Basic Plan and the Electricity Demand and Supply Basic Plan. The national GDP in 2018 was 1 trillion 302.8 billion dollars and was forecasted to increase to 1 trillion 611.5 billion dollars in 2030. Thus, a continuous rise is expected until 2030.
For the floor area data of commercial buildings, the data of Statistics Korea were used. These data are accurate and representative because they are based on building registers. The floor area statistics from 1970 until the present are already established, but there are no floor area forecasts for the period until 2030. There are no officially published forecast data for the floor areas of buildings in South Korea in general. Thus, we built a proprietary floor area forecast model and used the results for the energy demand forecast model [24].
For cooling/heating days, the Korea Meteorological Administration publishes official data every year, so it is possible to collect historical data. However, as with the floor area data, there are no official forecast data for future cooling/heating days. It is impossible to forecast cooling/heating days because this requires future weather forecasts. Therefore, in this study, the cooling/heating days were not used for the demand forecast model.
The Korea Energy Economics Institute has been providing energy prices since 1990. As with the cooling/heating days and floor area forecasts, it is difficult to acquire future energy prices. Therefore, we used the energy prices provided by the IEA, which publishes the prices of energies such as petroleum, gas, and electricity until 2030, as expressed by an index based on 2010 as 100 [25]. Table 2 summarizes the list of statistical data described above. Figure 7 shows the yearly trend for the energy demand forecasting model.
4.2.2. Floor Area Data
The energy consumption of commercial buildings is a variable that has a direct correlation with floor area; it is essential for energy demand forecasting. However, there are few studies on the future floor areas of buildings in South Korea. Thus, we forecasted the future floor areas of commercial buildings [26].
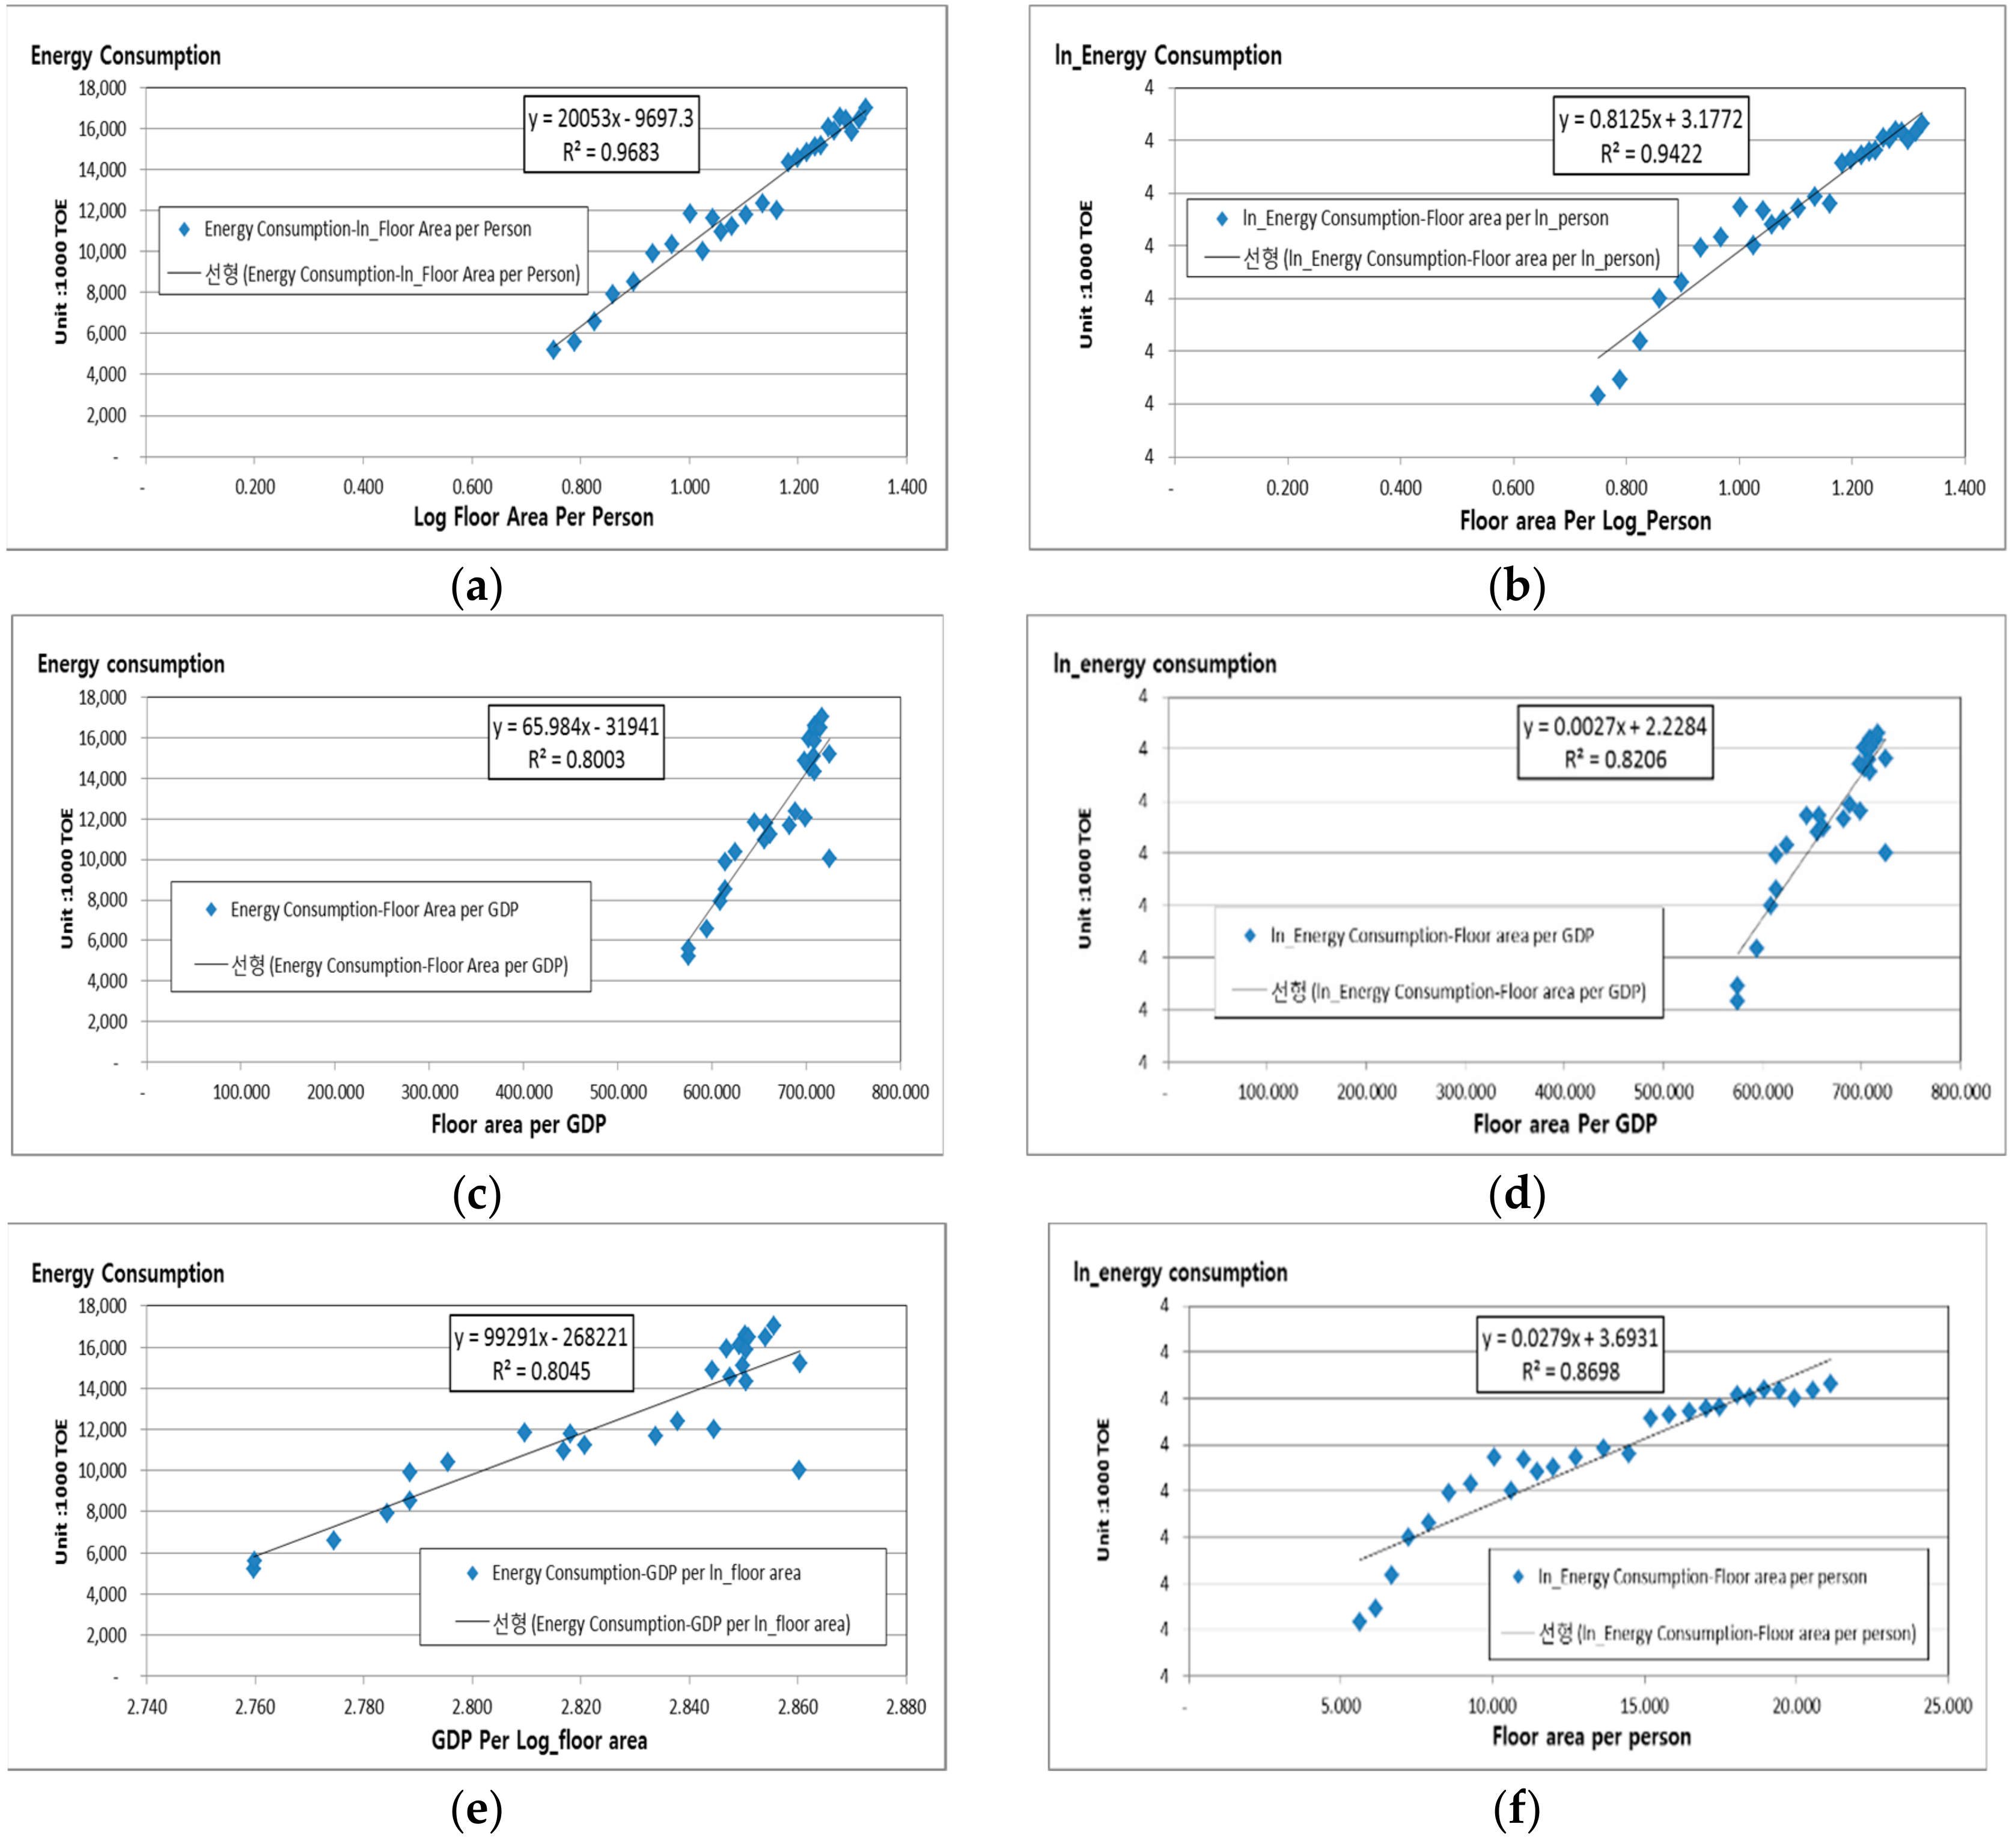
As with the energy demand forecast model, future floor areas until 2030 were predicted using an econometrics model. To determine the variables required for model development, variables that had high correlations with energy consumption were selected through regression analysis between energy consumption and the variables. This allowed us to generate statistics for floor area, floor area per person, log floor area per person, and GDP per person. The regression analysis showed that the energy consumption and floor area have high correlation in general (Figure 8). Particularly, energy consumption and the floor area per log_person showed the highest R2 (coefficient of determination) value of 96.8%.
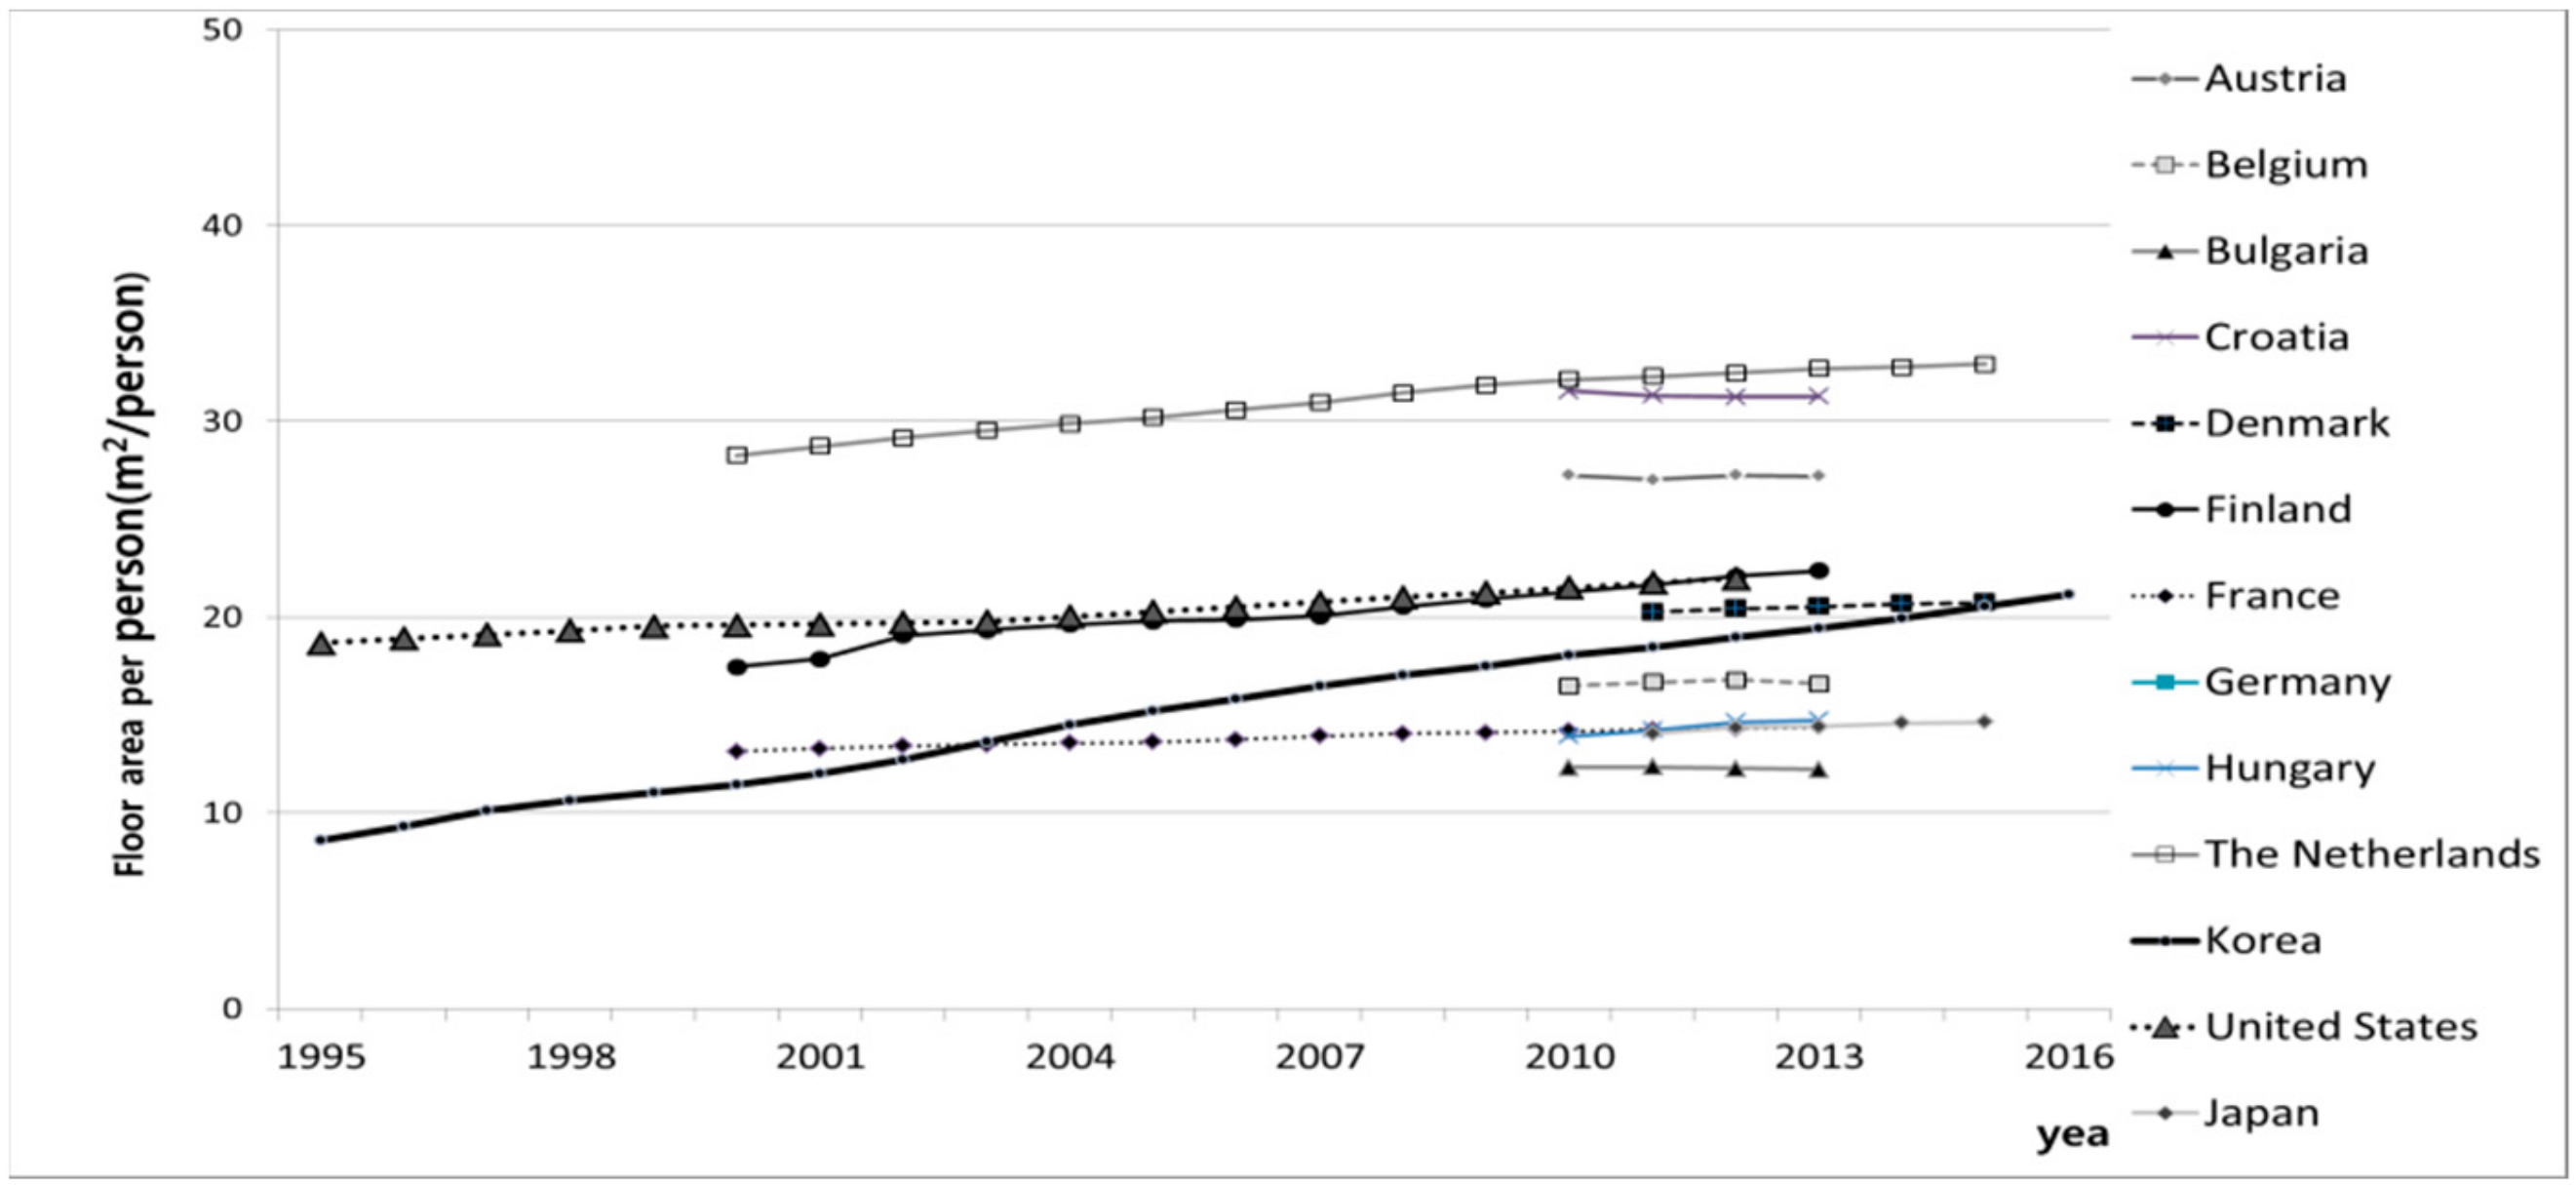
South Korea has limited national land; keeping this in mind, the floor areas of the future were estimated to converge rather than increase. As with overseas cases in Europe, the U.S., and Japan, the floor area per person converged in most countries (Figure 9) [27,28].
The floor area forecast data were obtained by multiplying the forecasted floor area per person by the population to determine the final floor area. The demand forecast model for floor area was developed as a logistic function used in the econometrics model (Figure 10).
To forecast the future floor areas, the statistics from 1970 to 2030 were used and the model was constructed using STATA. The population, GDP, floor area, and the convergence level of floor area per person, which are required for building the model, were input. The convergence level of floor area per person for South Korea used in this study was 23 m2/person, which was based on the IEA forecasts of floor area per person for Europe and the U.S. Furthermore, the adequacy of the model results derived was verified using STATA. The derived model is expressed as Equation (1), and the R2 value of the final model was 99.89% and the p-value was 0, indicating high statistical significance [29].
where is the floor area per person, is the convergence level of floor area per person, is the constant, is the coefficient, is the GDP per person, and is the error function.
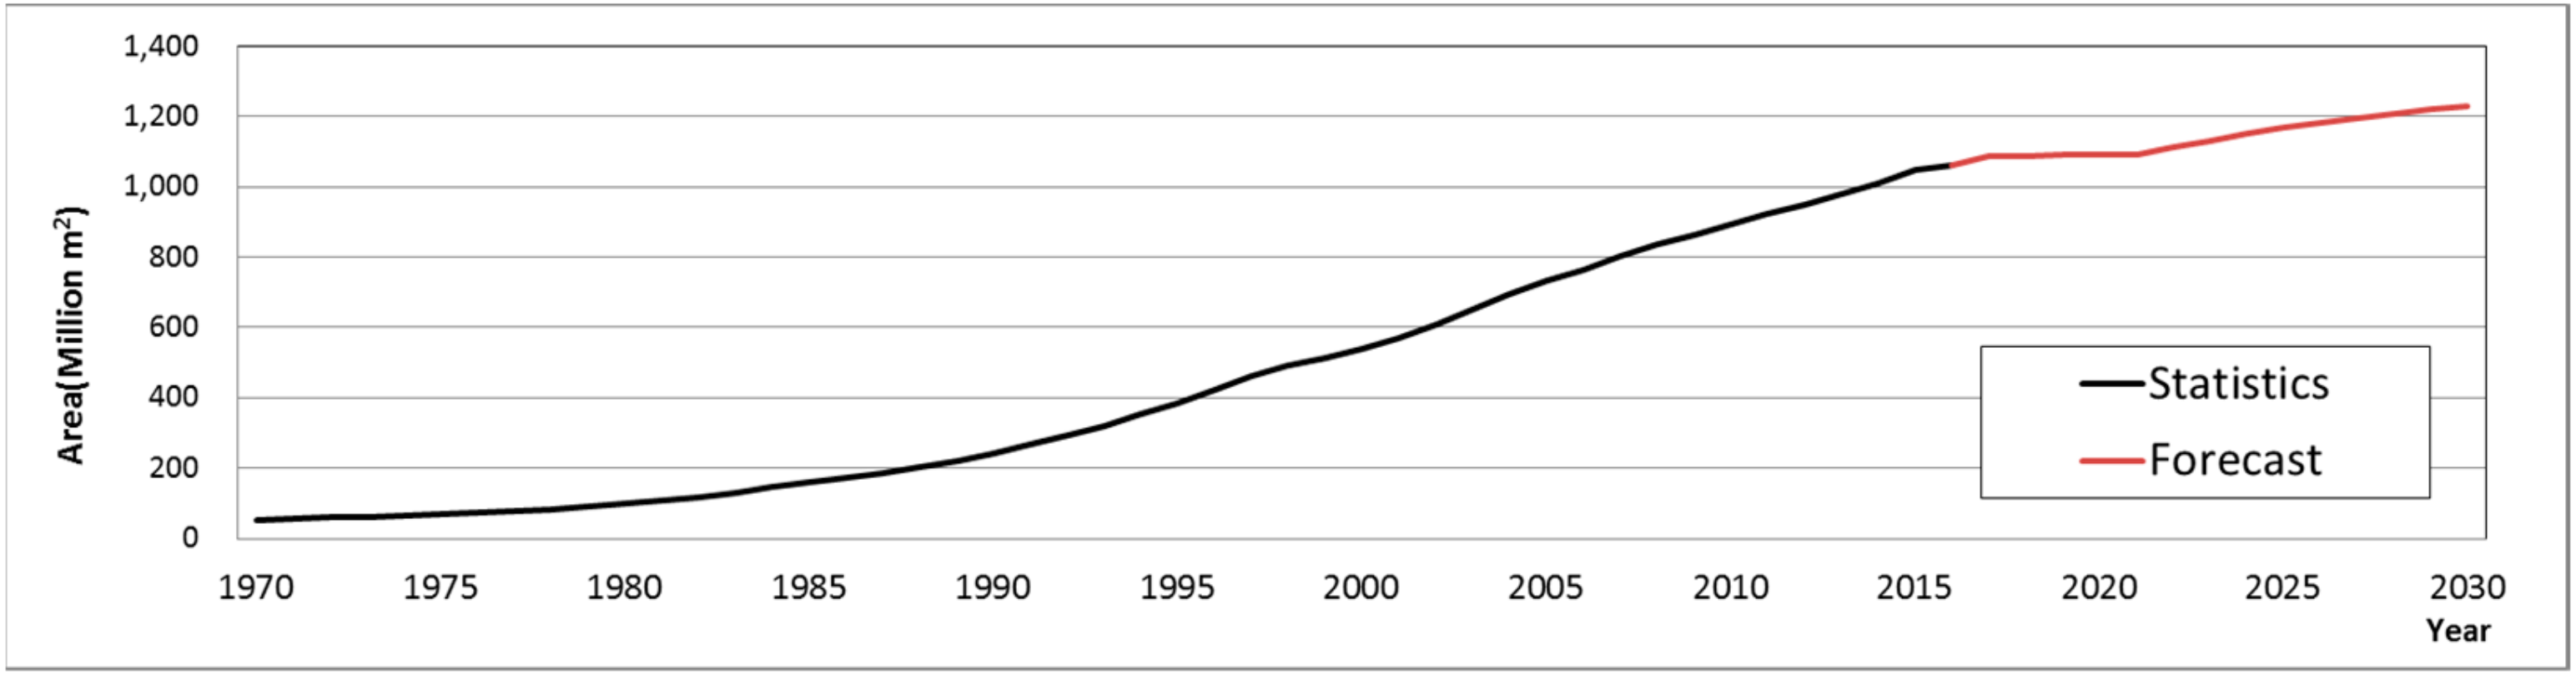
The floor areas estimated for the period until 2030 through the floor area forecast model are listed in Table 3 and shown in Figure 11. The annual average increase rate of the floor area from 2019 to 2030 was 0.91%, and the total floor area of commercial buildings in South Korea was forecasted to be 1231 million m2. These forecast results for the floor area will be used in the energy forecast model.
4.3. Demand Forecast Model by Energy
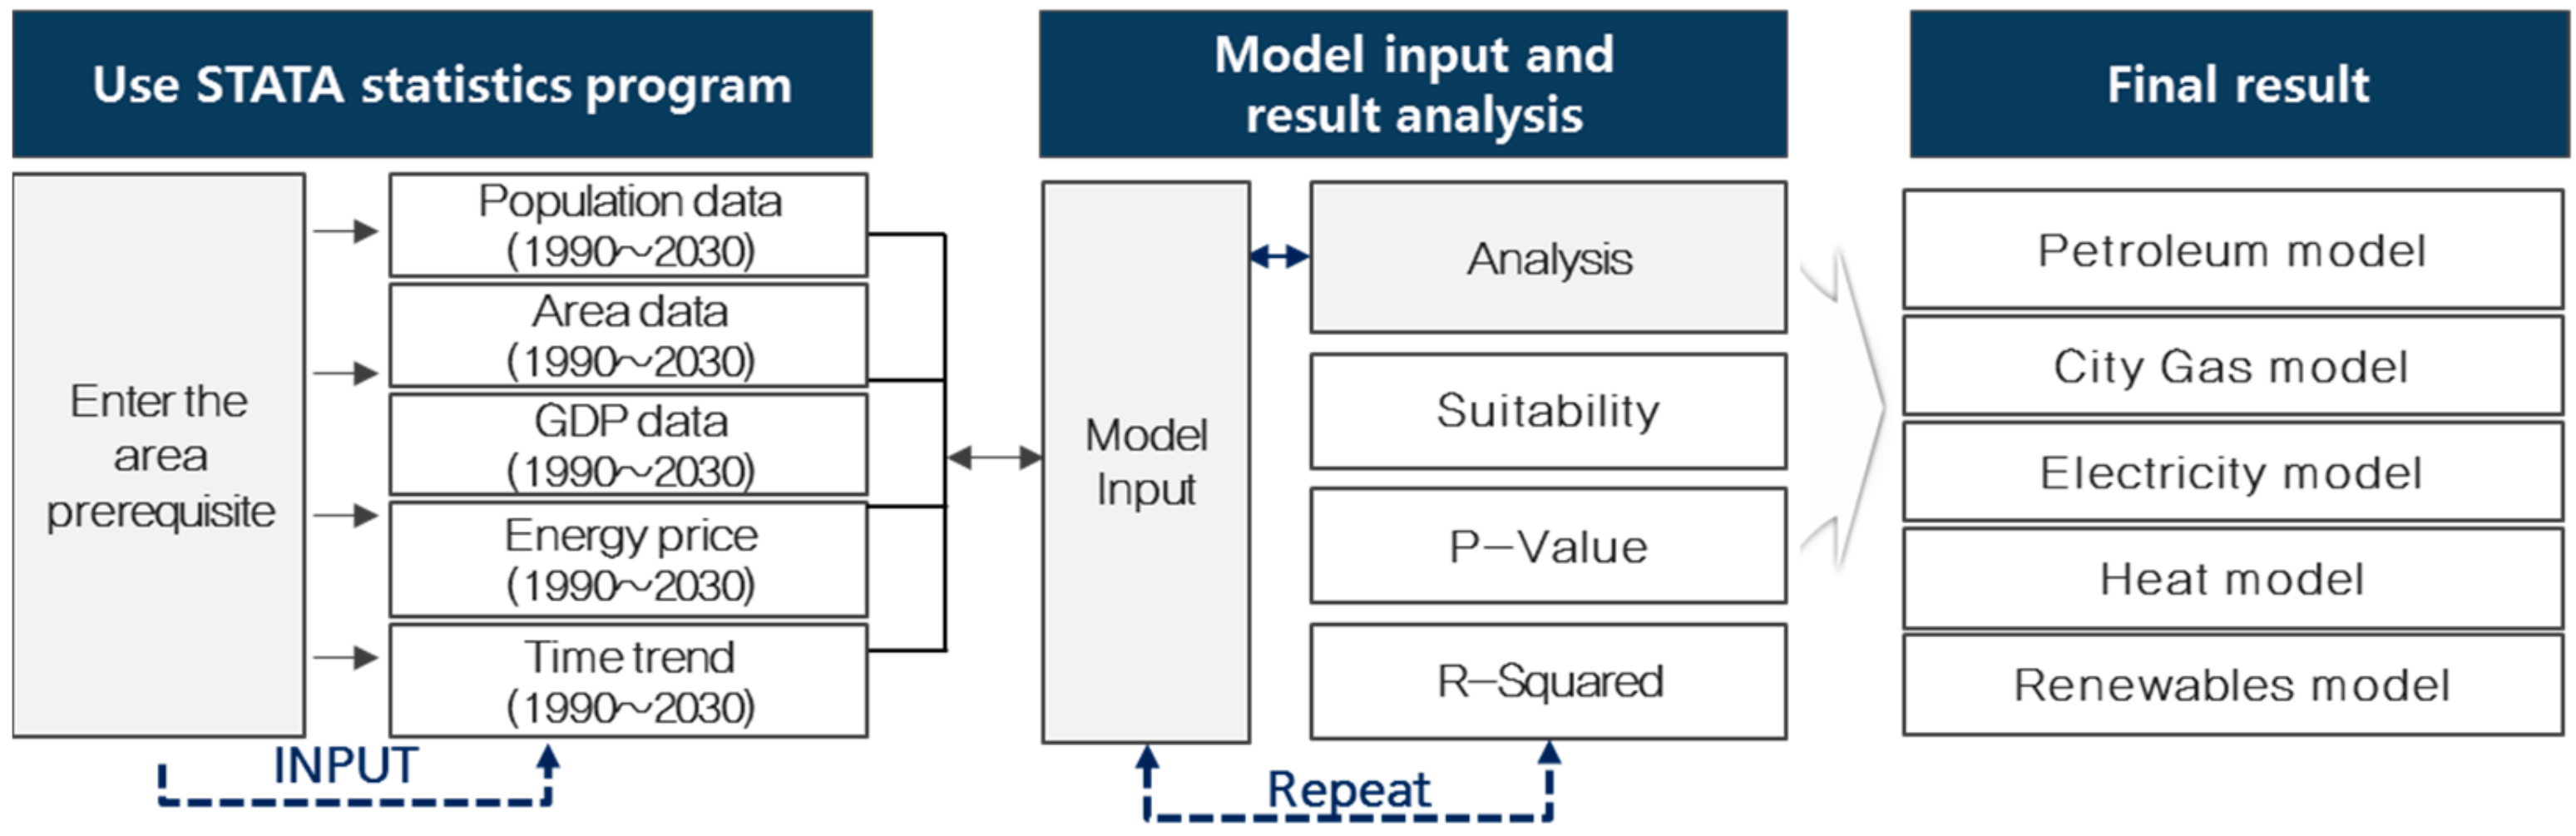
For the energy demand forecast of commercial buildings, the petroleum, electricity, city gas, electricity, heat, and renewable energy demand forecast models were constructed using the econometrics model (see Figure 12). As with the floor area forecast, STATA was used. For the variables of this model, the data that could be established between 1990 and 2030 through domestic statistics and research were used. We then analyzed the temporal trends of energy consumption, floor area data, petroleum prices, and population changes [30]. The cooling/heating days were excluded from the variables because future data require predictions of weather changes, which is impossible. However, historical data are accessible [31].
For statistical verification of the model, the statistical validity was evaluated using R2 and p-value (probability value).
4.3.1. Petroleum Model
The petroleum energy consumption showed a decreasing trend. Compared with 1990, it decreased by 48% at the annual average decrease rate of 2.4% in 2017. We estimated it to continue decreasing. We analyzed petroleum consumption because the city gas penetration rate of South Korea in 2015 was approximately 81%, with petroleum energy demand expected to decrease with increased use of city gas boiler in buildings. Moreover, buildings are expected to use city gas to avail themselves of the cheaper prices. Finally, air pollution and greenhouse gas emissions have become serious issues in South Korea. Thus, the government has been trying to replace petroleum with city gas, which is more environmentally friendly. However, the penetration rate of city gas in provinces outside cities is less than 50%. Thus, we expect continued petroleum consumption.
To develop the demand forecast model of petroleum energy, the variables appropriate for the model were searched by combining the trends of population, building area, GDP, energy prices, and energy consumption using STATA. The analysis results showed that the p-value was 0.7 when the petroleum price was included in the variables, indicating low significance. Thus, it was excluded from the variables of the energy demand forecast model. Statistically significant variables were derived through repetitive variable analysis, and the most significant statistical results were finally derived based on energy consumption. The statistical verification of the petroleum energy demand forecast yielded R2 of 89% and p-value of 0, suggesting the model’s statistical significance. In this study, the petroleum energy demand forecast model was derived as follows [32]:
where is petroleum consumption, is the constant, is the coefficient, ln x is the time trend, and is the error function.
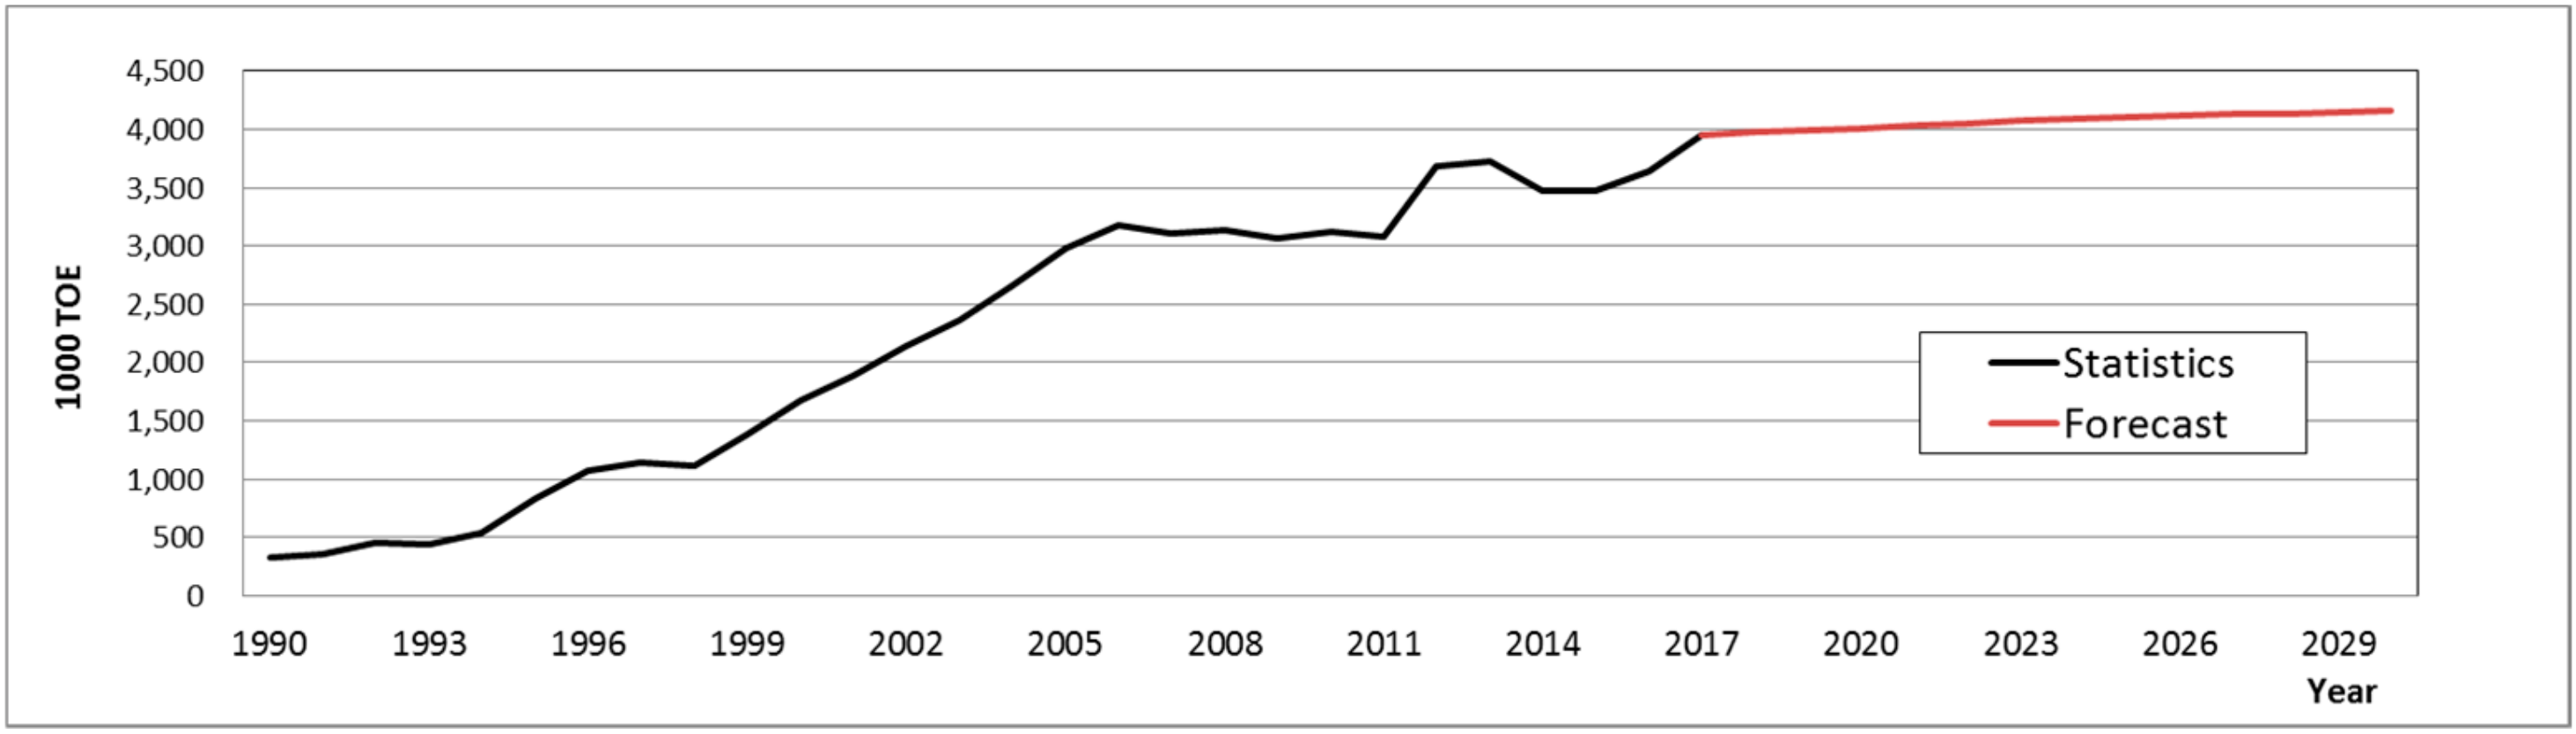
The petroleum energy demand forecast results until 2030 through demand forecast model are listed in Table 4, Figure 13. The petroleum energy demand forecast in 2030 was 1482 thousand toe, and the annual average change rate from 2019 to 2030 was forecasted to be −1.7%, indicating a decreasing trend until 2030.
4.3.2. City Gas Model
The historical city gas consumption showed a rapid rising trend. It increased by 1042% at an annual average rate of 9.4% in 2017, compared with 1990. This can be attributed to rising income standards, which, in turn, have increased the demand for city gas. As noted earlier, city gas is convenient to use and is replacing petroleum boiler. However, this rising trend is expected to slow down in the future for the following reasons. First, a rapid increase in future city gas consumption is unlikely because of supply saturation in city areas. For instance, Seoul, the capital of South Korea, has already reached over 96% saturation. Second, most petroleum boiler have already been replaced with city gas boiler to curb air pollution, so this rising trend will not be prolonged [33]. Although temporary increases and decreases in consumption are expected due to temperature effects, no rapid increase was estimated, as in the past.
To forecast the city gas energy demands, the most appropriate variables were searched using STATA based on the trends of population, building area, GDP, energy prices, and energy consumption. The analysis results showed that, when the city gas price was included in the variables, the p-value was 0.2, indicating low significance. Thus, it was excluded from the variables of the model. Finally, the most significant statistical results with the highest correlation with building area were derived with an R2 of 96% and p-value of 0. Thus, the model was found to be statistically significant. The regression model was derived as follows [32]:
where is city gas consumption, is the constant, is the coefficient, is the area, and is the error function.
4.3.3. Electricity Model
Electricity consumption accounts for approximately 64% of the total energy consumption of commercial buildings, and it has been steadily increasing. In 2017, compared with 1990, it increased by 1152% at an annual average rate of 9.8%. This can be attributed to increased use of electric and power appliances due to rising income and floor area of buildings. Consumption is expected to increase in the future as well. As higher incomes allow people to opt for greater convenience, the types and capacities of electric appliances will increase, thus increasing electricity consumption. Furthermore, the times of using cooling/heating systems and lighting apparatuses are also estimated to increase with greater access to comfortable living [34,35].
To forecast electricity demands, the most appropriate variables were searched using STATA based on the trends of population, building area, GDP, energy prices, and energy consumption. However, no statistically significant variables could be derived. Hence, we used the results of the Electricity Demand and Supply Basic Plan published by the South Korean government [36] because they provide the national total electricity demand forecasts for 15 years from the present year for every two years. The proportion of national total electricity consumption accounting for commercial buildings was separated from the national total electricity demand forecasts. This value has changed only marginally in the last five years, and the average proportion of electricity consumption in commercial buildings was found to be 25.5%. Therefore, 25.5% of the national total electricity demand forecasts was separated as follows [37]:
where is the electricity consumption, is the Electricity Supply and Demand Plan, and is the National Electricity Supply and Demand Plan.
4.3.4. Heat Model
Heat energy accounts for a small proportion approximately 2% of the total energy consumption of commercial buildings. However, it showed a steadily increasing trend. The consumption in 2017 increased by 4497% compared with 1990, rising rapidly at an annual average rate of 15.2%. Large-scale heat energy generation occurs in the suburbs near buildings, and it is supplied through pipelines to each building. Because heat energy has high economic value due to mass production, the government’s policy of promoting heat energy has increased its consumption. However, future trends are expected to slow down because it is practically difficult to construct more power plants for heat energy.
The appropriate variables for the heat energy demand forecast were searched, and the p-value of floor area was 0.006 and that of the previous term’s () heat consumption was 0, indicating statistical significance. Thus, the model was derived as follows:
where is heat consumption, is the constant, is the coefficient, is the area, and is the error function.
4.3.5. Renewables Model
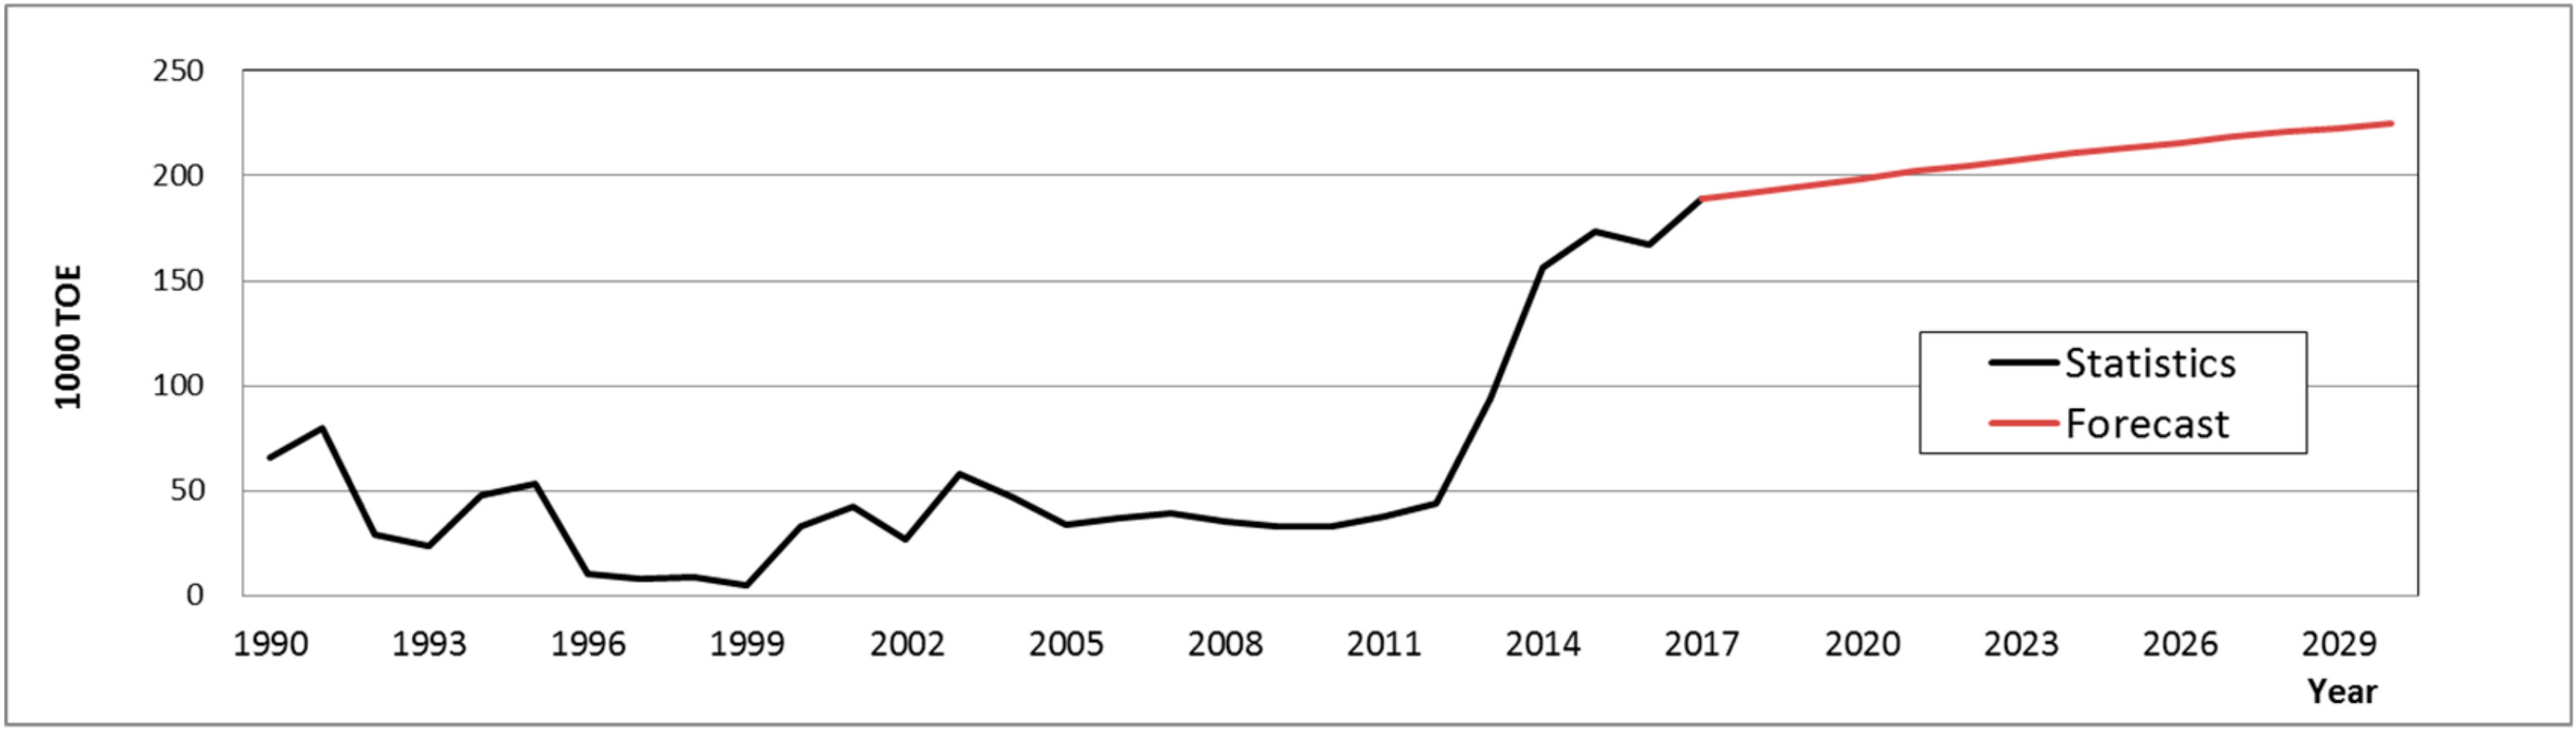
Renewable energy accounts for a small proportion approximately 1% of the total energy consumption of commercial buildings. Its consumption showed fluctuating trends, highlighted by recent increases. The consumption in 2017 increased by 235% at an annual average rate of 4.4%, compared with 1990.
Renewable energy consumption is significantly affected by national policy because it has low economic value compared with other energies. In 2018, the South Korean government announced the 3020 Renewable Energy Supply Plan with the aim to achieve 20% supply of renewable energy by 2030. Accordingly, the renewable energy demand is expected to increase in future in response to these pro-renewable policies. However, it is unlikely to grow substantially, because its proportion in the building sector is small [38]. Although buildings do use renewable energy sources, such as photovoltaic energy, solar power, and geothermal energy, the rapid increase in such technologies is difficult due to installation issues. Moreover, geothermal energy faces adoption challenges because of its weaker economic efficiency [30].
It is impossible to build a renewable energy model using the variable of historical results. This is because historical consumption varies significantly. Therefore, the proportion of renewable energy compared with other energies was used. The proportion of renewable energy in the total energy consumption of building for the past five years was approximately 1.1%, which was used in comparison with other energy demand forecasts.
where is the renewable energy consumption, is the petroleum energy forecast, is the city gas energy forecast, is the electricity energy forecast, is the heat energy forecast, and is the error function.
4.3.6. Energy Demand Forecast Result
Petroleum, city gas, electricity, heat, and renewable energy models were constructed to forecast the energy demands of commercial buildings. Through the models, the total energy demand was forecasted to increase to 19,815,000 toe in 2030 at an annual rate of 1.4% from 2019 to 2030 (Table 9).
5. Discussion
Korea lacks research on the energy demand forecasting of the building sector and needs related research. However, energy demand forecasts are needed, and the results can be used to reduce greenhouse gas emissions and establish energy policies. In this paper, we propose a prediction model of power, city gas, heat, and renewable energy to predict energy demand. Due to the lack of statistics in Korea, a statistically significant model could not be constructed for electricity and renewable energy. This is an aspect that needs to be supplemented through future research. In addition, the methodology for forecasting energy demand [39], and the process of deriving it, should be supplemented by continuous research. The model proposed in this study is not suitable for long-term models and can only be used for short-term models. Long-term models require additional variables and consideration of energy conversion. In addition, the model proposed in this study is based on Korean time series data and is suitable for Korea. This paper is a precedent study and will be a reference for future research.
6. Conclusions
We developed demand forecast models for petroleum, city gas, electricity, heat, and renewable energy to forecast annual energy demands for commercial buildings in South Korea until 2030. The conclusions of this study are as follows:
- We developed an appropriate energy demand forecast method by analyzing the characteristics of the econometrics model and the end-use account model. The demand forecast model for each energy source was constructed using a hybrid method combining both top-down and bottom-up methods.
- The floor area forecast model until 2030 for commercial buildings was developed using GDP per person and energy consumption, which have high correlations with floor area. According to the forecast results, the total floor area in 2030 was estimated to be 1231 million m2 and the annual increase rate from 2019 to 2030 was 0.91%.
- For the petroleum energy demand forecast model, the energy consumption trend was derived as the most appropriate variable for forecasting demand. The R2 of this model was 89% and the p-value was 0, indicating statistical significance. According to the forecast results, the petroleum energy consumption was forecasted to decrease to 1482 thousand toe in 2030 at an annual average rate of −1.7% from 2019 to 2030.
- The most appropriate variable for city gas energy demand forecast was the building floor area. The R2 of the model was 96% and the p-value was 0. According to the forecast results, the gas energy consumption was estimated to increase to 4157 thousand toe in 2030 at an annual average rate of 0.4% from 2019 to 2030.
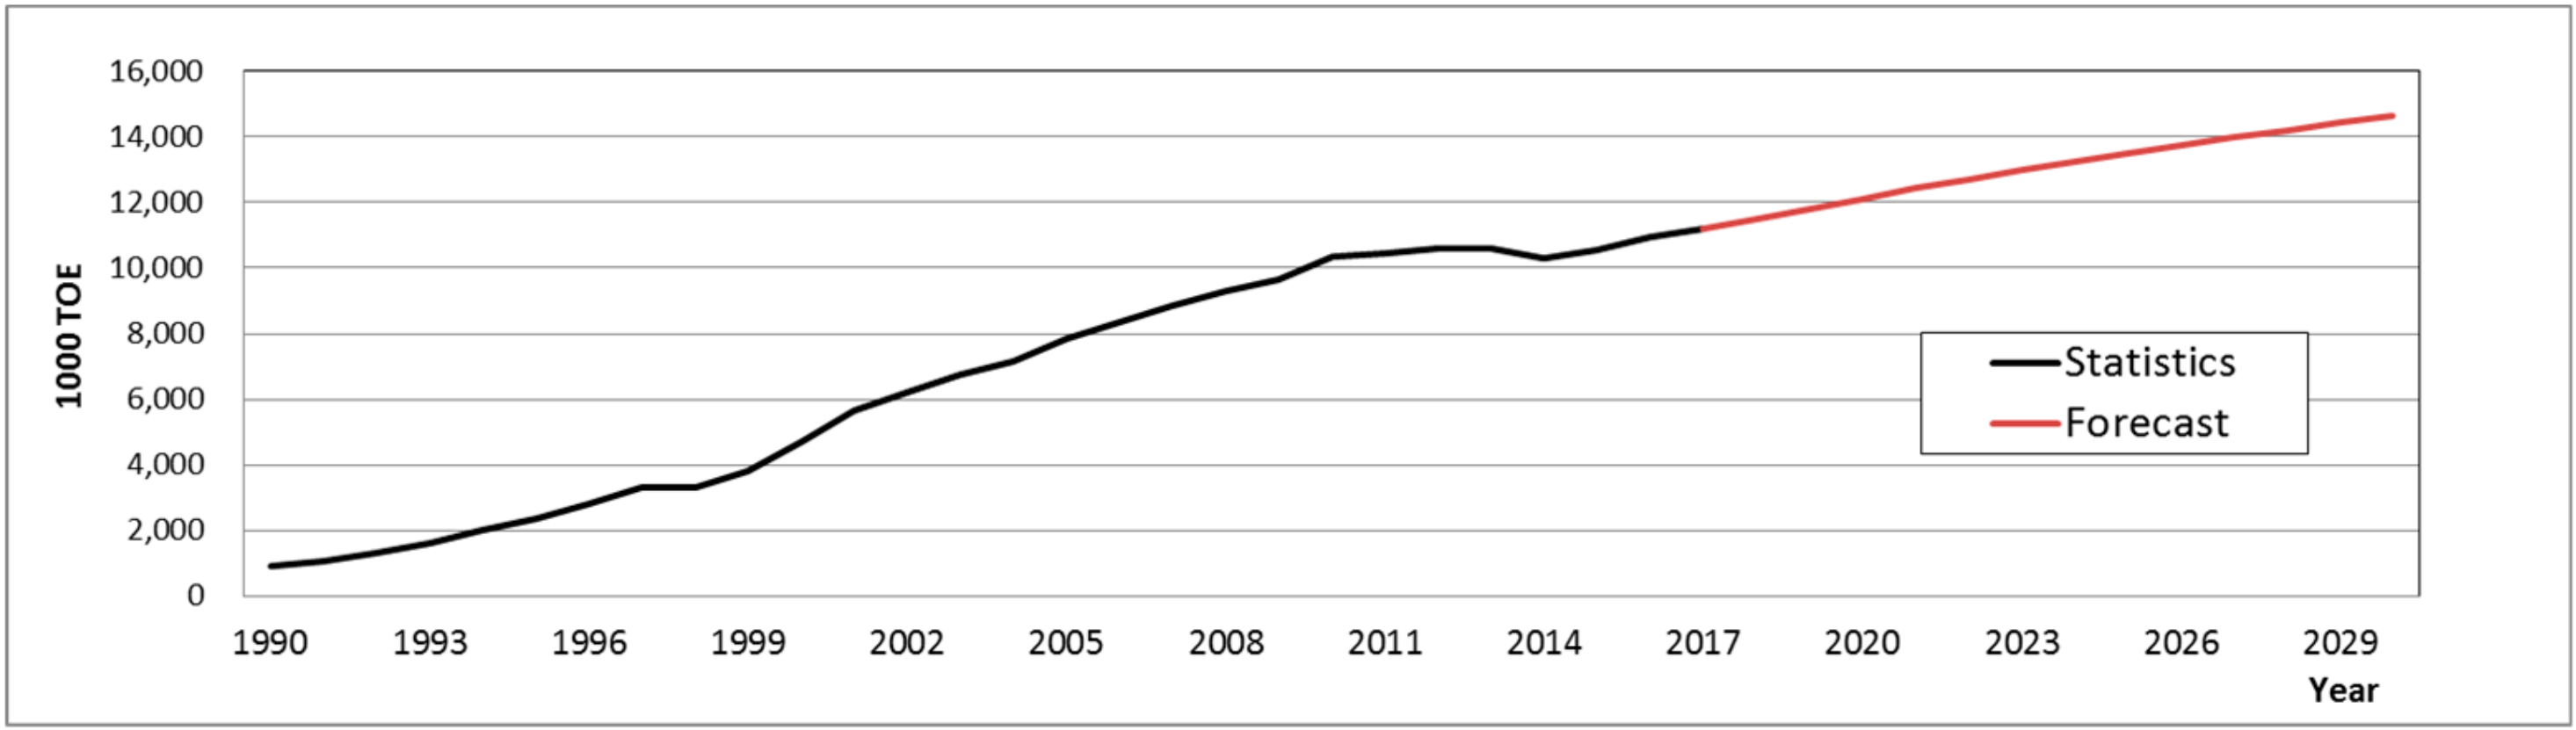
- The electricity energy demand was forecasted using the Electricity Demand and Supply Basic Plan. The proportion of commercial buildings in the national total electricity consumption published in this plan was 25.5%. It was thus used for the electricity energy demand forecast of commercial buildings. Accordingly, the consumption was forecasted to increase to 14,627 thousand toe in 2030 at an annual average rate of 2.1% from 2019 to 2030.
- The most appropriate variable for heat energy demand forecast derived from the analysis of variables was floor area. The p-value of this model was 0.006, indicating statistical significance. According to the forecast results, the heat energy consumption was forecasted to decrease to 182 thousand toe in 2030 at an annual rate of −0.2% from 2019 to 2030.
- The renewable energy demand was forecasted to account for 1.1% of the energy demand forecast results of other energies. This consumption was forecasted to increase to 225 thousand toe in 2030 at an annual average rate of 1.3% from 2019 to 2030.
In the future, a technical analysis by energy source and use, as well as a study on bottom-up methods through the construction of data on future technologies, are required for more accurate energy demand forecasting. To analyze the adequacy of our results, domestic and overseas case studies must be incorporated. Furthermore, more research is required to forecast the energy demands of residential and public buildings using insights presented in our study. This will enable us to forecast complex energy demands for the complete building sector of South Korea.
Author Contributions
All authors contributed substantially to all aspects of this article.
Funding
This work was supported by the National Research Foundation of Korea (NRF) grant funded by the Korea government (MSIT) (No. 2015R1A5A1037548).
Conflicts of Interest
The authors declare no conflict of interest.
References
- Park, S.W. Post-2020 Climate Regime and Paris Agreement. Environ. Law Policy 2016, 16, 285–322. [Google Scholar] [CrossRef]
- Korea Energy Economics Institute. Energy Balance; 2017 Yearbook of Energy Statistics; KEEI: Ulsan, Korea, 2018; Volume 35, pp. 296–349. [Google Scholar]
- Lee, C.Y.; Huh, S.Y. Forecasting new and renewable energy supply through a bottom-up approach: The case of South Korea. Renew. Sustain. Energy Rev. 2017, 69, 207–217. [Google Scholar] [CrossRef]
- Shin, J.; Lee, C.Y.; Kim, H. Technology and demand forecasting for carbon capture and storage technology in South Korea. Energy Policy 2016, 98, 1–11. [Google Scholar] [CrossRef]
- Ministry of Trade, Industry. Energy Basic Plan; Ministry of Trade, Industry: Sejong City, Korea, 2014.
- Ministry of Trade, Industry. Electricity Demand and Supply Basic Plan; Ministry of Trade, Industry: Sejong City, Korea, 2017.
- Ministry of Trade, Industry. Long-Term Natural Gas Demand and Supply Plan; Ministry of Trade, Industry: Sejong City, Korea, 2018.
- Jeon, H.C.; Chung, Y.M. Survey on Energy Demand Forecasting Models for the Development of Energy-Environment Outlook Model. Korea Environ. Inst. 2018, 2018, 1–59. [Google Scholar]
- Papadopoulos, S.; Bonczak, B.; Kontokosta, C.E. Pattern recognition in building energy performance over time using energy benchmarking data. Appl. Energy 2018, 221, 576–586. [Google Scholar] [CrossRef] [Green Version]
- Livingston, O.V.; Pulsipher, T.C.; Anderson, D.M.; Vlachokostas, A.; Wang, N. An analysis of utility meter data aggregation and tenant privacy to support energy use disclosure in commercial buildings. Energy 2018, 159, 302–309. [Google Scholar] [CrossRef]
- IEA. Online Annex: Energy-Efficient Buildings in the Urban Environment (Chapter 4); IEA: Paris, France, 2016. [Google Scholar]
- Ortiz, L.E.; Gonzalez, J.E.; Gutierres, E.; Arend, M. Forecasting Building Energy Demands with a Coupled Weather-Building Energy Model in a Dense Urban Environment. J. Sol. Energy Eng. 2016, 139, 011002-1–011002-8. [Google Scholar] [CrossRef]
- Jeong, Y.S.; Cho, C.H. A Forecast of Energy Demand in Building Sector using Energy System Model. J. Korean Inst. Archit. Sustain. Environ. Build. Syst. 2016, 10, 368–374. [Google Scholar]
- Wang, N.; Vlachokostas, A.; Borkum, M.; Bergmann, H.; Zaleski, S. Unique Building Identifier: A natural key for building data matching and its energy applications. Energy Build. 2019, 184, 230–241. [Google Scholar] [CrossRef]
- Bueno, B.; Norford, L.; Pigeon, G. Combining a Detailed Building Energy Model with a Physically-Based Urban Canopy Model. Bound. Layer Meteorol. 2011, 140, 471–489. [Google Scholar] [CrossRef]
- Roop, J.M.; Dahowski, R.T. Comparison of Bottom-up and Top-down Forecasts: Vision Industry Energy Forecasts with Items and Nems. Natl. Ind. Energy Technol. Conf. 2010, 22, 84–88. [Google Scholar]
- Ministry of Trade, Industry Energy. Commercial and Public Services; 2017 Energy Consumption Survey; Ministry of Trade, Industry Energy: Sejong City, Korea, 2018; pp. 540–600.
- Gutiérrez, E.; González, J.E.; Bornstein, R. A New Modeling Approach to Forecast Building Energy Demands During Extreme Heat Events in Complex Cities. J. Sol. Energy Eng. 2011, 135, 1879–1884. [Google Scholar] [CrossRef]
- Li, K.; Su, H. Forecasting building energy consumption with hybrid genetic algorithm-hierarchical adaptive network-based fuzzy inference system. Energy Build. 2010, 42, 2070–2076. [Google Scholar] [CrossRef]
- Li, X.; Wen, J. Building energy consumption on-line forecasting using physics-based system identification. Energy Build. 2014, 82, 1–12. [Google Scholar] [CrossRef]
- Zhang, F.; Deb, C.; Lee, S.E.; Yang, J. Time series forecasting for building energy consumption using weighted Support Vector Regression with differential evolution optimization technique. Energy Build. 2016, 126, 94–103. [Google Scholar] [CrossRef]
- Rouchier, S.; Rabouille, M.; Oberle, P. Calibration of simplified building energy models for parameter estimation and forecasting: Stochastic versus deterministic modelling. Build. Environ. 2018, 134, 181–190. [Google Scholar] [CrossRef]
- Eom, J.; Clark, L.; Kim, S.H. China’s Building Energy Demand: Long-Term Implications from a Detailed Assessment. Energy 2012, 46, 405–419. [Google Scholar] [CrossRef]
- Kyle, P.; Clarke, L.; Rong, F. Climate Policy and the Long-Term Evolution of the U.S. Buildings Sector. Energy J. 2010, 31, 145–172. [Google Scholar] [CrossRef]
- IEA. Transition to Sustainable Buildings; Strategies and Opportunities to 2050; IEA: Paris, France, 2013. [Google Scholar]
- Depecker, P.; Menezo, C.; Virgone, J.; Lepers, S. Design of buildings shape and energetic consumption. Build. Environ. 2001, 36, 627–635. [Google Scholar] [CrossRef]
- IEA. Available online: https://iea.org/books (accessed on 9 June 2017).
- World Bank. Available online: https://data.worldbank.org/country (accessed on 10 March 2018).
- Michale, A.M.; Virginie, E.L.; Stephane, R.C. Global Potential of Energy Efficiency Standards and Labeling Programs; LBNL: Berkeley, CA, USA, 2008; pp. 7–99.
- Cao, Z.; Yuan, P.; Ma, Y.B. Energy Demand Forecasting Based on Economy-related Factors in China. Energy Sources Part B Econ. Plan. Policy 2014, 9, 214–219. [Google Scholar] [CrossRef]
- Ulhaner, R.; Cason, T.; Smith, B. A Method of Forecasting End-Use Energy Usage Patterns Using Customer Attributes. Atomic Energy Comm. USA 1991, 100396, 1–21. [Google Scholar]
- Modis, T. Forecasting energy needs with logistics. Technol. Forecast. Soc. Chang. 2019, 139, 135–143. [Google Scholar] [CrossRef]
- Fujime, K. An Analysis of and Forecast for Economic Development and Energy Demand in Asia/Pacific Countries. Congr. World Energy Counc. 1995, 11, 231–250. [Google Scholar]
- Vinutha, H.D.; Gouda, K.C.; Chandan, K.N. Electric Load Forecasting using a Neural Network Approach. IJCTT 2014, 11, 244–249. [Google Scholar]
- Ardakani, F.J.; Ardehali, M.M. Long-term electrical energy consumption forecasting for developing and developed economies based on different optimized models and historical data types. Energy 2014, 65, 452–461. [Google Scholar] [CrossRef]
- Ministry of Trade, Industry Energy. The 8th Korea Power Supply and Demand Plan; Ministry of Trade, Industry Energy: Sejong City, Korea, 2018.
- Kaboli, S.H.; Selvaraj, J.; Rahim, N.A. Long-term electric energy consumption forecasting via artificial cooperative search algorithm. Energy 2016, 115, 857–871. [Google Scholar] [CrossRef]
- In, C.H. Seoul Energy Demand Forecast 2015–2035: An Application of the MAED. J. Environ. Policy Adm. 2015, 23, 47–76. [Google Scholar]
- Lee, S.C.; Shih, L.H. Forecasting of electricity costs based on an enhanced gray-based learning model: A case study of renewable energy in Taiwan. Technol. Forecast. Soc. Chang. 2011, 78, 1242–1253. [Google Scholar] [CrossRef]
Figure 1.
Energy demand forecast model for IEA buildings.
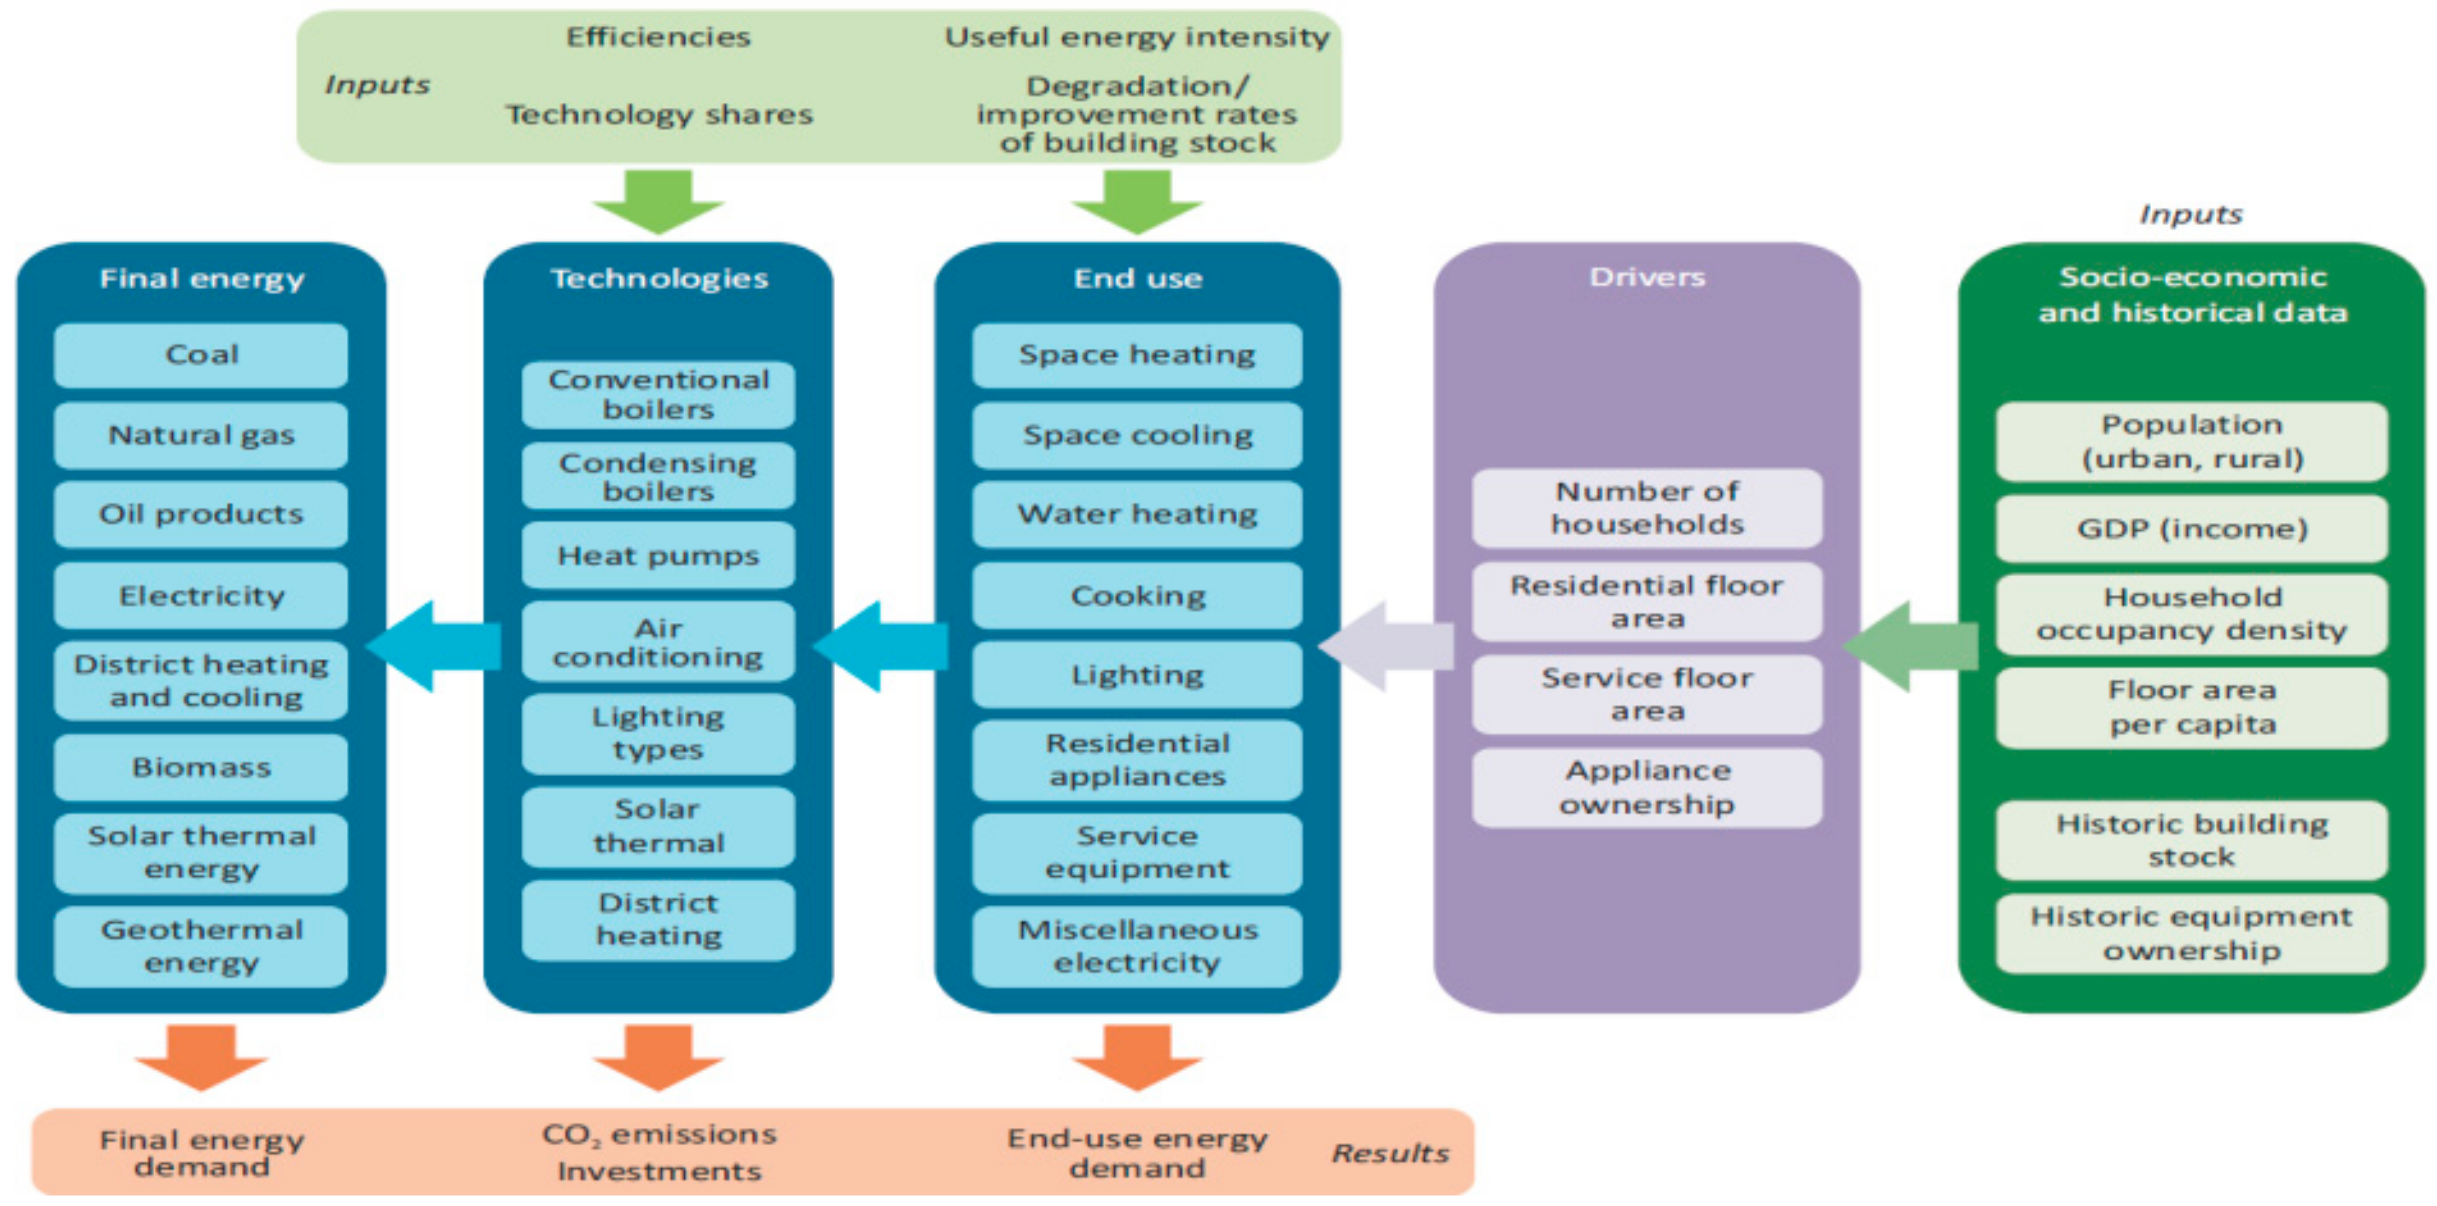
Figure 2.
Composition of this study.

Figure 3.
Research flowchart.
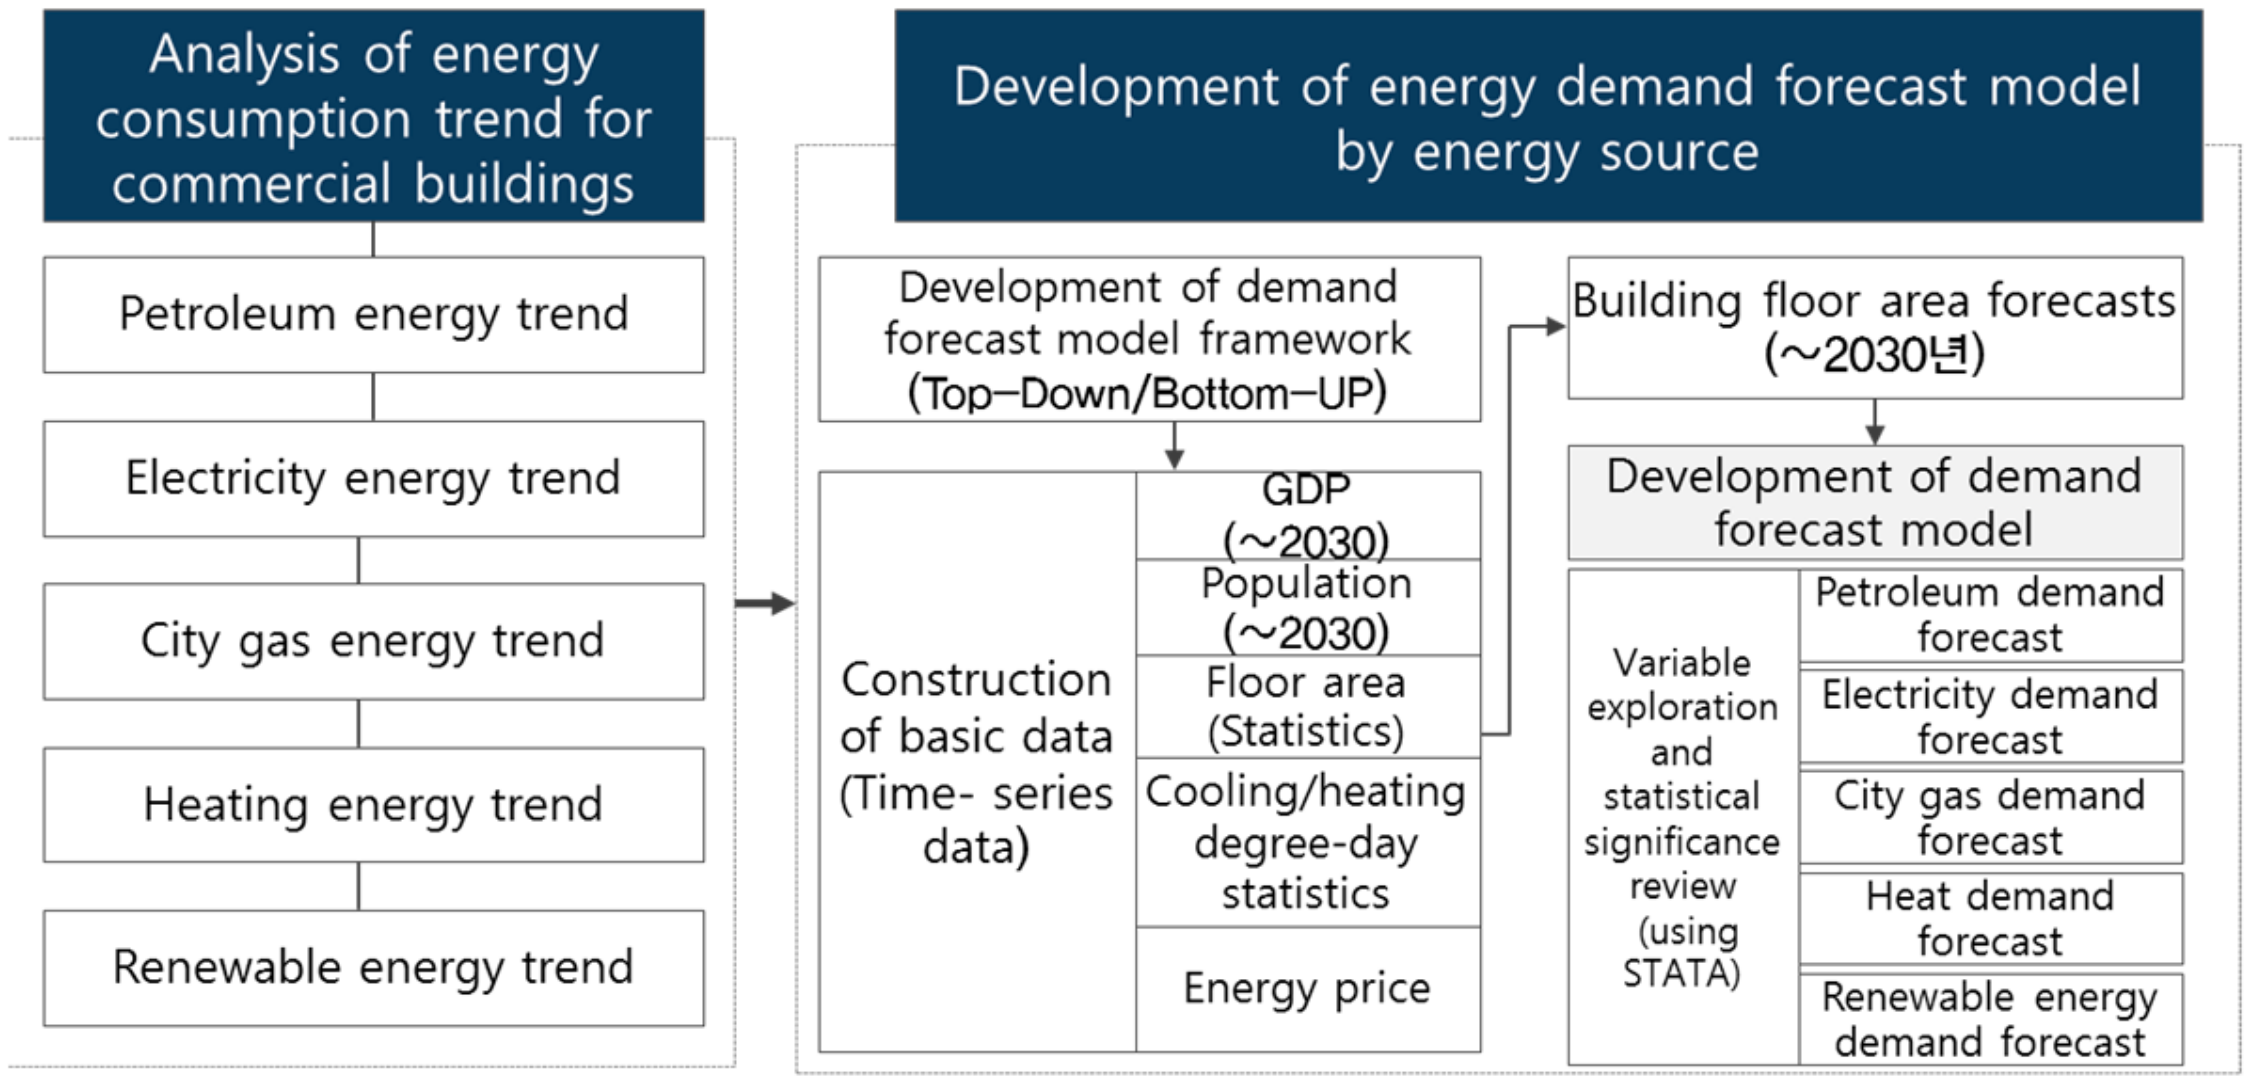
Figure 4.
Energy consumption status of commercial buildings.

Figure 5.
Energy demand forecast methods: (a) top-down model; (b) bottom-up model.
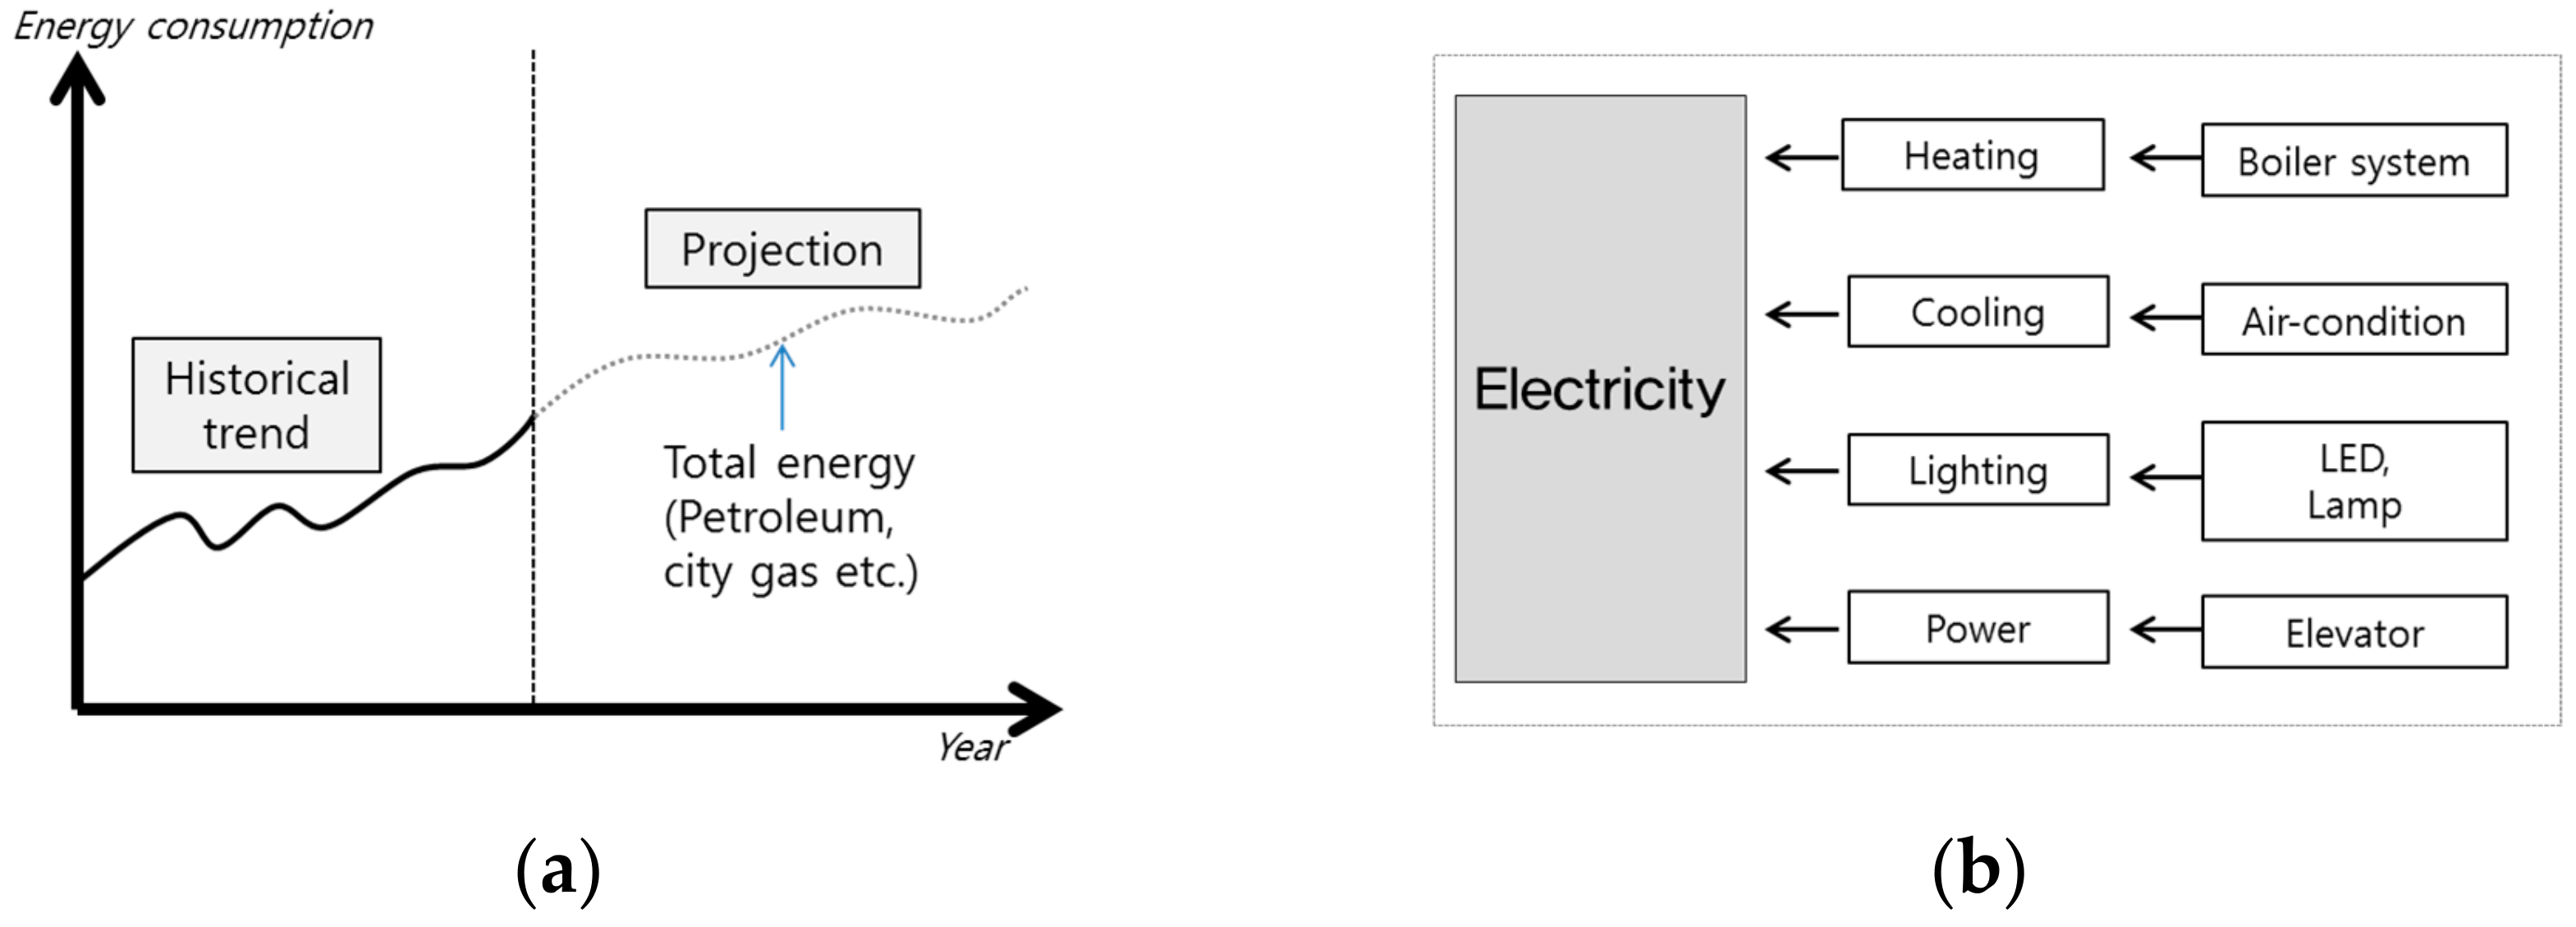
Figure 6.
Structure of the energy demand forecast model.
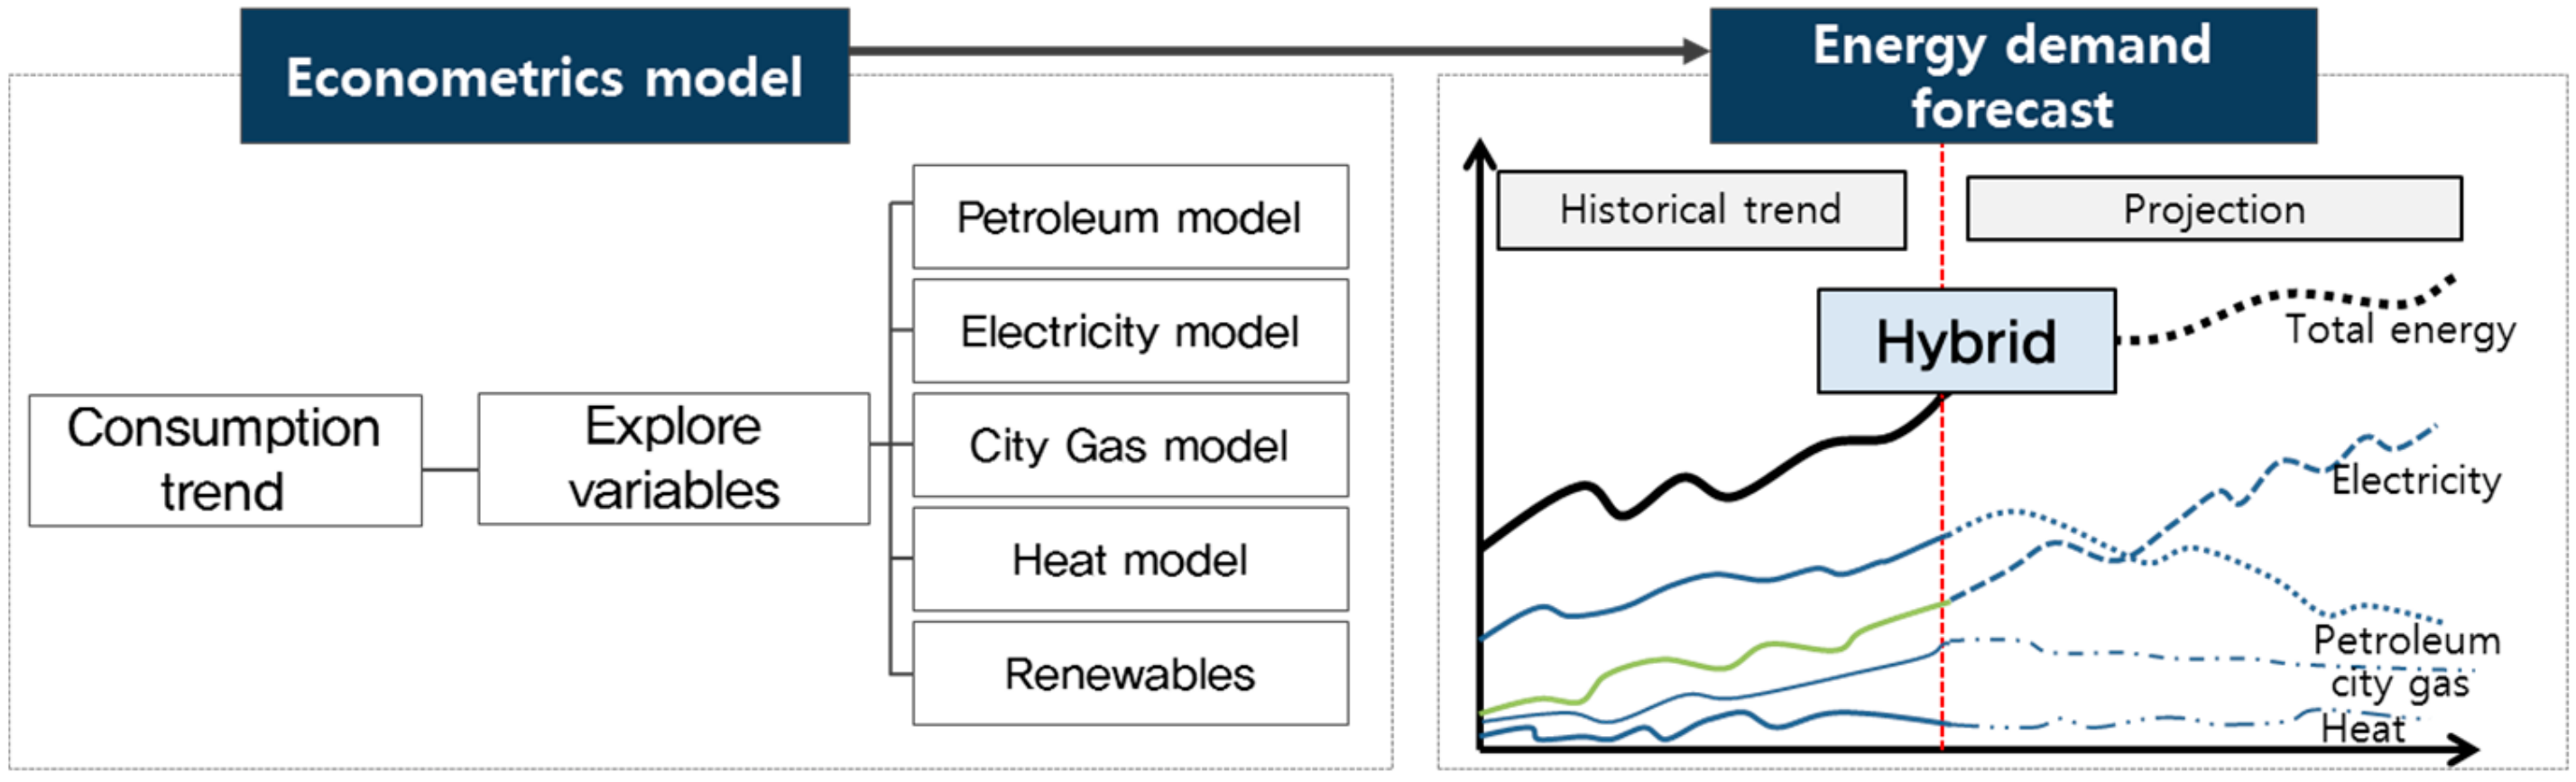
Figure 7.
Annual data trends for energy demand forecast model: (a) population trend by year, (b) gdp trend by year, (c) floor area trend by year, (d) energy price trend by year, (e) heating days trend by year, and (f) cooling days trend by year.
Figure 7.
Annual data trends for energy demand forecast model: (a) population trend by year, (b) gdp trend by year, (c) floor area trend by year, (d) energy price trend by year, (e) heating days trend by year, and (f) cooling days trend by year.
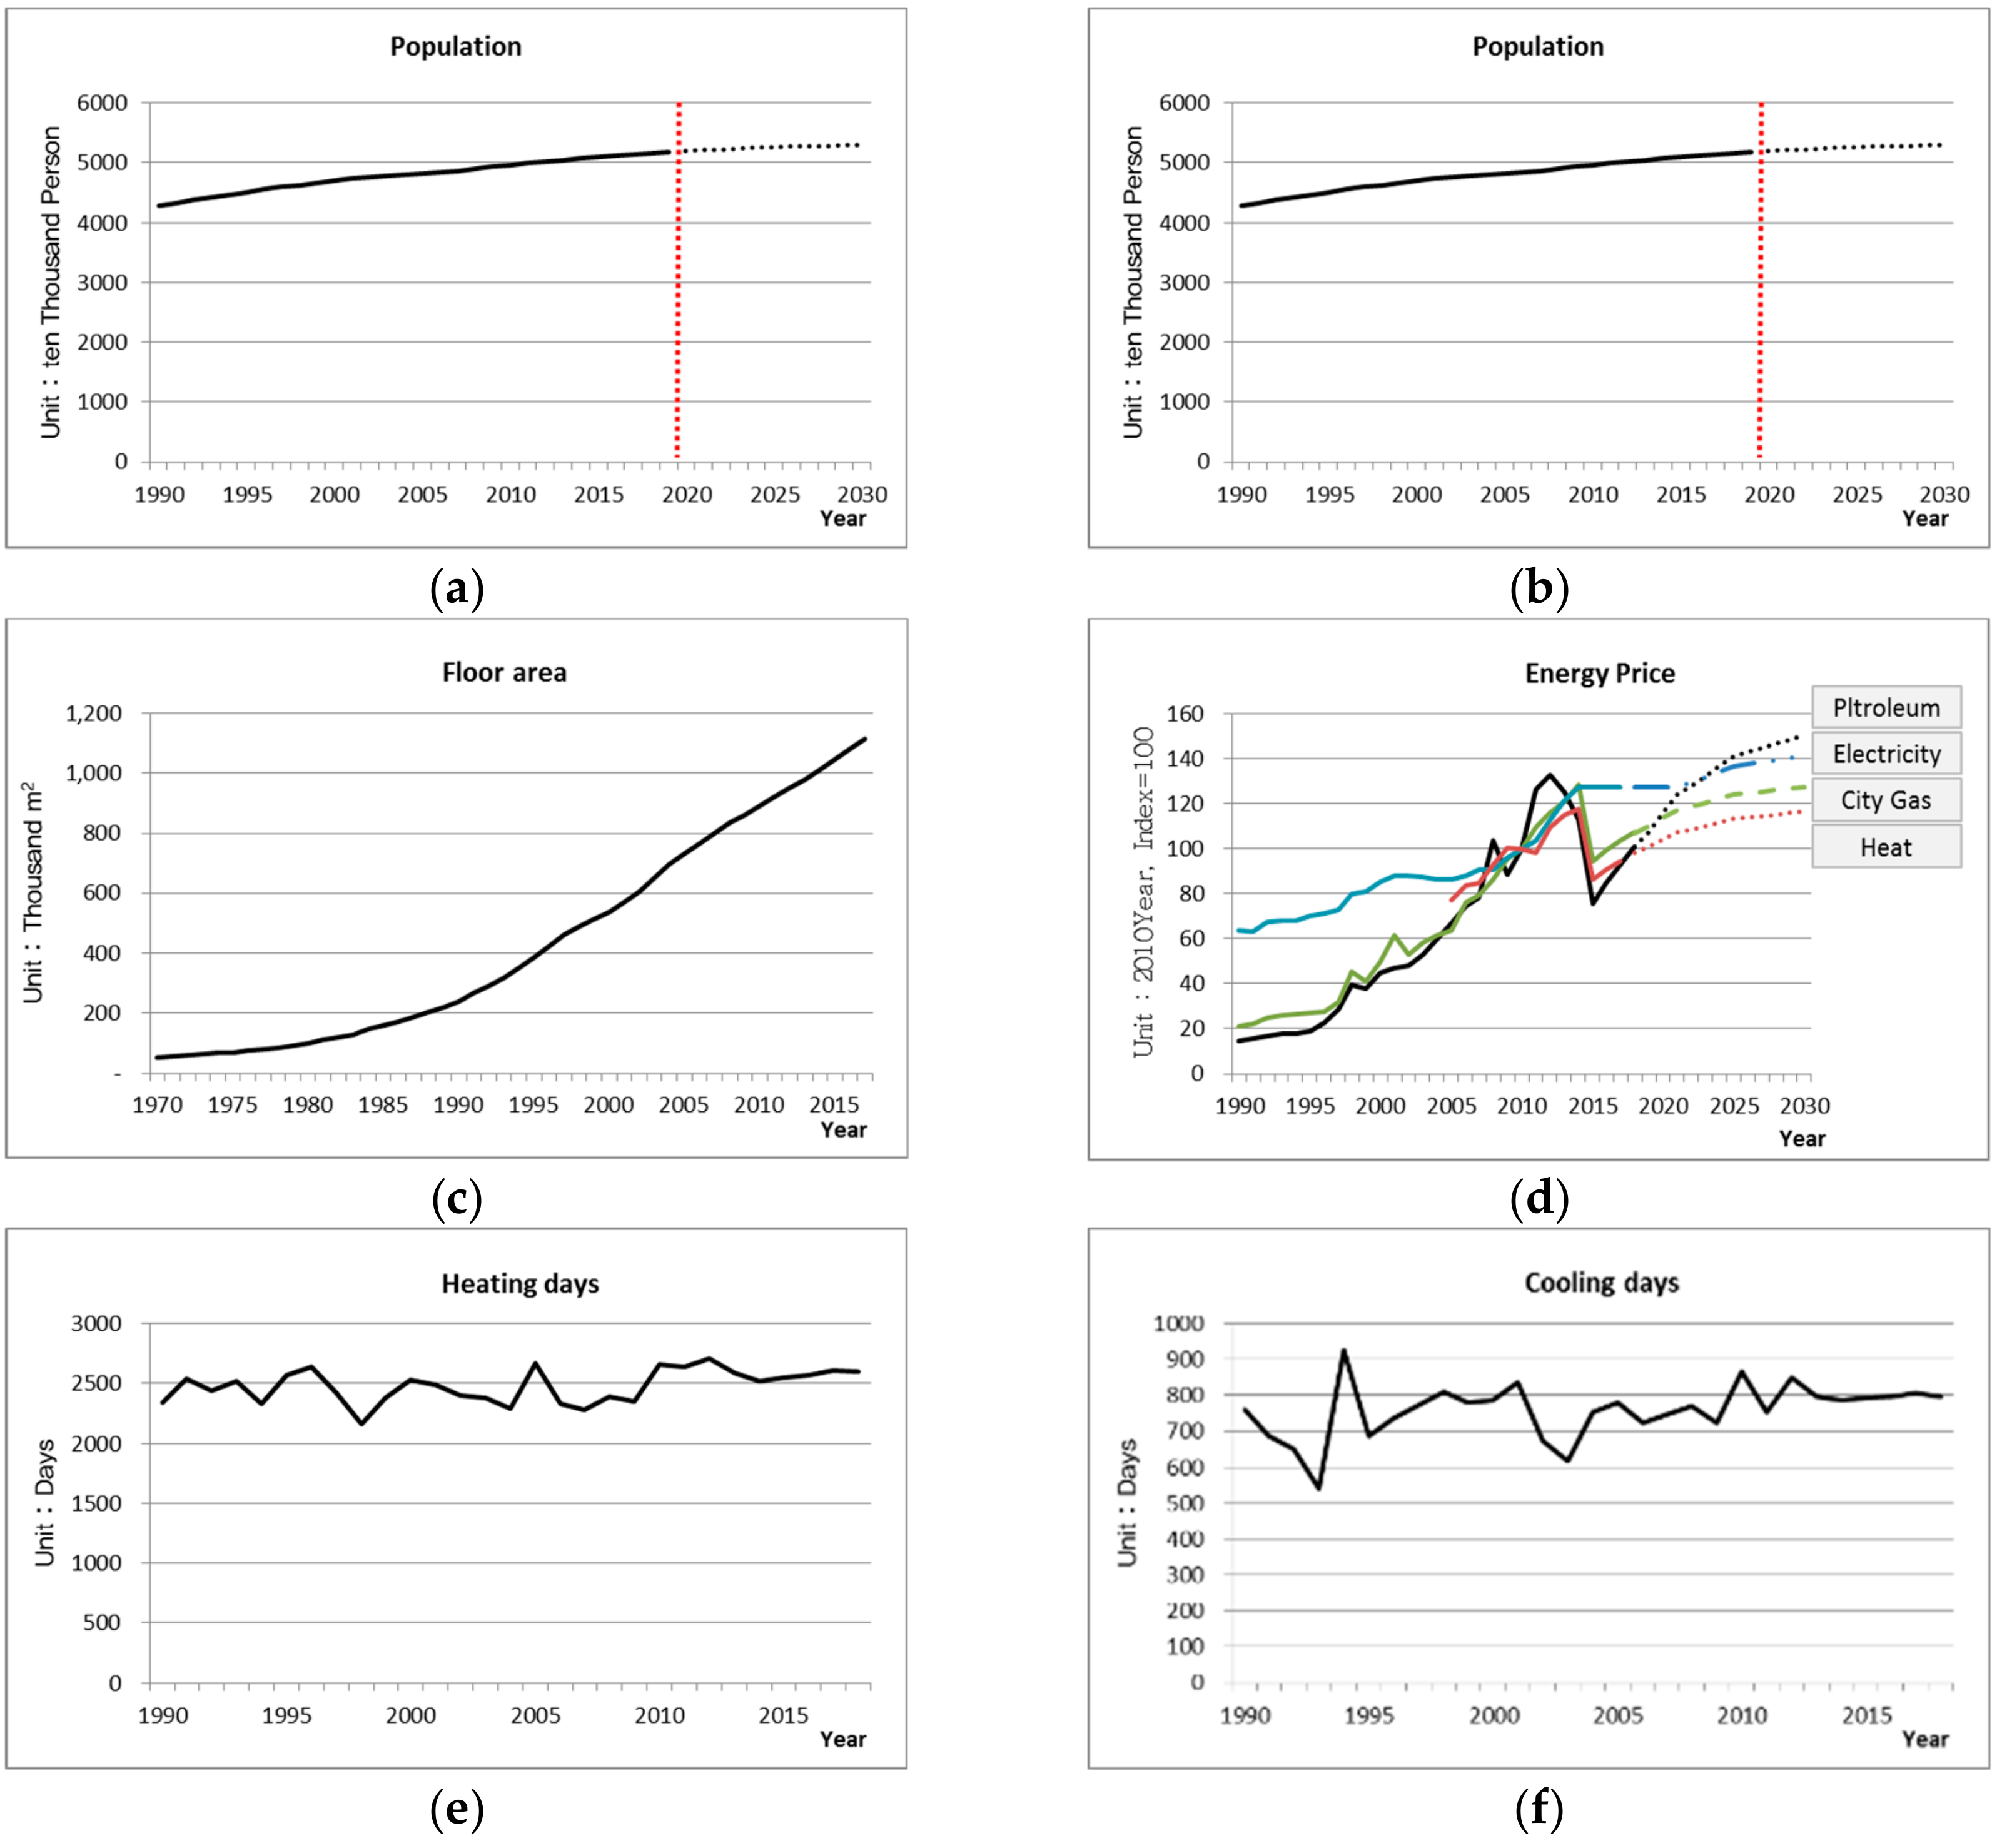
Figure 8.
Correlation analysis results for floor area of commercial buildings: (a) energy consumption and log floor area per person, (b) log energy consumption and floor area per log person, (c) energy consumption and floor area per GDP, (d) log energy consumption and floor area per GDP, (e) energy consumption and GDP per log and floor area (f) log energy consumption and floor area per person.

Figure 9.
Floor area per person by country.

Figure 10.
Floor area forecast model structure.

Figure 11.
Floor area statistics and forecast result.

Figure 12.
Demand forecast model structure by energy.

Figure 13.
Petroleum energy and forecast result.
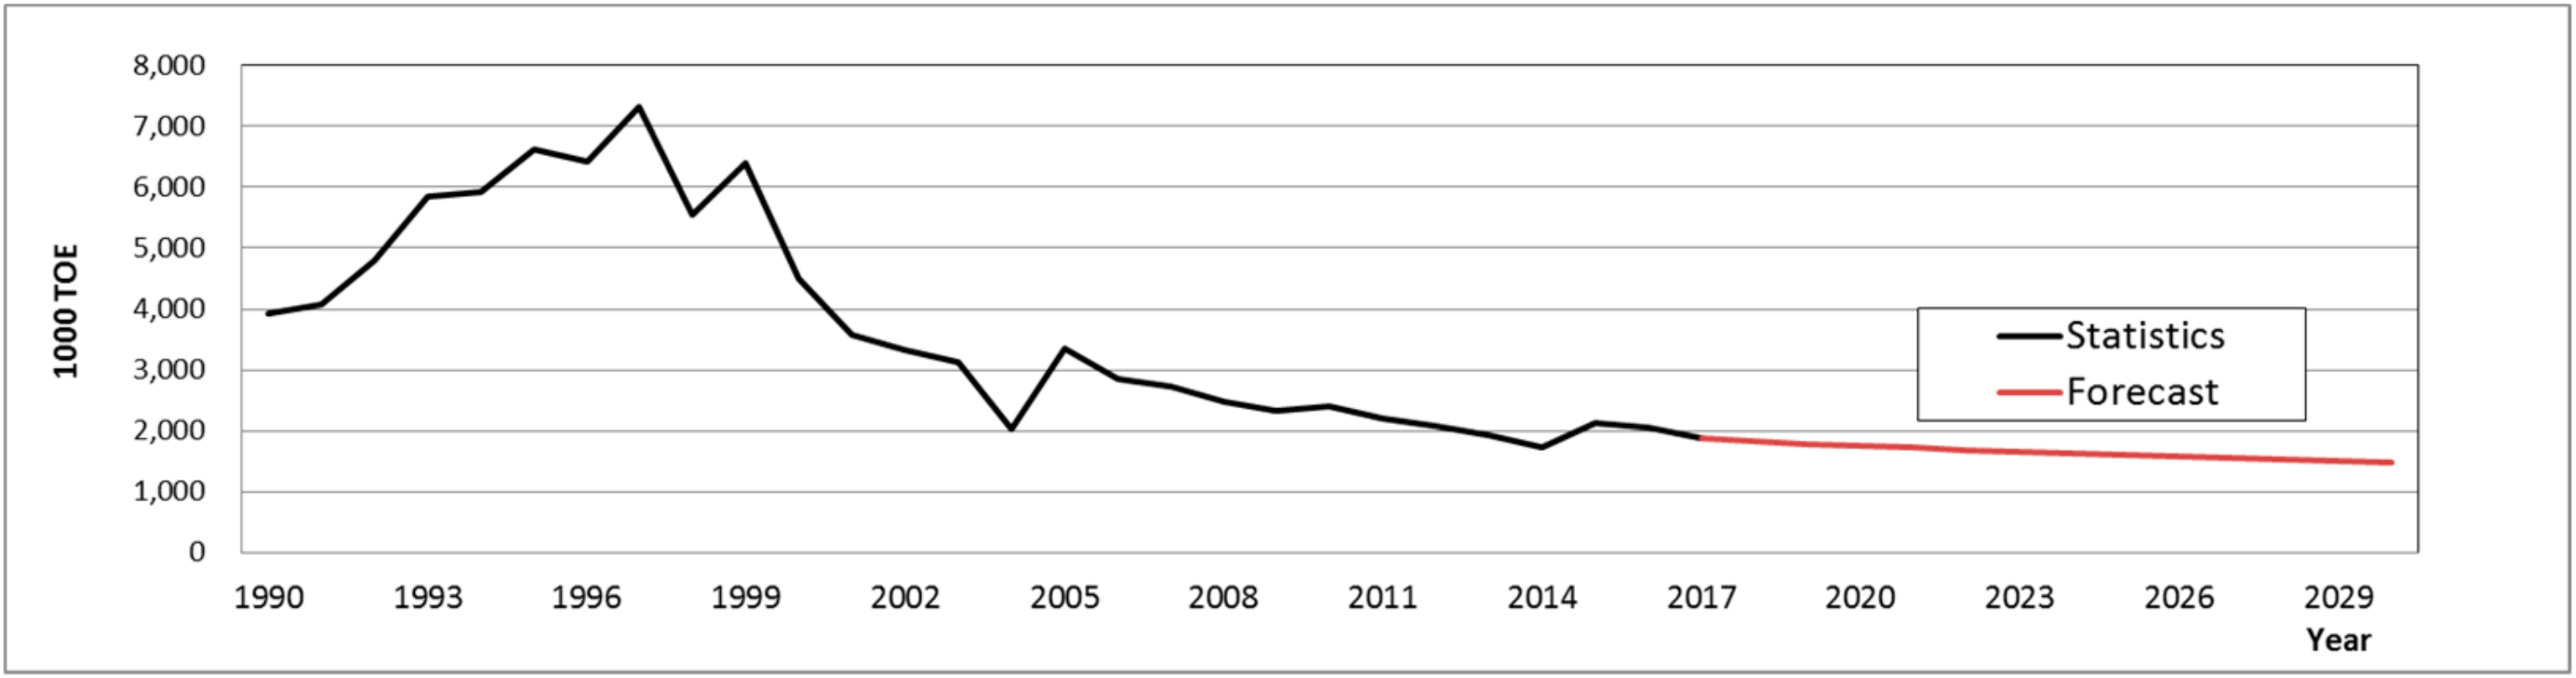
Figure 14.
City gas energy and forecast result.

Figure 15.
Electricity energy and forecast result.

Figure 16.
Heat energy and forecast result.
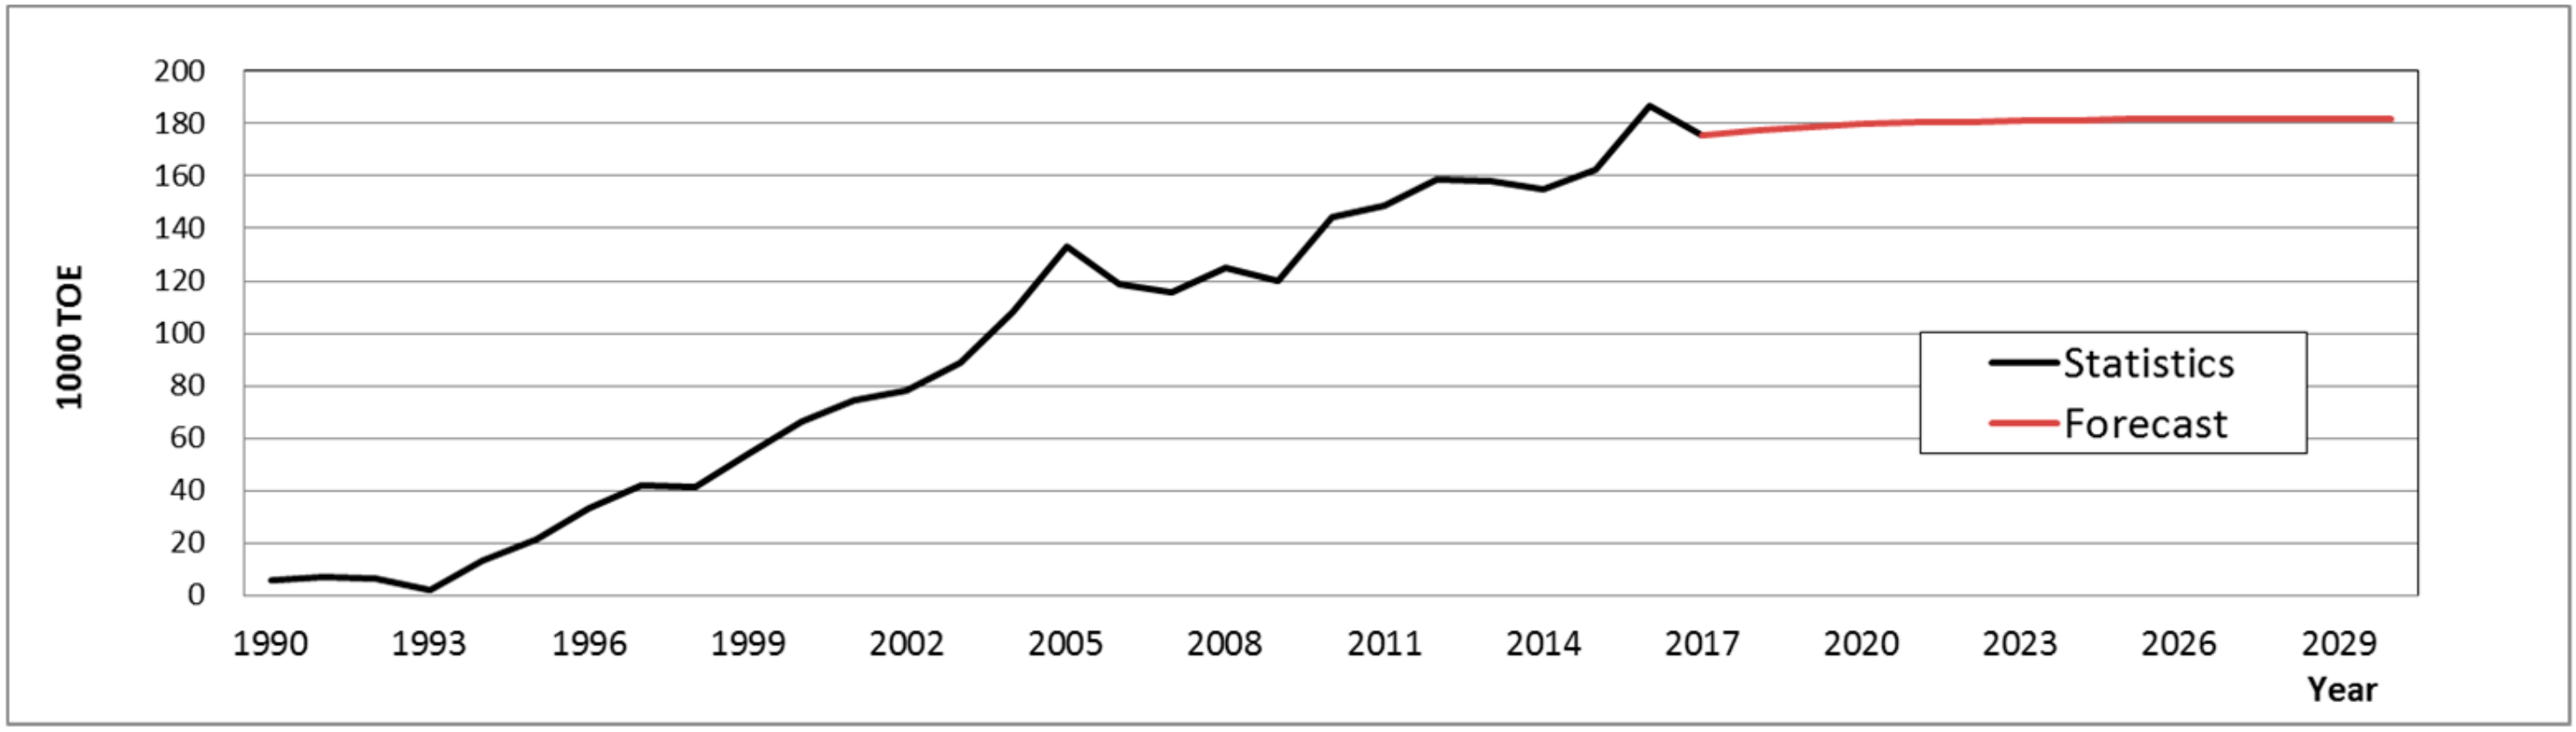
Figure 17.
Renewable energy and forecast result.

Table 1.
Comparison and analysis of energy statistics.
| Division | Year Book of Energy Statistics | Energy Consumption Survey |
|---|---|---|
| Time of publication | Every year | Every three years |
| Survey method | Monthly production and sales results Based on inputs | Combination of self-enumeration method and interviewing method for samples |
| Purpose of use | Total energy consumptions (Top-down) | Proportions by building use and energy source (Bottom-up) |
| Advantages | Total energy consumption of commercial buildings High reliability | Statistics by energy source can be used |
| Disadvantages | No statistics by energy source | Low reliability of total energy consumption data |
Table 2.
List of statistics for energy demand forecast.
| Category | Contents |
|---|---|
| Population | Yearly statistical and forecast data for 1990–2030 Annual average growth rate 0.53% (1990–2030) |
| GDP | Yearly statistical and forecast data for 1990–2030 Annual average growth rate 3.34% (1990–2030) |
| Floor Area | Statistical data for 1970–2017 Annual average growth rate 6.76% (1970–2017) |
| Heating/Cooling day | Statistical data for 1970–2017 Not forecast |
| Energy Price | Yearly statistical and forecast data for 1990–2030 Annual average growth rate 4.54% (1990–2030) |
Table 3.
Floor area forecast result.
| Year | 2015 | 2018 | 2020 | 2025 | 2030 | Annual Increase (2019–2030) |
|---|---|---|---|---|---|---|
| Floor Area (million m2) | 1048 | 1088 | 1092 | 1168 | 1231 | 0.91% |
Table 4.
Petroleum energy forecast result.
| Year | 2015 | 2018 | 2020 | 2025 | 2030 | Annual Increase (2019–2030) |
|---|---|---|---|---|---|---|
| Energy (1000 toe) | 2127 | 1829 | 1754 | 1601 | 1482 | −1.7% |
Table 5.
Petroleum energy forecast result.
| Year | 2015 | 2018 | 2020 | 2025 | 2030 | Annual Increase (2019–2030) |
|---|---|---|---|---|---|---|
| Energy (1000 toe) | 3469 | 3971 | 4013 | 4110 | 4157 | 0.4% |
Table 6.
Electricity energy forecast result.
| Year | 2015 | 2018 | 2020 | 2025 | 2030 | Annual Increase (2019–2030) |
|---|---|---|---|---|---|---|
| Energy (1000 toe) | 10,533 | 11,480 | 12,112 | 13,504 | 14,627 | 2.1% |
Table 7.
Heat energy forecast result.
| Year | 2015 | 2018 | 2020 | 2025 | 2030 | Annual Increase (2019–2030) |
|---|---|---|---|---|---|---|
| Energy (1000 toe) | 163 | 177 | 180 | 182 | 182 | 0.2% |
Table 8.
Renewables energy forecast result.
| Year | 2015 | 2018 | 2020 | 2025 | 2030 | Annual Increase (2019–2030) |
|---|---|---|---|---|---|---|
| Energy (1000 toe) | 174 | 185 | 199 | 213 | 225 | 1.3% |
Table 9.
Total energy demand.
| Year | Energy (1000 toe) | ||||
|---|---|---|---|---|---|
| Petroleum | City Gas | Electricity | Heat | Renewables | |
| 2019 | 1790 | 3992 | 11,798 | 179 | 195 |
| 2020 | 1754 | 4013 | 12,112 | 180 | 199 |
| 2021 | 1720 | 4033 | 12,428 | 180 | 202 |
| 2022 | 1688 | 4053 | 12,711 | 181 | 205 |
| 2023 | 1657 | 4072 | 12,985 | 181 | 208 |
| 2024 | 1628 | 4091 | 13,248 | 181 | 211 |
| 2025 | 1601 | 4110 | 13,504 | 182 | 213 |
| 2026 | 1575 | 4120 | 13,752 | 182 | 216 |
| 2027 | 1550 | 4130 | 13,989 | 182 | 218 |
| 2028 | 1527 | 4139 | 14,208 | 182 | 221 |
| 2029 | 1504 | 4149 | 14,423 | 182 | 223 |
| 2030 | 1482 | 4157 | 14,627 | 182 | 225 |
| Annual Increase | −1.7% | 0.4% | 2.1% | 0.2% | 1.3% |
© 2019 by the authors. Licensee MDPI, Basel, Switzerland. This article is an open access article distributed under the terms and conditions of the Creative Commons Attribution (CC BY) license (http://creativecommons.org/licenses/by/4.0/).
Share and Cite
MDPI and ACS Style
Ha, S.; Tae, S.; Kim, R. Energy Demand Forecast Models for Commercial Buildings in South Korea. Energies 2019, 12, 2313. https://doi.org/10.3390/en12122313
AMA Style
Ha S, Tae S, Kim R. Energy Demand Forecast Models for Commercial Buildings in South Korea. Energies. 2019; 12(12):2313. https://doi.org/10.3390/en12122313
Chicago/Turabian StyleHa, Sungkyun, Sungho Tae, and Rakhyun Kim. 2019. "Energy Demand Forecast Models for Commercial Buildings in South Korea" Energies 12, no. 12: 2313. https://doi.org/10.3390/en12122313
Note that from the first issue of 2016, this journal uses article numbers instead of page numbers. See further details here.