CFD Modeling on Hydrodynamic Characteristics of Multiphase Counter-Current Flow in a Structured Packed Bed for Post-Combustion CO2 Capture


1
Key Laboratory of Coal-Based CO2 Capture and Geological Storage, China University of Mining and Technology, Xuzhou 221116, Jiangsu, China
2
School of Electrical and Power Engineering, China University of Mining and Technology, Xuzhou 221116, Jiangsu, China
3
Department of Mechanical Engineering, College of Engineering, University of Kentucky, Lexington, KY 40506, USA
4
Center for Applied Energy Research, University of Kentucky, Lexington, KY 40511, USA
*
Authors to whom correspondence should be addressed.
Energies 2018, 11(11), 3103; https://doi.org/10.3390/en11113103
Submission received: 28 September 2018
/
Revised: 26 October 2018
/
Accepted: 7 November 2018
/
Published: 9 November 2018
Abstract
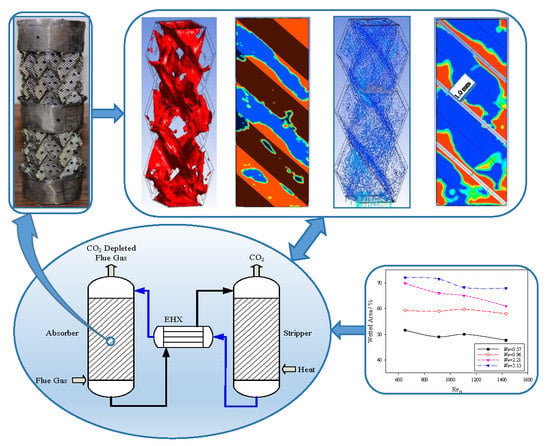
:Solvent-based post combustion CO2 capture is a promising technology for industrial application. Gas-liquid interfaces and interactions in the packed bed are considered one of the key factors affecting the overall CO2 absorption rate. Understanding the hydrodynamic characterizations within packed beds is essential to identify the appropriate enhanced mass transfer technique. However, multiphase counter-current flows in the structured packing typically used in these processes are complicated to visualize and optimize experimentally. In this paper, we aim to develop a comprehensive 3D multiphase, counter-current flow model to study the liquid/gas behavior on the surface of structured packing. The output from computational fluid dynamics (CFD) clearly visualized the hydrodynamic characterizations, such as the liquid distributions, wettability, and film thicknesses, in the confined packed bed. When the liquid We (Weber number) was greater than 2.21, the channel flow became insignificant and flow streams became more disorganized with more droplets at larger sizes. The portion of dead zones is decreased at higher liquid We, but it cannot be completely eliminated. Average film thickness was about 0.6–0.7 mm, however, its height varied significantly.
1. Introduction
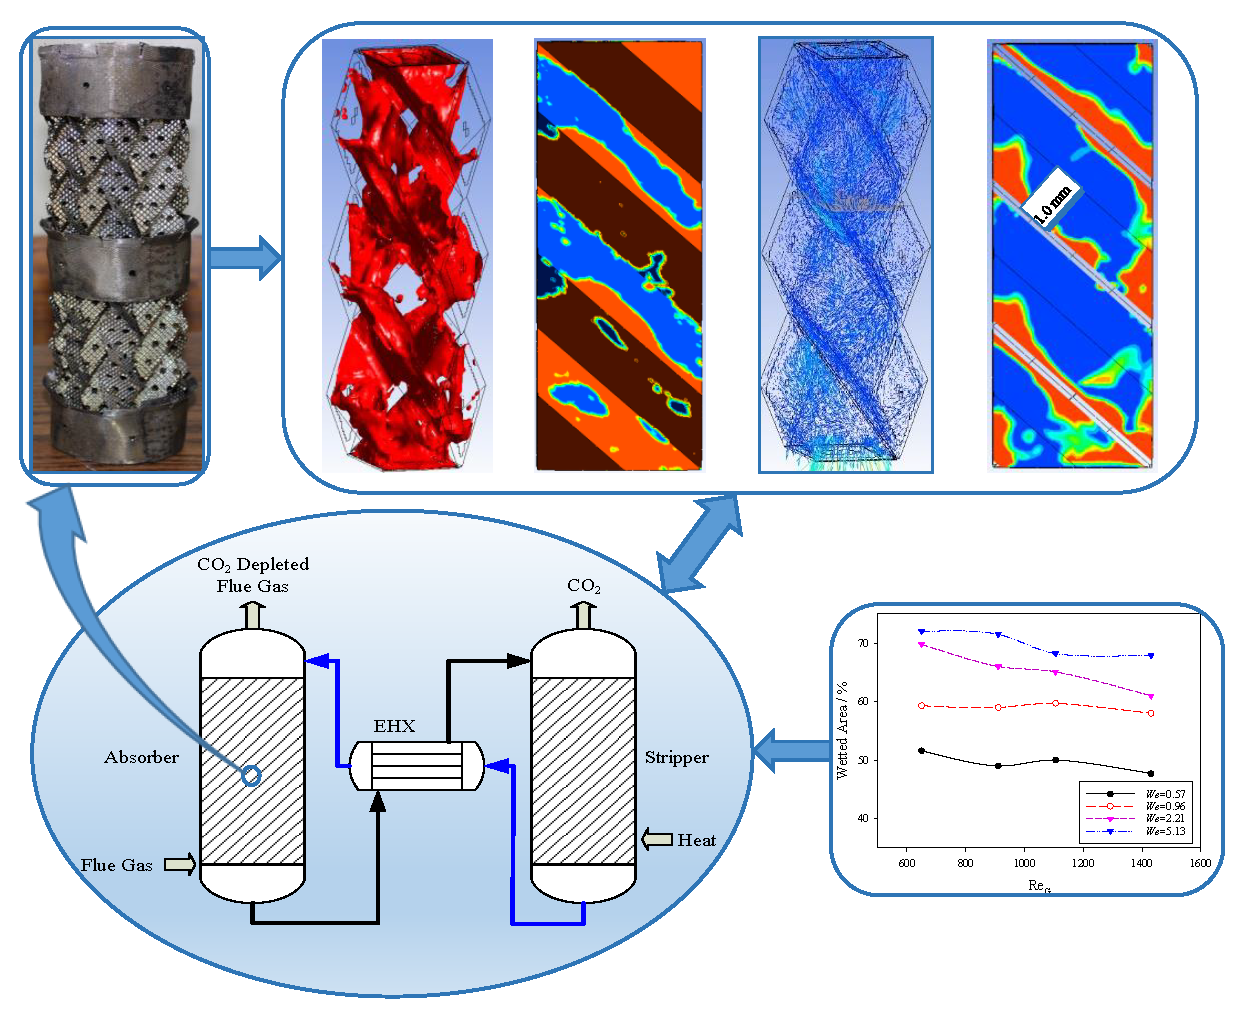
Scientific consensus exists that the primary driving mechanism for global warming is the global increases in atmospheric carbon dioxide (CO2) concentrations, which is attributed to the anthropogenic emissions from the use of fossil fuels, and the use of coal alone accounted for 43% of global CO2 emissions [1]. Post-combustion CO2 capture using solvent-based CO2 absorption technologies is one of the most promising approaches among the current CO2 capture technologies and may be implemented at the large-scale in power generation [2]. A schematic diagram of a solvent-based CO2 absorption process is presented in Figure 1. It includes an absorber, a stripper, and their necessary auxiliary equipment for an aqueous solvent circulating between the two reactors [3]. Both reactors typically use a packed bed to improve the mass transfer by providing an effective contact area between gas and liquid phase reactants [4] due to relatively slow reaction kinetics. The packing materials are in many different forms, but they can be generally divided into random and structured packing. The structured packing can provide a similar effective surface area but much less pressure drop compared to random packing, making it a good candidate for application in post-combustion CO2 capture processing, and is investigated herein [5].
The absorber is expected to be very large and could make up approximately 20% of the capital cost required for CO2 capture. For example, a CO2 absorber capable of handling 90% capture of CO2 from a 0.7 MWe power system would be approximately 19.5 m in height and have at least 13.7 m of structure packing [6,7]. Therefore, understanding the hydrodynamic characterizations within packed beds is of the essence, which will provide insights for gas/liquid mixing enhancement, channel flow prevention, and surface wettability estimation, and then develop techniques to enhance the mass transfer by intensifying the gas/liquid contact and mixing.
Extensive investigations on macro-scale performance have been performed on packed bed reactors over the years [8,9,10], however, the experimental study on micro-scale hydraulics on the packing surface is scarce. Because, experimentally, it is almost impossible to insert measuring devices to determine the wettability, gas/liquid contact interface, or fluid pattern due to limited available space. Alternatively, with applications of supercomputing, computational fluid dynamics (CFD) has become a possible tool for studying multiphase flows with complicated and relative large geometries [11,12]. Also, overall process performance and individual modifications can be easily evaluated, and test data can be better understood with the aid of such process modeling. Recently, researchers built a 3D numerical model to study the hydrodynamic characterizations, in which the geometry selected was mono-sized, spherical particles were arranged in a cylindrical container [13,14] or inclined or flat plates [15], and the flow was chosen for co-current, or counter-current gas-liquid flows. In contrast, CO2 absorption processes are typically two-phase counter-current unstable flow, and current simulations are insufficient to provide a clear understanding of the dependencies for their 3D hydrodynamics in structured packing. In order to reduce computing complexity, researchers [6,16] used a porous media zone to simulate structured packing. This method could provide certain information in the simulation and design of new geometries. However, it cannot precisely present the interactions between the two phases under counter-current flow. Thus, no information can be acquired to enhance the gas/liquid mixing. Table 1 lists representative CFD models in structured-packing bed hydrodynamic study.
A key approach missing for a 3D model to assess post combustion CO2 capture reactions is to build a true packing geometry instead of a porous media configuration, and consider the solvent properties along the packing length. In this study, a 3D CFD model will be built to understand the hydraulic characterizations in the structured bed, and to provide insights to estimate the surface wettability, prevent the channel flow, and identify the way to enhance the gas/liquid mixing. These results expand the CFD model for efficient industrial application.
2. Computational Model
2.1. Governing Equations
The multi-fluid CFD volume of fluid (VOF) model is applied in this work. It has been considered as suitable to describe the flow characterization, especially for simulating liquid break-up and the interaction of two phases, and has been successfully implemented in other applications [23,24]. It is a surface-tracking technique developed for two or more immiscible fluids where the position of the interface between the fluids is of interest [22]. In the model, a single set of momentum equations is shared by the fluids, and the volume fraction of each fluid in each computational cell is tracked throughout the domain. By solving the governing equations, the phasic volume fraction, a concept describing the volume fraction of gas and liquid, can be determined [25]. The governing equations of the two-phase flow are given as:
Continuity equation
Momentum equation
where , is the interface drag force.
Each phase’s volume fraction is where:
For a two-phase system:
where ranges from 0 to 1; a zero corresponds to a cell filled with the gas phase and a value of one corresponds to a celled filled with the liquid phase. Also, surface tension was represented by the drag force term in Equation (2), and the surface tension model [26] is governed by:
where k is the free surface curvature, which is defined as
The symbol is a unit normal vector, and n = .
2.2. Geometry
In this manuscript, the Mellapak 250 Y (Sulzer) is selected due to its thorough characterization by many research groups [27]. It is the most popular packing type for various solvents, which has been quoted frequently within the literature on CO2 absorber processes [28]; the number 250 in its designation indicates a specific surface area of 250 m2 m−3 and the symbol Y means a surface inclined angle of 45° relative to the flow direction. Mellapak 250 Y is made of corrugated metal sheets arranged side-by-side with opposing channel orientations, as illustrated in Figure 2a,b. To save computational time, one slice was chosen as the modeling geometry, thus, a “sandwich-like” packing was built, as shown in Figure 2c.
2.3. Meshing
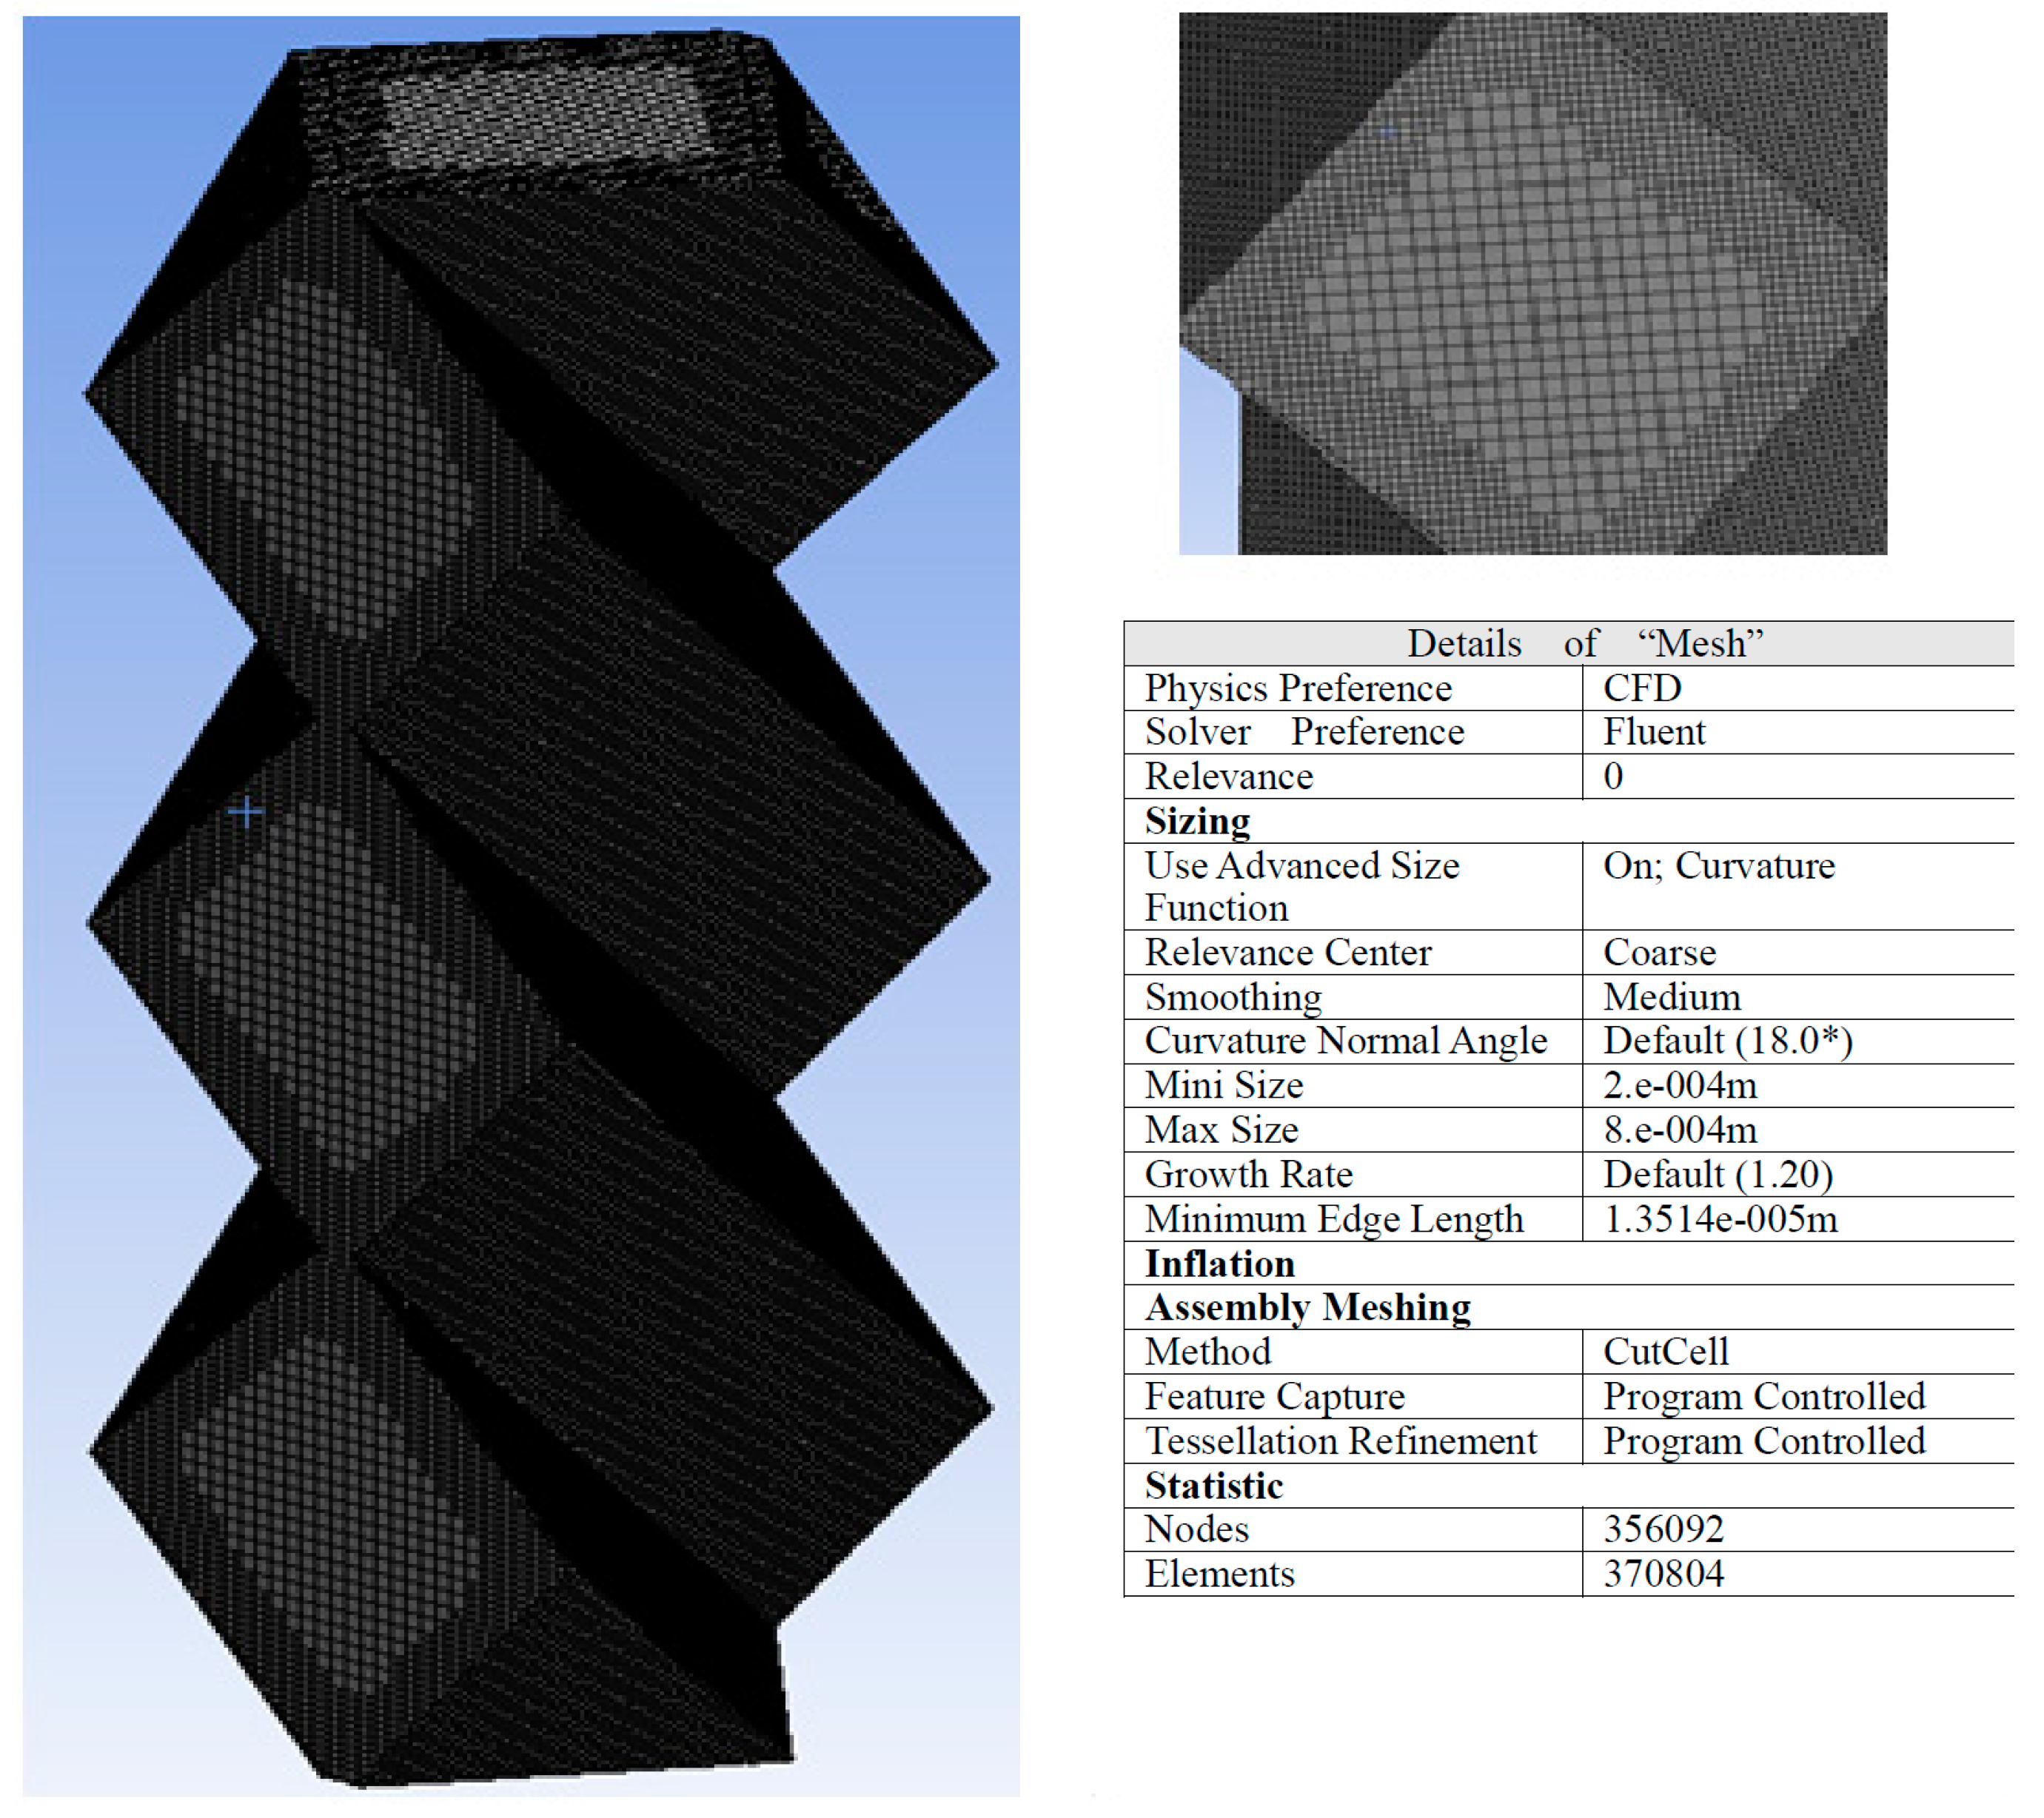
The mesh independent test was performed at the very beginning of the study. Three different cells of 320,486, 370,804, and 401,038 were applied and compared, and the mesh elements of greater than 320,486 yield similar pressure drops. Typically, larger number of meshes give more accurate results, with fine mesh close to solid surfaces for an accurate determination of the liquid-film thickness, and coarser away from these surfaces; the mesh elements for the study were finally changed to 370,804, as shown in Figure 3. Details of the mesh structure are also provided in Figure 3.
2.4. Turbulence Model
In packed bed flows, the value of Reynolds number, which is generally used to separate laminar or turbulent flows, is different with traditional macroscopic flows [29], in which for 1 < Re, the flow was dominated by viscous force; for 1 < Re < 150, the flow was a steady laminar inertial flow; for 150 ≤ Re, the flow was unsteady, chaotic, and qualitatively resembled turbulent flow. In this simulation process, with the range of flow at a minimum of 180 and maximum of 1100, this is turbulence flow. The LES (Large Eddy Simulation) turbulent model was applied, which is popular for use in turbulent flow simulations, and it emphasizes the interactions between phases [5].
The Reynolds number has been calculated as:
where the characteristic length d is the thickness of the phase inlet, is the density of the fluid (kg/m3), is its velocity (m/s), and is the viscosity (kg/m/s).
2.5. Boundary Conditions
In the simulation of flow parameters, the velocity-inlet condition was used, the volume fraction of liquid phase was set to 1, and the whole flow field was initially filled with air. To make counter-current flow, the liquid entered from the top and flowed out from the bottom, while gas entered from the bottom and flowed out from the top; to make the liquid continuously flow down the “sandwich-like” packed column, the side walls were set as symmetric boundaries. The schematic overview of flow directions is shown in Figure 4.
The Geo-Reconstruct algorithm method was used for interface reconstruction of the volume fraction, a simple scheme for the pressure-velocity coupling. For spatial discretization, the least squares cell-based method was used for the gradient in the spatial discretization set up, the PRESTO method was used for pressure, the second-order upwind method was used for the momentum equation, and the first-order implicit method was used for the transient formulation. The simulation used a transient state to observe the growth of the liquid film and the development of gas–liquid interactions. The time step size for this model was 0.00005 s while solving a maximum 30 iterations per time step. The total computation time for each case was close to 120 h. Table 2 shows the details of boundary conditions for the simulations.
3. Results and Discussion
3.1. Validation of Simulation Model
Liquid holdups and pressure drops from simulation and experiments for the packing bed were compared in Figure 5 and identify whether any parameters can be improved. Experimental values of liquid holdup and pressure drop were obtained by well-developed empirical models for a structured packing published by Stichlmair [30]; it is outlined by Equation (9) and has the Ergun equation [31] as its foundation after modification to account for the presence of a liquid.
where , is gas density, UG is gas velocity.
, in this type packing, , ,
Figure 5a,b show a comparison of gas phase pressure drops as obtained from the empirical model [30] and from the current CFD simulations. As can be seen, pressure drops from both the empirical model and the CFD simulation agreed quite well, increasing monotonically with increased liquid flow rates and gas flow rates.
An empirical relationship for predicting liquid holdup was developed by Billet [32]; it is expressed as:
where UL is the liquid velocity in m/s, is the specific surface area in m2 m−3, g is the gravity in m/s−2, and is the void fraction in %. Liquid holdups using the developed CFD model at low liquid flow rates and three different gas flow rates were compared to this empirical equation as presented in Figure 6 and show that different gas flow rates had only a very weak effect on liquid holdup, a result consistent with data from the empirical model. Such a weak dependency on gas flow rates may be a result of the liquid film becoming thinner as the gas flow rates were increased. As a consequence of the agreement between the 3D simulations and empirical model results, the CFD model for structured packing was considered validated.
3.2. Liquid Distribution and Surface Wettability
Liquid distributions and their evolution as a function of liquid flow rates were studied. From Figure 7, an interface between the fluids was successfully demonstrated, and especially when strongly curved surfaces are present Weber numbers (We), which are a measure of the relative importance of a fluid’s inertia compared to its surface tension, were used as the variable of interest rather than the liquid or gas flow rates [33]. The We number is expressed as:
where is the density of the fluid (kg/m3), is the fluid velocity (m/s), is its characteristic length—typically the droplet diameter (m), and is the surface tension (N/m) of the liquid.
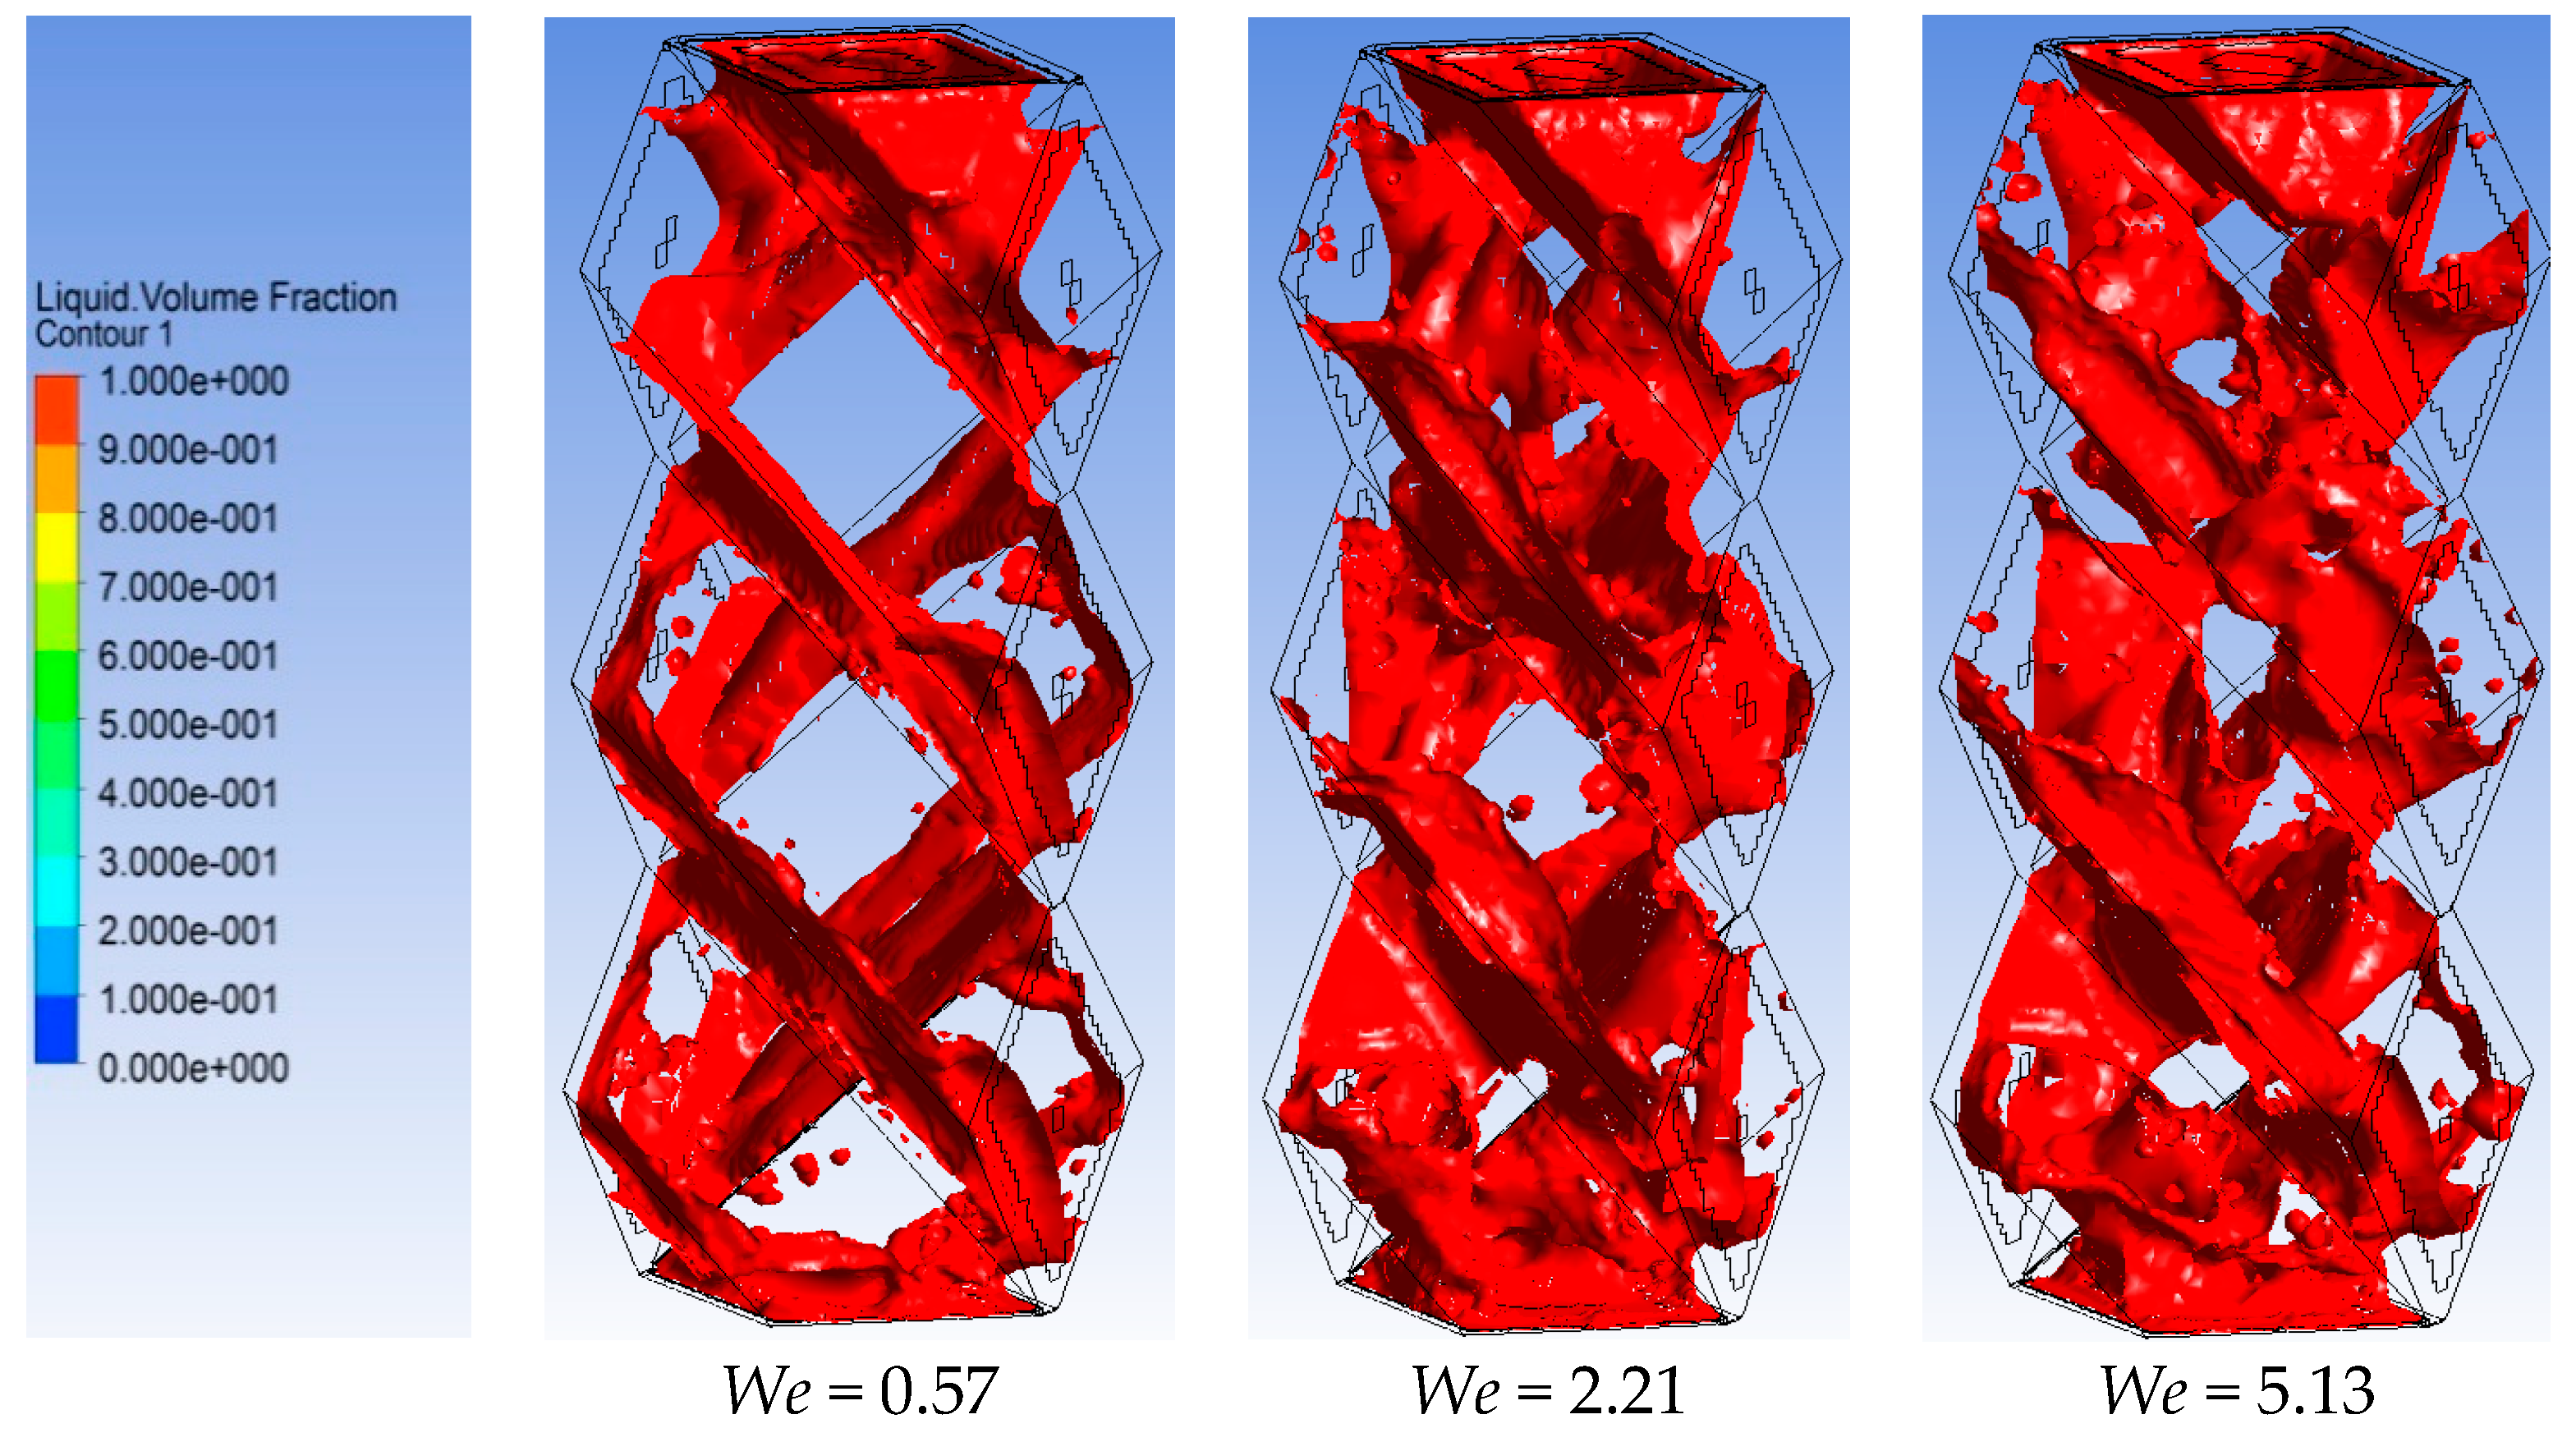
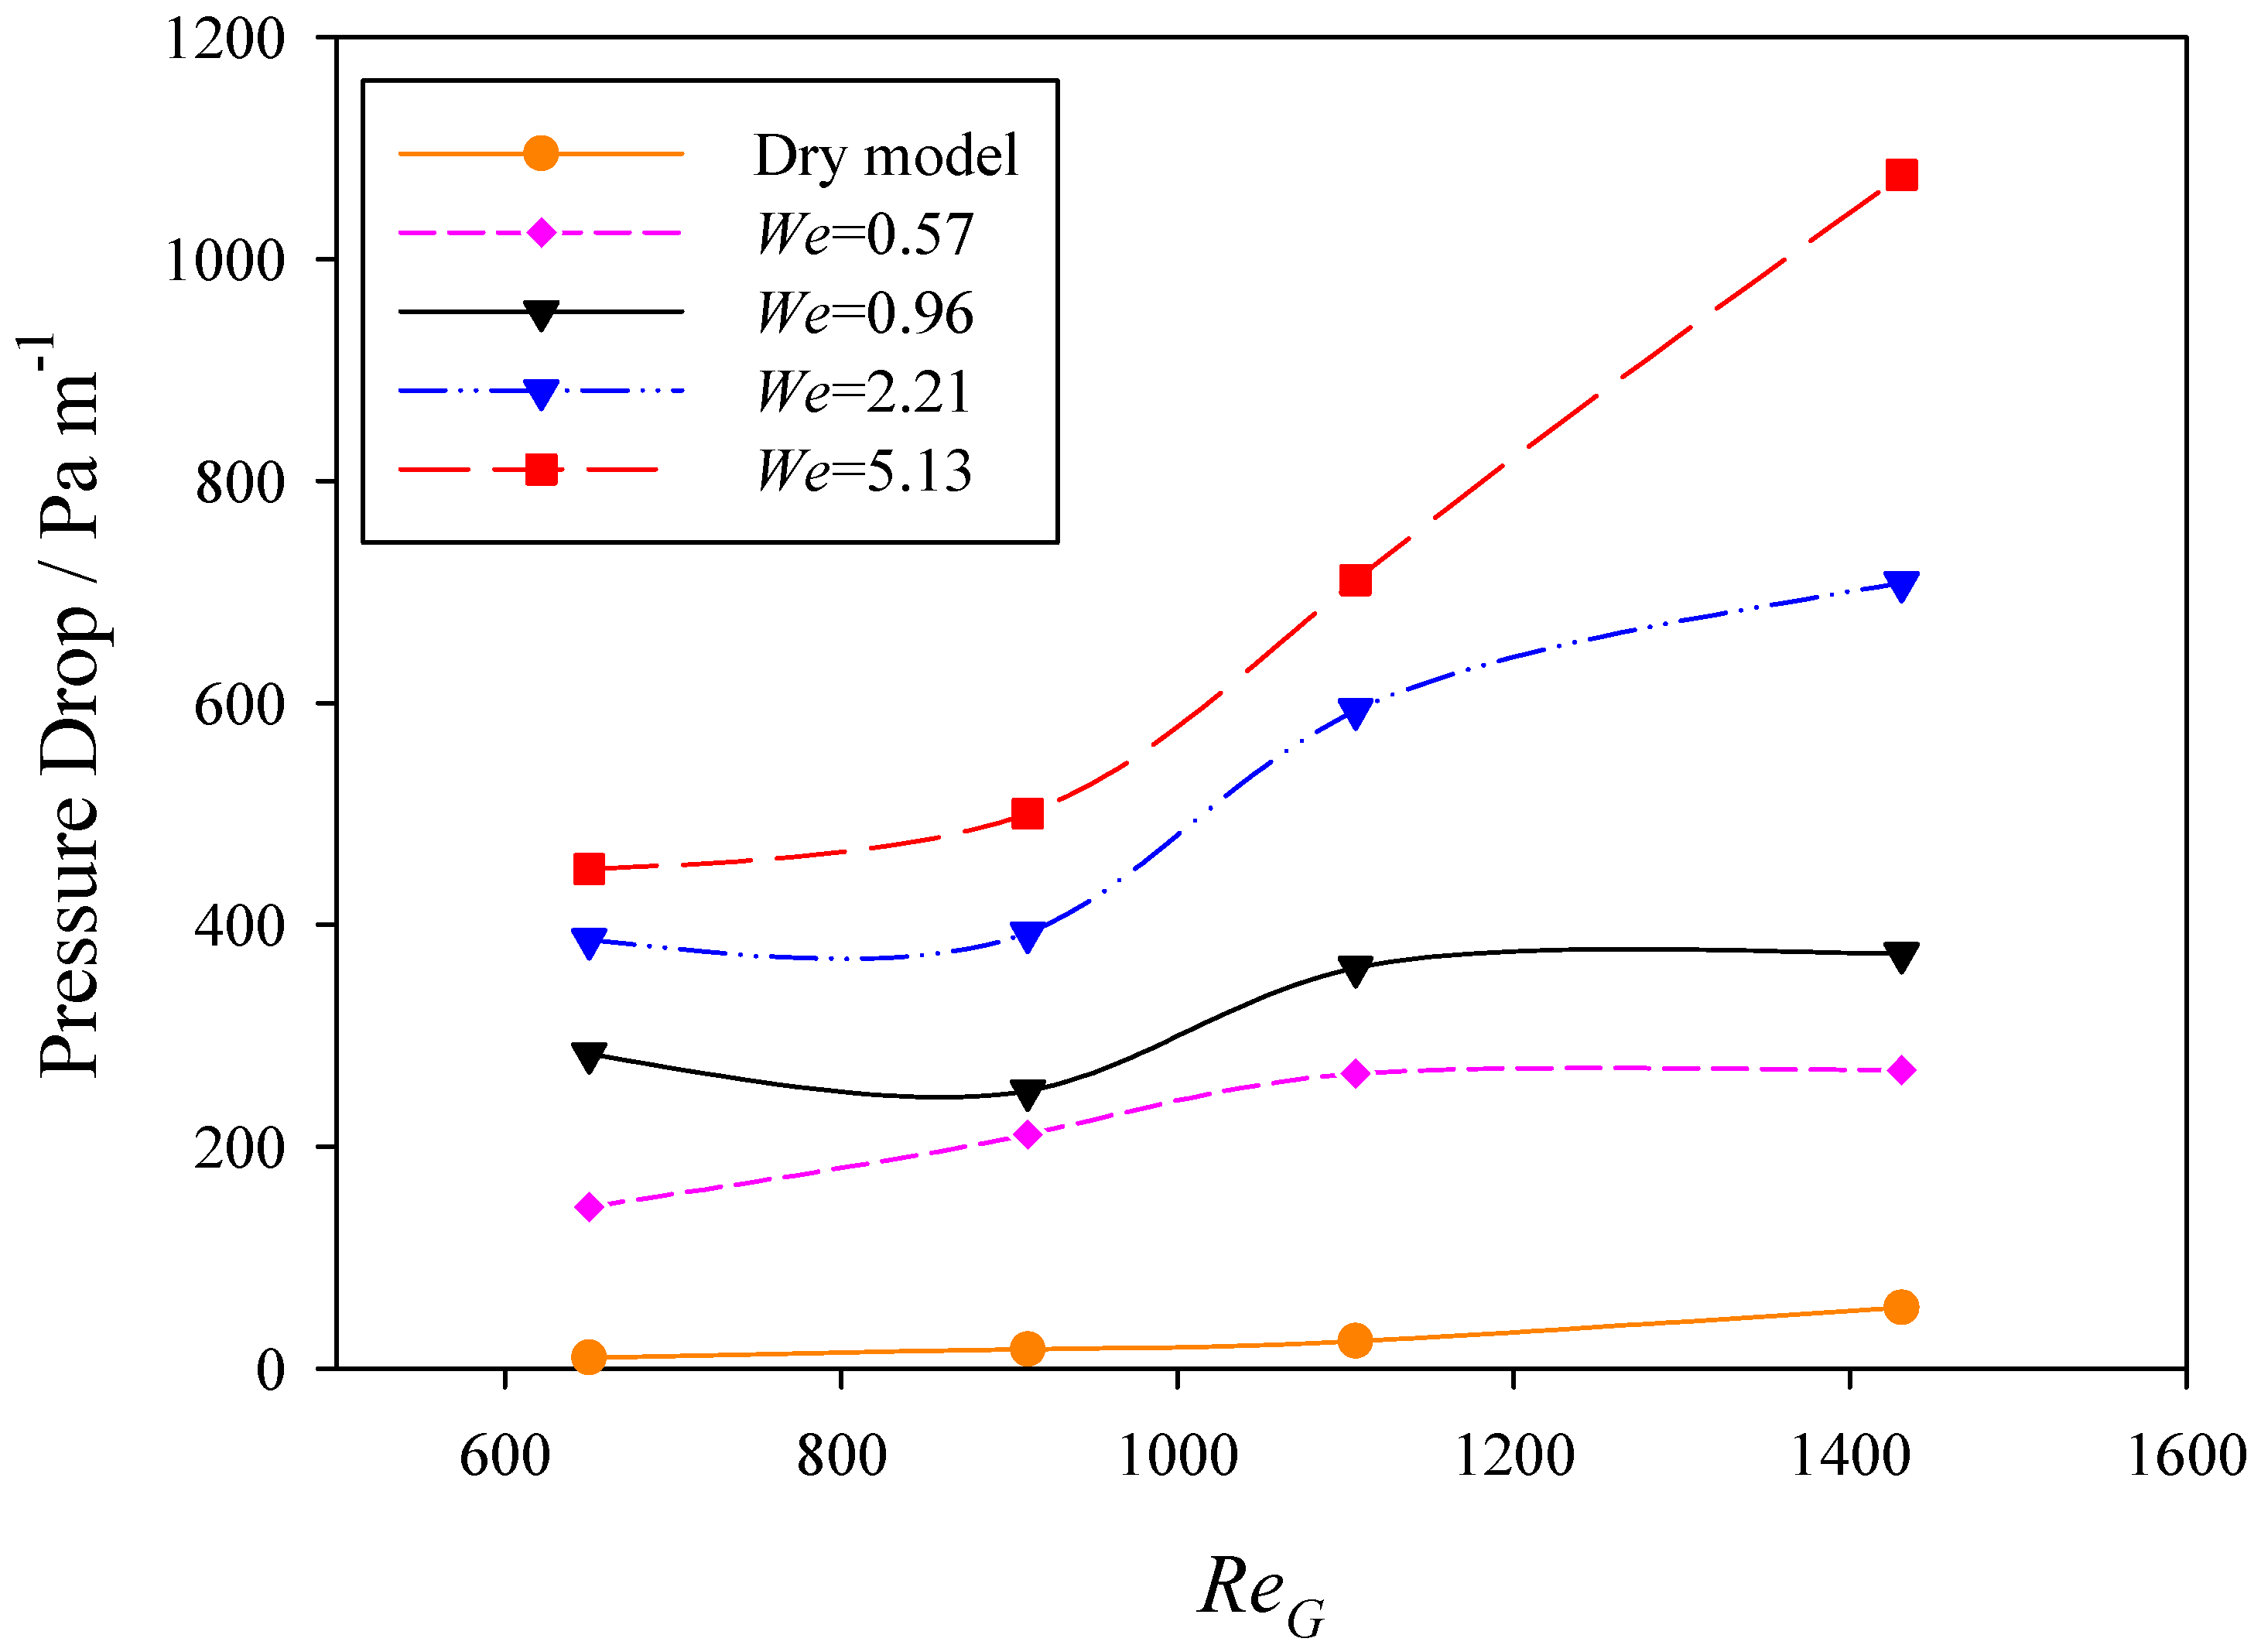
Three computing outputs were obtained when steady state is achieved at three We numbers. The scale bar on the left shows that a red color represents 100 vol. % liquid and a blue color represents 100 vol. % gas. Since the side walls were set as symmetrized segments, the flow is shown in a rotated orientation and the liquid is shown to continuously flow down the packing surface following a “Z” shape. At low liquid We numbers (e.g., low liquid flow rate), i.e., We = 0.57, the liquid flow seemed like a channel flow, and indicated that the packing surface is wetted but interface between liquid and gas is stable. With the increase in liquid We to 2.21, when the inertial forces began to dominate over surface tension, flow streams became more disorganized with more droplets (segment from bulk stream) with larger sizes, indicating an instable and turbulent interaction between gas and liquid, which could benefit channel flow prevention and intensify the gas/liquid mixing to boost the CO2 capture mass transfer. Further increasing We to 5.13, the flow pattern did not change too much besides increasing the liquid fraction in the packing space compared to We = 2.21, resulting in higher pressure drop which kept on increasing with the increase of gas velocity at this condition, as shown in Figure 8, and implied the potential flooding as demonstrated by the packing operating curve obtained experimentally.
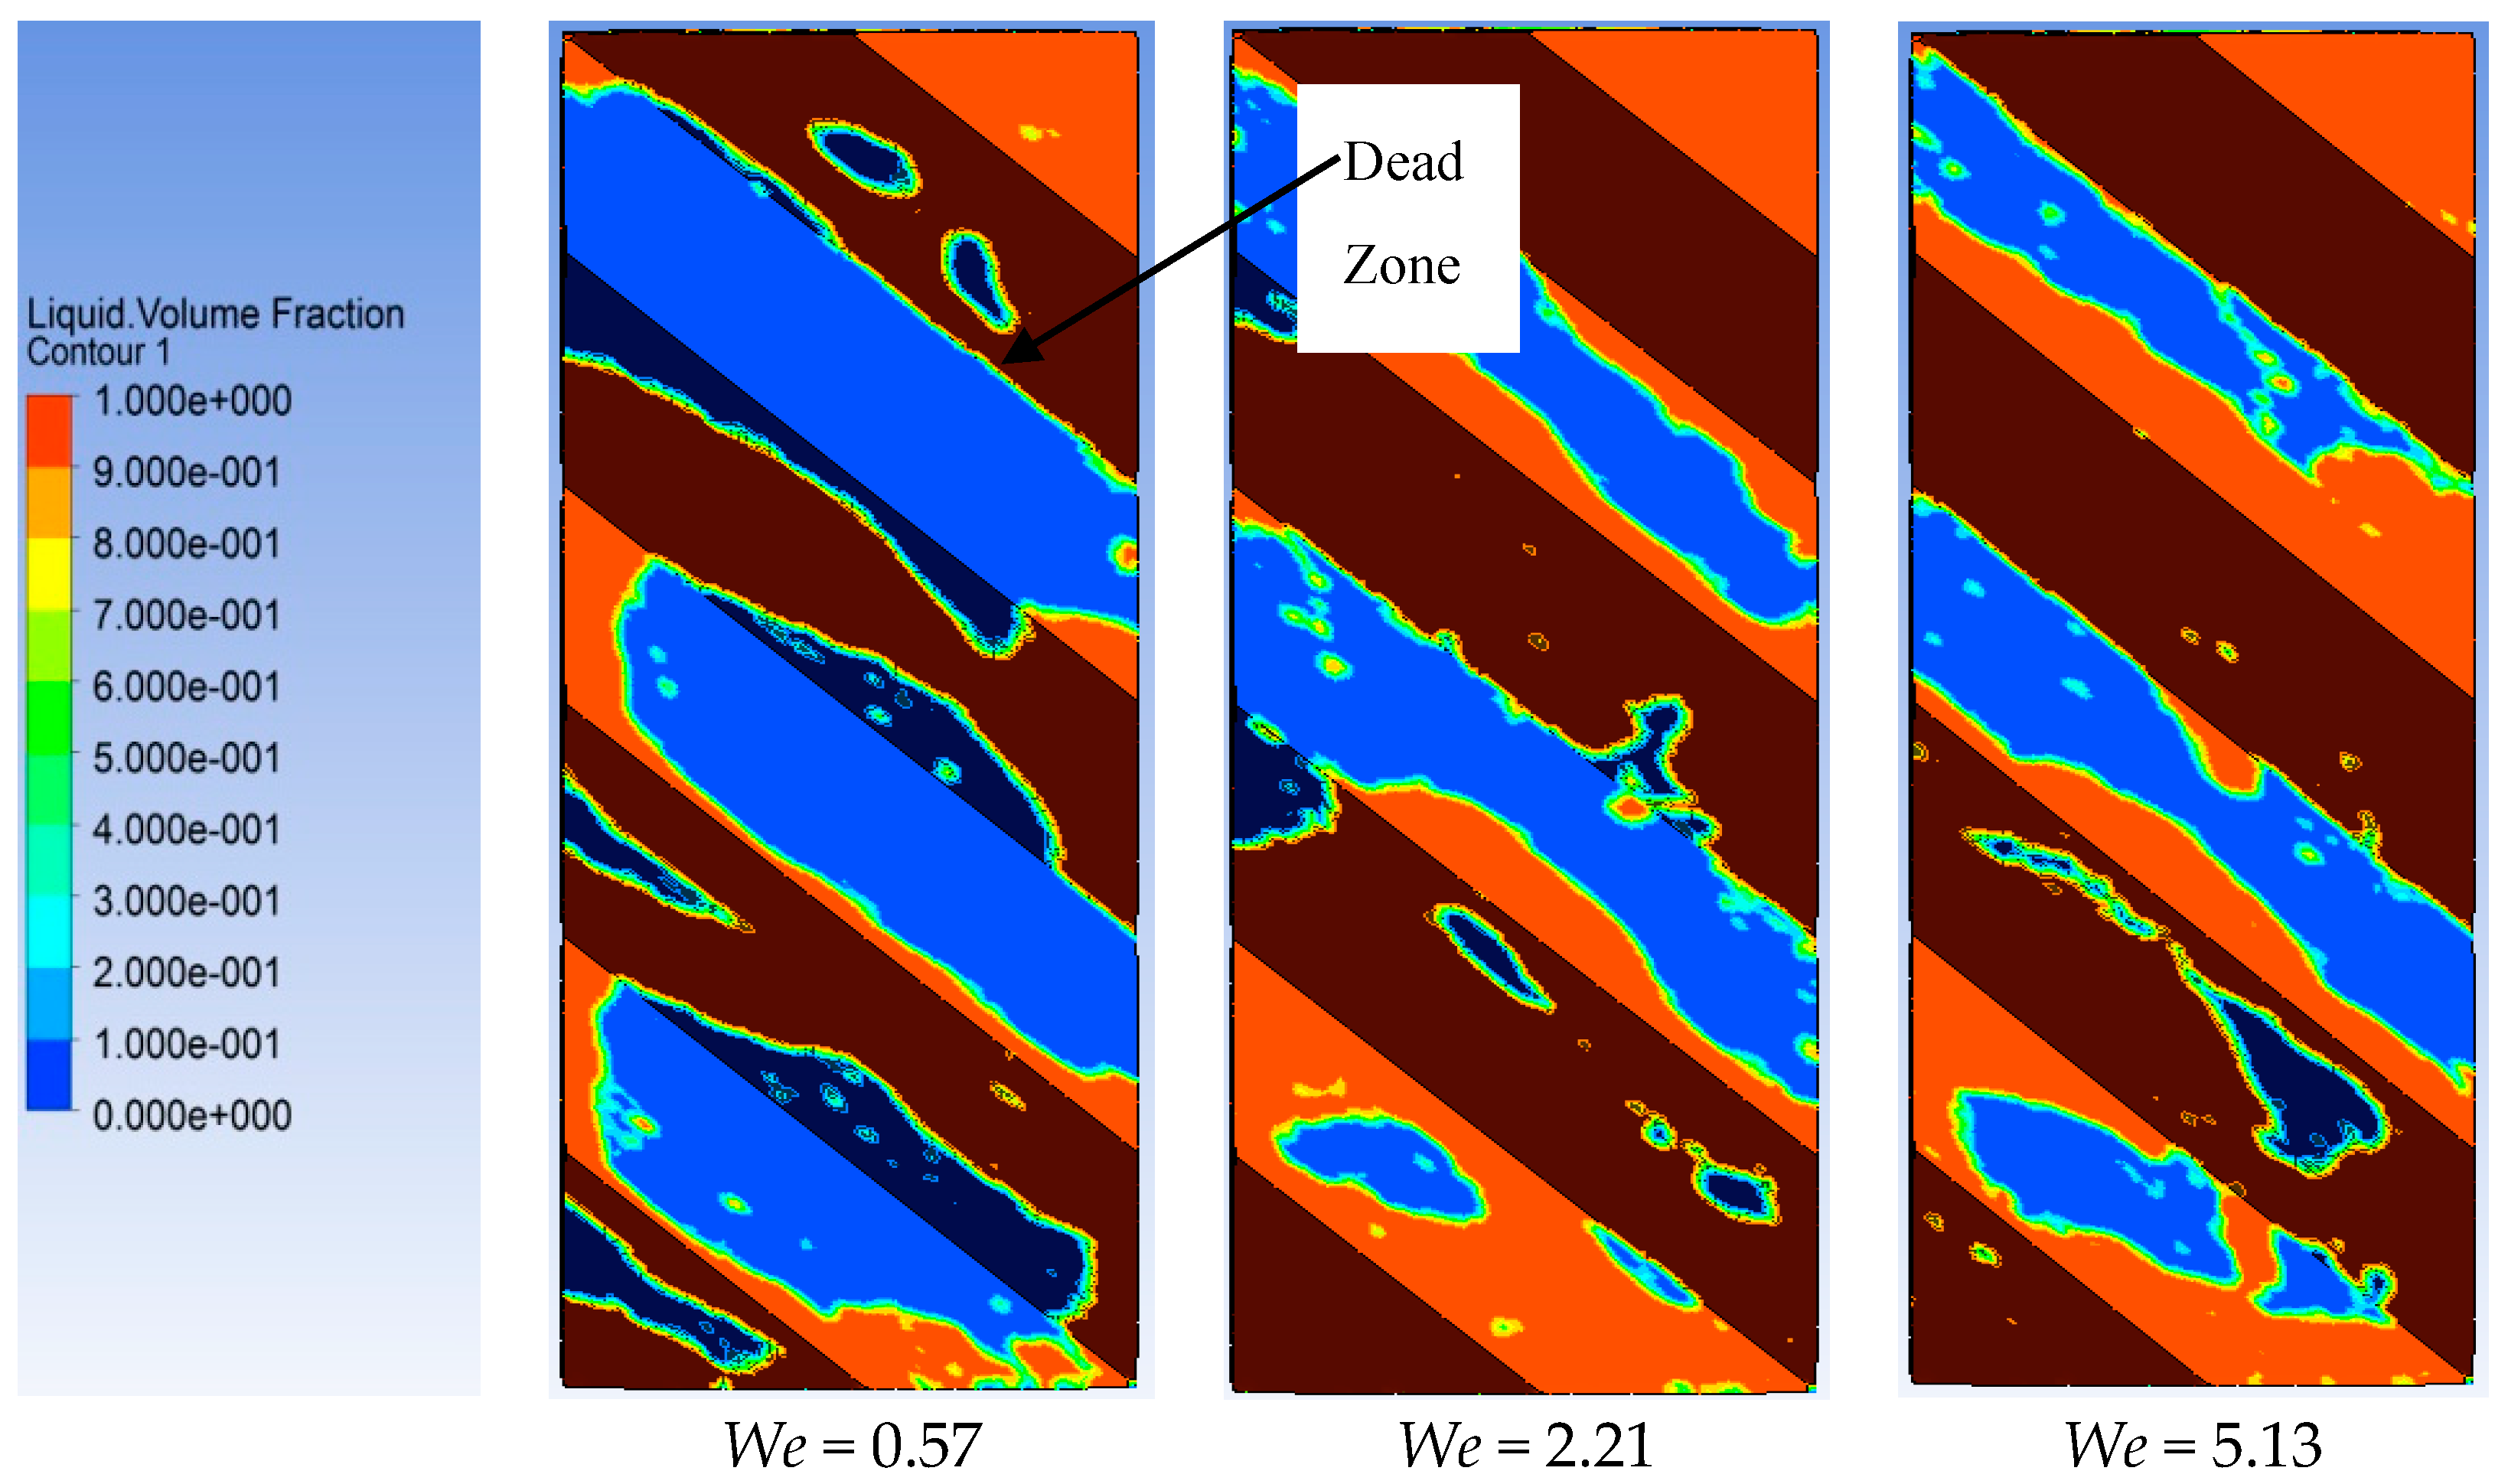
Figure 9 and Figure 10 show the wettability at different liquid We numbers from 0.57 to 5.13. At We = 0.57, the surface of the packing was only partially wetted. Another phenomenon observed was that droplets began to appear near the main flow stream, although the droplet sizes were relatively small. The possible droplet formation mechanisms will be discussed later. Increasing the liquid We number, the coverage of the wetted surface increased significantly. However, the surface was not fully wetted even at We = 5.13, which matches the experimental finding—approximately 60–70% of the surface wetted. Those dry surfaces could be referred to as dead zones; in general, as liquid We values increased, the dead zones on the packing surfaces decreased but were not completely eliminated at any We values tested.
Interestingly, increasing the gas flow rates only slightly lowered the wetted area at any particular liquid flow rate, which could indicate the lack of impact of the drag force of the gas stream on liquid distribution and fluid. Considering the phenomenon in Figure 7 and Figure 9, at high gas flow rates, it can be anticipated that strong gas–liquid interactions may occur in the structured packing which will increase the mixing of gas and liquid because the curved edges and flow channels help create conditions conducive for gas–liquid interactions; this occurrence may then also lead to the generation of more liquid droplets which can cause decreases in the wetted areas as is observed in Figure 10.
3.3. Formation of Droplets
Figure 11 shows the development of droplets when ReG = 1431 and We = 5.13. At t = 0.011 s, the liquid reached the packing surface and flowed along its 45° trajectory. At t = 0.058 s, the liquid wetted the first element and began to flow onto the second element. Several droplets are seen to have been formed at t = 0.058 s at the frontier of the flow stream and turning point of the two packing elements; the area of the neck is smaller than above or below it and, as a consequence, the gas flow velocity is higher in the neck. By t = 0.134 s, the second element had been wetted, and by t = 0.232 s the liquid had flowed throughout the whole domain; droplets can be found in every element region by t = 0.232 s.
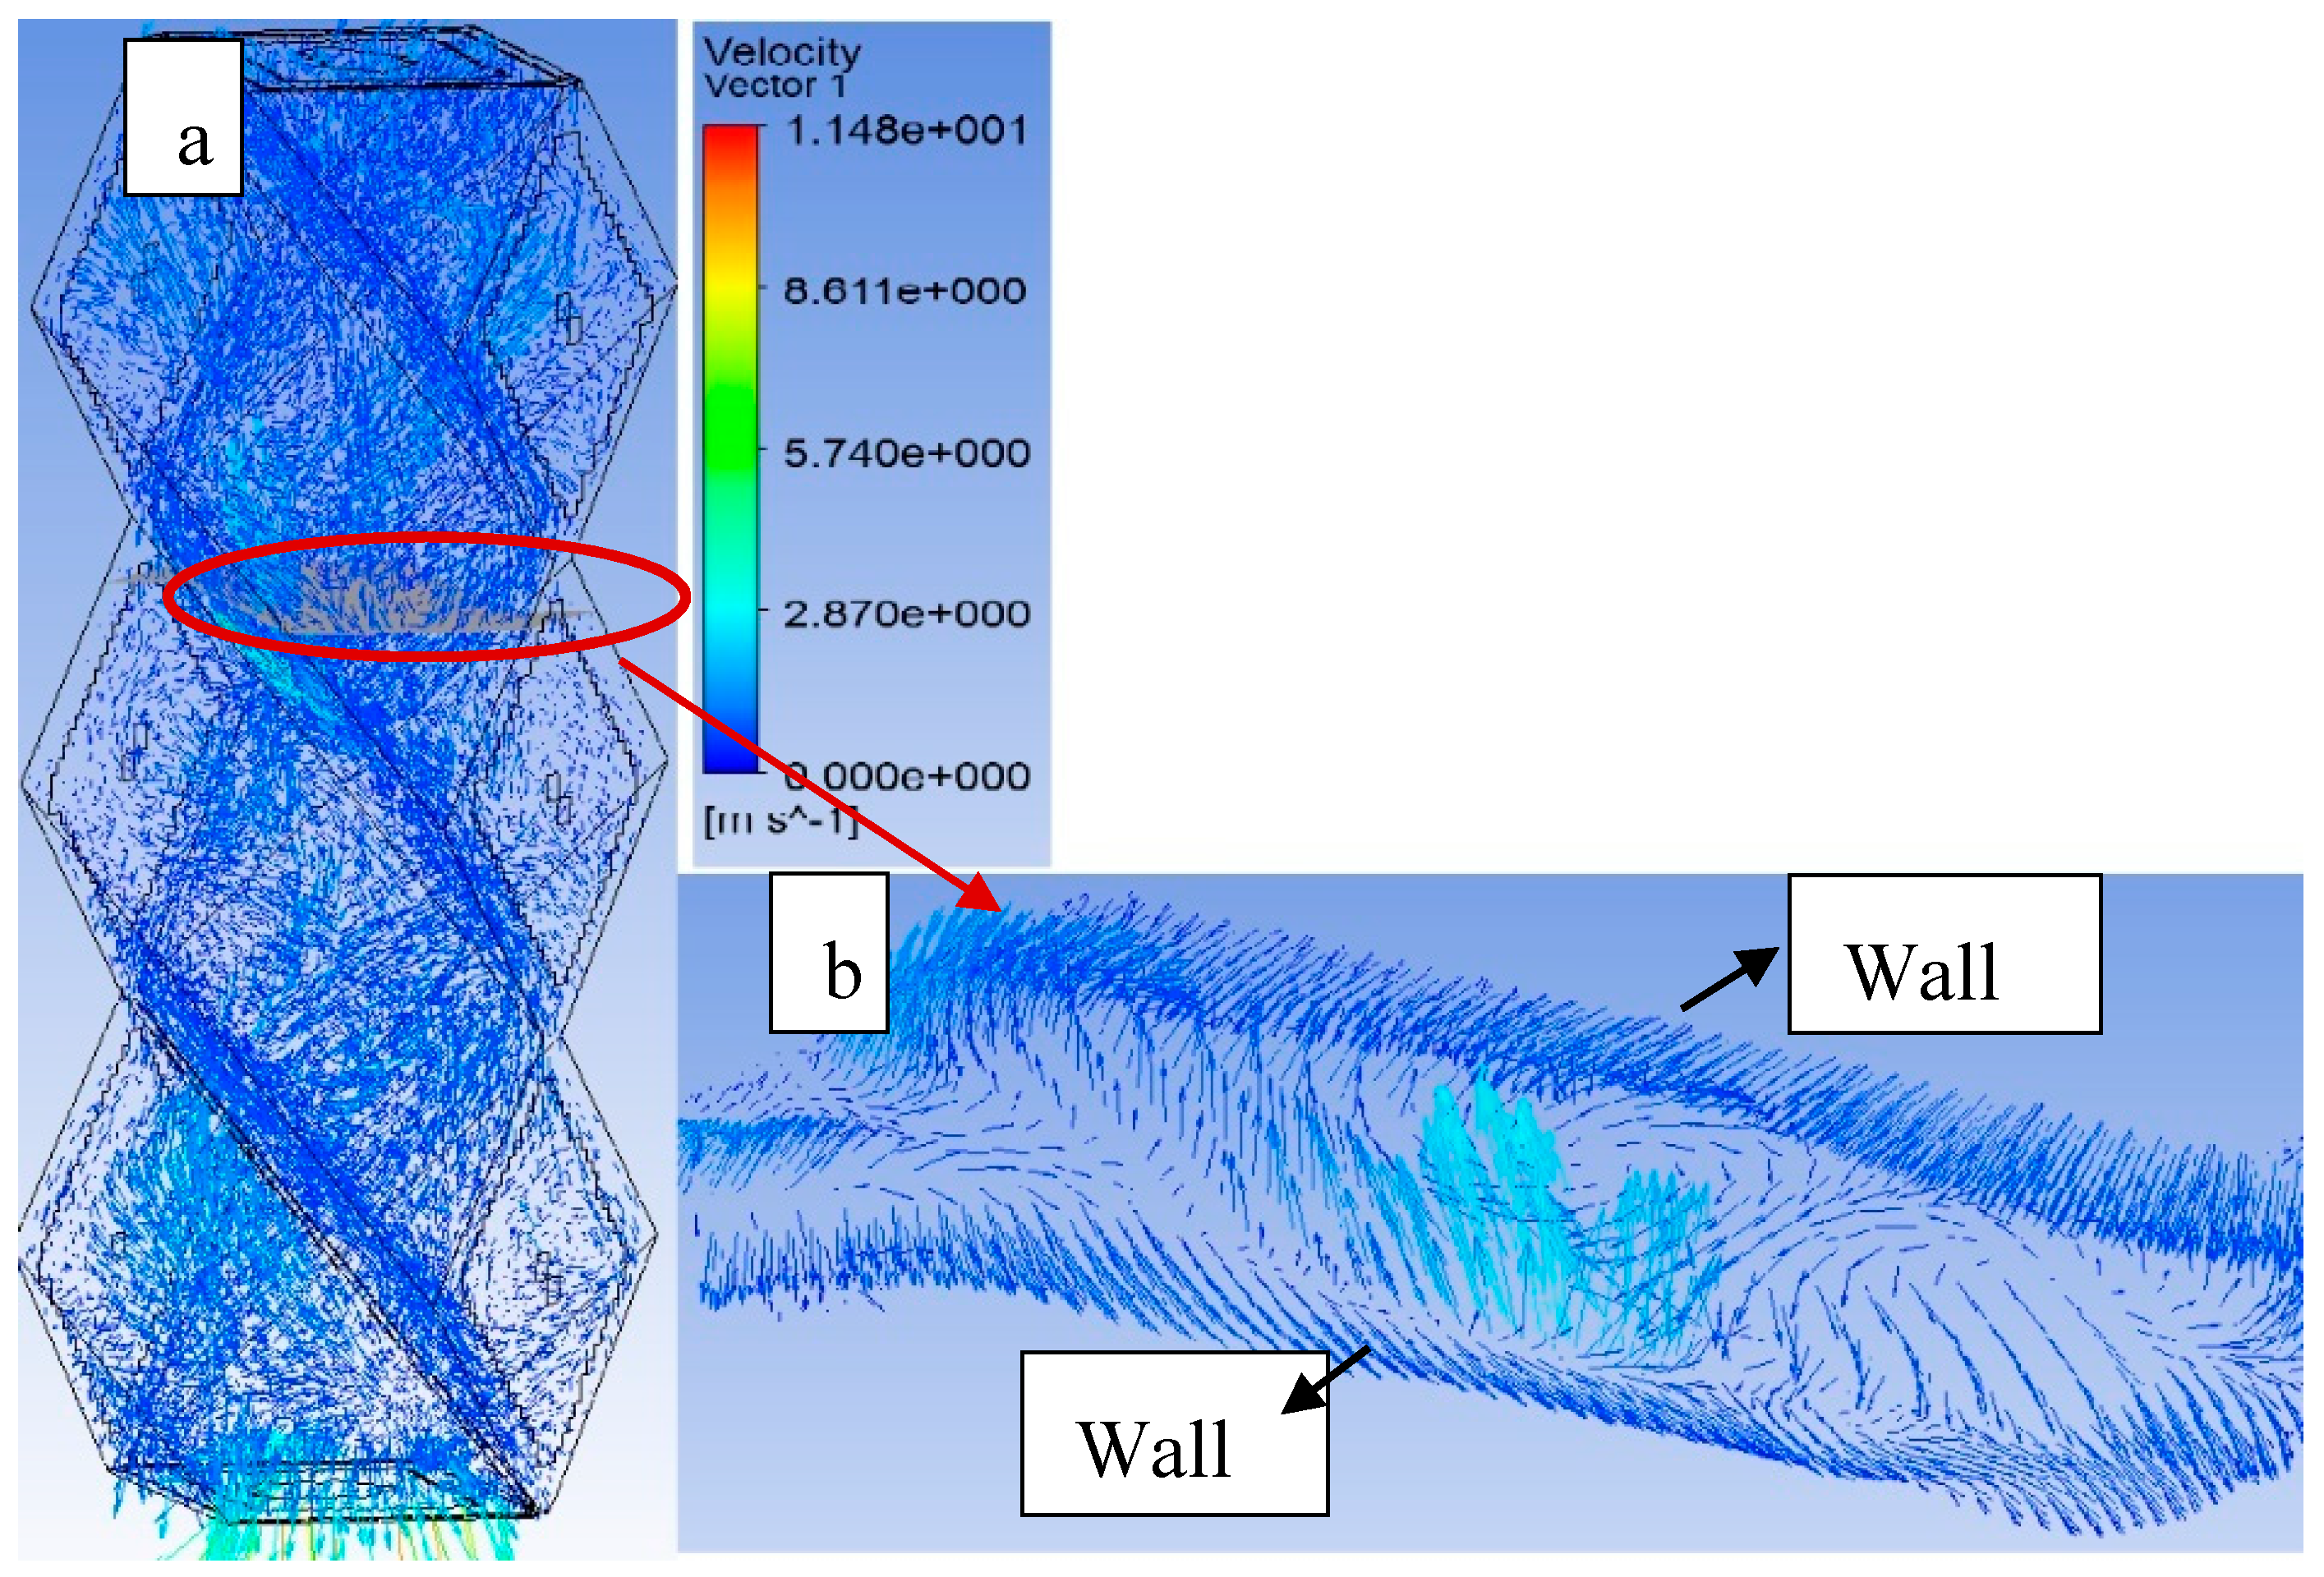
Gas and liquid velocity vectors were also monitored to provide insight into gas–liquid interactions in the packed bed, as shown in Figure 12. Downward pointing arrows associate with the direction and velocities of liquid flows, and upward pointing arrows associate with the direction and velocities of gas flows. The gas phase always had higher velocity than the liquid phase and, in general, the liquid flowed along the surface of the packing. However, at turning areas between the sections, the gas and liquid velocity vectors were not parallel to the packing channels. Rather, the gas velocities were shifted away from being parallel to the channels, flowing upwards instead of downwards, and this shift disturbed the liquid flow. Reversed gas flow velocity along with the increased gas velocities in the neck areas can more readily cause the formation of droplets. As droplets develop, the intimacy of gas–liquid interactions increases. Thereby this type of structured packing will also increase the interaction of gas and liquid. Furthermore, the disturbed liquid flow may lead to a less uniform distribution of film thickness.
3.4. Film Thickness
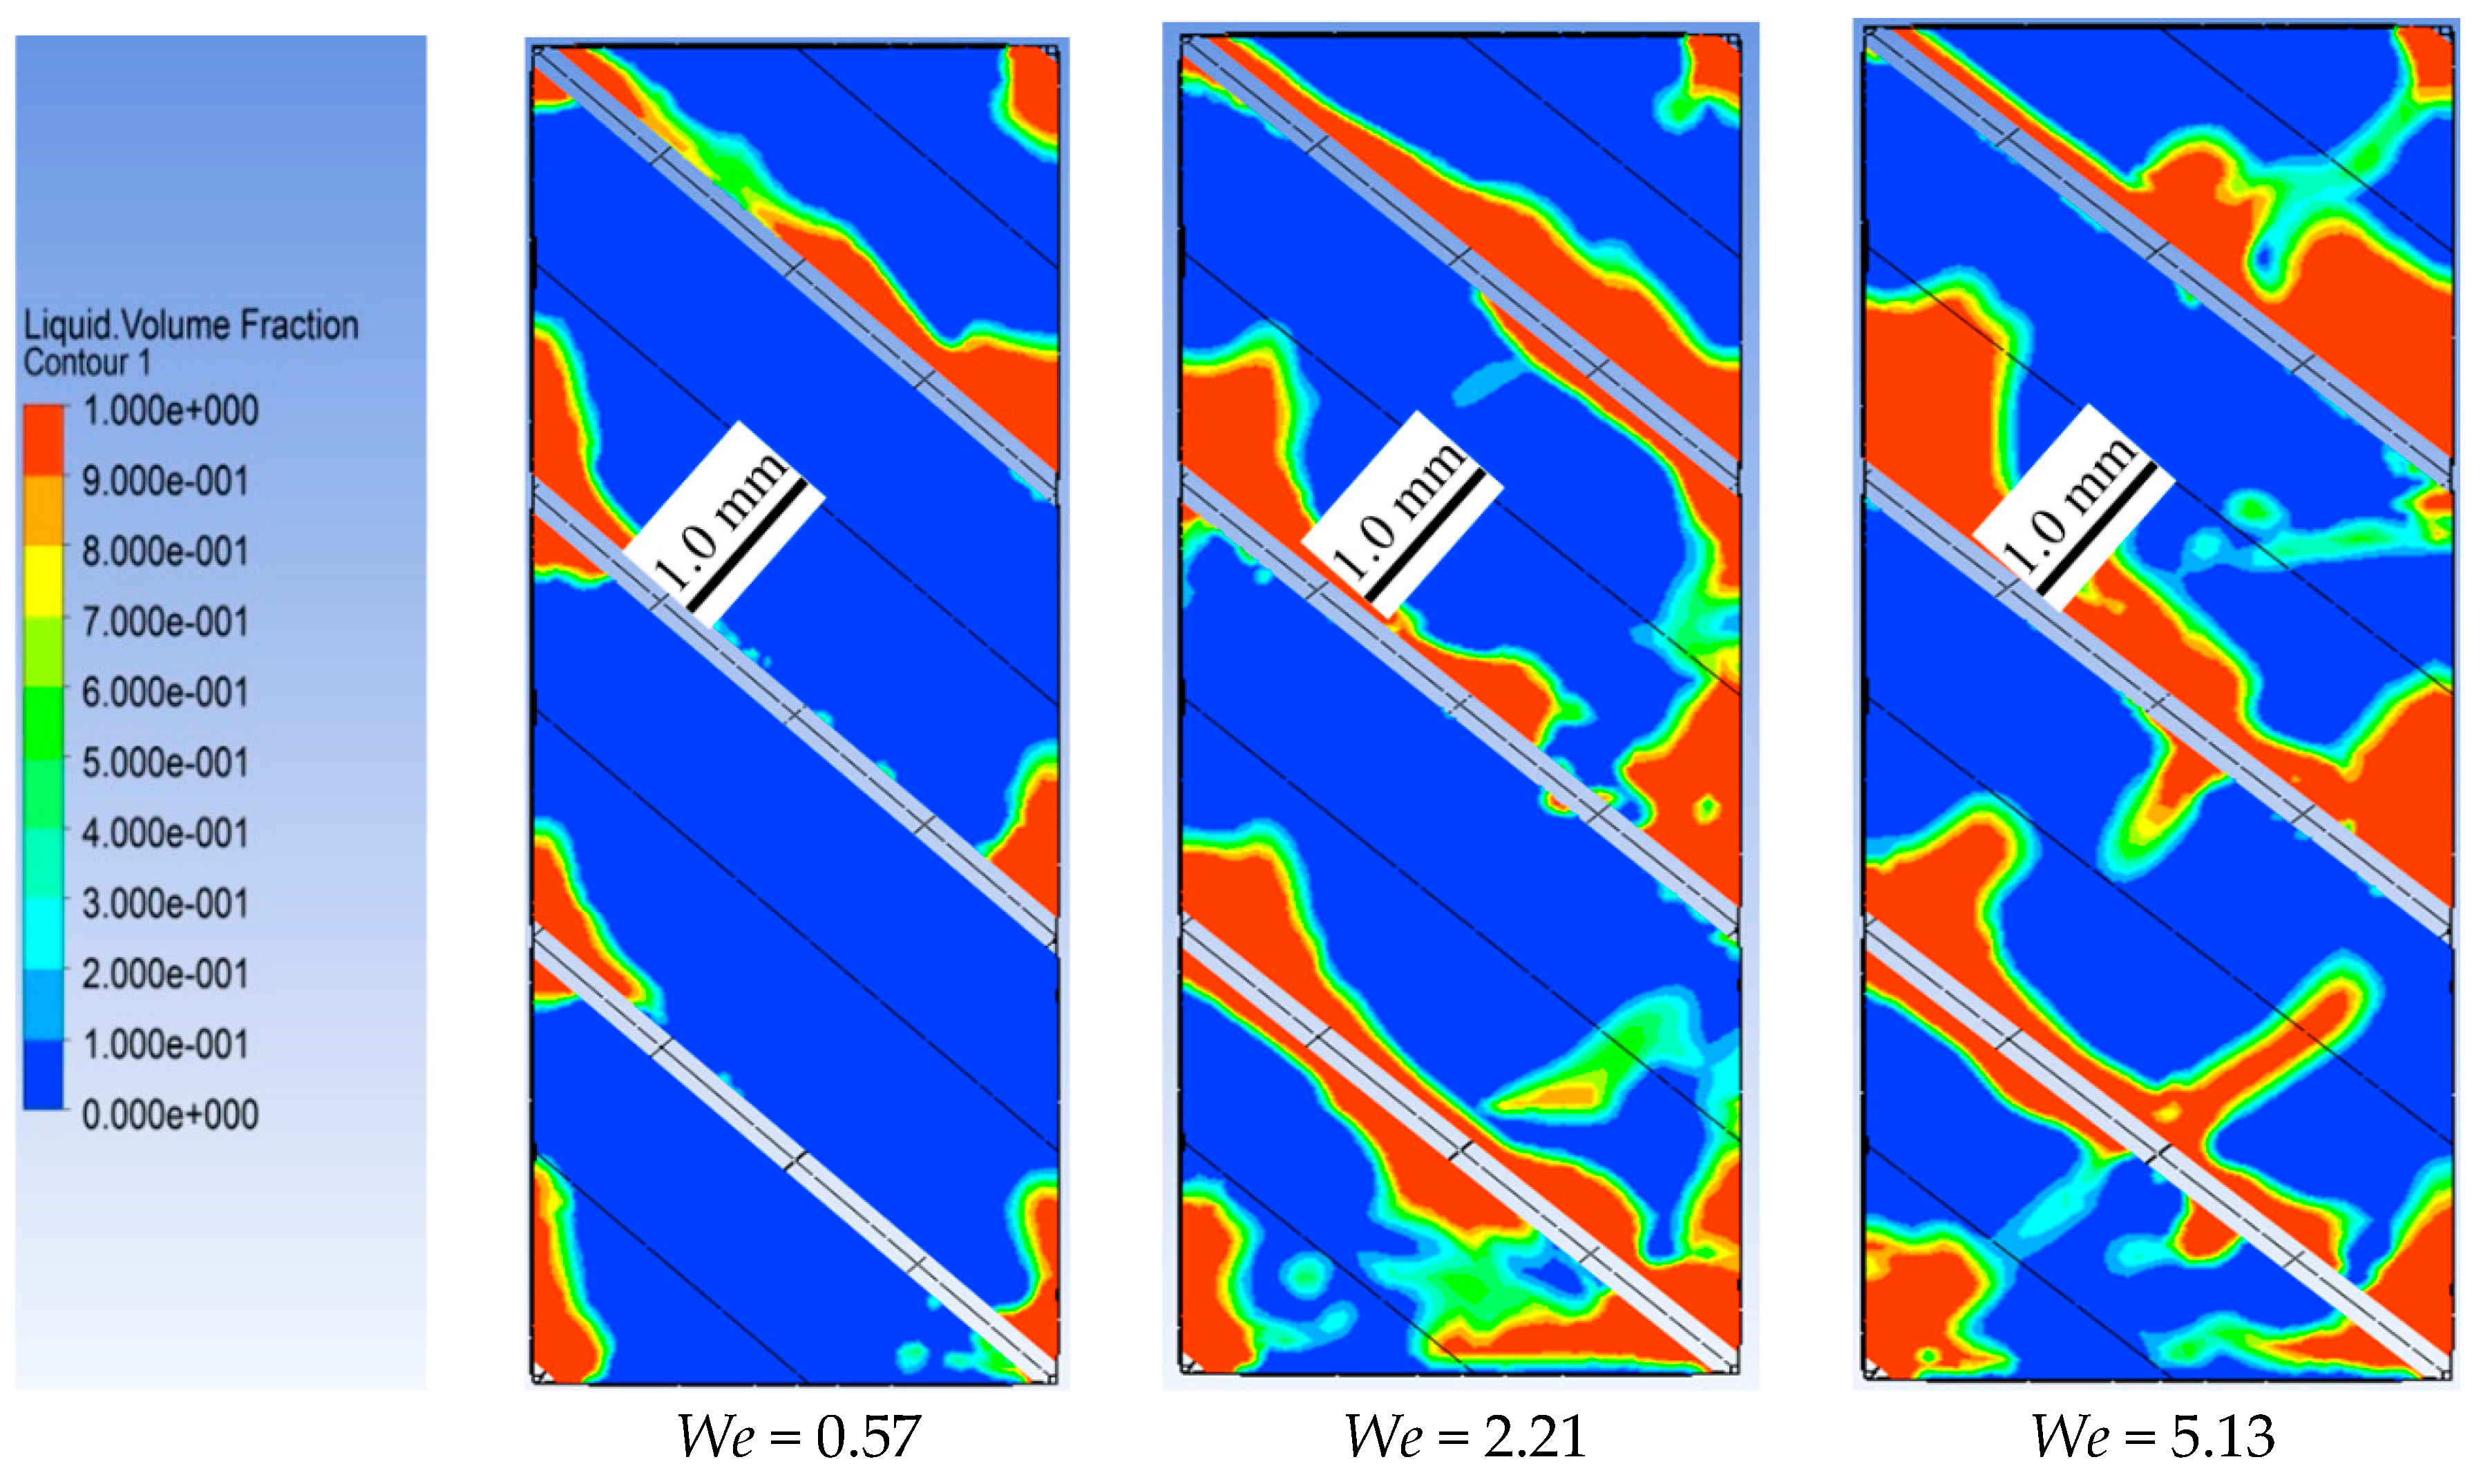
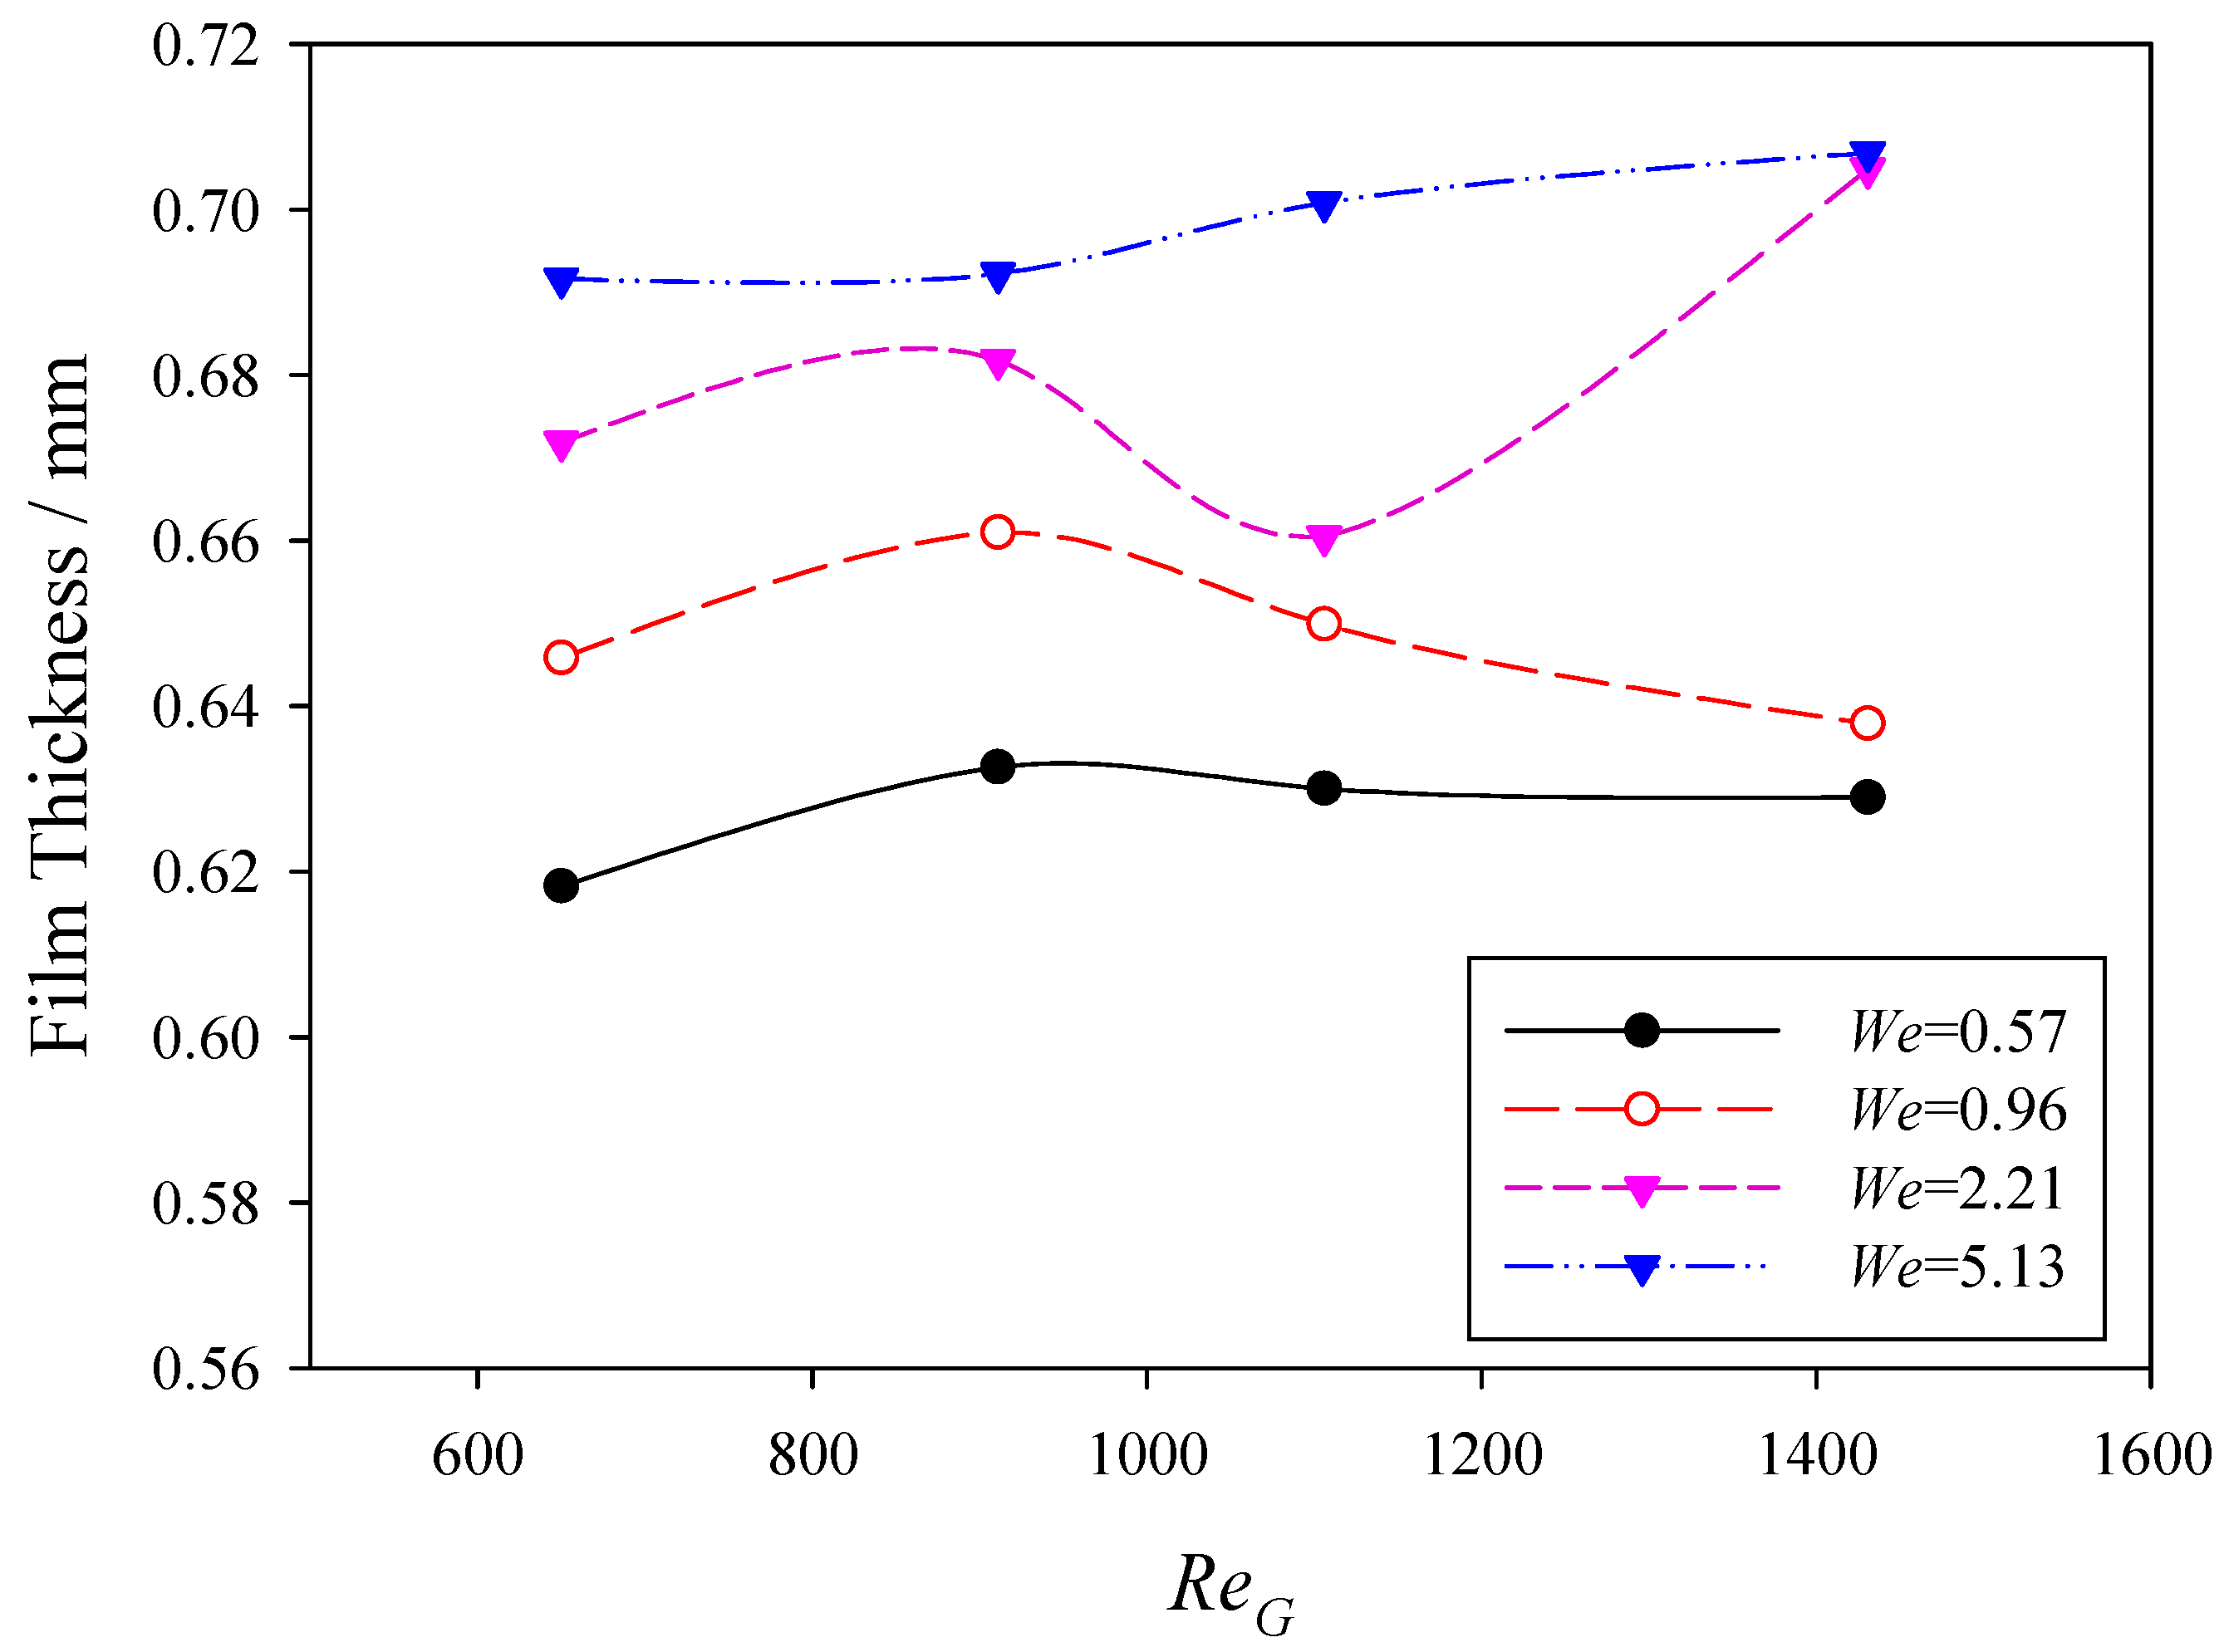
The average film thickness in the packed bed was evaluated by liquid holdup divided by wetted surface area [34]. Figure 13 shows images of the development of film thickness under different liquid We values at constant ReG = 1431. When We was below 2.21, the packing surface was not fully wetted and the film thickness was not uniform; this result indicated that surface tension dominated the liquid flow. When We was increased to 2.21 and beyond, liquid film increased in thickness, and the film thicknesses became more uniform at We = 2.21. However, as also shown in Figure 13, the liquid film became less uniform with significant protrusions at We = 5.13, which implied strong interactions between the gas and liquid phases. This also implied that the film thickness will be influenced by the time, gas flow rates, and liquid flow rates. However, the average film thickness can be estimated using this model. Figure 14 shows the influence of gas flow rates and liquid flow rates on the average film thickness where film thicknesses were between 0.6–0.7 mm. Larger liquid flow rates created thicker liquid films; for example, the film thickness was near 0.62 mm at We = 0.57 and increased to near 0.7 mm when We = 5.13. However, changing the gas flow rates had no significant effects or result in any consistent trends to arise on film thickness. However, with increasing gas flow rates, the liquid flow will become unstable.
4. Conclusions
A comprehensive VOF-based 3D CFD model with structured packing in counter-current gas-liquid flow was developed to study the complicated hydrodynamics in the post combustion CO2 capture process. The model was validated by experimental data in the public domain. The hydrodynamics in a structured packing under various flow conditions were examined and discussed. Inertial forces and surface tension affecting the flow patterns, and a higher We number leads to a more uniform liquid distribution, high wettability, and a minimum probability for channel flow. However, a large We number (e.g., high liquid flow rate) may lead to flooding. The wetted surface area and average film thickness were greatly affected by the liquid flow rate while slight effects by the gas flow rate were observed. However, increasing the gas flow rate will enhance the gas–liquid interactions, leading to increased liquid film instability and large amount of liquid droplet generation. Average film thickness was about 0.6–0.7mm. The unparalleled counter flow direction of the gas and liquid is the main reason for droplet formation, where it is more obvious at the turning point of two packing elements.
Author Contributions
Conceptualization, K.L. and K.S.; Methodology, F.L.; Software, L.Y.; Validation, L.Y. and F.L.; Formal Analysis, L.Y. and F.L.; Investigation, L.Y.; Writing-Original Draft Preparation, L.Y.; Writing-Review & Editing, L.Y., F.L., K.L. and K.S.
Funding
This research was funded by the Key Laboratory of Coal-based CO2 Capture and Geological Storage, Jiangsu Province (China University of Mining and Technology) (NO: 2017A02).), and by the Natural Science Foundation of Jiangsu Province (BK20180645), the author also thanks the support from the Key Project of Scientific Research Frontiers of CUMT (2017XKZD02).
Conflicts of Interest
The authors declare no conflict of interest.
References
- Yu, H. Carbon capture and storage: A challenging approach for mitigation of global warming. Int. J. Clean Coal Energy 2013, 2, 23–24. [Google Scholar] [CrossRef]
- Thompson, J.G.; Combs, M.; Abad, K.; Bhatnagar, S.; Pelgen, J.; Beaudry, M.; Rochelle, G.; Hume, S.; Link, D.; Figueroa, J.; et al. Pilot testing of a heat integrated 0.7 MWe CO2 capture system with two-stage air-stripping: Emission. Int. J. Greenh. Gas Control 2017, 64, 267–275. [Google Scholar] [CrossRef]
- Yang, L.; Liu, F.; Song, Z.; Liu, K.; Saito, K. 3D Numerical Study of Multiphase Counter-Current Flow within a Packed Bed for Post Combustion Carbon Dioxide Capture. Energies 2018, 11, 1441. [Google Scholar] [CrossRef]
- Ranade, V.; Chaudhari, R.; Gunjal, P. Hydrodynamics and Flow Regimes. In Trickle Bed Reactors; Elsevier: Amsterdam, The Netherlands, 2011; Chapter 2; pp. 25–75. [Google Scholar]
- Haroun, Y.; Legendre, D.; Raynal, L. Direct numerical simulation of reactive absorption in gas–liquid flow on structured packing using interface capturing method. Chem. Eng. Sci. 2010, 65, 351–356. [Google Scholar] [CrossRef]
- Kim, J.; Pham, D.A.; Lim, Y.-I. Gas−liquid multiphase computational fluid dynamics (cfd) of amine absorption column with structured-packing for CO2 capture. Comput. Chem. Eng. 2016, 88, 39–49. [Google Scholar] [CrossRef]
- Saito, K.; Ito, A.; Nakamura, Y. Progress in Scale Modeling. In The International Symposia on Scale Modeling, ISSM VI (2009) and ISSM VII (2013); Springer: Berlin, Germany, 2013; Volume II. [Google Scholar]
- Pangarkar, K.; Schildhauer, T.; Ommen, J.; Nijenhuis, J.; Kapteijn, F.; Moulijn, J.A. Structured Packings for Multiphase Catalytic Reactors. Ind. Eng. Chem. Res. 2008, 47, 3720–3751. [Google Scholar] [CrossRef]
- Basden, M.; Eldridge, R.B.; Farone, J.; Feng, E.; Hussey, D.S.; Jacobson, D.L. Liquid holdup profiles in structured packing determined via neutron radiography. Ind. Eng. Chem. Res. 2013, 52, 17263–17269. [Google Scholar] [CrossRef]
- Guo, X.; Sun, Y.; Li, R.; Yang, F. Experimental investigations on temperature variation and inhomogeneity in a packed bed clc reactor of large particles and low aspect ratio. Chem. Eng. Sci. 2014, 107, 266–276. [Google Scholar] [CrossRef]
- Yeoh, G.; Tu, J. Computational Techniques for Multiphase Flows. Butterworth-Heinemann: Oxford, UK, 2010. [Google Scholar]
- Zhang, H. High Temperature Flow Solver for Aerothermodynamics Problems. Ph.D. Thesis, University of Kentukcy, Lexington, KY, USA, August 2015. [Google Scholar]
- Lopes, R.J.G.; Quinta-Ferreira, R.M. Cfd modelling of multiphase flow distribution in trickle beds. Chem. Eng. J. 2009, 147, 342–355. [Google Scholar] [CrossRef]
- Gunjal, P.; Kashid, M.; Ranade, V.; Chaudhari, R.V. Hydrodynamics of Trickle-Bed Reactors: Experiments and CFD Modeling. Ind. Eng. Chem. Res. 2005, 44, 6278–6294. [Google Scholar] [CrossRef]
- Wen, X.; Shu, Y.; Nandakumar, K.; Chuang, K.T. Predicting liquid flow profile in randomly packed beds from computer simulation. AIChE J. 2001, 47, 1770–1779. [Google Scholar] [CrossRef]
- Hoffmann, A.; Ausner, I.; Repke, J.; Wozny, G. Fluid dynamics in multiphase distillation processes in packed towers. Comput. Chem. Eng. 2005, 29, 1433–1437. [Google Scholar] [CrossRef]
- Yu, D.; Cao, D.; Li, Z.; Li, Q. Experimental and CFD studies on the effects ofsurface texture on liquid thickness, wetted areaand mass transfer in wave-like structured packings. Chem. Eng. Res. Des. 2018, 129, 170–181. [Google Scholar] [CrossRef]
- Olenberg, A.; Reschetnikb, W.; Kullmer, G.; Kenig, E.Y. Optimization of structured packings using twisted tape inserts. Chem. Eng. Res. Des. 2018, 132, 1–8. [Google Scholar] [CrossRef]
- Haroun, Y.; Raynal, L.; Alix, P. Prediction of effective area and liquid hold-up in structured packings by cfd. Chem. Eng. Res. Des. 2014, 92, 2247–2254. [Google Scholar] [CrossRef]
- Ding, H.; Li, J.; Xiang, W.; Liu, C. Cfd simulation and optimization of winpak-based modular catalytic structured packing. Ind. Eng. Chem. Res. 2015, 54, 2391–2403. [Google Scholar] [CrossRef]
- Fourati, M.; Roig, V.; Raynal, L. Liquid dispersion in packed columns: Experiments and numerical modeling. Chem. Eng. Sci. 2013, 100, 266–278. [Google Scholar] [CrossRef] [Green Version]
- Haroun, Y.; Raynal, L.; Legendre, D. Mass transfer and liquid hold-up determination in structured packing by cfd. Chem. Eng. Sci. 2012, 75, 342–348. [Google Scholar] [CrossRef] [Green Version]
- Ginzburg, I.; Wittum, G. Two-phase flows on interface refined grids modeled with vof, staggered finite volumes, and spline interpolants. J. Comput. Phys. 2001, 166, 302–335. [Google Scholar] [CrossRef]
- Renardy, Y.; Renardy, M. Prost: A parabolic reconstruction of surface tension for the volume-of-fluid method. J. Comput. Phys. 2002, 183, 400–421. [Google Scholar] [CrossRef]
- Zhang, C.; Zhang, W.; Lin, N.; Tang, Y.; Zhao, C.; Gu, J.; Lin, W.; Chen, X.; Qiu, A. A two-phase flow model coupling with volume of fluid and immersed boundary methods for free surface and moving structure problems. Ocean Eng. 2013, 74, 107–124. [Google Scholar] [CrossRef]
- Hirt, C.; Nichols, B. Volume of fluid (VOF) method for the dynamics of free boundaries. J. Comput. Phys. 1981, 39, 201–225. [Google Scholar] [CrossRef]
- Olsson, E.; Kreiss, G. A conservative level set method for two phase flow. J. Computat. Phys. 2005, 210, 225–246. [Google Scholar] [CrossRef]
- Olujić, Ž.; Seibert, A.; Fair, J. Influence of corrugation geometry on the performance of structured packings: An experimental study. Chem. Eng. Process. Process Intensif. 2000, 39, 335–342. [Google Scholar] [CrossRef]
- Cable, M. An Evaluation of Turbulence Models for the Numerical Study of Forced and Natural Convective Flow in Atria. Master’s Thesis, Queen’s University, Kingston, ON, Canada, May 2009. [Google Scholar]
- Stikkelman, R.; Teeuw, H.; Wesselingh, H.; de Graauw, J.; Olujic, Z. A study of gas and liquid distributions in structured packings. Chem. Eng. Technol. 1989, 12, 445–449. [Google Scholar] [CrossRef]
- Ergun, S.; Orning, A.A. Fluid Flow through Randomly Packed Columns and Fluidized Beds. Ind. Eng. Chem. 1949, 41, 1179–1184. [Google Scholar] [CrossRef]
- Billet, R. Packed Towers: In Processing and Environmental Technology; Wiley-VCH: Wernheim, Germany, 1995. [Google Scholar]
- Sebastia-Saez, D.; Gu, S.; Ranganathan, P.; Papadikis, K. 3D modeling of hydrodynamics and physical mass transfer characteristics of liquid film flows in structured packing elements. Int. J. Greenh. Gas Control. 2013, 19, 492–502. [Google Scholar] [CrossRef]
- Jo, D. Hydrodynamic model of interfacial area for trickling flow in a packed bed. J. Mech. Sci. Technol. 2016, 30, 171–178. [Google Scholar] [CrossRef]
Figure 1.
Schematic diagram of a post combustion solvent-based CO2 capture process. MEA means monoethanolamine; HEX means heat exchanger.
Figure 1.
Schematic diagram of a post combustion solvent-based CO2 capture process. MEA means monoethanolamine; HEX means heat exchanger.
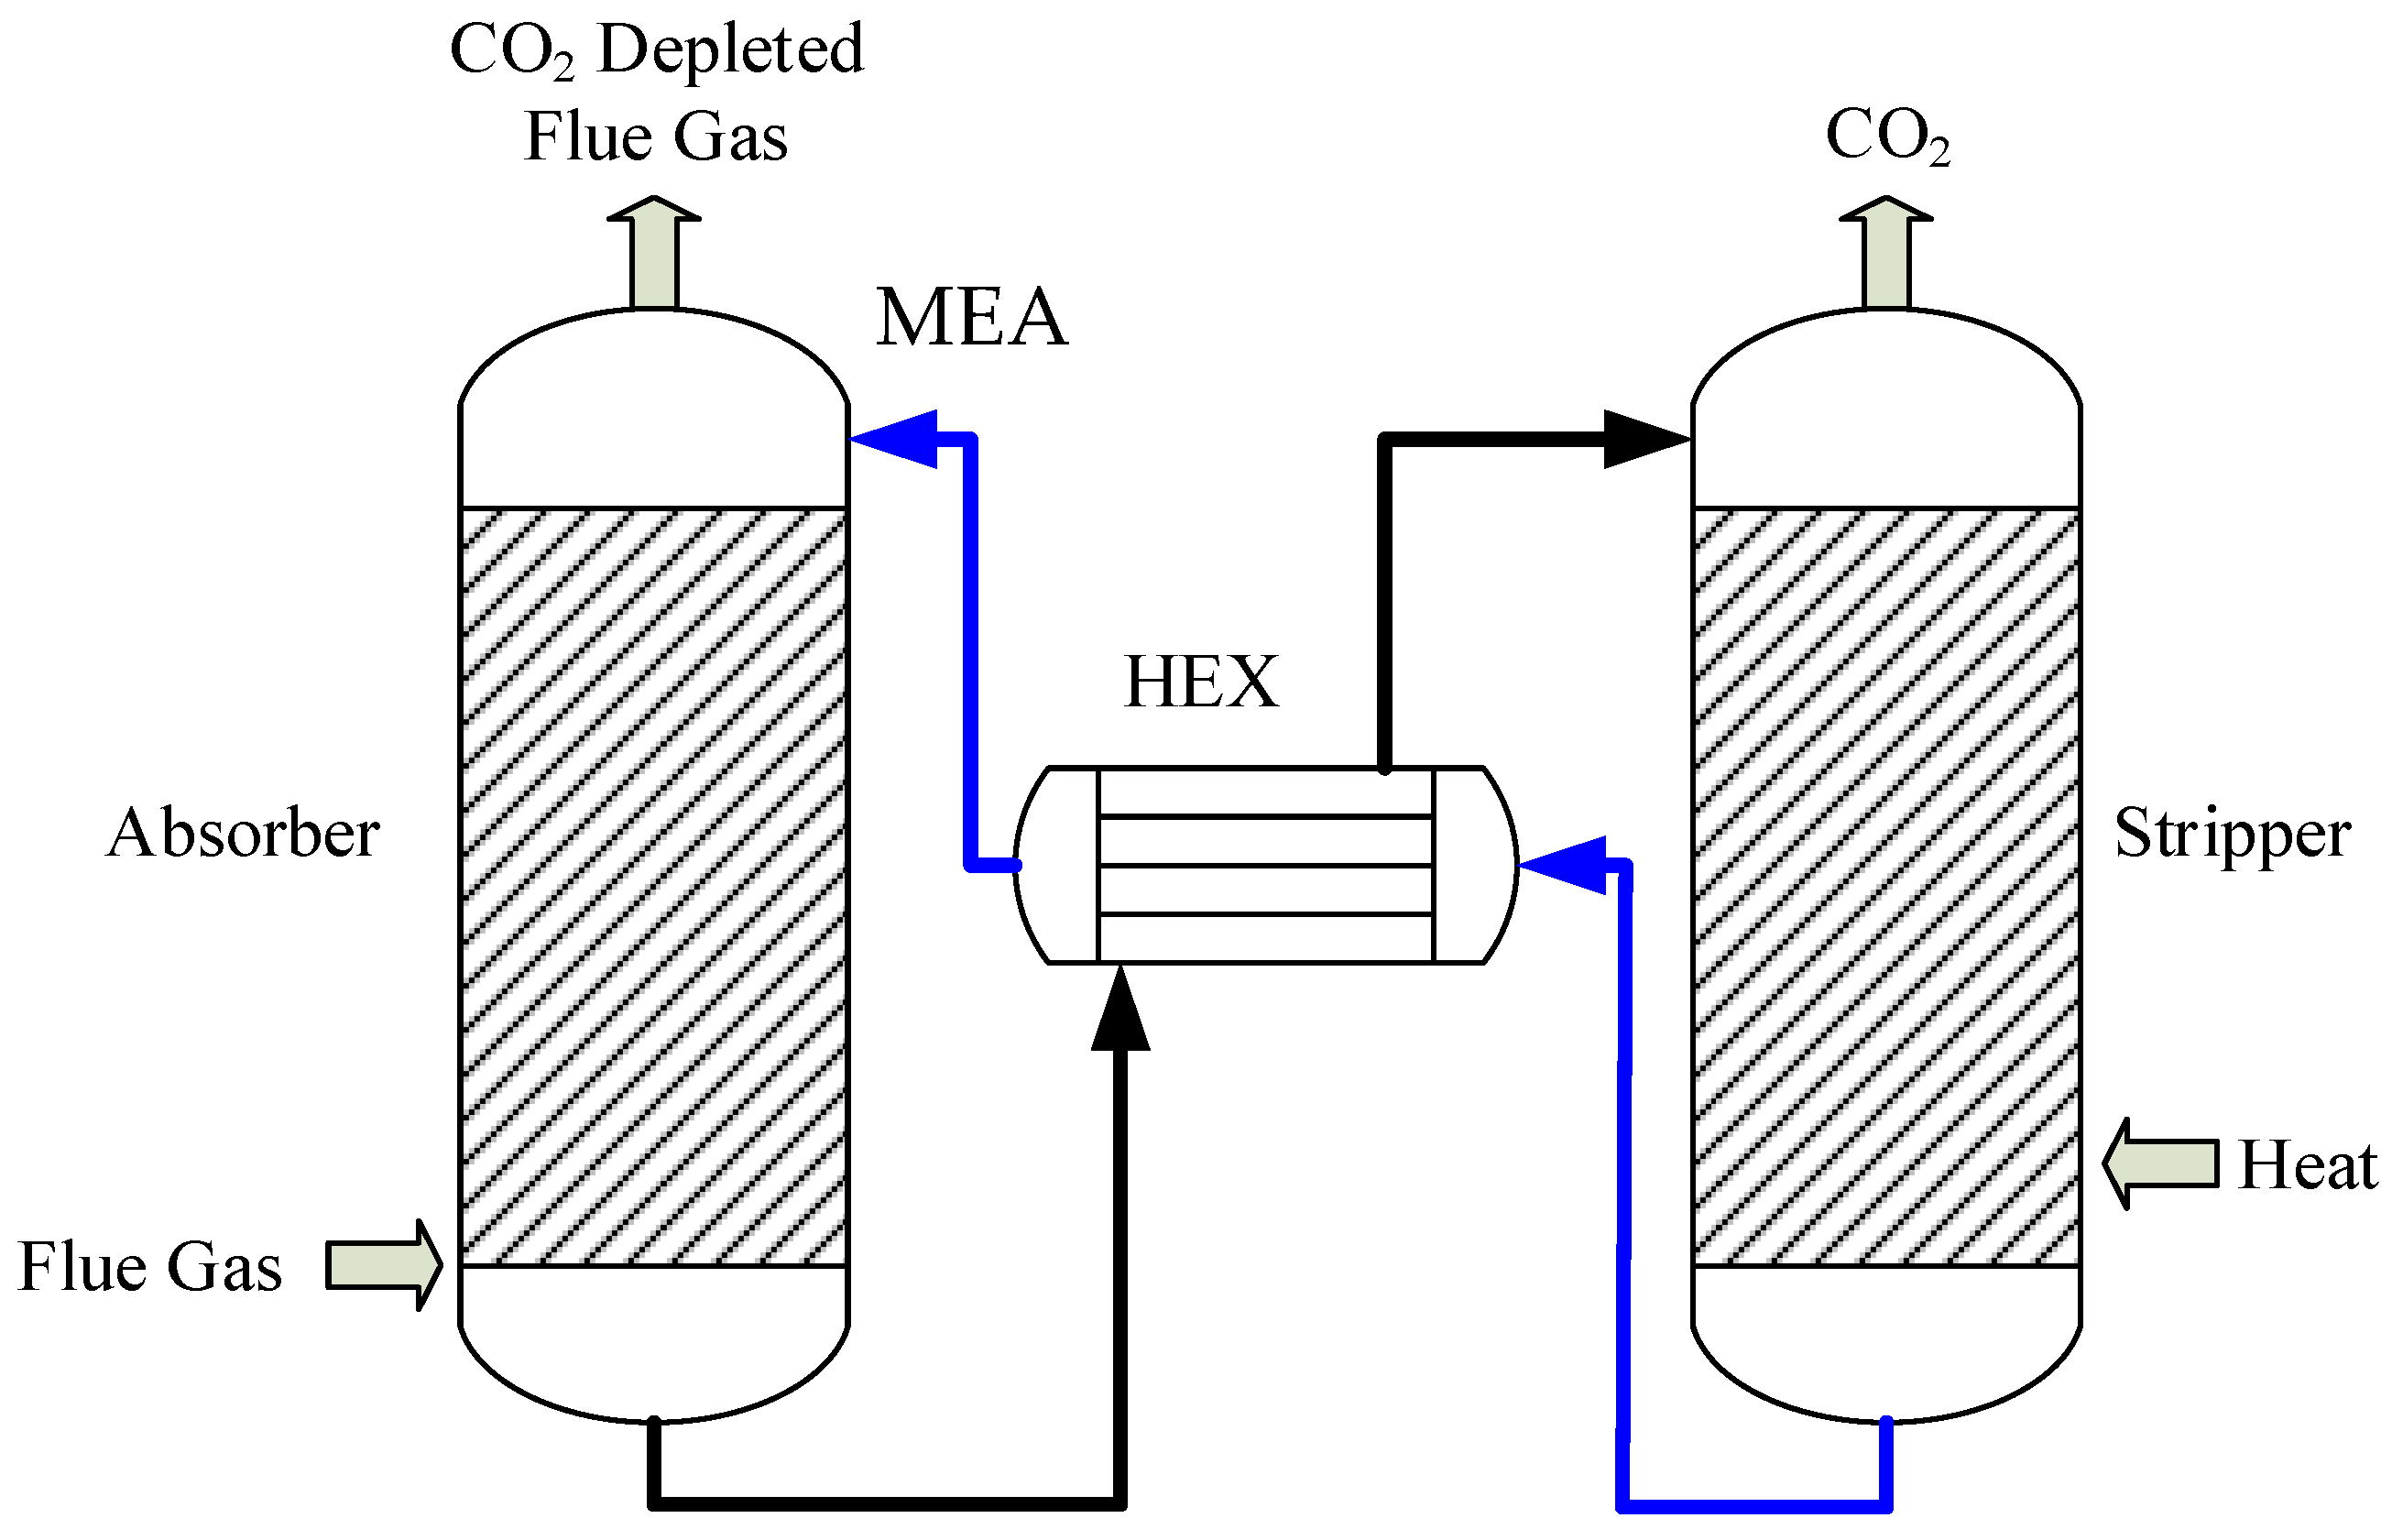
Figure 2.
Images of the Mellapak 250 Y structured packing within a bed: (a) overview; (b) top view; and (c) the geometric model.
Figure 2.
Images of the Mellapak 250 Y structured packing within a bed: (a) overview; (b) top view; and (c) the geometric model.
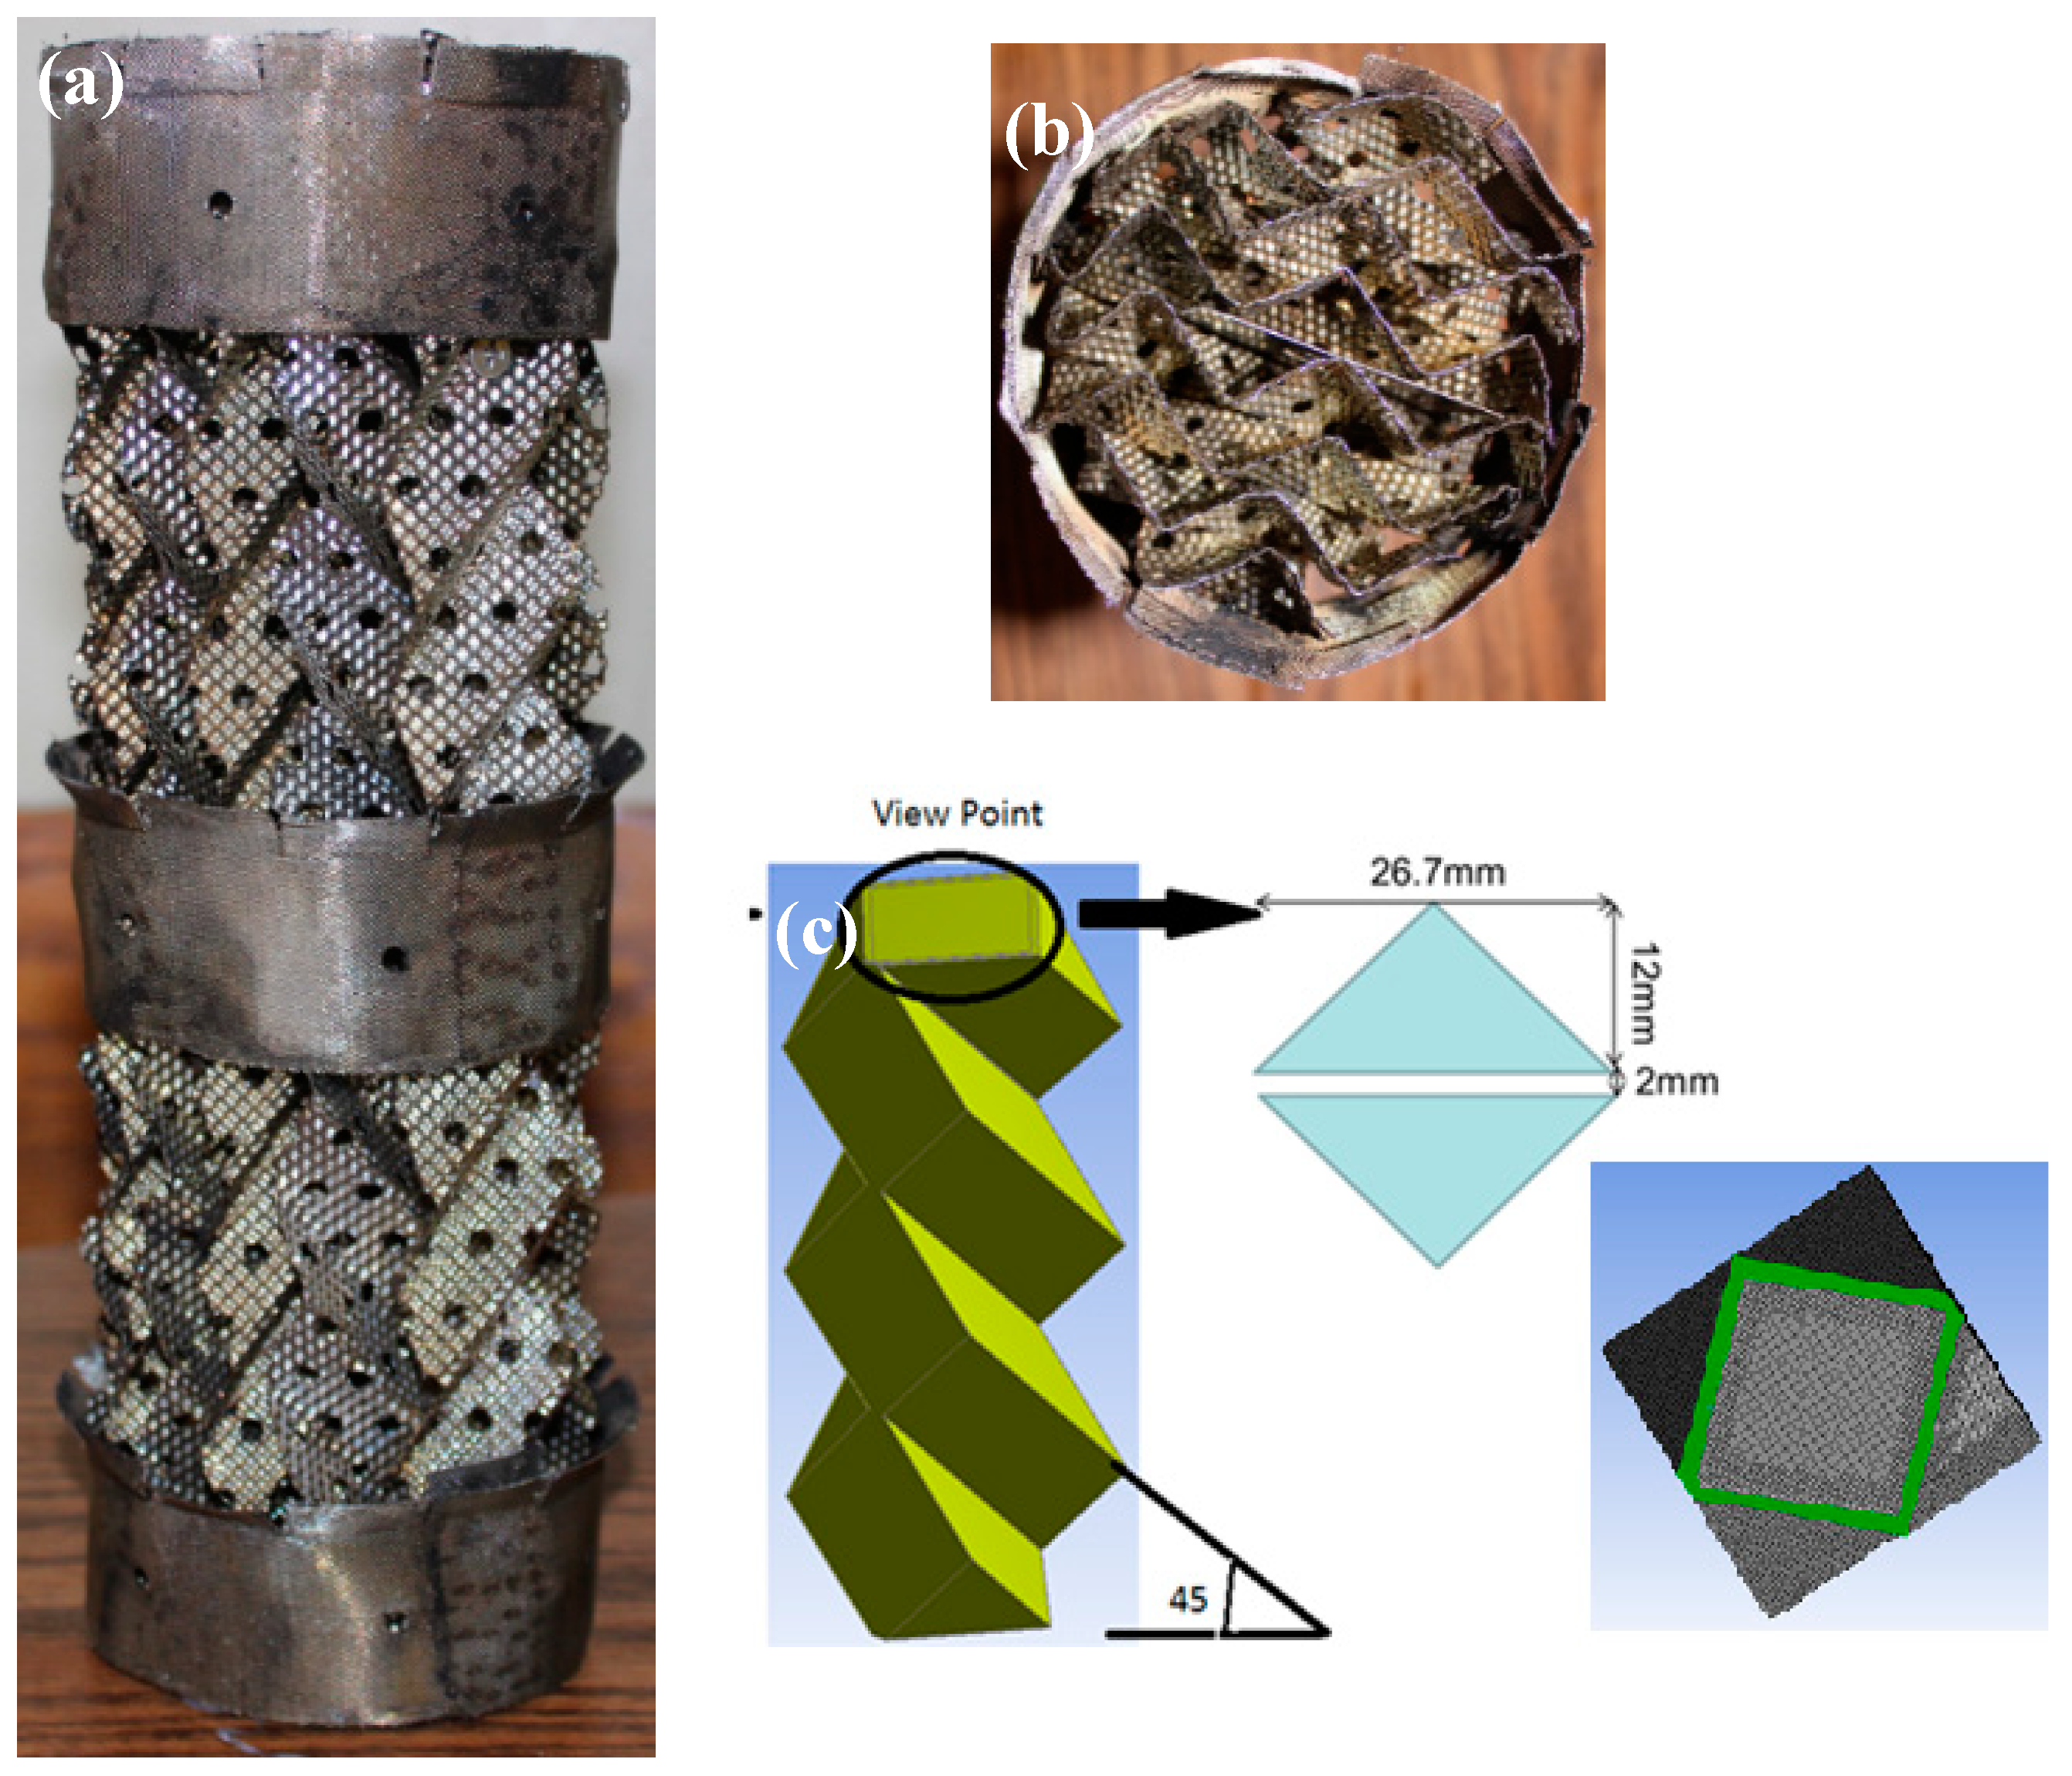
Figure 3.
Mesh model and the details of the mesh.

Figure 4.
Schematic overview of flow directions.
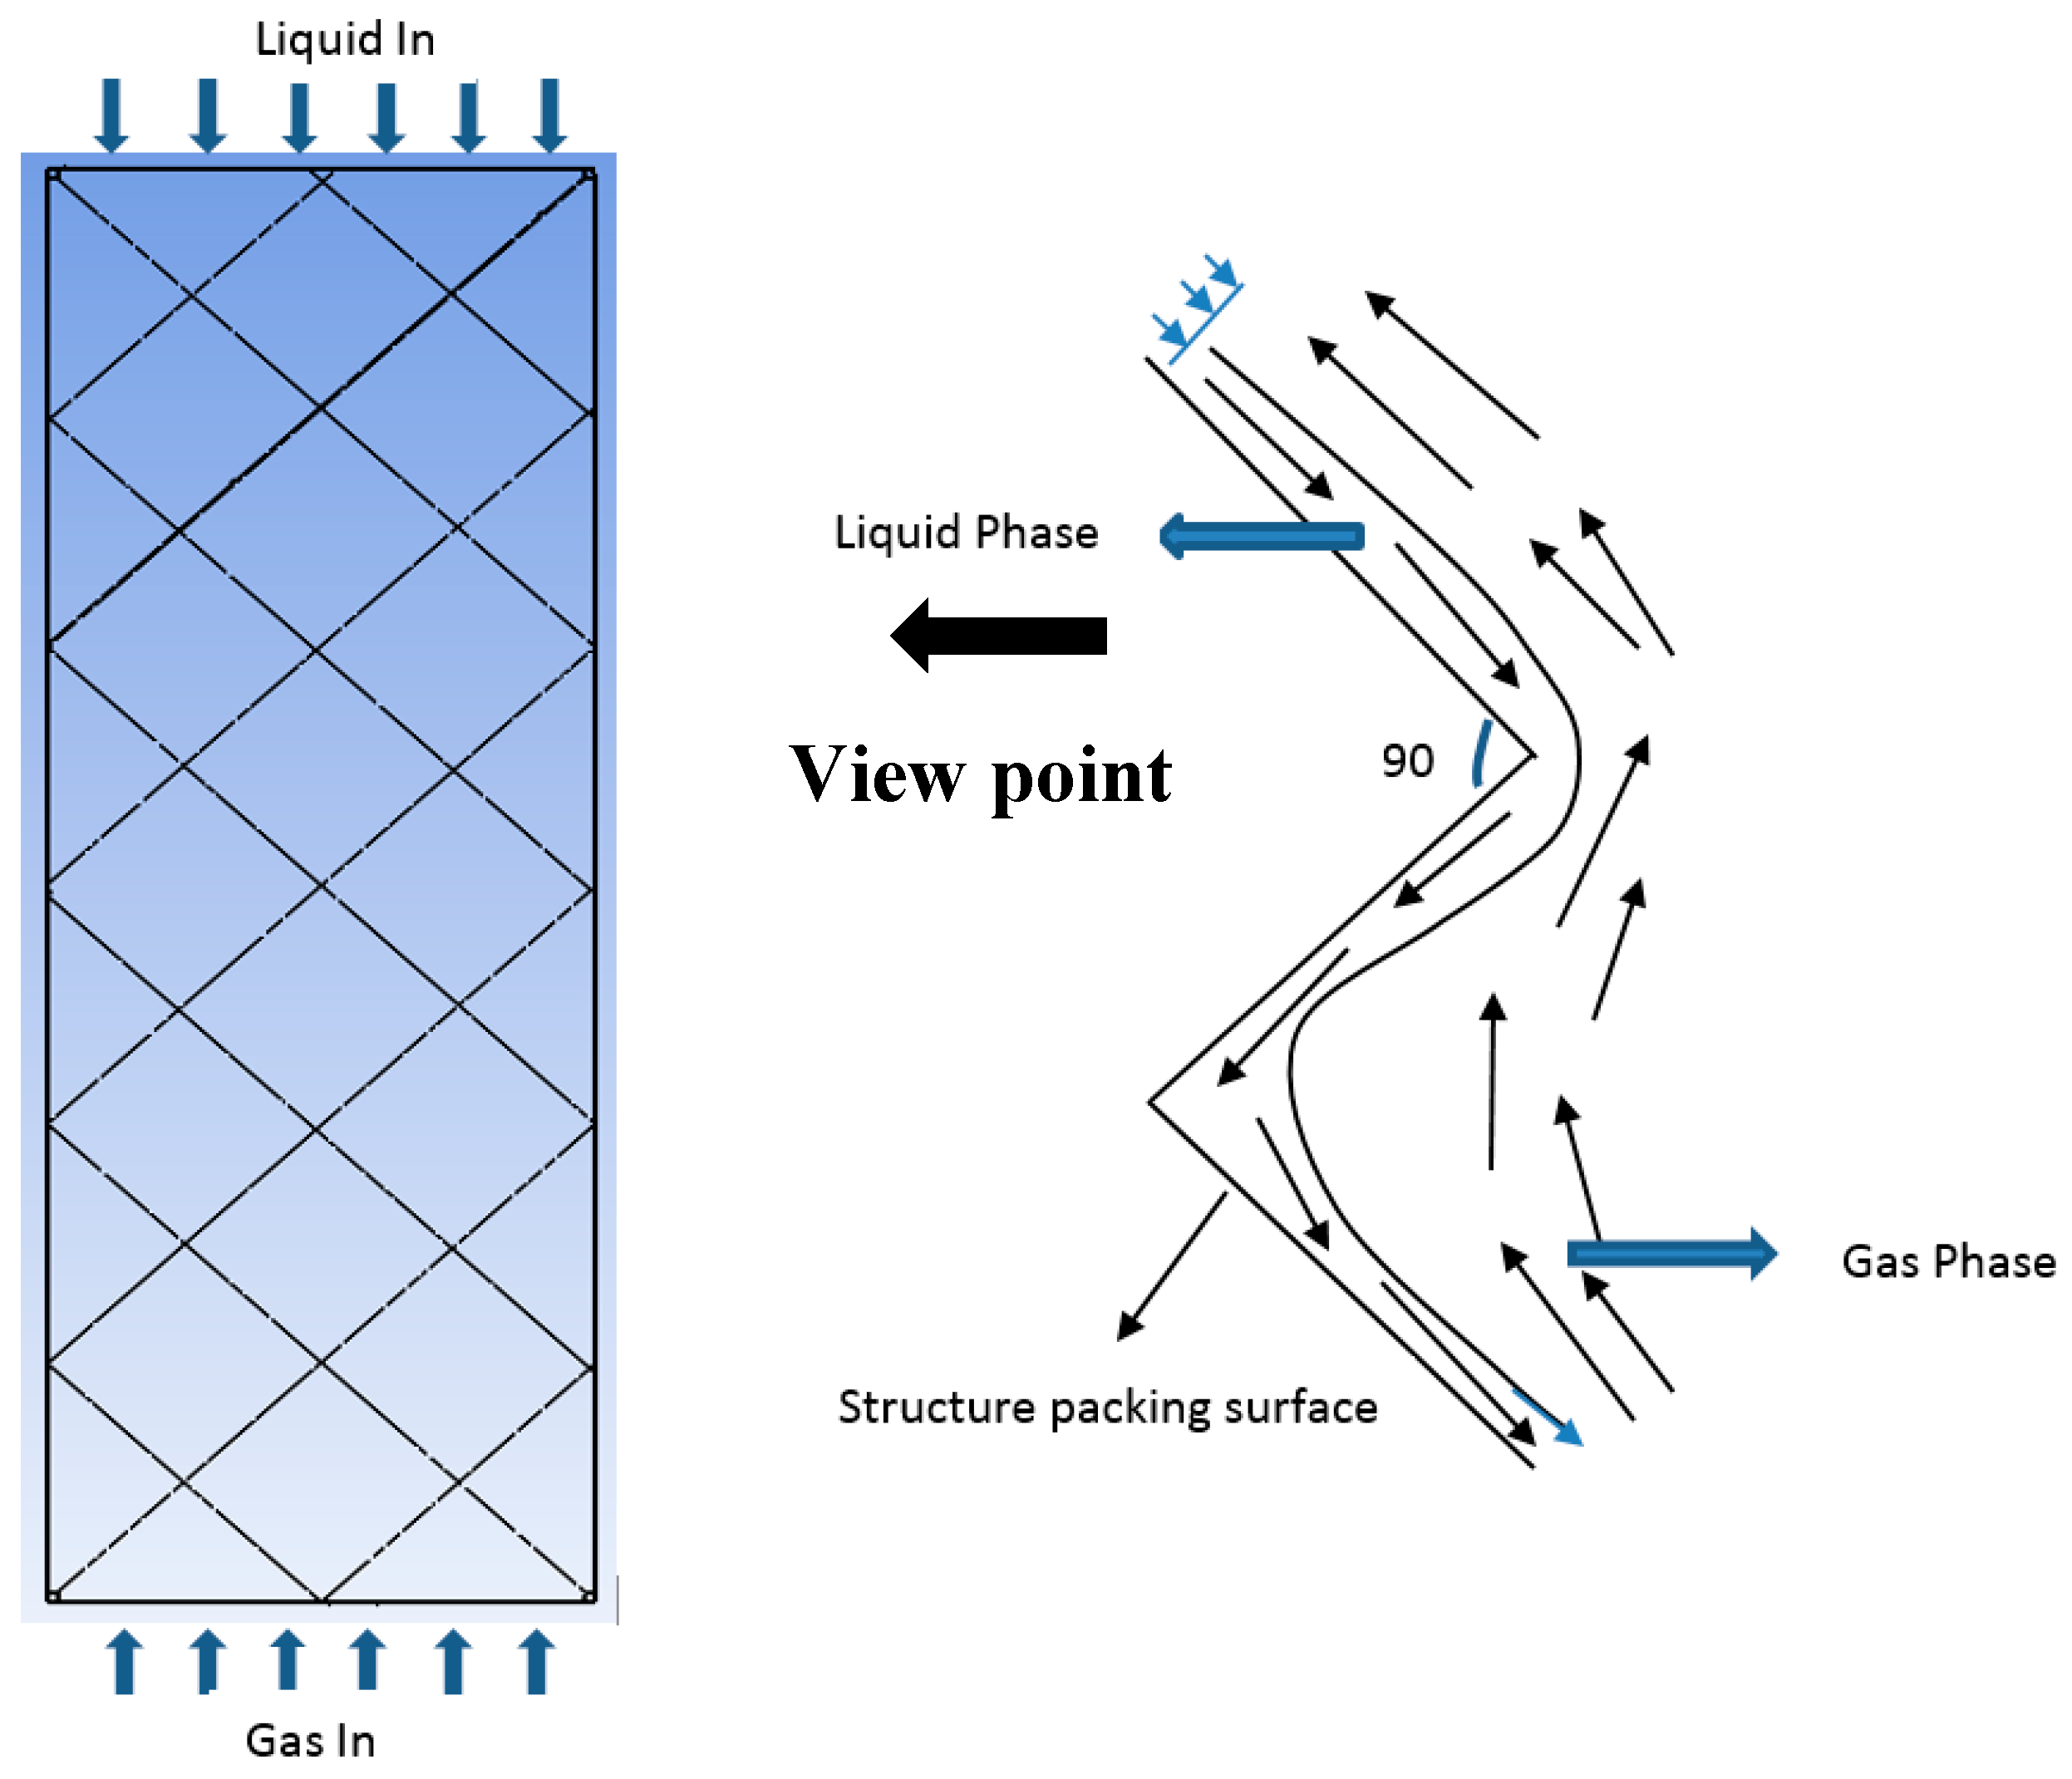
Figure 5.
A comparison of pressure drops from Stichlmair’s empirical model and the CFD simulation results for different gas flow rates: (a) , (b) .
Figure 5.
A comparison of pressure drops from Stichlmair’s empirical model and the CFD simulation results for different gas flow rates: (a) , (b) .
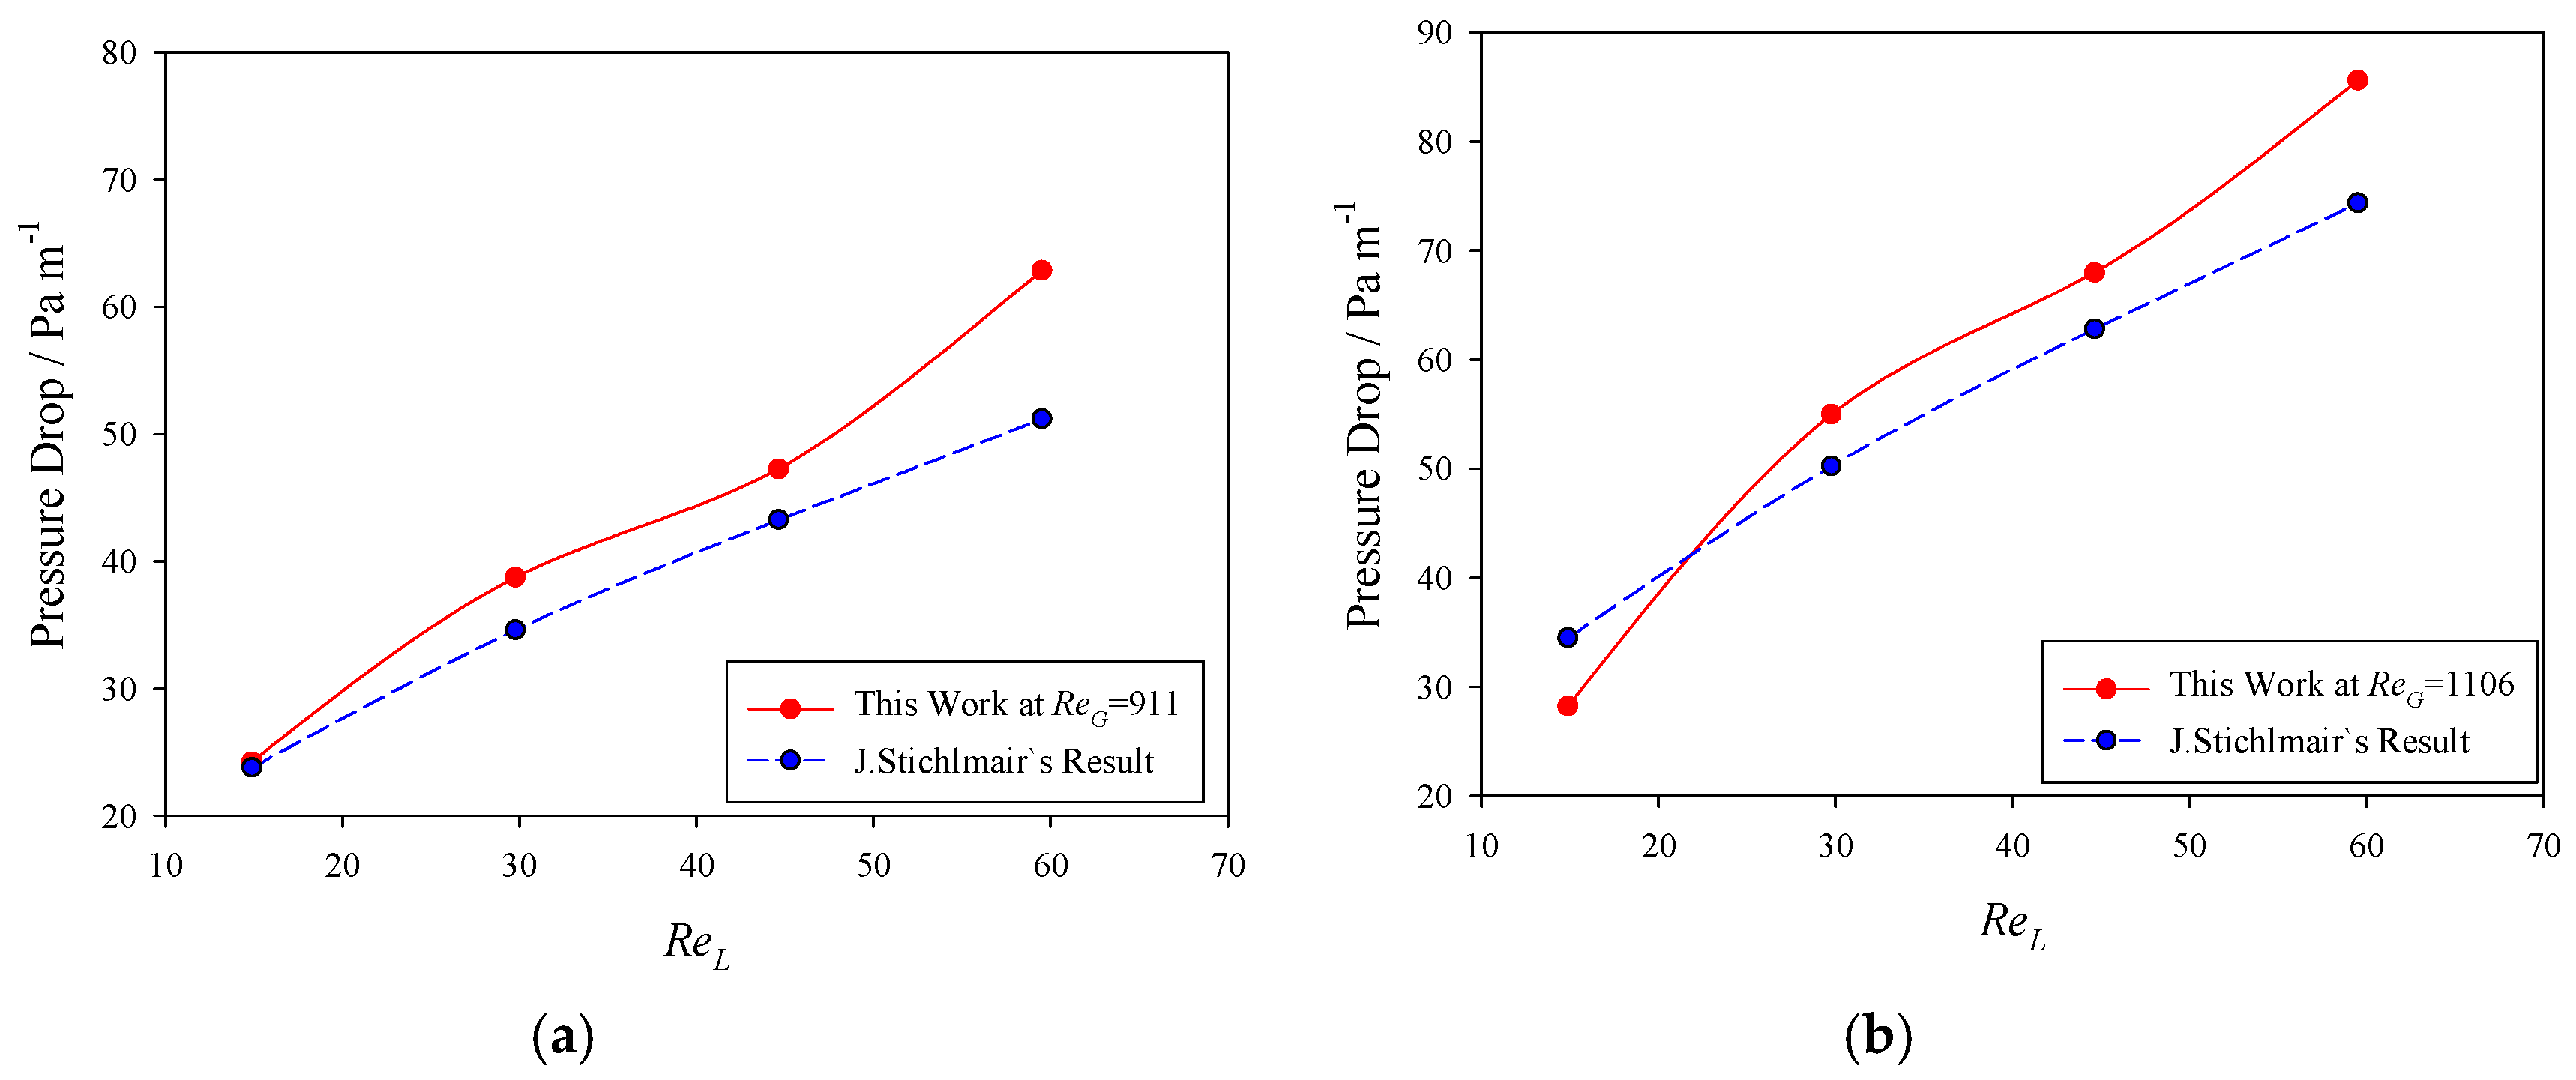
Figure 6.
Comparison of liquid holdups from CFD simulations and empirical calculations.
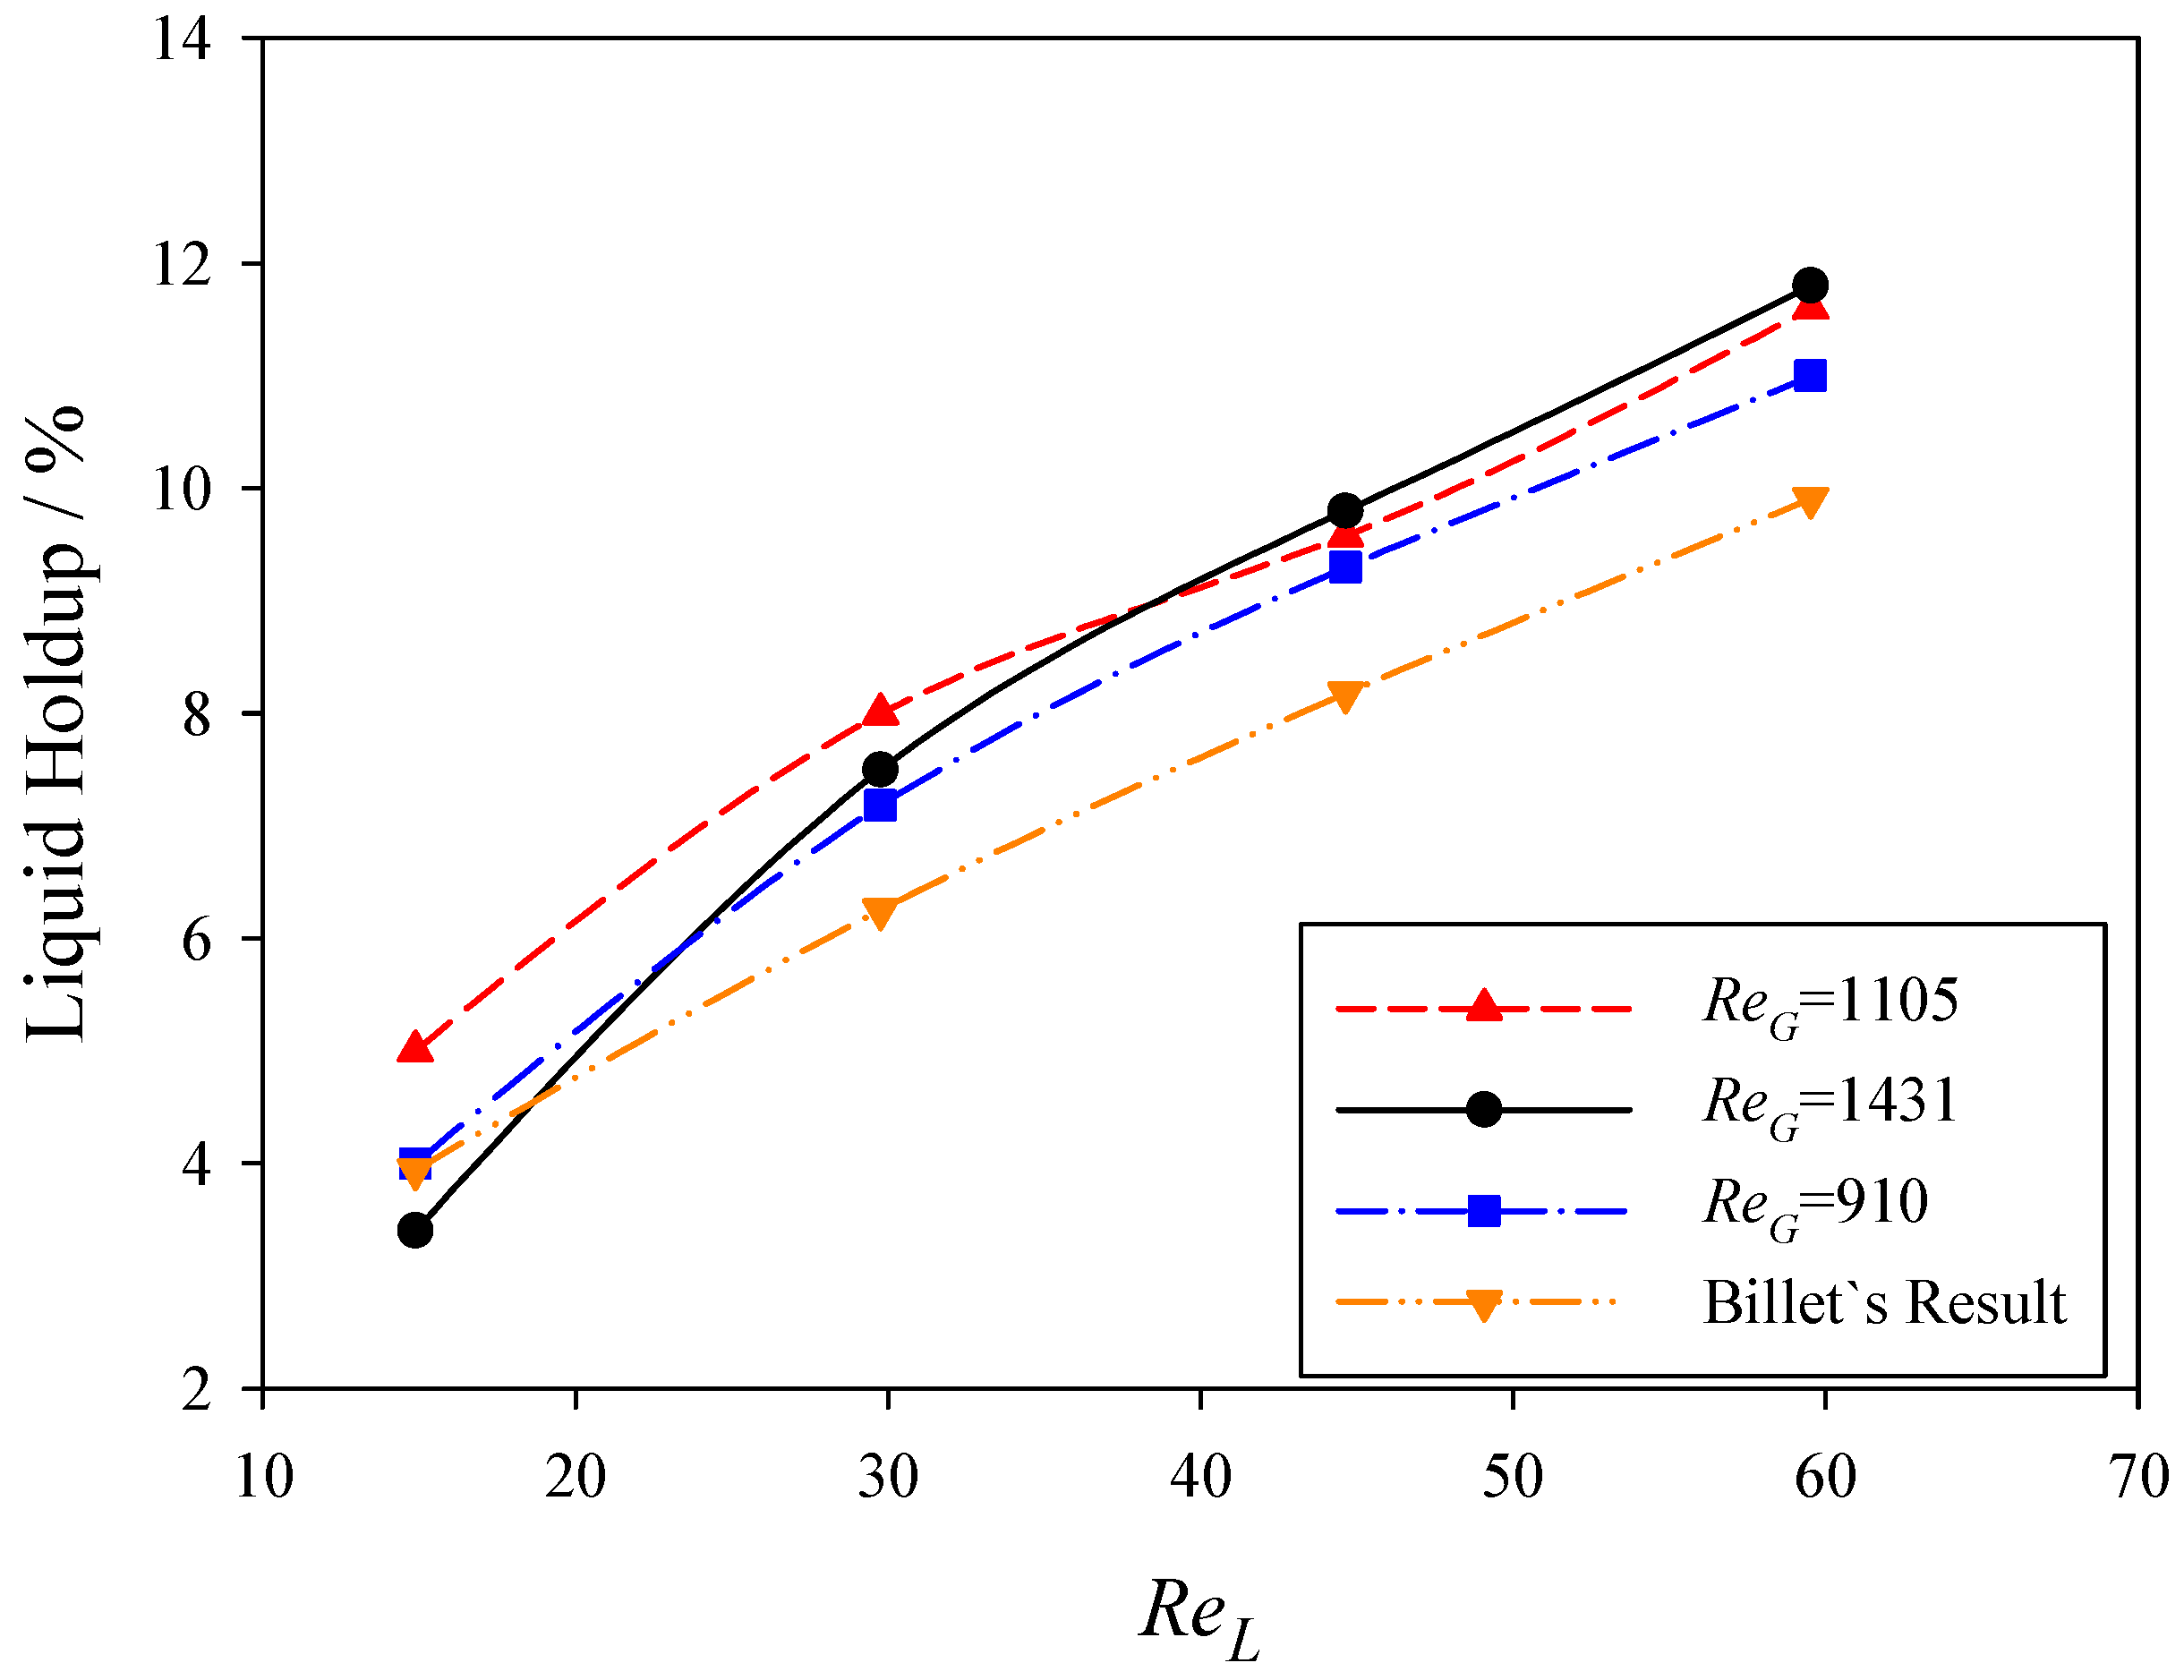
Figure 7.
Liquid distribution for structured packing at different liquid We numbers from 0.57 to 5.13 and fixed .
Figure 7.
Liquid distribution for structured packing at different liquid We numbers from 0.57 to 5.13 and fixed .

Figure 8.
Influence of gas flow rates with fixed liquid velocities on pressure drop.

Figure 9.
Wettability for structured packing at different liquid We numbers from 0.57 to 5.13 and fixed .
Figure 9.
Wettability for structured packing at different liquid We numbers from 0.57 to 5.13 and fixed .

Figure 10.
Influence of gas flow rate with fixed liquid flow rate on wetted area.
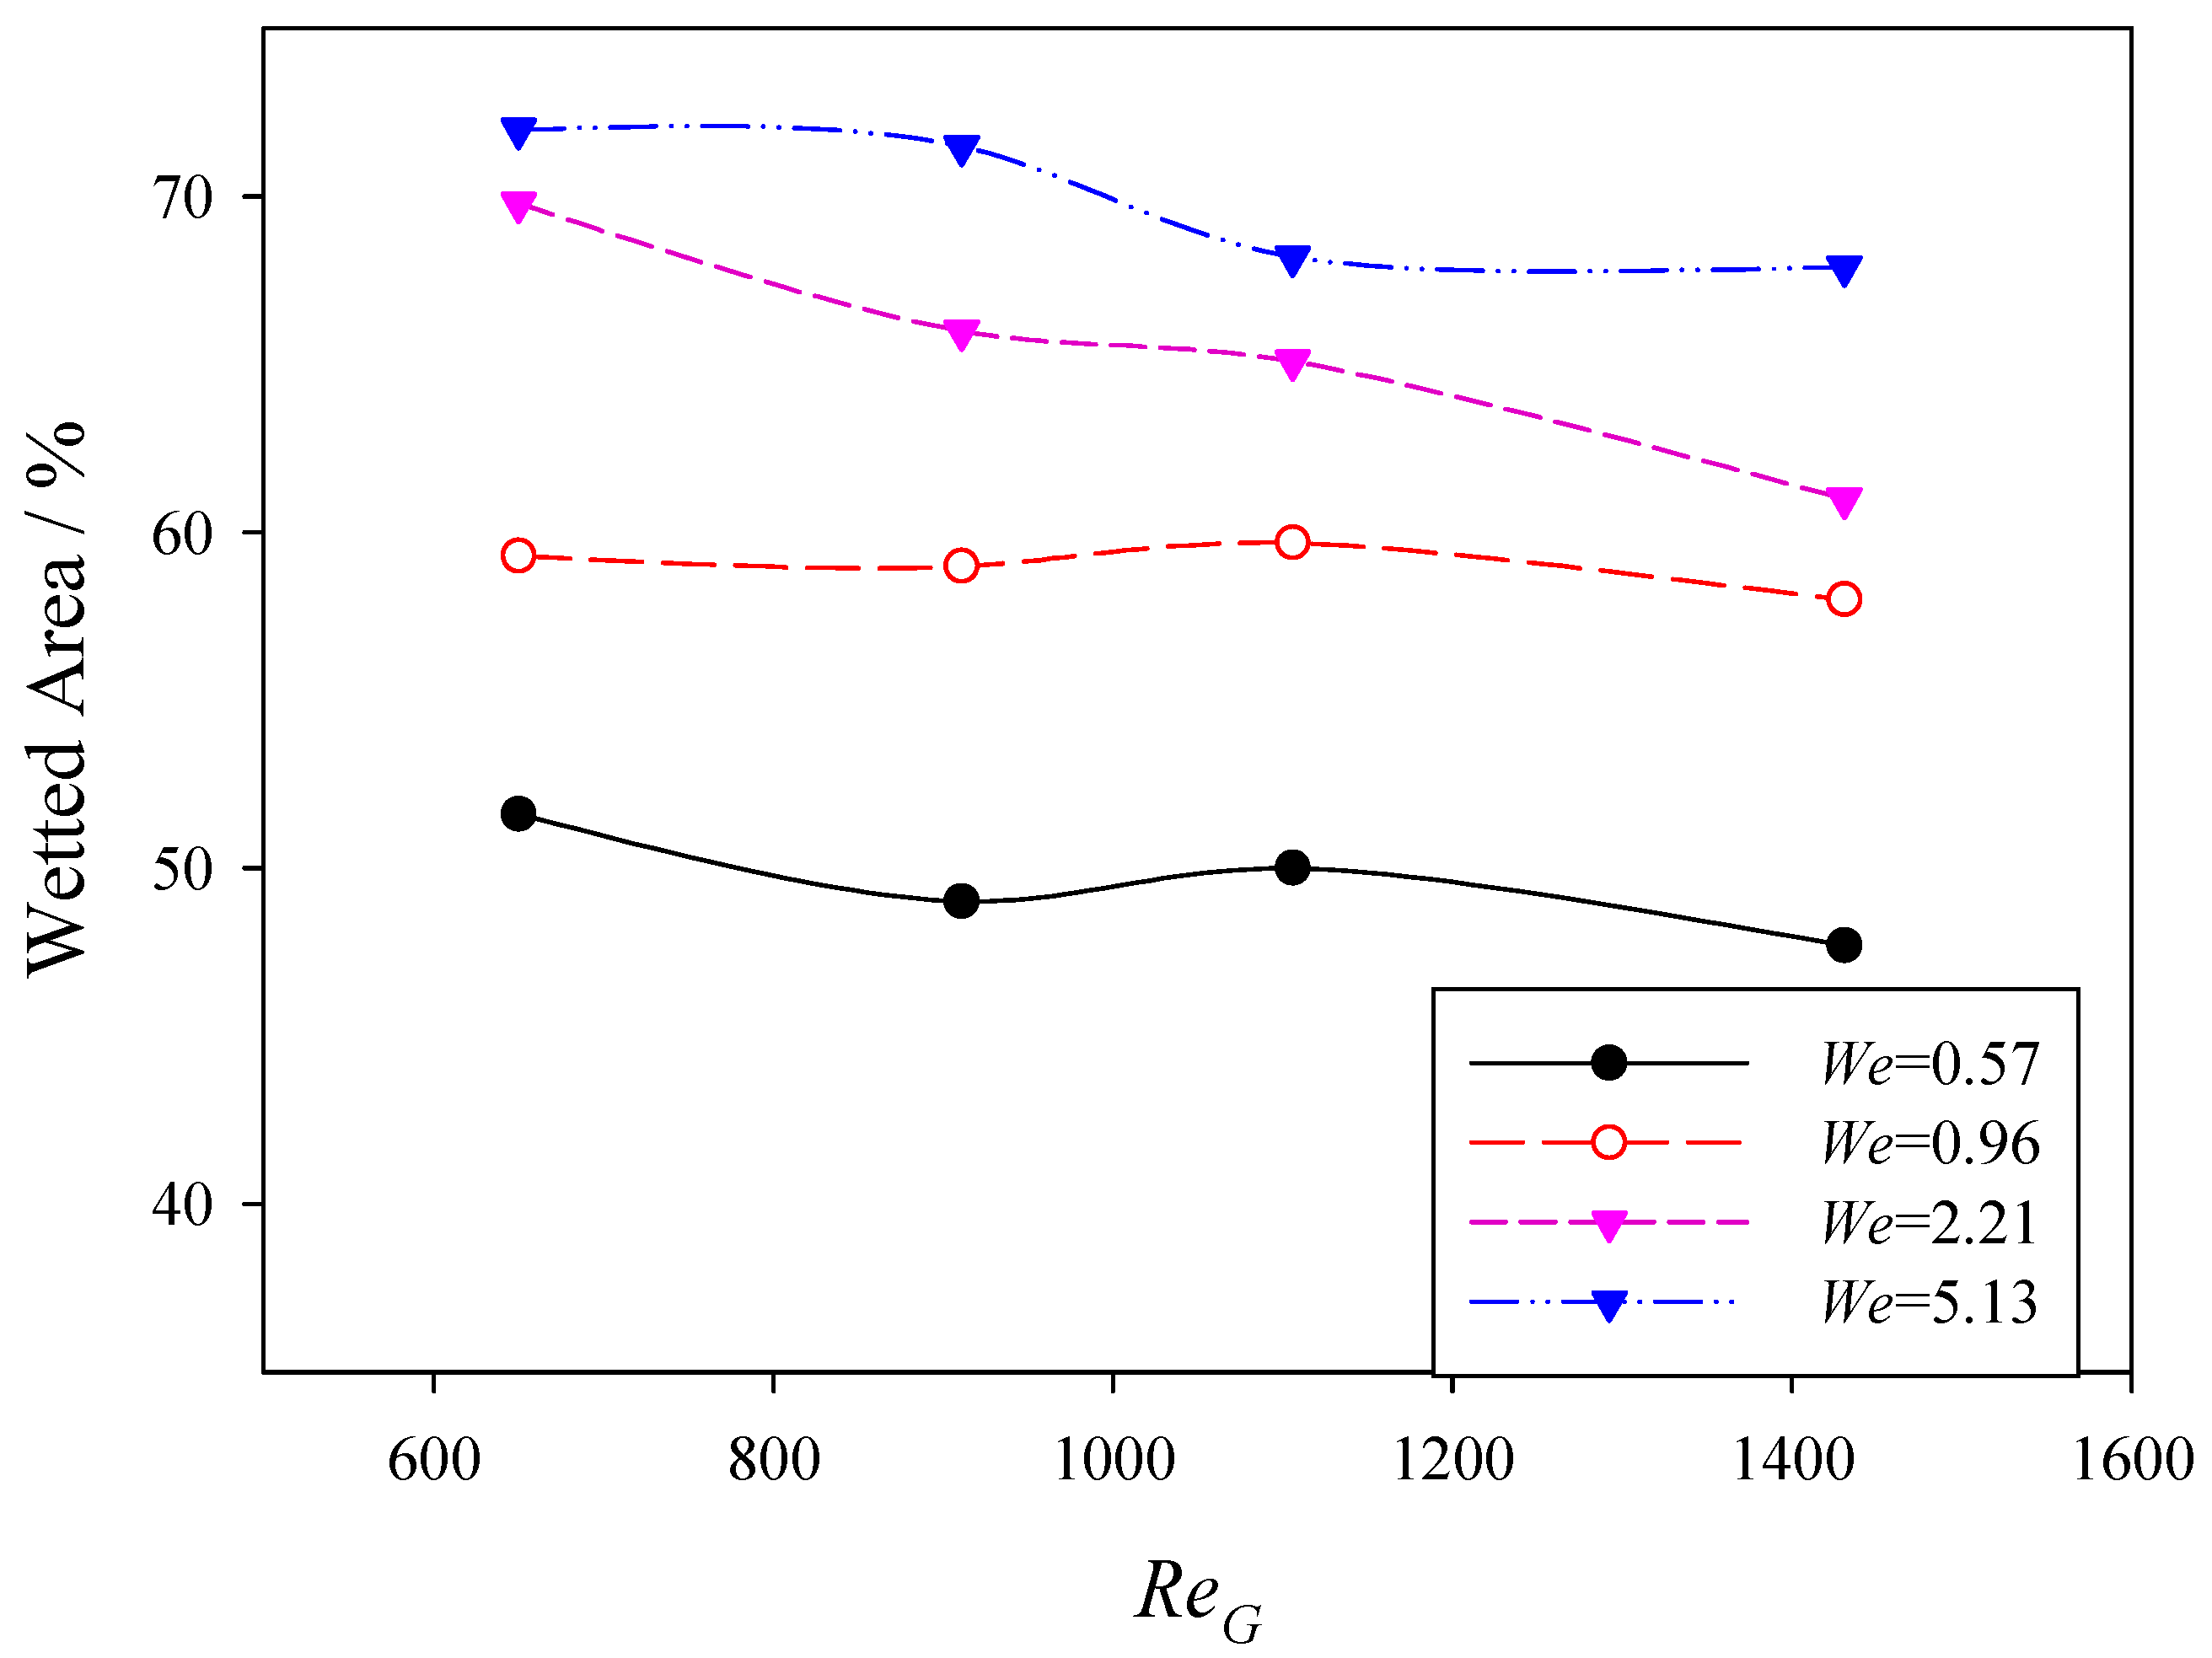
Figure 11.
Flow development with time at and We = 5.13 (red color represents 100 vol. % of liquid and blue color represents 100 vol. % of gas).
Figure 11.
Flow development with time at and We = 5.13 (red color represents 100 vol. % of liquid and blue color represents 100 vol. % of gas).
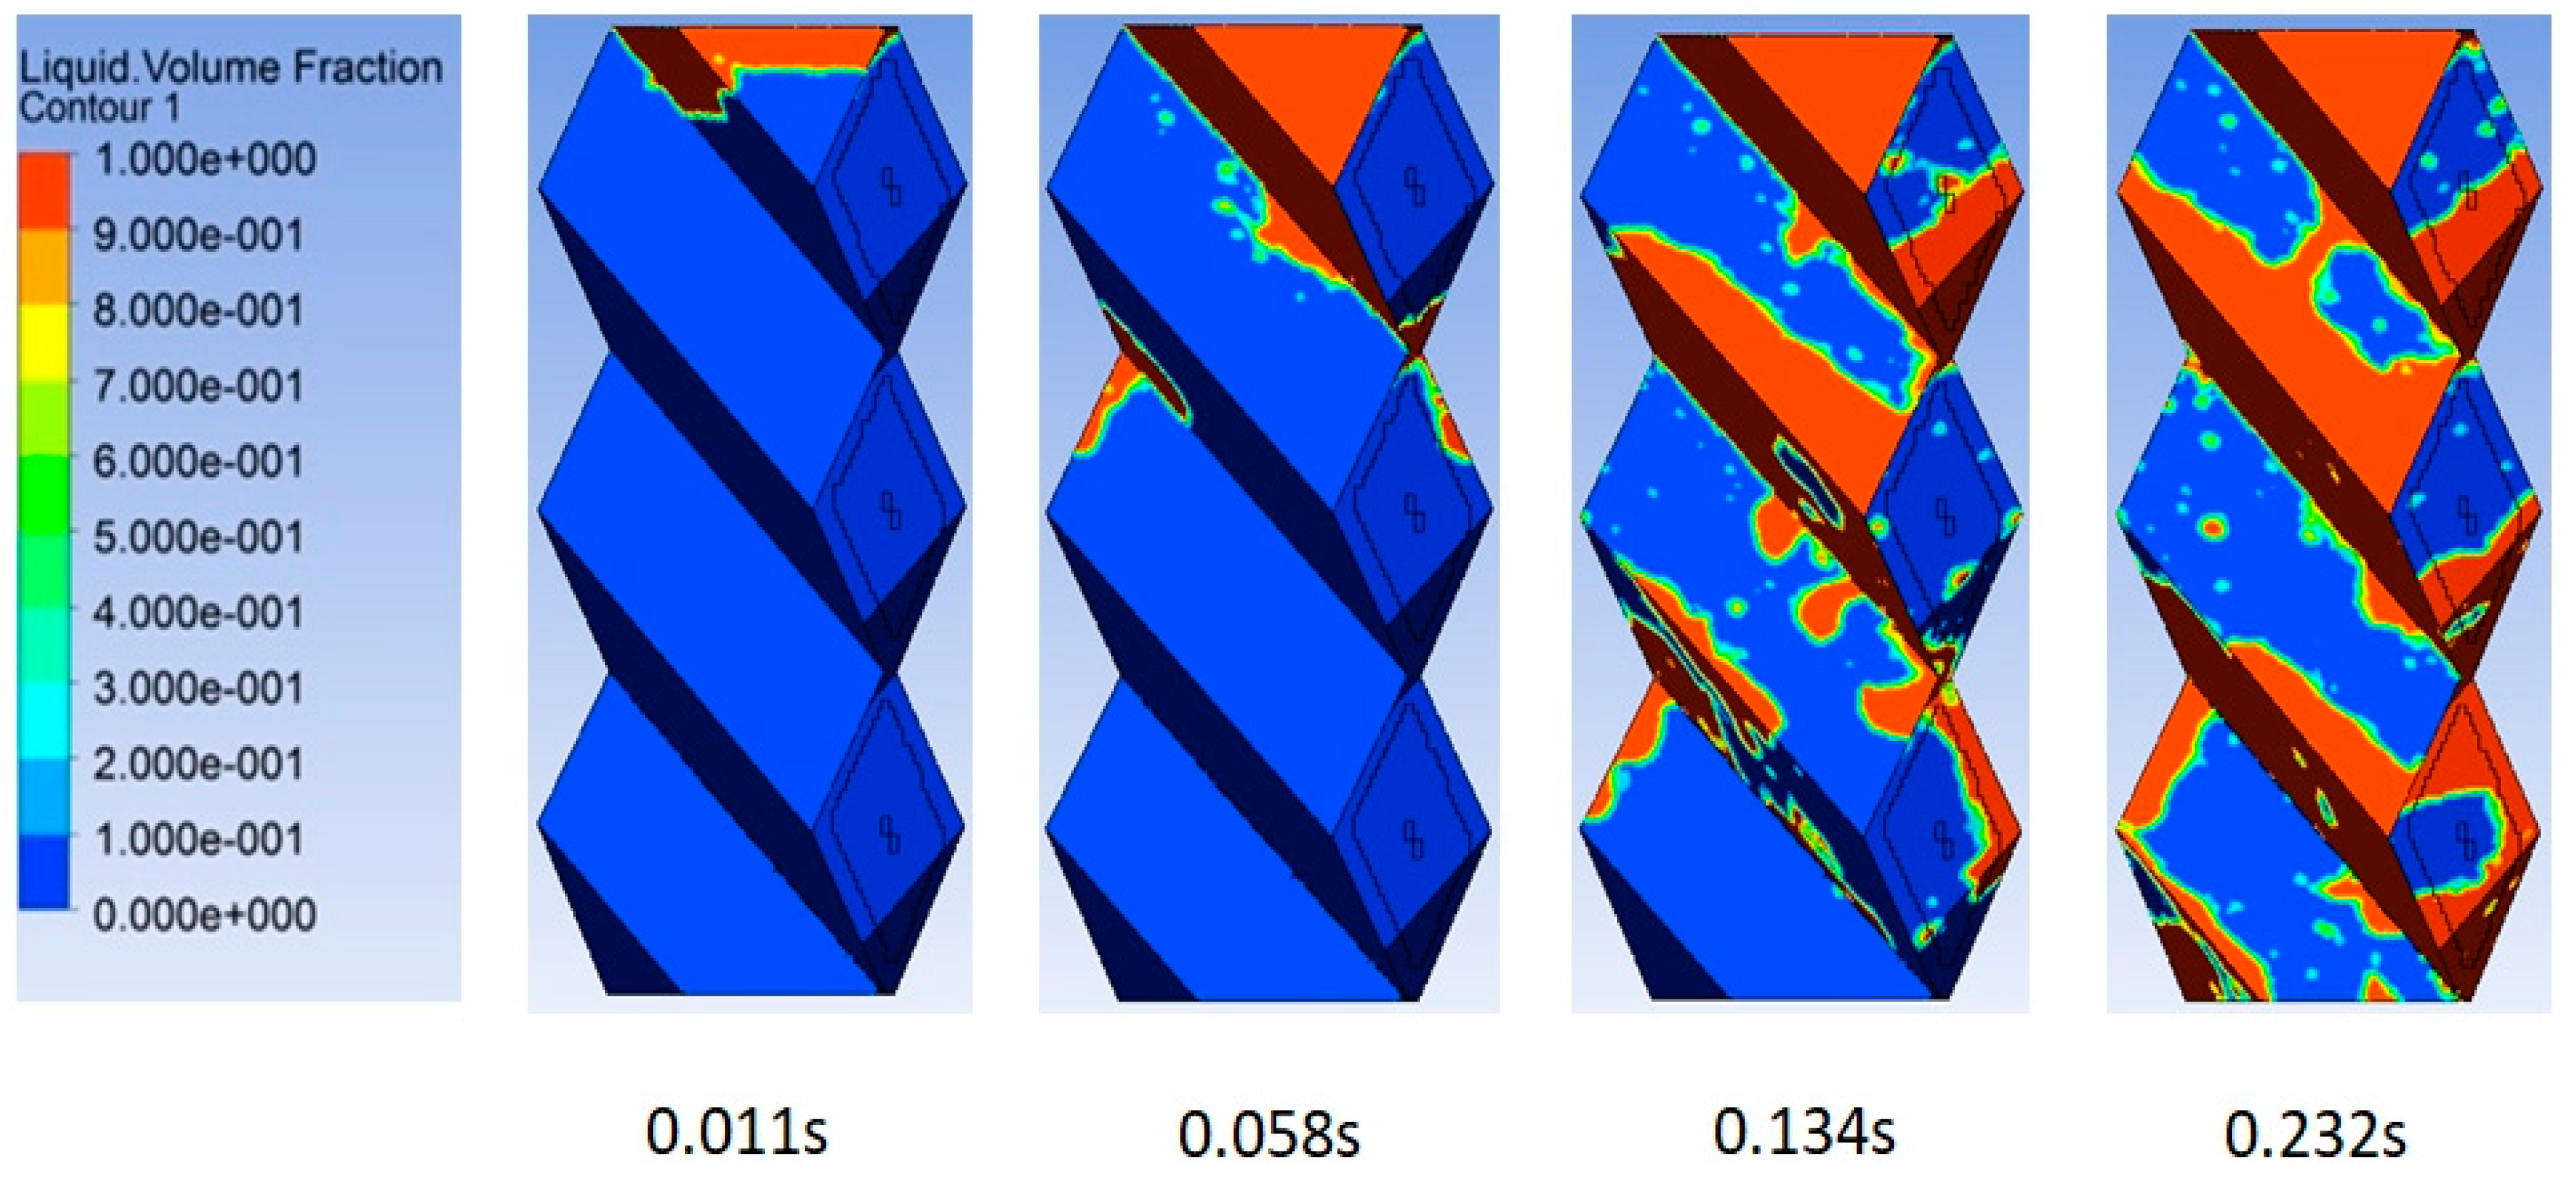
Figure 12.
Gas and liquid flow vectors at and We = 5.13. (a) The velocity vectors in the whole domain. (b) Velocity vectors in a neck area or element channel within the packing.
Figure 12.
Gas and liquid flow vectors at and We = 5.13. (a) The velocity vectors in the whole domain. (b) Velocity vectors in a neck area or element channel within the packing.

Figure 13.
Film thicknesses as a function of liquid flow rates at constant (a red color represents 100 vol. % of liquid and blue color is 100 vol. % of gas).
Figure 13.
Film thicknesses as a function of liquid flow rates at constant (a red color represents 100 vol. % of liquid and blue color is 100 vol. % of gas).

Figure 14.
Influence of gas flow rate on film thickness under fixed liquid flow rate.


Table 1.
Computational fluid dynamics (CFD) models in structured-packing bed hydrodynamic study.
| Reference | Geometry Models | Contribution |
|---|---|---|
| Yu et al. (2018) [17] | 2D Structured and 3D Porous Model | From the 2D volume of fluid (VOF) model, the accumulation of the liquid in the troughs of the rough surface caused the average film thickness to be larger on the rough surface than on the smooth surface, particularly for low liquid loads. In the 3D VOF model, the flow paths were similar on the two surfaces, but the effective wetted area was slightly larger on the rough surface than on the smooth surface. |
| Olenberg et al. (2017) [18] | Montz B1-250 Structured Model | Built a single-phase CFD simulation model, and predicted the pressure drop in structured packings. |
| Haroun et al. (2014) [19] | 3-D Vertical Plate Model | Prediction of effective area and liquid hold-up in structured packings. |
| Ding et al. (2015) [20] | 3D Structured Model | Characterized the pressure drop trend. |
| Fourati et al. (2013) [21] | 1D Model | The Eulerian two-fluid framework with user-defined functions and associated models are taken into account in the liquid dispersion model. |
| Haroun et al. (2012) [22] | 2-D Structured Packing Model | Studied mass transfer and liquid hold-up in a 2D cross section structured packing using the VOF method. |
Table 2.
Details of boundary conditions of all simulations.
| Boundary | Materials | Type | Value | Velocity | Reynolds Number | Weber Number |
|---|---|---|---|---|---|---|
| Liquid inlet | Water | Mass Flow Rate | 12.2–48.8 m3/(m2·h) | 0.015–0.6 m/s | 15–600 | 0.02–5.13 |
| Gas inlet | Air | Velocity m/s | 0.5–1.1 m/s | 0.5–1.1 m/s | 325–1200 | - |
| Liquid outlet | - | Pressure-outlet | 0 Pa | - | - | - |
| Gas outlet | - | Pressure-outlet | 0 Pa | - | - | - |
© 2018 by the authors. Licensee MDPI, Basel, Switzerland. This article is an open access article distributed under the terms and conditions of the Creative Commons Attribution (CC BY) license (http://creativecommons.org/licenses/by/4.0/).
Share and Cite
MDPI and ACS Style
Yang, L.; Liu, F.; Saito, K.; Liu, K. CFD Modeling on Hydrodynamic Characteristics of Multiphase Counter-Current Flow in a Structured Packed Bed for Post-Combustion CO2 Capture. Energies 2018, 11, 3103. https://doi.org/10.3390/en11113103
AMA Style
Yang L, Liu F, Saito K, Liu K. CFD Modeling on Hydrodynamic Characteristics of Multiphase Counter-Current Flow in a Structured Packed Bed for Post-Combustion CO2 Capture. Energies. 2018; 11(11):3103. https://doi.org/10.3390/en11113103
Chicago/Turabian StyleYang, Li, Fang Liu, Kozo Saito, and Kunlei Liu. 2018. "CFD Modeling on Hydrodynamic Characteristics of Multiphase Counter-Current Flow in a Structured Packed Bed for Post-Combustion CO2 Capture" Energies 11, no. 11: 3103. https://doi.org/10.3390/en11113103
Note that from the first issue of 2016, this journal uses article numbers instead of page numbers. See further details here.