Permeability Evolution of Pyrolytically-Fractured Oil Shale under In Situ Conditions


1
Key Laboratory of In-Situ Property-Improving Mining of Ministry of Education, Taiyuan University of Technology, Taiyuan 030024, Shanxi, China
2
Department of Geology, Hebei Vocational College of Geology, Shijiazhuang 050081, Hebei, China
3
Department of Mining Engineering, Taiyuan University of Technology, Taiyuan 030024, Shanxi, China
4
Energy and Mineral Engineering & Geosciences, EMS Energy Institute and G3 Center, The Pennsylvania State University, University Park, Pennsylvania, PA 16802, USA
*
Author to whom correspondence should be addressed.
Energies 2018, 11(11), 3033; https://doi.org/10.3390/en11113033
Submission received: 9 September 2018
/
Revised: 16 October 2018
/
Accepted: 24 October 2018
/
Published: 5 November 2018
Abstract
:In-situ injection of steam for heating of the subsurface is an efficient method for the recovery of oil and gas from oil shale where permeability typically evolves with temperature. We report measurements on Jimusar oil shales (Xinjiang, China) at stepped temperatures to 600 °C and under recreated in situ triaxial stresses (15 MPa) and recover permeability evolution with temperature and stress. Initial very low permeability evolves with the temperature above an initial threshold temperature at high rate before reaching a plateau in permeability above a peak temperature. The threshold temperature triggering the initial rapid rise in permeability is a function of triaxial stresses. For Jimusar oil shale, this threshold temperature ranges from 200 °C to 250 °C for burial depths of 500 m and from 350 °C to 400 °C for burial depths of 1000 m. This rapid rise in permeability correlates with the vigor of pyrolysis and directly scales with the production rate of pyrolysis-derived gas production. The permeability increases with temperature to a plateau in peak permeability that occurs at a peak-permeability temperature. This peak temperature is insensitive to stress and is in the range 450 °C to 500 °C for all Jimusar samples. Pyrolysis plays an important role in the stage of rapid permeability evolution with this effect stopping once pyrolysis is essentially complete. At these ultimate high temperatures, permeability exhibits little reduction due to stress and remains elevated due to the vigor of the pyrolysis. These results effectively demonstrate that oil shale may be transformed by pyrolysis from a tight porous medium into highly permeable medium and that oil and gas may be readily recovered from it.
1. Introduction
Oil shale is an attractive supplemental energy source for petroleum. The reserve of oil shale may be estimated at a trillion tons [1]. The oil shale retorting technology has a long history and different technologies have been developed [2,3,4,5,6]. Presently, in-situ mining technology is gaining more attention because of its advantages [7]. China is rich in oil shale reserves with 4.76 × 10¹⁰ tons that could significantly increase the petroleum supply [8]. The in situ mining of oil shale is a potentially environmentally friendly method to recover hydrocarbons as excavation, retorting, then spoiling is not required. In the in-situ process of mining, heat is injected into the oil shale stratum and pyrolyzes the organic matter. Then, the shale oil and hydrocarbon gas can be recovered [9,10,11,12]. The advantages of such in-situ mining involves no large-scale mining, nor equipment, nor waste-rock production and allows for the control of environmental pollution.
Permeability is a key parameter which controls the potential to recover the retorted chemicals from the geological host. Many factors influence rock permeability—paramount among them are effective stresses and temperature. At room temperature (RT), the permeability of intact and fractured rocks, generally decreases with increasing effective stresses [13,14,15,16,17]. Permeability may be enhanced by thermal fracturing when the rock is heated to a high temperature. The permeability of Beishan and Daqing granites, when heated then cooled to RT, has been shown to first increase slowly at low temperature, then increase as temperature transits from 20 °C to 900 °C. The threshold value of permeability for Beishan granite is between 300 °C and 400 °C and for Daqing granite between 200 °C and 300 °C [18]. The permeability evolution of Luhui granite shows a threshold temperature (Tc) for permeability change that activates permeability in the thermally cracked granite. The magnitude of permeability is 10−7D with only a slight increase below Tc with permeability increasing dramatically from 10−6D as temperatures approach 300–400 °C to 10−5D at 400 °C [19]. This threshold temperature for permeability gain in sandstone has been identified as 400–500 °C. The initial permeability of sandstone (under certain pressure conditions) has been found to have a nonlinearity with a rising temperature [20]. Zhang performed real-time permeability experiments on fine-grained feldspar-rich sandstone where permeability first increases at low temperature, then increases abruptly at a threshold temperature of 200 °C, then decreases at temperatures between 200 °C and 400 °C, before finally increasing from 400 °C to 600 °C [21].
These studies mainly focus on permeability evolution with temperature of rocks composed of inorganic minerals. Few studies explore the permeability of organic-rich rocks such as coal and oil shale at incremented temperature. However, such studies are important for underground coal gasification and in-situ extraction in oil shale and low-rank coal by injecting heat. Understanding the permeability sensitivity to reservoir temperature change is crucial to defining fluid flow as an increase temperature may cause a loss in productivity in oil and gas wells. Permeability of low-rank lignite exhibits an increasing and periodic change at temperatures from RT to 650 °C [22]. Feng et al. [23] investigated the permeability of anthracite and coal at high temperature and under triaxial stresses and found that coal permeability could be divided into three stages by a critical temperature and peak temperature from RT to 600 °C. The critical temperature of anthracite is from 150 °C to 200 °C with a peak temperature between 450 °C and 500 °C. For coal, these range from 200 °C to 250 °C for the critical temperature of coal with no peak temperature emerging from RT to 400 °C. Kang et al. [24,25] reported results for heated Fushun oil shale where a small quantity of micro—fissures formed in the specimen mainly along the original bedding and at the boundaries of hard mineral particles under 300 °C. The thermal fissure surfaces are sub-parallel to the original bedding. The quantity, length and width of the fissures increased rapidly at above 300 °C due to chemical reactions within the oil shale. The corresponding permeability was measured at temperatures to 500 °C showing that permeability dramatically grew at about 350 °C. Zhao et al. [26] also analyzed the law of pore structure and porosity of Daqing and Yan’an oil shale by computed tomography (CT) imaging and found out that organic matter thermal decomposition at high temperatures led to changes in the structure of Daqing oil shale. When the temperature reached 200 °C, many pores were developed in the original sample. At high temperature, organic matter began to decompose, and then the gas and oil was generated, and lastly many pores were formed. With the temperature rising, the number of the pores increased and became interconnected by cracks that also formed. Heterogeneous thermal dilation was a main factor leading to changes in the pore structure of Yan’an oil shale. At 200 °C, many fractures parallel to the primary bedding were developed, which expanded with the rising temperature. The internal structure of oil shale was changed by high temperature and formed a porous medium including pores and cracks [26].
Clearly, the permeability evolution and sensitivity to temperature is a key parameter in the in-situ retorting of oil shale. Xinjiang is rich in oil shale resources and here we evaluate methods for the economic recovery at temperature up to 600 °C. We report on experiments on Jimusar oil shale from Xinjiang at in situ triaxial stresses and at temperatures to 600 °C.
2. Experimental Method and Procedures
2.1. Samples
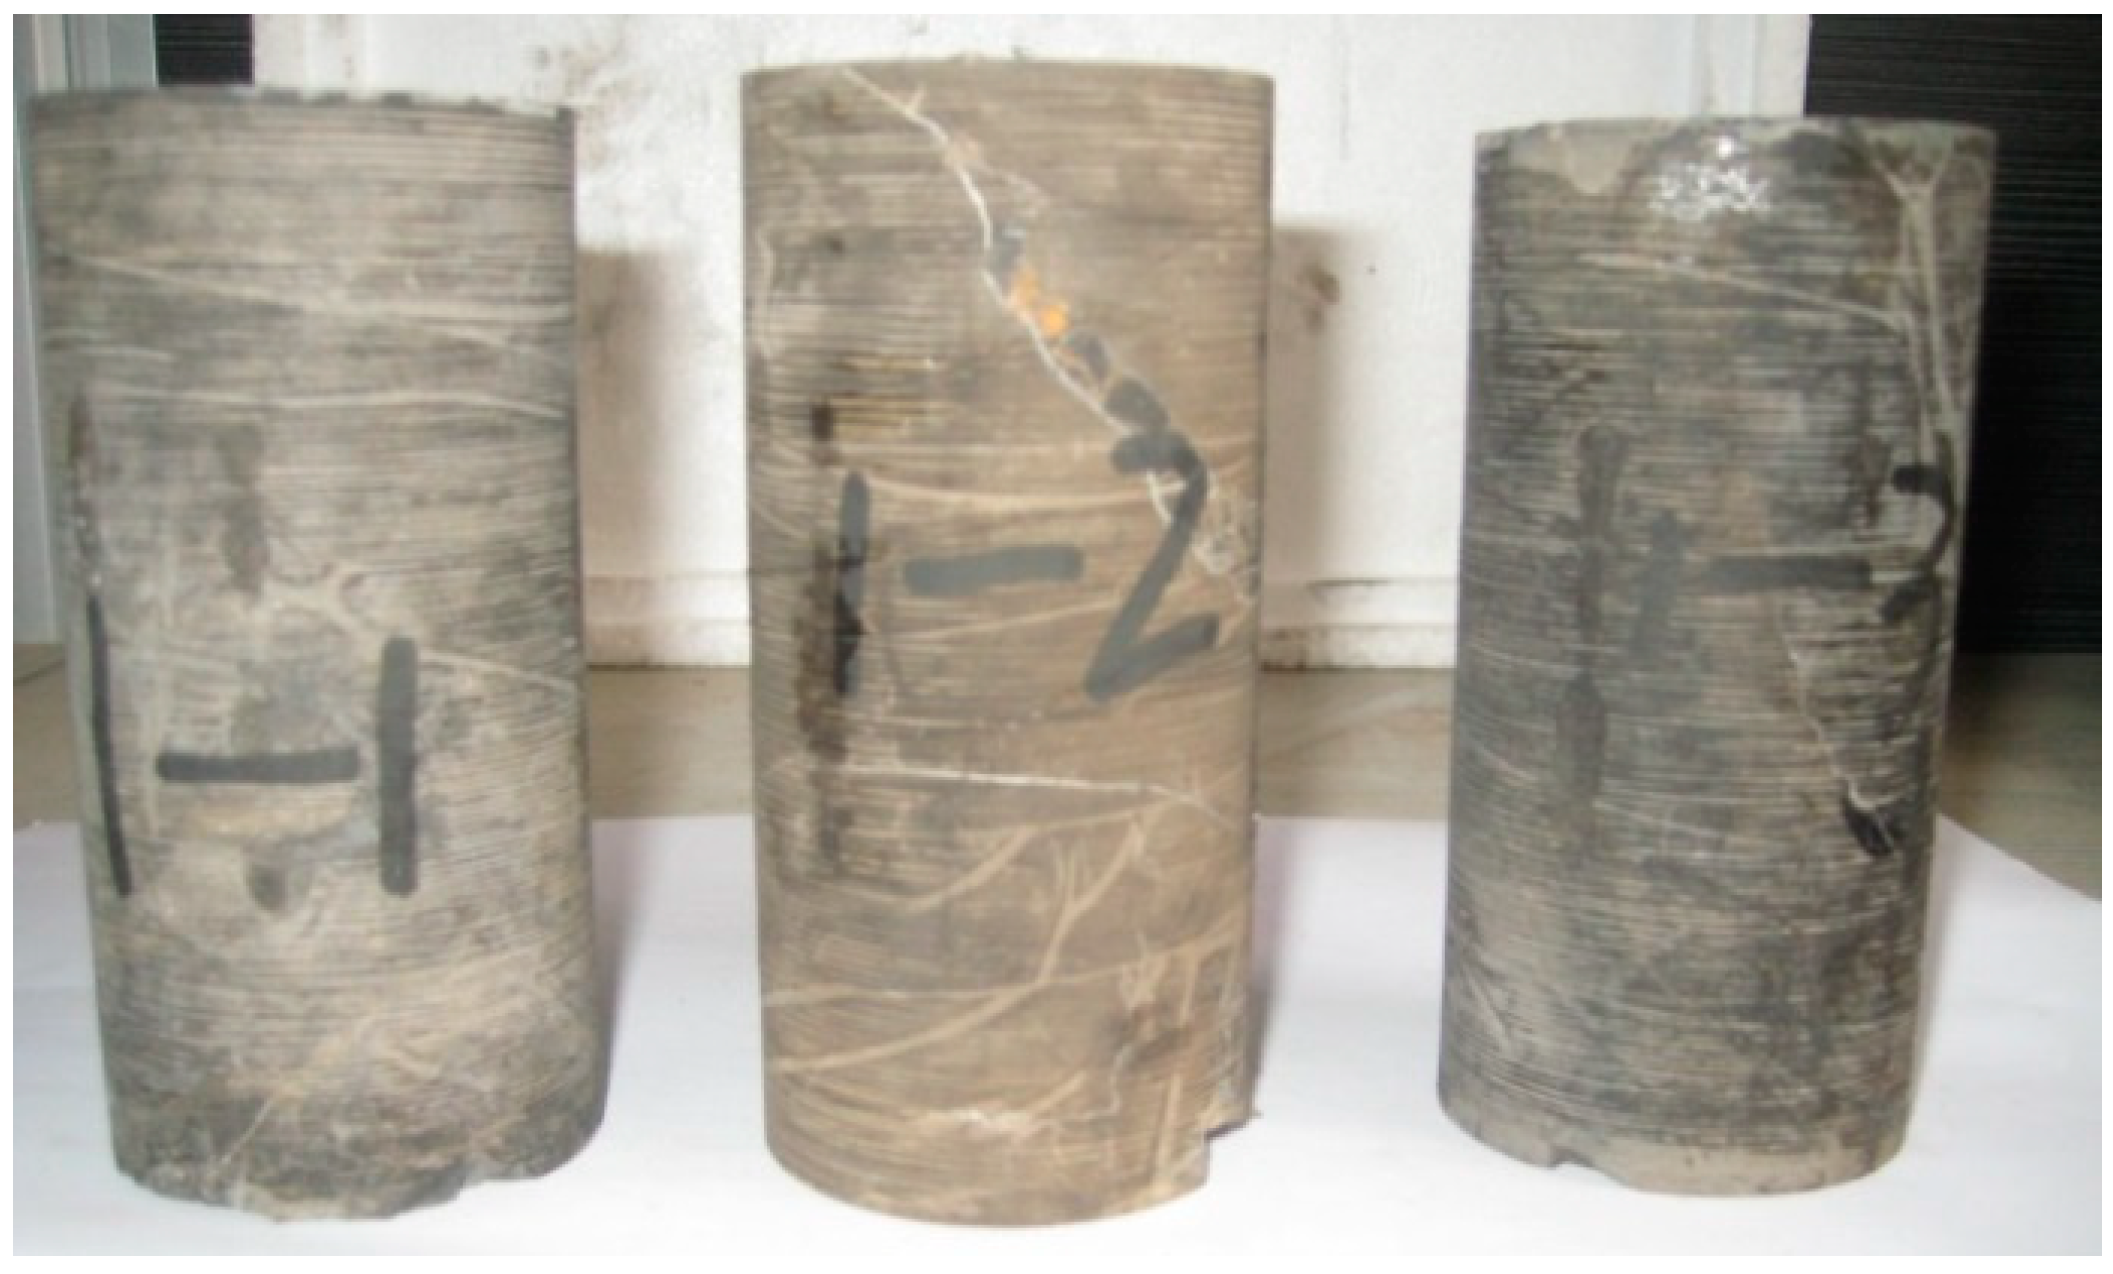
Large block samples of oil shale were collected from an open-pit mine in Jimsar, Xinjiang province in China. They were coated with paraffin wax to maintain them in their natural water-saturated state. Cylindrical samples were then cored from these block samples and turned on a lathe to standard size of 50 mm in diameter and 100 mm long. The longitudinal axis of all samples was perpendicular to bedding. The samples are gray (Figure 1) and have a silty structure with a density of 2.40 g/cm3. Proximate analysis and elemental analysis of samples are shown in Table 1 and Table 2. The diameters of three samples are 48.87 mm, 49.27 mm and 49.20 mm, respectively. The average diameter is 49.11 mm with standard deviation of 0.17 mm.
2.2. Experimental Procedures
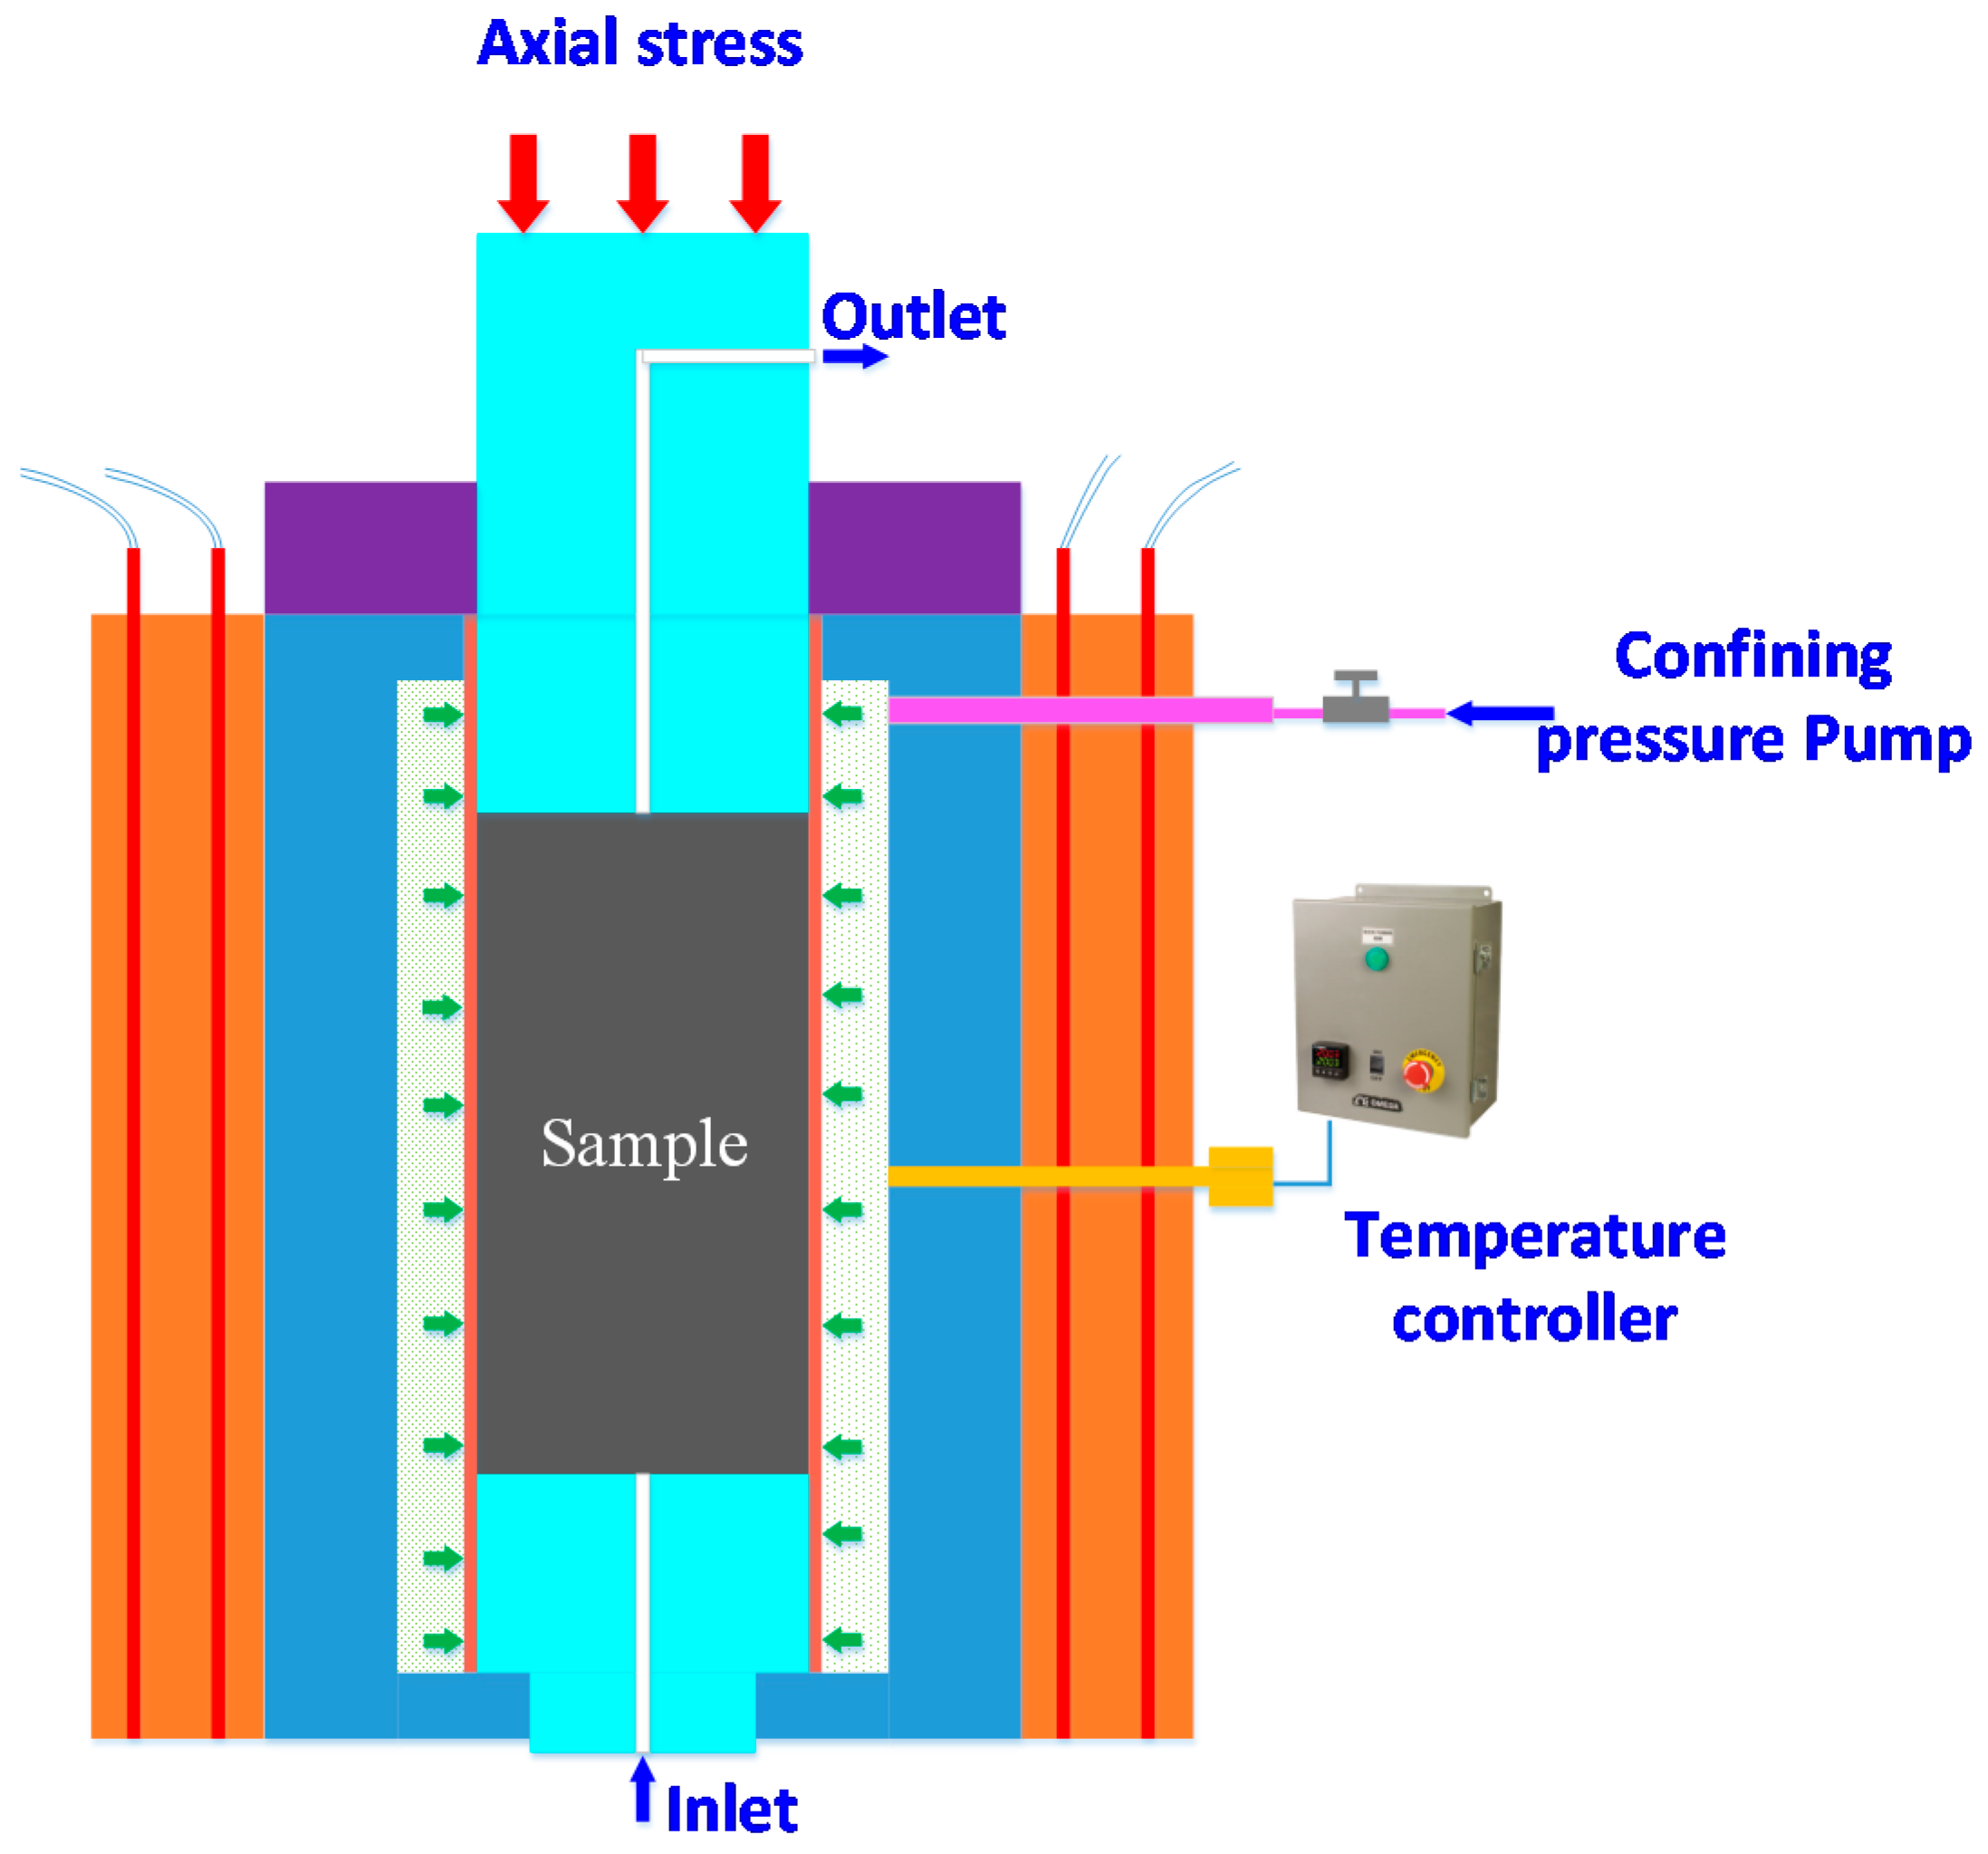
A loading frame and core holder capable of applying and sustaining high temperature and triaxial stresses was employed to perform the permeability measurements at temperatures to 600 °C and at stress to 15 MPa. An axial stress is applied by a hydraulic piston and confining pressure applied by compressed gas. The sample was sheathed and sealed in red copper as shown in Figure 2. Temperature in the sample was measured by thermocouple with a heating rate of 15 °C/h applied and controlled by the heating system.
Two in-situ ground stress levels were applied to the samples. For samples 1# and 2#, an axial stress of 12.5 MPa and a confining stress of 15 MPa were applied. This corresponds to a burial depth of 500 m. Hence, the axial stress on sample 1# and 2# is uniform due to almost equal diameter in these two samples. For sample 3#, equal axial and confining stresses of 25 MPa was applied–corresponding to a burial depth of 1000 m. Triaxial stresses were first applied to samples at RT, followed by permeability measurement. The samples were then heated to target temperatures from 50 °C to 600 °C in 50 °C steps. Each target temperature was sustained for 2 h in order to ensure a uniform temperature distribution in the samples. This was then followed by nitrogen permeability measurements. Due to the discharge of pyrolysis-induced gas during heating, permeability measurement was performed only after the complete discharging of that gas.
3. Results
The steady flow method was used to measure permeability change in the oil shale, at different temperatures, up to 600 °C. The permeability was calculated from Darcy’s law as:
where k, μ, Q, L, A are gas permeability in m2, nitrogen dynamic viscosity at appropriate temperatures in , measured flow rate through sample in m3/s, length of sample in m, and sectional area of sample in m2, respectively. , , denote standard atmospheric pressure in MPa and nitrogen pressure of the inlet and outlet (MPa).
3.1. Permeability Evolution with Temperature
The permeability of the Jimsar oil shale evolved non-monotonically with temperature, as shown in Figure 3. The permeability progression can be divided into three transitional states during heating.
The low temperature stage is the first stage and is present from RT to 200–250 °C. In the first stage, permeability is very low and changes little. This is closely related to the mineral composition of the oil shale. Oil shale is composed of both inorganic minerals (mass fraction >90%) and organic matter (mass fraction <10%). Fine clay minerals such as illite, smectite and kaolinite are the main components. Hence, oil shale is of very low permeability and has low porosity at RT. Thermally induced micro-cracks would appear in the rock during heating and further augment permeability. However, for oil shale, the production of thermally induced cracks is suppressed due to the presence of its fine-grained structure. In addition, thermal expansion can reduce the opening of fissures including natural fissures and thermally induced cracks. For these combined reasons, the change in permeability below 200–250 °C remains very small.
The second stage of permeability evolution is where temperature ranges from 200–250 °C to 450–500 °C. Permeability increases from zero at 200–250 °C to approximately 3.5 × 10⁻¹⁶ m2 at 450–500 °C. At the beginning of this stage, where temperature ranges from 200–250 °C to 350–400 °C, thermal cracking is the main mechanism for permeability increase. Permeability sharply rises at temperatures greater than 350–400 °C. The pyrolysis of organic matter at high temperatures to 500 °C is likely the main contributor to this sharp increment in permeability increase.
The establishment of a plateau of high permeability is observed above 500 °C. This is the final stage where temperatures range from 500 °C to 600 °C. In this stage, organic matter in the oil shale engages in deep pyrolysis. Gas and/or oil production induced by this pyrolysis results in the development of many pores and fissures which significantly augment oil shale permeability. However, these newly-formed pores and fissures are also compressed by triaxial stresses, which resists further increase in permeability at this stage. As a result, permeability remains significantly elevated but changes little. Pyrolysis is the key process augmenting the permeability of tight oil shales.
The permeability of tight oil shales evolves with temperature with an initial increase in permeability at a threshold temperature and a permeability peak at a peak temperature. The threshold temperature ranges from 200 °C to 250 °C and the peak temperature ranges from 450 °C to 500 °C. These two key temperatures divide permeability into three stages. These comprise: (i) a very slow evolution at low temperature ranging from RT to the threshold temperature, (ii) a considerable increment in permeability at intermediate temperatures ranging from the threshold temperature to peak temperature, and (iii) a plateau of high permeability at high temperatures ranging from this peak temperature to 600 °C.
3.2. Effect of Stress on Permeability of Oil Shale at High Temperature
Generally, the incrementing of stress results in the reduction of permeability at RT. However, the few studies on oil shales reveal that this effect of stress on permeability at high temperatures is muted and countered by the positive effects of pyrolysis. We measure the permeability evolution of sample 3# at temperatures to 600 °C under hydrostatic axial and confining stresses of 25 MPa that corresponds to a burial depth of 1000 m. Similar to samples 1# and 2#, the permeability of sample 3# also experiences the three stages of permeability evolution, as shown in Figure 4. However, the threshold temperature is considerably higher than that in samples 1# and 2#, ranging from 350 °C to 400 °C. The reason may be that the opening of microcracks induced by thermal cracking is more readily countered by thermal expansion at high stress and greater confinement. Once organic matter begins to pyrolyze at 400 °C, new pores and fissures will emerge and result in a significant jump in permeability. The permeability may reach 7 × 10⁻¹⁶ m2 at the peak temperature of 500 °C, which is the same as the threshold temperature in samples 1# and 2#. Above peak temperature, the permeability exhibits a slight drop but still remains high. Hence, pyrolysis results in high permeability of oil shale at high temperature regardless of the stress state. The stress results in permeability reduction only at low temperature when it is not countered by pyrolysis-induced permeability increase.
4. Discussion
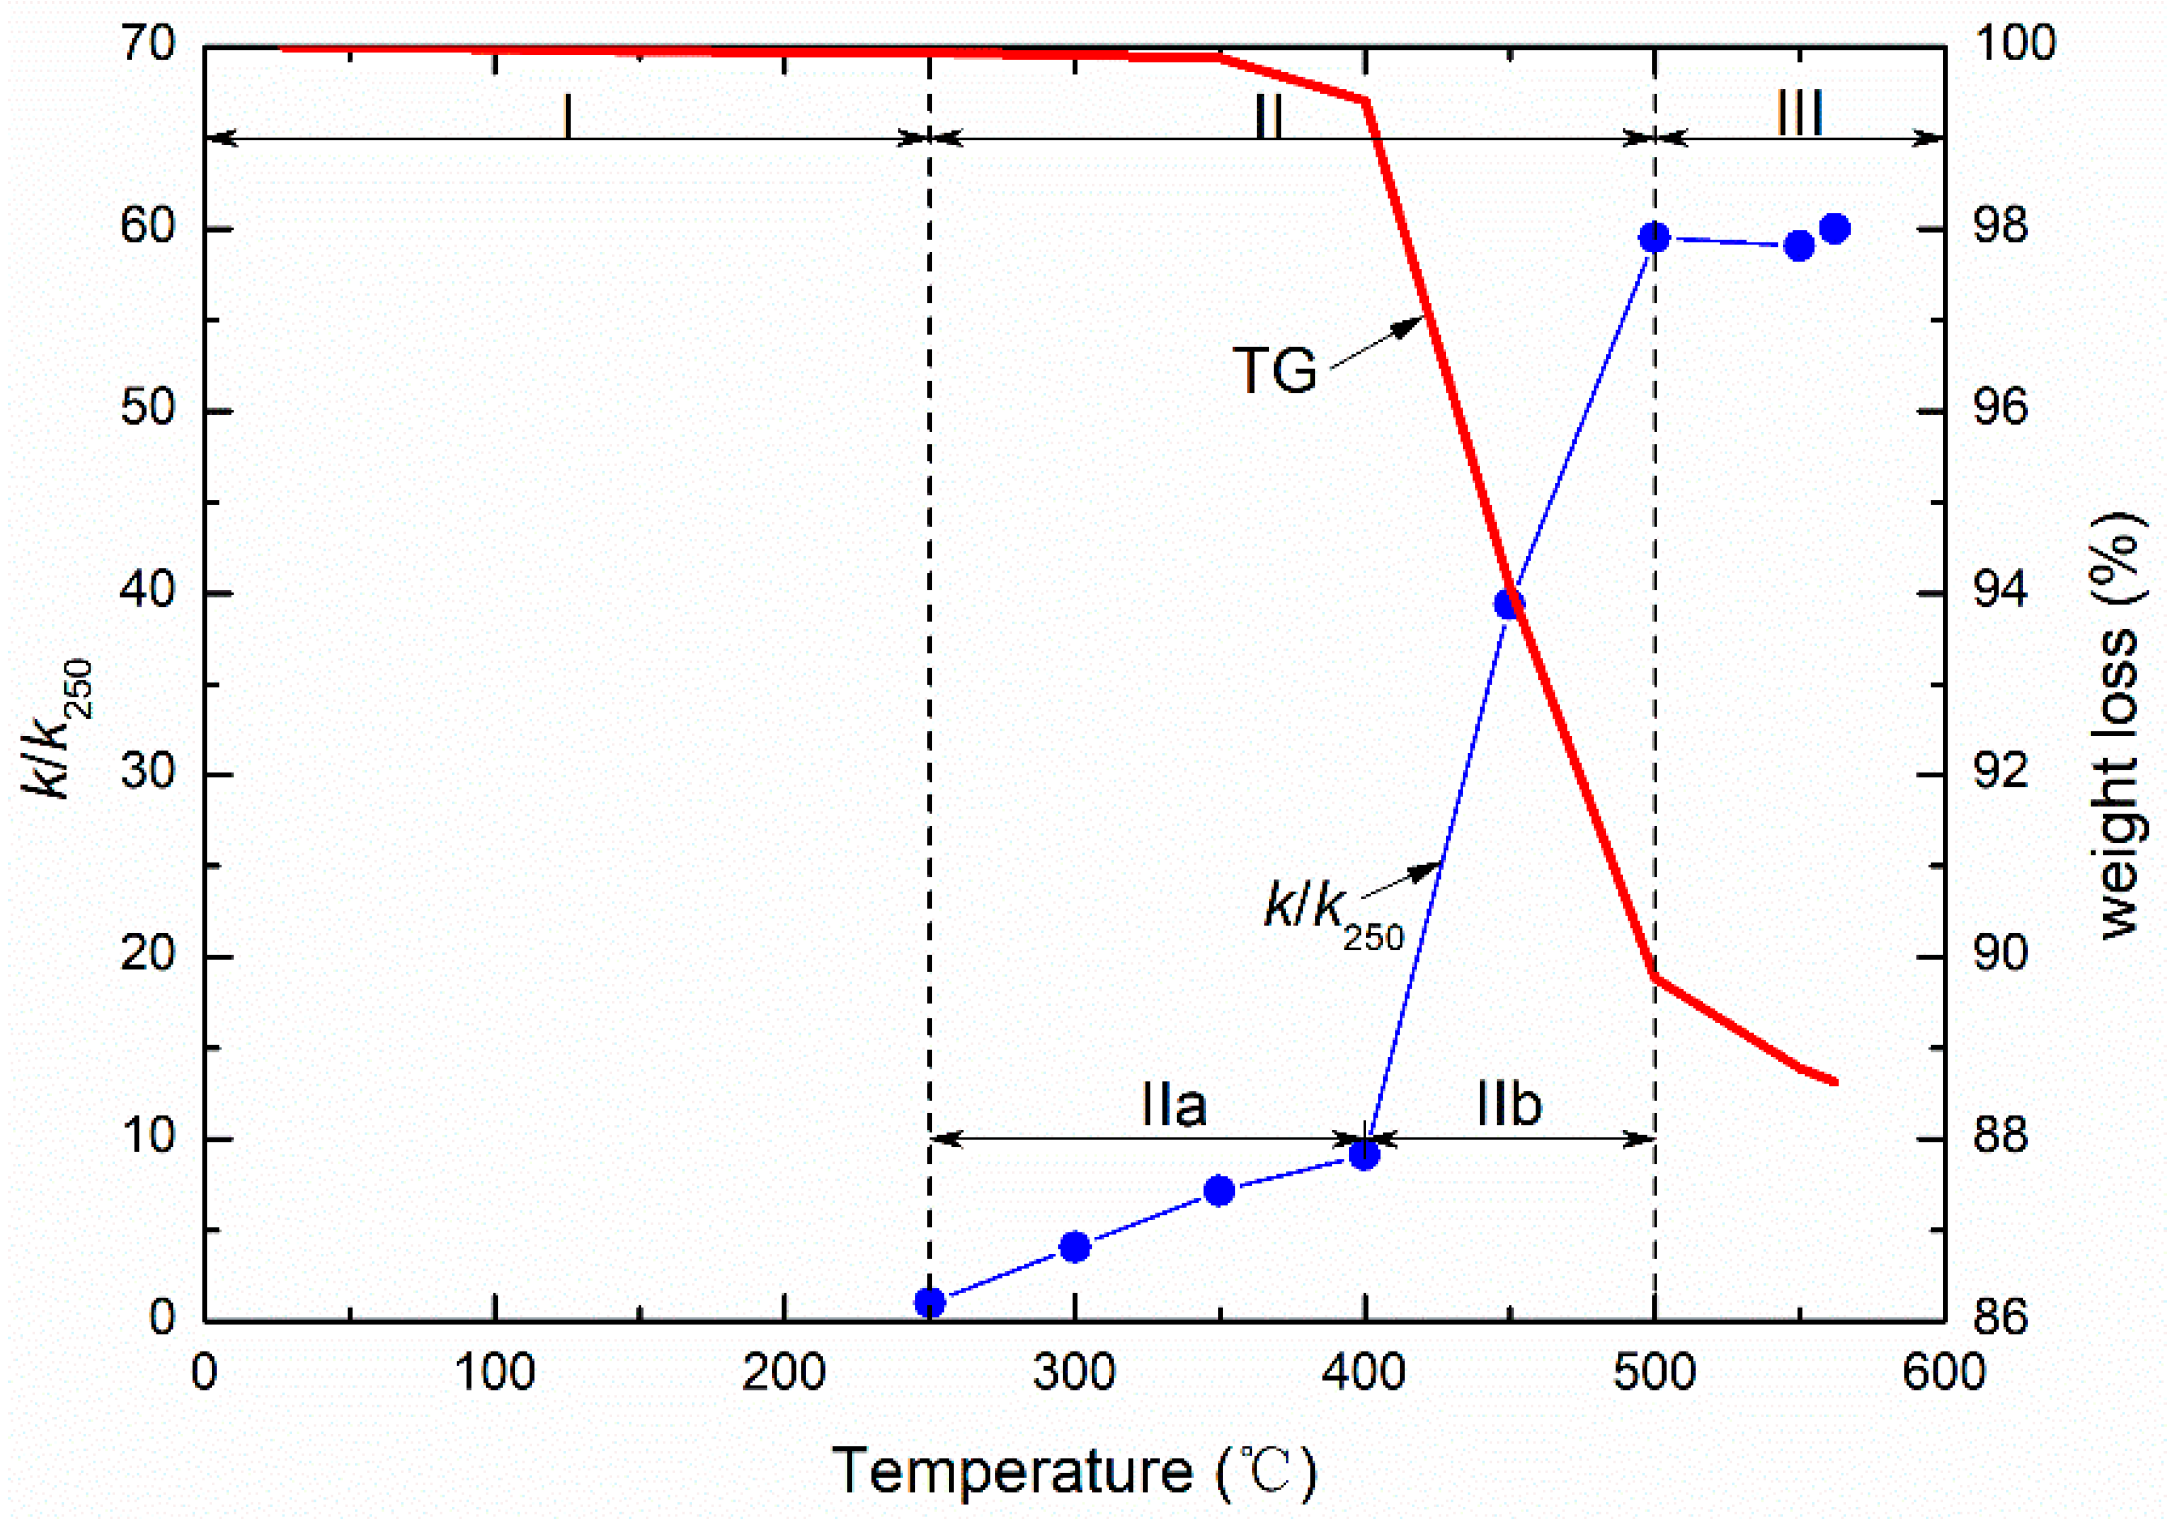
As mentioned above, permeability evolution with temperature may be closely related to the pyrolysis of organic matter. We measured weight loss of the oil shale at temperatures to 600 °C in order to analyze the effect of pyrolysis on permeability. Figure 5 shows the variation in permeability of sample 2# with temperature and corresponding weight loss (measured by mass thermogravimetry (TG)). The permeability increment is defined on the left axis (Figure 5) and is the ratio of permeability at high temperature (k) to that at 250 °C (k250). The reason for adopting the permeability at 250 °C as a baseline is that permeability can be measured only at 250 °C and is very low below 250 °C. These three stages of permeability evolution, shown in Figure 5, closely correspond to the three stages of pyrolysis in oil shale. At temperatures below 250 °C, effectively no permeability is measured–since pyrolysis is not yet activated in the shale. The organic matter in the oil shale begins to decompose and weight loss begins only at 250 °C. Two sub-stages IIa and IIb of permeability can be observed at 250–500 °C, shown in Figure 5. Weight loss induced by pyrolysis can also be also divided into two sub-stages. Hence, the initial but slight pyrolysis results in a slow increment of permeability increase, corresponding to sub-stage IIa. This is followed by deep pyrolysis which results in the drastic increase in permeability, apparent in stage IIb of Figure 5. In this sub-stage, weight loss changes from 99% to 90%, an increase of 9% (total about 12% within 600 °C). The corresponding pyrolysis-induced permeability increases from 10-fold at 400 °C to 60-fold at 500 °C. The rate of weight loss per degree centigrade slows above 500 °C, suggesting that pyrolysis has completed and changes abate at 400–500 °C. The corresponding permeability exhibits a small reduction due to stress effects driven by thermal strains but remains high. Hence, pyrolysis plays a crucial role in permeability evolution and fundamentally changes permeability tendency and magnitude.
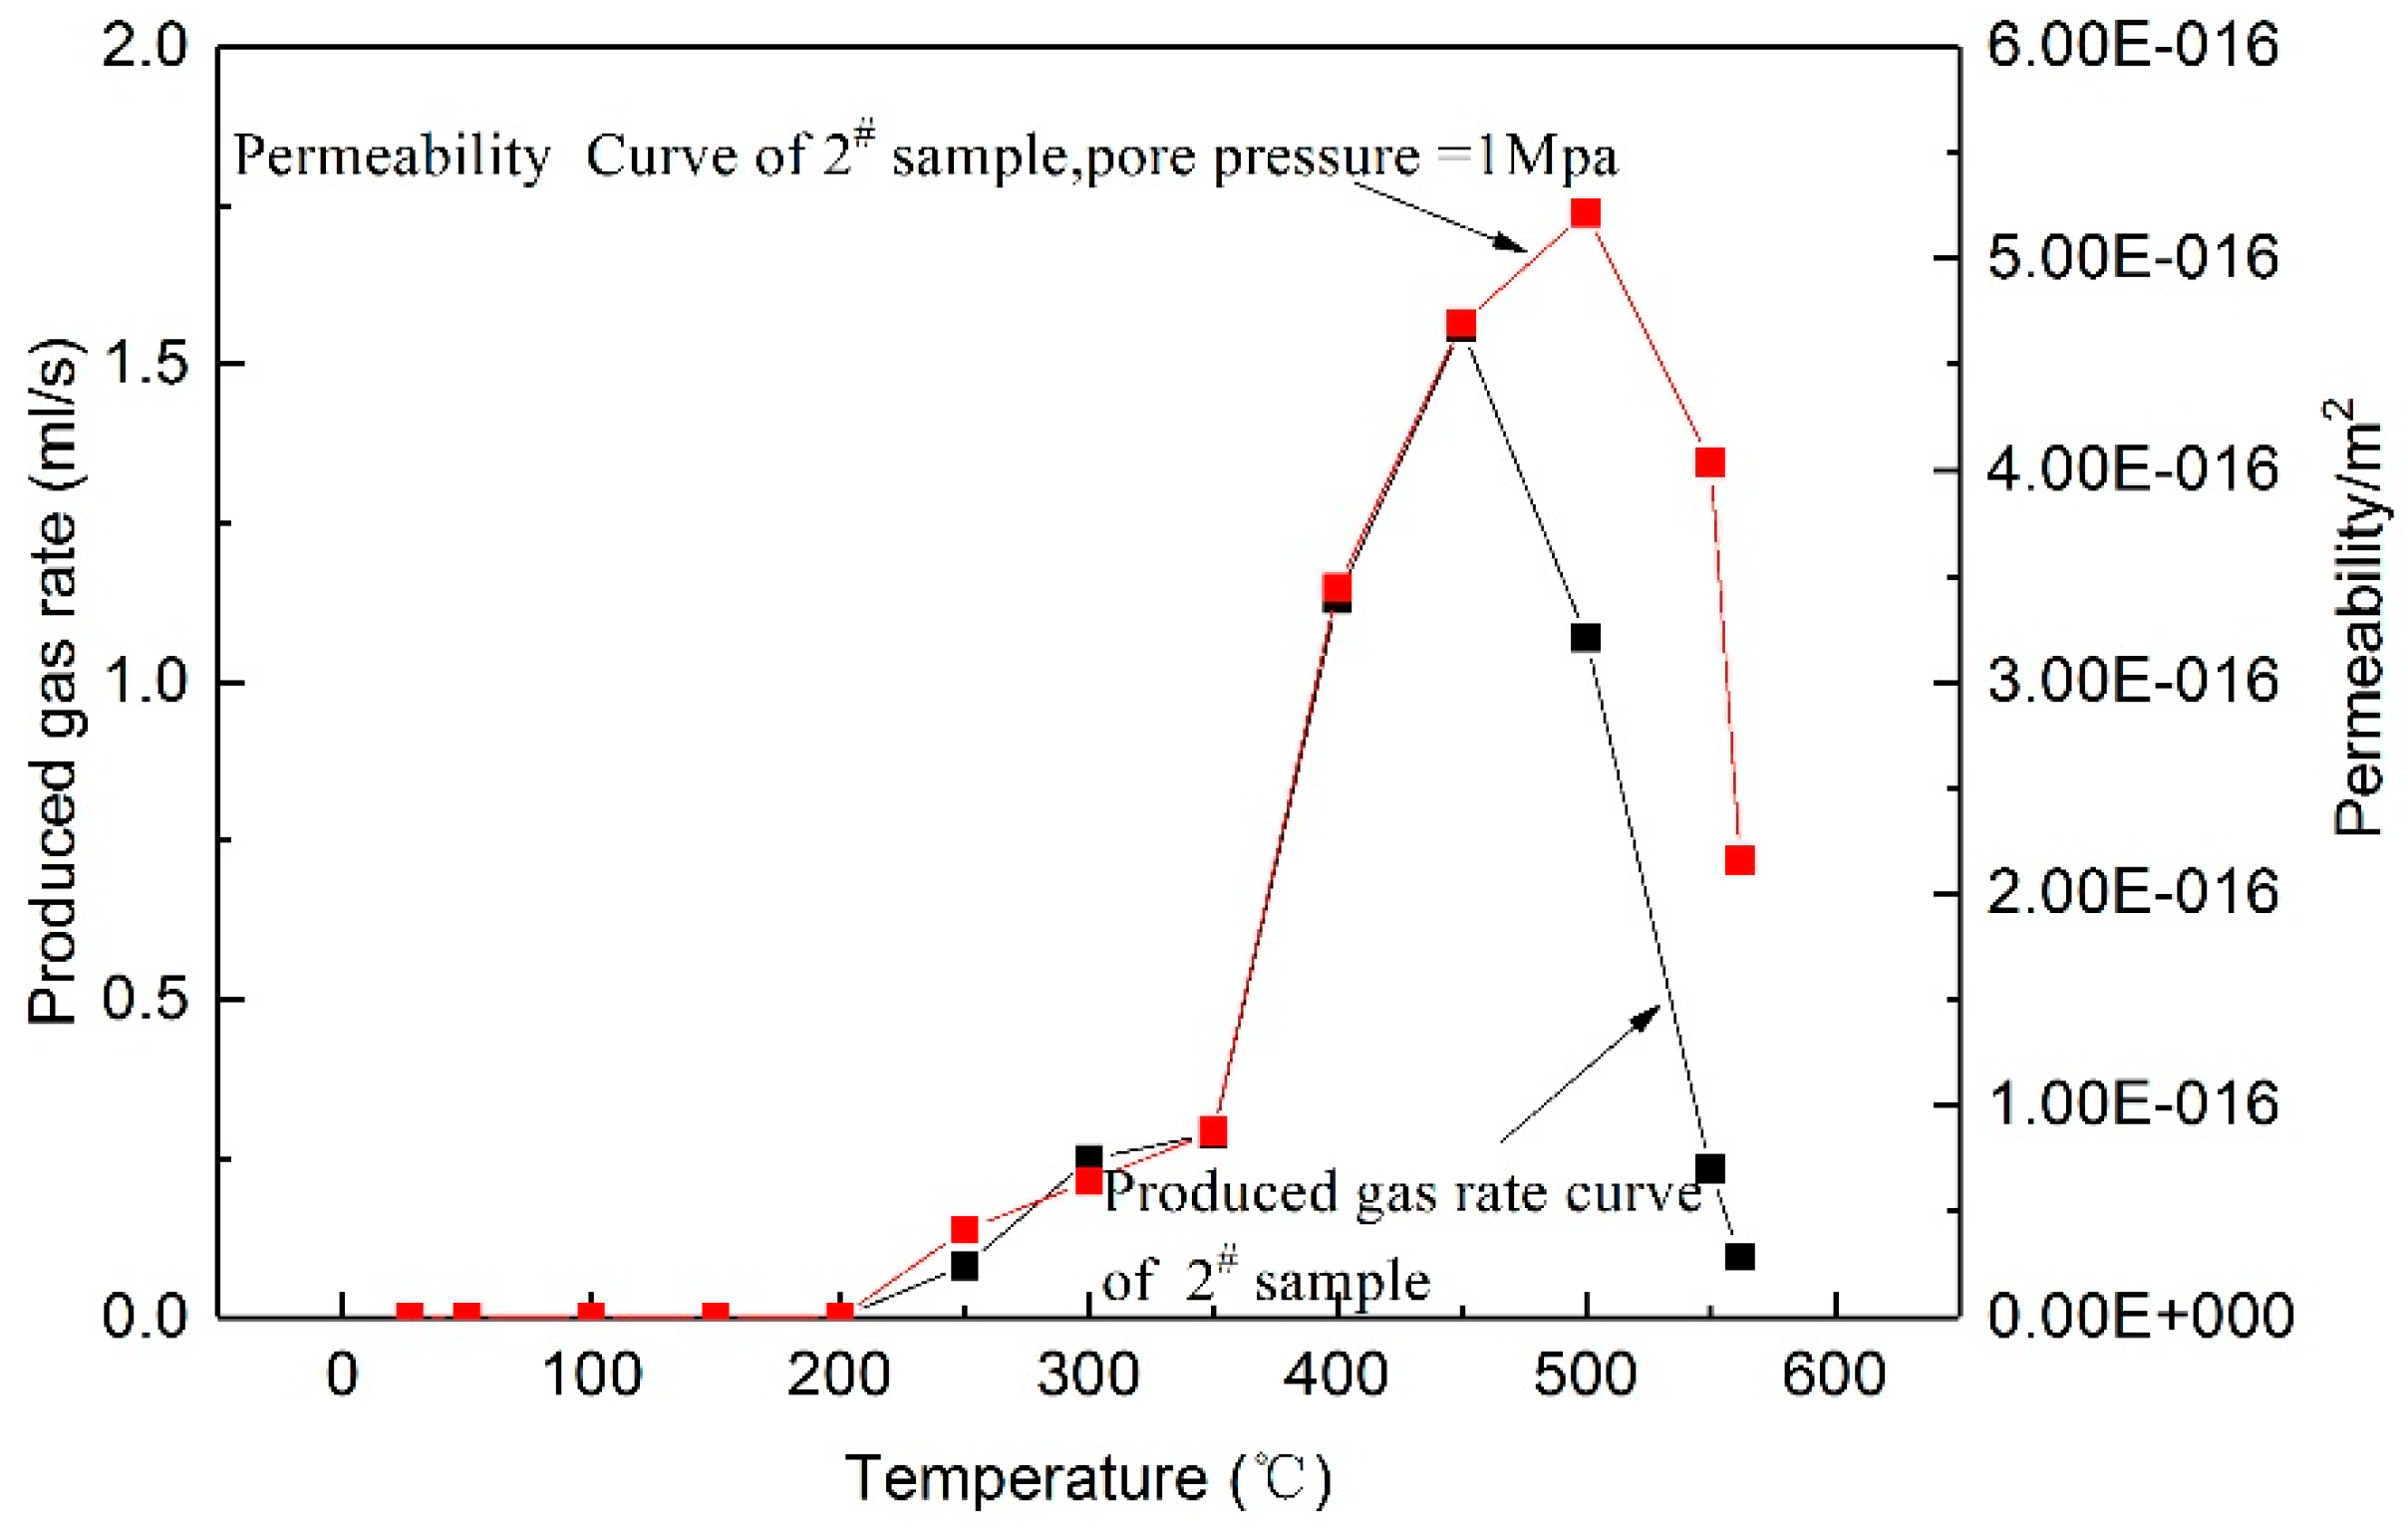
Gas emission during heating oil shale to 600 °C can develop an oil-filled and connected fracture network. This network evolves from impermeable to permeable such that permeability can be dramatically increased. Hence, gas production during pyrolysis has a significant influence on its permeability. Figure 6 shows the relation between gas production rate and permeability of Jimsar oil shale at different temperatures. No gas was produced at temperatures from RT to 200–250 °C, corresponding to the first stage of permeability change where the permeability is very low. Gas production rate increases with temperatures between 250 °C and 450 °C which corresponds to the main stage pyrolysis of the oil shale. In this stage, the weight loss of oil shale accounts for 90% of the total weight loss as apparent in Figure 5. Kerogen within the oil shale is converted to hydrocarbon gas and shale oil, which further develops pores and improves the connectivity of pores. Hence, the increase in permeability is to 3.0 × 10⁻¹⁶ m2 where it reaches 89% of peak permeability. Gas production rate drops at temperatures of 450–550 °C. However, permeability continues to increase until 500 °C then decreases at 500–600 °C. Thus, permeability evolution tracks closely with the change in the gas production rate and this in turn reflects the intensity of pyrolysis. High gas production rate supports rapid mass loss in the oil shale and the rapid production of pores–and permeability increases significantly. When gas production rate decreases, the resulting pores are compressed by the tri-axial stresses and permeability slightly decreases.
5. Conclusions
The following conclusions are drawn, based on experiments on the permeability evolution of Jimusar oil shale from Xinjiang, China at both high temperature and recreated triaxial stress state:
(1) The permeability of tight oil shales evolves with temperature. The behavior corresponds small changes in permeability below a threshold temperature, then rapid pyrolysis-driven changes above this threshold temperature until a final temperature where pyrolysis is effectively complete and no significant further growth in permeability results.
(2) The threshold temperatures are dependent on triaxial stresses. For Jimusar oil shale, the threshold temperature ranges from 200 °C to 250 °C for a burial depth of 500 m and from 350 °C to 400 °C for burial depths of 1000 m. The peak temperature is insensitive to triaxial stress state and is in the range 450 °C to 500 °C for all Jimusar samples.
(3) Pyrolysis plays an important role in permeability evolution and fundamentally changes the tendency of permeability evolution and its magnitude. The first stage of permeability evolution is attributed to thermal expansion of minerals in the oil shale but this is completely overpowered by pyrolysis-driven changes (increases) in permeability at elevated temperatures.
Pyrolytically-fractured permeability in oil shale can increase the number and opening of flow channels where the production transport such as gas and oil. In addition, the enhanced flow properties can be good for heating transferring in oil shale strata. Hence, permeability enhancement is extremely conducive to oil and gas recovery from oil shale strata in practice.
Author Contributions
Methodology, Z.F., Y.Z.; Formal Analysis, F.D.; Investigation, D.Y.; Data Curation, F.D.; Writing-Original Draft Preparation, F.D.; Writing-Review & Editing, Z.F., D.E.; Supervision, Z.F.
Funding
This research was funded by the National Natural Science Foundation of China (Grant Numbers 51404161, 11772213, 51574173, and 51504220).
Acknowledgments
This work was supported by the National Natural Science Foundation of China (Grant Numbers 51404161, 11772213, 51574173, and 51504220).
Conflicts of Interest
The authors declare no conflict of interest. The funders had no role in the design of the study; in the collection, analyses, or interpretation of data; in the writing of the manuscript, and in the decision to publish the results.
References
- Qian, J.L.; Wang, J.Q.; Li, S.Y. World oil shale development & utilization trends—Report on 27th International Oil Shale Conference in America. Sino Glob. Energy 2008, 13, 11–15. [Google Scholar]
- Pan, Y.; Mu, J.Q.; Ning, J.P.; Yang, S.H. Research on in-situ oil shale mining technology. IOSR J. Pharm. Sci. Inven. 2012, 1, 1–7. [Google Scholar]
- Gwyn, J.E. Oil from shale as a viable replacement of depleted crude reserves: processes and challenges. Fuel Process. Technol. 2001, 70, 27–40. [Google Scholar] [CrossRef]
- Russell, P.L. Oil Shales of the World: Their Origin, Occurrence & Exploitation; Pergamon Press: Oxford, UK, 1990; pp. 1285–1291. [Google Scholar]
- Ots, A.; Poobus, A.; Lausmaa, T. Technical and ecological aspects of shale oil and power cogeneration. Oil Shale 2011, 28, 101–112. [Google Scholar] [CrossRef]
- Speight, J.G. Shale Oil Production Process; Elsevier: New York, NY, USA, 2012. [Google Scholar]
- Yao, G.M. Speculations on the exploration and development of unconventional hydro-carbon resources. Nat. Gas Ind. 2008, 28, 1–3. [Google Scholar]
- Liu, Z.J.; Dong, Q.S.; Ye, S.Q.; Zhu, J.W.; Guo, W.; Li, D.C.; Liu, R.; Zhang, H.L.; Du, J.F. The situation of oil shale resources in China. J. Jilin Univ. Earth Sci. Ed. 2006, 36, 869–876. [Google Scholar]
- Razvigorova, M.; Budinova, T.; Petrova, B.; Tsyntsarski, B.; Kinci, E.; Ferhat, M.F. Steam pyrolysis of Bulgarian oil shale kerogen. Oil Shale 2008, 25, 27–36. [Google Scholar] [CrossRef]
- Jiang, X.M.; Han, X.X.; Cui, Z.G. New technology for the comprehensive utilization of Chinese oil shale resources. Energy 2007, 32, 772–777. [Google Scholar] [CrossRef]
- Kok, M.V.; Guner, G.; Bagci, S. Laboratory steam injection applications for oil shale fields of Turkey. Oil Shale 2008, 25, 37–46. [Google Scholar] [CrossRef]
- Harfi, K.E.; Mokhlisse, A.; Chanaa, M.B.; Outzourhit, A. Pyrolysis of Moroccan (Tarfaya) oil shales under microwave irradiation. Fuel 2000, 79, 733–742. [Google Scholar] [CrossRef]
- Bernabe, Y. The effective pressure law for permeability in Chelmsford granite and Barre granite. Int. J. Rock Mech. Min. 1986, 23, 267–275. [Google Scholar] [CrossRef]
- Morrow, C.; Byerlee, J. Permeability of rock samples from Cajon Pass, California. Geophys. Res. Lett. 2013, 15, 1033–1036. [Google Scholar] [CrossRef]
- Zhu, W.; Wong, T.F. Network modeling of the evolution of permeability and dilatancy in compact rock. J. Geophys. Res. Solid Earth 1999, 104, 2963–2971. [Google Scholar] [CrossRef]
- Zoback, M.D.; Byerlee, J.D. The effect of microcrack dilatancy on the permeability of westerly granite. J. Geophys. Res. 1975, 80, 752–755. [Google Scholar] [CrossRef] [Green Version]
- Ostensen, R.W. Microcrack permeability in tight gas sandstone. Soc. Pet. Eng. J. 1983, 23, 919–927. [Google Scholar] [CrossRef]
- Gao, H.M.; Lan, Y.W.; Zhao, Y.L.; Xu, X.H.; Meng, L.Y. Change rule of porosity and permeability of granite under high temperature. In Proceedings of the 2017 International Conference on Coal Science & Technology and 2017 Australia-China Symposium on Energy, Beijing, China, 25–29 September 2017. [Google Scholar]
- Feng, Z.J.; Zhao, Y.S.; Zhang, Y.; Wan, Z.J. Real-time Permeability evolution of thermally cracked granite at triaxial stresses. Appl. Therm. Eng. 2018, 133, 194–200. [Google Scholar] [CrossRef]
- Yang, S.Q.; Xu, P.; Li, Y.B.; Huang, Y.H. Experimental investigations on triaxial mechanical and permeability behavior of sandstone after exposure to different high temperature treatments. Geothermics 2017, 69, 93–109. [Google Scholar] [CrossRef]
- Zhang, Y.; Zhao, Y.S.; Wan, Z.J.; Qu, F.; Dong, F.K.; Feng, Z.J. Experimental study on effect of pore pressure on feldspar fine sandstone permeability under different temperatures. Chin. J. Rock mech. Eng. 2008, 27, 53–58. [Google Scholar]
- Niu, S.W.; Zhao, Y.S.; Hu, Y.Q. Experimental investigation of the temperature and pore pressure effect on permeability of lignite under the in-situ condition. Trans. Porous Med. 2014, 101, 137–148. [Google Scholar] [CrossRef]
- Feng, Z.J.; Wan, Z.J.; Zhao, Y.S.; Li, G.W.; Zhang, Y.; Wang, C.; Zhu, N.J. Experimental study of permeability of anthracite and gas coal masses under high temperature and triaxial stress. Chin. J. Rock Mech. Eng. 2010, 29, 689–696. [Google Scholar]
- Kang, Z.Q.; Zhao, Y.S.; Meng, Q.R.; Yang, D.; Xi, B.P. Micro-CT experimental research of oil shale thermal cracking laws. Chin. J. Geophys. 2009, 52, 842–848. (In Chinese) [Google Scholar]
- Kang, Z.Q.; Yang, D.; Zhao, Y.S.; Hu, Y.Q. Thermal cracking and corresponding permeability of Fushun oil shale. Oil Shale 2011, 28, 273–283. [Google Scholar] [CrossRef]
- Zhao, J.; Yang, D.; Kang, Z.Q.; Feng, Z.C. A micro-CT study of changes in the internal structure of Daqing and Yan’an oil shales at high temperatures. Oil Shale 2012, 29, 357–367. [Google Scholar] [CrossRef]
Figure 1.
Oil shale samples.

Figure 2.
Schematic diagram of sample assembly.

Figure 3.
Permeability evolution of samples 1# and 2# at different temperatures: (a) 1# sample; and (b) 2# sample.
Figure 3.
Permeability evolution of samples 1# and 2# at different temperatures: (a) 1# sample; and (b) 2# sample.
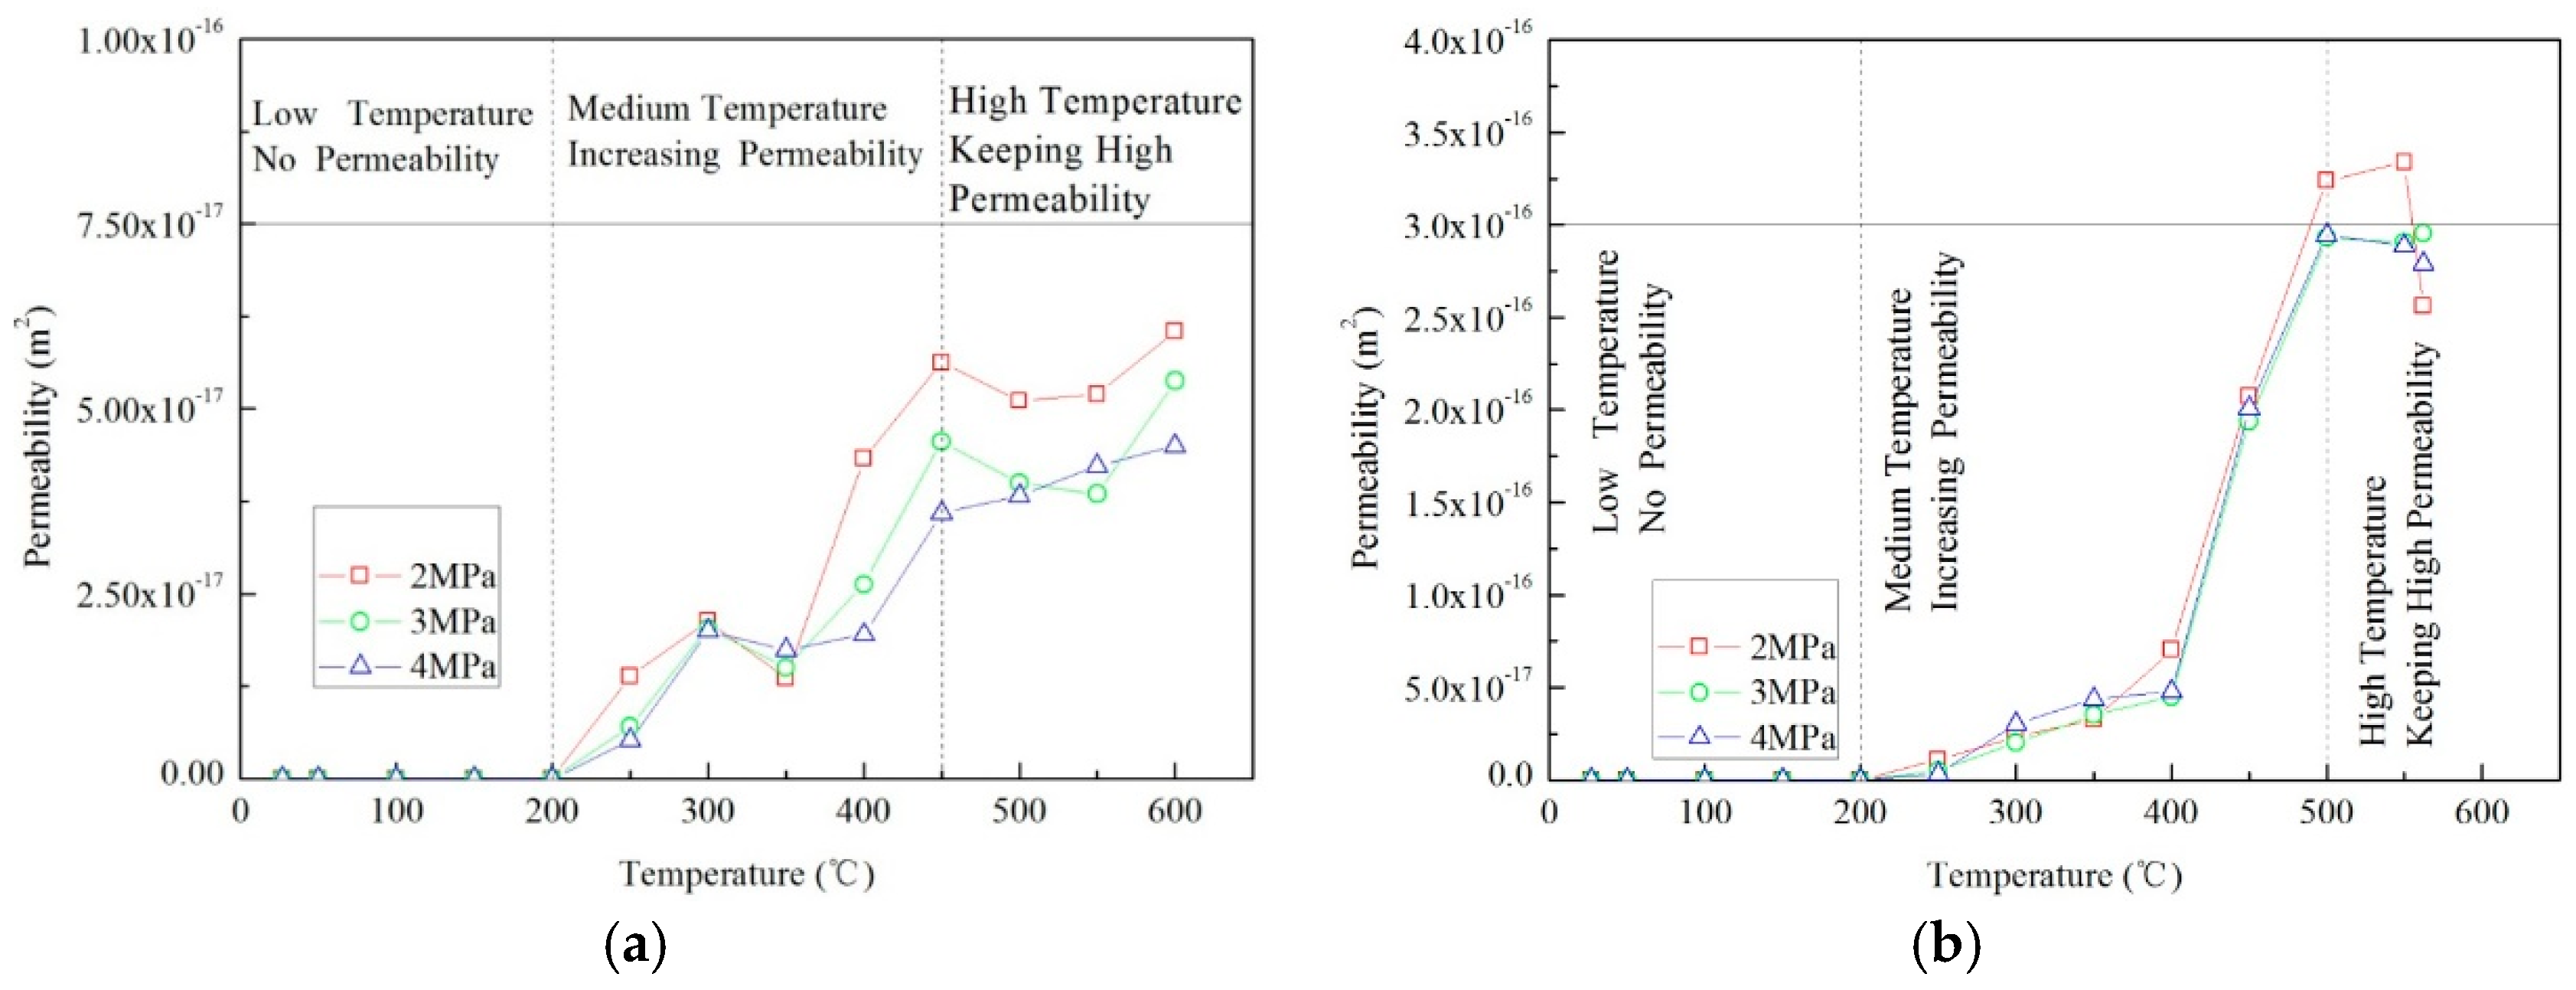
Figure 4.
Permeability evolution of sample 3# at different temperatures.
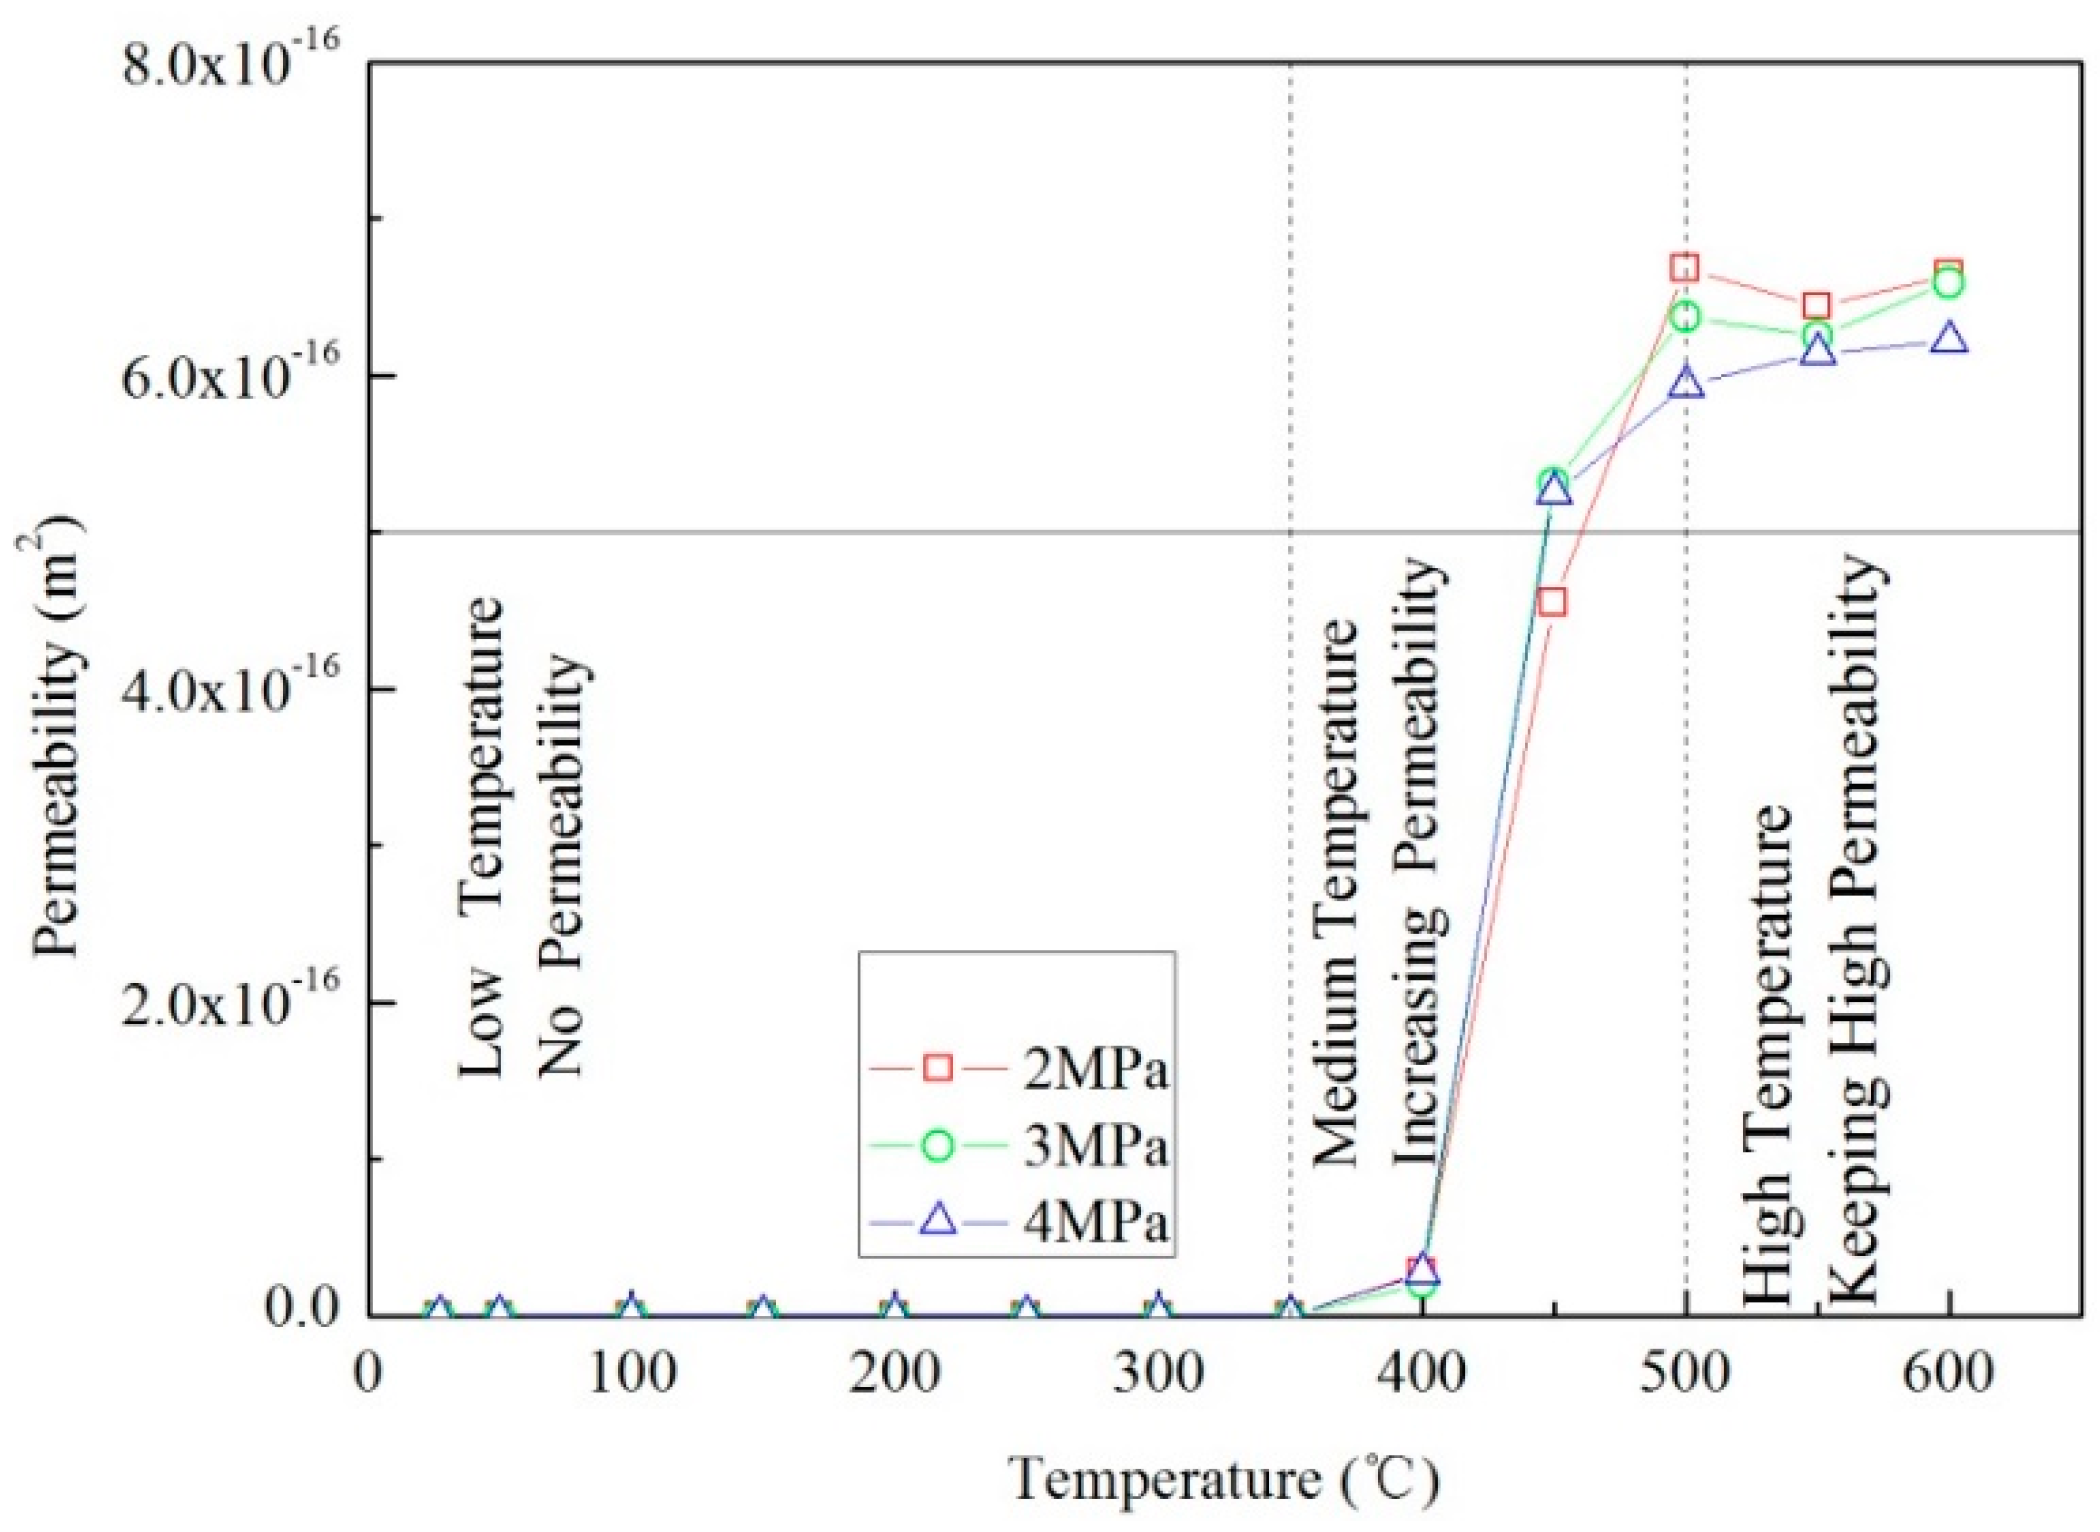
Figure 5.
Comparison between permeability evolution of specimen 2# and the thermogravimetric (TG) mass loss curve of oil shale.
Figure 5.
Comparison between permeability evolution of specimen 2# and the thermogravimetric (TG) mass loss curve of oil shale.

Figure 6.
Comparison of permeability to produced gas rate of oil shale at temperatures up to 600°C.


Table 1.
Proximate analysis of Jimsar oil shale.
| Water (%) | 0.6 |
| Ash (%) | 77.13 |
| Volatile (%) | 19.63 |
| Fixed Carbon (%) | 2.64 |
| Calorific Value(cal/g) | 1358 |
Table 2.
Element analysis of Jimsar oil shale.
| C (%) | 15.78 |
| H (%) | 2.55 |
| N (%) | 0.4 |
| O (%) | 4.54 |
| Total S (%) | 0.35 |
© 2018 by the authors. Licensee MDPI, Basel, Switzerland. This article is an open access article distributed under the terms and conditions of the Creative Commons Attribution (CC BY) license (http://creativecommons.org/licenses/by/4.0/).
Share and Cite
MDPI and ACS Style
Dong, F.; Feng, Z.; Yang, D.; Zhao, Y.; Elsworth, D. Permeability Evolution of Pyrolytically-Fractured Oil Shale under In Situ Conditions. Energies 2018, 11, 3033. https://doi.org/10.3390/en11113033
AMA Style
Dong F, Feng Z, Yang D, Zhao Y, Elsworth D. Permeability Evolution of Pyrolytically-Fractured Oil Shale under In Situ Conditions. Energies. 2018; 11(11):3033. https://doi.org/10.3390/en11113033
Chicago/Turabian StyleDong, Fuke, Zijun Feng, Dong Yang, Yangsheng Zhao, and Derek Elsworth. 2018. "Permeability Evolution of Pyrolytically-Fractured Oil Shale under In Situ Conditions" Energies 11, no. 11: 3033. https://doi.org/10.3390/en11113033
Note that from the first issue of 2016, this journal uses article numbers instead of page numbers. See further details here.