A Systematic Multivariate Analysis of Carica papaya Biodiesel Blends and Their Interactive Effect on Performance

1
School of Engineering and Technology, Central Queensland University, North Rockhampton, QLD 4702, Australia
2
School of Health, Medical and Applied Sciences, Central Queensland University, North Rockhampton, QLD 4702, Australia
*
Author to whom correspondence should be addressed.
Energies 2018, 11(11), 2931; https://doi.org/10.3390/en11112931
Submission received: 11 October 2018
/
Revised: 24 October 2018
/
Accepted: 25 October 2018
/
Published: 26 October 2018
(This article belongs to the Special Issue Biofuel and Bioenergy Technology)
Abstract
:This paper investigates the interactive relationship between three operating parameters (papaya seed oil (PSO) biodiesel blends, engine load, and engine speed) and four responses (brake power, BP; torque; brake specific fuel consumption, BSFC; and, brake thermal efficiency, BTE) for engine testing. A fully instrumented four cylinder four-stroke, naturally aspirated agricultural diesel engine was used for all experiments. Three different blends: B5 (5% PSO biodiesel + 95% diesel), B10 (10% PSO biodiesel + 90% diesel), and B20 (20% PSO biodiesel + 80% diesel) were tested. Physicochemical properties of these blends and pure PSO biodiesel were characterised, and the engine’s performance characteristics were analysed. The results of the engine performance experiments showed that, in comparison with diesel, the three PSO biodiesel blends caused a slight reduction in BP, torque, and BTE, and an increase in BSFC. The analysis of variance and quadratic regression modelling showed that both load and speed were the most important parameters that affect engine performance, while PSO biodiesel blends had a significant effect on BSFC.
1. Introduction
Diesel fuel has successfully contributed to all sectors of human life, especially to transportation, industry, and agricultural sectors due to its availability, reliability, adaptability, higher combustion efficiency, and excellent handling/storage properties. However, fossil reserves (oil, gas, and coal) are limited, therefore, researchers have been exploring an alternative source for diesel for many years, and, over the last decade, biofuel (i.e., mainly biodiesel) has drawn massive attention for its excellent environmental and sustainability attributes [1,2]. Biodiesel is biodegradable, non-toxic, non-explosive, non-flammable, renewable, and an environmentally friendly (produces fewer emissions) fuel. Although the biodiesel energy content is about 10–12% less than diesel, it can be mixed with diesel at specific proportions to make the blended fuel properties close to diesel [3,4]. Furthermore, researchers are working hard to find suitable sustainable biodiesels and their blends, which can be used as fuel in unmodified diesel engines.
Numerous researchers have explored the production of biodiesel from different feedstocks focusing on non-edible oil, but very few investigations [5,6,7,8,9,10] have been performed on papaya seed oil (PSO) biodiesel. Among these, most of the articles deal with only the biodiesel production process when using different catalysts and methanol: oil molar ratios. Asokan et al. [2] examined engine performance in a single cylinder diesel engine fuelled with a mixture of papaya seed oil and watermelon seed oil and found that B20 performed close to diesel. Prabhakaran et al. [11] analysed engine performance of a single cylinder Kirloskar-TV1 diesel engine with PSO biodiesel blends and found B25 blend has lower BSFC than all other blends. Sundar Raj and Karthikayan [12] did diesel engine (single cylinder) performance analysis with PSO-diesel blends with/without additives and found PSO-diesel blends with additives have better combustion and emission characteristics. However, no other literature has been found on engine performance analysis of a fully instrumented four cylinder four-stroke diesel engine fuelled with PSO biodiesel.
PSO is non-edible and converting the waste product (seeds) of the fruit into biodiesel is a sensible option. Carica papaya was originally native to the tropics of the Americas and it is now primarily grown in tropical-subtropical climates of Asia (in particular, India with 42% of world production), South America (mainly Brazil), Africa (Nigeria and Congo), and Polynesia [13,14]. Therefore, the evaluation of papaya seed oil as biodiesel feedstock will contribute to the development of regional communities and their overall economy. In this study, papaya seed oil was used as feedstock to produce biodiesel and investigate its suitability as an alternative fuel source. Determining the fuel properties of PSO and its various blends with diesel were also undertaken. Finally, interactive relationships between several operating parameters (PSO biodiesel blends, load, and speed) and engine performance are evaluated and discussed.
2. Materials and Method
2.1. Materials
The raw PSO was obtained from a supplier in Eumundi, Queensland, Australia. The chemicals that were utilised for this study were methanol (99.9% purity), potassium hydroxide (KOH pellets, 99% purity), and sodium hydroxide (NaOH pellets, 99% purity). All chemicals were of analytical reagent grade (AR) and they were procured from the School of Engineering and Technology, Central Queensland University. A reflux condenser and a thermocouple fitted on 0.5 L and 1 L three-neck laboratory reactors were used for the PSO biodiesel conversion experiments.
2.2. Equipment List
The PSO properties were characterised for density, viscosity, refractive index, angular rotation, acid value, oxidation stability, and iodine value. These properties were measured before the biodiesel conversion and optimisation process. Table 1 summarises the equipment used in this study to measure the properties of PSO, PSO biodiesel, and the biodiesel-diesel blends, and the relevant standards applied. The properties studied were density at 15 °C, kinematic viscosity at 40 °C, acid value, calorific value, flash point, and oxidation stability. A gas chromatograph was used to determine the fatty acid compositions by EN 14103.
2.3. Biodiesel Production
The acid value of raw PSO was determined to be 0.98 mg KOH/g. After transesterification using the KOH catalyst, the acid value of PSO biodiesel was found to be 0.42 mg KOH/g. This trial experiment suggested that only the single-stage alkyl catalyst transesterification process was necessary for satisfactory PSO biodiesel production. Further, only a few researchers [6,7,8,9,10] have found that the single-stage transesterification process was sufficient for PSO biodiesel conversion. Based on these researches and the trial experiment, it was decided to use single-stage alkaline transesterification for biodiesel production. Thus, in each experiment, the conversion was performed by reacting a known quantity of PSO with methanol and the catalyst.
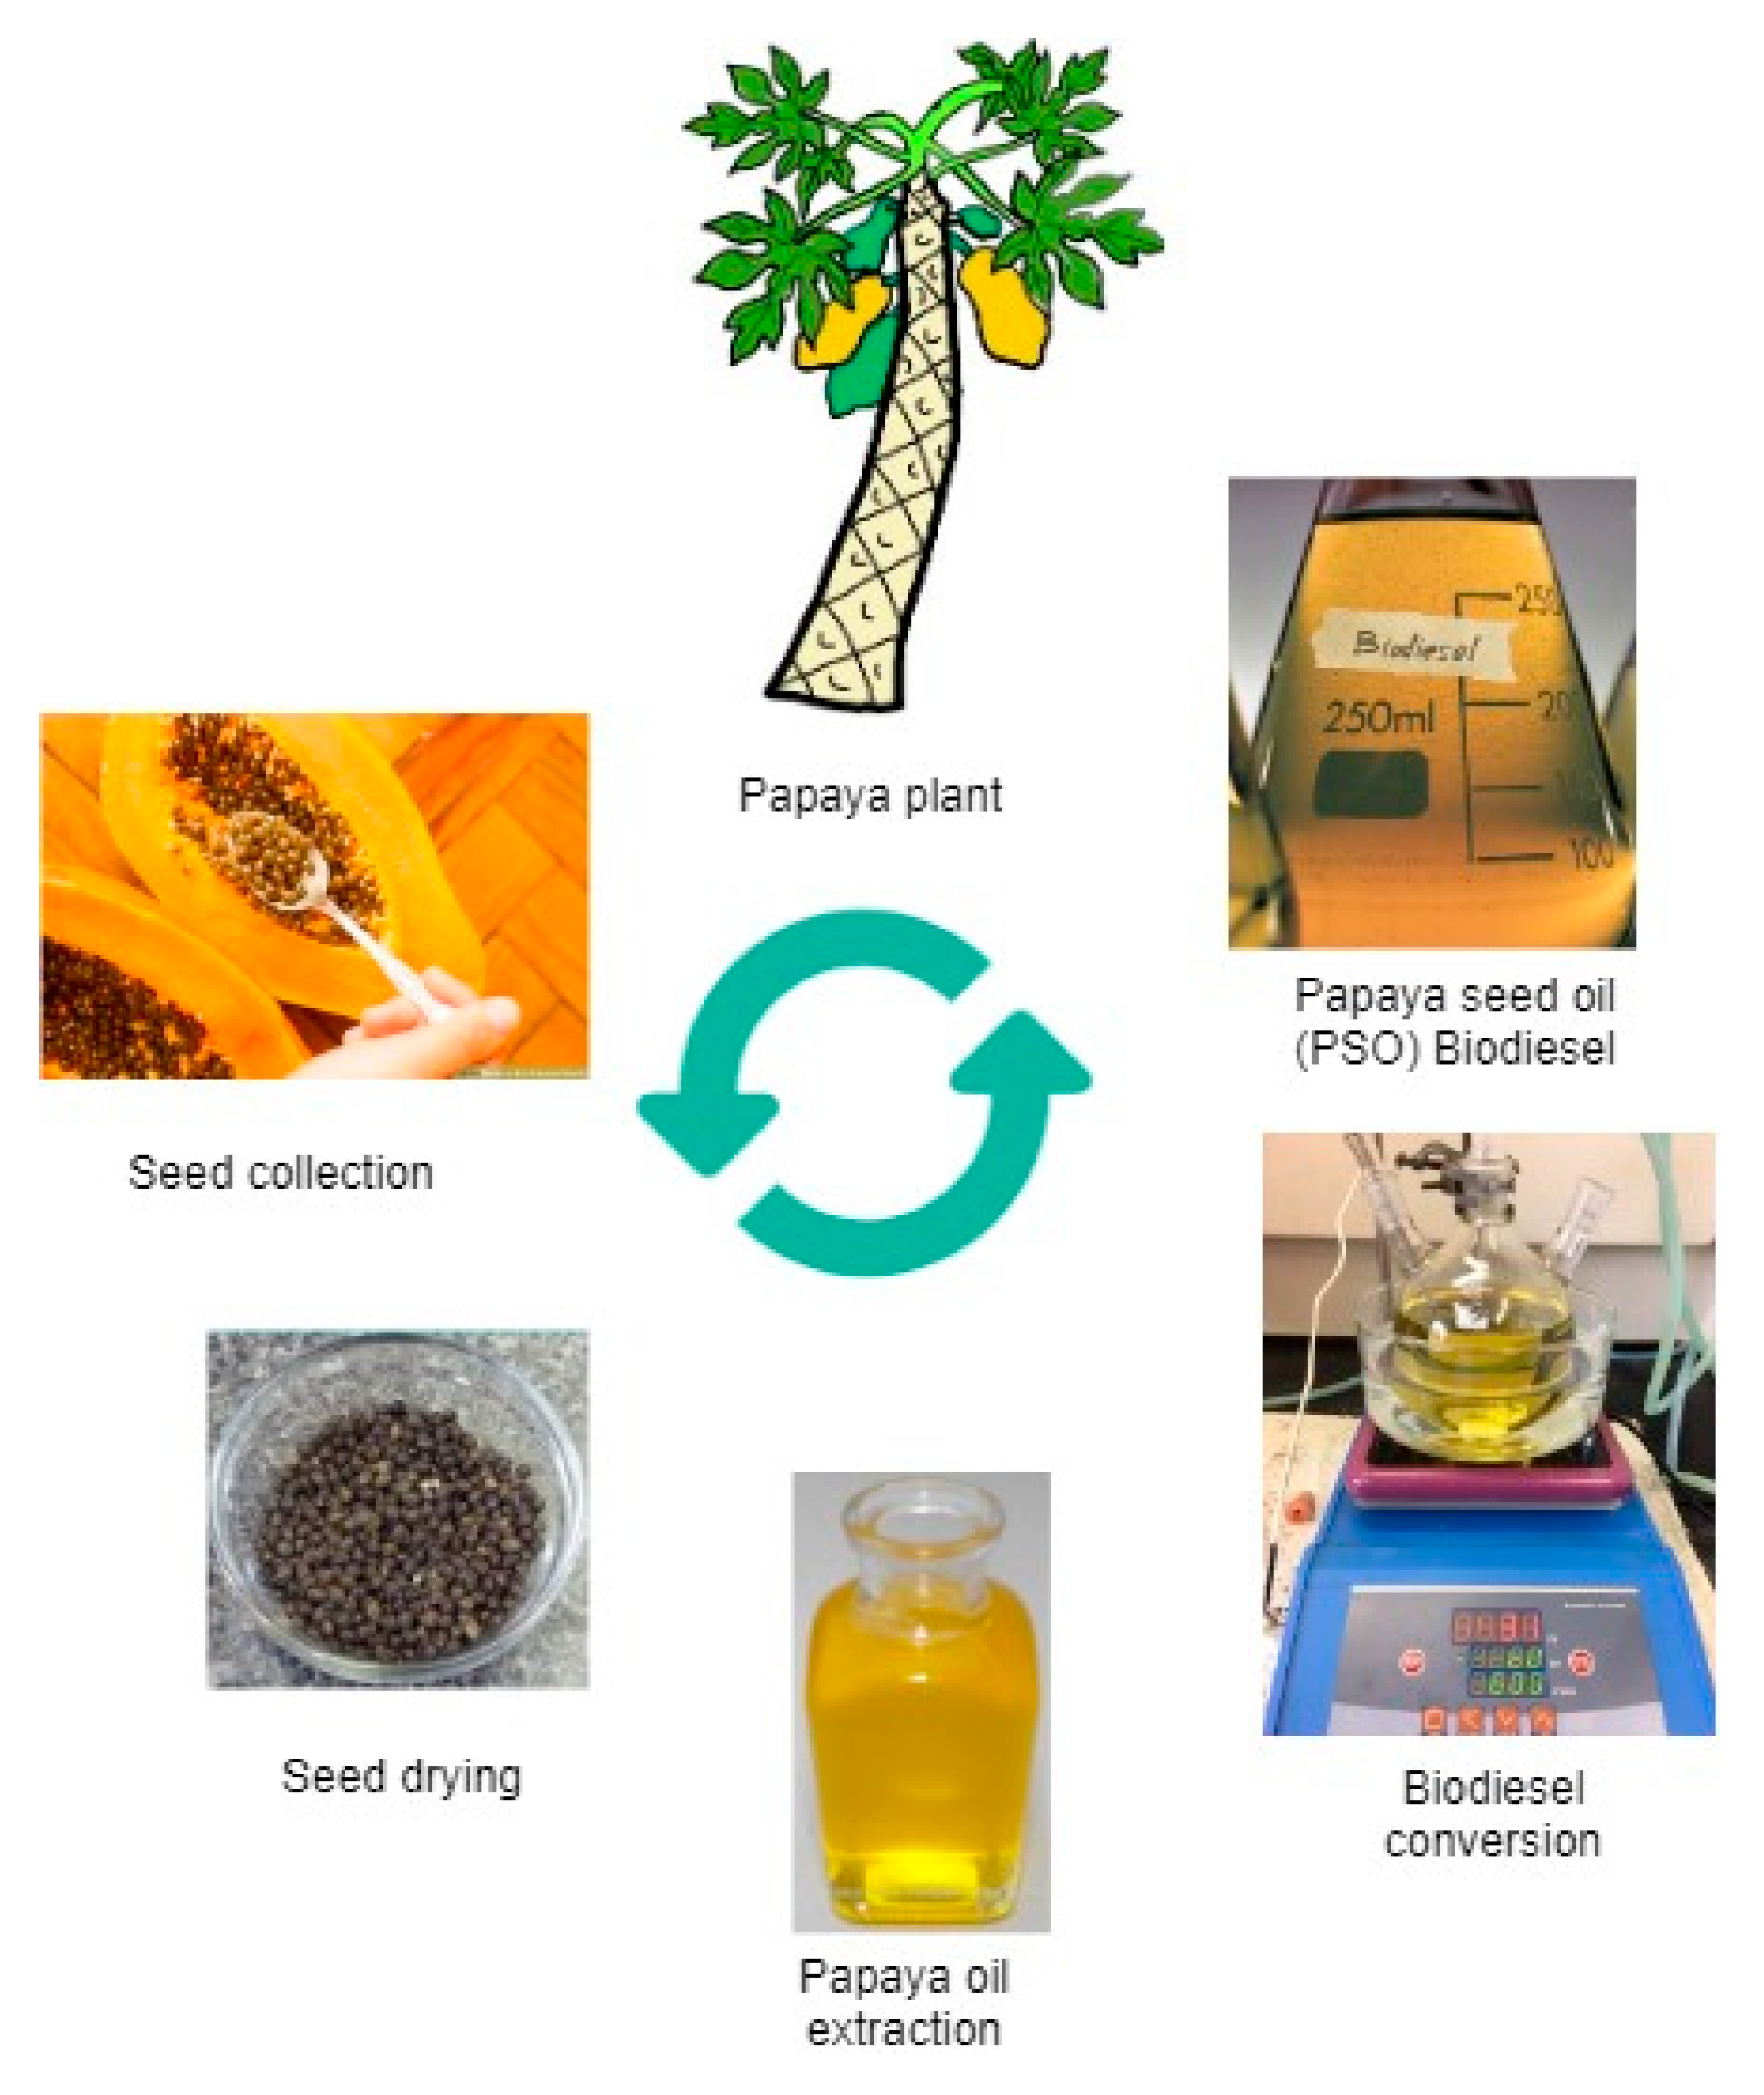
In each of these experiments, PSO was poured into a three-neck laboratory reactor and was heated to the preferred temperature. The catalyst (KOH) was dissolved in methanol in a separate beaker, and a magnetic stirrer was used to provide vigorous agitation at 600 rpm for 10 min at 50 °C to produce methoxide. This solution was then poured into the reactor that contained heated PSO to allow the transesterification reaction at a constant speed of agitation of 600 rpm. Other reaction conditions, such as temperature and time, were adjusted as per the individual experimental designs determined from the optimisation process of PSO biodiesel [14]. At the end of the transesterification reaction, the blend was poured into a separating funnel and left to settle 24 h for layer separation. Under gravity, two distinct liquid phases were formed; the upper layer was methyl ester (biodiesel), and the bottom dark brown layer consisted of glycerol and impurities. The glycerol and impurities were drawn off, whence the methyl ester layer was collected and washed with warm (50 °C) distilled water. The methyl ester was then heated to 110 °C for 15 min to remove any water that would have been retained from the washing process. A Whatman® qualitative Grade 1 filter paper was used to filter the methyl ester (i.e., biodiesel) and was stored at laboratory temperature for characterisation. Figure 1 shows the PSO production process.
PSO biodiesel yield was calculated using Equation (1).
2.4. Fatty Acid Composition
Fatty acids with a double bond are known as unsaturated fatty acids, while those without a double bond are called saturated fatty acids. High unsaturated fatty acid levels make biodiesel prone to autoxidation [14]. However, high unsaturated fatty acid levels do ensure good flow properties as compared with saturated fatty acids. The major drawback of high saturated fatty acid levels in biodiesel is its poor fuel filterability, particularly in cold weather conditions. The PSO biodiesel fatty acid composition was determined using a gas chromatograph (GC), (Thermo Trace 1310 GC) according to EN14103. Table 2 shows the operating condition details of the GC.
The compositional analysis that is detailed in Table 3 shows that PSO biodiesel contains a high level (87.5%) of unsaturated fatty acid methyl esters (FAME) made up of polyunsaturated fatty acid (PUFA) at 39.03% and monounsaturated fatty acid (MUFA) at 48.49%. Amongst these, the dominant fatty acids were found to be oleic acid (C18:1) at 47.7% and linoleic acid (C18:2) at 37.3%. The saturated fatty acids included palmitic acid (C16:0) at 6%.
2.5. Properties Analysis
The properties of the produced PSO methyl ester (i.e., pure biodiesel or B100) are compared with those of diesel (B0) and PSO biodiesel-diesel blends (B5, B10, and B20) in Table 4. The properties and qualities of PSO biodiesel and the diesel blends comply with the requirements of international standards ASTM D6751 and EN14214. The USA’s ASTM D6751 ensures that the parameters of any pure biodiesel (B100) satisfy the standard before being used as a blend with diesel or pure fuel, whereas the European Union’s EN14214 defines the minimum standards for FAME [14,15]. The PSO biodiesel was found to comply with both standards.
2.6. Fourier Transform Infrared (FTIR) Analysis
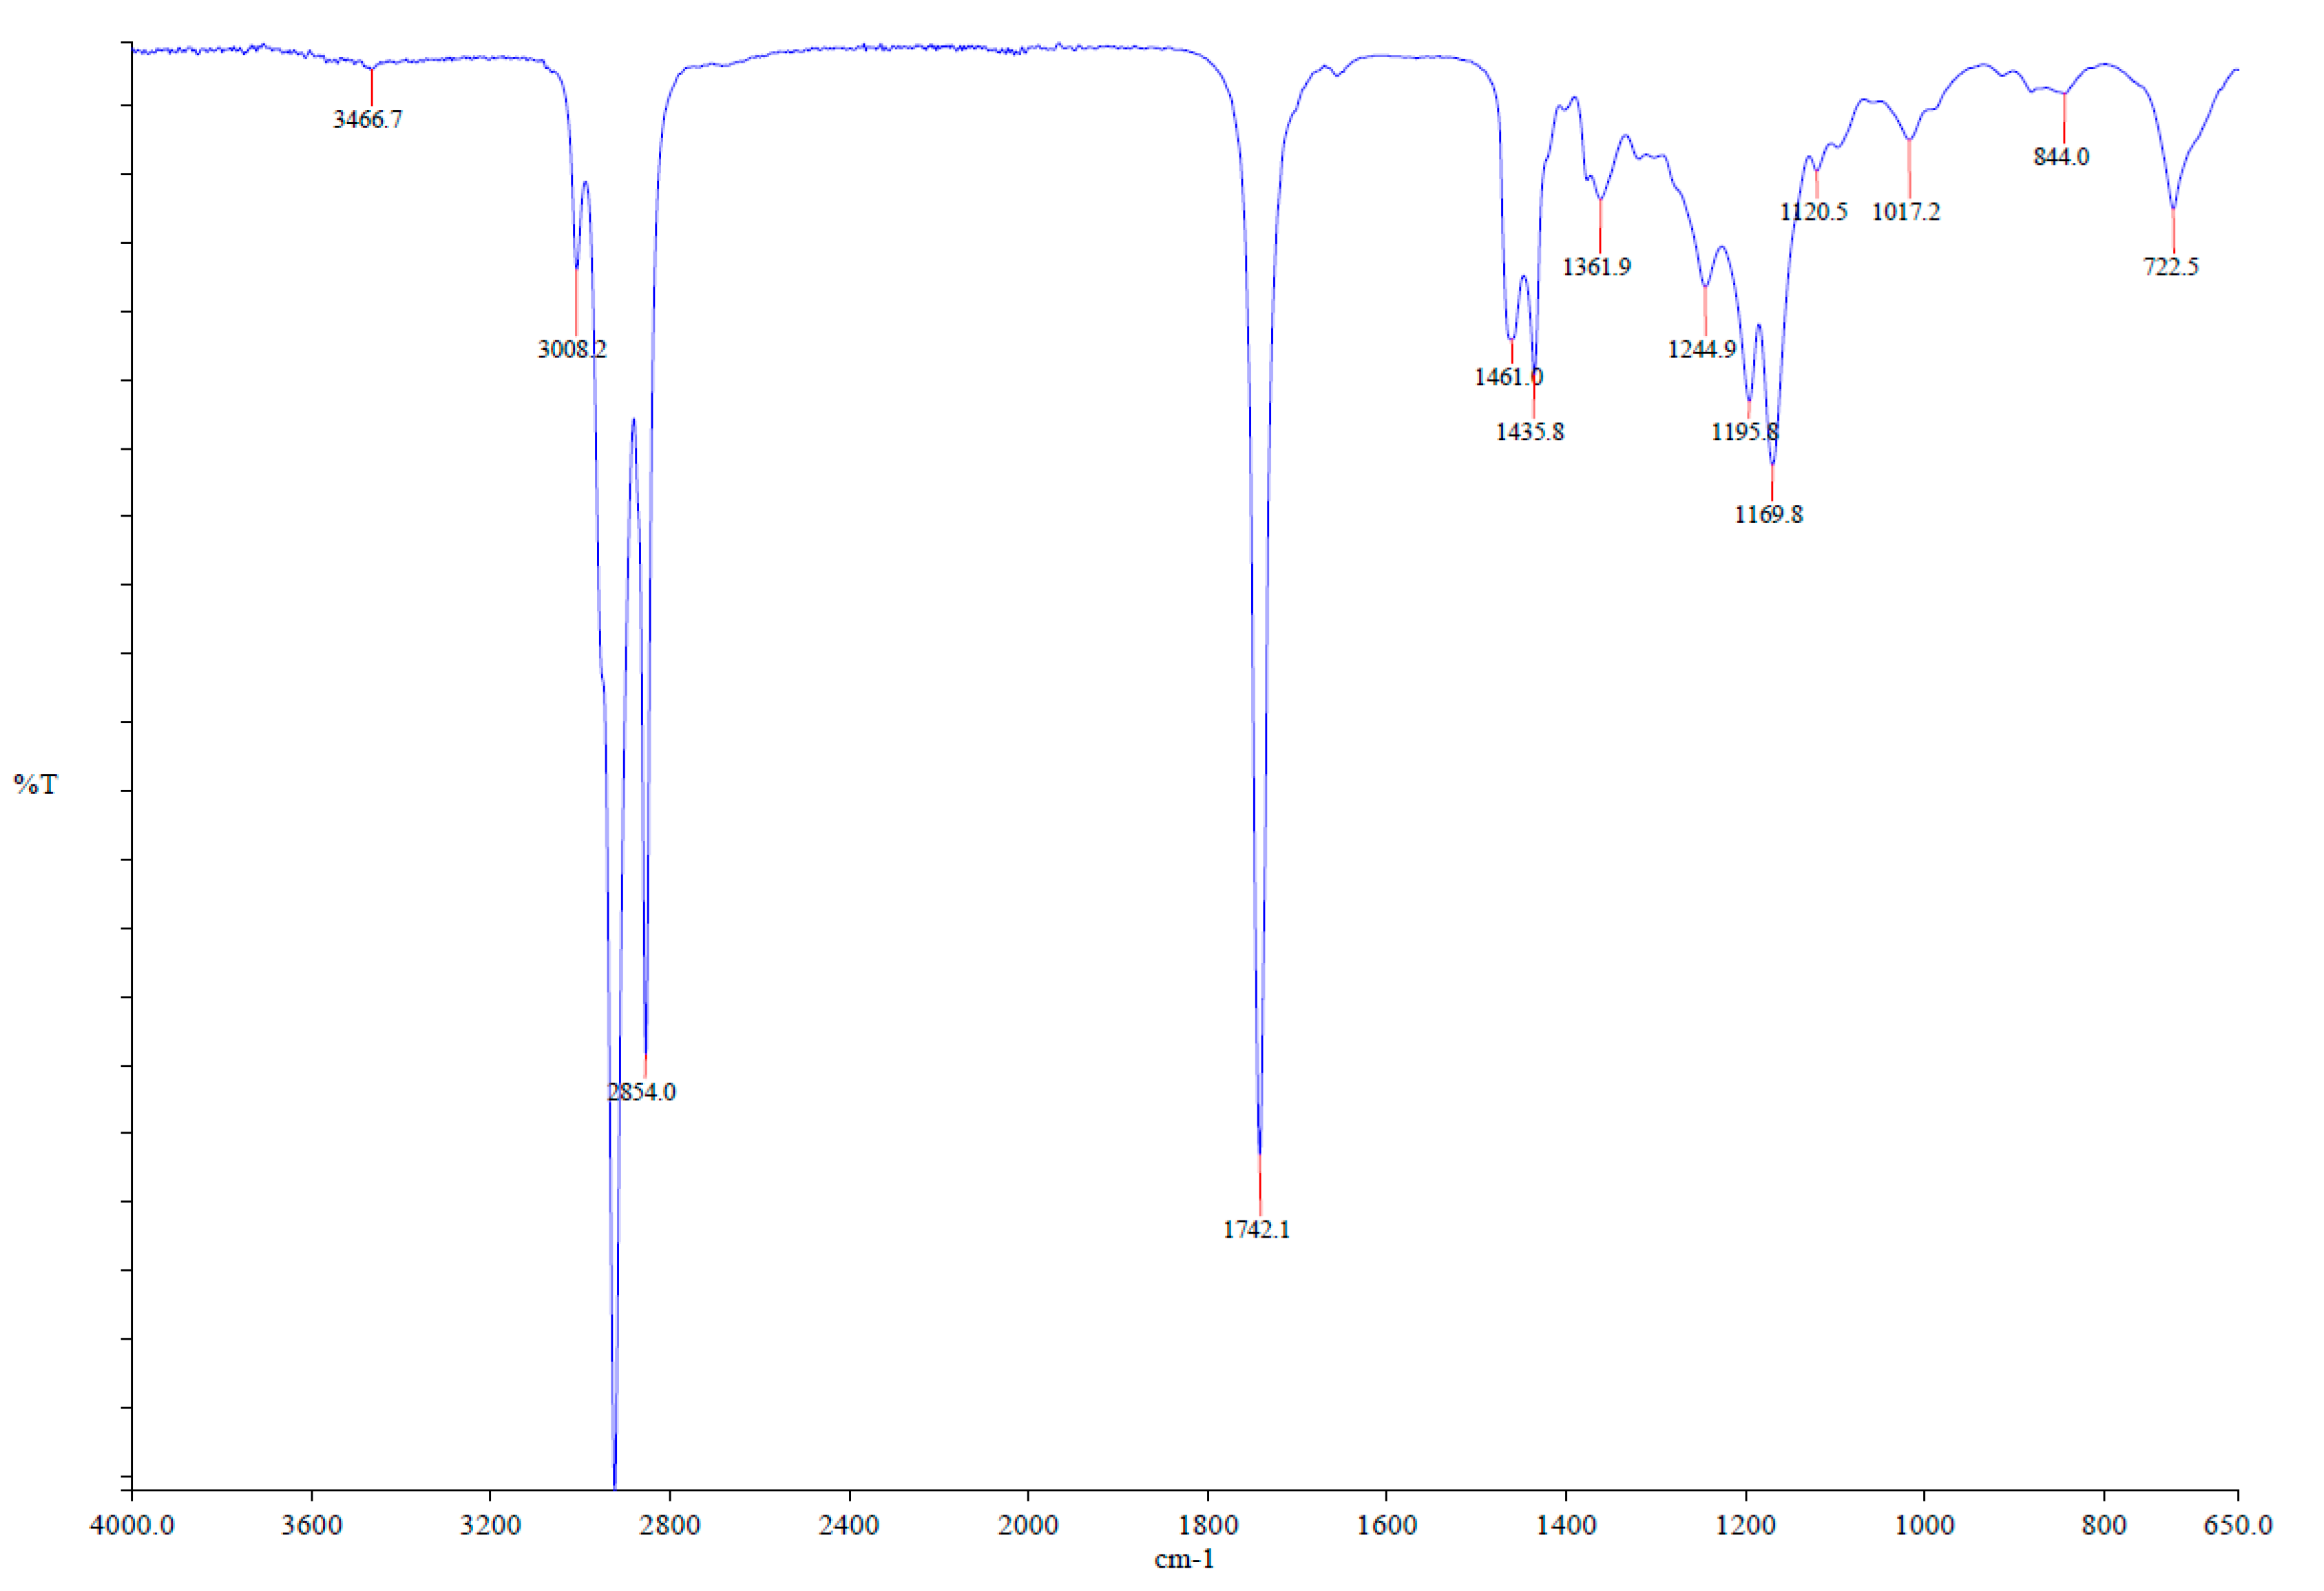
The various functional groups that are present in the pure PSO biodiesel sample were determined with FTIR spectroscopy. In this study, a Spectrum 100 series FTIR spectrometer with a universal Attenuated total reflectance (ATR) sampling accessory was used. Samples of the PSO biodiesel were inserted directly on the ATR window to record the spectra over the frequency range of 4000–650 cm−1 with four scans at approximately 40% transmission. Spectrum analysis program (Spectrum version 6.2.0, Perkin-Elmer Life and Analytical Sciences, Bridgeport, CT, USA) was used to acquire data and for processing. Figure 2 shows the FTIR spectrum of the pure PSO biodiesel (B100).
2.7. Blending of Biodiesel
The pure PSO biodiesel (B100) was mixed with pure diesel (B0) to prepare various blends. Those blends comprised homogeneous mixtures of 5% vol. of biodiesel with 95% vol. of diesel denoted by B5, 10% vol. of biodiesel with 90% vol. of diesel indicated by B10 and 20% vol. of biodiesel with 80% vol. of diesel meant by B20. The blends were prepared in a 2 L flask and were agitated at 2000 rpm with a magnetic stirrer for 60 min.
2.8. Experimental Setup for Engine Testing
This experimental investigation was carried out using pure diesel (B0) and PSO biodiesel-diesel blends (B5, B10, and B20) in an agricultural tractor four-stroke diesel engine with four cylinders (model: Kubota V3300) coupled with an eddy current dynamometer. Table 5 details the engine specification. This tractor engine was used for testing PSO biodiesel-diesel blends with regard to engine performance and characteristics of exhaust emissions. The engine performance and emissions data were collected under full load (100%) condition, keeping the throttle 100% wide open and varying speeds in the range from 1200 to 2400 rpm with an increment of 200 rpm. A photograph of the engine and test bed and a schematic of the setup of the engine along with the data acquisition system are shown in Figure 3. The engine is connected with the test bed along with instrumentation consoles that measure engine speed, torque, air, and fuel consumption and temperature. A Dynolog data acquisition system was used to convert the console-measured data to a display in the computer monitor. The exhaust gas emissions of NOx and HC in ppm, and CO and CO2 in vol. %, were measured with a CODA 5 gas analyser (CODA Products Pty Ltd., Hamilton NSW 2303, Australia). For measuring Particulate Matter (PM) emissions, a PM meter (MPM-4M) (MAHA Maschinenbau Haldenwang GmbH & Co. KG, Haldenwang, Germany) was used. Table 6 shows the specification of the gas analyser and PM meter. Before taking any data from the diesel engine, it was run with pure diesel (B0) for 20 min at full load to ensure that the engine was warmed up. The biodiesel-diesel blend (B5, B10, and B20) was then fuelled into the engine for analysis and data acquisition. At the end of any test or experiment with blended fuel, the engine was again flushed out with pure diesel to clear the fuel line of blended fuel and the injection system. All of the tests were repeated three times to minimise any possible error.
There are a large number of studies available in literatures on different biodiesels, and their engine performance and emission characteristics, but a very few researchers have analysed the engine performance or emission characteristics in terms of multivariate analysis. This study focuses on the multivariate analysis of PSO biodiesel blends and their interactive effect on engine performance.
3. Results and discussion
3.1. Characterisation of PSO Biodiesel-Diesel Blends
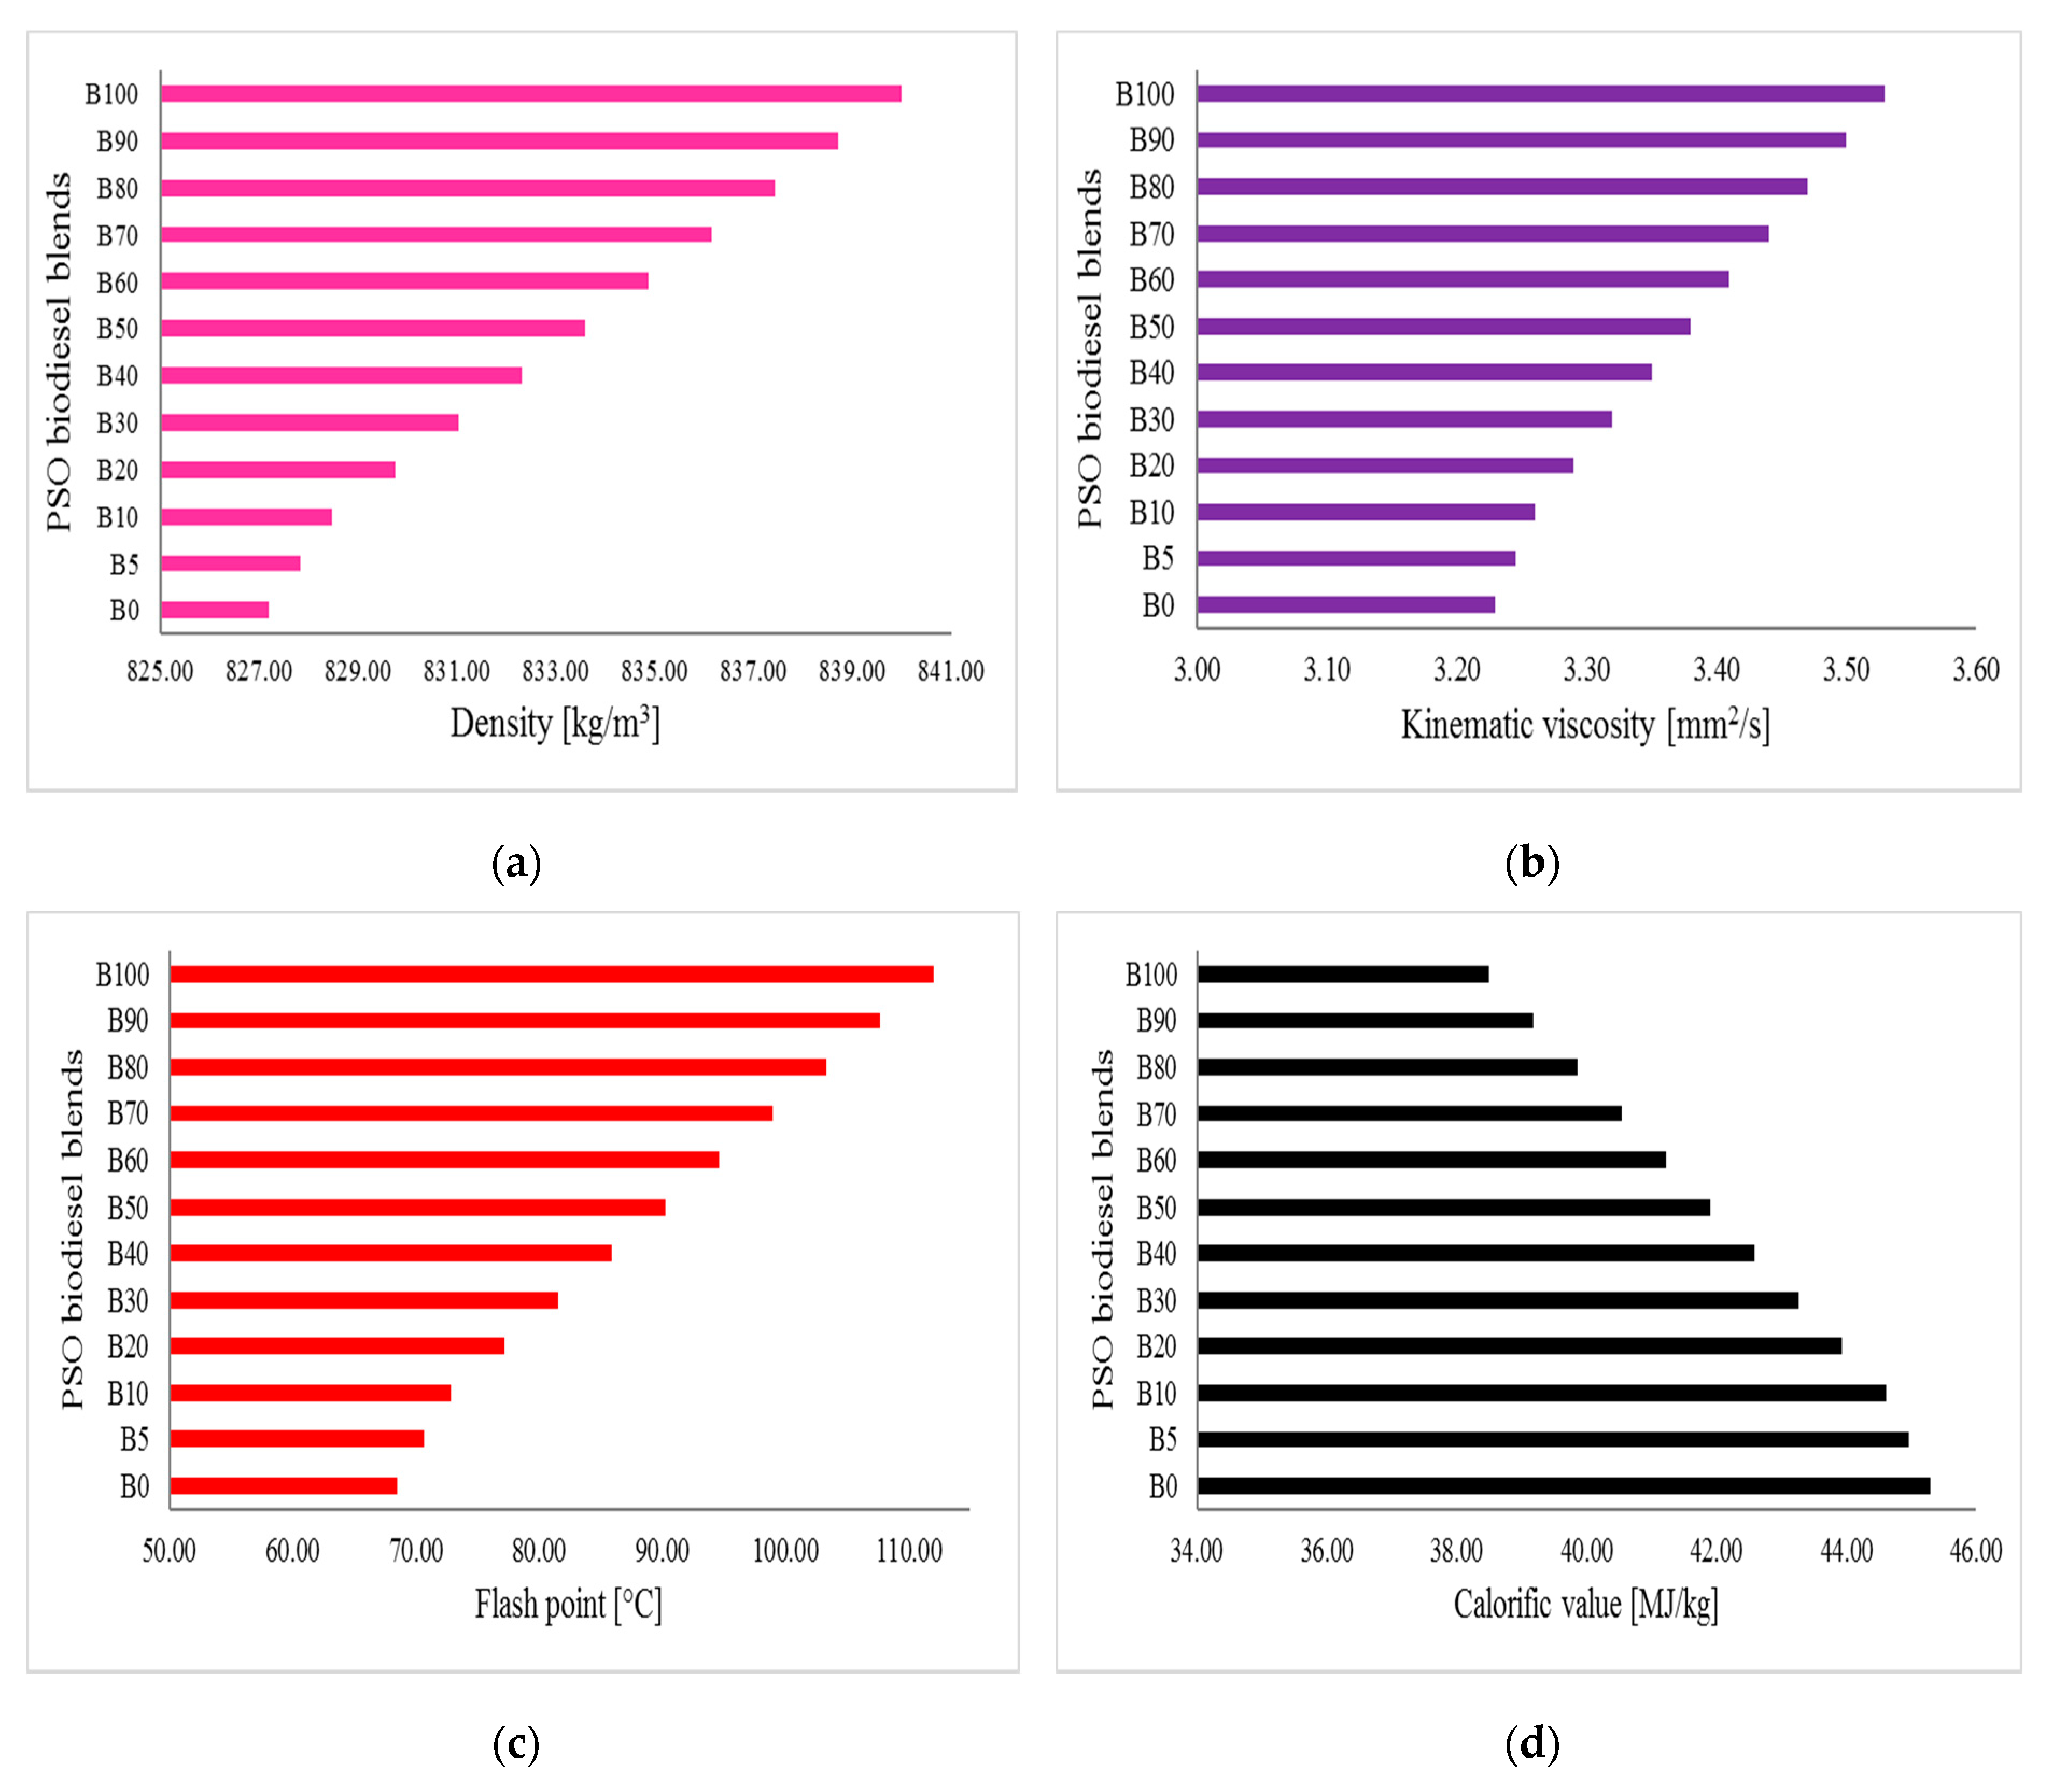
While the engine performance experiments in this study investigated B5, B10, and B20 biodiesel blends, the characteristics of a much broader series of PSO biodiesel-diesel blends has been investigated. A total of 10 PSO biodiesel-diesel blends (from B5-B90) were prepared, and their individual fuel properties of density, viscosity, flash point, calorific value, and oxidation stability have been analysed and are presented in Figure 4a–e.
Density is one of the vital properties of biodiesel that affects fuel atomisation efficiency in an airless combustion system [16]. According to relevant ASTM and EN standards, the density of biodiesel at 15 °C should be in the range of 860–900 kg/m3. The densities of B5 (827.84 kg/m3), B10 (828.48 kg/m3), and B20 (829.76 kg/m3) were very close to that of B0 diesel (827.20 kg/m3). Generally, biodiesel has a slightly higher density than diesel. In addition, density increased as the percentage of PSO biodiesel in the blends increased (Figure 4a).
Some vegetable oils have a higher viscosity, which causes poor fuel flow. Raw PSO has a viscosity of 27.3 mm2/s, which is 8–9 times higher than diesel (B0). However, after the transesterification process, the viscosity of PSO drops to an acceptable limit. Generally, the viscosity of biodiesel ranges from 1.9–6.0 mm2/s, and all PSO biodiesel-diesel blends in Figure 4b fulfill this requirement. However, the viscosity of B5 (3.25 mm2/s), B10 (3.26 mm2/s), B20 (3.29 mm2/s), and B30 (3.32 mm2/s) were very close to B0 (3.23 mm2/s). Therefore, those blends (B10–B30) can be used as a diesel engine fuel without any modifications to the engine.
According to ASTM D6751, the flashpoint should be 100–170 °C, and all of the biodiesel-diesel blends met that requirement as well. The flash point of B0 was recorded as 68.50 °C, whereas B5, B10, and B20 were found to be 70.68 °C, 72.85 °C, and 77.20 °C, respectively. Biodiesel tends to a higher flash point than diesel, and Figure 4c shows the pattern of the increased flash point with increased biodiesel blends. The more the flashpoint is above 66 °C is indicative of a safer fuel with better storage ability [1,17]. From that perspective, all PSO biodiesel-diesel blends can be stored safely and they can be used to fuel a diesel engine without any modifications.
Calorific value is another important property in the selection of any fuel. Figure 4d shows that pure PSO biodiesel and all of its blends have slightly lower calorific values than diesel although they are within the requirements of international standards. Biodiesel has nearly 10% more oxygen content than diesel, and less hydrogen-carbon content hence will produce less thermal energy [17]. Calorific values of B5 (44.96 MJ/kg), B10 (44.62 MJ/kg), and B20 (43.94 MJ/kg) blends are very close to B0 (45.30 MJ/kg).
Another vital fuel property is oxidation stability (OS), as it indicates the degree of oxidation that occurs during prolonged storage. Hasni et al. [18] mentioned that lower oxidation stability could adversely affect fuel quality. The higher the oxidation stability, the better the fuel quality. As the PSO biodiesel (unsaturated fatty acid) percentage increases, the OS decreases, which is shown in Figure 4e. As per European standard EN 590, the minimum OS of any fuel should be 20 h (indicated by the red line on the Figure 4e). PSO biodiesel-diesel blends B5 to B50 meet that standard. B5 has an OS value of 37.33 h and B50 is 22.31 h, while B0 has an OS value of 39 h. According to ASTM D6751 and EN14214, the minimum OS values are 3 and 6 h respectively. This study found the 100% PSO biodiesel has an OS value of 5.61 h, which falls within the ASTM and close to EN standards.
3.2. Analysis of Engine Performance
3.2.1. Brake Power (BP)
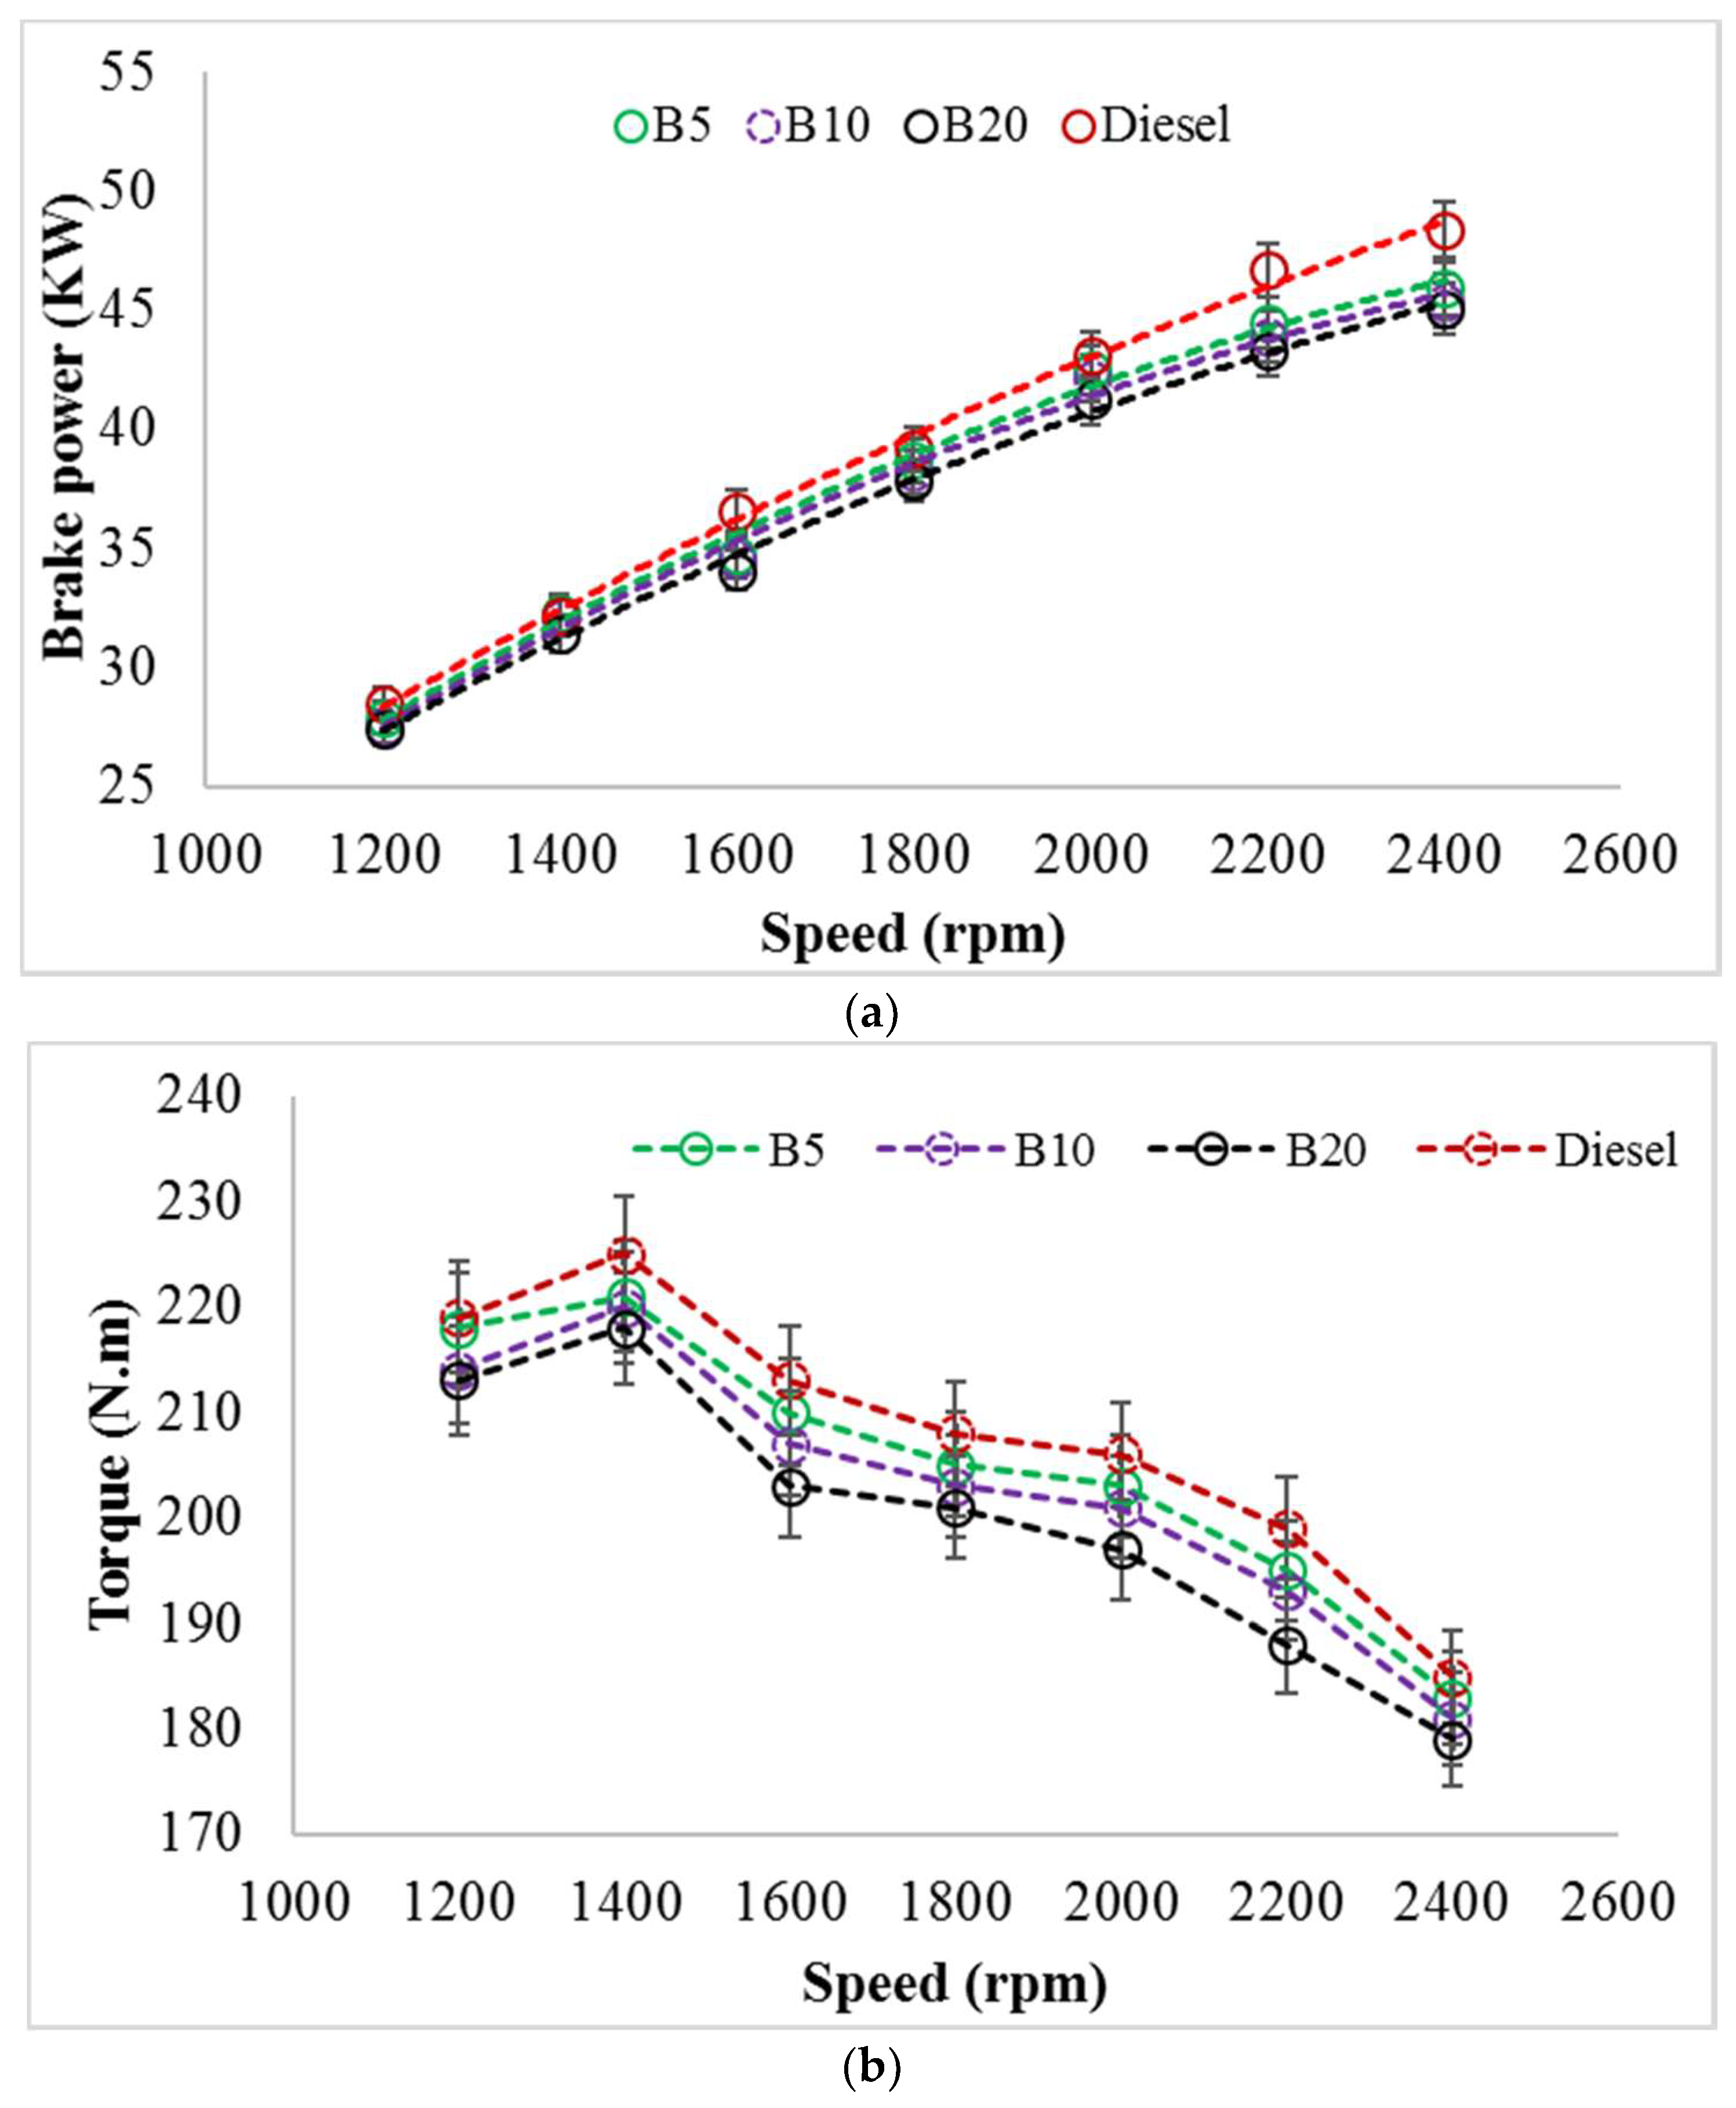
The brake power (BP) outputs from the diesel engine fuelled with diesel (B0) and PSO B5, B10, and B20 blends are shown in Figure 5a. It can be seen that the BP gradually increases with the increase of engine speed. Maximum BP was observed at 2400 rpm and was 45.9 kW, 45.4 kW, 45.08 kW, and 48.34 kW for B5, B10, B20, and B0, respectively. Several factors, such as calorific value and viscosity, can have the effect of uneven combustion that results in lowering the BP value. In this study, the viscosity of diesel (B0) and PSO biodiesel-diesel blends were very close. Only the difference in calorific values of blends and diesel caused the variations in BP values. Average BP value reductions for B5, B10, and B20 in comparison with B0 were 2.88%, 3.87%, and 5.13%, respectively.
3.2.2. Torque
Figure 5b shows that torque increases initially with speed increase up to 1400 rpm when the maximum level is achieved and then decreases continuously until the maximum speed of 2400 rpm for all biodiesel blends and B0. B5 had the highest torque among the biodiesel blends due to its higher calorific value and lower density and viscosity. As expected, B0 (diesel) had the highest torque followed by B5, B10, and B20. The maximum torques were recorded at 1400 rpm, and these were 225 Nm, 221 Nm, 220 Nm, and 218 Nm for B0, B5, B10, and B20, respectively. The average torque reduction for B5, B10, and B20 as compared with B0 was 1.37%, 2.47%, and 3.85%, respectively.
3.2.3. Brake Specific Fuel Consumption (BSFC)
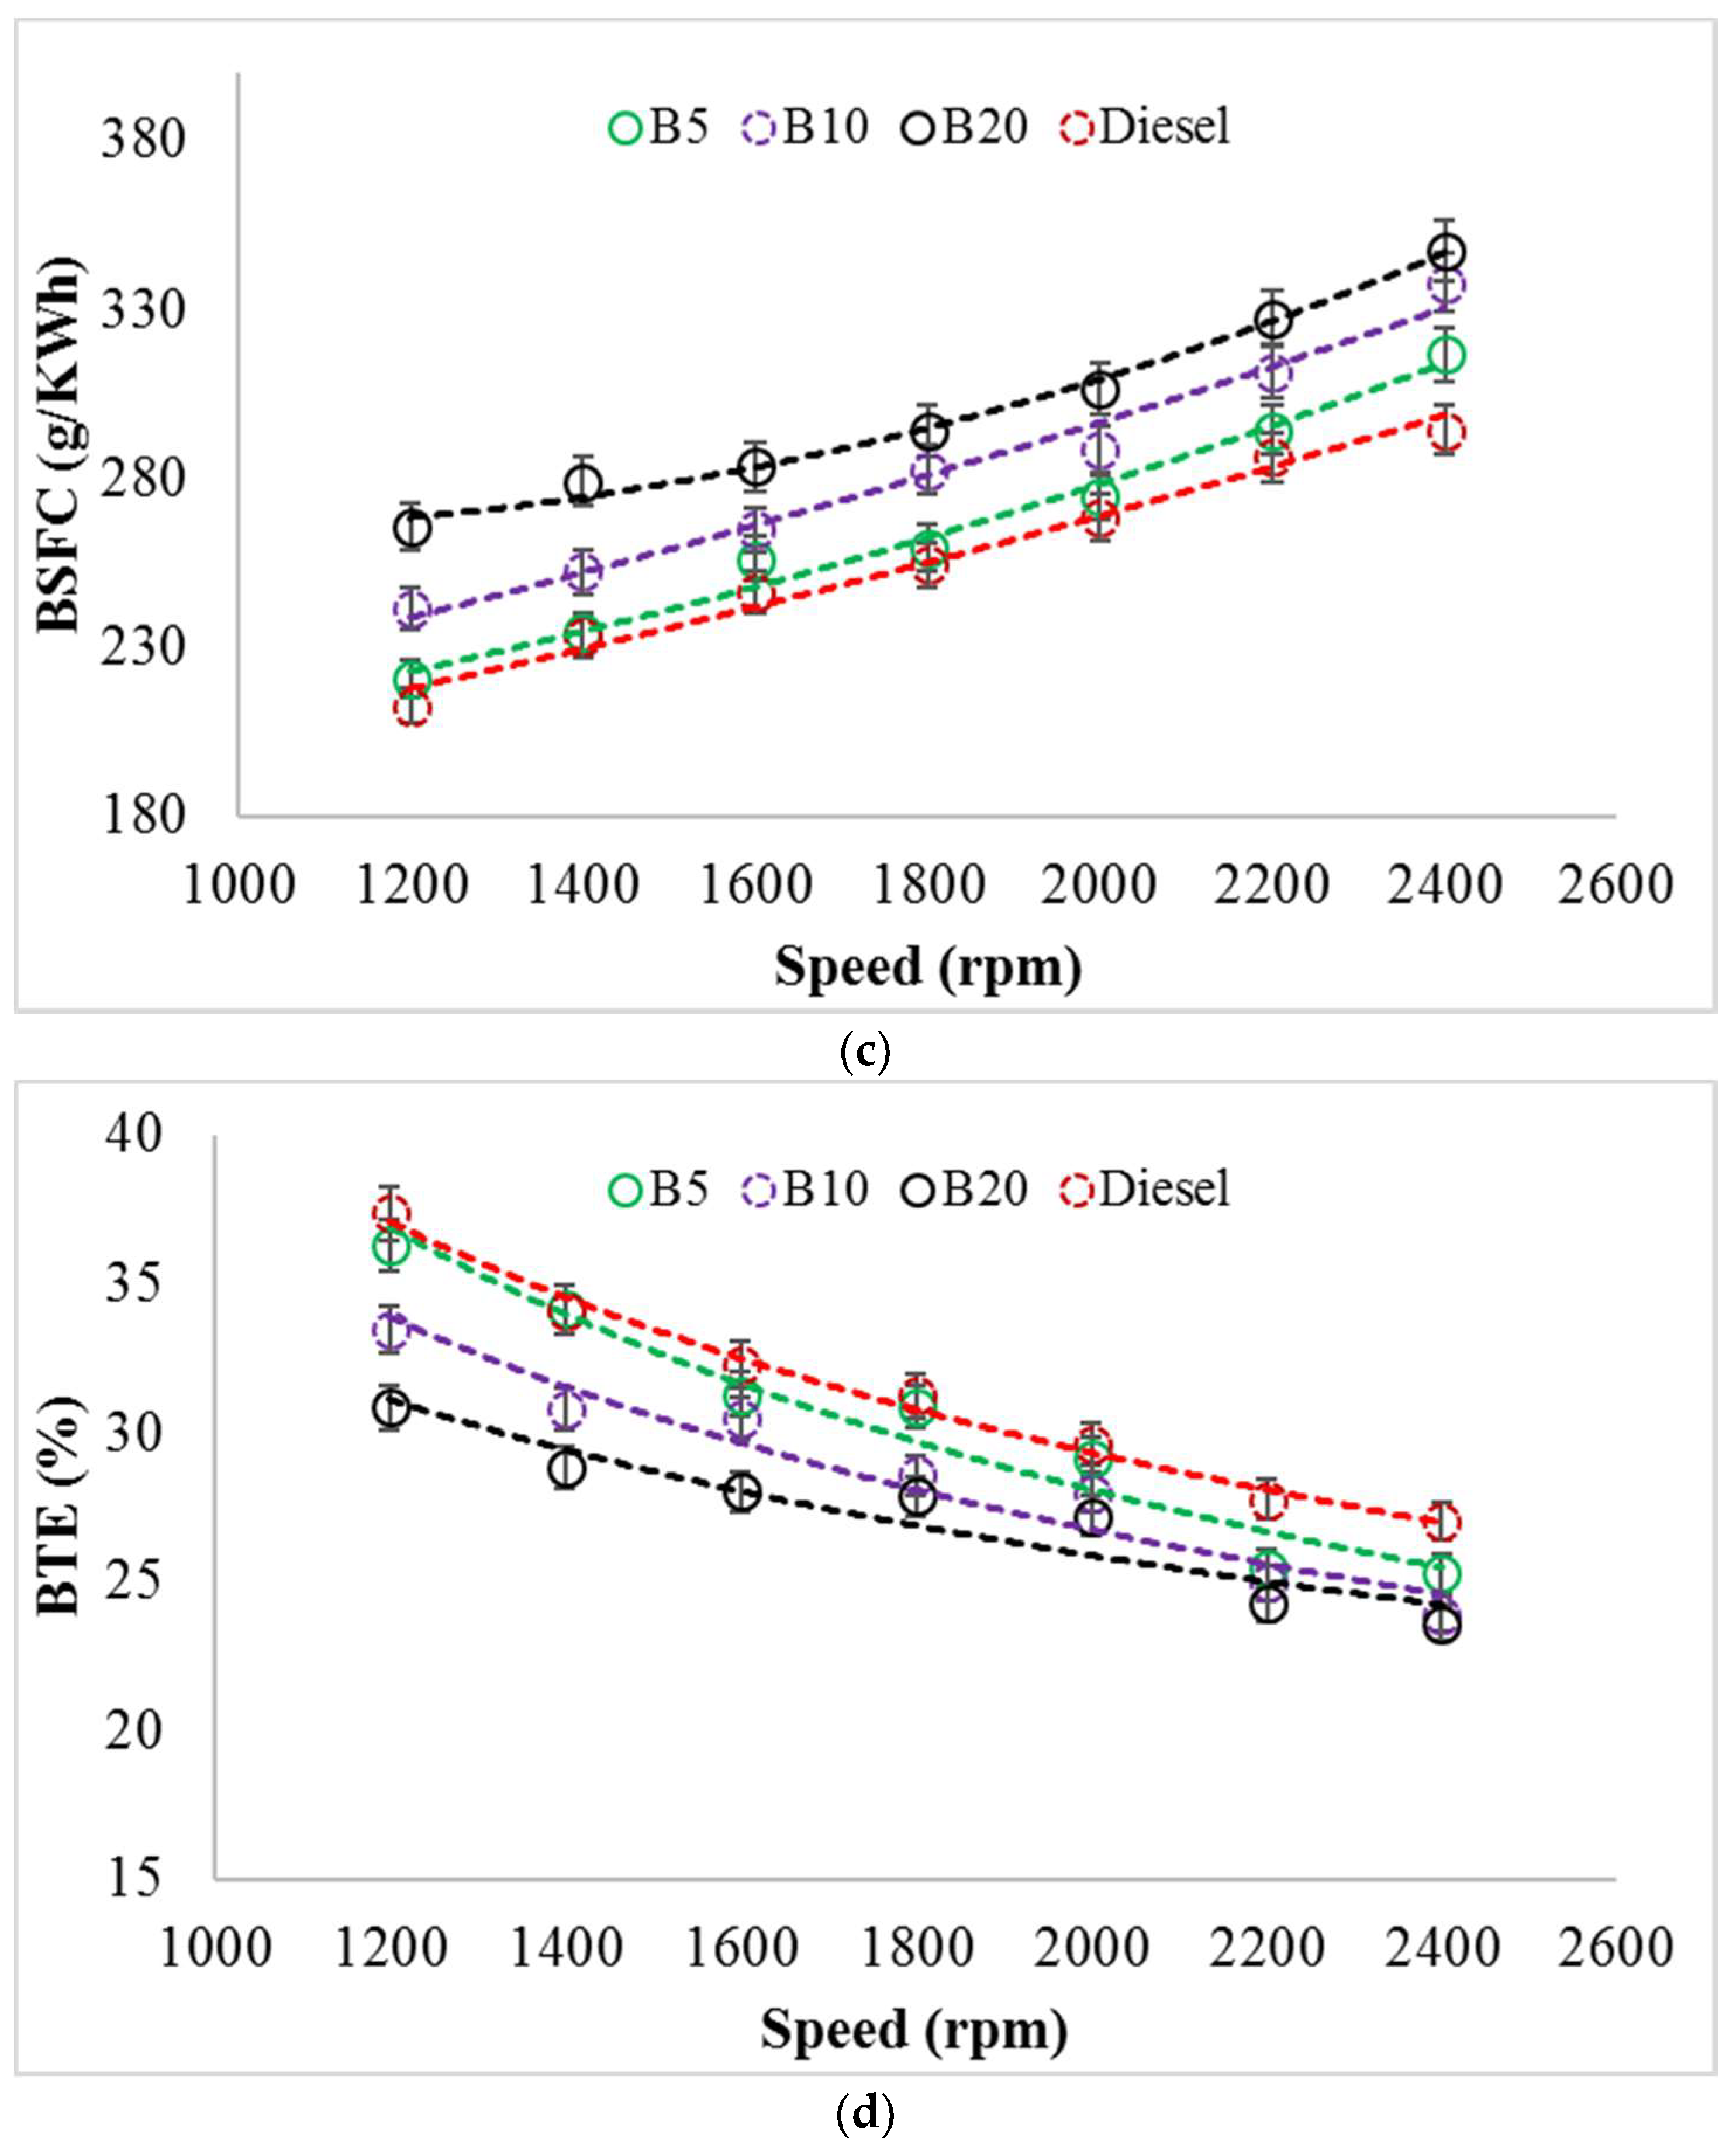
Brake specific fuel consumption (BSFC) is the ratio of fuel flow rate and brake power. According to Mofijur et al. [17], BSFC values depend on the relationship between the fuel injection system, fuel density, calorific value, and viscosity. Figure 5c shows the variation of BSFC for all PSO biodiesel-diesel blends and diesel with respect to engine speed. It is found that diesel has the lowest BSFC value in comparison with PSO biodiesel-diesel blends (B5, B10, and B20). The average BSFC value of B0 was measured as 256.5 g/kWh, whereas those for blends of B5, B10, and B20 were 265 g/kWh, 282.6 g/kWh, and 300.4 g/kWh, respectively. As mentioned earlier, the combined effects of fuel properties, such as density, viscosity, and calorific values of biodiesel may result in higher BSFC. Besides, biodiesel needs more fuel for producing the same power due to its lower calorific value in comparison with diesel. The average increase in BSFC values for B5, B10, and B20 as compared with B0 (diesel) were 3.35%, 10.16%, and 17.13%, respectively.
3.2.4. Brake Thermal Efficiency (BTE)
Brake thermal efficiency (BTE) is the ratio of the brake power and heat energy that is produced by fuel. Figure 5d shows that BTE decreases with the increase of biodiesel in the blends from B5 to B20. A higher BTE value (%) depends on some specific fuel properties such as higher calorific value, and lower density and viscosity. When compared with other blends, the properties of B5 were matched closely with diesel. The average BTE value of B5 was measured as 30.35%, whereas diesel was recorded as 31.33%. The lower calorific values and higher fuel consumptions of both B10 and B20 resulted in BTE values of 28.59% and 27.23%, respectively. The average reduction in BTE values for B5, B10, and B20 as compared with B0 (diesel) were 3.1%, 8.76%, and 13.1%, respectively.
3.3. Interaction Effects of Operating Parameters on PSO Engine Performance
The complex interaction effects of operating parameters, such as biodiesel blends, load, and speed, on each engine output response (BP, torque, BSFC, and BTE) could not be analysed independently. The significance of each of the various parameters in the model was obtained via analysis of variance (ANOVA). The experiments were carried out by use of the Box-Behnken response surface design. Minitab 18 was used to carry out the statistical analysis. Table 7 shows the factors and the range and levels of the investigated variables.
Once the experiments were completed, a full quadratic model was applied for the correlation of the response variable to the independent variables. The form of the full quadratic model is shown in Equation (2).
where R is the response factor; P0 is a constant; P1, P2, P3 are regression coefficients, P1,1, P1,2, P1,3, P2,2, P2,3, and P3,3 are quadratic coefficient; and, Q1, Q2, and Q3 are independent variables.
R = P0 + P1Q1 + P2Q2 + P3Q3 + P1,2Q1Q2 + P1,3Q1Q3 + P2,3Q2Q3 + P1,1Q12 + P2,2Q22 + P3,3Q32
Consideration was given to the linear, quadratic and combined effects of operating parameters to identify their impacts on the response. Each parameter’s the significance was evaluated by the probability value (p-value) from ANOVA. At the 95% confidence level, the p-values less than 0.05 indicate a ‘significant’ effect of those parameters on the response. In other words, p-values more than 5% or 0.05 indicate ‘not-significant’ effects of those parameters on the response.
3.3.1. Effects of Biodiesel Blends, Load and Speed on Brake Power (BP)
The relationships between brake power and three operating parameters of biodiesel blends, load, and speed were analysed. A quadratic regression model based on the coded parameters with determined coefficients for statistical prediction as defined by Equation (3) was developed using Minitab 18 to predict BP (kW) as a function of biodiesel blends (BL), load (LD), and speed (SP).
BP = 20 − 0.018 BL + 17.945 LD + 4.41 SP + 0.501 BL2 − 0.324 LD2 − 0.799 SP2 − 0.267 BL × LD − 2.177 BL × SP + 4.093 LD × SP
p-values from Table 8 show that the model is highly significant with an insignificant lack of fit. When considering the linear, quadratic, and combined effects, BL is not significant as a linear parameter; also, none of the quadratic terms is significant. Only the combined effects of LD and SP are highly significant, whereas BL and SP have a significant effect on BP. The ANOVA results in Table 8 also show that both LD and SP have the lowest p-values (<0.0001 each) and highest F-values (3307.29 and 199.74). According to the quadratic Equation (3), both LD and SP have positive effects on BP. This means that increasing the LD and SP will increase BP as well. The coefficient of determination (R2) and the adjusted coefficient of determination (adj. R2) were 99.86% and 99.61%, respectively, which indicates a high accuracy for the model.
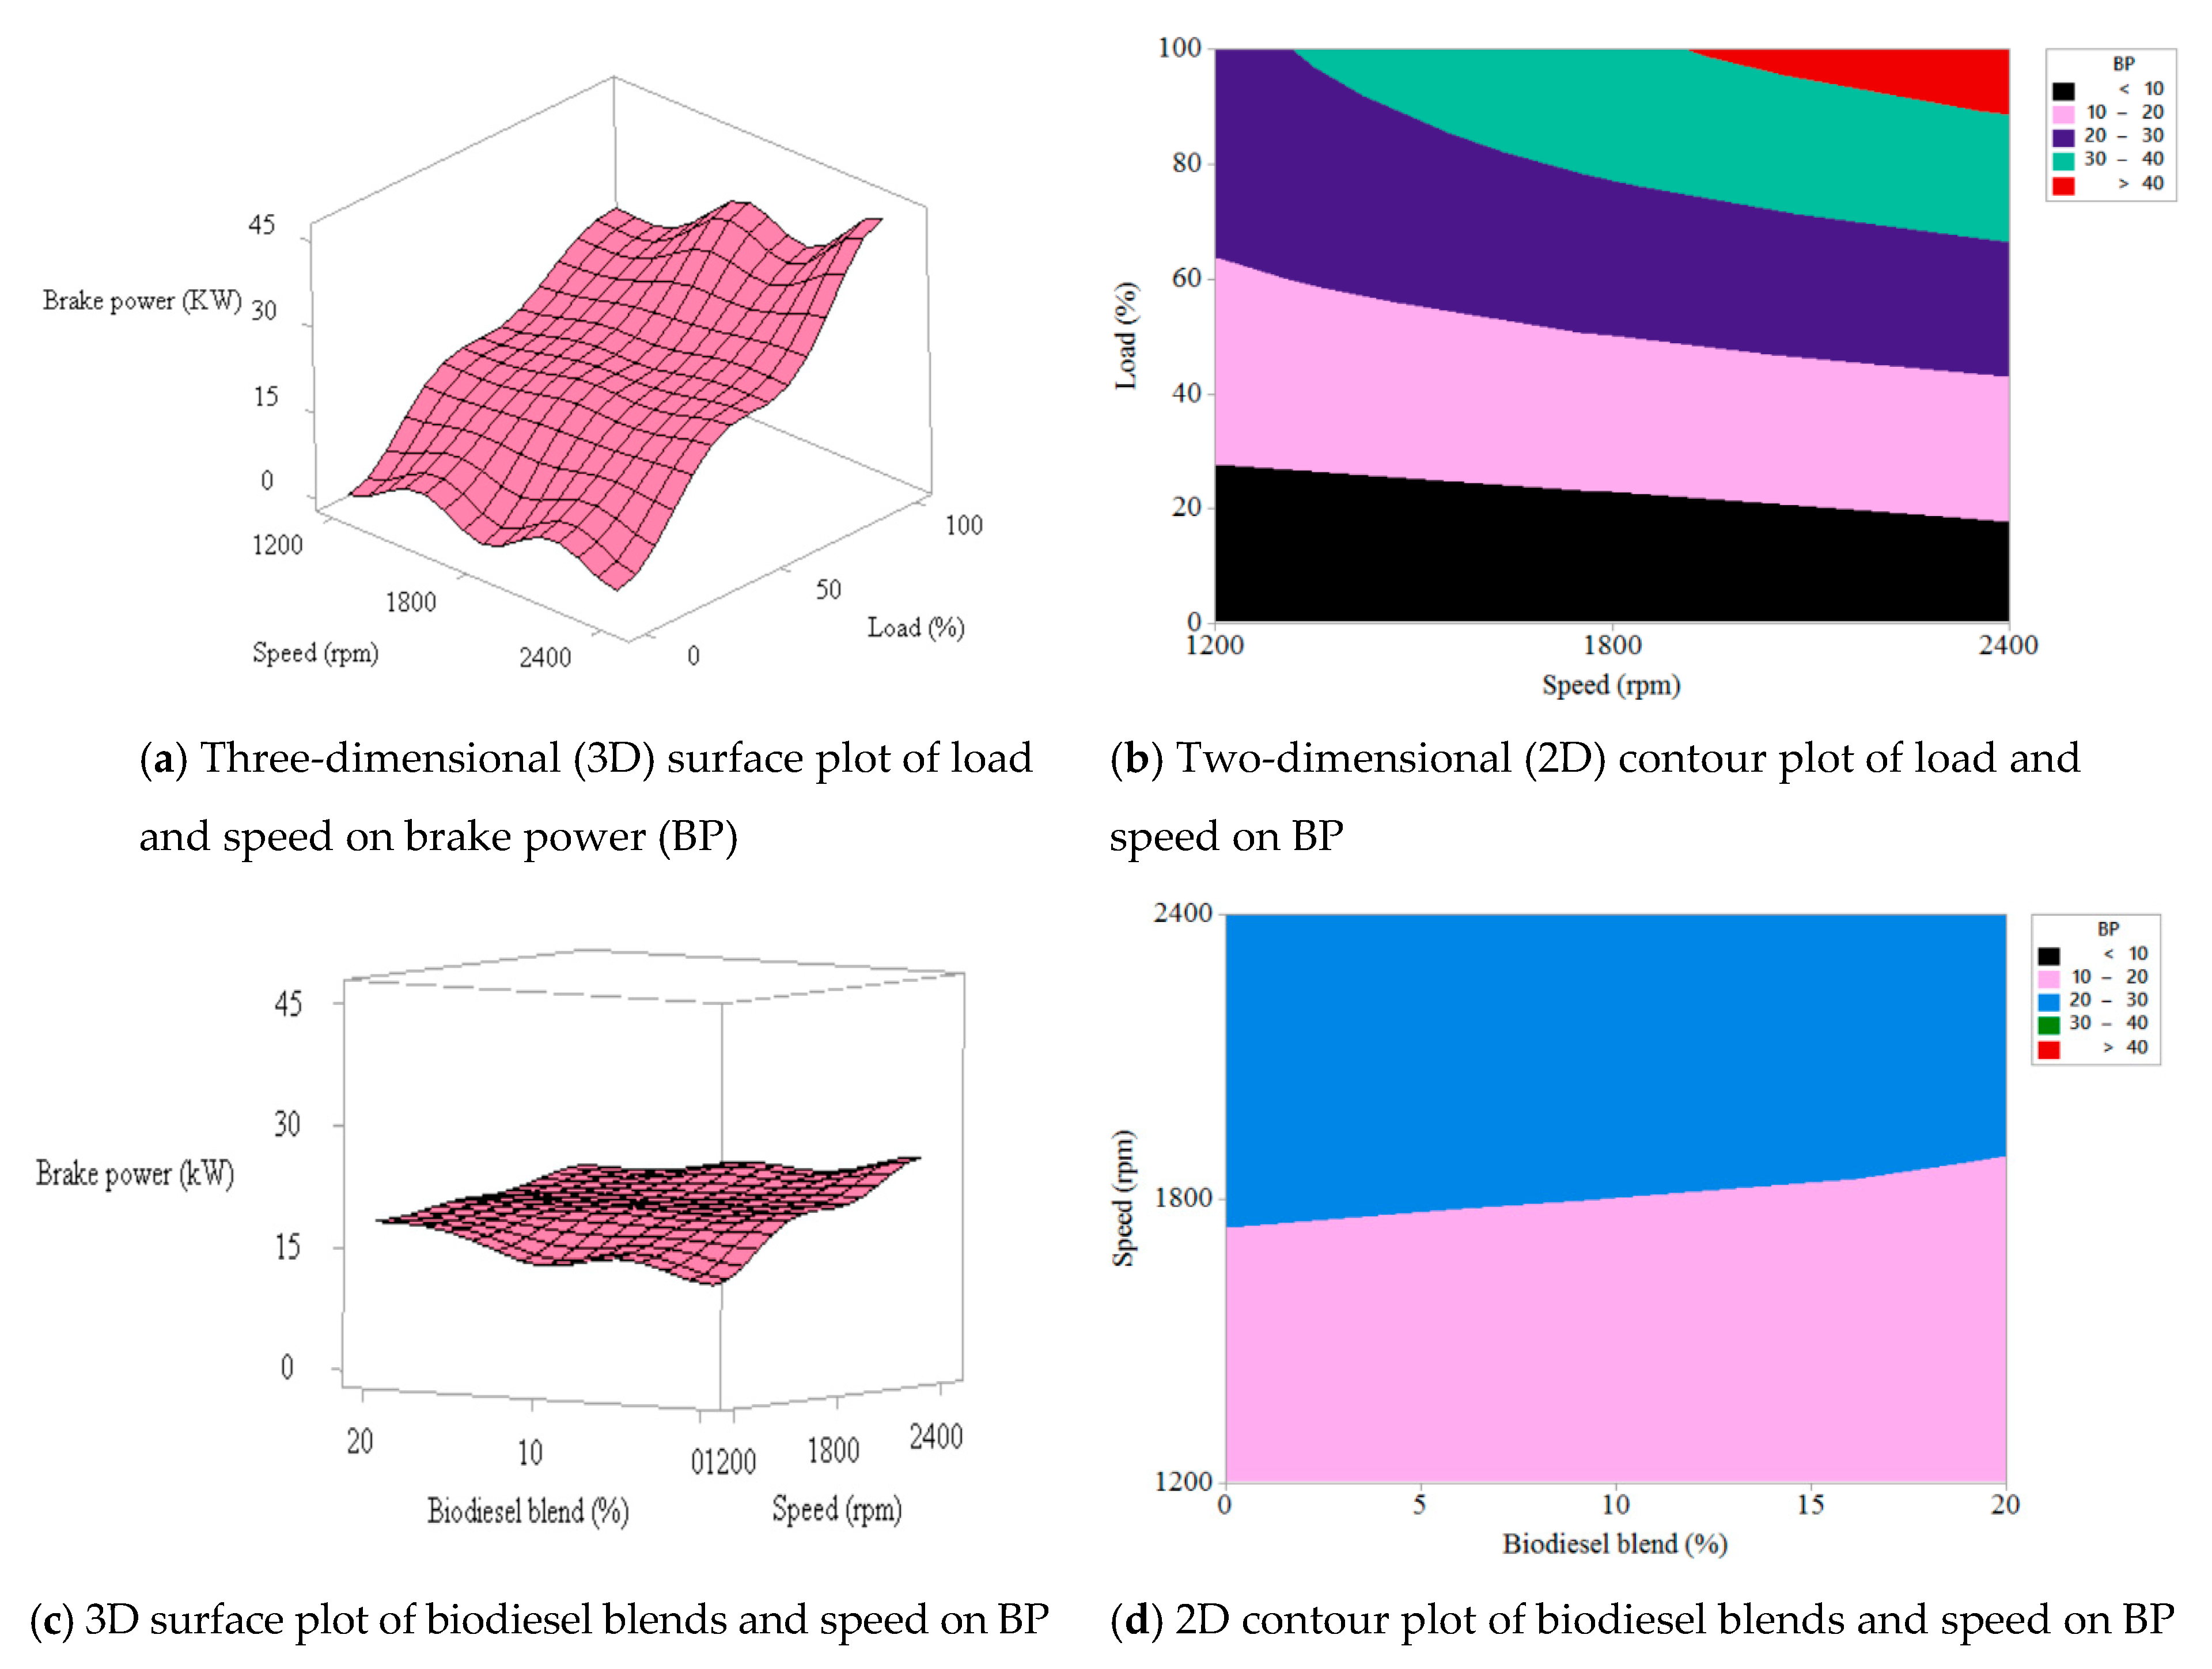
The ANOVA results in Table 8 for both LD × SP, and BL × SP interaction effects on BP are shown graphically in Figure 6. The three-dimensional (3D) surface plot and two-dimensional (2D) contour plot of LD and SP effects on BP are presented in Figure 6a,b respectively. BP (kW) increases with the increase of LD up to 100% and exceeds 40 kW with SP of 2000 rpm onwards. The maximum BP was found to be 45 kW at 2400 rpm. At 50% LD, the average BP value was recorded at about 20 kW with minimum effects from SP. However, the combined effects of LD and SP on BP are more significant with an increase of LD above 50%. Figure 6c,d present the 3D surface plot and 2D contour plot, respectively, which show only minor influences of changes of BL and SP on BP. It is therefore concluded that BL has a slight effect on BP, irrespective of SP changes.
3.3.2. Effects of Biodiesel Blends, Load, and Speed on Torque
The relationships between torque and three operating parameters of biodiesel blend, load, and speed were analysed. Based on the coded parameters, a quadratic regression model with determined coefficients for statistical prediction, as defined by Equation (4), was developed using Minitab 18 to predict torque (N.m) as a function of biodiesel blend (BL), load (LD), and speed (SP).
T = 137.47 + 4.596 BL + 95.884 LD − 8.105 SP − 16.6 BL2 − 15.06 LD2 − 18.13 SP2 − 0.53 BL × LD − 11.42 BL × SP − 12 LD × SP
p-values from Table 9 show that the model is highly significant with an insignificant lack of fit. When considering the linear, quadratic, and combined effects, only the combined effects of BL and LD are not significant. The ANOVA results in Table 9 show that LD is not significant, as it has the lowest p-value and highest F-value, while BL is found to be significant and all other parameters are highly significant. According to the quadratic Equation (4), both LD and BL have positive effects on torque. This means that increasing the LD and BL will increase torque as well. The coefficient of determination (R2) and the adjusted coefficient of determination (adj. R2) were 99.96% and 99.89%, respectively, which indicates the high accuracy of the model.
The ANOVA results in Table 9 for LD × SP, and BL × SP interaction effects on torque are shown graphically in Figure 7. The 3D surface plot and 2D contour plot of LD and SP effects on torque are presented in Figure 7a,b, respectively. Torque (Nm) decreases with the increase of SP at 100% LD. The maximum torque was found to be 220 Nm at 1400 rpm. At 50% LD, the average torque was recorded as about 120 Nm with minimum effects from SP. However, the combined effects of LD and SP on torque are more significant with an increase of LD above 50%. Figure 7c,d present the 3D surface plot and 2D contour plot, respectively, which show only minor influences of changes of BL and SP on torque. It is therefore concluded that BL has a slight effect on torque, irrespective of SP changes.
3.3.3. Effects of Biodiesel Blends, Load, and Speed on Brake Specific Fuel Consumption (BSFC)
The relationships between three operating parameters of biodiesel blend, load, and speed with brake specific fuel consumption (BSFC) were analysed. Based on the coded parameters, a quadratic regression model with determined coefficients for statistical prediction, as defined by Equation (5), was developed using Minitab 18 to predict BSFC (gm/kWh) as a function of biodiesel blends (BL), load (LD), and speed (SP).
BSFC = 252.17 + 138.13 BL − 526.25 LD − 30.43 SP + 62.5 BL2 + 488.88 LD2 + 71.66 SP2 − 125.71 BL × LD − 38.55 BL × SP + 78.67 LD × SP
p-Values in Table 10 show that the model is highly significant with an insignificant lack of fit. When considering the linear, quadratic, and combined effects, all of the parameters are highly significant. Among all parameters, LD is the parameter with the lowest p-value and highest F-value (20,429.23). According to the quadratic Equation (5), both LD and SP have a negative effect on BSFC. This means that increasing the LD will decrease BSFC, whereas decreasing the LD will increase BSFC. The SD parameter has less influence in changing BSFC. The coefficient of determination (R2) and the adjusted coefficient of determination (adj. R2) were 99.98% and 99.95%, respectively, which indicates the high accuracy of the model.
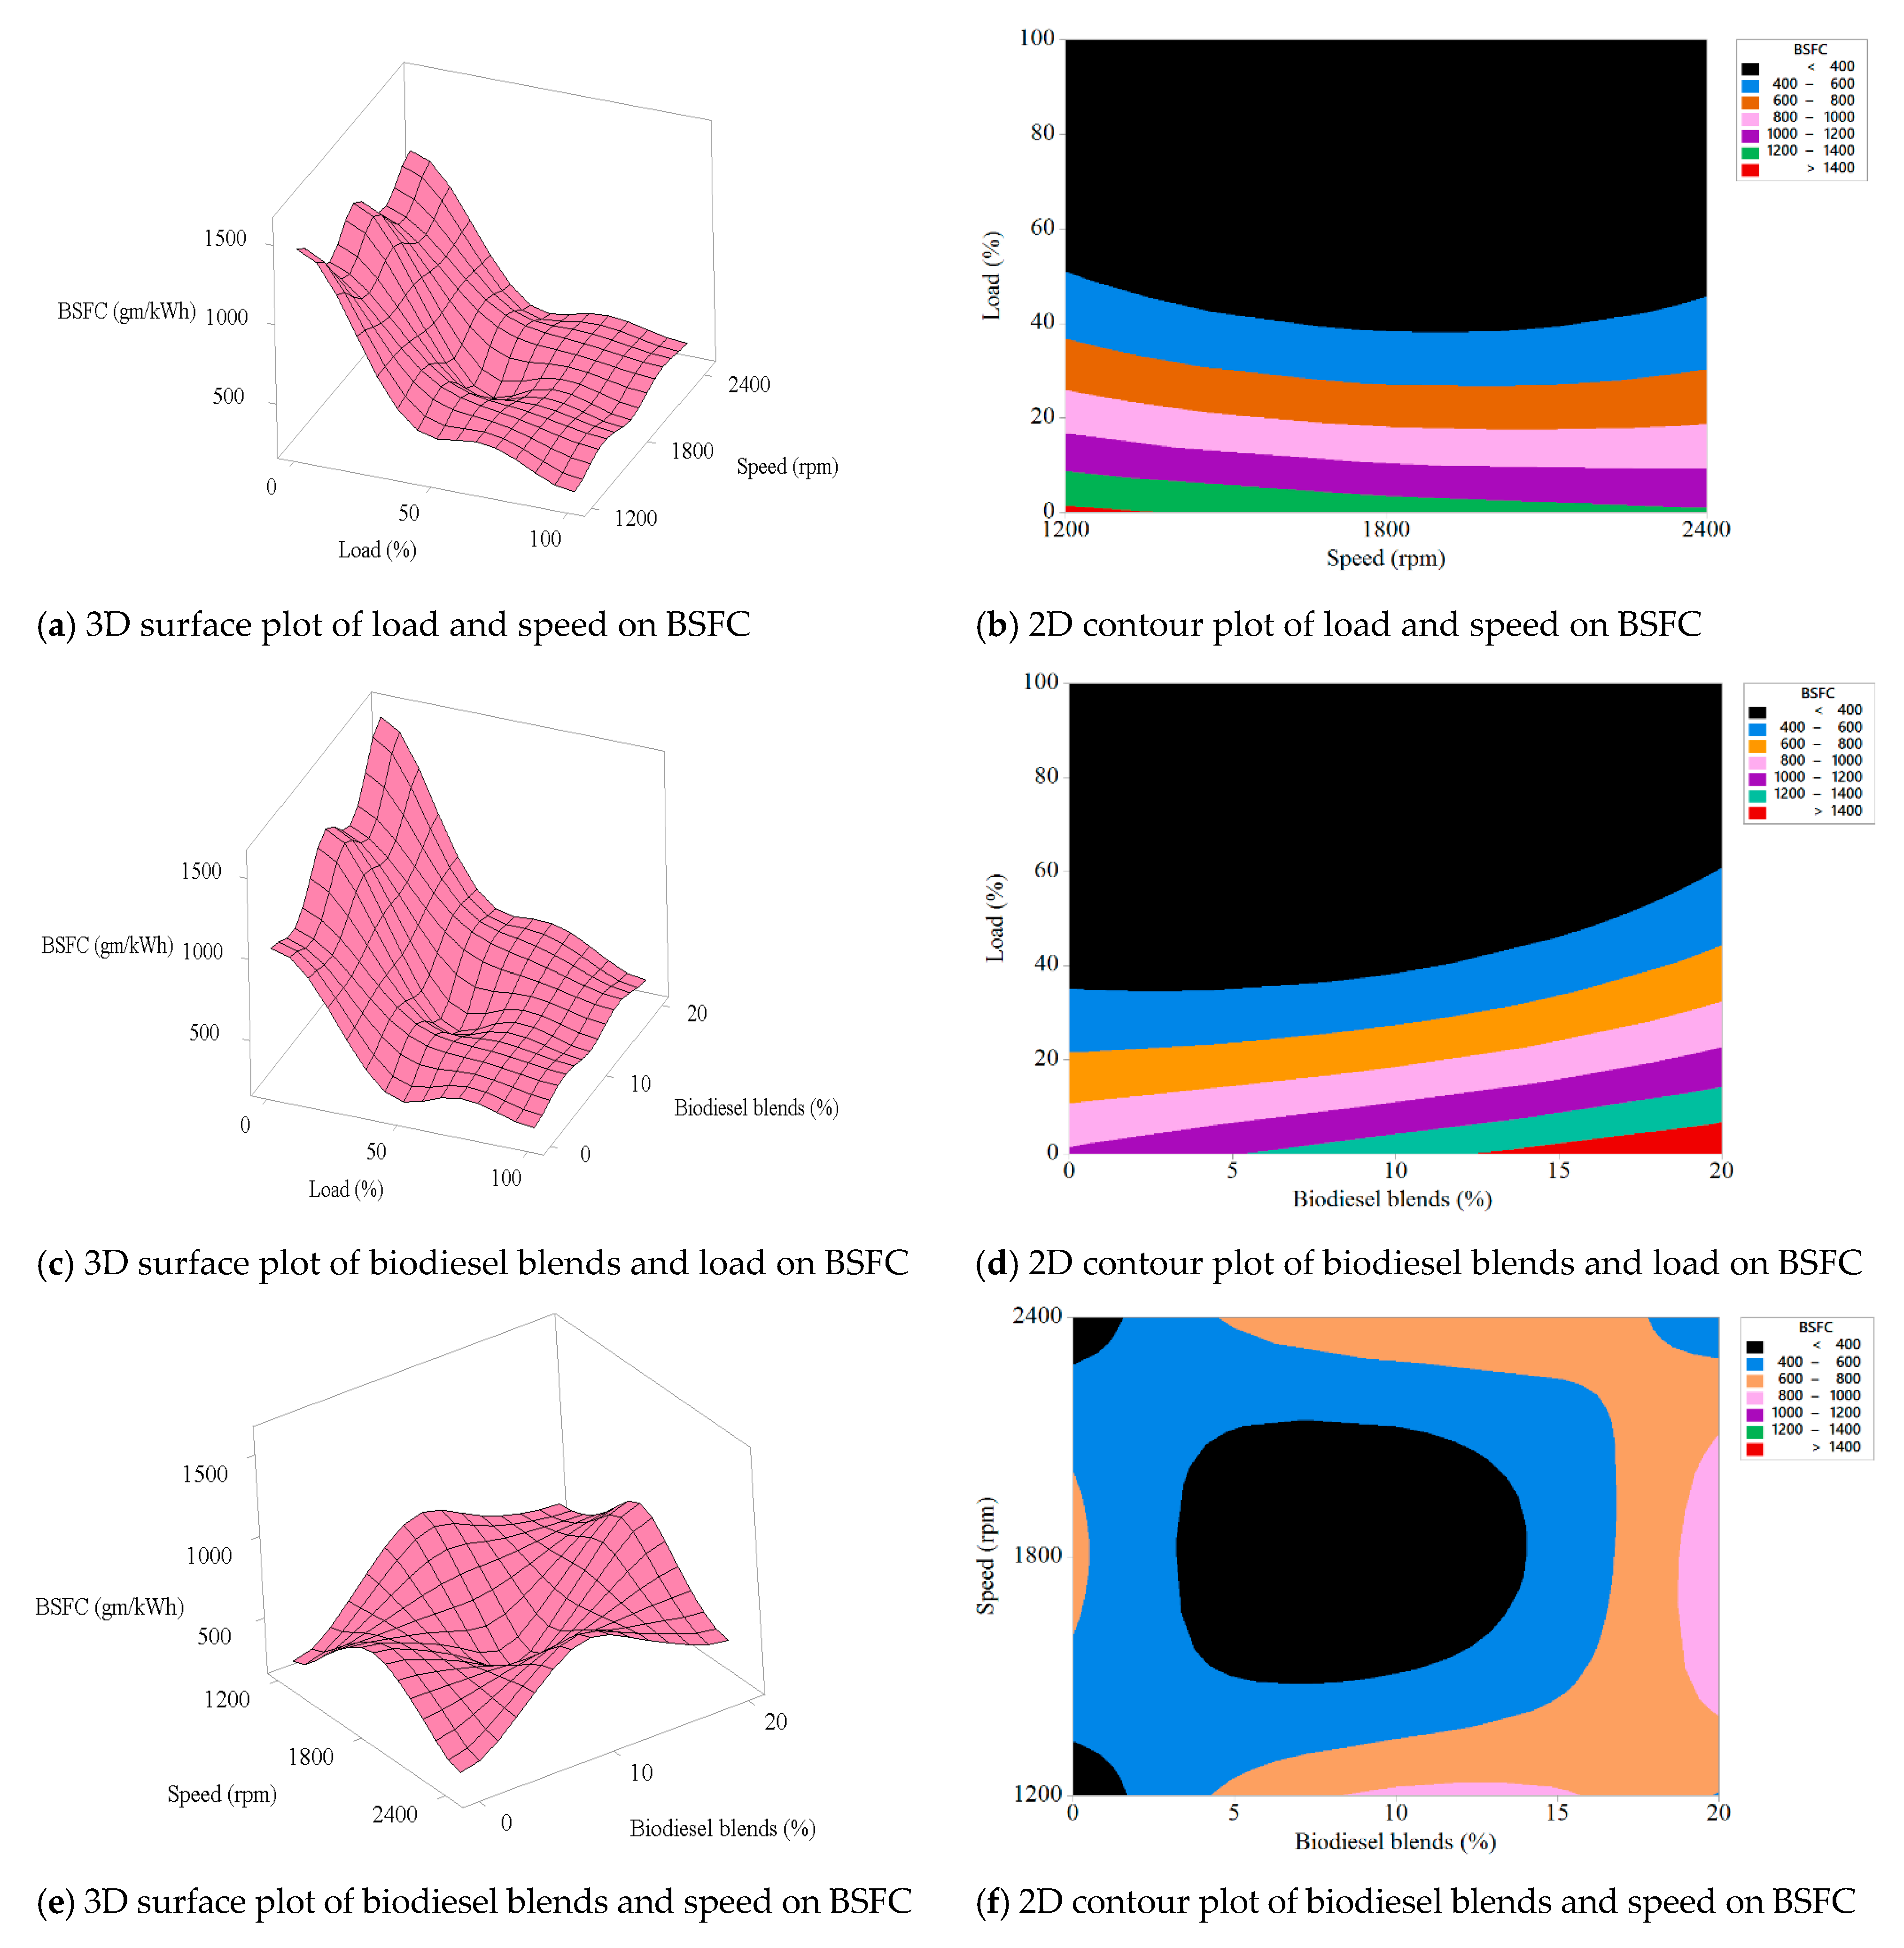
The ANOVA results in Table 10 for LD × SP, BL × LD, and BL × SP interaction effects on BSFC are shown graphically in Figure 8. The 3D surface plot and 2D contour plot of LD and SP effects on BSFC are presented in Figure 8a,b respectively. BSFC decreases with the increase of LD, irrespective of SP. The maximum BSFC was found to be 1450 gm/kWh at 0% LD and 1200 rpm SP. At 50% LD, the average BSFC was recorded at about 400 gm/kWh with almost no effect from changes in SP (rpm). Figure 8c,d present the 3D surface plot and 2D contour plot, respectively, of BL and LD effects on BSFC. At 0% LD, BL has a significant effect on BSFC. The 20% biodiesel blend (BL20) shows the maximum BSFC of 1450 gm/kWh at 0% LD. BSFC values decrease with the increase of LD, irrespective of BL. From Figure 8d, it can be seen that, at 36% LD, the 0–10% biodiesel blends (BL0, BL5, and BL10) have low BSFC values whereas, at 60% LD, BL20 also has achieved a lower BSFC. It is therefore concluded that BL has a minor effect on BSFC, irrespective of SP changes. Figure 8e,f show the 3D surface plot and 2D contour plot respectively of BL and SP effects on BSFC. BSFC values for BL0 have recorded for SP values in the range of 1200 to 2400 rpm and found to be less than 400 gm/kWh. Changes in both BL and SP influence BSFC values. From Figure 8f, it can be seen that both BL at 5% and BL at 10% have low BSFC for SP values in the range of 1600 to 2000 rpm. Higher BL percentages with higher SP values (up to 2000 rpm) result in higher values of BSFC.
3.3.4. Effects of Biodiesel Blends, Load, and Speed on Brake Thermal Efficiency (BTE)
The relationships between brake thermal efficiency (BTE) and three operating parameters of biodiesel blends, load, and speed were analysed. Based on the coded parameters, a quadratic regression model with determined coefficients for statistical prediction, as defined by Equation (6), was developed using Minitab 18 to predict BTE (%) as a function of biodiesel blends (BL), load (LD), and speed (SP).
BTE = 32.283 − 1.36 BL + 11.752 LD − 1.71 SP − 2.795 BL2 − 12.05 LD2 − 1.9 SP2 + 1.038 BL × LD + 0.267 BL × SP − 2.097 LD × SP
p-values in Table 11 show that the model is highly significant with an insignificant lack of fit. When considering the linear, quadratic, and combined effects, only the BL × LD and BL × SP combined parameters are not significant; all other parameters are significant. Only the combined effects of LD × SP are significant, whereas the quadratic terms LD × LD, BL × BL, and SP × SP were all found to have significant effects on BTE. The ANOVA results in Table 11 also show that LD has both the lowest p-values (<0.0001) and highest F-value (940.76). According to the quadratic Equation (6), only LD has a positive effect on BTE. This means that increasing the LD will increase BTE as well. The coefficient of determination (R2) and the adjusted coefficient of determination (adj. R2) were 99.66% and 99.05%, respectively, which indicates the high accuracy of the model.
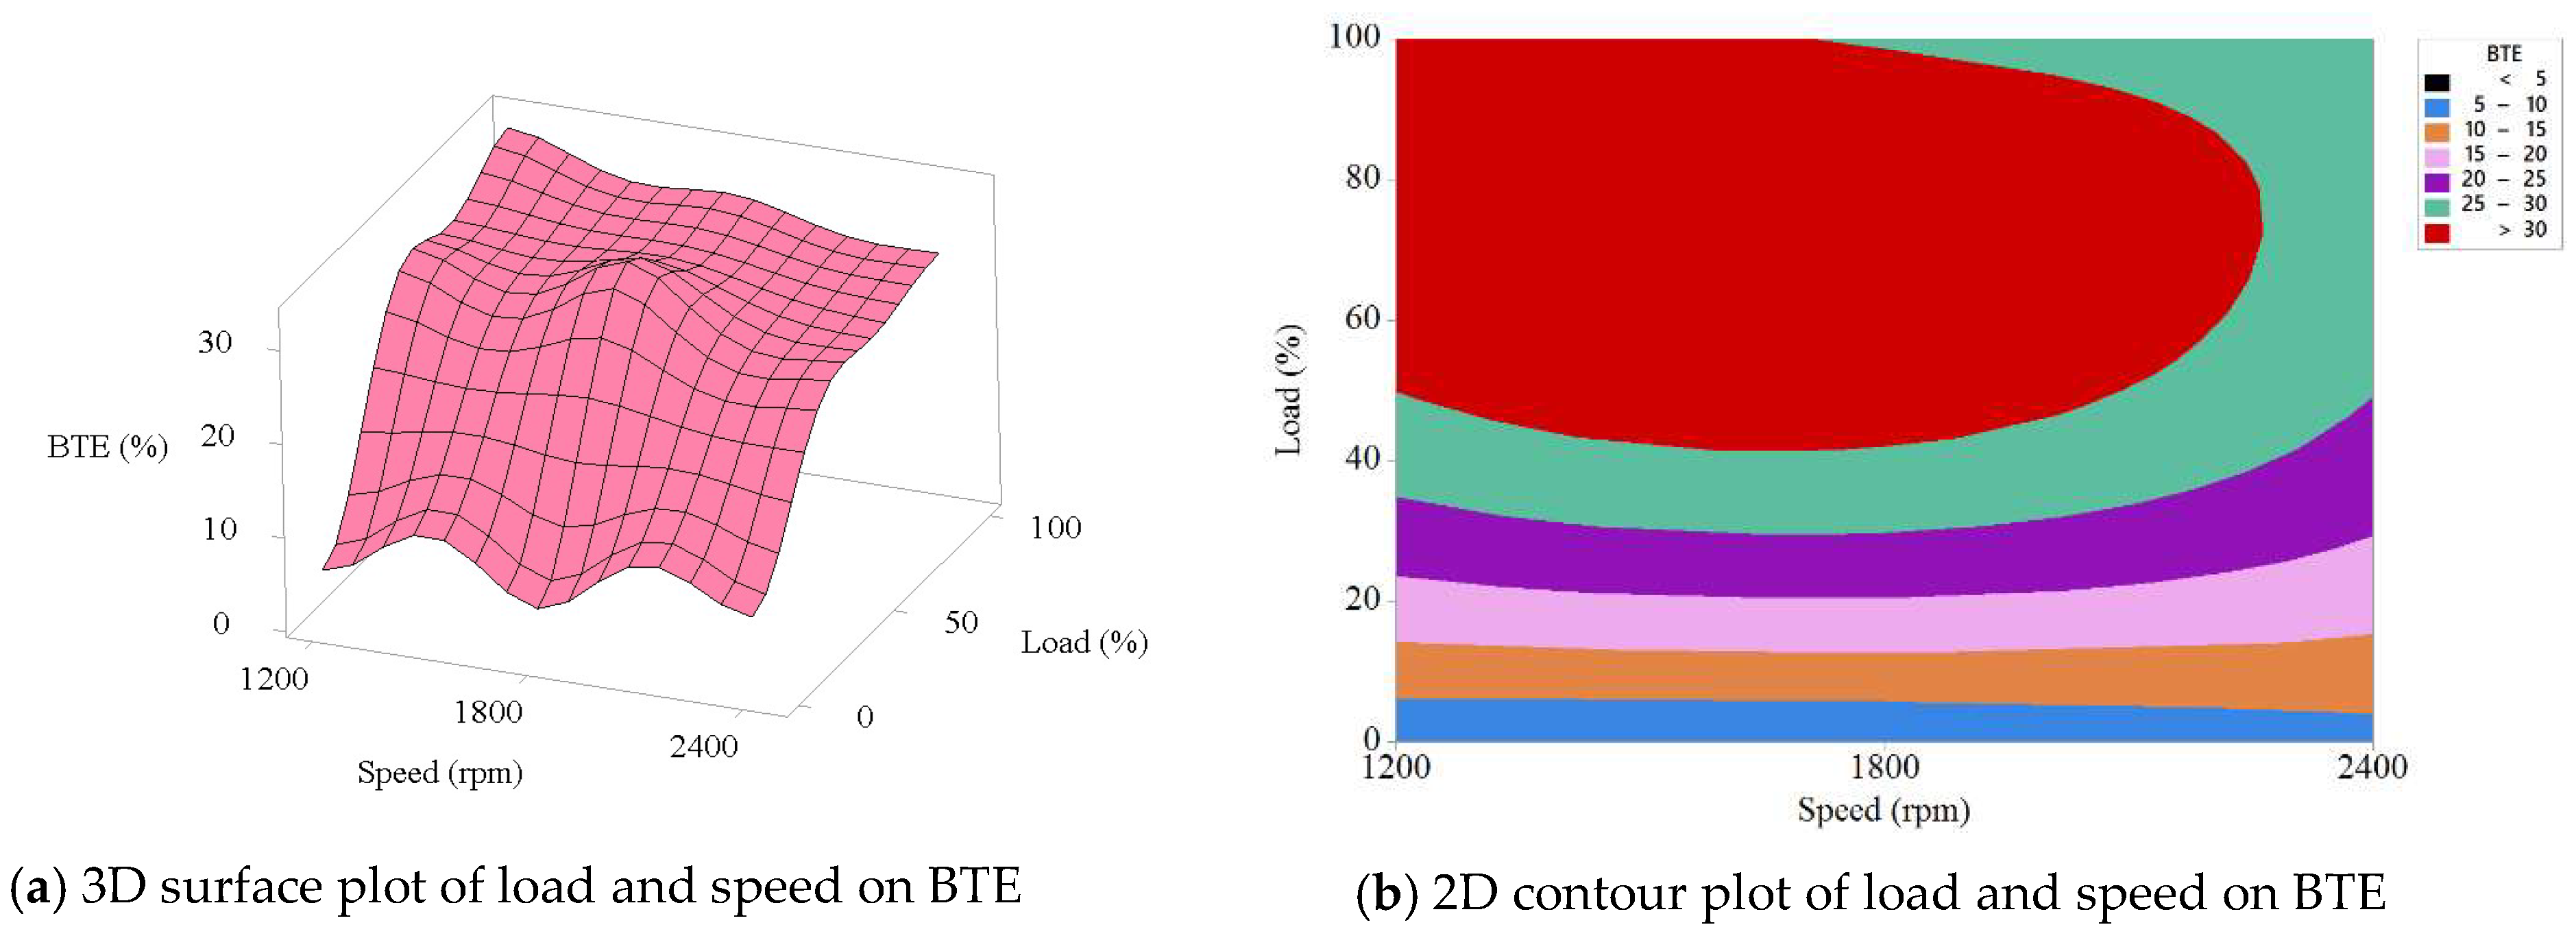
The ANOVA results in Table 11 for LD × SP interaction effects on BTE are shown graphically in Figure 9. The 3D surface plot and 2D contour plot of LD and SP effects on BTE are presented in Figure 9a,b, respectively. BTE increases with the increase of LD with minimum impacts from SP. The maximum BTE was found to be 33.43% at 1200 rpm. However, the combined effects of LD and SP on BTE are affected by an increase of LD above 50%. It is therefore concluded that SP has a minor impact on BTE, irrespective of LD changes.
4. Conclusions
This study investigated the effect of papaya seed oil (PSO) biodiesel in an agricultural diesel engine with various biodiesel-diesel blends and the resulting engine performance outcomes as compared with those from the use of a reference diesel. A response surface methodology was introduced to analyse and describe the performance of this engine. The results of this investigation can be summarised, as follows:
- PSO biodiesel-diesel blends (B5–B50) meet the European standard EN 590 for having minimum oxidation stability of 20 h.
- Over the entire speed range of 1200 to 2400 rpm, the average BP value reductions for B5, B10, and B20 in comparison with B0 were 2.88%, 3.87%, and 5.13%, respectively.
- The average torque reductions for B5, B10, and B20 in comparison with B0 were 1.37%, 2.47%, and 3.85%, respectively.
- The average increase in BSFC values for B5, B10, and B20 in comparison with B0 were 3.35%, 10.16%, and 17.13%, respectively.
- The average BTE value of B5 was measured as 30.35%, whereas B0 (diesel) was recorded as 31.33%.
- The interactive relationships between three operating parameters (biodiesel blends, load, and speed) and four responses (BP, torque, BSFC, and BTE) were analysed. ANOVA and a statistical regression model show that load and speed were the two most important parameters that affect all four responses. The biodiesel blends parameter had a significant effect on BSFC.
These results show that B5 and B10 PSO biodiesel-diesel blends can be used to fuel diesel engines without further engine modification. Therefore, it can be concluded that papaya seed oil can be considered as a promising source of biodiesel production. However, before recommending as a future alternative energy source in commercial scale, further research needs to be conducted in terms of engine emissions, in-cylinder pressure, burn rate data, combustion analysis, and tribological performance analysis.
Author Contributions
The contributions of each author are as follows: M.A. produced and characterised biodiesel-diesel blends, conducted and analysed engine performance, and drafted the manuscript; M.G.R. contributed to the experimental design and thoroughly revised the paper, and N.A. helped to revised and improved the paper.
Funding
This research received no external funding.
Acknowledgments
The authors would like to acknowledge Tim McSweeney, Adjunct Research Fellow, Tertiary Education Division at Central Queensland University, Australia for his contribution in proof reading of this article.
Conflicts of Interest
The authors declare no conflict of interest.
References
- Bhuiya, M.M.K.; Rasul, M.G.; Khan, M.M.K.; Ashwath, N.; Azad, A.K.; Hazrat, M.A. Second Generation Biodiesel: Potential Alternative to-edible Oil-derived Biodiesel. Energy Procedia 2014, 61, 1969–1972. [Google Scholar] [CrossRef]
- Asokan, M.A.; Prabu, S.S.; Kamesh, S.; Khan, W. Performance, combustion and emission characteristics of diesel engine fuelled with papaya and watermelon seed oil bio-diesel/diesel blends. Energy 2018, 145, 238–245. [Google Scholar] [CrossRef]
- Tüccar, G.; Tosun, E.; Özgür, T.; Aydın, K. Diesel engine emissions and performance from blends of citrus sinensis biodiesel and diesel fuel. Fuel 2014, 132, 7–11. [Google Scholar] [CrossRef]
- Ozsezen, A.N.; Canakci, M.; Turkcan, A.; Sayin, C. Performance and combustion characteristics of a DI diesel engine fueled with waste palm oil and canola oil methyl esters. Fuel 2009, 88, 629–636. [Google Scholar] [CrossRef]
- Agunbiade, F.O.; Adewole, T.A. Methanolysis of Carica papaya Seed Oil for Production of Biodiesel. J. Fuels 2014, 2014, 904076. [Google Scholar] [CrossRef]
- Wong, C.S.; Othman, R. Biodiesel Production by Enzymatic Transesterification of Papaya Seed Oil and Rambutan Seed Oil. Int. J. Eng. Technol. 2014, 6, 2773–2777. [Google Scholar]
- Mohan, A.; Sen, S.S.S. Emission Analysis Of The Biodiesel from Papaya and Chicken Blends. Int. J. Inform. Futurist. Res. 2015, 2, 2258–2264. [Google Scholar]
- De Melo, M.L.S.; Santos, N.A.; Rosenhaim, R.; Souza, A.G.; Filho, P.F.A. Use of thermal analysis techniques for evaluation of the stability and chemical properties of papaya biodiesel (Carica papaya L.) at low temperatures. J. Therm. Anal. Calorim. 2011, 106, 831–836. [Google Scholar] [CrossRef]
- Daryono, E.D.; Sinaga, E.J. Rapid In Situ Transesterification of Papaya Seeds to Biodiesel with the Aid of Co-solvent. Int. J. Renew. Energy Res. 2017, 7, 379–385. [Google Scholar]
- Anwar, M.; Rasul, M.G.; Ashwath, N. Optimization of biodiesel production process from papaya (Carica papaya) seed oil. In Proceedings of the 2017 IEEE 7th International Conference on Power and Energy Systems (ICPES), Toronto, ON, Canada, 1–3 November 2017. [Google Scholar]
- Prabhakaran, P.; Saravanan, C.G.; Aalam, C.S. Effects of Papaya Methyl Ester on DI Diesel Engine Combustion, Emission and Performance Characteristics. Int. Res. J. Eng. Technol. 2016, 3, 319–325. [Google Scholar]
- Sundar Raj, C.; Karthikayan, M. Effect of additive on the performance, emission and combustion characteristics of a diesel engine run by diesel-papaya methyl ester blends. Int. J. Chem. Sci. 2016, 14, 2823–2834. [Google Scholar]
- Sharma, S.K.; Mitra, S.K.; Saran, S. Papaya Production in India—History, Present Status and Future Prospects; International Society for Horticultural Science (ISHS): Leuven, Belgium, 2016; Volume 1111, pp. 87–94. [Google Scholar]
- Anwar, M.; Rasul, M.G.; Ashwath, N. Production optimization and quality assessment of papaya (Carica papaya) biodiesel with response surface methodology. Energy Convers. Manag. 2018, 156, 103–112. [Google Scholar] [CrossRef]
- Silitonga, A.S.; Masjuki, H.H.; Mahlia, T.M.I.; Ong, H.C.; Chong, W.T.; Boosroh, M.H. Overview properties of biodiesel diesel blends from edible and non-edible feedstock. Renew. Sustain. Energy Rev. 2013, 22 (Suppl. C), 346–360. [Google Scholar] [CrossRef]
- Silitonga, A.S.; Ong, H.C.; Mahlia, T.M.I.; Masjuki, H.H.; Chong, W.T. Biodiesel Conversion from High FFA Crude Jatropha Curcas, Calophyllum Inophyllum and Ceiba Pentandra Oil. Energy Procedia 2014, 61 (Suppl. C), 480–483. [Google Scholar] [CrossRef]
- Mofijur, M.; Masjuki, H.H.; Kalam, M.A.; Atabani, A.E. Evaluation of biodiesel blending, engine performance and emissions characteristics of Jatropha curcas methyl ester: Malaysian perspective. Energy 2013, 55, 879–887. [Google Scholar] [CrossRef]
- Hasni, K.; Ilham, Z.; Dharma, S.; Varman, M. Optimization of biodiesel production from Brucea javanica seeds oil as novel non-edible feedstock using response surface methodology. Energy Convers. Manag. 2017, 149 (Suppl. C), 392–400. [Google Scholar] [CrossRef]
Figure 1.
PSO biodiesel production.

Figure 2.
PSO methyl ester investigation Fourier Transform Infrared (FTIR) spectrum.

Figure 3.
Test engine set up.
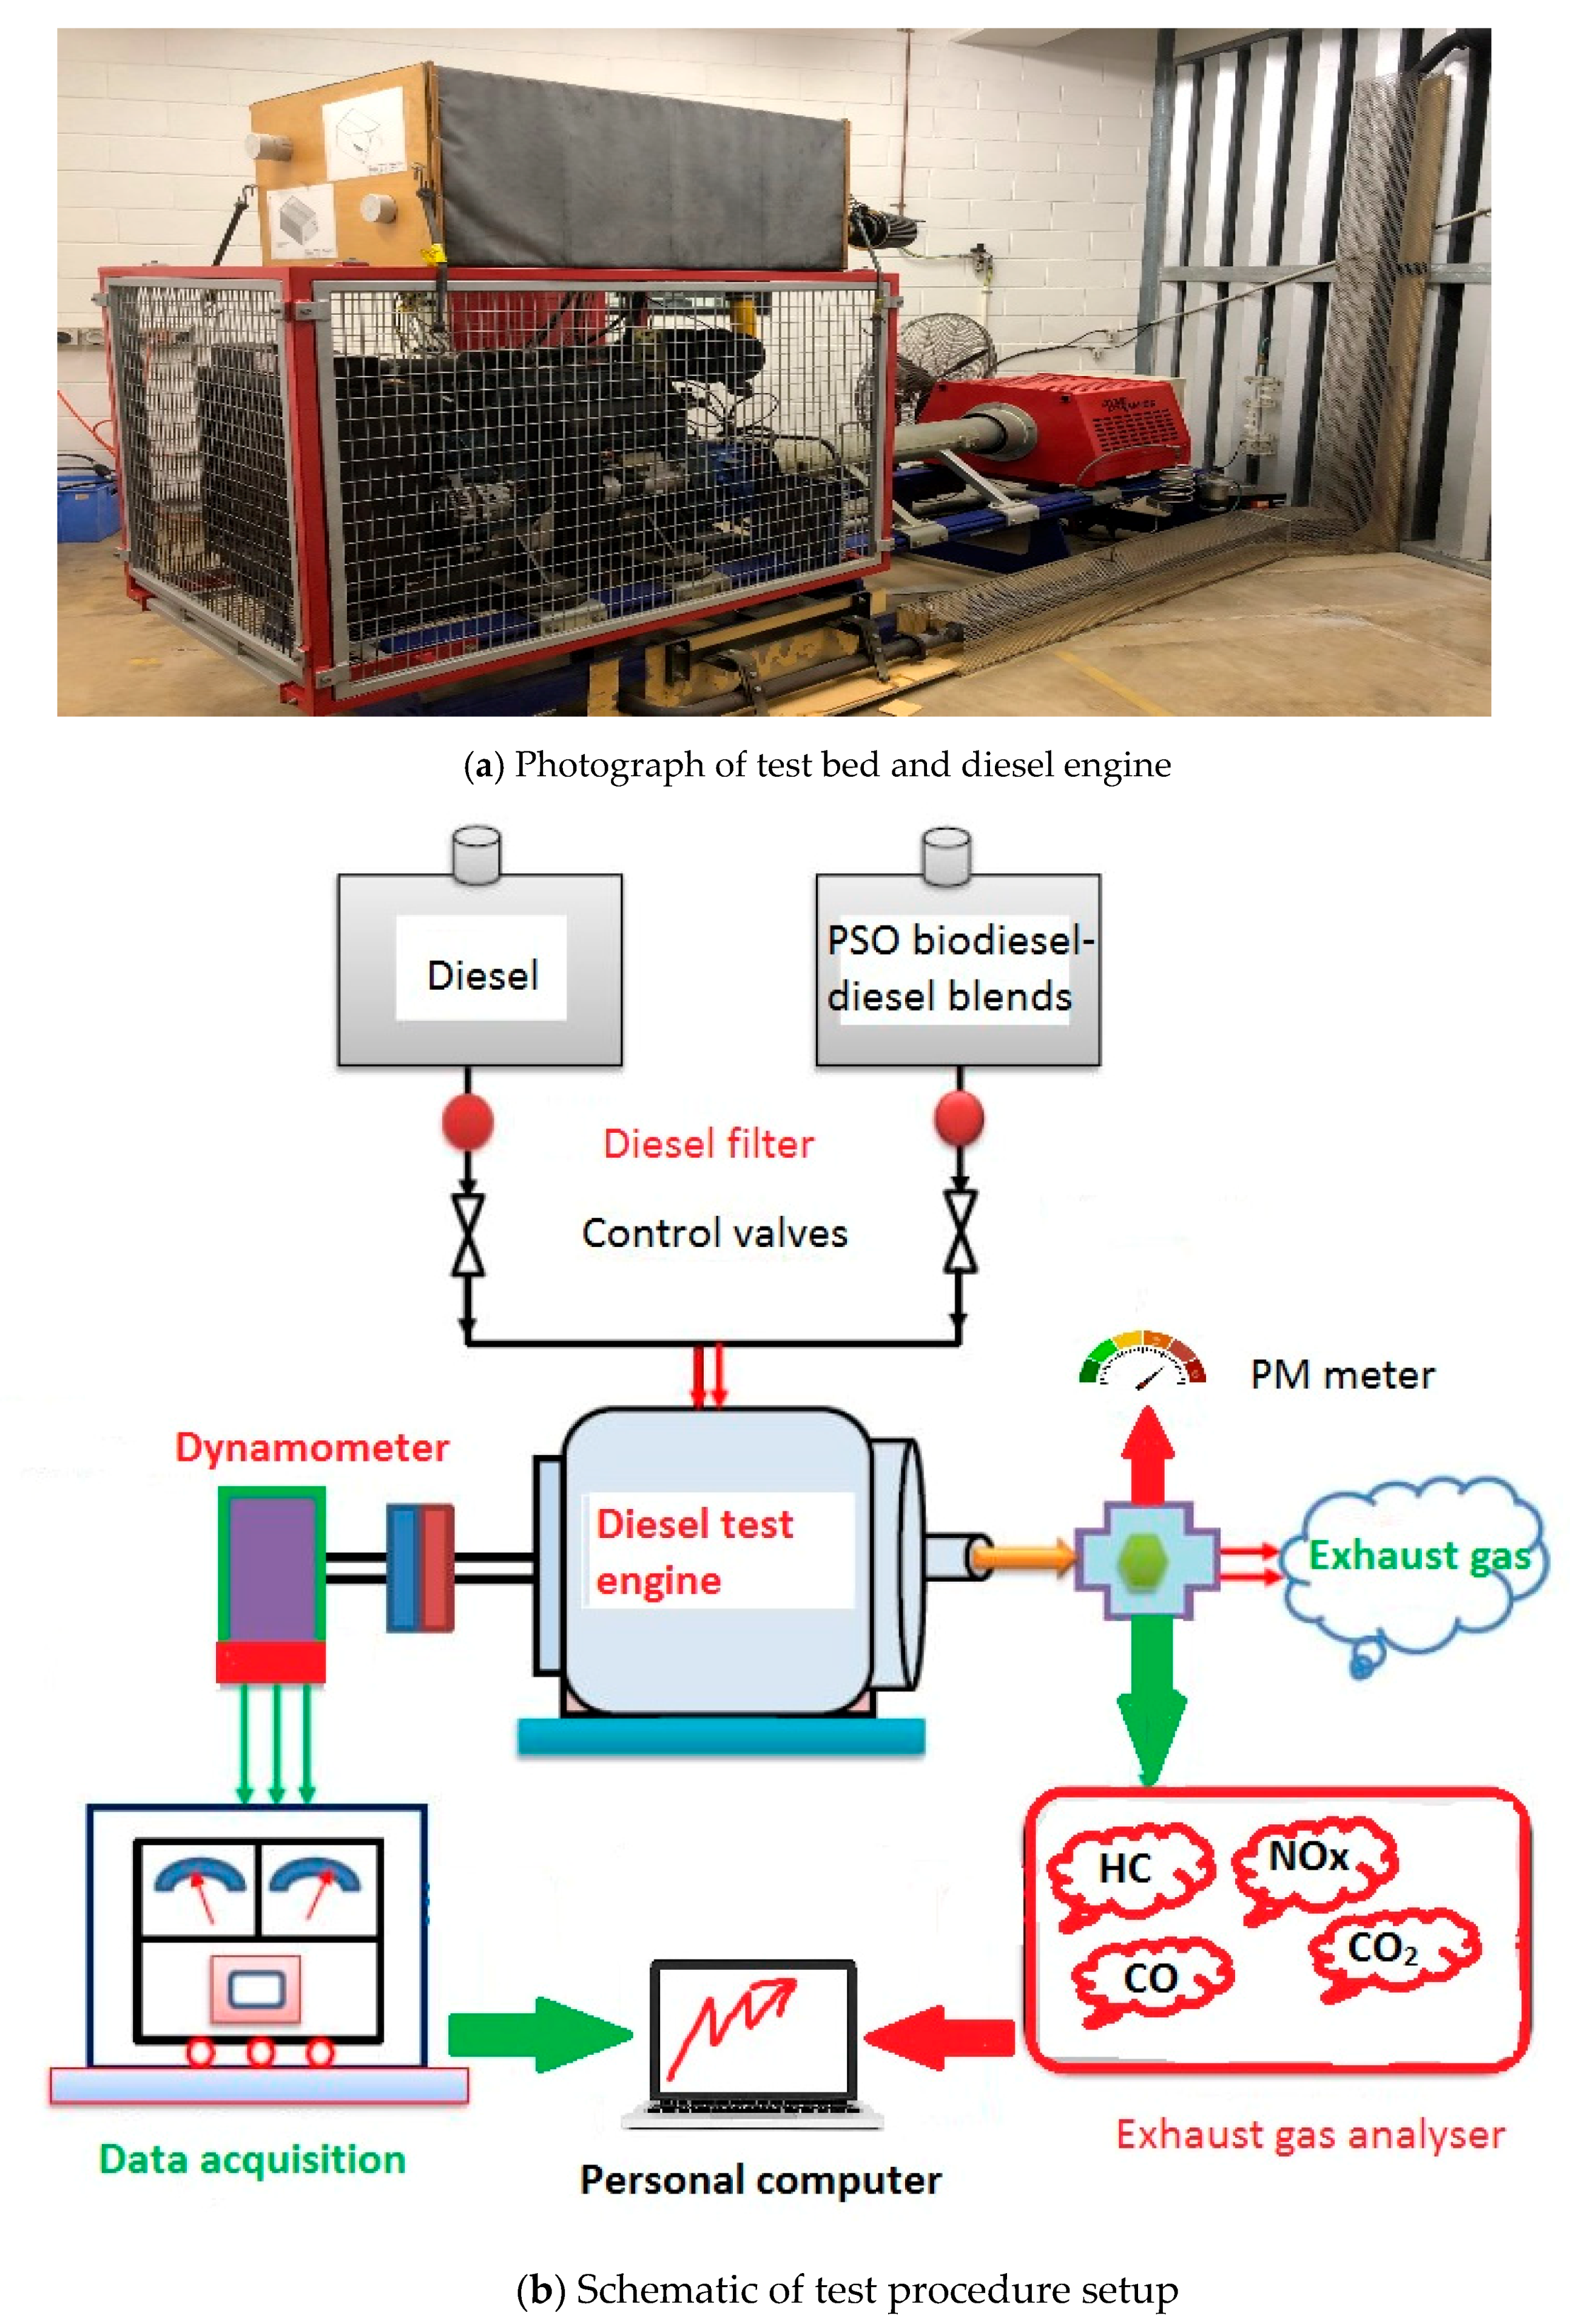
Figure 4.
PSO biodiesel-diesel blending effects on: (a) density, (b) kinematic viscosity, (c) flash point, (d) calorific value, and (e) oxidation stability.
Figure 4.
PSO biodiesel-diesel blending effects on: (a) density, (b) kinematic viscosity, (c) flash point, (d) calorific value, and (e) oxidation stability.


Figure 5.
Variation of: (a) brake power, (b) torque, (c) brake specific fuel consumption (BSFC), and (d) brake thermal efficiency (BTE) for all PSO biodiesel-diesel blends and diesel with respect to engine speed at full load condition.
Figure 5.
Variation of: (a) brake power, (b) torque, (c) brake specific fuel consumption (BSFC), and (d) brake thermal efficiency (BTE) for all PSO biodiesel-diesel blends and diesel with respect to engine speed at full load condition.


Figure 6.
Combined effects of biodiesel blends, load, and speed on BP (kW).

Figure 7.
Combined effects of biodiesel blends, load, and speed on torque (Nm).
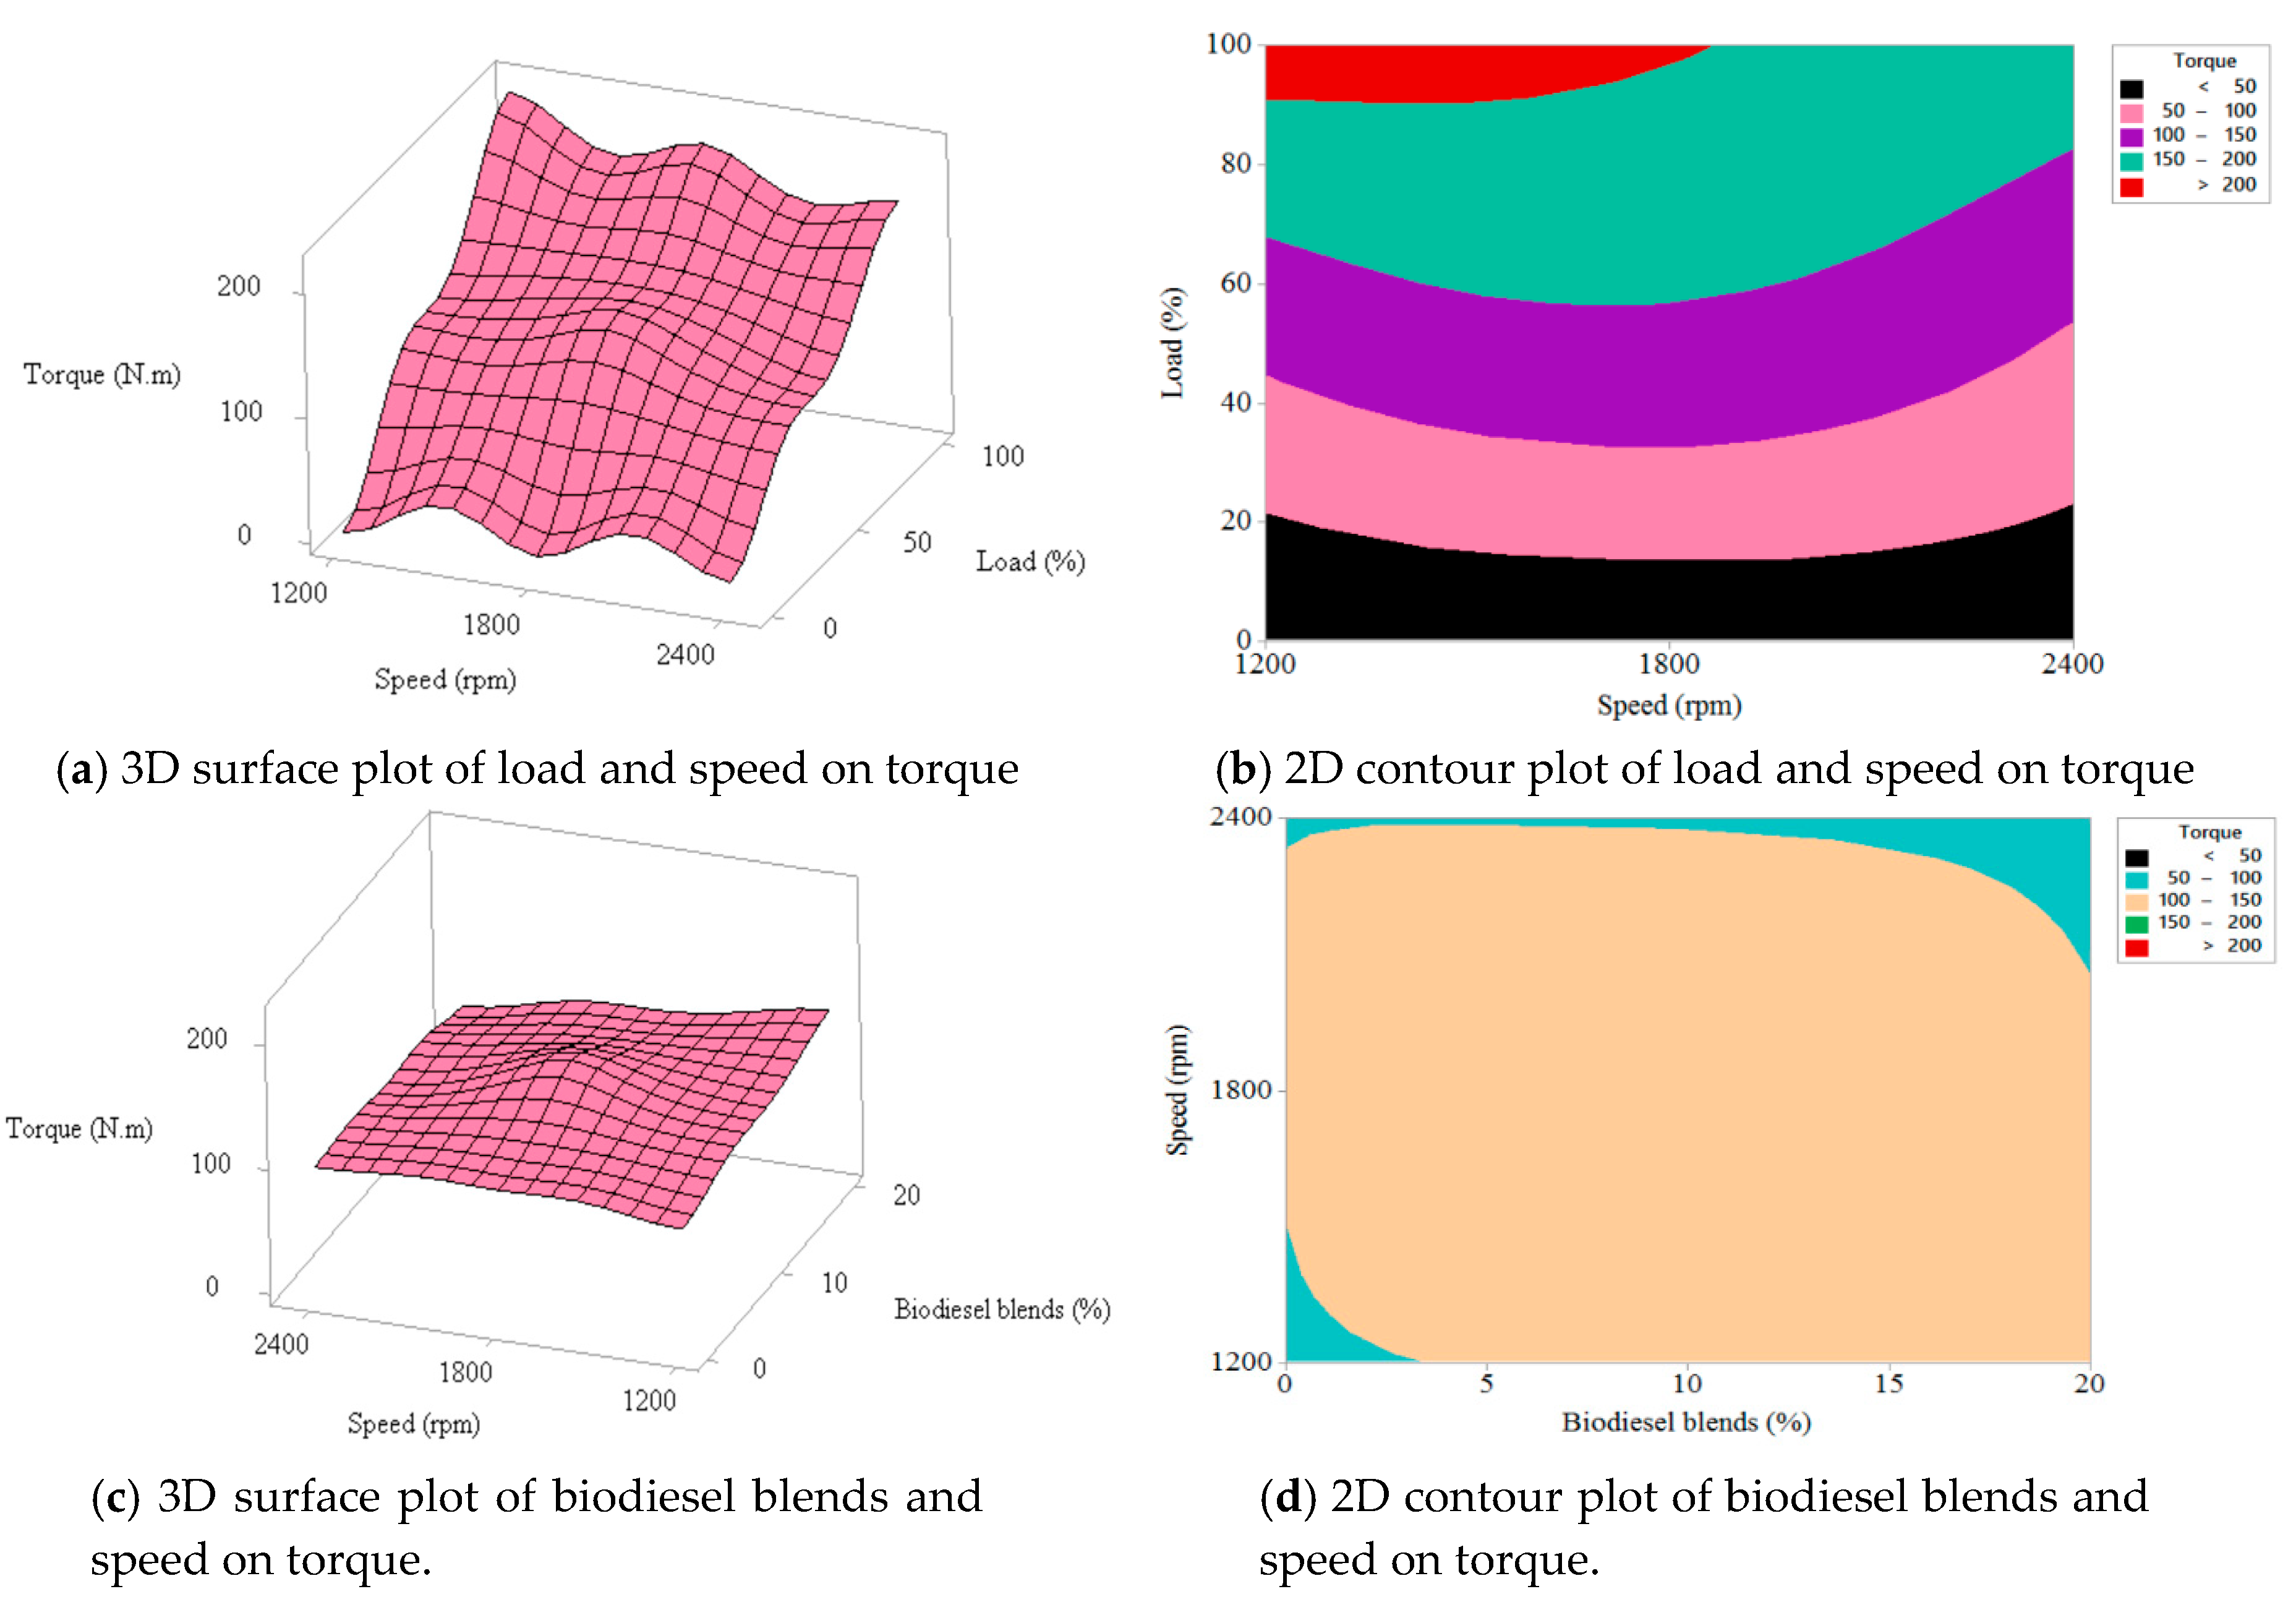
Figure 8.
Combined effects of biodiesel blends, load, and speed on BSFC (gm/kWh).

Figure 9.
Combined effects of biodiesel blends, load, and speed on BTE (%).


Table 1.
Equipment used for measuring properties of papaya seed oil (PSO) and related products in this study.
Table 1.
Equipment used for measuring properties of papaya seed oil (PSO) and related products in this study.
| Property | Equipment | Standard Applied | Accuracy |
|---|---|---|---|
| Kinematic viscosity | NVB classic (Normalab, France) | ASTM D445 | ±0.01 mm2/s |
| Density | DM40 LiquiPhysicsTM density meter (Mettler Toledo, Switzerland) | ASTM D1298 | ±0.1 kg/m3 |
| Flash point | NPM 440 Pensky-Martens flash point tester (Normalab, France) | ASTM D93 | ±0.1 °C |
| Acid value | Automation titration Rondo 20 (Mettler Toledo, Switzerland) | ASTM D664 | ±0.001 mg KOH/g |
| Calorific value | 6100EF semi-auto bomb calorimeter (Perr, USA) | ASTM D240 | ±0.001 MJ/kg |
| Oxidation stability at 110 °C | 873 Rancimat (Metrohm, Switzerland) | ASTM D2274 | ±0.01 h |
| Refractive index | RM 40 Refractometer | - | ±0.0001 |
Table 2.
Gas chromatograph (GC) operating conditions.
| Property | Details |
|---|---|
| Brand, model | Thermo Scientific Trace 1310 GC |
| Carrier gas | Helium |
| Flow rates | Air: 350 mL/min, H2: 35 mL/min, N2: 30 mL/min |
| Detector temperature | 240 °C |
| Column dimensions | 60 m × 250 µm × 0.25 µm |
| Column head pressure | 23.8 psi |
| Injector | Split injector, 40:1 ratio, split flow 48 mL/min, constant flow 1.2 mL/min, 1 µL injection volume |
| Temperature ramp 1 | 110 °C hold for 4 min |
| Temperature ramp 2 | 10 °C/min to 230 °C, hold for 3 min |
Table 3.
PSO biodiesel fatty acid composition.
| Fatty Acids | Formula | Molecular Weight | Structure | wt% |
|---|---|---|---|---|
| Palmitic | C16H32O2 | 256 | 16:0 | 6.07 |
| Stearic | C18H36O2 | 284 | 18:0 | 3.13 |
| Oleic | C18H34O2 | 282 | 18:1 | 47.73 |
| Linoleic | C18H32O2 | 280 | 18:2 | 37.25 |
| Linolenic | C18H30O2 | 278 | 18:3 | 1.78 |
| Eicosenoic | C20H38O2 | 310 | 20:1 | 0.76 |
| Behenic | C22H44O2 | 340 | 22:0 | 0.68 |
| Erucic | C22H42O2 | 338 | 22:1 | 1.51 |
| Others | 1.09 | |||
| Total Saturated Fatty Acids (SFA) | 9.88 | |||
| Total Monounsaturated Fatty Acids (MUFA) | 48.49 | |||
| Total Polyunsaturated Fatty Acids (PUFA) | 39.03 | |||
| Degree of Unsaturation (DU) | 126.55 | |||
| Long Chain Saturated Factor (LCSF) | 3.19 | |||
Table 4.
Comparison of PSO biodiesel and blends with diesel.
| Properties | Units | PSO | B100 | B20 | B10 | B5 | B0 | ASTM D6751-2 | EN14214-03 |
|---|---|---|---|---|---|---|---|---|---|
| Density | Kg/m3 | 885 | 840 | 829.76 | 828.48 | 827.84 | 827.2 | 870–890 | 860–900 |
| Viscosity at 40 °C | mm2/s | 27.3 | 3.53 | 3.29 | 3.26 | 3.25 | 3.23 | 1.9–6.0 | 3.5–5.0 |
| Acid value | mg KOH/g | 0.98 | 0.42 | 0.12 | 0.09 | 0.07 | 0.05 | max. 1 0.5 | max. 0.5 |
| Cetane number (CN) | - | - | 48.29 | 48.06 | 48.03 | 48.01 | 48.00 | min. 2 47 | min. 51 |
| Calorific value | MJ/kg | - | 38.49 | 43.94 | 44.62 | 44.96 | 45.30 | - | 35.00 |
| Flash point | (°C) | - | 112 | 77.20 | 72.85 | 70.68 | 68.50 | min. 93 | >120 |
| Iodine value (IV) | - | 79.95 | 115.89 | 53.82 | 46.06 | 42.18 | 38.30 | - | max. 120 |
| Oxidation stability (OS) | Hour | 77.97 | 5.61 | 32.32 | 35.66 | 37.33 | 39 | min. 3 | min. 6 |
1 max. = maximum; 2 min. = minimum.
Table 5.
Details of the test engine.
| Property | Apparatus, Model |
|---|---|
| Engine Model | Kubota V3300 Indirect injection |
| Type | Vertical, 4 cycle liquid cooled diesel |
| Number of cylinders | 4 |
| Total displacement (L) | 3.318 |
| Bore × Stroke (mm) | 98 × 110 |
| Combustion system | Spherical type (E-TVCS) (three vortex combustion system) |
| Intake system | Natural aspired |
| Rated power output (KW/rpm) | 53.9/2600 |
| Rated torque (Nm/rpm) | 230/1400 |
| Compression ratio | 22.6 |
| Emissions certification | Tier 2 |
Table 6.
Exhaust gas analyser, PM meter specification, and error analysis.
| Measured Gas | Measurement | ||
|---|---|---|---|
| Range | Resolution | Accuracy | |
| HC | 0–30,000 ppm (n-hexane) | 1 ppm | ±1 ppm |
| CO | 0–15% | 0.001% | ±0.02% |
| CO2 | 0–20% | 0.001% | ±0.3% |
| NOx | 0–5000 ppm | 1 ppm | ±1 ppm |
| Meter | Particle Size | Particle Concentration Range | Resolution |
| Particulate Matter | <100 nm to >10 µm | 0.1 to >700 mg/m3 | ±0.1 mg/m3 |
| Measurements | Accuracy | Relative Uncertainty (%) | Average Reading for B0 |
| BP | ±0.41 kW | 0.0105 | 39.20 |
| BSFC | ±5 g/kWh | 0.0195 | 256 |
Table 7.
Experimental range and levels coded for analysis of variance (ANOVA).
| Factors | Unit | Symbol Coded | Range and Levels | ||
|---|---|---|---|---|---|
| −1 | 0 | 1 | |||
| Biodiesel blends | % | BL | 0 | 10 | 20 |
| Load | % | LD | 0 | 50 | 100 |
| Speed | rpm | SP | 1200 | 1800 | 2400 |
Table 8.
ANOVA results of the interactive effect of biodiesel blends, load, and speed on brake power.
Table 8.
ANOVA results of the interactive effect of biodiesel blends, load, and speed on brake power.
| Source | DF | Adj. SS | Adj. MS | F-Value | p-Value | Significant |
|---|---|---|---|---|---|---|
| Model | 9 | 2821.89 | 313.54 | 402.53 | <0.0001 | Highly |
| Biodiesel blends (BL) | 1 | 0.00 | 0.00 | 0.00 | 0.957 | No |
| Load (LD) | 1 | 2576.18 | 2576.18 | 3307.29 | <0.0001 | Highly |
| Speed (SP) | 1 | 155.58 | 155.58 | 199.74 | <0.0001 | Highly |
| BL × BL | 1 | 0.93 | 0.93 | 1.19 | 0.325 | No |
| LD × LD | 1 | 0.39 | 0.39 | 0.50 | 0.512 | No |
| SP × SP | 1 | 2.36 | 2.36 | 3.02 | 0.143 | No |
| BL × LD | 1 | 0.29 | 0.29 | 0.37 | 0.571 | No |
| BL × SP | 1 | 18.97 | 18.97 | 24.35 | 0.004 | Yes |
| LD × SP | 1 | 66.99 | 66.99 | 86.01 | <0.0001 | Highly |
| Lack-of-Fit | 3 | 3.58 | 1.19 | 7.71 | 0.117 | No |
| Pure Error | 2 | 0.31 | 0.15 | - | - | - |
| Total | 14 | 2825.79 | - | - | - | - |
| R2 = 0.9986 | Adj. R2 = 0.9961 | - | ||||
Table 9.
ANOVA results of the interactive effect of biodiesel blends, load, and speed on torque.
| Source | DF | Adj. SS | Adj. MS | F-Value | p-Value | Significant |
|---|---|---|---|---|---|---|
| Model | 9 | 78,005.7 | 8667.3 | 1352.54 | <0.0001 | Highly |
| BL | 1 | 169.0 | 169.0 | 26.37 | 0.004 | Yes |
| LD | 1 | 73,549.5 | 73,549.5 | 11,477.45 | <0.0001 | Highly |
| SP | 1 | 525.5 | 525.5 | 82.01 | <0.0001 | Highly |
| BL × BL | 1 | 1017.2 | 1017.2 | 158.73 | <0.0001 | Highly |
| LD × LD | 1 | 837.8 | 837.8 | 130.73 | <0.0001 | Highly |
| SP × SP | 1 | 1213.7 | 1213.7 | 189.40 | <0.0001 | Highly |
| BL × LD | 1 | 1.1 | 1.1 | 0.18 | 0.691 | No |
| BL × SP | 1 | 521.7 | 521.7 | 81.41 | <0.0001 | Highly |
| LD × SP | 1 | 575.5 | 575.5 | 89.81 | <0.0001 | Highly |
| Lack-of-Fit | 3 | 30.4 | 10.1 | 12.13 | 0.077 | No |
| Pure Error | 2 | 1.7 | 0.8 | - | - | - |
| Total | 14 | 78,037.7 | - | - | - | - |
| R2 = 0.9996 | Adj. R2 = 0.9989 | |||||
Table 10.
ANOVA results of the interactive effect of biodiesel blends, load and speed on brake specific fuel consumption (BSFC).
Table 10.
ANOVA results of the interactive effect of biodiesel blends, load and speed on brake specific fuel consumption (BSFC).
| Source | DF | Adj. SS | Adj. MS | F-Value | p-Value | Significant |
|---|---|---|---|---|---|---|
| Model | 9 | 3,358,105 | 373,123 | 3440.61 | <0.0001 | Highly |
| BL | 1 | 152,631 | 152,631 | 1407.43 | <0.0001 | Highly |
| LD | 1 | 2,215,481 | 2,215,481 | 20,429.23 | <0.0001 | Highly |
| SP | 1 | 7408 | 7408 | 68.31 | <0.0001 | Highly |
| BL × BL | 1 | 14,424 | 14,424 | 133.00 | <0.0001 | Highly |
| LD × LD | 1 | 882,480 | 882,480 | 8137.45 | <0.0001 | Highly |
| SP × SP | 1 | 18,960 | 18,960 | 174.83 | <0.0001 | Highly |
| BL × LD | 1 | 63,215 | 63,215 | 582.91 | <0.0001 | Highly |
| BL × SP | 1 | 5944 | 5944 | 54.81 | 0.001 | Highly |
| LD × SP | 1 | 24,756 | 24,756 | 228.28 | <0.0001 | Highly |
| Lack-of-Fit | 3 | 521 | 174 | 16.38 | 0.058 | No |
| Pure Error | 2 | 21 | 11 | - | - | - |
| Total | 14 | 3,358,647 | - | - | - | - |
| R2 = 0.9998 | Adj. R2 = 0.9995 | |||||
Table 11.
ANOVA results of the interactive effect of biodiesel blends, load, and speed on brake thermal efficiency (BTE).
Table 11.
ANOVA results of the interactive effect of biodiesel blends, load, and speed on brake thermal efficiency (BTE).
| Source | DF | Adj. SS | Adj. MS | F-Value | p-Value | Significant |
|---|---|---|---|---|---|---|
| Model | 9 | 1717.12 | 190.79 | 162.44 | <0.0001 | Highly |
| BL | 1 | 14.80 | 14.80 | 12.60 | 0.016 | Yes |
| LD | 1 | 1104.97 | 1104.97 | 940.76 | <0.0001 | Highly |
| SP | 1 | 23.39 | 23.39 | 19.92 | 0.007 | Yes |
| BL × BL | 1 | 28.85 | 28.85 | 24.57 | 0.004 | Yes |
| LD × LD | 1 | 536.17 | 536.17 | 456.49 | <0.0001 | Highly |
| SP × SP | 1 | 13.34 | 13.34 | 11.35 | 0.020 | Yes |
| BL × LD | 1 | 4.31 | 4.31 | 3.67 | 0.114 | Not |
| BL × SP | 1 | 0.29 | 0.29 | 0.24 | 0.642 | No |
| LD × SP | 1 | 17.60 | 17.60 | 14.98 | 0.012 | Yes |
| Lack-of-Fit | 3 | 5.48 | 1.83 | 9.26 | 0.099 | No |
| Pure Error | 2 | 0.39 | 0.20 | - | - | - |
| Total | 14 | 1722.99 | - | - | - | - |
| R2 = 0.9966 | Adj. R2 = 0.9905 | |||||
© 2018 by the authors. Licensee MDPI, Basel, Switzerland. This article is an open access article distributed under the terms and conditions of the Creative Commons Attribution (CC BY) license (http://creativecommons.org/licenses/by/4.0/).
Share and Cite
MDPI and ACS Style
Anwar, M.; Rasul, M.G.; Ashwath, N. A Systematic Multivariate Analysis of Carica papaya Biodiesel Blends and Their Interactive Effect on Performance. Energies 2018, 11, 2931. https://doi.org/10.3390/en11112931
AMA Style
Anwar M, Rasul MG, Ashwath N. A Systematic Multivariate Analysis of Carica papaya Biodiesel Blends and Their Interactive Effect on Performance. Energies. 2018; 11(11):2931. https://doi.org/10.3390/en11112931
Chicago/Turabian StyleAnwar, Mohammad, Mohammad G. Rasul, and Nanjappa Ashwath. 2018. "A Systematic Multivariate Analysis of Carica papaya Biodiesel Blends and Their Interactive Effect on Performance" Energies 11, no. 11: 2931. https://doi.org/10.3390/en11112931
Note that from the first issue of 2016, this journal uses article numbers instead of page numbers. See further details here.