Article

Effects of Coal Deformation on Different-Phase CO2 Permeability in Sub-Bituminous Coal: An Experimental Investigation

1
College of Mining Engineering, Key Laboratory of In-Situ Property-Improving Mining of Ministry of Education, Taiyuan University of Technology, Taiyuan 030024, China
2
Deep Earth Energy Laboratory, Department of Civil Engineering, Monash University, Building 60, Melbourne, VIC 3800, Australia
*
Authors to whom correspondence should be addressed.
Energies 2018, 11(11), 2926; https://doi.org/10.3390/en11112926
Submission received: 7 September 2018 / Revised: 15 October 2018 / Accepted: 23 October 2018 / Published: 26 October 2018

Abstract

:
Coal deformation is one of the leading problems for carbon dioxide (CO2) sequestration in coal seams especially with respect to different-phase CO2 injection. In this paper, a series of core flooding tests were conducted under different confining stresses (8–20 MPa), injection pressures (1–15 MPa), and downstream pressures (0.1–10 MPa) at 50 °C temperature to investigate the effects of coal deformation induced by adsorption and effective stress on sub-critical, super-critical, and mixed-phase CO2 permeability. Due to the linear relationship between the mean flow rate and the pressure gradient, Darcy Law was applied on different-phase CO2 flow. Experimental results indicate that: (1) Under the same effective stress, sub-critical CO2 permeability > mixed-phase CO2 permeability > super-critical CO2 permeability. (2) For sub-critical CO2 flow, the initial volumetric strain is mainly attributed to adsorption-induced swelling. A temporary drop in permeability was observed. (3) For super-critical CO2 flow, when the injection pressure is over 10 MPa, effective-stress-generated deformation is dominant over the adsorption-induced strain and mainly contributes to the volumetric strain change. Thus, there is a linear increase of the volumetric strain with mean pore pressure and super-critical CO2 permeability increased with volumetric strain. (4) For mixed-phase CO2 flow, coupling effects of adsorption-induced swelling and effective stress on the volumetric strain were observed but effective stress made more of a contribution. CO2 permeability consistently increased with the volumetric strain. This paper reveals the swelling mechanism of different-phase CO2 injections and its effect on coal permeability.

1. Introduction

Since carbon dioxide (CO2) is one of the leading greenhouse gases, many researchers are trying to find the appropriate methods to capture and store anthropogenic CO2 emissions [1,2]. CO2 sequestration in deep un-minable coal seams is currently identified as one of the promising solutions to reduce CO2 emissions due to its potential large-scale storage capacity [3,4]. According to Gale’s estimation [5], it will take less than $110 per ton of CO2 sequestration in coal seams if overall 148 Gt of CO2 could be stored in worldwide coal basins. Meanwhile, since coal has a higher affinity to absorb CO2 than CH4, CO2 injection into the coal seam can enhance coalbed methane (CBM) production, which will partly offset the cost of CO2 sequestration [6,7].
Coal can be treated as a highly-complex dual porosity system, which consists of cleats (face cleats and butt cleats) and pores (marco-pores, meso-pores, and mirco-pores) [8,9]. Generally, the permeability of the coal matrix is very low due to the narrow flow path while cleats network will effectively improve the overall permeability. The distributions and connectivity of these structures will affect the transport paths of gas greatly. Large block samples contain more natural cleats and fractures, which can reflect the effect of cleats and fractures on the permeability. A literature investigation was conducted to study the effect of natural coal sample size on permeability (Table 1). It can be seen that the permeabilities of large coal samples are clearly larger than those of small samples by several orders of magnitude due to the contribution of more cleats and fractures in large coal samples. Thus, a 100 × 100 × 200 mm fractured coal sample was prepared to investigate different-phase CO2 permeability in this study.
For a deep un-mineable coal seam, CO2 tends to exist in sub-critical, super-critical, and mixed-phase states (without a liquid state) based on the pore pressure since in-situ temperature is normally above the supercritical temperature of CO2 (31.1 °C). According to existing research, CO2 will pass through significant variations in fluid properties (e.g., viscosity and density) for relatively minor fluctuations in the pressure-temperature (P-T) conditions near the critical point [20]. These variations in hydro-dynamic properties will have a dominant effect on CO2 flow behavior, which is vital for estimating CO2 sequestration in a coalbed. Darcy Law can be applied on sub-critical and super-critical CO2 flow and super-critical CO2 permeability is significantly lower than sub-critical CO2 in low and high rank coal [21,22]. However, mixed-phase CO2 flow behavior is rarely investigated and also needs to be discussed whether mixed-phase CO2 transport in coal is Darcy’s flow. In addition, CO2 adsorption causes coal matrix swelling and, under in-situ conditions, the swelling tends to narrow the flow path, which results in the reduction of the permeability. As super-critical CO2 has greater attraction to the coal matrix surface compared to sub-critical CO2 [23], super-critical CO2 adsorption creates a greater swelling effect than sub-critical CO2 [24,25]. The swelling becomes more complex when it comes to a mixed-phased CO2. To date, the effect of mixed-CO2 adsorption-induced swelling on permeability is still poorly understood. Except for adsorption-induced swelling, CO2 injection also causes the reduction of effective stress under in situ conditions. Cleat aperture is sensitive to effective stress. Cleats tend to close under external compressive force and open with progressive pore pressure, which results in the corresponding permeability variation with effective stress [26,27]. Therefore, under a constant confinement pressure, the permeability may increase by raising the injection pressure due to the reduction of the effective stress [28,29] or decrease due to coal matrix swelling induced by gas adsorption [30,31]. As sub-critical, super-critical, and mixed-phase CO2 injection causes different variations in adsorption-induced swelling and effective stress, it is essential to investigate the coupling effects of different-phase CO2 injection on coal permeability.
Therefore, an adsorption experiment was first conducted to investigate the strain induced by different-phase CO2 adsorption (adsorption-induced strain, ε a d s ). Subsequently, a series of CO2 permeability tests are carried out with drain methods to characterize different-phase CO2 flow behavior and distinguish the coupling effects of adsorption-induced strain and effective stress on permeability.

2. Experimental Method

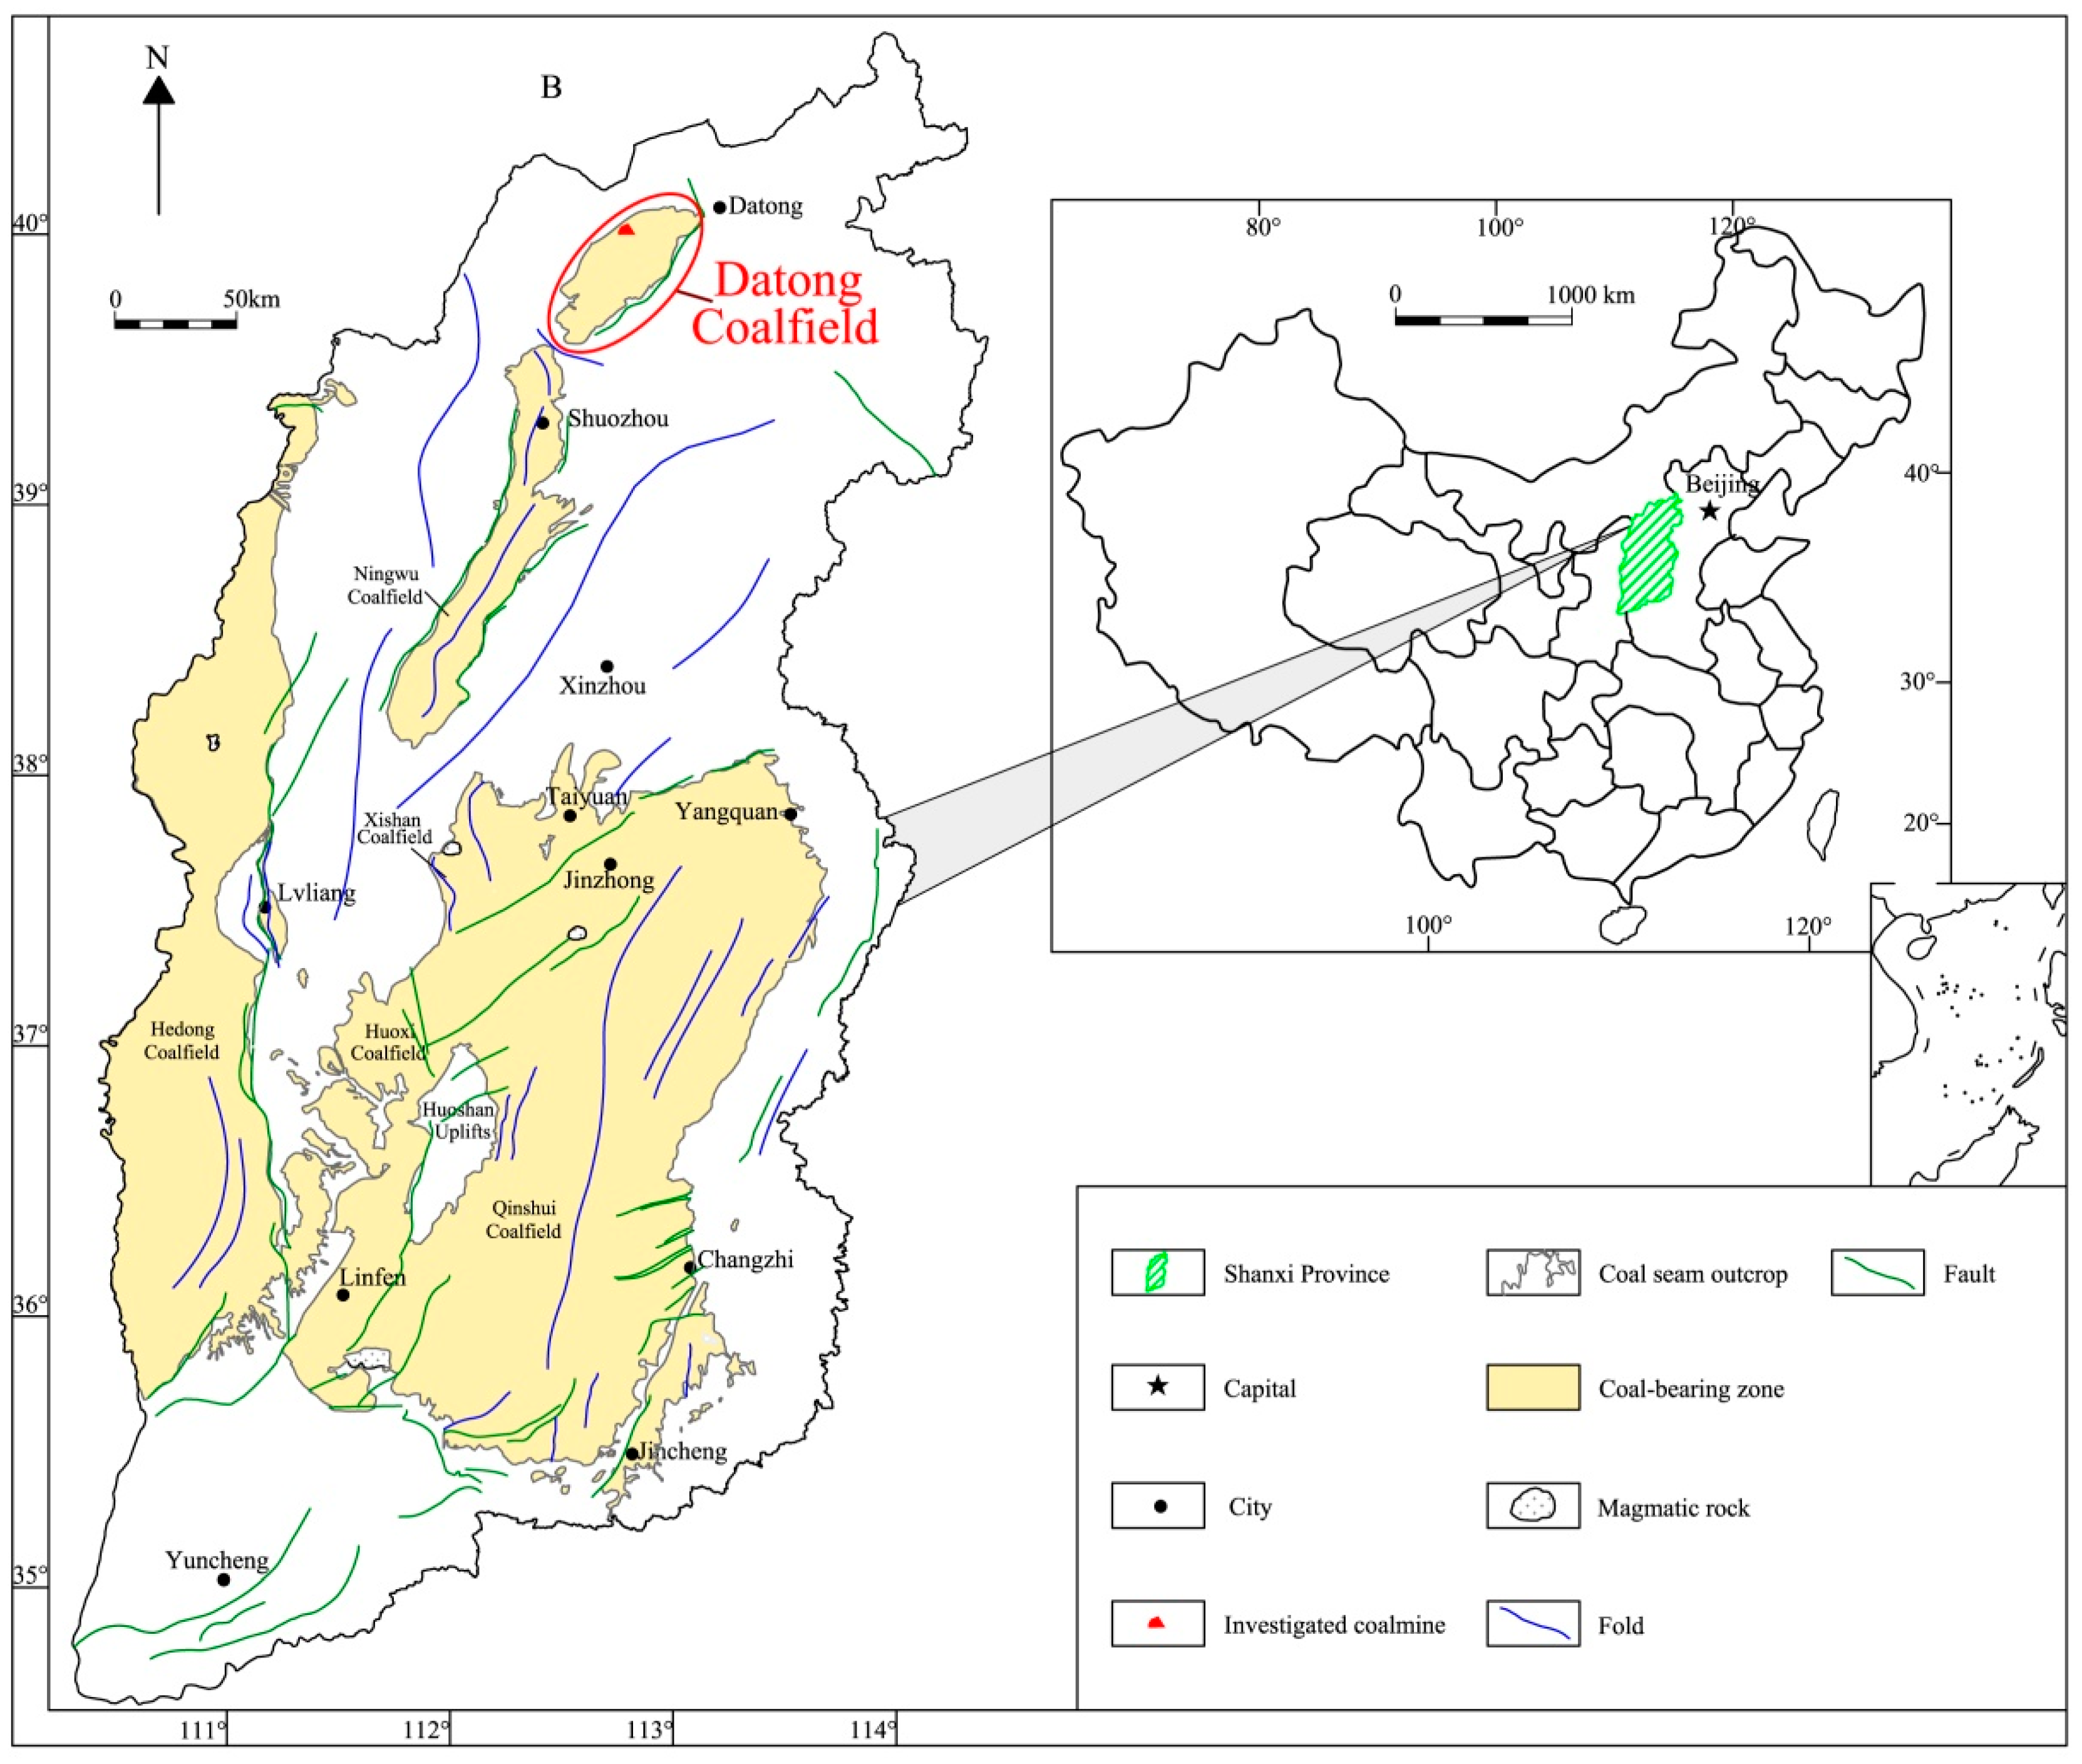
2.1. Geological Setting

The Datong coalfield located in northern Shanxi Province, China preserves about 3143 m thick successions of sedimentary rock and covers over an area of 1827 km2 from 39°52′ to 40°10′ north latitude and 112°49′32″ to 113°9′30″ west longitude. There are two coal-bearing strata in this coalfield: upper Jurassic coal-bearing strata with an area of 772 km2 and 60.8 Gt of coal resource and lower Carboniferous and Permian coal-bearing strata with an area of 1739 km2 and 369.1 Gt of the coal resource.
The obtained block of coal belongs to the Datong Formation (Middle Jurassic), which has a thickness of 65.13 to 262.75 m (with an average thickness of 211.95 m) consisting of gray medium to coarse sandstone, gray fine sandstone, dark gray siltstone, sandy mudstone, mudstone, carbonaceous mudstone, and coal (with an average thickness of 19.26 m). The geological map of Datong coalfield, which is highlighted by the sampling area in red, is shown in Figure 1.

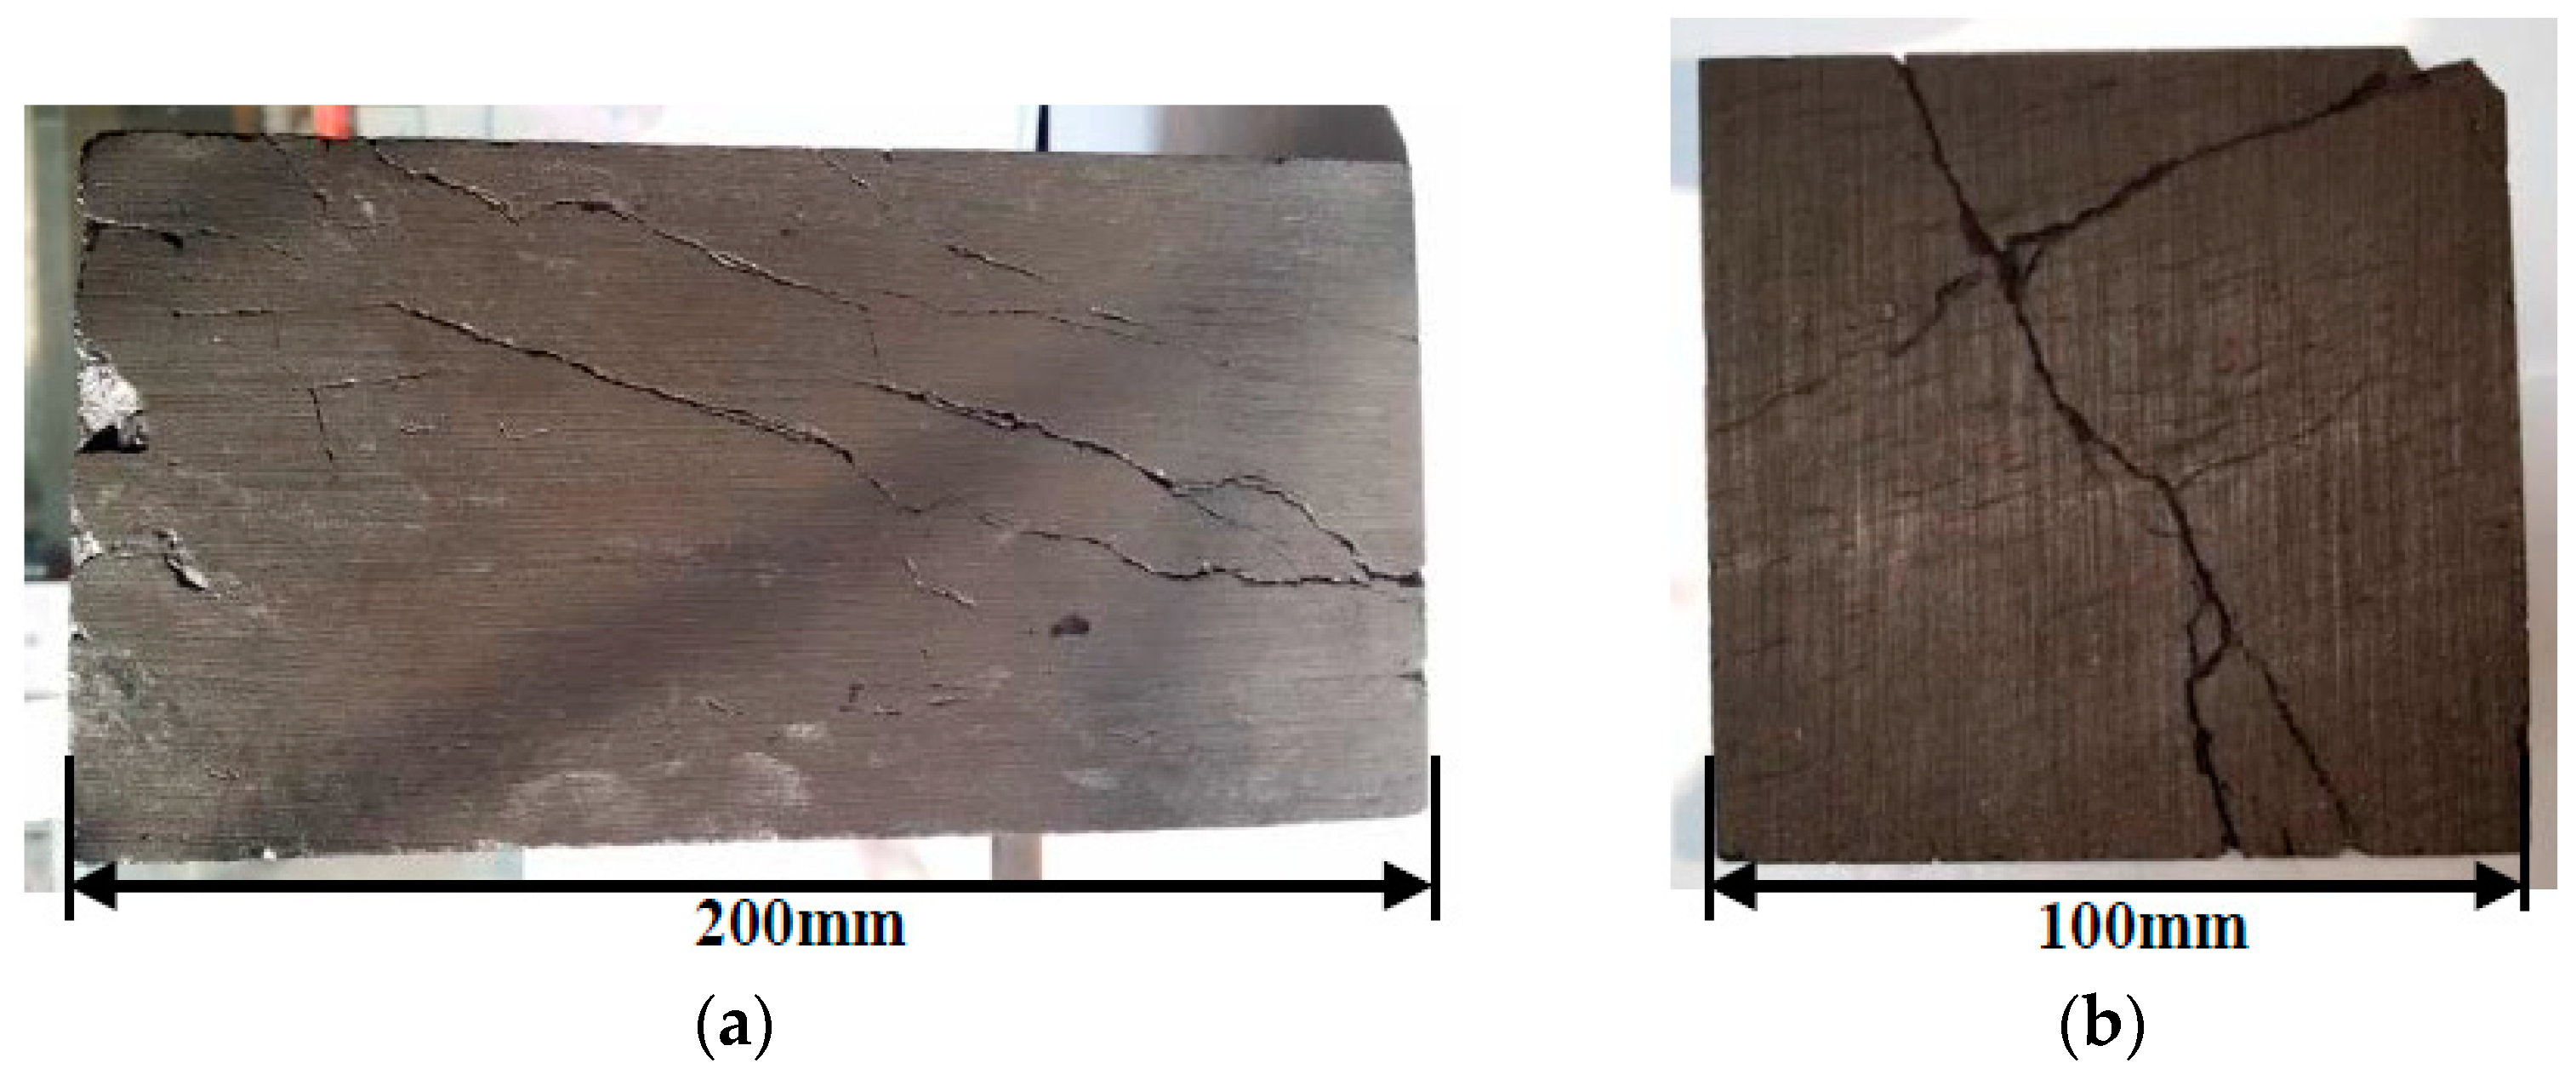
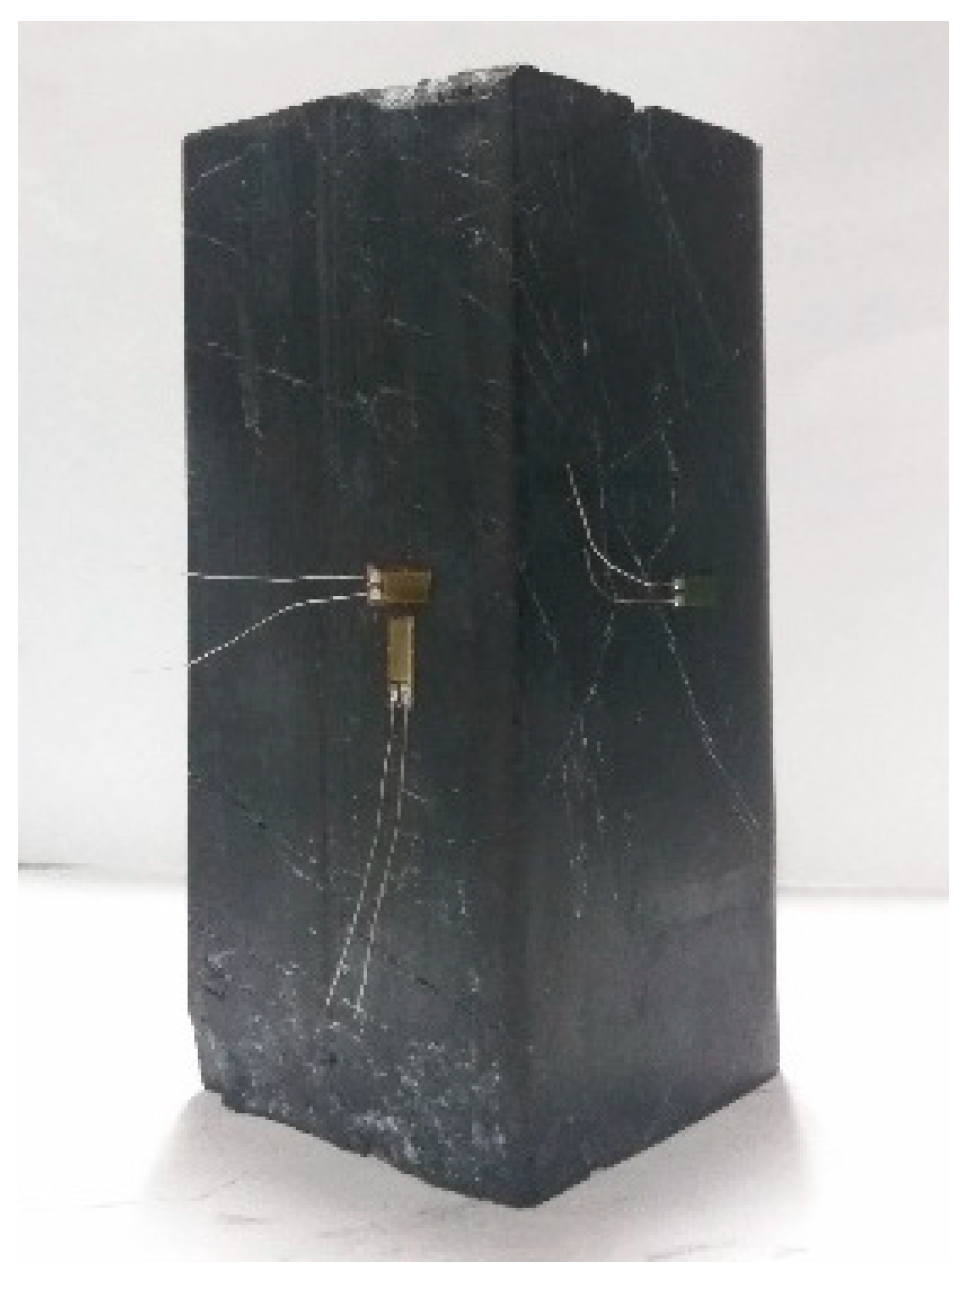
2.2. Sample Description

The large coal blocks were obtained from coal seam No. XII in the Datong coalfield to investigate sub-critical and super-critical CO2 permeability and CO2 adsorption-induced swelling in sub-bituminous coal. The tested samples were collected from the coal work face in the depth of 400 m and were sent to the Key Laboratory of in situ Property-improving Mining of Ministry of Education immediately.
For the CO2 permeability test, a large coal block was cut to around 205–210 mm in height and 105–110 mm in length and width using a diamond cutter. The cutter was maintained at very slow rates to avoid any damage to the sample structure. After cutting, a rock grinding machine was used to smooth all the sample surfaces and make sure that the sample size is approximately 100 × 100 × 200 mm (Figure 2). The height direction (200 mm) of the sample is parallel to the bedding plane.
For the CO2 sorption experiment, a 50 × 50 × 100 mm coal sample was processed with the same method. It can be seen that there are some cleats and small fractures on the surface of 50 × 50 × 100 mm coal sample (Figure 3) and the natural fracture networks (two fractures along the height and two connected cleats on the top surface) can be clearly observed on the surface of 100 × 100 × 200 mm coal sample (Figure 2).
To avoid the effect of moisture on the experimental results, both the 100 × 100 × 200 mm coal sample and the 50 × 50 × 100 mm coal sample were dried in a heated vacuum oven at 105 °C for 48 h before the permeability and adsorption experiments. The mean maximum vitrinite reflectance (Ro,max), the maceral composition, and the proximate analysis of the raw coal were measured, according to the standards of GB/T 6948-2008, GB/T 8899-2013, and GB/T 212-2008 standard, respectively (Table 2). Based on the results, the coal rank of the sample belongs to the sub-bituminous coal.

2.3. Experimental Apparatus

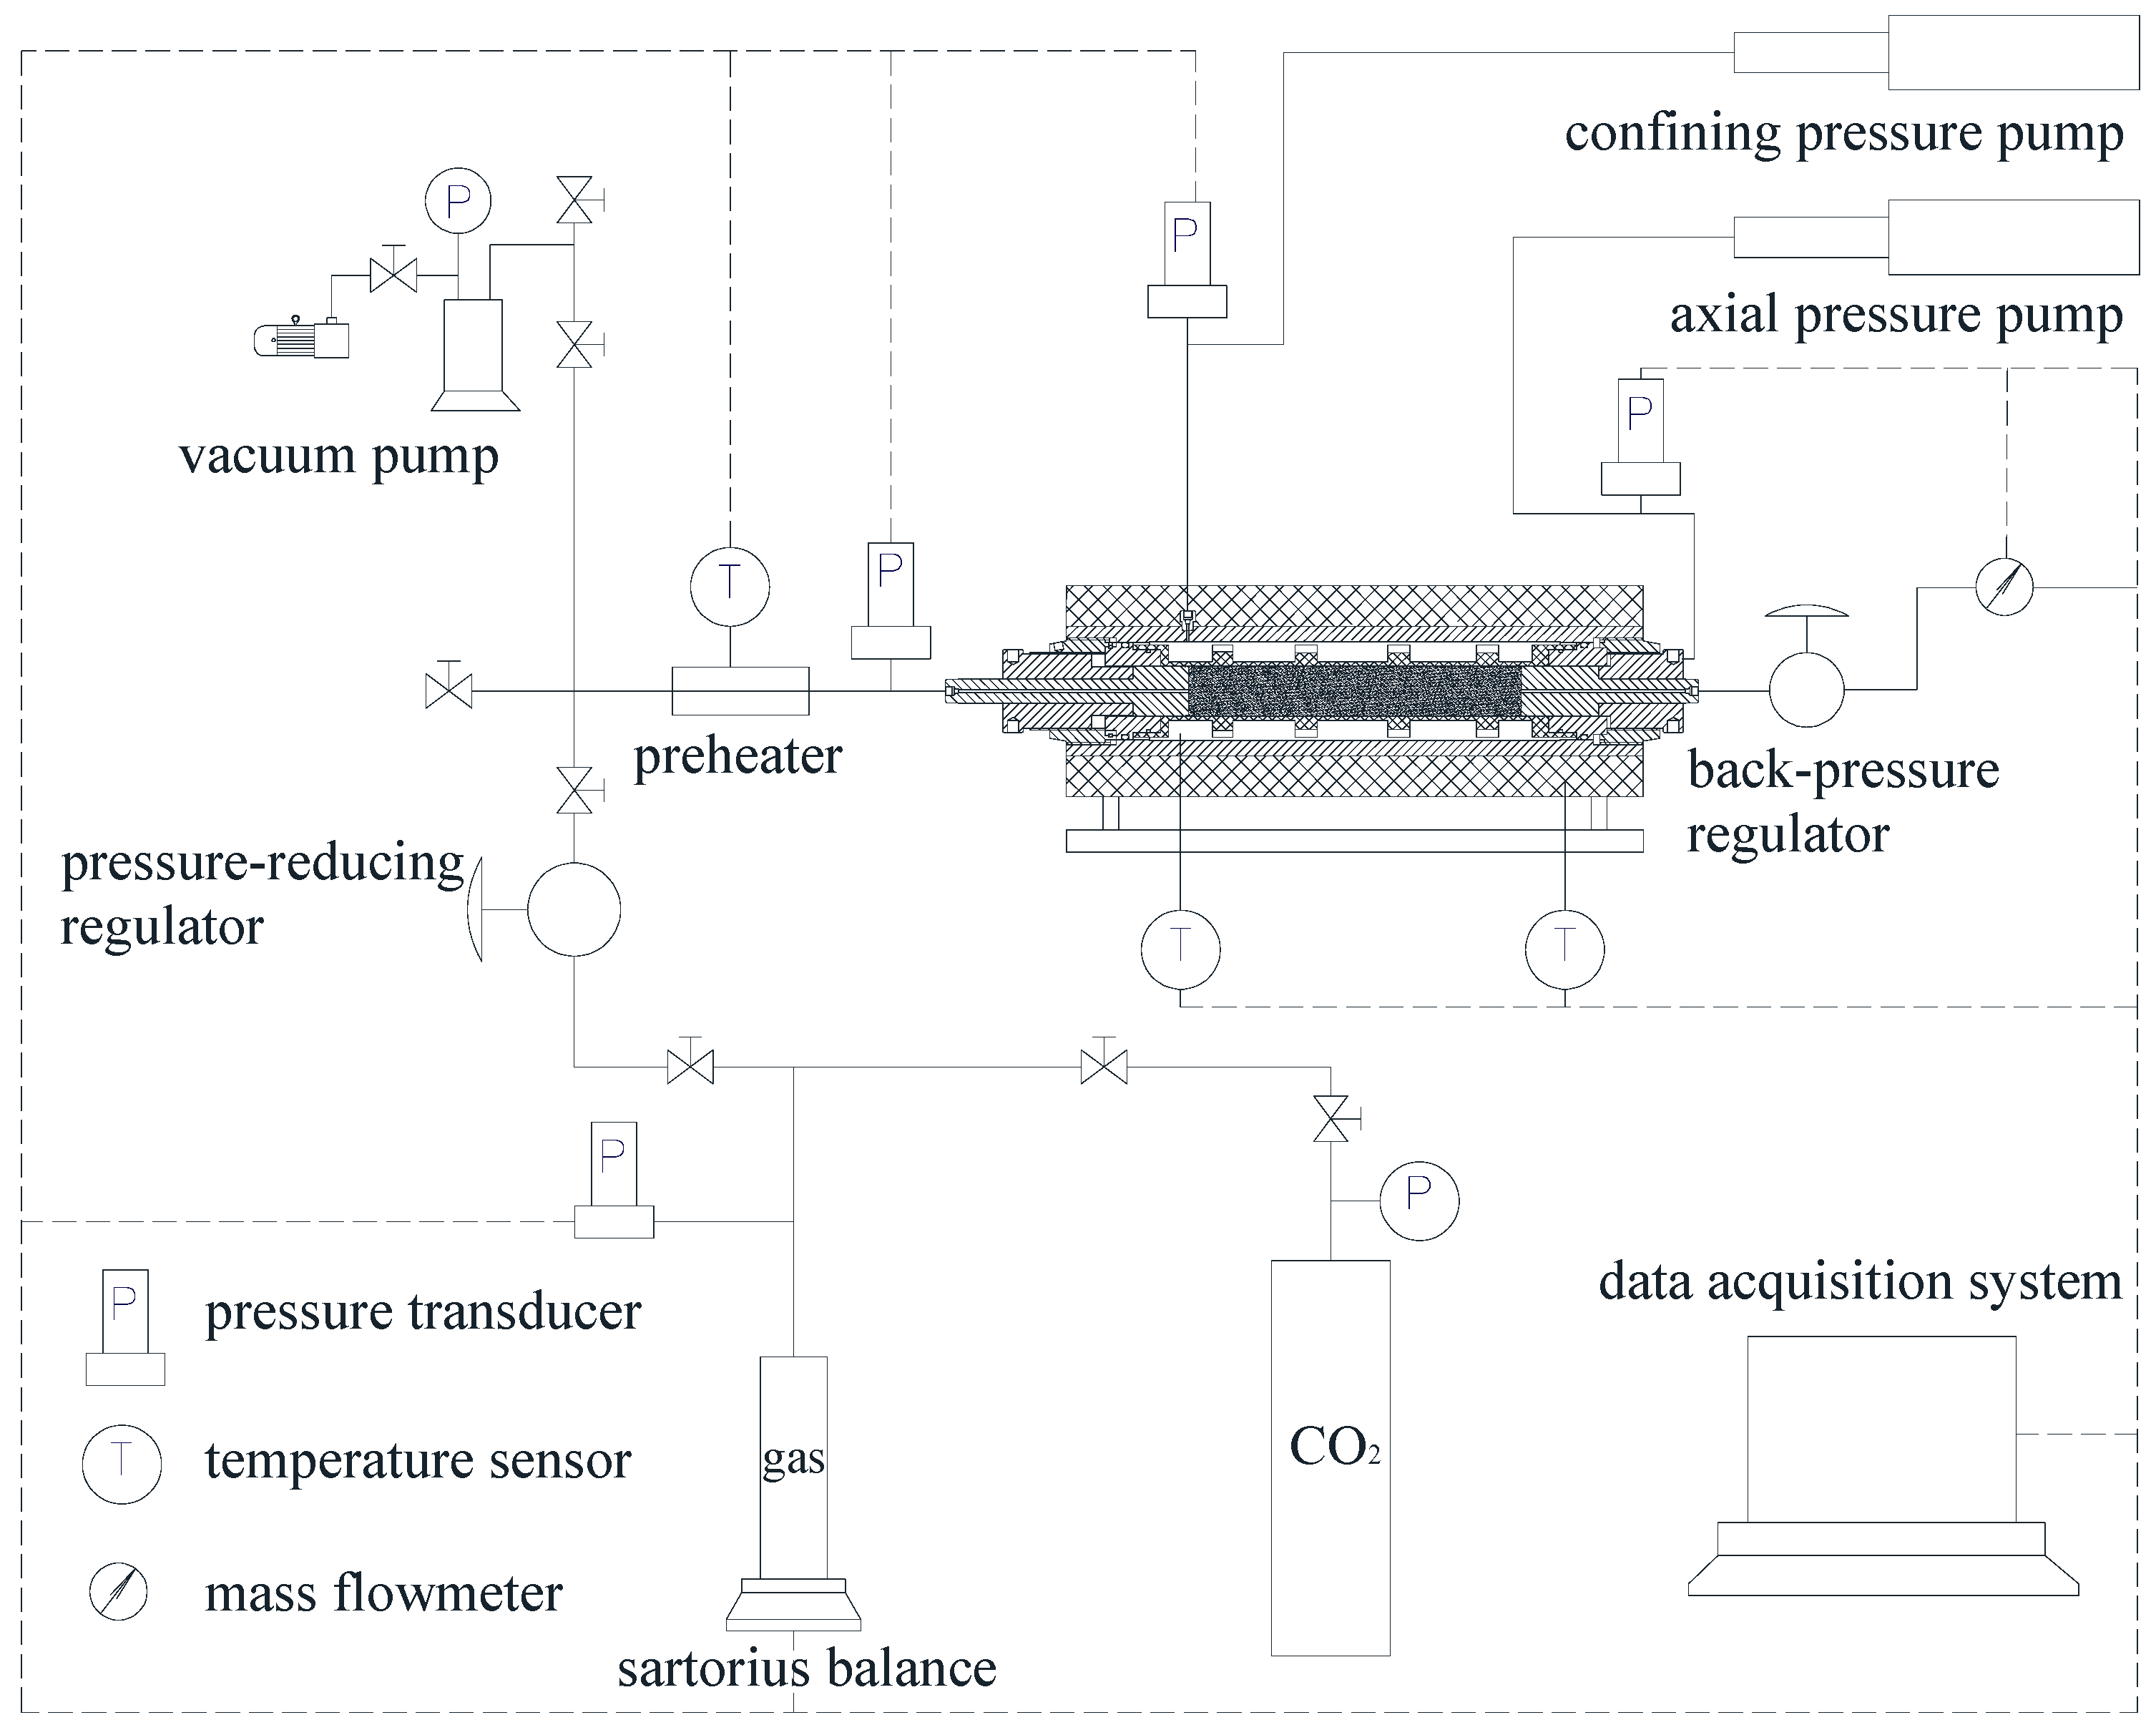
2.3.1. Permeability Testing Apparatus

The newly developed Different-phase CO2 Permeability Testing apparatus was used for the CO2 permeability experiments (Figure 4). The 100 × 100 × 200 mm cuboid sample is placed between two cubic stainless steel loading platens in the triaxial sample holder. Two porous disks are sandwiched between the sample and the left/right platen to ensure the uniform distribution of the injection gas into the sample. The loading platens and sample are wrapped in a rubber jacket to isolate them from the confining fluid. The CO2 injection line is connected to the left platen and the outlet line is connected to the right platen. The triaxial sample holder has been designed to withstand up to 50 MPa of axial stress, 50 MPa of confining stress, and 70 °C temperature. The axial stress and confining stress are applied independently by two syringe pumps with a precision of 0.01 MPa. A heating blanket with a maximum temperature of 70 °C is around the triaxial sample holder and the upstream injection tubing is wrapped with a heating tape to confirm the temperature of injection gas, which is equal to the temperature of the tested sample. A CO2 compressed liquefied gas bottle (up to 70 MPa) is utilized to inject high-pressure CO2 and an ALG-60 type air-driven gas booster (maximum pressure 50 MPa) will provide the liquefied CO2. The injection pressure is controlled by a pressure regulator and the downstream pressure is maintained by a back pressure regulator. Both the upstream pressure and downstream pressure are measured by two pressure transducers. The gas flow rate is monitored by a milli gas counter. All the data including the temperature, pump volume variation, flow rate, and pressure transducers are recorded by using the integrated software. A schematic diagram of the permeability apparatus is shown in Figure 4.

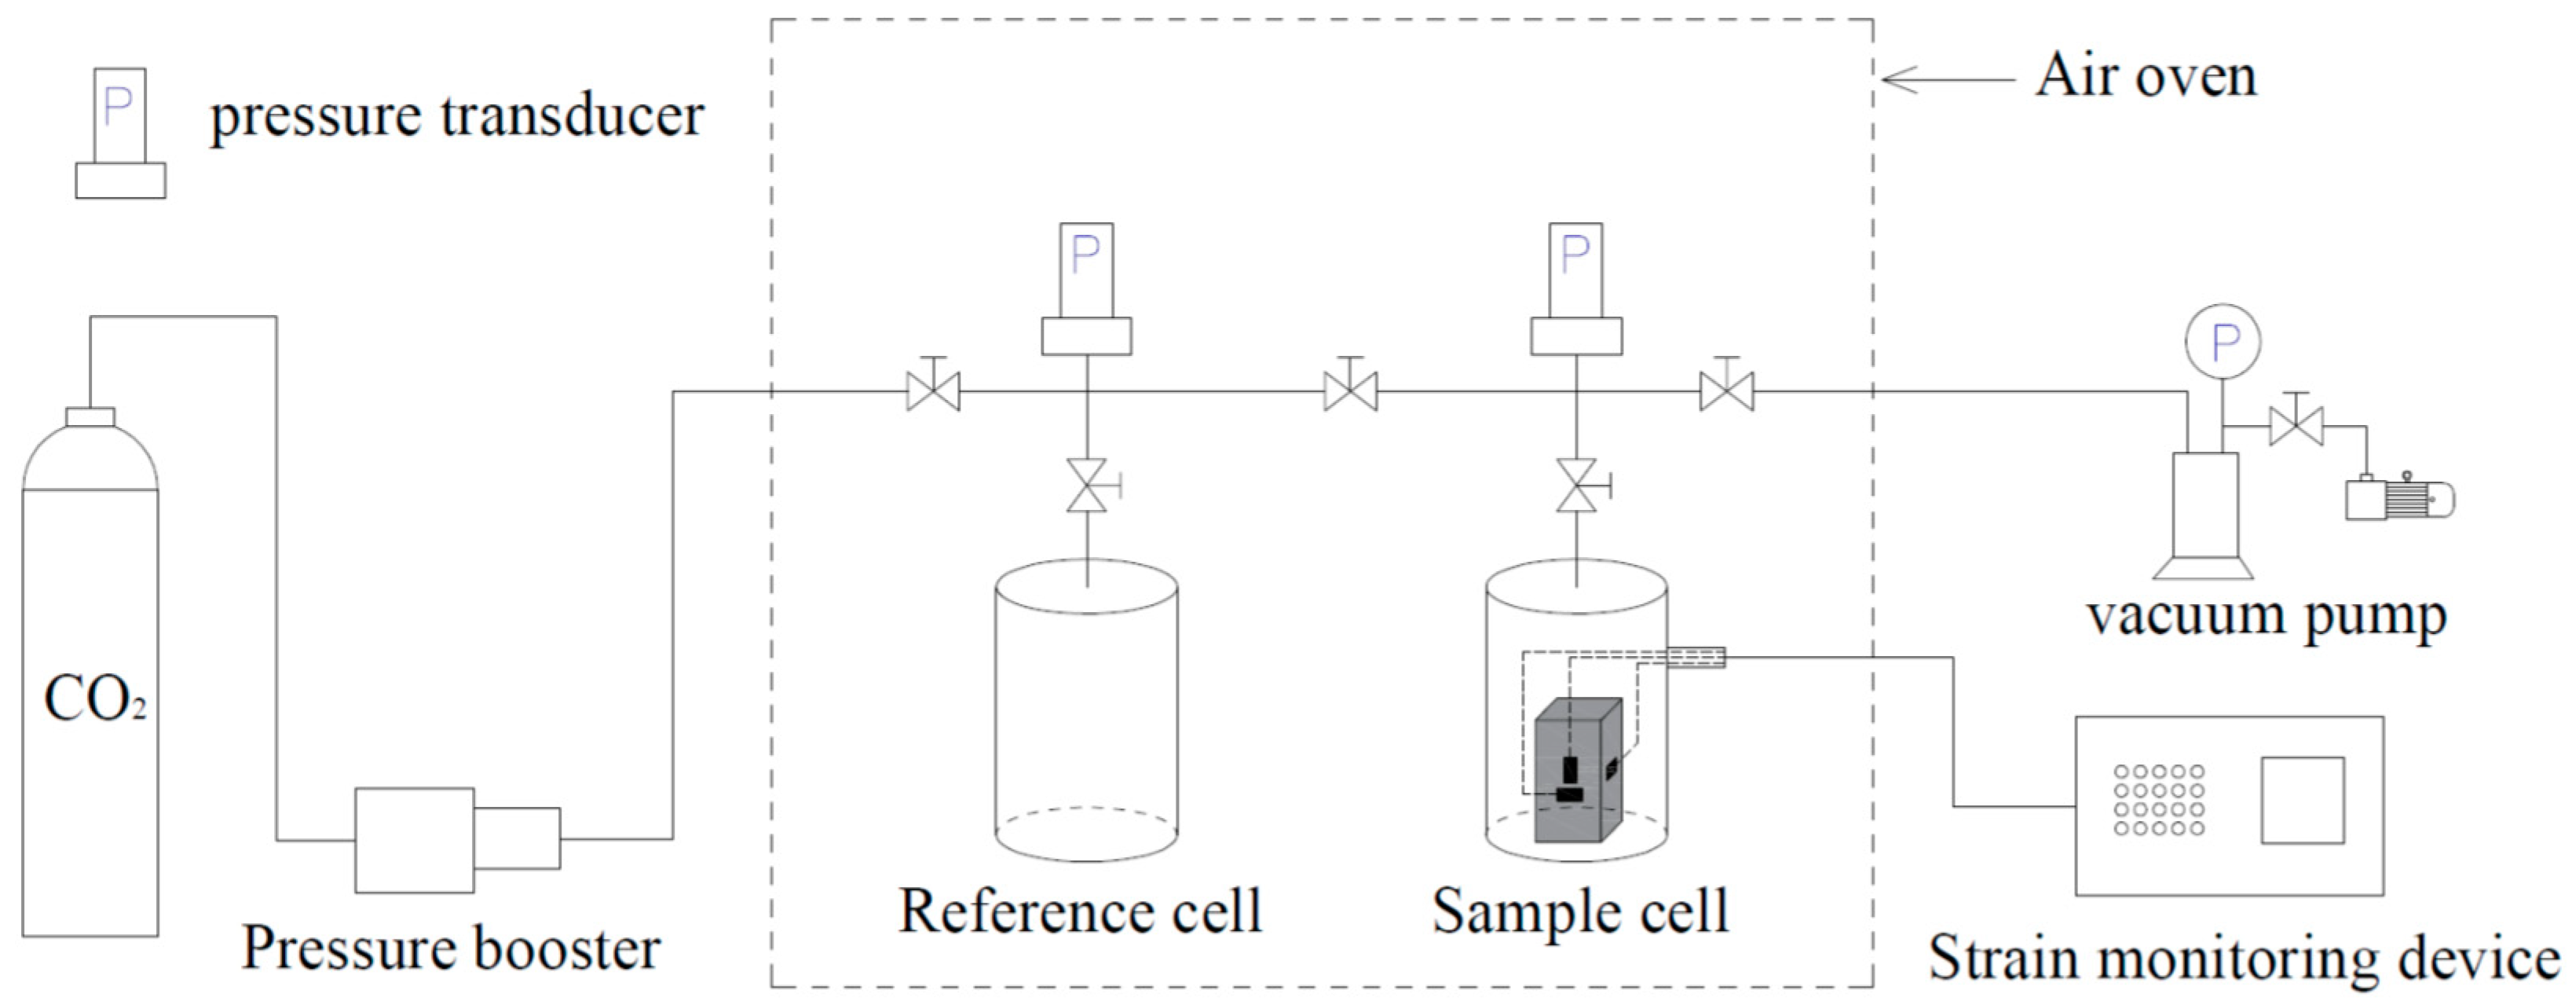
2.3.2. Adsorption Experimental Apparatus

The adsorption experimental apparatus basically consists of a reference cell (RC) and a sample cell (SC) and there is an isolation valve placed between two cells. The sample cell was modified to connect to a strain monitoring bridge consisting of 20 independent channels (Figure 5). Additionally, 10 mm one-way strain gauges were attached to the sample to measure the strains caused by CO2 adsorption. The adsorption isotherms were measured by using volumetric methods. The RC, the SC, values, and connected tubing were placed in an air oven with a temperature control less than ±0.1 °C. The pressure transducers were equipped with a precision of 0.689 KPa to confirm the accurate measurement.

2.4. Experimental Procedure

2.4.1. Permeability Tests

A series of permeability tests under drained conditions were conducted in the same coal sample under 50 °C. Table 3, Table 4 and Table 5 show the testing conditions done on the sample. In addition, 8 MPa confining stress was applied to the sample and the triaxial sample holder was heated to 50 °C. Nitrogen gas was first injected into the gas tubes at 6 MPa to carry out the tube-leakage tests. The pressure in the gas tubes was maintained at 6 MPa for 2 h to ensure that there was no pressure loss. Subsequently, preheated CO2 was injected at a 1 MPa injection pressure and atmospheric downstream pressure was maintained during the sub-critical CO2 injection. Once the output flow rate was steady, the injection pressure was increased to the next given pressure and the test procedure was replicated. Confining stress was raised to 10 MPa after the variation of the injection pressure was finished and then the sub-critical CO2 was injected from 1 MPa again. When confining stress was increased to 18 MPa, super-critical CO2 was injected and the injection pressure was increased from 10 MPa. In addition, the downstream pressure was consistently maintained at 8.0 MPa to assure that the super-critical CO2 condition can be achieved in the coal sample during a supercritical CO2 injection. After the planned injection pressure finished, confining stress was increased to 20 MPa and super-critical CO2 was injected from 10 MPa again. After super-critical CO2 permeability tests, mixed-phase CO2 permeability was investigated under 20 MPa confining stress. Injection pressure was maintained at 10 MPa and downstream pressure was increased gradually from 0.1 MPa to 9 MPa. Subsequently, the injection pressure rose to 11 MPa and repeated to increase downstream pressure. All the flow rates were obtained by using the milli-gas-flow counter.
During the permeability test, leakage tests were conducted first when confining stress was increased, which involved testing for stability in the oil volume under the given stress. After confirming the non-leaking condition, volumetric strain of the confined coal sample can be calculated by considering the volume change of the syringe pump and applying the confining stress [32]. Under a certain confining stress, excess oil was pumped out into the syringe pump when the coal sample swells and, meanwhile, the varying volume was recorded. Thus, the volumetric strain of the sample under various injection conditions can be calculated by Equation (1) [32].
S v = V 0 V t V initial × 100 %
where V 0 is the initial pump volume under the respective confining stress, mL, V t is the pump volume at some injection pressure, mL, and V initial is the initial volume of the coal sample, mL. Since it would take some time for CO2 adsorption at a different injection pressure, the pump volume was only taken after the pump oil volume became stable.

2.4.2. Adsorption and Coal Swelling Test

CO2 adsorption-induced strain at 50 °C was measured by using the adsorption experimental apparatus. The prepared coal sample (50 × 50 × 100 mm) with three strain gauges affixed in the directions of parallel to the bedding plane and perpendicular to the bedding plane was placed in the sample cell to measure the strains caused by CO2 adsorption. The seal of the apparatus was tested at 15 MPa (the maximum adsorption pressure in this experiment). The adsorption isotherms were measured by using volumetric methods. Prior to the measurements, the system was allowed to reach thermal equilibrium at 50 °C and then the system was degassed under vacuum for at least 24 h. Helium was utilized to calibrate the void volume of the sample cell [33]. After finishing the volume calibration and the He in the system vented, the reference cell and the sample cell were pressurized with CO2 in a series of steps up to a maximum of 15 MPa. The detailed procedure can be found in the literature [34]. Both the strain readings and the pressure readings were allowed to stabilize before progressing to the next pressure level.
Volumetric strain of the coal sample was obtained by Equation (2), as established in standard rock mechanics literature.
ε exp = ε 1 + ε 2 + ε 3
where ε exp is the volumetric strain obtained in the adsorption experiment, ε 1 and ε 2 are the strains parallel to the bedding plane in two orthogonal directions, and ε 3 is the strain perpendicular to the bedding plane.
According to the real gas law, the adsorption amount of CO2 called Gibbsian surface excess (GSE) was calculated by Reference [33].
Δ G S E = 1 m R T ( P 1 V V Z 1 + P 2 V R C Z 2 P 3 V R C Z 3 P 4 V V Z 4 )
where m is the weight of the coal sample, g, R is the universal gas constant, 8.314 J·mol−1·K−1, T is the isothermal temperature, 323.15 K in this experiment, P 1 and P 3 are the initial and final pressures of the sample cell, respectively, Pa, P 2 and P 4 are the initial and final pressures of the reference cell, respectively, Pa, Z 1 , Z 2 , Z 3 , and Z 4 , correspond to P 1 , P 2 , P 3 , and P 4 , respectively, are the compressibility factors of CO2 at 323.15 K in this study. Compressibility factors of CO2 were calculated by Span and Wagner-EoS due to its high predictive accuracy [35].
CO2 pressure was increased in stages to 15 MPa to obtain the isotherm. The total amount of the adsorbed CO2 was calculated by Equation (4) [34].
G S E n = i = 1 n Δ G S E i

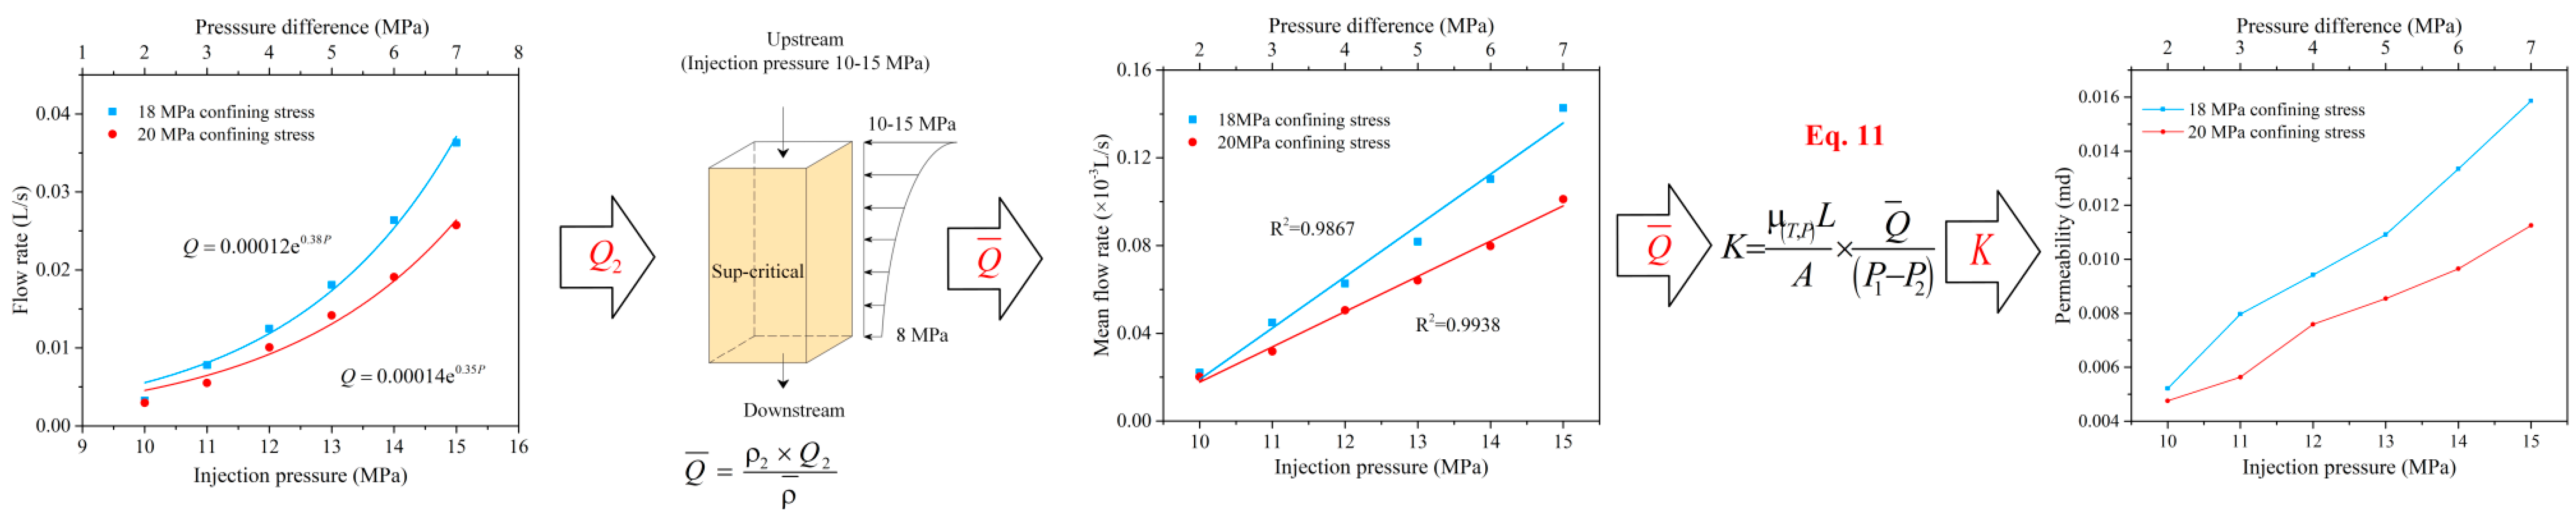
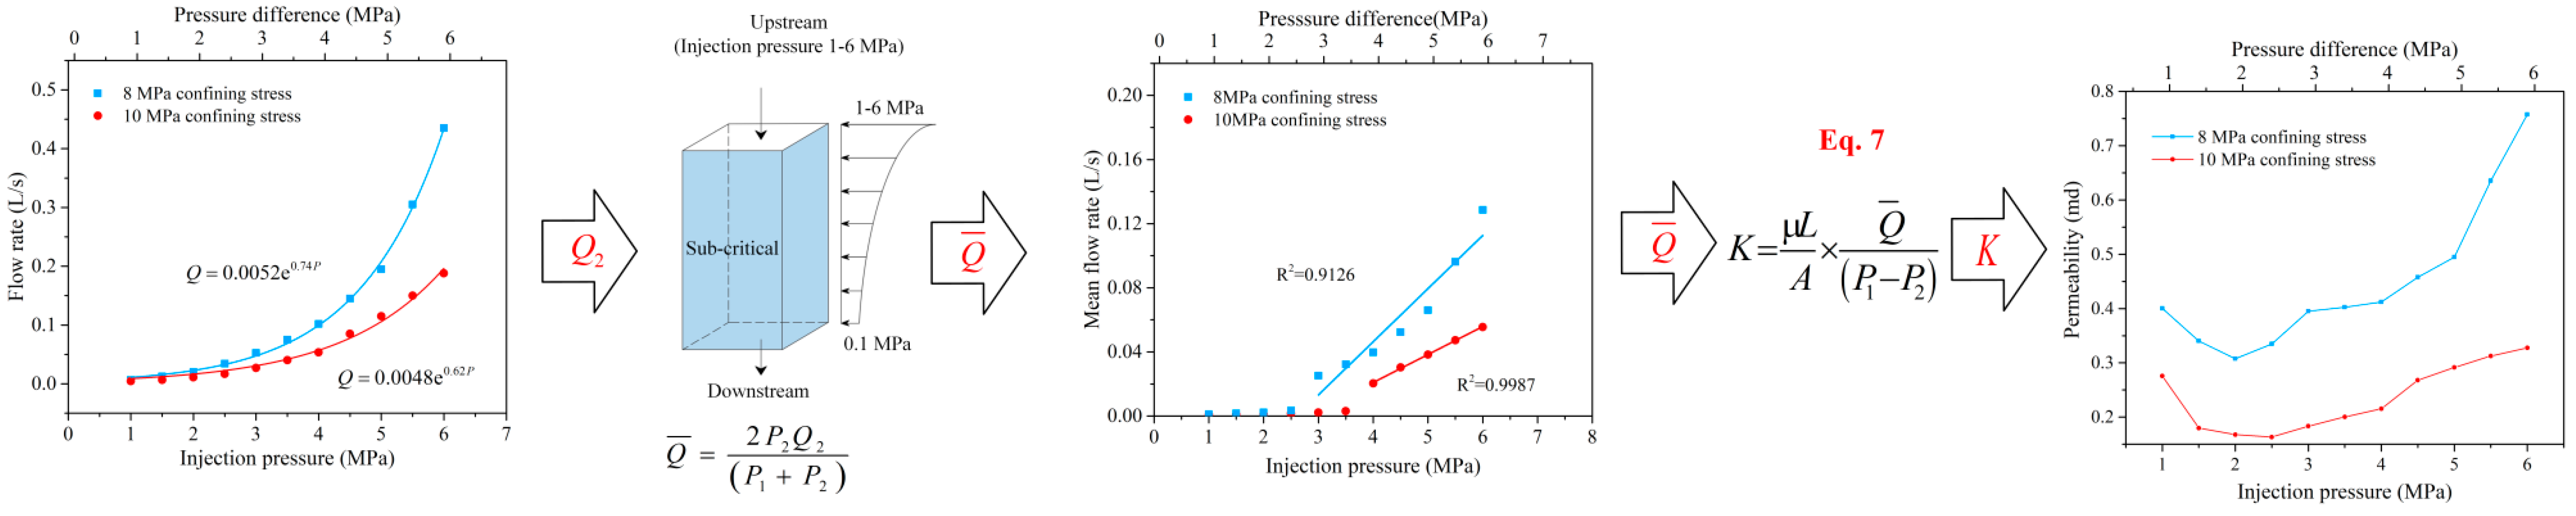
2.5. Permeability Equations for Sub-Critical and Sup-Critical CO2

Darcy’s Law has been extensively used to calculate the coal permeability. In 1856, Darcy [36] observed a linear relationship between the water flow rate and the pressure gradient and Equation (5) was obtained.
K = μ Q L ( P 1 P 2 ) A = μ L A × Q ( P 1 P 2 )
where K is the permeability, 1012 μm2, μ is the dynamic viscosity, Pa·s, Q is the flow rate, m3·s−1, P 1 is the upstream pressure, Pa, P 2 is the downstream pressure, Pa, L is the mean length, m, and A is the sample area, m2.
As μ , L , and A were assumed to be constant for water flow and the relationship between water velocity and the pressure gradient was linear in the original Darcy’s flow equation (Equation (5)). Water is considered as incompressible fluid. Thus, the volumetric flow rate ( Q ) of water is constant in the sample regardless of the variation of pore pressure along the transport path. However, CO2 compressibility is sensitive to pressure, which results in the volumetric flow rate varying along the flow path. To solve this issue, the mean flow rate was established based on the Ideal Gas Law. Assuming gaseous CO2 is an ideal gas, the relation between the mean flow rate and the downstream flow rate can be described by the equation below.
( P 1 + P 2 ) 2 Q ¯ = P 2 Q 2
where Q ¯ is the mean flow rate, m3·s−1, Q 2 is the volumetric flow rate at downstream, m3·s−1, P 1 is the upstream pressure, Pa, and P 2 is the downstream pressure, Pa.
Therefore, the mean flow rate can be calculated by using the equation below.
Q ¯ = 2 P 2 Q 2 ( P 1 + P 2 )
Assuming there is a linear relationship between the mean flow rate and the pore pressure gradient, Darcy’s Law can be applied to calculate permeability of sub-critical CO2. Combined Equation (5) with Equation (7), the permeability equation for gaseous CO2 can be obtained by the formula below.
K = μ L A × Q ¯ ( P 1 P 2 ) = 2 μ P 2 Q 2 L ( P 1 2 P 2 2 ) A
where K is the permeability, 1012 μm2, μ is the dynamic viscosity, Pa·s, Q 2 is the flow rate, m3·s−1, P 1 and P 2 is the upstream and downstream pressure, respectively, Pa, L is the mean length of the sample, m, and A is the crossed area of the sample, m2.
Similarly, the mean flow rate was also used to evaluate super-critical/mixed-phase CO2 flow behavior. Since the Ideal Gas Law is not applicable in this condition, the mass flow rate was put forward to calculate the mean flow rate based on the principle of mass conservation. As the amount of super-critical CO2 transporting in the coal sample is equal to the amount of CO2 altered to the gas phase in atmospheric pressure, which was measured using the milli-gas-flow counter, the relationship can be determined by using the formula below.
Q m = ρ ¯ Q ¯ = ρ 2 Q 2
where Q ¯ is the mean volumetric flow rate, m3·s−1, Q m is the mass flow rate, mol·s−1, ρ ¯ is the CO2 mean density along the coal sample, mol·m−3, ρ 2 is the CO2 density at downstream, mol·m−3, and Q 2 is the volumetric flow rate at downstream, m3·s−1.
Based on Equation (9), the mean volumetric flow rate of supercritical/mixed-phase CO2 can be calculated by Equation (10).
Q ¯ = Q m ρ ¯ = ρ 2 × Q 2 ρ ¯
The CO2 density can be calculated using the adiabatic compressibility. Both the adiabatic compressibility and viscosity values under a different pressure can be found in the Reference Fluid Thermodynamic and Transport Properties (REFPROP) database [37].
Likewise, if a linear relationship was built between the mean volumetric flow rate and the pore pressure gradient, Darcy’s Law was applied to obtain the super-critical/mixed-phase CO2 permeability. Combined Equation (5) with Equation (10), the permeability equation for supercritical/mixed-phase CO2 can be established by the equation below.
K s c = μ ( T , P ) L A × Q ¯ ( P 1 P 2 ) = μ ¯ ( T , P ) Q 2 L ( P 1 P 2 ) A · ρ 2 ρ ¯
where K s c is the CO2 permeability, 1012 μm2, μ ¯ ( T , P ) is the mean viscosity of CO2 along the flow path, Pa·s, Q ¯ is the mean volumetric flow rate, m3·s−1, L is the length of the tested specimen, m, P 1 and P 2 are upstream and downstream pressures respectively, Pa, A is the section area of the test specimen, m2, Q 2 is the volumetric flow rate of gaseous CO2 at downstream, m3·s−1, ρ 2 is CO2 density, kg·m−3, and ρ ¯ is the mean density of supercritical CO2 along the flow path, kg·m−3.

3. Results and Analysis

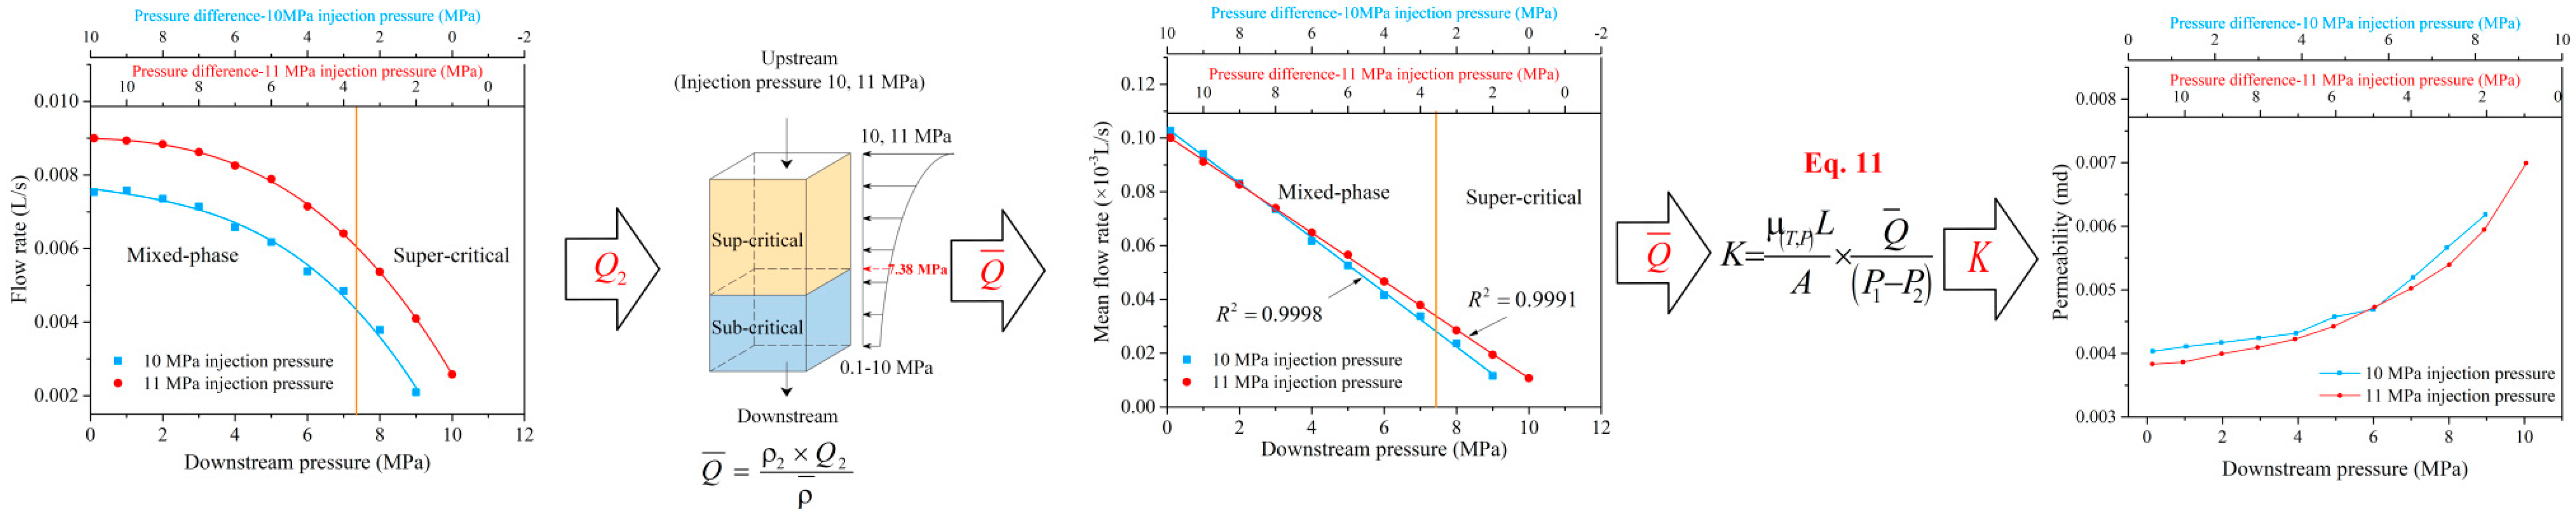
3.1. Sub-Critical, Super-Critical, and Mixed-Phase CO2 Flow Behavior

The permeability experiments for sub-critical, super-critical, and mixed-phase CO2 were performed in a drain condition to measure the flow rates under different effective stresses and then the mean flow rates were investigated to estimate whether Darcy’s Law can be applied. At each injection pressure, the final flow rate was needed to stabilize at a certain value for one hour.
Figure 6 shows the flow rates of sub-critical CO2 versus the injection pressure at 8 MPa and 10 MPa confining pressures. An exponential relationship between the flow rate and the injection pressure gradient was observed. The fitting curves showed that the flow rate at 8 MPa confining stress increased faster than that at 10 MPa confining stress. Then, the mean flow rates were calculated by Equation (7). It can be seen that there is a non-linear relationship between the mean flow rate and the pressure gradient at first, but the flow rate increased linearly with a further increase of the injection pressure. The initial abnormal variation of the mean flow rate was mainly attributed to CO2 adsorption-induced swelling, which will be discussed in Section 4.3.
Figure 7 shows the flow rates of super-critical CO2 versus the injection pressure at 18 MPa and 20 MPa confining pressures. As discussed previously, the downstream pressure was maintained at 8 MPa and the injection pressure was increased from 10 MPa to 15 MPa. Thus, the pressure difference varied from 2 to 7 MPa. Similarly, there was another exponential increase between the flow rate of super-critical CO2 and the injection pressure gradient. Due to higher confinements and greater viscosity, the flow rate of super-critical CO2 was reduced significantly by one magnitude compared with sub-critical CO2. As the injection pressure was increased from 11 MPa to 15 MPa at 18 MPa confining stress, the flow rate increased from 0.0078 L/s to 0.0363 L/s 4.65 time, which is far less than the 51 times rise under 8 MPa confining stress. Mean flow rates of super-critical CO2 were calculated by Equation (10) and the results indicate that the mean flow rate is linear to the injection pressure and a high value of the determination coefficient (R2) was achieved for the trend line. Therefore, super-critical CO2 flow can be assumed to be laminar and Darcy’s law is applicable for the estimation of super-critical CO2 permeability.
Different from the above two conditions, mixed-phase CO2 changed from a super-critical state to a sub-critical state due to the variation of downstream pressure (Figure 8) and it became a totally super-critical state when the downstream pressure was above 7.38 MPa. Interestingly, although the pore pressure increased with progressive downstream pressure, the flow rates showed a decline trend. Furthermore, under the same downstream pressure, the flow rates at the 11 MPa injection pressure are higher than those at the 10 MPa injection pressure. Similarly, the mean flow rates were evaluated by Equation (10). Good linear relationships between the mean flow rate and the downstream pressure were observed regardless of the CO2 phase. This reveals that the mixed-phase CO2 flow still follows Darcy’s law. To be noticed, due to the initial storage term, the non-zero y-intercepts were observed in the figures of mean flow rate versus the injection pressure for the different-phase CO2 injection.

3.2. Sub-Critical, Super-Critical, and Mixed-Phase CO2 Permeability

Since Darcy’s law is applicable regardless of the CO2 state, the sub-critical super-critical and mixed-phase CO2 permeabilities were investigated respectively. A non-linear relationship between permeability and the injection pressure was observed under different confining stresses (Figure 6, Figure 7 and Figure 8).
Despite the fact that the flow rate of sub-critical CO2 increased with the injection pressure, an initial reduction of permeability was observed under 8 MPa and 10 MPa confining stresses (Figure 6). Sub-critical CO2 permeability reached the minimum at 2 to 2.5 MPa. At 8 MPa confinement pressure, coal permeability reduced by nearly 14.97% from 1 MPa to 2 MPa of CO2 injection while the decline rate was increased to nearly 34.78% under 10 MPa confinement. After the initial decline, the sub-critical CO2 permeability started increasing with the injection pressure gradient.
Super-critical CO2 permeability was investigated at 18 MPa and 20 MPa confining stress (Figure 7). Super-critical CO2 permeability increased with a progressive injection pressure and decreased with the confinement gradient. In addition, sup-critical CO2 permeability is far less than sub-critical CO2. CO2 permeability is 0.0094 md at 12 MPa injection pressure and 18 MPa confining stress while it is 0.31 md at a 2 MPa injection pressure and 8 MPa confining stress.
Different from the declining trend of the flow rate, a gradual increase of mixed-phase CO2 permeability was observed with downstream pressure and the increase trend became more dominant when the downstream pressure is above 7.38 MPa (Figure 8). The mixed-phase CO2 permeability is close to super-critical CO2 permeability and less than sub-critical CO2 permeability. Interestingly, although the flow rates at 11 MPa injection pressure is more than those at the 10 MPa injection pressure, the permeability showed an inverse trend.

4. Discussion

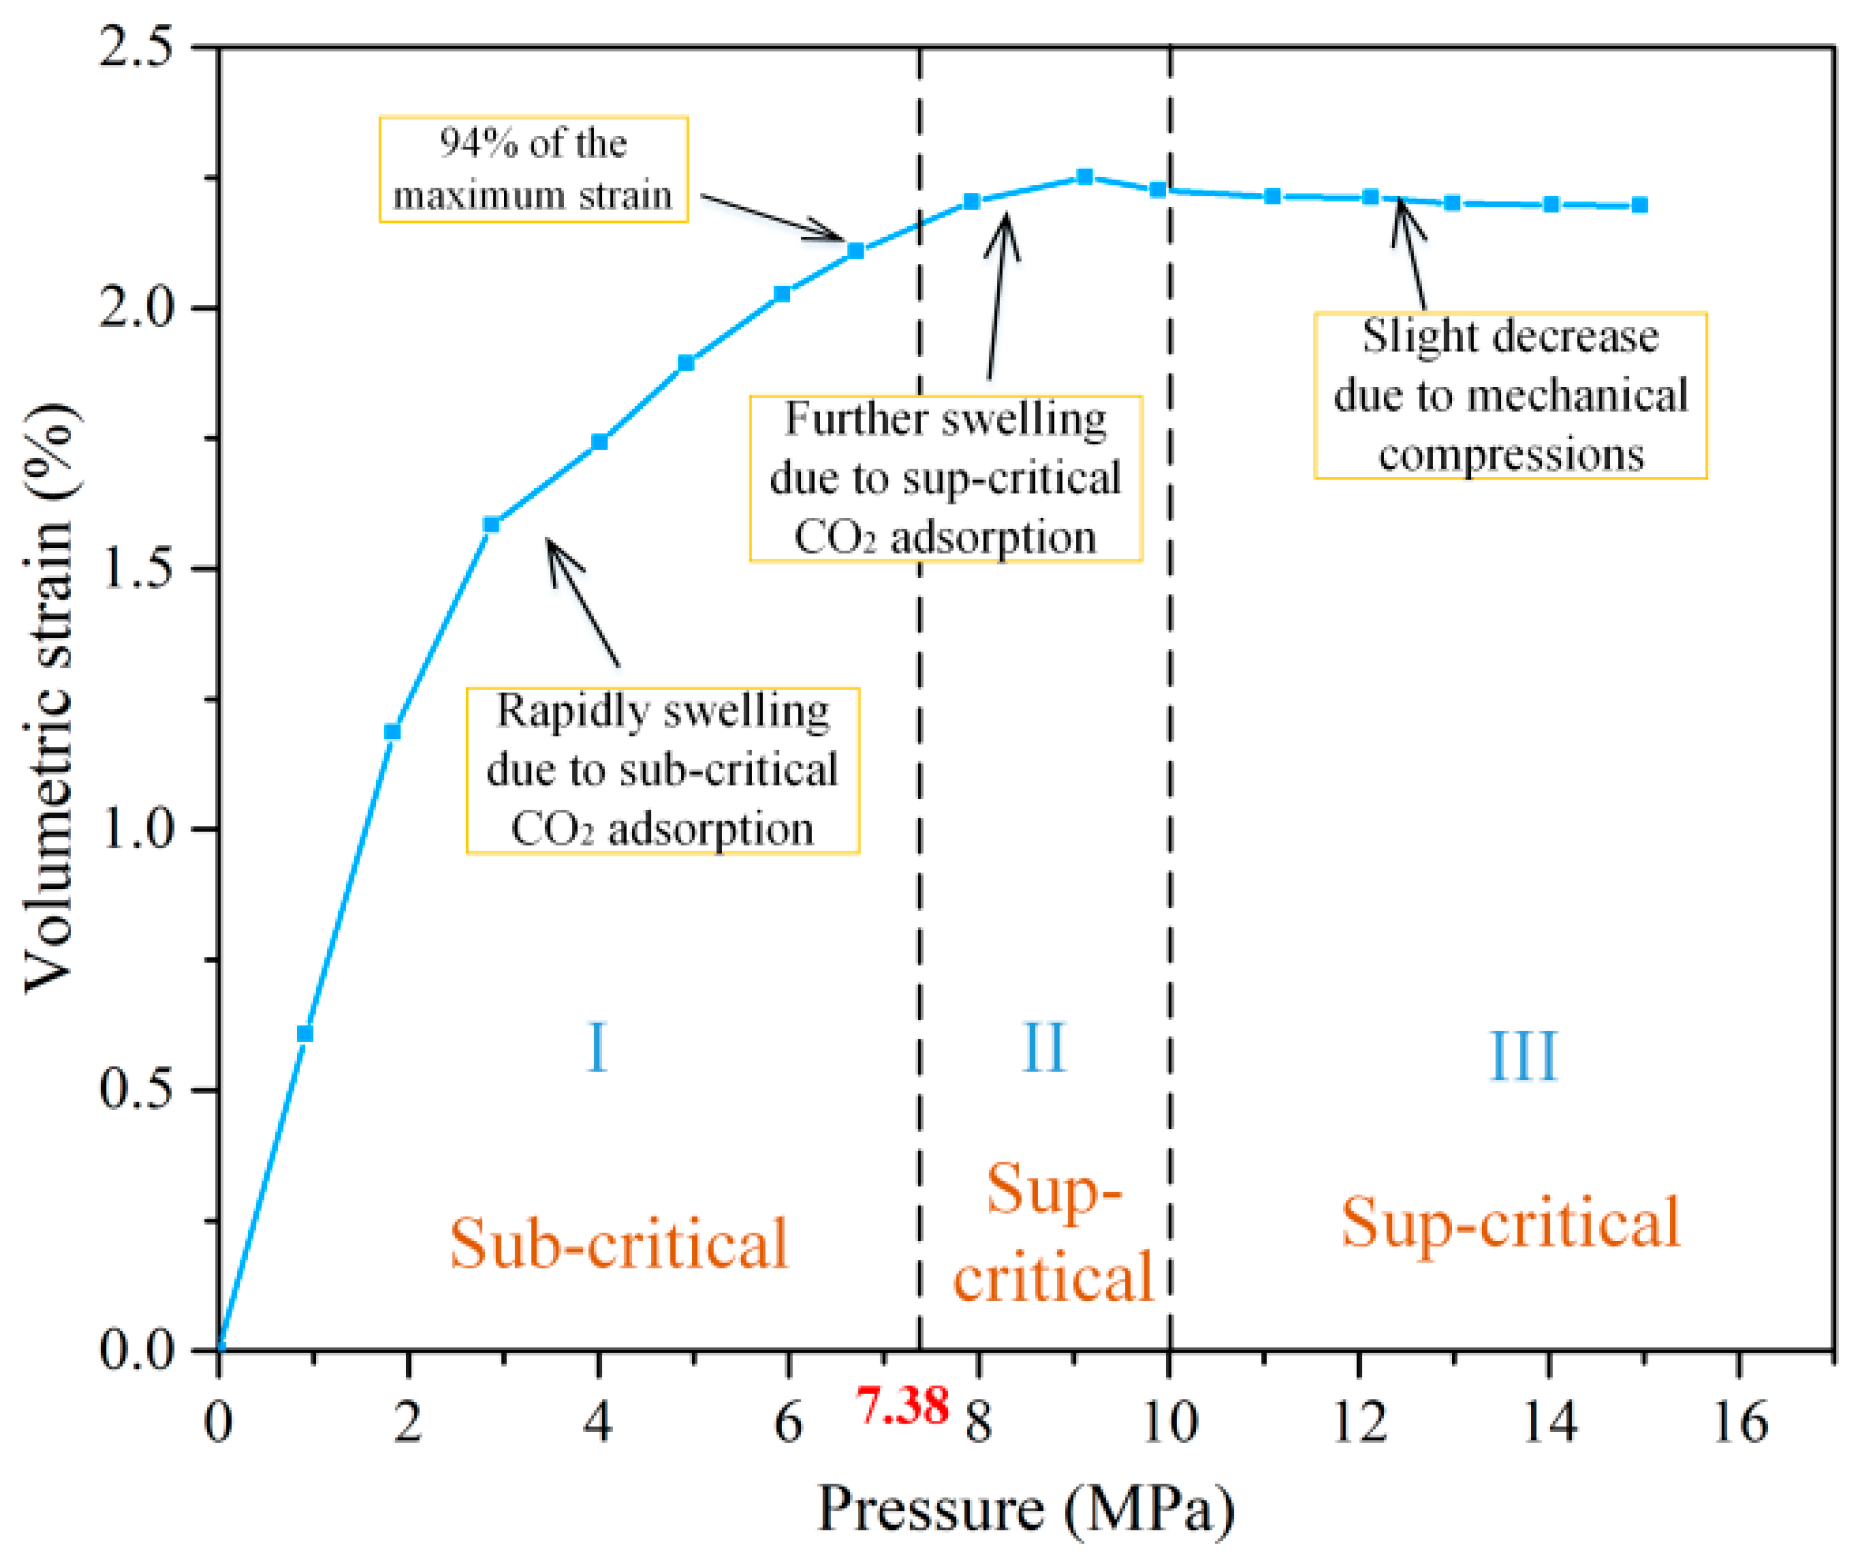
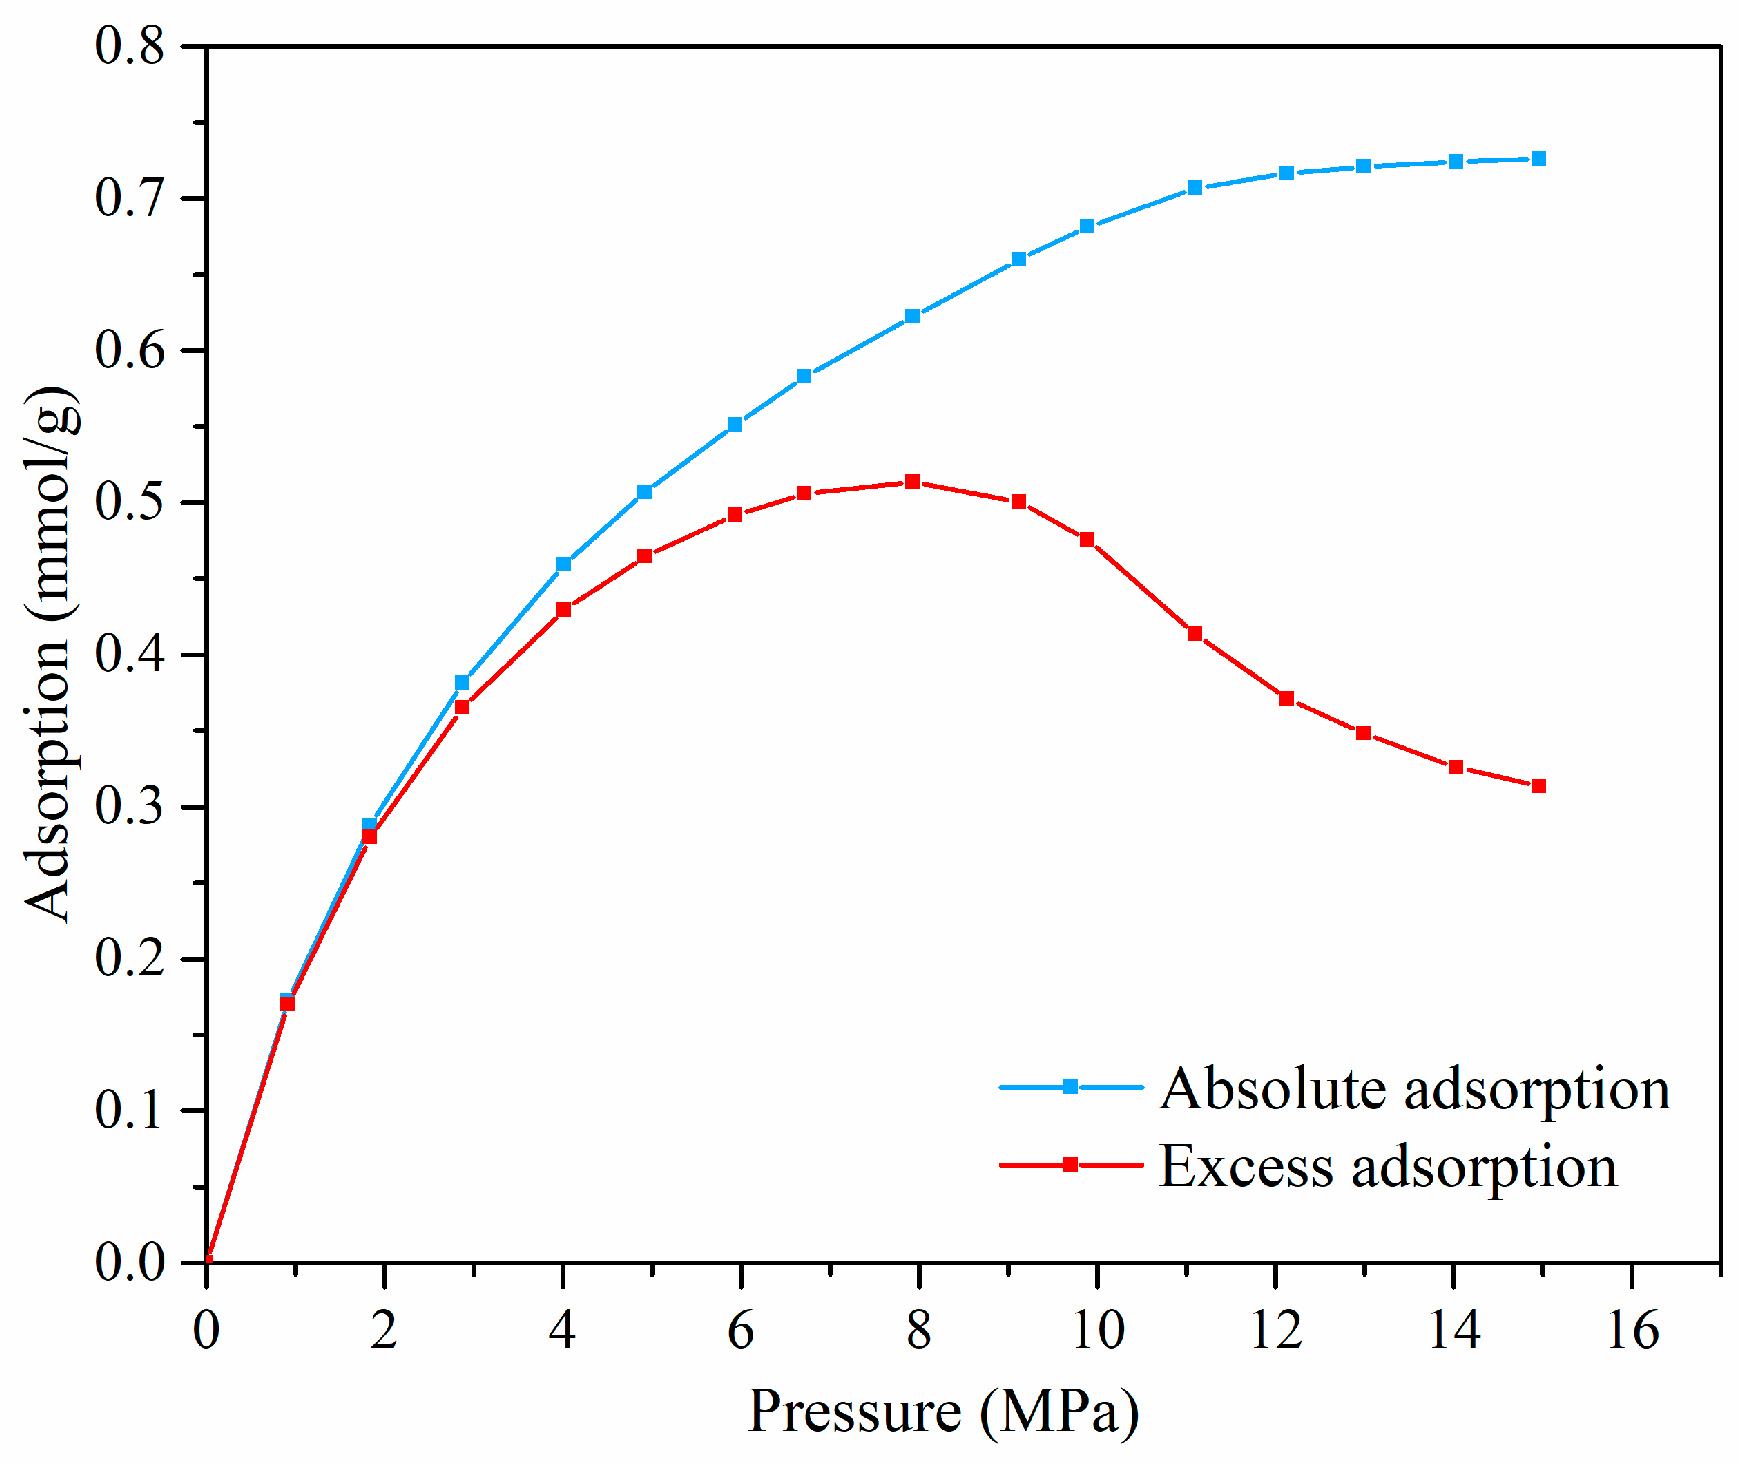
4.1. Mechanism and Behavior of Coal Swelling Due to Different-Phase CO2 Adsorption

4.1.1. Coal Swelling Mechanism Due to Different-Phase CO2 Adsorption

Under in situ conditions, coal deformation due to CO2 injection was mainly determined by two mechanisms: (1) CO2 adsorption-induced swelling, which narrows the gas flow path and has a detrimental effect on the permeability, (2) gas pressure increase and effective stress decrease, which tends to compress the coal matrix and open coal cleats (fractures), contributing to coal permeability [38,39]. It is important to distinguish these two opposite effects on coal permeability. Thus, the coal swelling mechanism due to CO2 adsorption was investigated.
When CO2 was injected into the coalbed, CO2 adsorbed on the surfaces of the coal fractures and cleats immediately and then diffused into cleats and pore structures. The adsorbate CO2 formed fresh intramolecular bonds with coal, which will break the original molecular structure [40]. As a result, the glassy/rubbery, strained, and highly cross-linked macromolecular structure became viscoelastic relaxation and the coal matrix began swelling [41,42]. According to previous research [43], assuming that the variation of the elastic energy is equal to the variation of surface energy and the coal deformation is isotropic elastic [44], the adsorption-induced strain can be derived by using the equation below.
ε a d s = γ A ρ s E s f ( x , v s )
where
f ( x , v s ) = [ 2 ( 1 v s ) ( 1 + v s ) c x ] [ 3 5 v s 4 ( 1 2 v s ) c x ] ( 3 5 v s ) ( 2 3 c x )
where ε a d s is the adsorption-induced strain, γ is the specific surface energy, A is the surface area per unit mass of adsorbent, ρ s is the density for the coal solid, E s is the Young’s modulus for the coal solid, x is a coal structure parameter related to the porosity of micro-pores, v s is the Poisson’s ratio for the coal solid, and c is a constant equal to 1.2.
As high-pressure CO2 will also compress the coal matrix, the compression strain caused by pore pressure is given by Equation (14) below [45].
ε c o m = P E s ( 1 2 v s )
where ε c o m is the pore-pressure-compression strain, P is the pore pressure, E s is the Young’s modulus for the coal solid, and v s is the Poisson’s ratio for the coal solid.
Thus, combining the adsorption-induced strain and the pressure compression strain, the total strain due to a high pressure CO2 adsorption can be obtained as the equation below [43].
ε a d s = ε a d s + ε c o m = γ A ρ s E s f ( x , v s ) P E s ( 1 2 v s )

4.1.2. Coal Swelling Behavior Due to Different-Phase CO2 Adsorption

An adsorption experiment, with respect to different-phase CO2, was conducted in sub-bituminous coal at 50 °C. The absolute adsorption isotherm and the excess adsorption isotherm of CO2 in the adsorption test are presented in Figure 9. According to Day et al. [46], the absolute isotherm can be calculated by Equation (16).
W a b = W e x ( 1 ρ g / ρ a )
where W a b is the absolute adsorption, W e x is the excess adsorption, ρ g is the density of the gas, and ρ a is the density of the adsorbed phase.
It can be seen from Figure 9 that the excess adsorption of super-critical CO2 increased rapidly to a maximum of 0.52 mmol/g at 7.93 MPa and began to decrease afterwards, which is mainly because the bulk density increased faster than the adsorbed phase density with progressive CO2 pressure [34]. According to Sircar [47], the excess adsorption will approach zero when the bulk density is close to the density of the adsorbed phase. Unlike the excess adsorption, the absolute CO2 adsorption kept increasing when CO2 pressure increased, but the increase rate slowed down after CO2 reached a super-critical condition.
Adsorption-induced swelling is shown in Figure 10. The volumetric strain increased rapidly with increasing CO2 pressure at first and a maximum value of about 2.25% was reached at 9.12 MPa. About 94% of the total swelling occurred at 6.71 MPa, which means less than 6% further swelling occurred due to a super-critical CO2 adsorption. Interestingly, there is a slight decrease of volumetric strain after 10 MPa. The volumetric strain decreased from 2.25% at 9.12 MPa to 2.20% at 14.97 MPa. Although the bulk CO2 continued to be absorbed at a super-critical condition (Figure 9), the variation of the surface potential energy induced by adsorption at a high pressure slowed down and the compression strain caused by high pressure became predominant. As a consequence, the volumetric strain started to decrease after reaching the maximum swelling [43]. Similar experimental results were demonstrated in Day et al. [46] and Moffat et al. [48].
To be noted, previous research has shown that clay minerals can absorb considerable quantities of CO2 [49]. Specifically, Ca-exchanged smectite absorbed the largest amounts of CO2, Na-exchanged smectite, illite, kaolinite, and chlorite were followed [49]. Since there is only 4.3% clay detected in the raw coal sample (Table 2), the contribution of clay minerals to the total amount of CO2 adsorption can be neglected. In addition, the tested coal samples have been dried for 24 h. Since dry smectite and non-expandable clays like illite do not show measurable swelling strain after CO2 adsorption [50,51], the effect of clay minerals on coal swelling can be neglected.

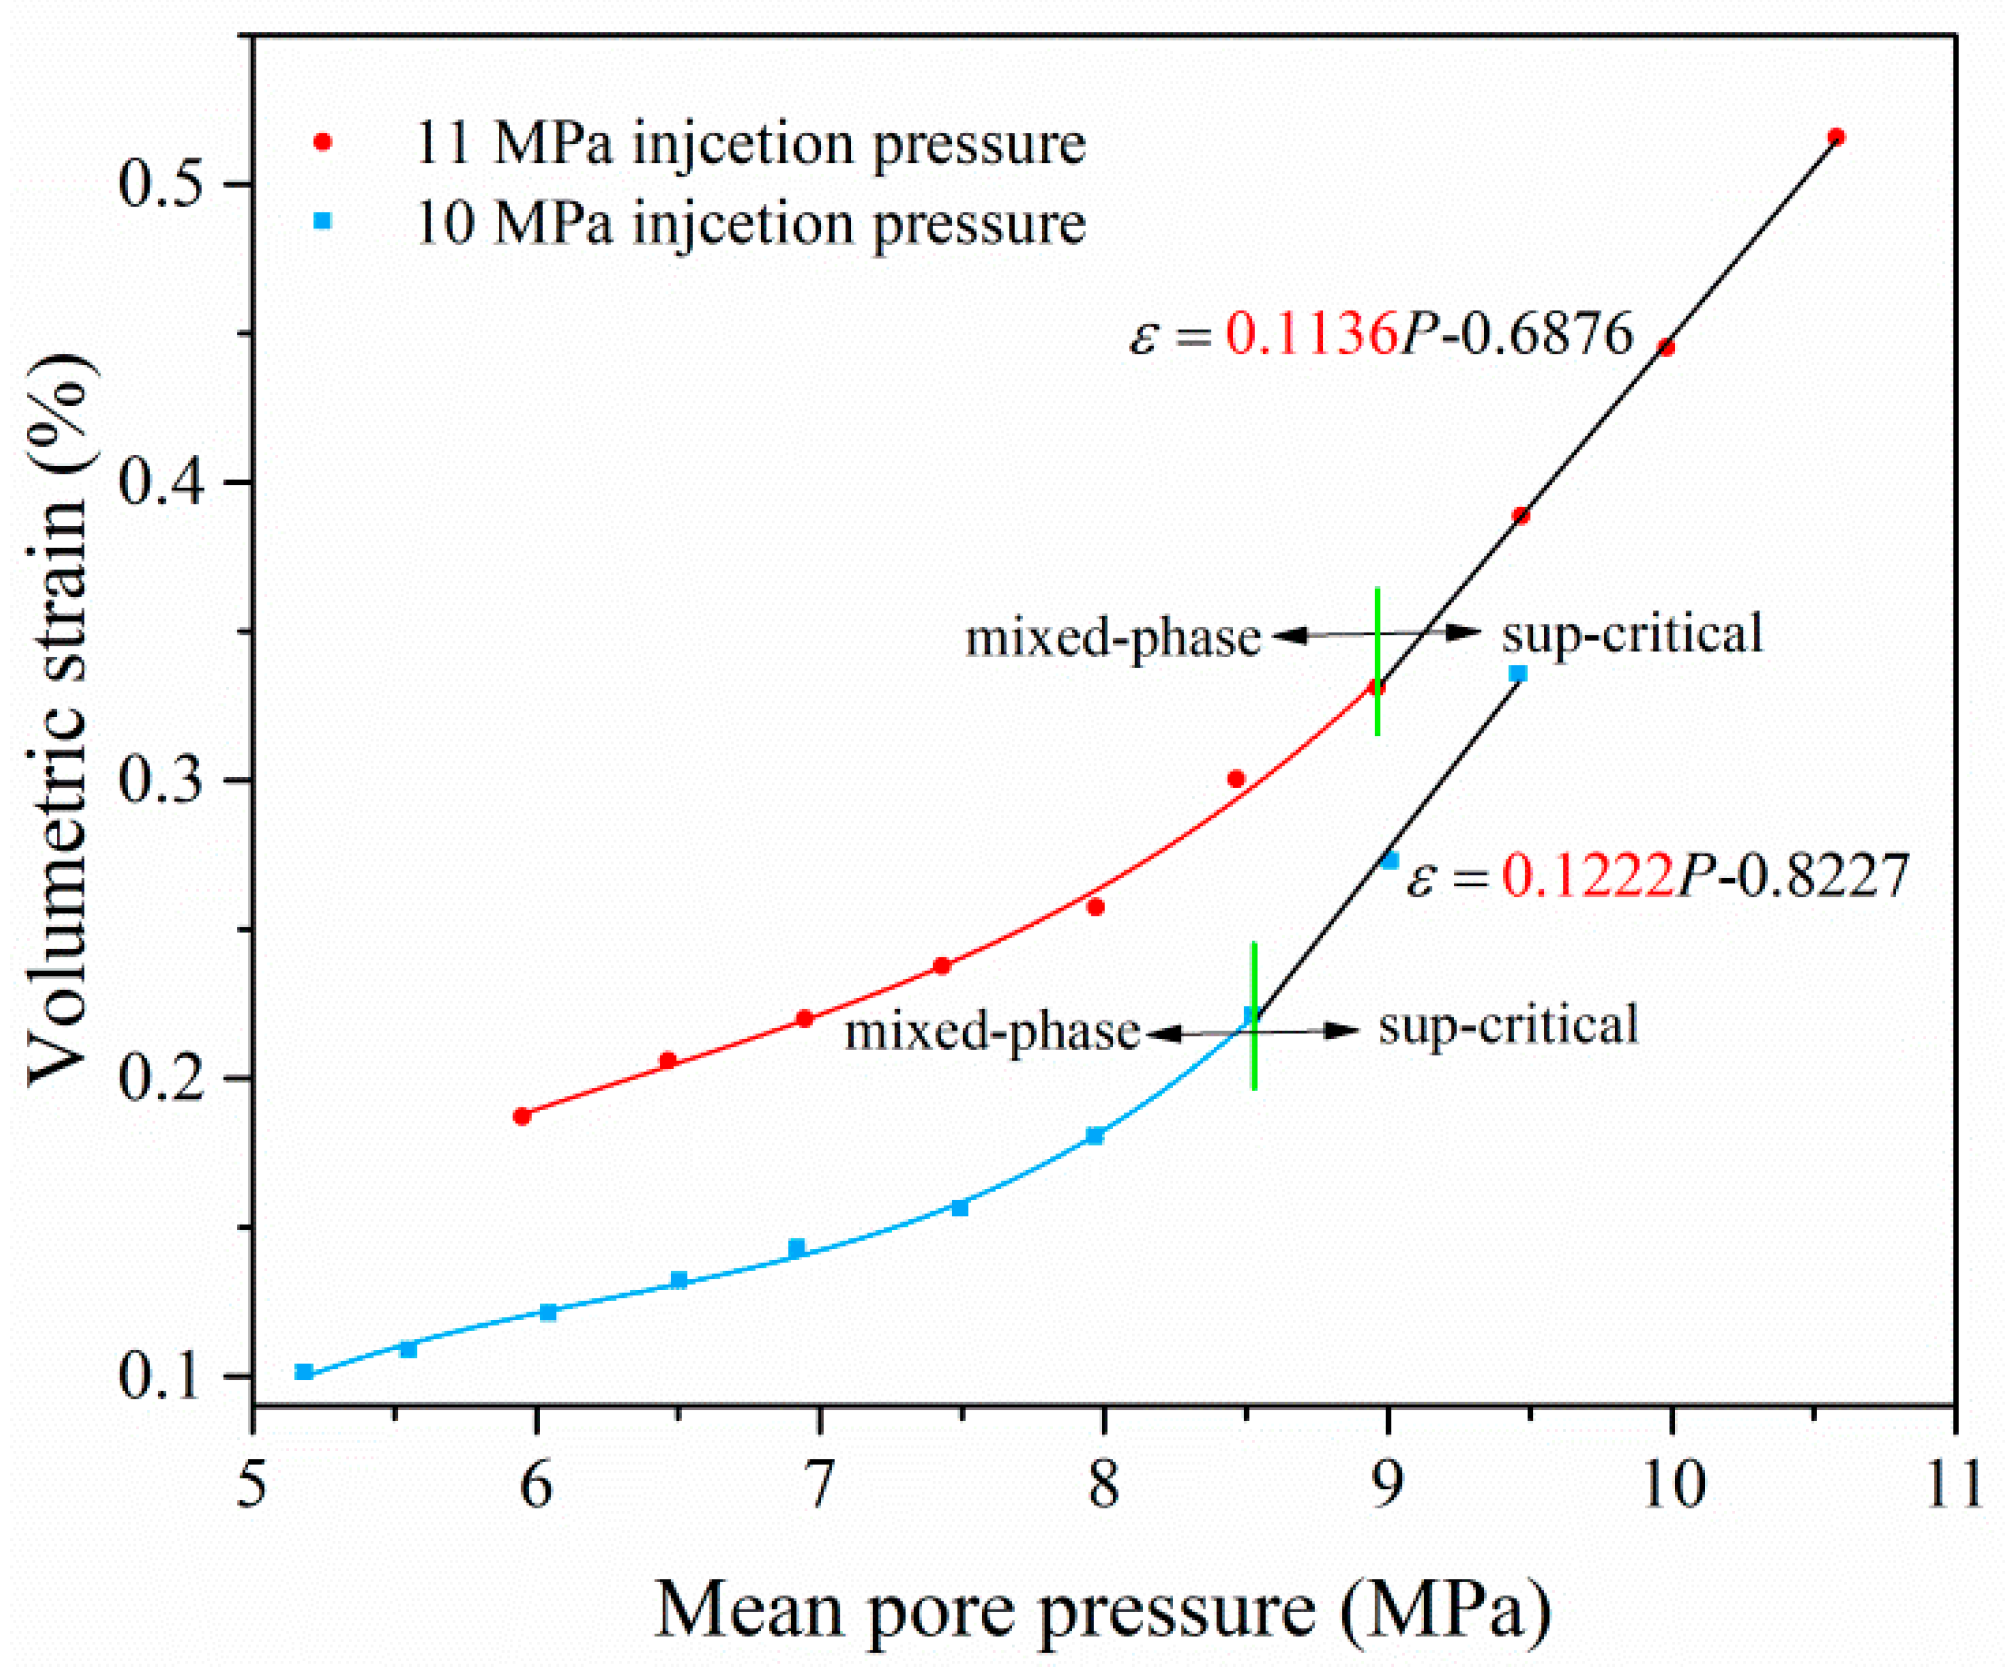
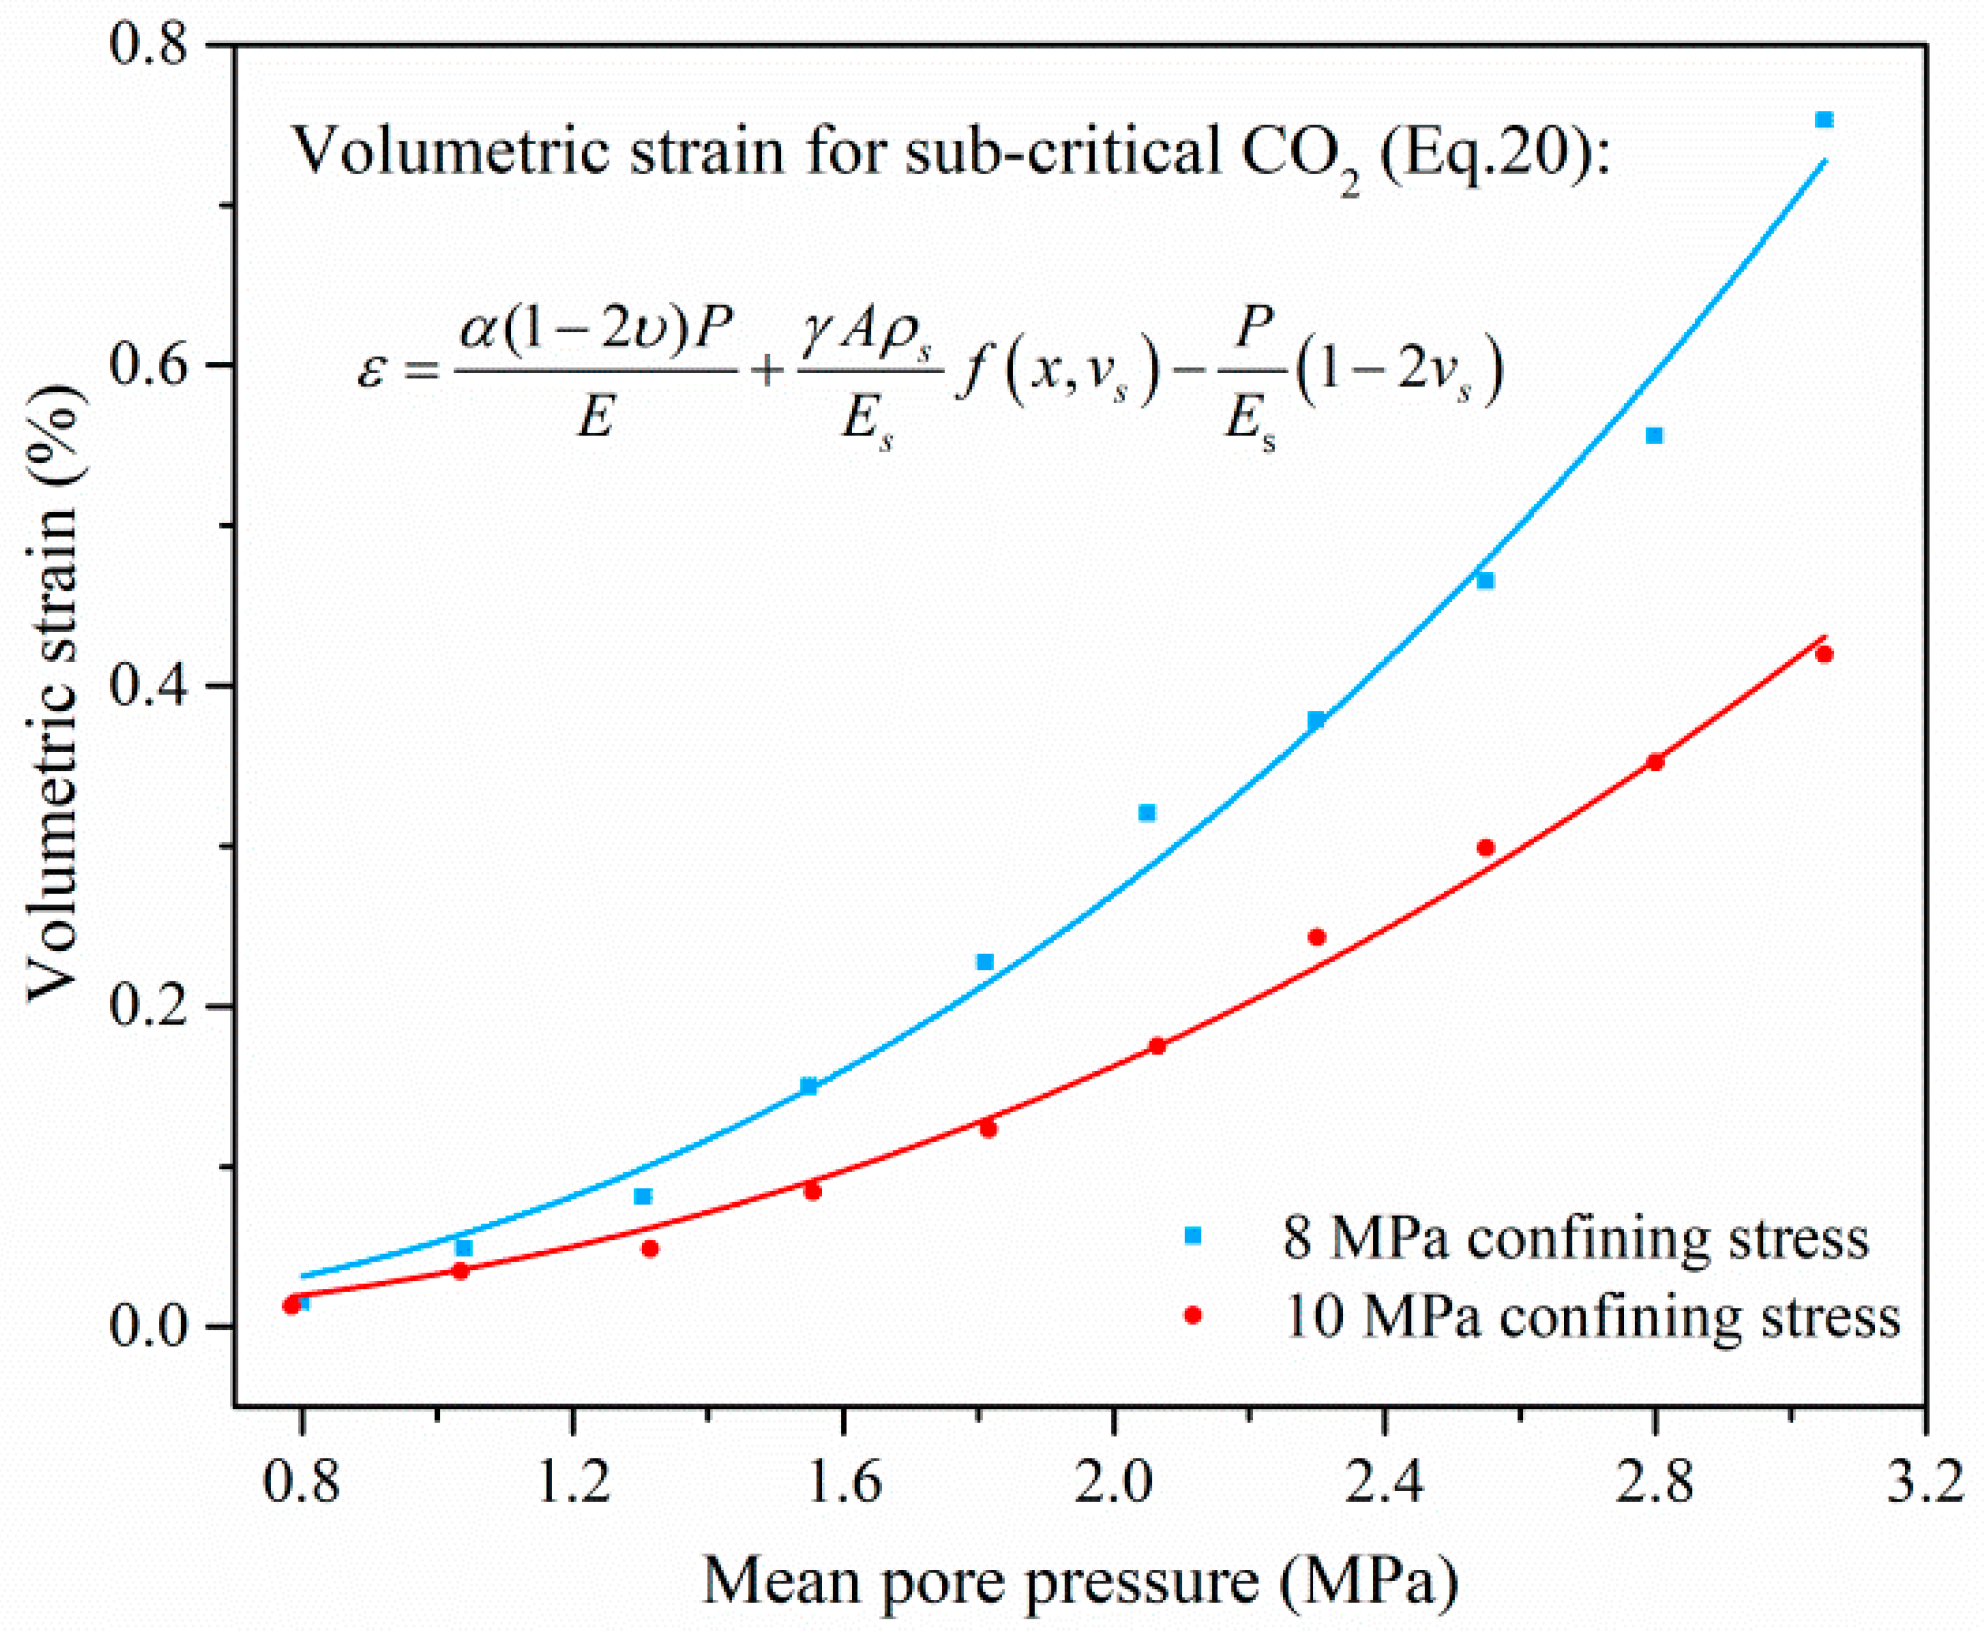
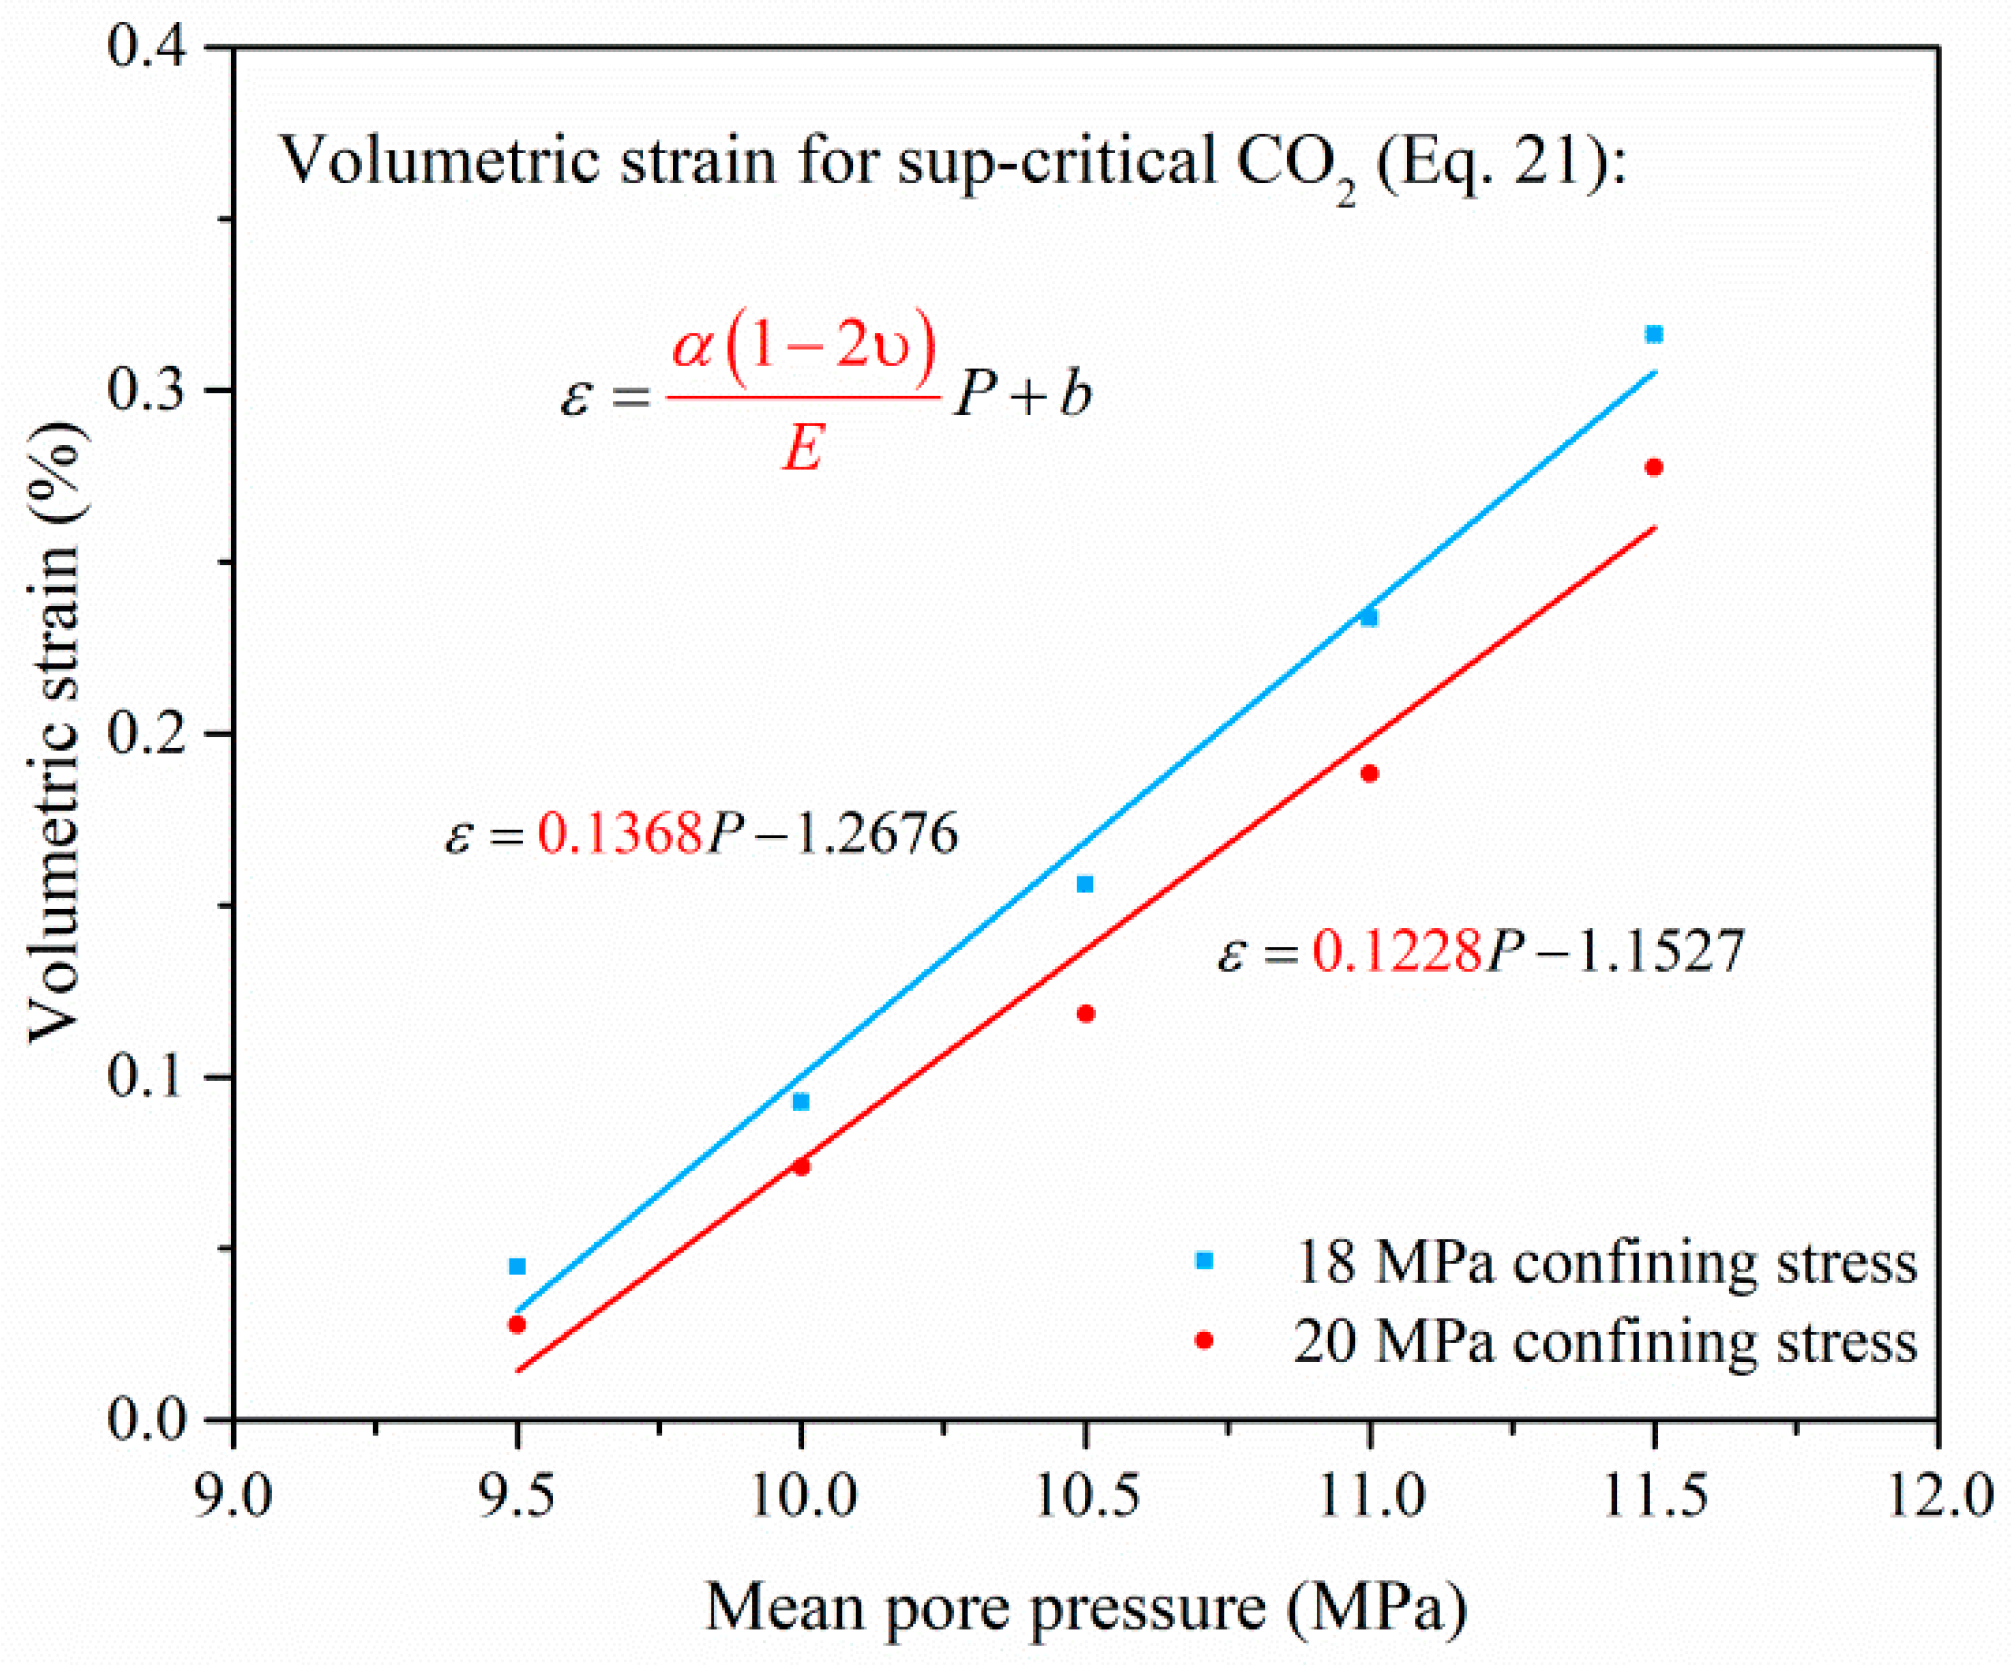
4.2. Mechanism and Behavior of Coal Deformation In Situ Conditions

4.2.1. Coal Deformation Mechanism In Situ Conditions

Although high-pressure CO2 will compress the coal matrix, under in-situ conditions, CO2 injection also tends to cause the decrease of effective stress, which contributes to the swelling of the whole coal mass. Effective stress is defined as a function of the confining pressure and the pore pressure, which can be presented by the Biot theory [52]. In previous work, the Biot coefficient is assumed to be unity, but some experimental results have shown that the Biot coefficient is less than unity [53,54,55]. Assuming that (1) the coal sample is homogeneous and isotropic, (2) the deformation is elastic and reversible. The coal deformation before CO2 injection can be expressed by the equation below.
ε 1 = 1 E [ σ 1 μ ( σ 2 + σ 3 ) ]
Coal deformation after CO2 injection can be described by the equation below.
ε 1 = 1 E [ σ 1 μ ( σ 2 + σ 3 ) ] α ( 1 2 υ ) P E
Under the same confinement, the volumetric strain caused by CO2 injection (variation of effective stress) can be described by Equation (19) [54].
ε e f f = Δ ε = ε 1 ε 1 = α ( 1 2 υ ) P E
where σ 1 , σ 2 , and σ 3 are stress in three orthogonal directions, ε e f f is the volumetric strain due to variation of effective stress, α is the Biot coefficient, υ is the Poission ratio of coal mass, E is the Young’s modulus of coal mass, and P is the pore pressure.
Combining the coupling effects of CO2 adsorption and decrease of effective stress, the overall volumetric strain ( ε ) due to CO2 injection under in situ conditions can be derived as the equation below.
ε = ε e f f + ε a d s = α ( 1 2 υ ) P E + γ A ρ s E s f ( x , v s ) P E s ( 1 2 v s )
Equation (20) can be used to calculate the volumetric strain caused by different-phase CO2 injection. In addition, according to Figure 10, no further adsorption-induced strain ( ε a d s ) and slight compression strain ( ε c o m ) were observed after 9.14 MPa. It means that ε a d s can be viewed as a constant (b) for the super-critical CO2 injection in this experiment since the minimum injection pressure is 10 MPa. Thus, for a super critical CO2 injection, Equation (21) can be simplified as the formula below.
ε = α ( 1 2 υ ) P E + b

4.2.2. Coal Deformation Behavior In Situ Conditions

Under in situ conditions, CO2 injection causes adsorption-induced swelling and reduction of effective stress, which results in an increase of volumetric strain. Figure 11 shows the variation of volumetric strain due to sub-critical, super-critical, and mixed-phase CO2 injection during the permeability tests. Assuming the coal sample is isotropic elastic, the volumetric strain can be calculated by Equation (20). For a sub-critical CO2 injection, a non-linear increase of volumetric strain was observed with the injection pressure. At constant confinement, both adsorption-induced swelling and effective stress contributed to the volumetric strain. The adsorption-induced strain at 4 MPa pressure is approximately 86% of that at 6 MPa pore pressure without confinement (Figure 10), but this ratio decreased to about 43% under 8 and 10 MPa confining stress (Figure 11). It revealed that the contribution of effective stress to the total volumetric strain became predominant.
With an increasing confining pressure, some natural fractures and cleats in the coal became closed, which resulted in less adsorption-induced coal swelling as a consequence of fewer surface for CO2 adsorption. At the same time, the Boit coefficient decreased due to increasing confinement [54]. Considering the less CO2 adsorption and Biot coefficient, the volumetric strain decreased with increasing confinements (Figure 11).
For a super critical CO2 injection, the volumetric strain increased linearly with the injection pressure (Figure 12). According to Figure 10, the adsorption induced swelling decelerated after a 9.12 MPa pore pressure. Considering that the least injection pressure is 10 MPa and the downstream pressure is 8 MPa, the further volumetric strain due to super critical CO2 injection is mainly caused by the decrease of effective stress. According to Equation (21), under constant confinement, the Boit coefficient, the Poission ratio, and the elastic modulus could be assumed to be constant and no further adsorption-induced strain occurred, so the swelling strain caused by effective stress increased linearly with the pore pressure gradient.
Meanwhile the slopes of the regressed curves decreased with progressive confining stress in Figure 12. Although the Boit coefficient was regarded as a constant under constant confining stress, the Boit coefficient will decrease with progressive confining stress [54,56]. According to Equation (21), the decrease of the Boit coefficient will have a predominantly negative effect on the volumetric strain, which leads to the reduced slopes of fitting equations.
For a mixed-phased CO2 injection, due to the coupling effects of adsorption-induced swelling and effective stress, a non-linear increase of the volumetric strain was observed when the downstream pressure was below 7.38 MPa (Figure 13). CO2 existed totally in a super critical state when the downstream pressure is over 7.38 MPa. As discussed previously, the variation of volumetric strain was mainly attributed to the effective stress. Thus, there was a linear relationship between the mean pore pressure and the volumetric strain.

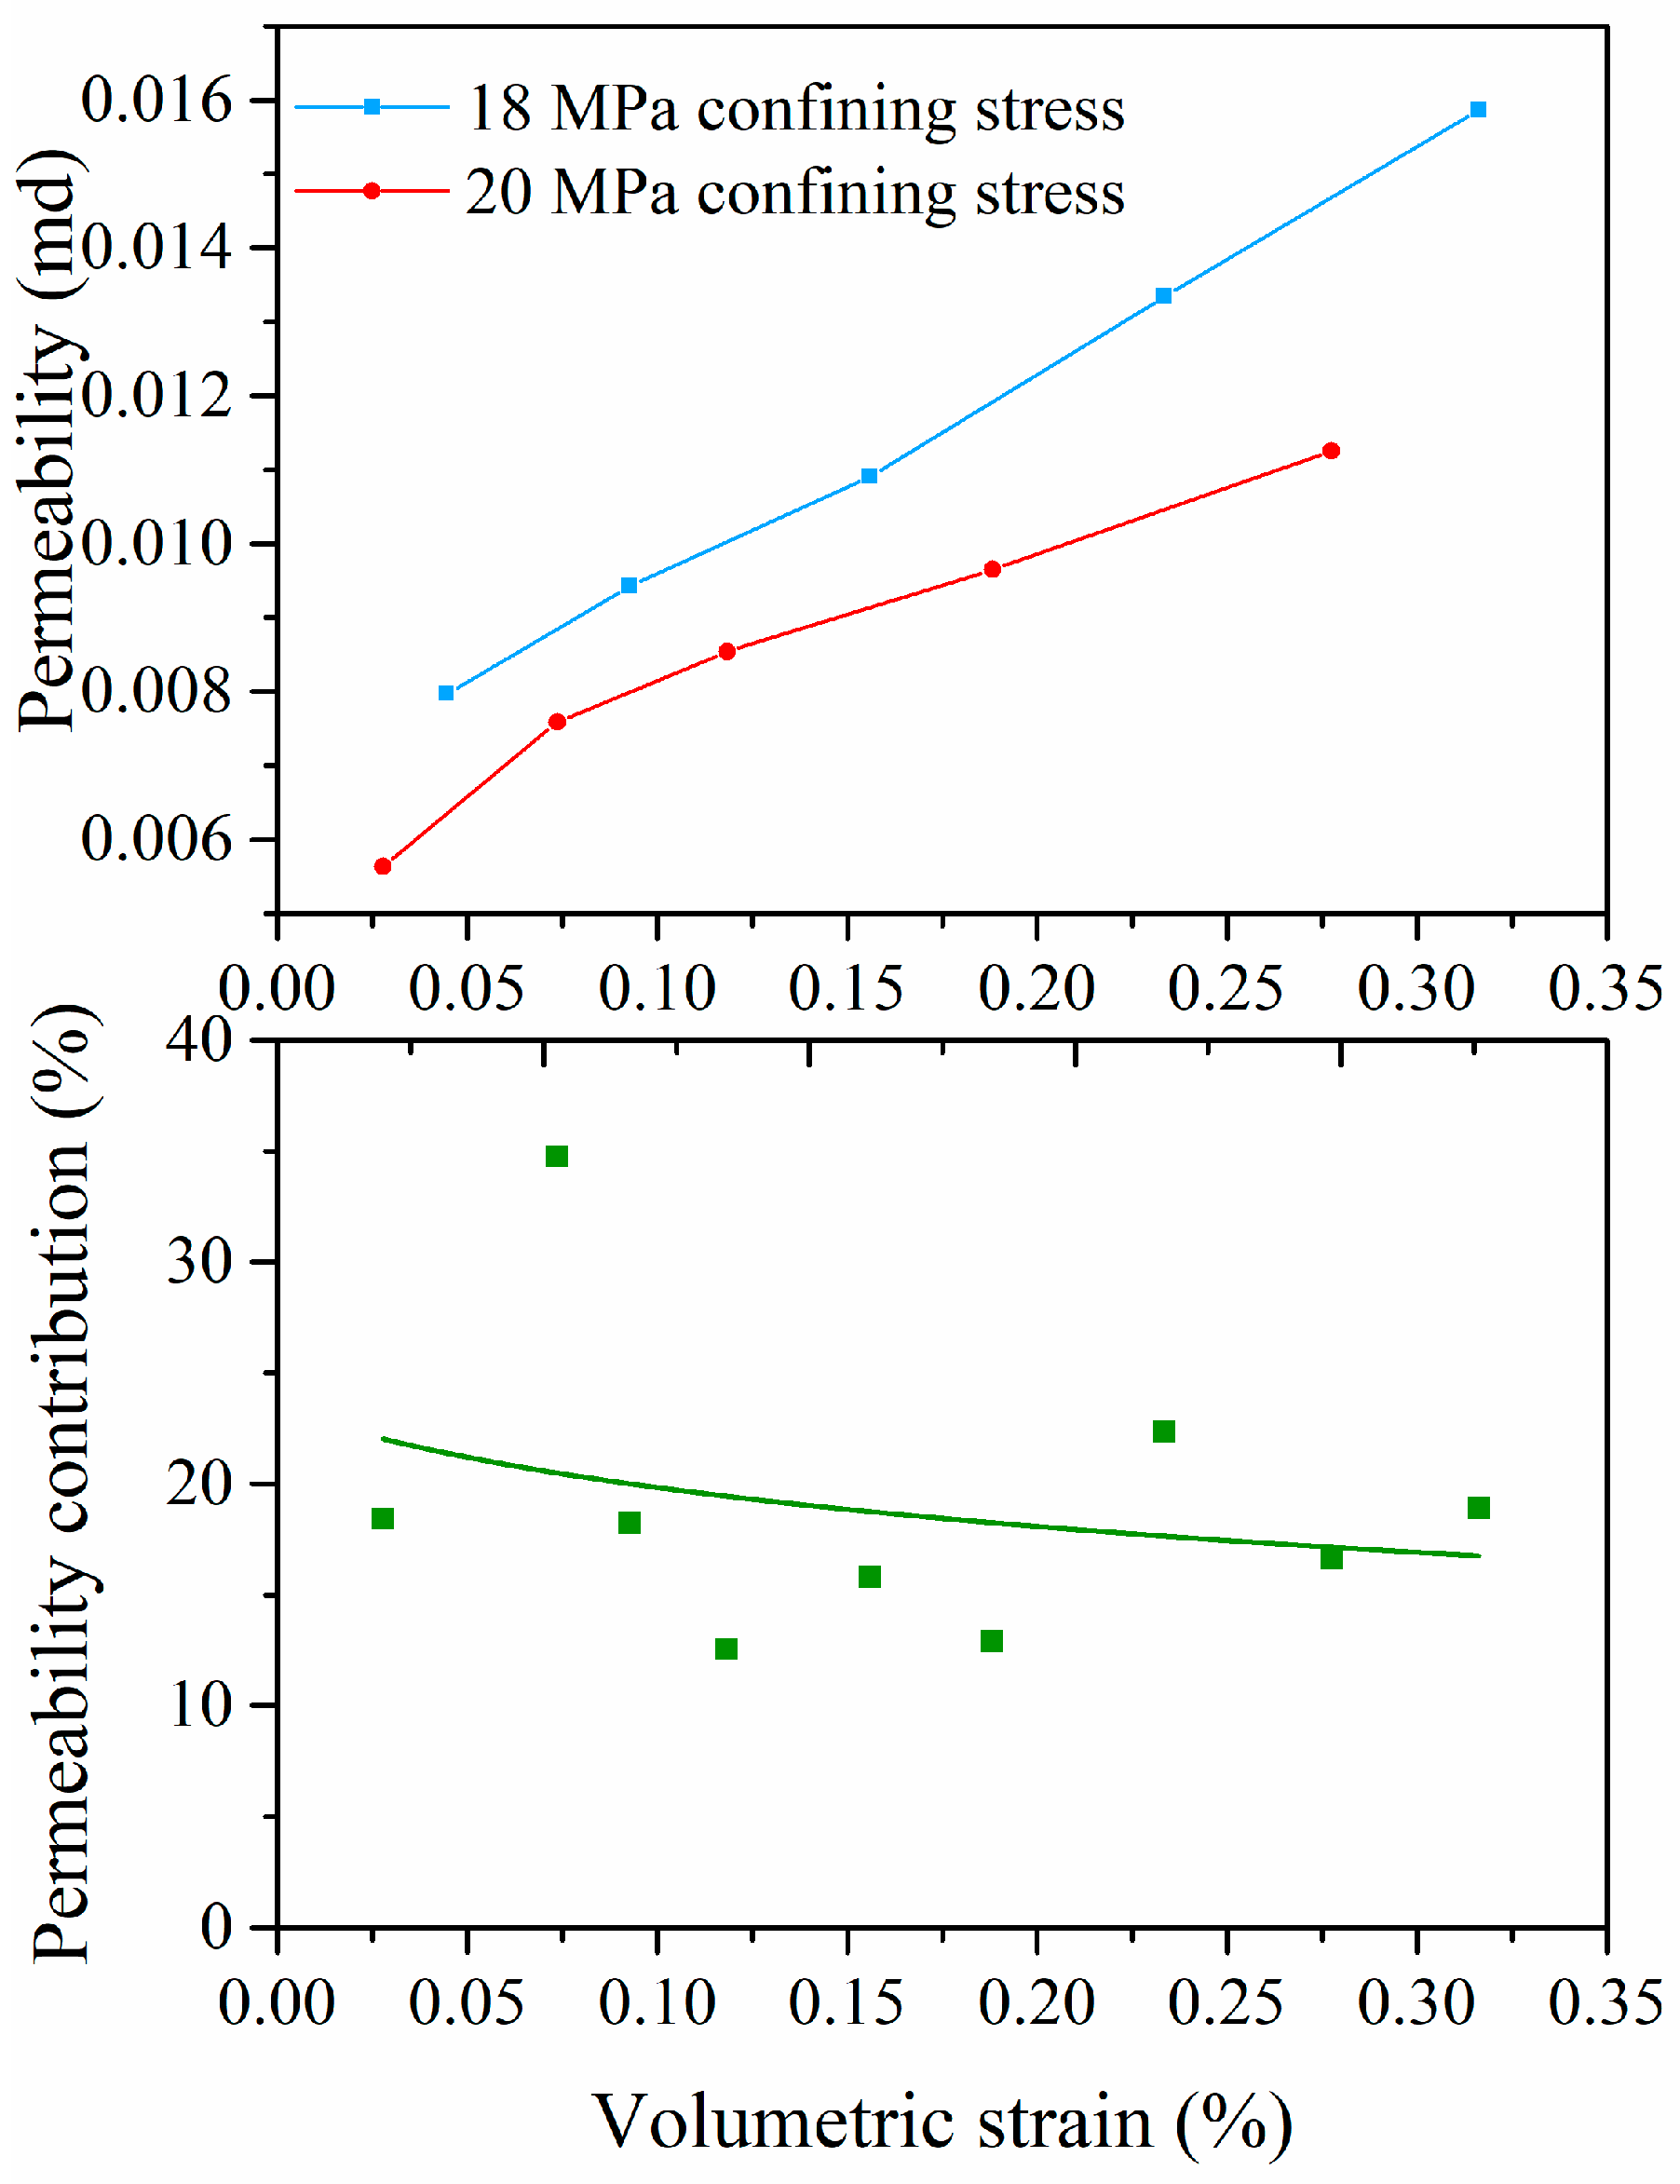
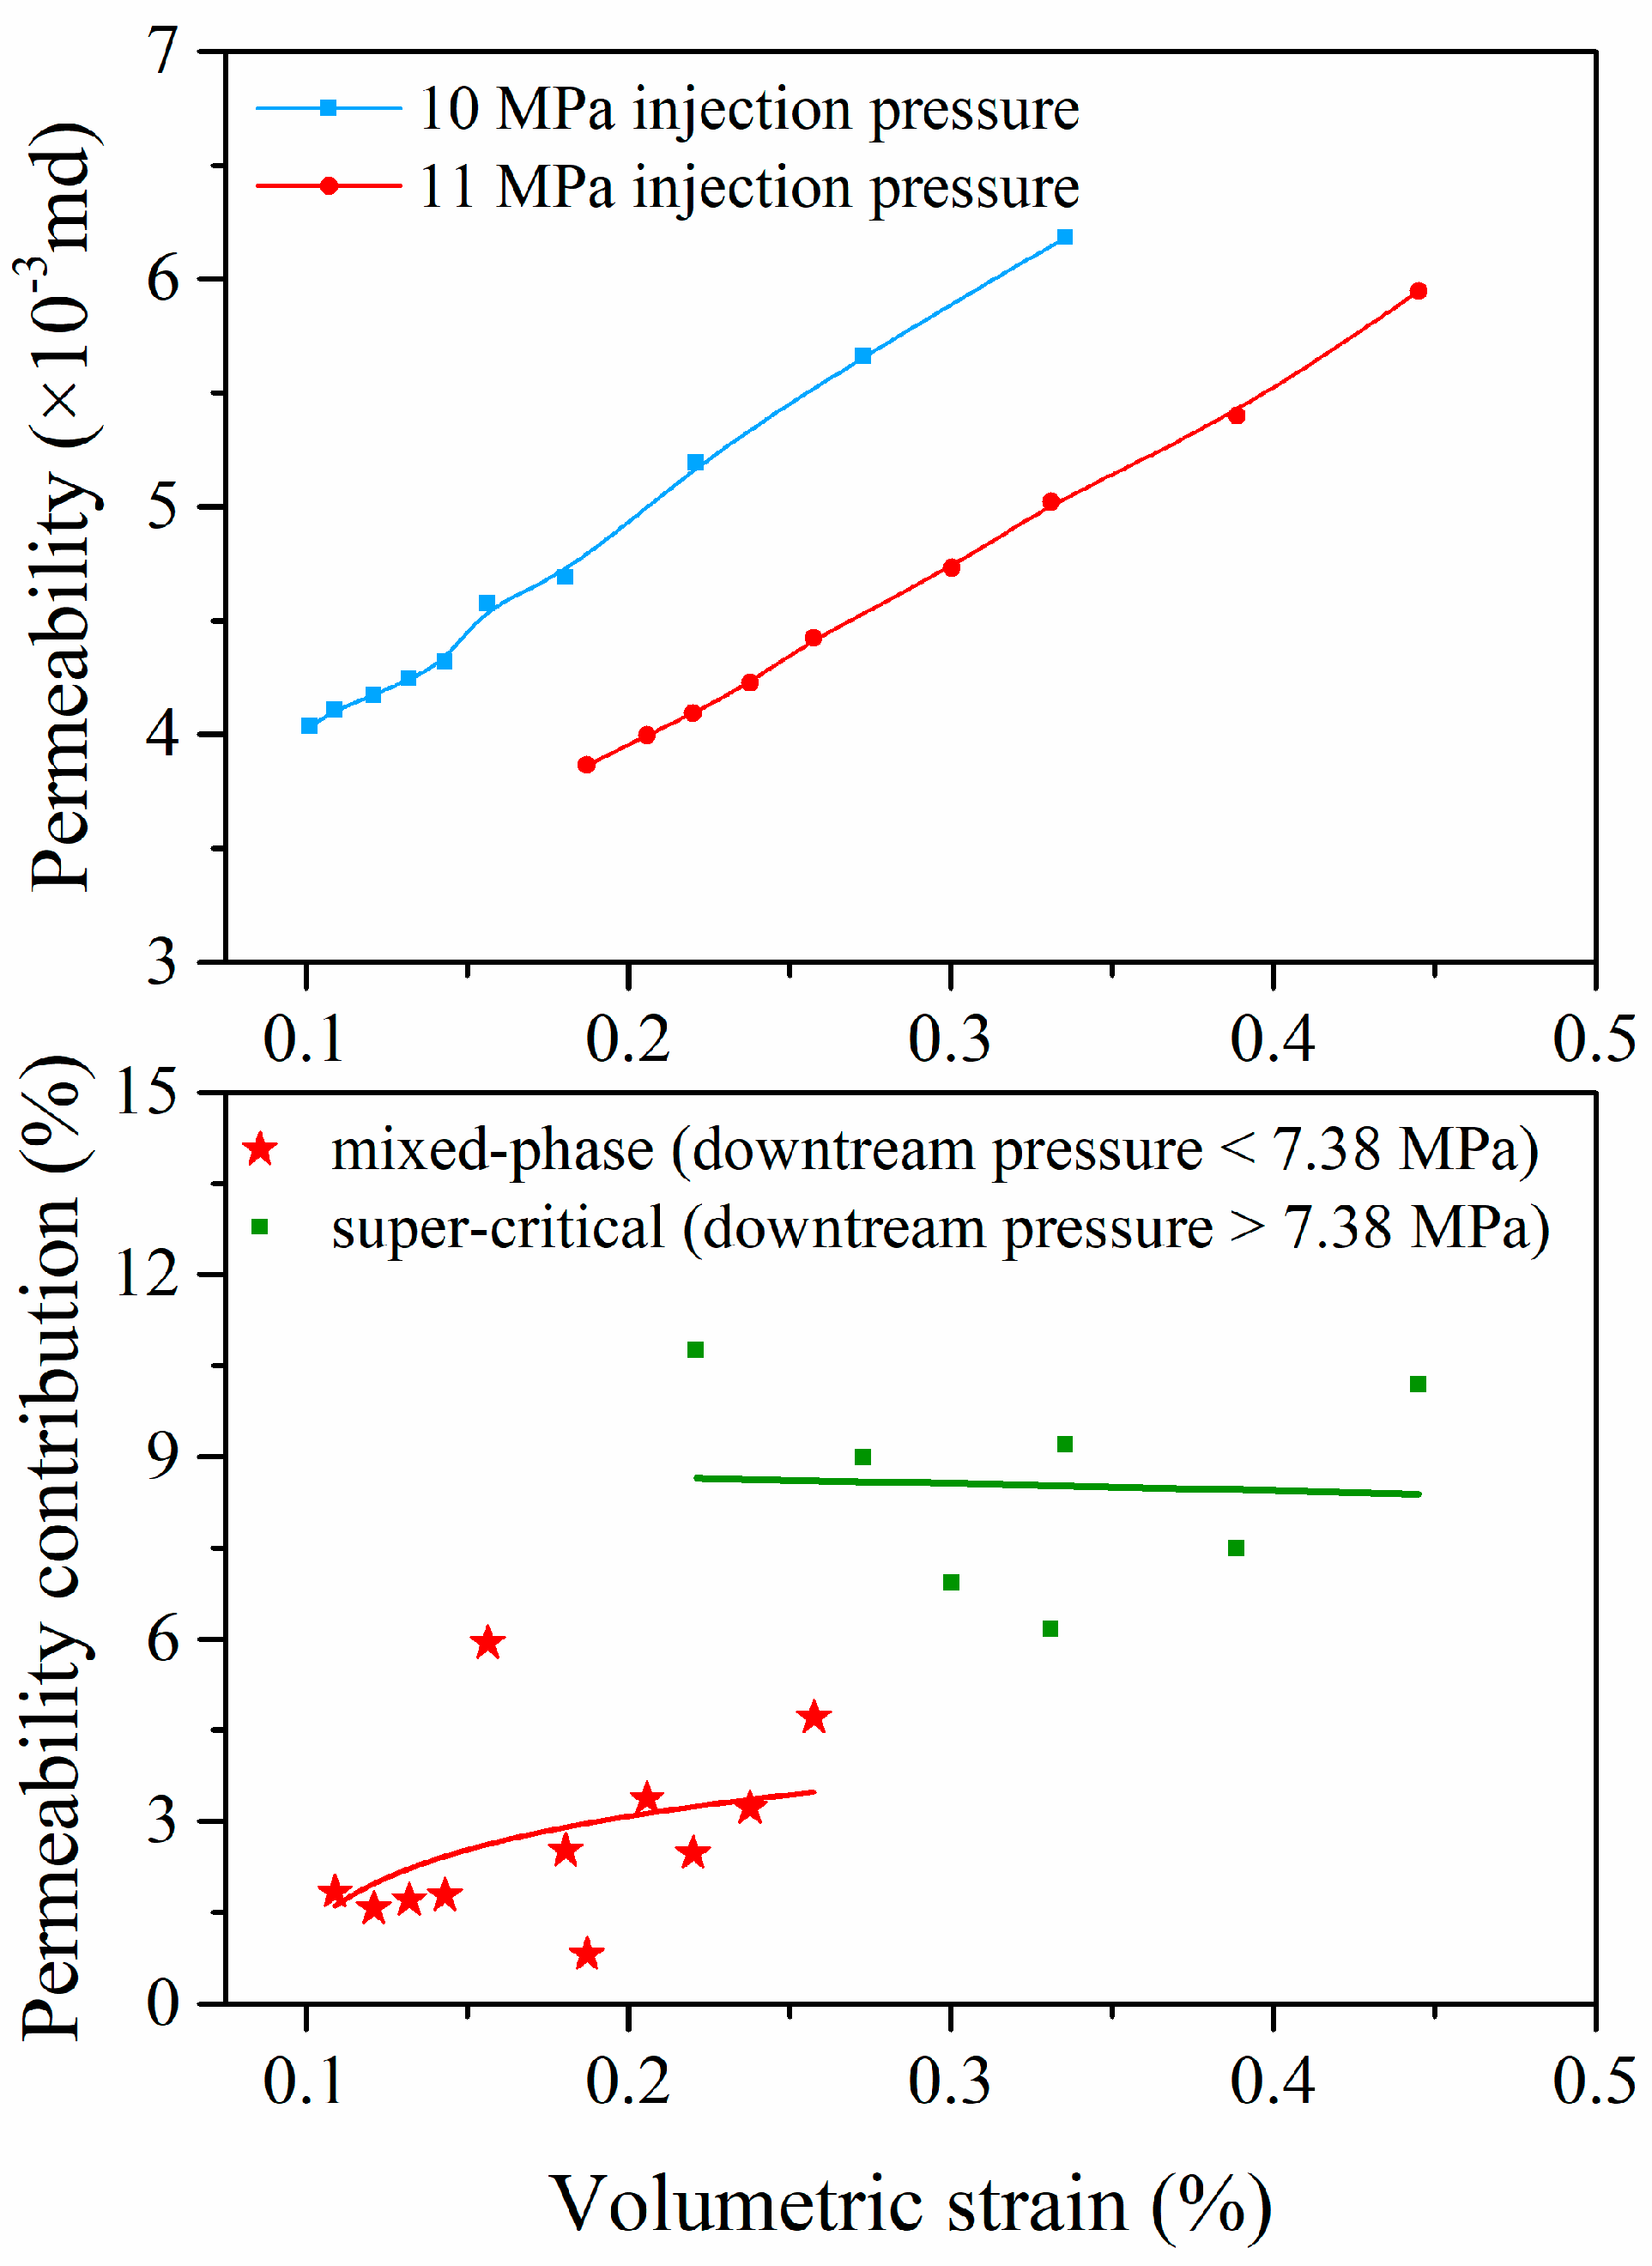
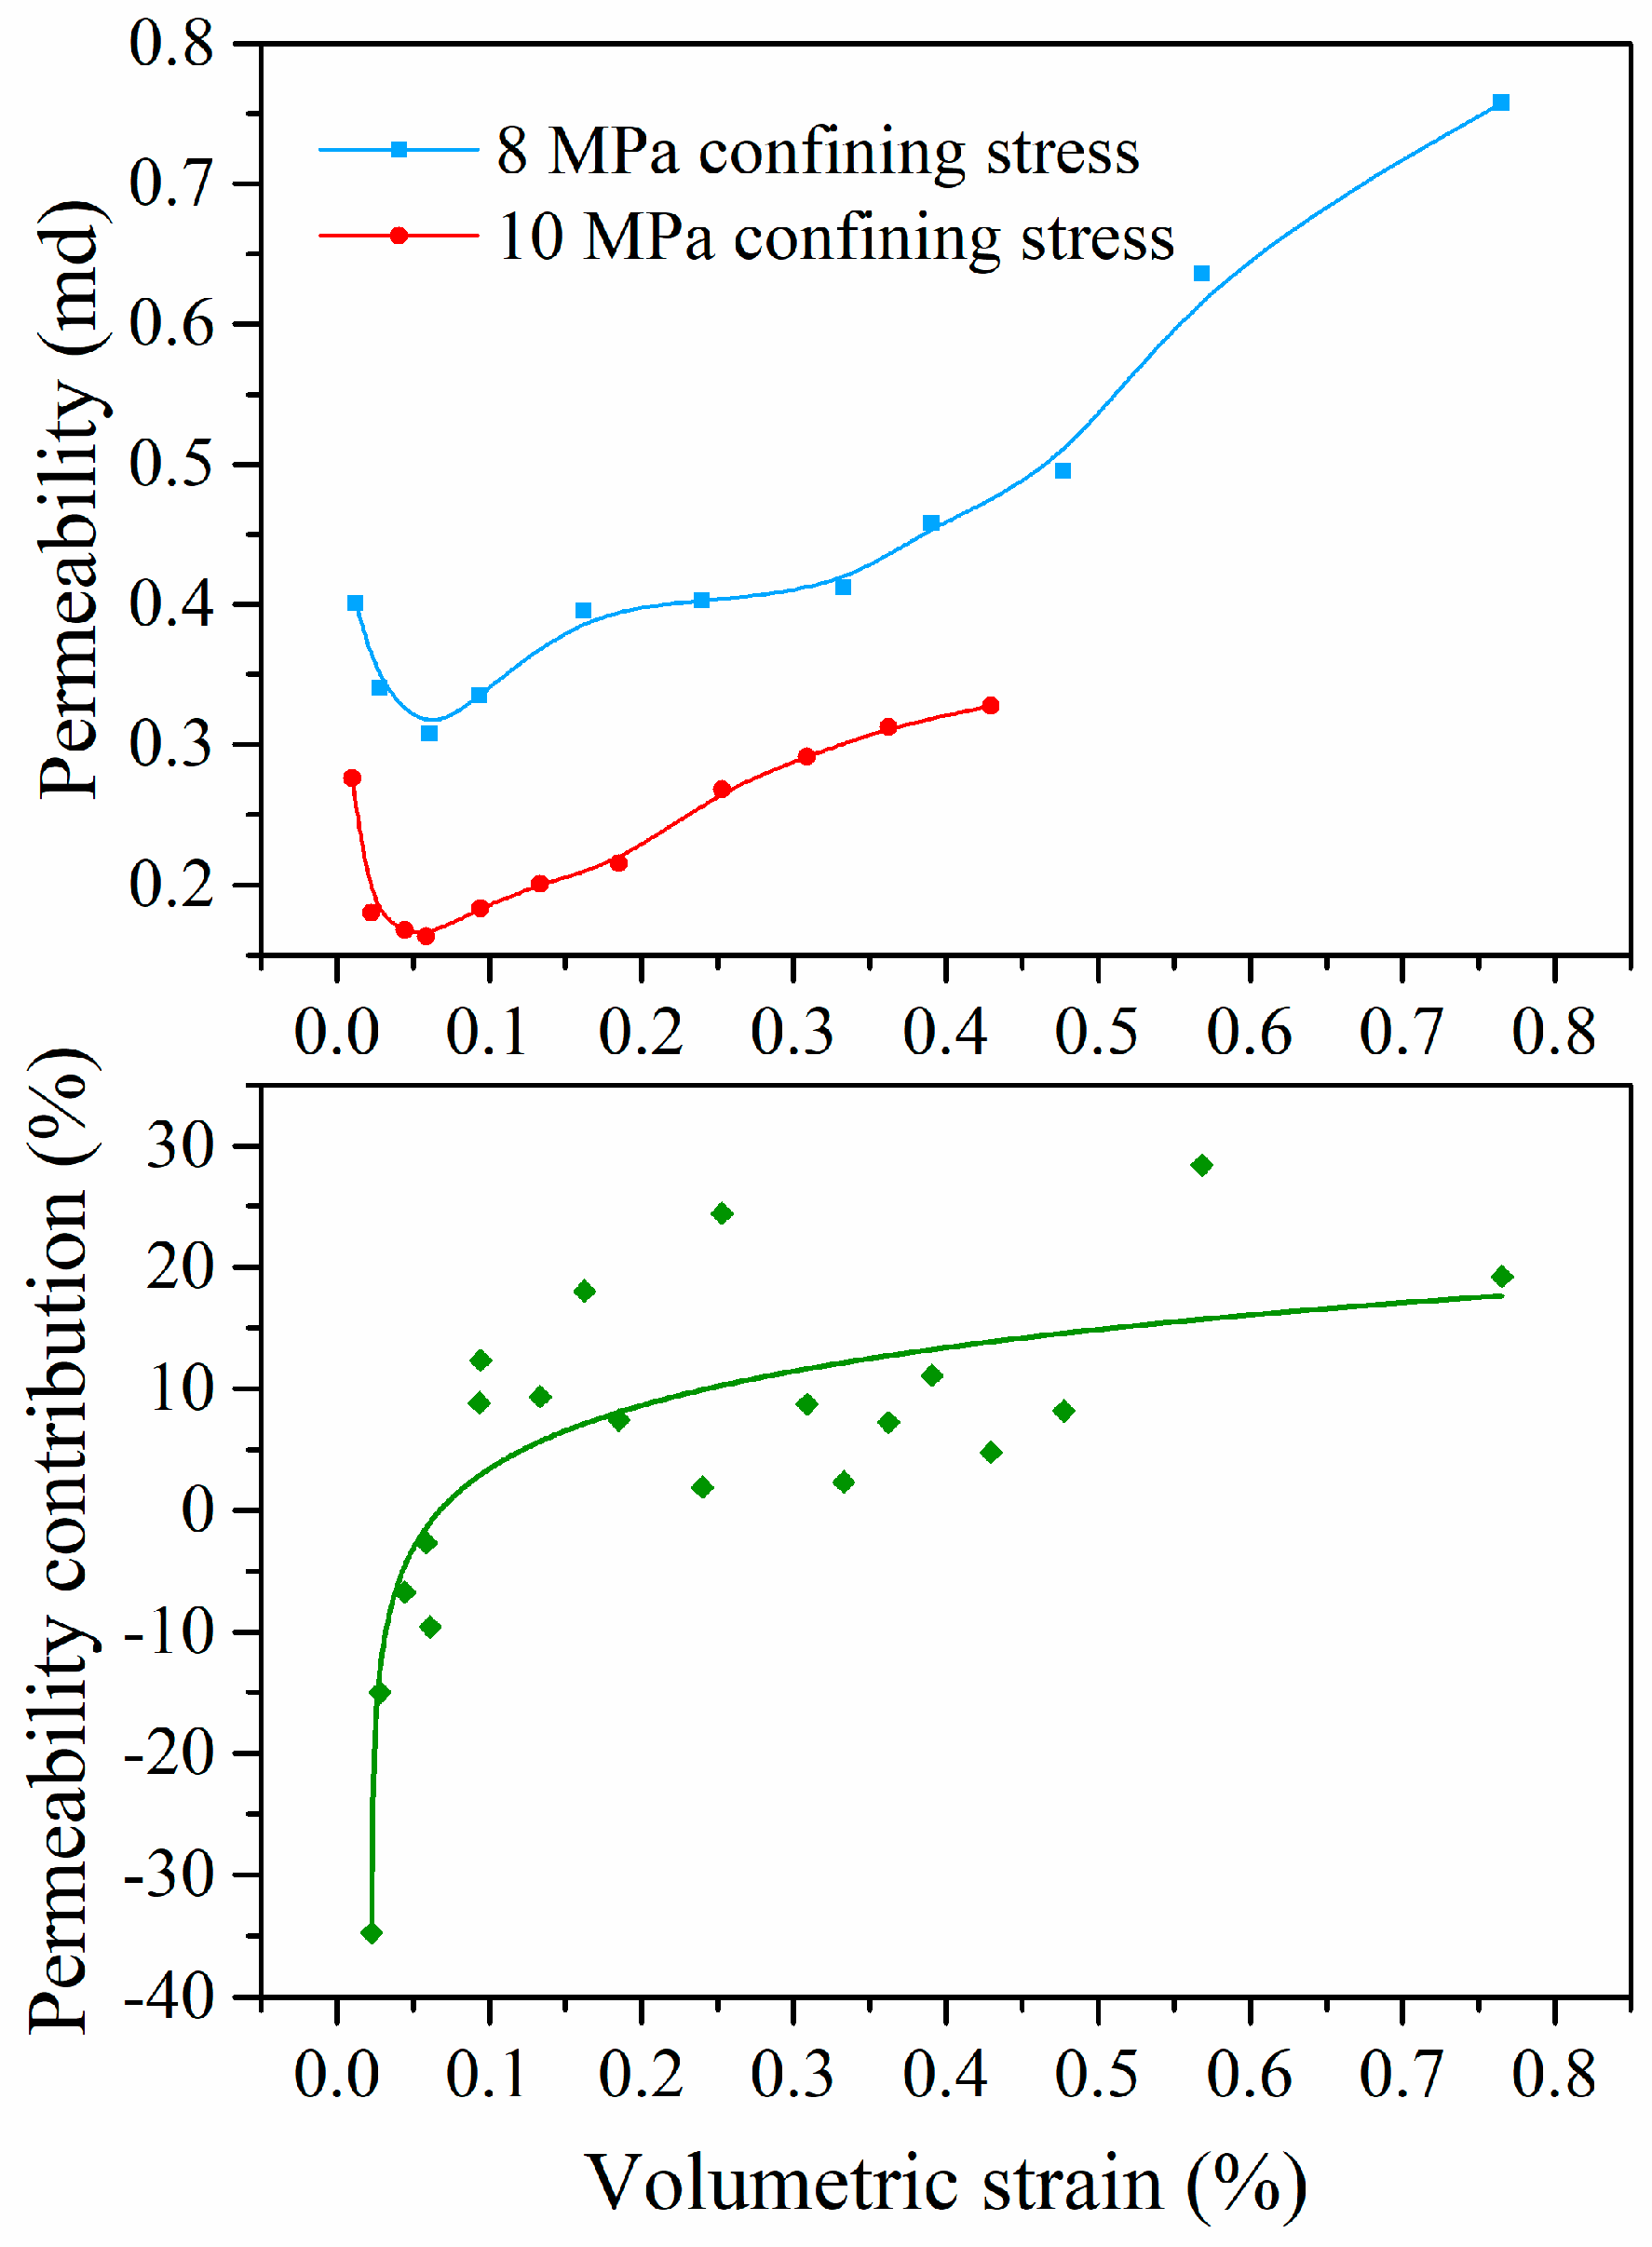
4.3. Effects of Coal Deformation on Permeability

Under in situ conditions, the volumetric strain caused by the adsorption-induced matrix swelling tends to narrow the flow path, which resulted in the decline of permeability. On the contrary, the volumetric strain due to the increase of the pore pressure and reduction of effective stress contributes to fracture (cleat) apertures and, thus, enhances coal permeability [39,57]. To evaluate the coupling effects of the adsorption-induced strain and effective stress on coal permeability, the contribution of volumetric strain to permeability was established, which is named by the permeability contribution (Equation (22)).
η = K n + 1 K n K n
where η is the permeability contribution, K n is the permeability at the given injection pressure, and K n + 1 is the permeability at the next given injection pressure.
The permeability contribution is minus, which indicates that adsorption-induced swelling is dominant and volumetric strain has a detrimental effect on permeability, while the contribution is positive, which means effective stress plays a more important role and the volumetric strain contributes to the permeability.
As discussed earlier, the volumetric strain increased fast at the initial CO2 injection. As shown in Figure 10, the adsorption-induced strain is 1.19% and 1.58%, respectively, at 1.9 MPa and 2.9 MPa adsorption pressure, about 59% to 78% of the volumetric strain at 6 MPa. The initial matrix swelling closed some fractures and cleats and narrowed the flow path, which results in a predominant decrease of permeability before 2.5 MPa injection pressure. Therefore, the permeability contribution is minus at the initial sub-critical CO2 injection (Figure 14). After that, the increase rate of adsorption-induced strain slowed down and the effective stress made more of a contribution to volumetric strain. Under 8 and 10 MPa confining stress, the volumetric strain at 3 MPa injection pressure is approximately 20% of that at 6 MPa injection pressure far away from 79% without confining stress. Since the effective stress mainly contributed to the volumetric strain after 3 MPa injection pressure, the sub-critical CO2 permeability increased with the volumetric strain after an initial decrease and the contribution of volumetric strain to coal permeability tended to become constant, which stabilized at approximately 20%.
The other hypothesis for variations of sub-critical CO2 permeability is attributed to Klinkenberg’s effect, which is usually considered in the gas flow in porous media [58]. Previous research has presented that the Klinkenberg’s effect diminished with a progressive pore pressure [53]. At 1 MPa injection pressure (mean pore pressure in the coal sample is equal to 0.55 MPa) in this study, the mean free path of CO2 is about 18.5 nm, which is far less than the aperture of the coal cleats (3–40 μm) [59]. Thus, Klinkenberg’s effect is not considered for sub-critical CO2 injection.
For a super-critical CO2 injection, since there is no further adsorption-induced swelling observed after 10 MPa adsorption pressure (Figure 10), the volumetric strain increased mainly due to the reduction of effective stress. The progressive pore pressure makes the coal matrix shrink and the cleats dilate in width. As a result, the sup-critical CO2 permeability increased with volumetric strain and the permeability contribution was stable with fluctuating around 20% (Figure 15).
As for mixed-phase CO2, when the downstream pressure is below 7.38 MPa, both super-critical and sub-critical CO2 exists in the coal sample, which means adsorption-induced swelling still occurred. The permeability contribution of the mixed-phase CO2 is lower than that in a super critical state (Figure 16). When downstream pressure is over 7.38 MPa, the permeability contribution fluctuated around 10%. Since the minimum mean pore pressure is 5 MPa for a mixed-phase CO2 injection, the effective stress mainly contributed to the total volumetric strain. Therefore, permeability increased with the volumetric strain and an approximately linear relationship was observed.
To be noted, due to the effect of coal deformation and the anisotropy of coal structure, it is difficult to quantify the distribution of pore pressure in the coal sample. However, as discussed previously (Figure 6, Figure 7 and Figure 8), the linear relationship between the CO2 flow rate and the pressure difference shows that sub-critical, super-critical, and mixed-phase CO2 flow follow Darcy’s law regardless of the pressure difference and the specific pressure distribution in the coal sample.

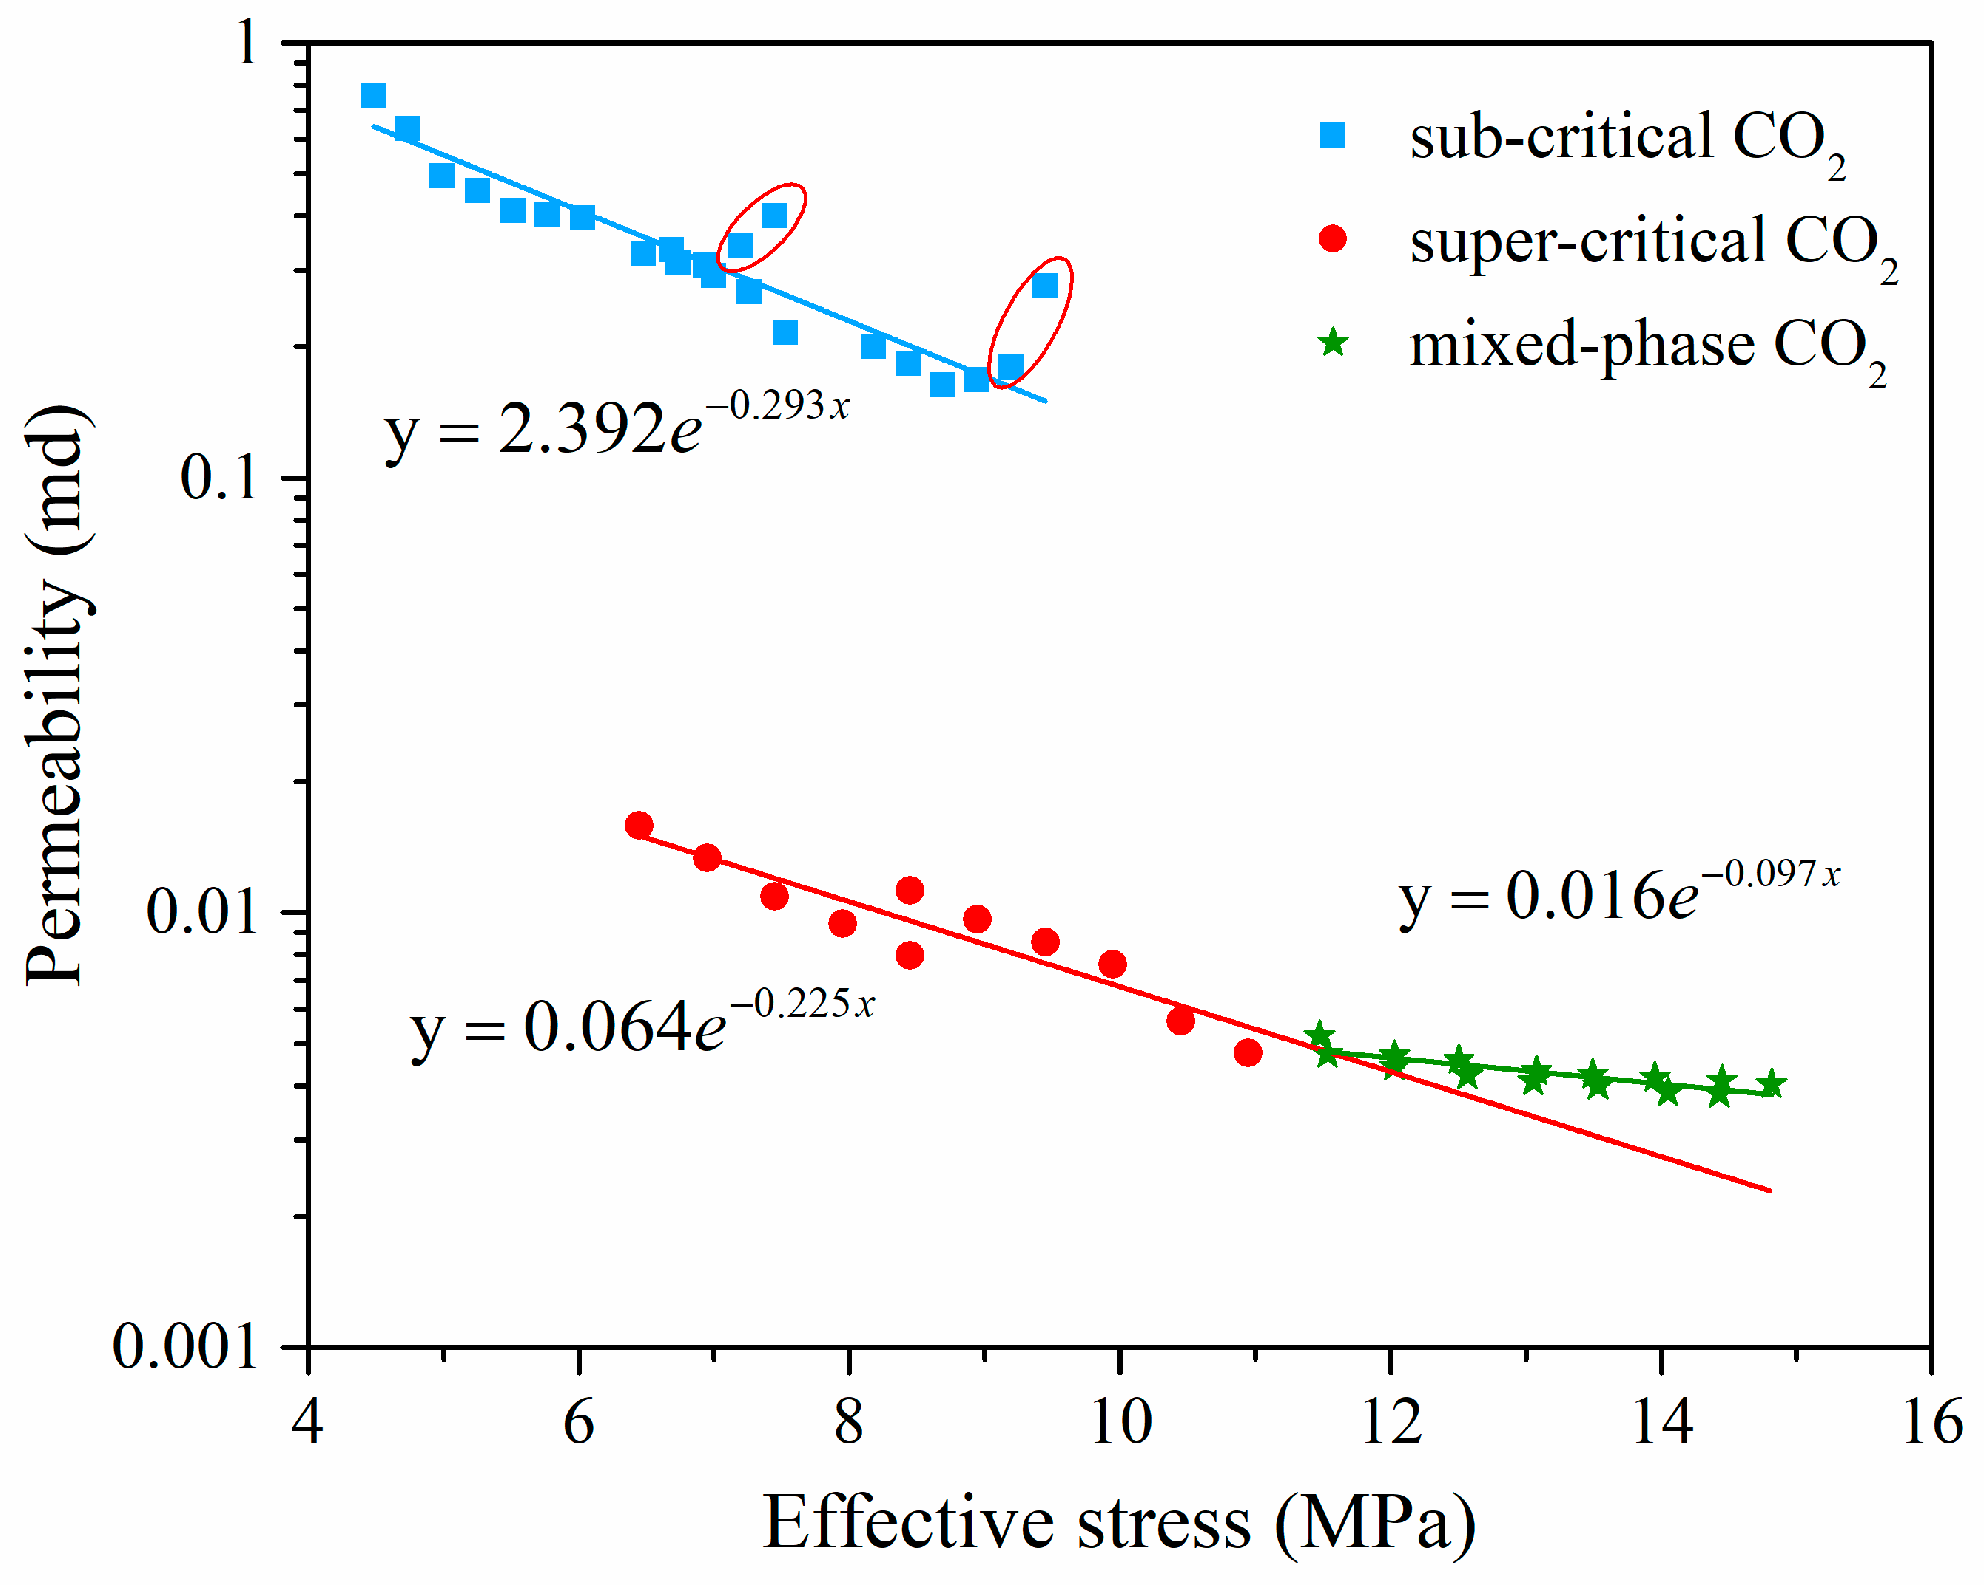
4.4. Effect of Effective Stress on Coal Permeability

As effective stress made more contribution to volumetric strain at a greater pore pressure, the influence mechanisms of effective stress on sub-critical, super-critical, and mixed-phase CO2 permeability were investigated. As mentioned earlier, effective stress also has a coefficient of deformation involved, which can be assumed to be unified to study the relation between permeability and effective stress [60,61,62]. According to Harpalani and Chen [63], the effective stress can be calculated by Equation (23).
σ e = P c P i + P o 2
where σ e is the effective stress, MPa, P c is the confining stress, MPa, P i is the injection pressure, MPa, and P o is the outlet pressure (atmospheric pressure in sub-critical condition, 8 MPa in super-critical condition in this study), MPa.
Figure 17 showed a general trend of exponential decline in CO2 permeability regardless of CO2 state. Interestingly, clusters of outliers, highlighted in red, were also observed and all these outliers occurred at an initial sub-critical CO2 injection. As discussed previously, the initial fast matrix swelling was dominant, which led to abnormal variation of permeability in these regions.
Super-critical CO2 permeability is less than one tenth of sub-critical CO2 permeability under the same effective stress while mixed-phase CO2 permeability is slightly higher than the super-critical CO2 permeability. As noted previously in Figure 10, the overall adsorption-induced swelling in super-critical condition is greater than that in the sub-critical condition, which leads to further shrinking of cleats in width. Meanwhile the viscosity of super-critical CO2 is higher than sub-critical CO2, which will make the migration of CO2 molecules slower [21]. The greater swelling and viscosity led to less CO2 permeability in the super critical condition. For mixed-phase CO2 flow, CO2 changed from a super critical state to a sub-critical state. Thus, mixed-phase CO2 permeability is just between the sub-critical and the super-critical CO2.

5. Conclusions

Several laboratory experiments were carried out to investigate the different influence mechanism of adsorption-induced strain and effective stress on sub-critical, super-critical, and mixed-phase CO2 permeability. A good linear relationship between a different-phase CO2 flow rate and a pore pressure gradient was obtained, which indicated that CO2 flow in coal follows the Darcy Law regardless of the CO2 state.
For sub-critical CO2, volumetric strain is mainly attributed to adsorption-induced swelling at the initial CO2 injection. The contribution of volumetric strain to permeability is minus and a temporary drop in permeability occurred. After that, effective stress became predominant and permeability increased with volumetric strain. When CO2 was changed to a super critical state, effective-stress-generated deformation became dominant over the adsorption-induced strain, which is mainly contributed to the volumetric strain. The contribution of volumetric strain to permeability stabilized at approximately 20% and a significant increase of permeability with the volumetric strain was observed. For mixed-phase CO2 injection, as both adsorption-induced swelling and effective stress existed, the contribution of volumetric strain to permeability is obviously lower than that in the super critical state. However, since effective stress is still dominant, mixed-phase CO2 permeability increased with the volumetric strain.
All permeabilities of different-phase CO2 showed a negative exponential decrease with progressive effective stress. Super-critical CO2 permeability is less than one tenth of sub-critical CO2 permeability under the same effective stress while mixed-phase CO2 permeability is slightly more than super critical CO2 permeability.

Author Contributions

Methodology, B.Z. and W.H.; investigation, B.Z. and Z.L.; resources, W.L. and X.Z.; writing—original draft preparation, B.Z.; writing—review and editing, W.L. and P.G.R.

Funding

This research was funded by the National Nature Science Foundation of China, grant number 51225404, Nature Science Foundation of Shanxi Province, grant number 2014011044-1, San-Jin scholar support project, grant number 2013, and the Shanxi Postgraduate Education Innovation Project, grant number 2017BY042.

Conflicts of Interest

The authors declare no conflict of interest.

References

  1. Perera, M.S.A. A Comprehensive Overview of CO2 Flow Behaviour in Deep Coal Seams. Energies 2018, 11, 906. [Google Scholar] [CrossRef]
  2. Razavi, S.M.R.; Marjani, A.; Shirazian, S. CO2 Capture from Gas Mixtures by Alkanol Amine Solutions in Porous Membranes. Transp. Porous Med. 2015, 106, 323–338. [Google Scholar] [CrossRef]
  3. Shi, J.; Mazumder, S.; Wolf, K.; Durucan, S. Competitive Methane Desorption by Supercritical CO2 Injection in Coal. Transp. Porous Med. 2008, 75, 35–54. [Google Scholar] [CrossRef]
  4. Li, W.; Liu, H.; Song, X. Influence of Fluid Exposure on Surface Chemistry and Pore-Fracture Morphology of Various Rank Coals: Implications for Methane Recovery and CO2 Storage. Energy Fuels 2018, 31, 12552–12569. [Google Scholar] [CrossRef]
  5. Gale, J.J. Using coal seams for CO2 sequestration. Geol. Belg. 2004, 7, 99–103. [Google Scholar]
  6. Perera, M.S.A.; Ranjith, P.G. Carbon dioxide sequestration effects on coal’s hydro-mechanical properties: A review. Int. J. Energy Res. 2012, 36, 1015–1031. [Google Scholar] [CrossRef]
  7. Reeves, S.R. Enhanced CBM recovery, coalbed CO2 sequestration assessed. Oil Gas J. 2003, 101, 49–53. [Google Scholar]
  8. Sing, K.S.W.; Everett, D.H.; Haul, R.W.; Moscou, L.; Pierotti, R.A.; Rouquerol, J.; Siemieniewska, T. Reporting physisorption data for gas/solid systems with special reference to the determination of surface area and porosity. Pure Appl. Chem. 1985, 57, 603. [Google Scholar] [CrossRef]
  9. Li, W.; Liu, H.; Song, X. Multifractal analysis of Hg pore size distributions of tectonically deformed coals. Int. J. Coal Geol. 2015, 144–145, 138–152. [Google Scholar] [CrossRef]
  10. Wang, S.; Elsworth, D.; Liu, J. Permeability evolution in fractured coal: The roles of fracture geometry and water content. Int. J. Coal Geol. 2011, 87, 13–25. [Google Scholar] [CrossRef]
  11. Ranathunga, A.S.; Perera, M.S.A.; Ranjith, P.G.; Zhang, X.G.; Wu, B. Super-critical carbon dioxide flow behaviour in low rank coal: A meso-scale experimental study. J. CO₂ Util. 2017, 20, 1–13. [Google Scholar] [CrossRef]
  12. Perera, M.S.A.; Ranjith, P.G.; Choi, S.K. Coal cleat permeability for gas movement under triaxial, non-zero lateral strain condition: A theoretical and experimental study. Fuel 2013, 109, 389–399. [Google Scholar] [CrossRef]
  13. Vishal, V.; Ranjith, P.G.; Singh, T.N. CO2 permeability of Indian bituminous coals: Implications for carbon sequestration. Int. J. Coal Geol. 2013, 105, 36–47. [Google Scholar] [CrossRef]
  14. Siriwardane, H.; Haljasmaa, I.; McLendon, R.; Irdi, G.; Soong, Y.; Bromhal, G. Influence of carbon dioxide on coal permeability determined by pressure transient methods. Int. J. Coal Geol. 2009, 77, 109–118. [Google Scholar] [CrossRef]
  15. Pan, Z.; Connell, L.D.; Camilleri, M. Laboratory characterisation of coal reservoir permeability for primary and enhanced coalbed methane recovery. Int. J. Coal Geol. 2010, 82, 252–261. [Google Scholar] [CrossRef]
  16. Durucan, S.; Ahsan, M.; Shi, J. Matrix shrinkage and swelling characteristics of European coals. Energy Procedia 2009, 1, 3055–3062. [Google Scholar] [CrossRef] [Green Version]
  17. Kiyama, T.; Nishimoto, S.; Fujioka, M.; Xue, Z.; Ishijima, Y.; Pan, Z.; Connell, L.D. Coal swelling strain and permeability change with injecting liquid/supercritical CO2 and N2 at stress-constrained conditions. Int. J. Coal Geol. 2011, 85, 56–64. [Google Scholar] [CrossRef]
  18. Wang, G.X.; Wei, X.R.; Wang, K.; Massarotto, P.; Rudolph, V. Sorption-induced swelling/shrinkage and permeability of coal under stressed adsorption/desorption conditions. Int. J. Coal Geol. 2010, 83, 46–54. [Google Scholar] [CrossRef]
  19. Liang, W.; Zhao, Y.; Wu, D.; Dusseault, M.B. Experiments on methane displacement by carbon dioxide in large coal specimens. Rock Mech. Rock Eng. 2011, 5, 579–589. [Google Scholar] [CrossRef]
  20. Holloway, S. Underground sequestration of carbon dioxide—A viable greenhouse gas mitigation option. Energy 2005, 30, 2318–2333. [Google Scholar] [CrossRef]
  21. Perera, M.S.A.; Ranjith, P.G.; Airey, D.W.; Choi, S.K. Sub- and super-critical carbon dioxide flow behavior in naturally fractured black coal: An experimental study. Fuel 2011, 90, 3390–3397. [Google Scholar] [CrossRef]
  22. Ranathunga, A.S.; Perera, M.S.A.; Ranjith, P.G.; Ju, Y.; Vishal, V.; De Silva, P.N.K. A macro-scale experimental study of sub-and super-critical CO2 flow behaviour in Victorian brown coal. Fuel 2015, 158, 864–873. [Google Scholar] [CrossRef]
  23. Krooss, B.M.; Van Bergen, F.; Gensterblum, Y.; Siemons, N.; Pagnier, H.J.M.; David, P. High-pressure methane and carbon dioxide adsorption on dry and moisture-equilibrated Pennsylvanian coals. Int. J. Coal Geol. 2002, 51, 69–92. [Google Scholar] [CrossRef]
  24. Perera, M.S.A.; Ranjith, P.G.; Choi, S.K.; Bouazza, A.; Kodikara, J.; Airey, D. A review of coal properties pertinent to carbon dioxide sequestration in coal seams: With special reference to Victorian brown coals. Environ. Earth Sci. 2011, 64, 223–235. [Google Scholar] [CrossRef]
  25. Lyu, Q.; Long, X.; Ranjith, P.G.; Kang, Y. Unconventional gas: Experimental study of the influence of subcritical carbon dioxide on the mechanical properties of black shale. Energies 2016, 9, 516. [Google Scholar] [CrossRef]
  26. Liu, J.; Chen, Z.; Elsworth, D.; Miao, X.; Mao, X. Evaluation of stress-controlled coal swelling processes. Int. J. Coal Geol. 2010, 83, 446–455. [Google Scholar] [CrossRef]
  27. Zhang, Y.; Xu, X.; Lebedev, M.; Sarmadivaleh, M.; Barifcani, A.; Iglauer, S. Multi-scale X-ray computed tomography analysis of coal microstructure and permeability changes as a function of effective stress. Int. J. Coal Geol. 2016, 165, 149–156. [Google Scholar] [CrossRef]
  28. Durucan, S.; Edwards, J.S. The effects of stress and fracture on permeability of coal. Min. Sci. Technol. 1986, 3, 205–216. [Google Scholar] [CrossRef]
  29. Xie, J.; Gao, M.; Yu, B.; Zhang, R.; Jin, W. Coal permeability model on the effect of gas extraction within effective influence zone. Geomech. Geophys. Geo-Energy Geo-Resour. 2015, 1, 15–27. [Google Scholar] [CrossRef] [Green Version]
  30. Robertson, E.P.; Christiansen, R.L. Measurement of sorption induced strain. In Proceedings of the 2005 International Coalbed Methane Symposium, Tuscaloosa, AL, USA, 17–19 May 2005. [Google Scholar]
  31. Wang, S.; Elsworth, D.; Liu, J. Evolution of permeability in coal to sorbing gases: A Preliminary Study. In Proceedings of the 44th U.S. Rock Mechanics Symposium, Salt Lake City, UT, USA, 27–30 June 2010. [Google Scholar]
  32. Ranathunga, A.S.; Perera, M.S.A.; Ranjith, P.G.; Wei, C.H. An experimental investigation of applicability of CO2 enhanced coal bed methane recovery to low rank coal. Fuel 2017, 189, 391–399. [Google Scholar] [CrossRef]
  33. Goodman, A.L.; Busch, A.; Duffy, G.J.; Fitzgerald, J.E.; Gasem, K.A.M.; Gensterblum, Y.; Krooss, B.M.; Levy, J.; Ozdemir, E.; Pan, Z.; et al. An Inter-laboratory Comparison of CO2 Isotherms Measured on Argonne Premium Coal Samples. Energy Fuels 2004, 18, 1175–1182. [Google Scholar] [CrossRef]
  34. Zhang, D.; Cui, Y.; Liu, B.; Li, S.; Song, W.; Lin, W. Supercritical Pure Methane and CO2 Adsorption on Various Rank Coals of China: Experiments and Modeling. Energy Fuels 2011, 25, 1891–1899. [Google Scholar] [CrossRef]
  35. Span, R.; Wagner, W. A New Equation of State for Carbon Dioxide Covering the Fluid Region from the Triple Point Temperature to 1100 K at Pressures up to 800 MPa. JPCRD 1996, 25, 1509–1596. [Google Scholar] [CrossRef]
  36. Darcy, H. Les Fontaines Publiques de la Ville de Dijon; Dalmont: Paris, France, 1856. [Google Scholar]
  37. Cheng, L.; Ribatski, G.; Wojtan, L.; Thome, J.R. New flow boiling heat transfer model and flow pattern map for carbon dioxide evaporating inside horizontal tubes. Int. J. Heat Mass Transf. 2006, 49, 4082–4094. [Google Scholar] [CrossRef]
  38. Liu, H.H.; Rutqvist, J. A new coal-permeability model: Internal swelling stress and fracture–matrix interaction. Transp. Porous Med. 2010, 82, 157–171. [Google Scholar] [CrossRef]
  39. Zhu, W.C.; Wei, C.H.; Liu, J.; Xu, T.; Elsworth, D. Impact of Gas Adsorption Induced Coal Matrix Damage on the Evolution of Coal Permeability. Rock Mech. Rock Eng. 2013, 46, 1353–1366. [Google Scholar] [CrossRef]
  40. Larsen, J.W. The effects of dissolved CO2 on coal structure and properties. Int. J. Coal Geol. 2004, 57, 63–70. [Google Scholar] [CrossRef]
  41. Karacan, C.Ö. Heterogeneous sorption and swelling in a confined and stressed coal during CO2 injection. Energy Fuels 2003, 17, 1595–1608. [Google Scholar] [CrossRef]
  42. Brenner, D. The macromolecular nature of bituminous coal. Fuel 1985, 64, 167–173. [Google Scholar] [CrossRef]
  43. Pan, Z.; Connell, L.D. A theoretical model for gas adsorption-induced coal swelling. Int. J. Coal Geol. 2007, 69, 243–252. [Google Scholar] [CrossRef]
  44. Scherer, G.W. Dilation of porous glass. J. Am. Ceram. Soc. 1986, 69, 473–480. [Google Scholar] [CrossRef]
  45. Goodman, R.E. Introduction to Rock Mechanics; JohnWiley & Sons: New York, NY, USA, 1980; p. 173. [Google Scholar]
  46. Day, S.; Fry, R.; Sakurovs, R. Swelling of Australian coals in supercritical CO2. Int. J. Coal Geol. 2008, 74, 41–52. [Google Scholar] [CrossRef]
  47. Sircar, S. Gibbsian Surface Excess for Gas Adsorption Revisited. Ind. Eng. Chem. Res. 1999, 38, 3670–3682. [Google Scholar] [CrossRef]
  48. Moffat, D.H.; Weale, K.E. Sorption by coal of methane at high pressures. Fuel 1955, 34, 449–462. [Google Scholar]
  49. Busch, A.; Alles, S.; Gensterblum, Y.; Prinz, D.; Dewhurst, D.N.; Raven, M.D.; Stanjek, H.; Krooss, B.M. Carbon dioxide storage potential of shales. Int. J. Greenh. Gas Control 2008, 2, 297–308. [Google Scholar] [CrossRef]
  50. Costanzo, P.A.; Guggenheim, S. Baseline studies of the clay minerals society source clays. Clays Clay Miner. 2001, 49, 371. [Google Scholar] [CrossRef]
  51. Lyu, Q.; Long, X.; Ranjith, P.G.; Tan, J.; Kang, Y. Experimental investigation on the mechanical behaviours of a low-clay shale under water-based fluids. Eng. Geol. 2018, 233, 124–138. [Google Scholar] [CrossRef]
  52. Biot, M.A. General theory of three-dimensional consolidation. J. Appl. Phys. 1941, 12, 155–164. [Google Scholar] [CrossRef]
  53. Chen, Z.; Pan, Z.; Liu, J.; Connell, L.D.; Elsworth, D. Effect of the effective stress coefficient and sorption-induced strain on the evolution of coal permeability: Experimental observations. Int. J. Greenh. Gas Control 2011, 5, 1284–1293. [Google Scholar] [CrossRef]
  54. Zhao, Y.; Hu, Y.; Wei, J.; Yang, D. The experimental approach to effective stress law of coal mass by effect of methane. Transp. Porous Med. 2003, 53, 235–244. [Google Scholar]
  55. Zhao, Y.; Hu, Y.; Zhao, B.; Yang, D. Nonlinear coupled mathematical model for solid deformation and gas seepage in fractured media. Transp. Porous Med. 2004, 55, 119–136. [Google Scholar] [CrossRef]
  56. Pan, Z.; Connell, L.D. Modelling permeability for coal reservoirs: A review of analytical models and testing data. Int. J. Coal Geol. 2012, 92, 1–44. [Google Scholar] [CrossRef]
  57. Izadi, G.; Wang, S.G.; Elsworth, D.; Liu, J.; Wu, Y.; Pone, D. Permeability evolution of fluid-infiltrated coal containing discrete fractures. Int. J. Coal Geol. 2011, 85, 202–211. [Google Scholar] [CrossRef]
  58. Klinkenberg, L.J. The permeability of porous media to liquids and gases. In Drilling and Production Practice; American Petroleum Institute: New York, NY, USA, 1 January 1941. [Google Scholar]
  59. Laubach, S.E.; Marrett, R.A.; Olson, J.E.; Scott, A.R. Characteristics and origins of coal cleat: A review. Int. J. Coal Geol. 1998, 35, 175–207. [Google Scholar] [CrossRef]
  60. Ranjith, P.G.; Perera, M.S.A. A new triaxial apparatus to study the mechanical and fluid flow aspects of carbon dioxide sequestration in geological formations. Fuel 2011, 90, 2751–2759. [Google Scholar] [CrossRef]
  61. Ranathunga, A.S.; Perera, M.S.A.; Ranjith, P.G.; Silva, G.P.D.D. A macro-scale view of the influence of effective stress on carbon dioxide flow behaviour in coal: An experimental study. Geomech. Geophys. Geo-Energy Geo-Resour. 2017, 3, 13–28. [Google Scholar] [CrossRef]
  62. Lyu, Q.; Long, X.; Ranjith, P.G.; Tan, J.; Kang, Y.; Wang, Z. Experimental investigation on the mechanical properties of a low-clay shale with different adsorption times in sub-/super-critical CO2. Energy 2018, 147, 1288–1298. [Google Scholar] [CrossRef]
  63. Harpalani, S.; Chen, G. Influence of gas production induced volumetric strain on permeability of coal. Geotech. Geol. Eng. 1997, 15, 303–325. [Google Scholar] [CrossRef]
Figure 1. The geological map of Datong coalfield.
Energies 11 02926 g001
Figure 2. 100 × 100 × 200 mm coal sample for permeability tests. (a) Side view of the sample. (b) Top view of the sample.
Energies 11 02926 g002
Figure 3. 50 × 50 × 100 mm coal sample for the adsorption test.
Energies 11 02926 g003
Figure 4. Schematic diagram of the Supercritical CO2 Permeability Testing apparatus.
Energies 11 02926 g004
Figure 5. Schematic diagram of CO2 adsorption experimental apparatus.
Energies 11 02926 g005
Figure 6. Sub-critical CO2 flow behavior and permeability variation at 8 and 10 MPa confining pressures.
Energies 11 02926 g006
Figure 7. Super-critical CO2 flow behavior and permeability variation at 18 and 20 MPa confining pressures.
Energies 11 02926 g007
Figure 8. Mixed-phase CO2 flow behavior and permeability variation at 20 MPa confining pressures.
Energies 11 02926 g008
Figure 9. The absolute adsorption isotherm and the excess adsorption isotherm of CO2 at 50 °C.
Energies 11 02926 g009
Figure 10. The adsorption-induced strain versus the pore pressure at 50 °C.
Energies 11 02926 g010
Figure 11. Variation of the volumetric strain versus the mean pore pressure (the mean of upstream and downstream pressures) of sub-critical CO2 at 8 and 10 MPa confining pressures.
Energies 11 02926 g011
Figure 12. Variation of the volumetric strain versus the mean pore pressure (the mean of upstream and downstream pressures) of super critical CO2 at 18 and 20 MPa confining pressures.
Energies 11 02926 g012
Figure 13. Variation of the volumetric strain versus the mean pore pressure (the mean of upstream and downstream pressures) of mixed-phase CO2 at 20 MPa confining pressures.
Energies 11 02926 g013
Figure 14. Sub-critical CO2 permeability and permeability contribution versus the volumetric strain.
Energies 11 02926 g014
Figure 15. Sup-critical CO2 permeability and permeability contribution versus the volumetric strain.
Energies 11 02926 g015
Figure 16. Mixed-phase CO2 permeability and permeability contribution versus the volumetric strain.
Energies 11 02926 g016
Figure 17. Influence of effective stress on sub-critical, super-critical, and mixed-phase CO2 permeability.
Energies 11 02926 g017
Table 1. Permeability of natural coal samples in the previous study.
RankCountryGasConfining Pressure (MPa)Gas Pressure (MPa)Sample Size (mm)Permeability (μm2)Refs.
AnthraciteAmericaHe, CH4, CO26–121–6φ25 × 46.710−10–10−6Wang et al. [10]
Brown coal AustraliaN2, CO211–176–14φ38 × 7610−9–10−7Ranathunga et al. [11]
BituminousAustraliaN2, CO25–202–9φ38 × 7610−7–10−6Perera et al. [12]
BituminousIndiaCO25–131–5φ39 × 7610−7–10−5Vishal et al. [13]
BituminousAmericaAr, CO27–204–10φ37.45~50.4 × 19.15~80.110−6–10−3Siriwardane et al. [14]
BituminousAustraliaCH4, CO2201–13φ45 × 105.510−4–10−3Pan et al. [15]
Bituminous, semi-anthraciteFrance, GermanyCH4, CO27near 0–3.5φ5010−6–10−4Sevket et al. [16]
BituminousJapanN2, CO22–120.1–11φ50 × 12510−6–10−3Kiyama et al. [17]
BituminousAustraliaCH4, CO23.1–4.50.4–280 × 80 × 8010−3Wang et al. [18]
BituminousChinaCH4, CO21.0–5.50.5–2100 × 100 × 20010−4–10−2Liang et al. [19]
Table 2. The proximate analysis of the coal sample (%).
Coal RankRo,maxMaceral Groups (Volume, %)Mineral (Volume, %)Proximate Analysis (%)
VitriniteInertiniteLiptiniteMoistureAsh YieldVolatile MatterClayPyriteCarbonate
Sub-bituminous0.4646.948.84.36.2317.3224.684.30.44.1
Table 3. Procedure of sub-critical and super-critical CO2 permeability test.
CO2 PhaseConfining Stress (MPa)Temperature (°C)Injection Pressure (MPa)Downstream Pressure (MPa)
Sub-critical condition85011.522.533.544.555.560.1
105011.522.533.544.555.560.1
Super-critical condition18501011121314158
20501011121314158
Table 4. Procedure of mixed-phase CO2 permeability test.
CO2 PhaseConfining Stress (MPa)Temperature (°C)Injection Pressure (MPa)Downstream Pressure (MPa)
Sub-critical and super-critical2050100.1123456789
2050110.112345678910
Table 5. Pressure difference of different-phase CO2 injection (Injection pressure minus downstream pressure).
CO2 PhasePressure Difference (MPa)
Sub-critical a0.91.41.92.42.93.43.94.44.95.45.9
Super-critical b234567
Mixed-phase c9.9987654321
Mixed-phase d10.910987654321
a, 8 and 10 MPa confining stress; b, 18 and 20 MPa confining stress; c, 10 MPa injection pressure, d, 11 MPa injection pressure.

