Risk Assessment of Failure of Outdoor High Voltage Polluted Insulators under Combined Stresses Near Shoreline


1
School of Engineering and Built Environment, Glasgow Caledonian University, Glasgow G4 0BA, UK
2
Department of Applied Sciences, University of Quebec at Chicoutimi, Saguenay, QC G7H 2B1, Canada
*
Author to whom correspondence should be addressed.
Energies 2017, 10(10), 1661; https://doi.org/10.3390/en10101661
Submission received: 11 September 2017
/
Revised: 14 October 2017
/
Accepted: 16 October 2017
/
Published: 20 October 2017
Abstract
:The aim of this paper is to investigate the various effects of climate conditions on outdoor insulators in coastal areas as a result of saline contamination under acidic and normal cold fog, determining significant electrical and physico-chemical changes on the insulator surface and considering the effect of discharge current, electric field distribution and surface roughness. To replicate similar conditions near the shoreline, experimental investigations have been carried out on insulation materials with the combined application of saline contamination and acidic or normal cold fog. The test samples included silicone rubber (SiR), ethylene propylene diene monomer (EPDM) and high-density polyethylene (HDPE), which were used as reference. The materials are of the same composition as those used in real-life outdoor high voltage insulators. All samples were aged separately in an environmental chamber for 150 h for various saline contaminations combined with acidic and normal cold fog, and were generated by means of the adopted experimental setup. This analysis represented conditions similar to those existing near the shoreline exposed to saline and acid spray during winter and early spring. Electric field and discharge current along polymeric samples were examined under acidic and normal cold fog. Fourier transform infrared (FTIR) spectroscopy and scanning electron microscopic (SEM) were used to probe the physico-chemical changes on the samples surface and investigate the hydrophobicity recovery property after aging tests. Finally, a comparative study was carried out on polymeric samples before and after being exposed to the acidic and normal cold fog based on the results obtained from the experiment. Research data may provide references for the better prediction of surface degradation as well as for the better material coating and design of external insulation.
1. Introduction
The word “failure” for in-service outdoor insulators signifies unexpected unsatisfactory behaviour, leading to non-functioning of desired operations within the design life period. Such action is often referred to as “premature failure”. Outdoor insulator and substation equipment become worse when contaminated as a result of atmospheric pollution caused by, for example, saline, dust and ash [1]. Atmospheric contamination and adherence to outdoor high voltage insulators and substation equipment can cause various problems such as erosion and surface degradation and even complete failure of the insulator [2,3,4]. The use of non-ceramic insulators increased significantly in last five decades. Polymeric insulators both in service [5] and high voltage laboratory tests [6] demonstrated better performance than ceramic insulators in contaminated environmental conditions. Initially, non-ceramic insulators prevent water filming on the surface due to their hydrophobic properties, but this resistance gradually decreases due to physical and chemical changes in the polymeric materials which can lead to dry band arcing and surface discharges [7,8]. The combination of high voltage stress and a contaminated water film produces dry-band arcing, and the resulting heat can lead to erosion of the insulator surface. A major and fundamental understanding of the factors that damage and degrade the insulator surface is therefore essential for mitigating these and for optimal design of outdoor insulators. Erosion and surface degradation phenomena of outdoor insulators and substation equipment actually relate to the two types of contamination deposit, namely wet and dry. Wet deposition is in the form of rainfall, drizzle, fog, snow and ice, while dry deposition appears in the form of dust, ash, saline, etc. In addition, several factors related to insulator energisation conditions affect the performance of outdoor high voltage insulators and substation equipment near the shoreline, including environmental stresses such as wind, cold fog (acidic or clean form) and saline contamination [9,10,11]. The erosion effect of acidic rain or fog is well known. Environmental contamination has become much more severe and has a significant negative impact on the performance of outdoor insulators with the development of industrialisation and increased emission of carbon dioxide in the air. According to some studies, acidic fog and rain tend to increase annually near the shoreline [12]. Thus, in recent years the influence of environmental stresses and acidic cold fog on outdoor insulators and substation equipment has triggered the interest of power engineers.
Sulphur dioxide (SO2), oxides of nitrogen (NO) and ammonia (NH3) are the main contaminants spewed out by factories and motor vehicles and are responsible for acidification in the atmosphere. On contact with fog and water, these gases can form sulphuric and nitric acid respectively. Fog and high levels of rainfall then wash a large amount of contaminant gases from the atmosphere, generating ‘‘acidic rain and fog’’ and adversely contaminating outdoor insulators. During acidic rain or fog, surface flashover voltage with such a high conductivity, can be almost two times lower than under normal rain or fog [13]. Extensive studies [14,15,16,17] have been conducted to understand the effects of acidic rain, but they are fairly limited as they consider acidic rain as the only influential factor for surface degradation. Moreno and Gorur [18,19] studied the surface degradation of the polymeric samples. It has been revealed that the severity of degradation increases with the relative humidity and the applied mechanical stresses. Further, physico-chemical analysis was performed by the authors and unfolded that the surface degradation is mainly due to the electro-chemical reactions rather than other mechanical stresses. It also has been observed by many other researchers that both the discharge phenomena and surface flashover under severe polluted environments are closely related to insulator performance which is affected by many factors, such as pollutants properties, humidity and other various environmental stresses. Therefore, the process and mechanism of surface degradation in polluted harsh environments are quite complex and still need more attention from researchers for further investigation [20,21]. In addition, in all these studies, the mechanism of and degree to which acidic cold fog with the combined application of saline contamination influence the performance of outdoor insulators and substation equipment remain unclear. Thus, more research is needed to investigate the influence of saline particles on the combined effects of acidic cold fog and its various contents on the premature failure of insulators.
In this paper, different types of insulation materials are used to evaluate their performance and their influence on the effect of various environmental and electrical stresses under acidic and clean cold fog conditions similar to those closer to the coastal area of the West of Scotland, and how they affect the premature failure of outdoor insulators. The tested insulators included silicone rubber (SiR), ethylene propylene diene monomer (EPDM) and high-density polyethylene (HDPE), which were used for reference. AC field meter, high frequency current transformer, scanning electron microscope (SEM) and Attenuated Total Reflection Fourier Transform Infrared (ATR FTIR) are used to investigate the impact of all these factors. Also, the relations between discharge current, electric field, acidity (pH) and conductivity of acidic fog on insulator surfaces are discussed to investigate the mechanisms behind insulator failure.
2. Test Arrangement
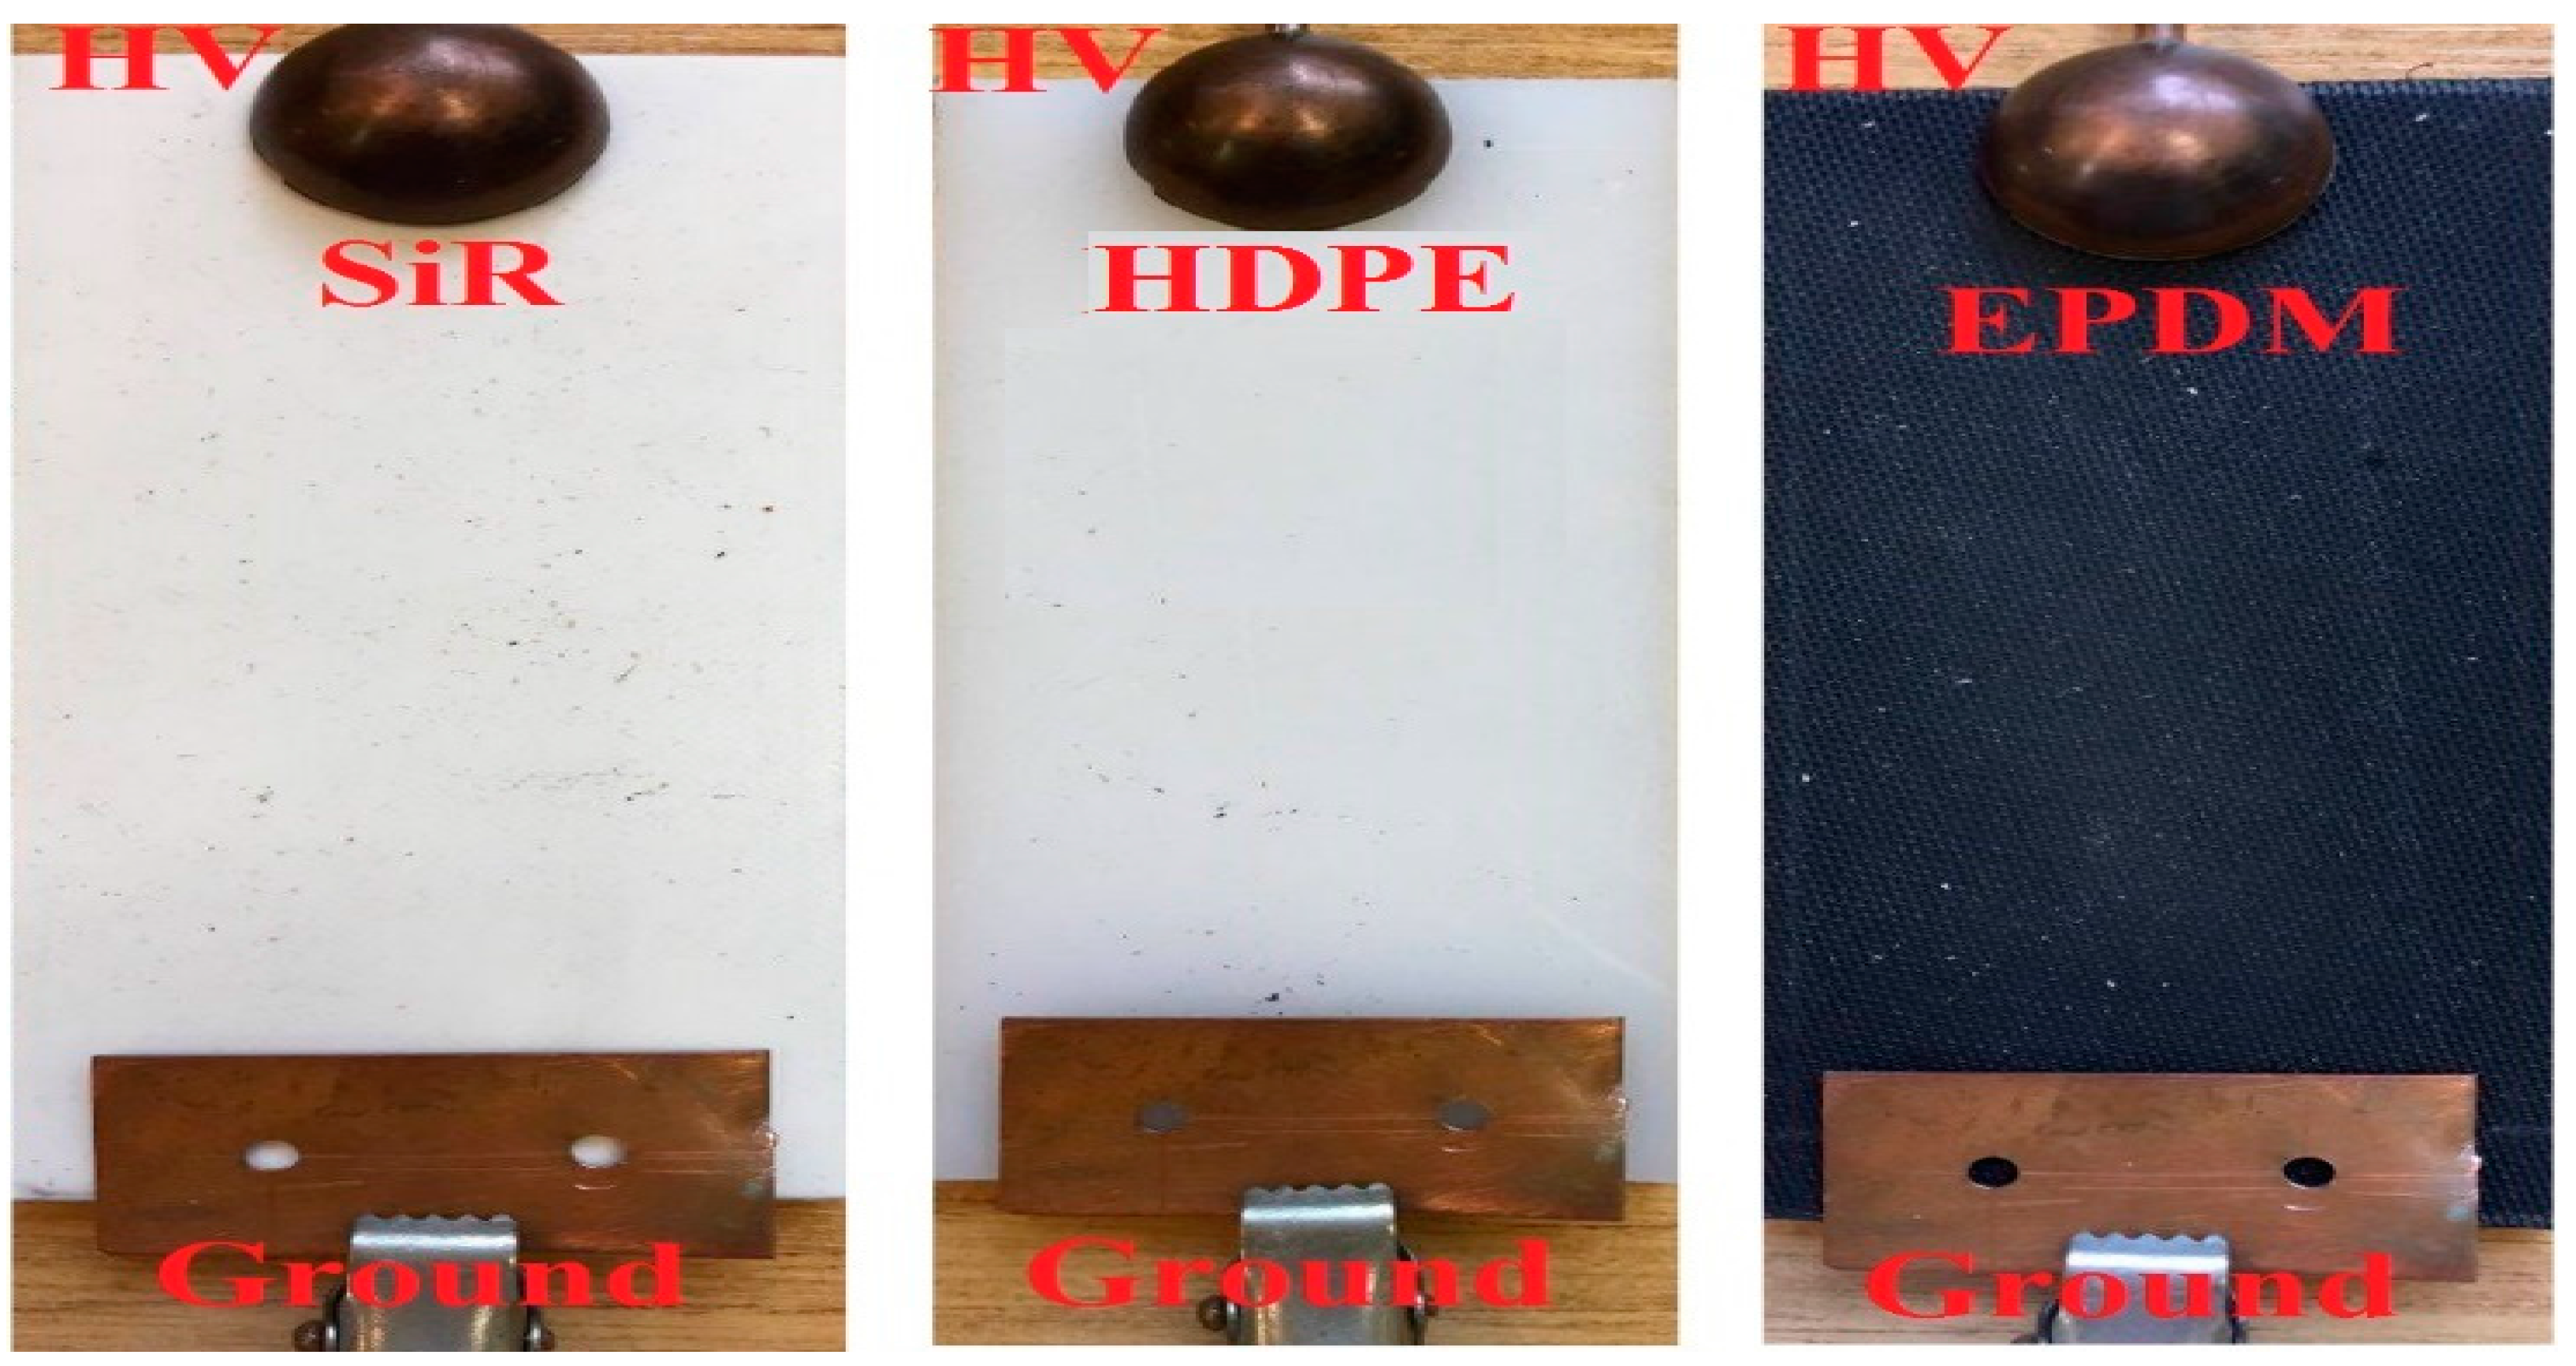
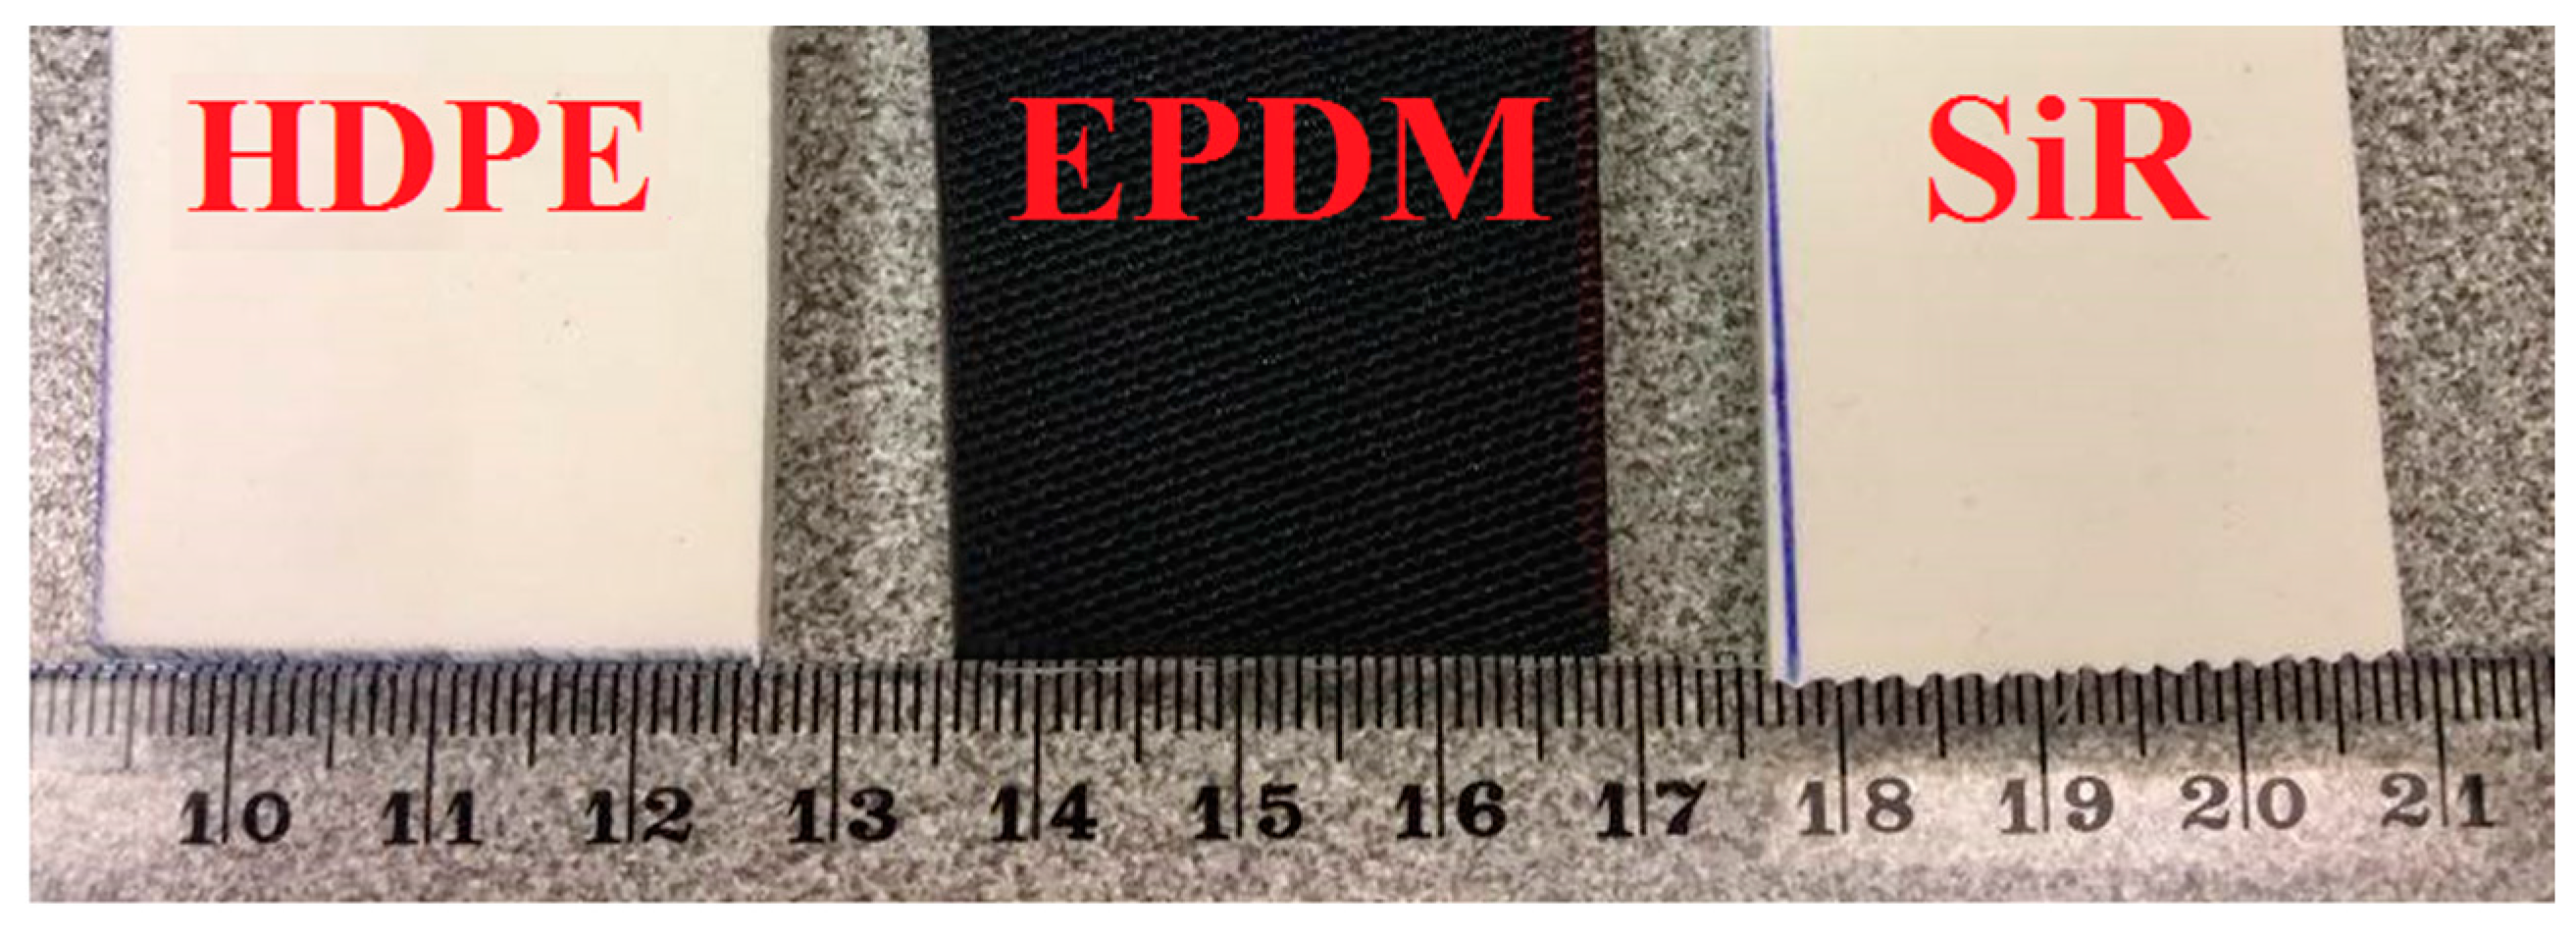
Different types of polymeric insulating material samples such as silicone rubber (SiR), high density polyethylene (HDPE) and ethylene propylene diene monomer (EPDM) with rectangular shape (18 cm × 4 cm × 8 cm) are taken with same composition as those used in real life outdoor high voltage insulators as test samples, as shown in Figure 1. Leakage current, electric field distribution and physico-chemical changes of the samples are investigated using the solid layer contamination method given in IEC-60507, under various environmental stresses in a chamber. The inclined plane test (IPT) for erosion, surface roughness and degradation and relationship to leakage current and electric field of polluted insulators, is used, which was standardized in ASTM D2303 [22] and IEC 60587 [23].
Figure 2 shows the experimental setup. In this research work the 33 kV AC test voltage was produced by a 10 kVA, 100 kV, and 50 Hz transformer. The supplied voltage can be increased manually or automatically at a rate of 1 kV/s. Acidic and normal cold fog are generated by adjusting the nozzle of the spray gun. The flow rate of fog is 2 kg/h/m3. The diameter of the spraying nozzle is 0.8 mm and the spraying pressure is 16.0 MPa. The conductivity of artificial contamination deposition is between 150 and 200 μS/cm and conductivity of the acidic cold fog is between 700 and 800 µS/cm, and pH of acidic cold fog is 3.6. These values are almost the same as the acidity measured in the atmosphere near the shoreline [24]. The lowest pH value is 2.4, which occurred in Scotland in 1974 [25] indicating ultra-acidic environmental conditions. The composition and density of the ion ingredients in the preparation of acidic cold fog are shown in Table 1. This composition is used as the standard acidic fog in this research to evaluate changes in surface physico-chemical properties, leakage current and electric field for all the insulator samples.
To investigate the saline contamination, normal cold and acidic fog effects on surface degradation, leakage current, electric field distribution and physico-chemical changes, the following procedures were used. The test was performed under two scenarios, as shown in Table 2. In this test, the artificial contamination and acidic fog adjustment was set at “ON” and was set at “ON/OFF” to investigate the resulting tracking, surface degradation and leakage current. The “ON” cycle represents the continuous application of contamination deposition and acidic cold or normal cold fog in the energized state. On the other hand, the “ON/OFF” cycle represents a periodic application of saline contamination and acidic cold or normal cold fog, corresponding to the situation where saline contamination deposition is “ON” throughout the test and acidic or normal cold fog generation is “OFF” (suspended for five-minute duration). In each test there was 14 numbers both of “ON” and “ON/OFF” cycles.
3. Results and Discussions
3.1. Electrical Properties
3.1.1. Effect of Acidic and Clean Cold Fog on Discharge Current
The discharge current flowing across the surface of the samples was monitored as a function of aging time during the tests. For the purpose, 33 kV AC voltage was supplied to each sample individually. Discharge current was monitored and recorded by using a high frequency current transformer (HFCT) and a protective circuit was used to avoid over voltage and over current during test. Failure was diagnosed and tracked for higher values of discharge current under acidic and normal cold fog conditions. The times of failure of all samples were compared and, together with the highest and the initial values of discharge current, are shown in Figure 3a,b clearly indicating that the discharge current increases rapidly with aging time under acidic fog conditions when compared to clean cold fog conditions. In addition, the discharge current of HDPE and EPDM samples increases more rapidly than that of SiR in the same aging period.
Figure 3a,b compare the discharge currents of various samples under the combined deposition of saline contamination and acidic or normal cold fog. It is observed that the discharge current increases with an increase in aging test time both in the acidic and normal cold fog and with an increase in the number of “ON” and “ON/OFF” cycles. From these figures, it is evident that the discharge current of the HDPE sample unveils a small current in “ON” when compared to the “ON/OFF” scenario, where it is too high and fails within 72 h. The EPDM sample has approximately half of this current variation both in the “ON” and “ON/OFF” scenarios over 98 h. Meanwhile, the SiR sample persists for 150 h with similar changes in discharge current in both the “ON” and “ON/OFF” scenarios. The results also indicate that the degree of surface degradation and insulator failure are not only dependent on the duration of service but are not sufficient to initiate the surface discharge phenomenon on the insulator surface. Surface degradation and failure have to be caused by a combination of electrical and environmental stresses such as saline contamination, acidic or clean cold fog and various electro-chemical reactions as well as weathering cycles and variations in the properties of the insulation materials, including SiR, HDPE and EPDM.
From the results it can be summarized that SiR performs better than the other materials, whereas HDPE and EPDM reveal that discharge current is about 43% and 27% higher than that of SiR. SiR gives a much lower discharge current as a result of its hydrophobic property. In addition, the effects of normal cold fog with saline contamination were also investigated for all materials. In fact, it can be noted that the discharge current is reduced more than 31% for SiR compared to the combined application of saline and acidic cold fog conditions. The reason for this is that, in the SiR sample the Si-O bond has a high bond energy so that SiR has a high heat resistance against erosion and surface degradation. In addition, the SiR methyl group bonds, such as the C-H bond of CH3 and Si-CH3, are highly moisture absorbable bonds, implying the diffusion of low molecular weight (LMW) polymer liquid from the bulk to the surface. However, the weak bonds in the molecular structure of EPDM, such as the C-C and C-H bonds in ethylene (C2) and propylene (C3), easily degrade in acidic cold fog because of early loss of hydrophobicity. EPDM and HDPE have slow hydrophobicity restoration in harsh environments.
3.1.2. Effect of Acidic and Clean Cold Fog on E-Field Distribution
The E-field distribution across insulators accelerates the surface degradation and reduces the life of insulators if not controlled properly. Unbalanced field distribution along the creepage length can exaggerate and ultimately degrade and damage insulator surfaces as a result of partial discharges on the surface which usually take place before surface flashover [26]. A remote reading AC field meter EMF-A152 and a spherical probe EMF-A182 were used for the measurement of the E-field distribution for each insulator slab in both acidic and normal cold fog conditions. The meter measures fields ranging from 50 V/m to about 350 kV/m in space. As a result of the presence of moisture in the environmental chamber, the spherical probe was covered with latex to overcome the moisture effect on its sensing part. A protective circuit was used to avoid over-voltage and over-current during the test.
Electric field distribution along the creepage path is given in Figure 4a,b for all samples in clean and acidic cold fog respectively. Clearly, the variation of electric field among the samples results from changes in the dielectric constant. The electric field distribution for all samples is non-linear with higher amplitude near the energised than that at the grounded end. It is also observed that the field strength along the samples is completely different during combined the application of saline contamination and acidic fog as compared to saline contamination and clean cold fog. The E-field distribution was measured after 110 h of aging time. The maximum strengths for SiR, EPDM and HDPE samples in normal fog are 0.399 kV/cm, 0.401 kV/cm and 0.425 kV/cm respectively. However, these values increased to 0.533 kV/cm, 0.569 kV/cm and 0.587 kV/cm respectively after 20 min of acidic cold fog generation. The reason for this is twofold. First, relative permittivity of acidic cold fog is much higher as compared to normal cold fog, which enhances the field strength in the surrounding air. Second, water droplets deform in the direction of the field, making their curvature smaller and increasing the field further.
3.2. Physico-Chemical Properties
The lifespan of the insulating materials under various combined stresses is a major and significant interest in failure studies [27,28]. Under various environmental stresses, the insulator loses its ability to work as required because of premature dielectric changes that take place in the form of chemical reactions and change in physical properties. This section describes all the physico-chemical changes that took place under various combined stresses. Figure 5 shows slices of samples cut from the 150 h aged samples for physico-chemical analysis.
3.2.1. Contact Angle and Hydrophobicity Measurement
Hydrophobicity loss and recovery of degraded samples are evaluated using static contact angle measurement. In this paper, sample surface hydrophobicity and its recovery time are determined by measuring the contact angle of water on the surface. Measurements were carried out on all samples before and after 150 h of aging in the combined application of saline contamination with acidic fog and normal cold fog separately. The static contact angle was measured using a Goniometer of Dyne Technology make to quantify the hydrophobicity recovery and measurement was carried out as per standard [29] and the measurements are carried out on different spots on the virgin and aged samples. The stated values are the average of the measurements.
The measured contact angles of all samples before and after aging in acidic and clean cold fog are shown in Figure 6. It is noticeable that the contact angle decreases with increased aging time in all samples. During measurements, it was observed that the hydrophobicity of the degraded SiR sample is restored in the “ON/OFF” scenario. The contact angle decreases during the “ON” scenario and increases to some extent during the “ON/OFF” scenario as compared to the EPDM and HDPE samples, where the contact angle steadily decreases in both scenarios. Thus, it can be concluded that the hydrophobicity recovery of SiR is more elastic than those of HDPE and EPDM. It should be noted that the surface of HDPE and EPDM undergo stronger erosion than that of SiR because of the chemical compositions of acidic cold fog. In addition, they suffer degradation because of the surface discharge in the presence of saline contamination and acidic cold fog. As a result, the contact angle was reduced by 8.3% for the SiR 150 h aged sample in clean cold fog in relation to the reference sample. For the 150 h aged sample in acidic cold fog the contact angle was decreased by 15.8%, showing that acidic cold fog has a relatively more severe effect on the surface than that of clean cold fog. Moreover, this effect is even more severe for EPDM and HDPE where the contact angle was reduced by 23.2% and 27.2% respectively in acidic cold fog during 150 h of aging and 19.4% and 21.1% in normal cold fog in the same conditions. From Figure 6 it can also be observed that both EPDM and HDPE have contact angles of less than 90° during 150 h in clean cold and acidic cold fog, indicating poor hydrophobicity. By definition, hydrophobic surfaces have contact angles of more than 90° while hydrophilic surfaces have angles of less than 90°. These results are because the surfaces are affected by partial discharge activity and acidic and saline contamination. For the same reason the contact angle reduction in the case of acidic cold fog is greater than that of clean cold fog. It was also found that methyl groups (CH3) are responsible for the hydrophobic and hydrophilic behaviour of SiR, EPDM and HDPE. As a matter of fact, when the numbers of these groups are decreased on the surface, the hydrophobicity of these materials is reduced.
3.2.2. Scanning Electron Microscopic (SEM) Analysis
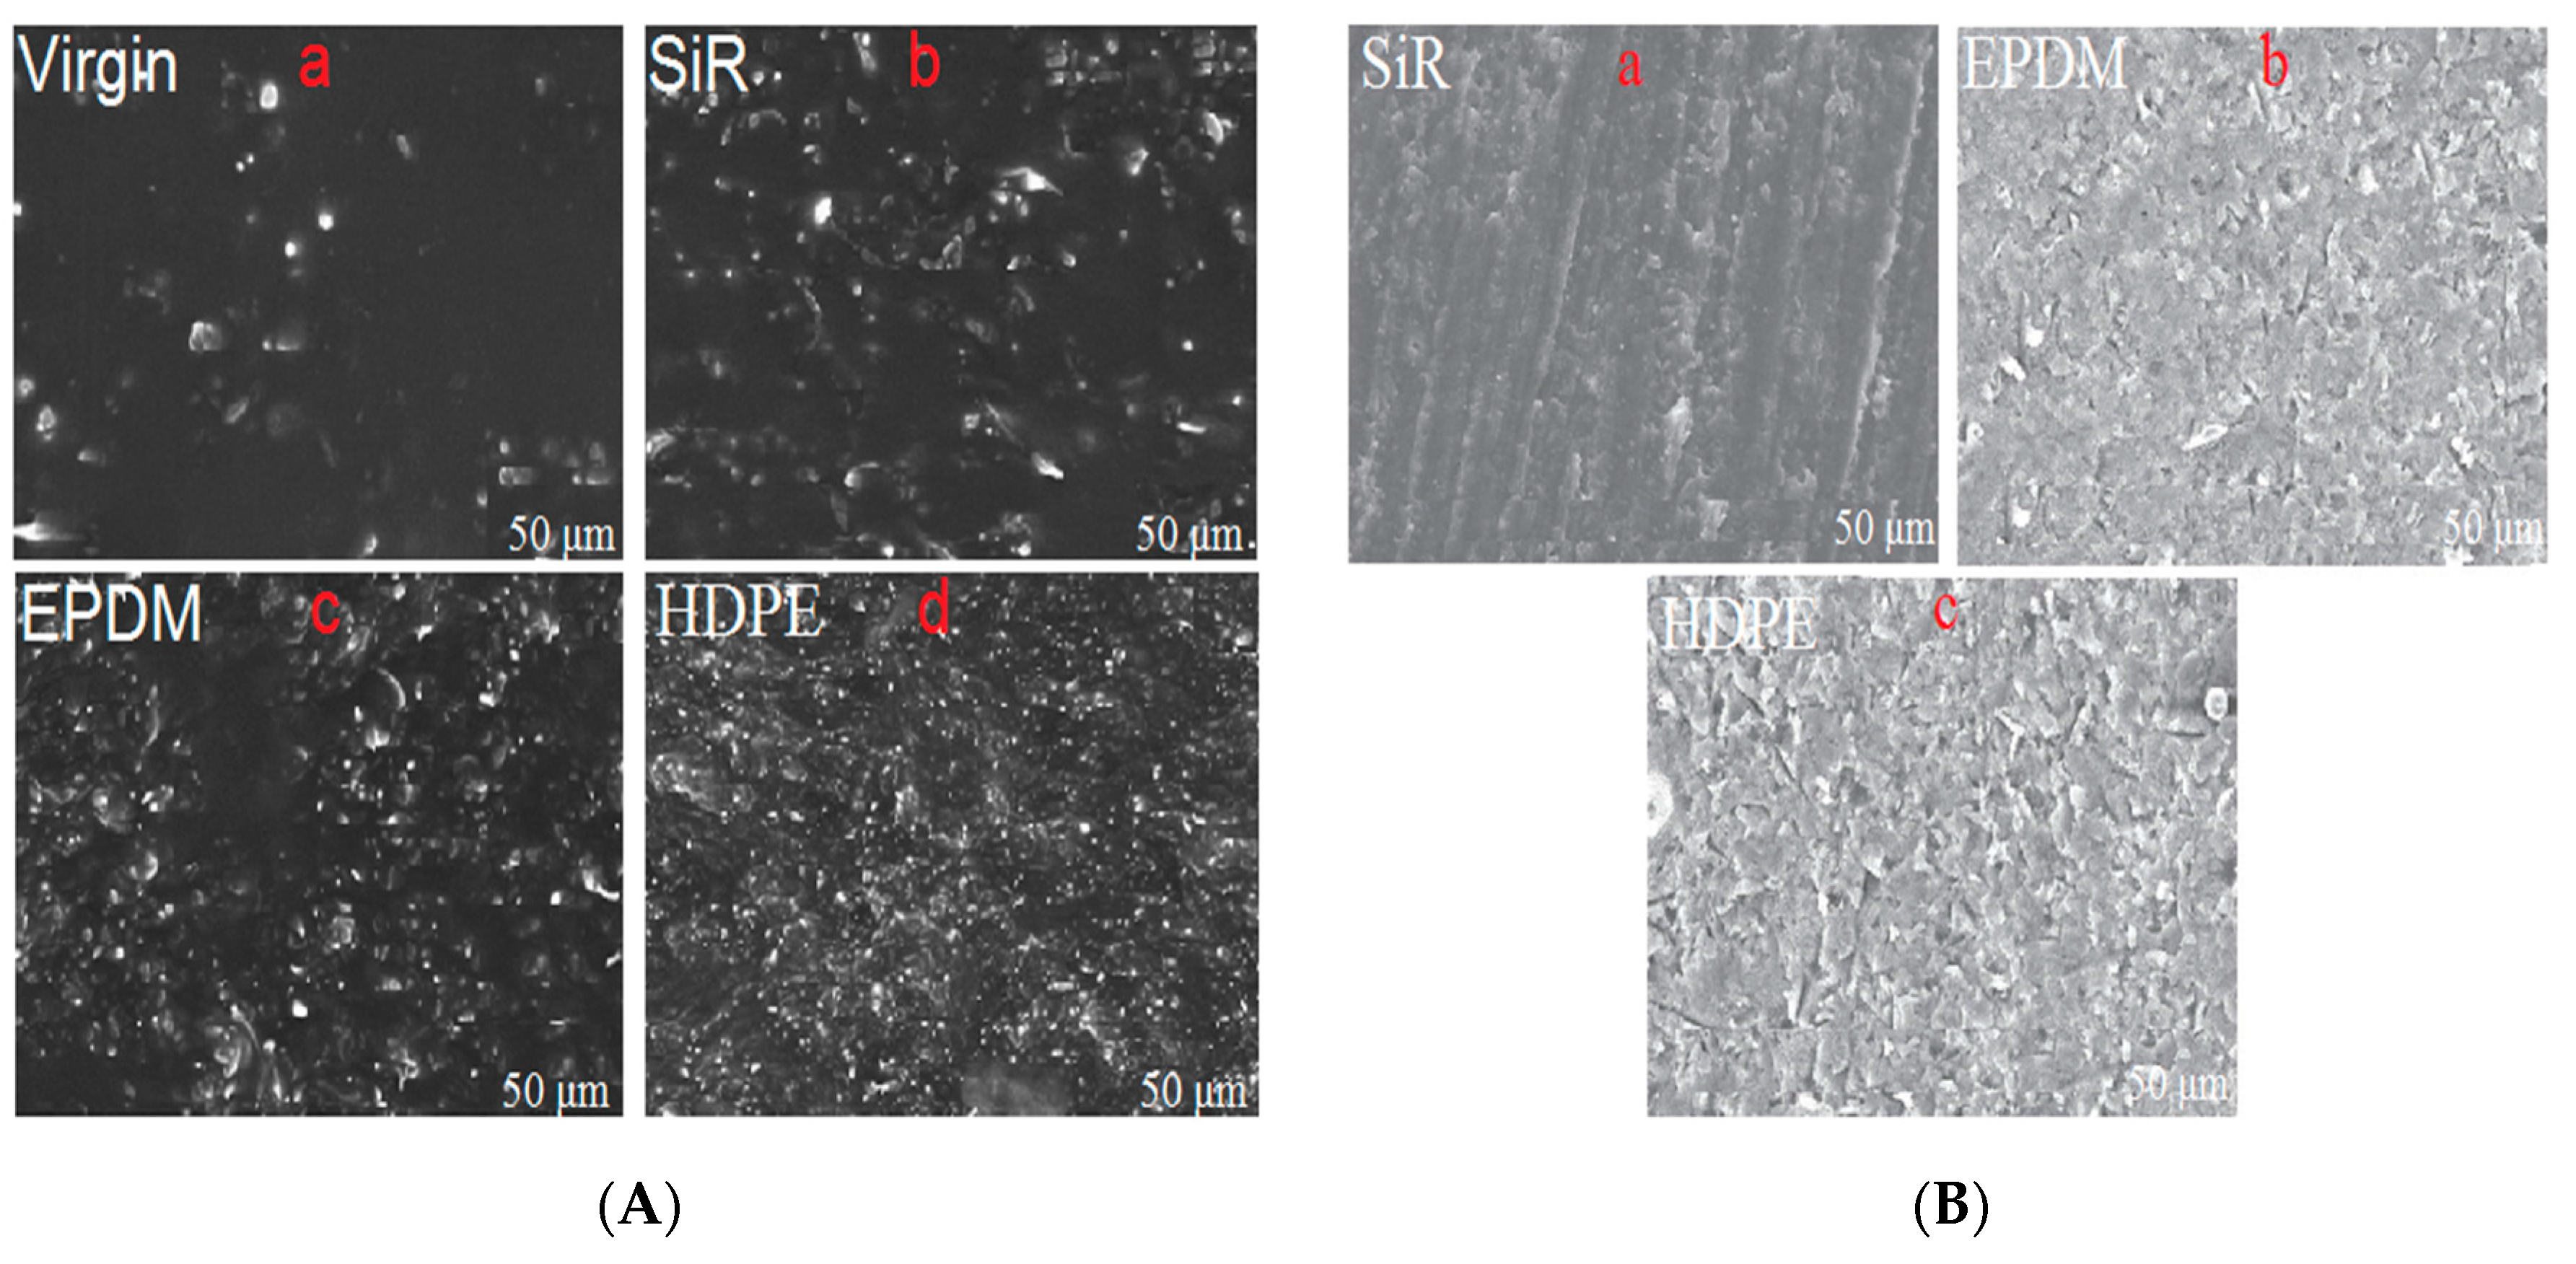
A Scanning Electron Microscope (SEM) analysis was undertaken to obtain information about the specimens’ surface structures and composition. Morphological and topological changes in the samples before and after the acidic and clean cold fog tests are shown in Figure 7A,B. Material properties have been observed after 150 h of aging for both acidic and clean cold fog conditions. Figure 7A shows the virgin sample before the treatment at a magnification range of 50 μm, it shows no dents, cracks or surface roughness and degradation. On the other hand, cracks and significant dents can be identified after 150 h of aging for all materials, especially on more exposed parts, such as those where the flow of leakage current was higher during the acidic than the clean cold fog application, as shown in Figure 7B. It was found that the surface morphology changes of the sample treated in acidic cold fog are different from those in clean cold fog. As for Figure 7A, no major cracks and dents were found in the clean cold fog samples except for some parts showing minor cracks and dents. This may be because of smaller discharge intensity in clean cold fog. The material treatment for the acidic fog was more served than that for clean cold fog as a result of high intensity of discharge activities. The experimental results discussed above reveal that acidic cold fog exposure has more severe degradation effects on insulation materials than clean cold fog exposure. After aging in acidic cold fog, the surface becomes rough with a number of dents and cracks and a decrease in the hydrophobicity. Moreover, the surface of EPDM and HDPE is damaged severely when compared to SiR, as the Si-O bond has high bond energy resulting in a high heat resistance against discharge and degradation.
3.2.3. Fourier Transform Infrared (FTIR) Analysis
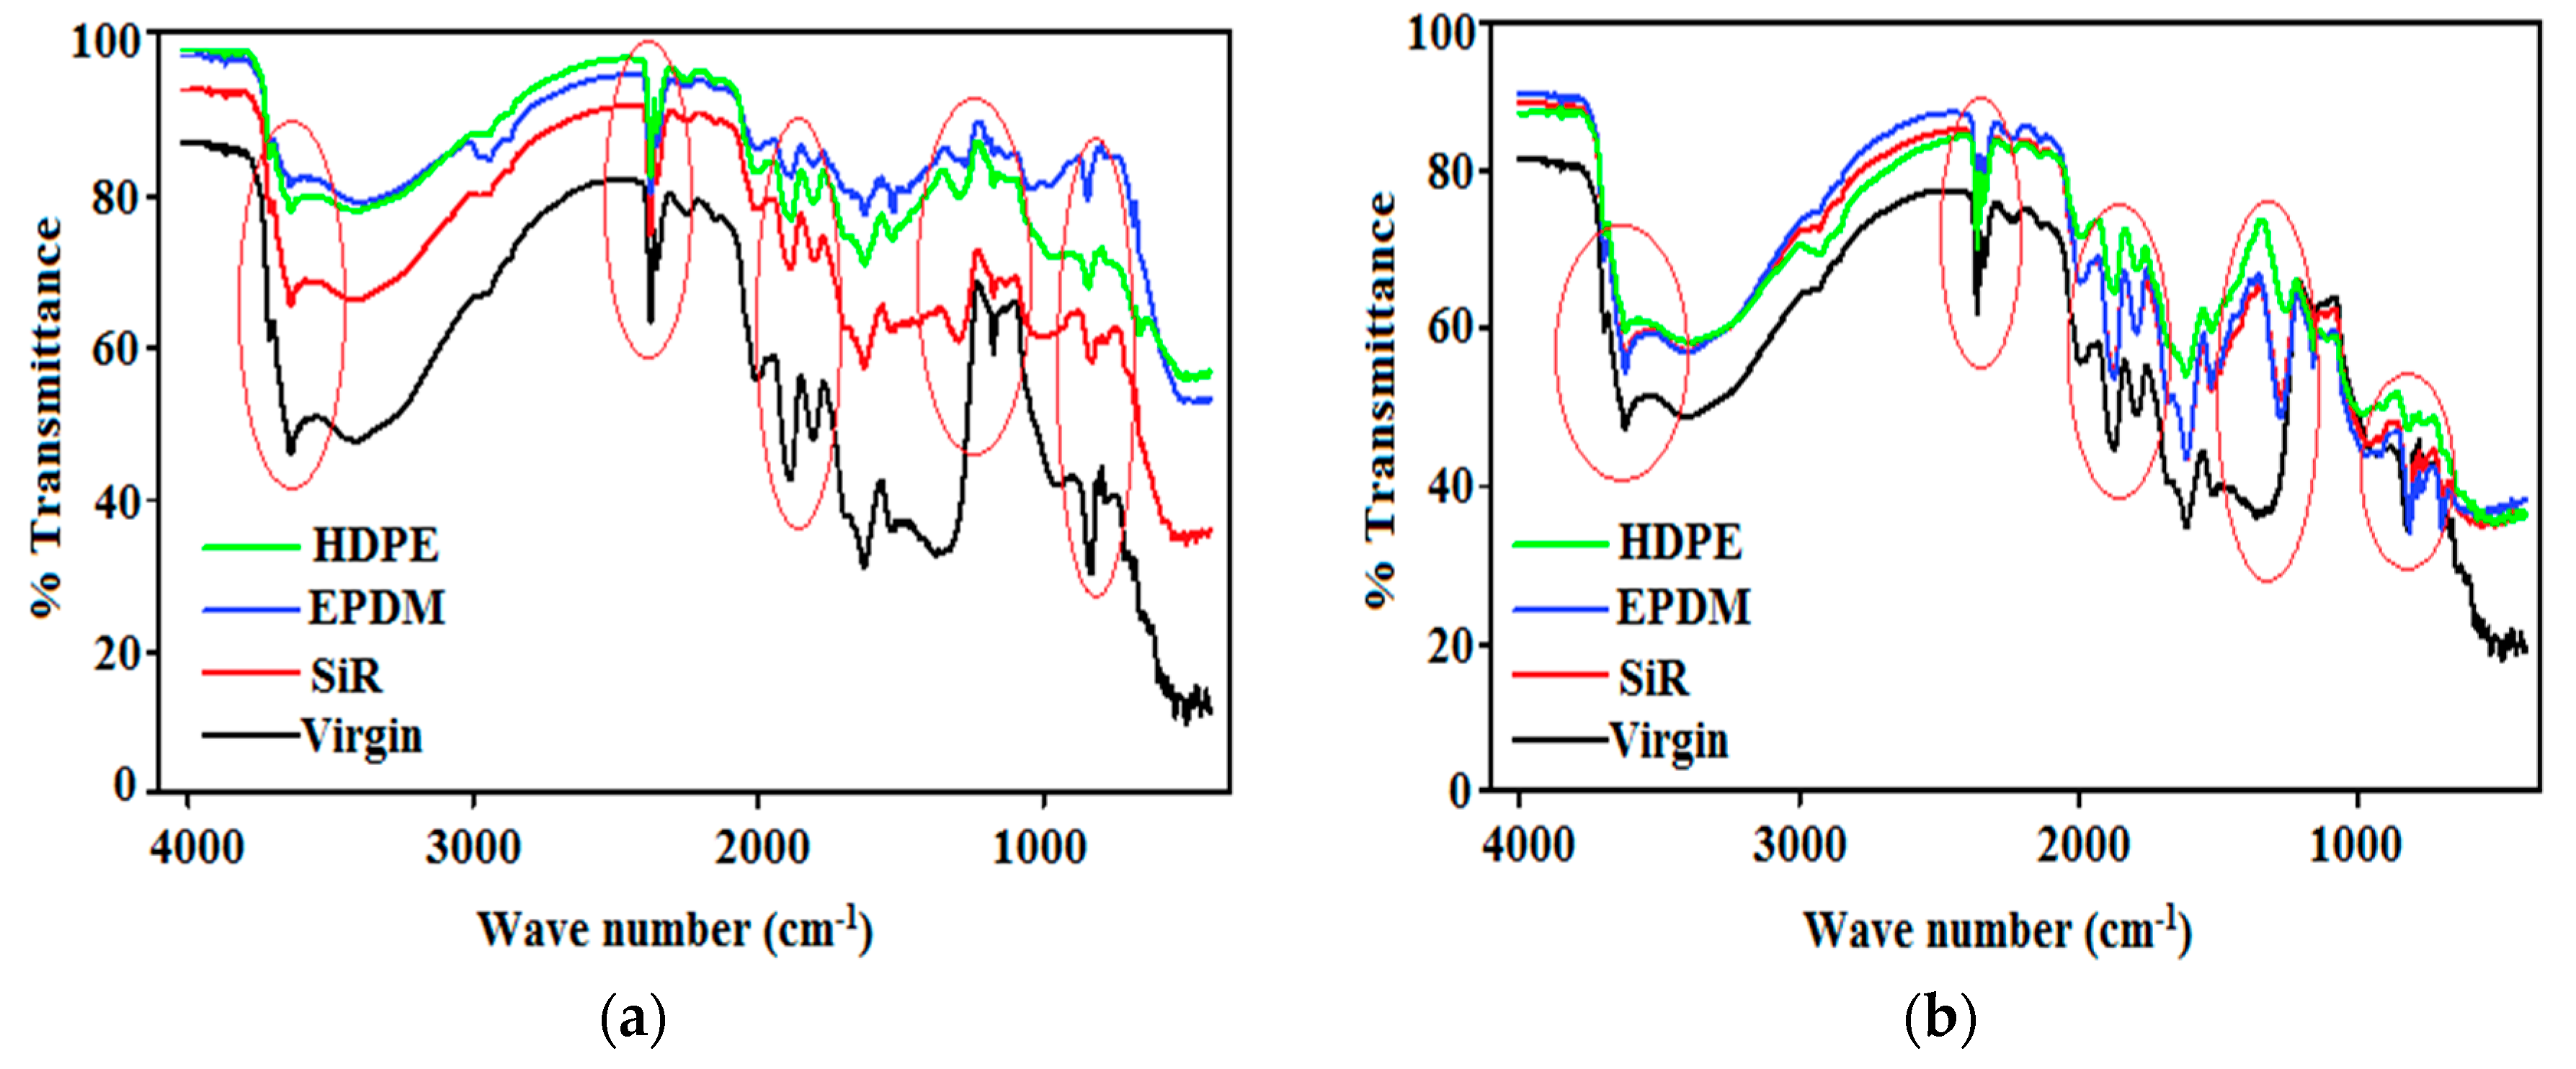
The molecular structural and functional chemical group changes of materials, both quantitative and qualitative, can be identified using Attenuated Total Reflection Fourier Transform Infrared (ATR FTIR). In this section, the effects of acidic and clean cold fog on the chemical structure of the SiR, EPDM and HDPE samples is evaluated using FTIR. Due to impact of acidic or normal fog in energised condition, various chemical reactions are occurred on insulation material surfaces, consequently, oxygenated types such as hydroxyl, carbonyl and ester groups were formed which changed the characteristics of materials. The % transmittances of all virgin materials are almost the same, so only SiR insulation material was used as reference to measure % transmittance.
The FTIR technique allows detection of molecular bonds formed on the sample surface [30]. Figure 8a,b shows the FTIR spectra of samples (SiR, EPDM and HDPE), energised at AC voltage in the combined application of saline contamination and clean or acidic cold fog. Figure 8a,b shows the FTIR spectra for the SiR, EPDM and HDPE samples exposed to saline contamination, combined to clean or acidic cold fog respectively, as per the adopted experimental set up. The spectra show a variation at the same wave number for the dents and cracks on the samples treated in acidic as compared to clean cold fog, with micro cracks on the sample surface. This is because all samples experience different types of chemical reactions and surface degradation because of the non-uniformity of heat generated along the creepage distance. For the silicone rubber sample, absorption at 2435 to 2710 cm−1 in clean cold fog and at 2310 to 2490 cm−1 in acidic cold fog is related to the Si-CH3 bond. Absorption at 970 to 1180 cm−l in clean cold fog and at 1240 to 1390 cm−l in acidic cold fog is caused by the Si-0-Si main bond. It is clear that the absorption the C-H bonds of CH3 is greater in clean than in acidic cold fog, which means that the number of C-H bonds is relatively less after the sample is tested using the combined action of saline contamination and acidic cold fog. The HDPE sample shows strong bands at 2470 cm−1 and 2590 cm−1 because of the stretching vibration of C=O in the -COOH group with acidic and clean cold fog respectively. The relative area ratios between the characteristics peak of C=O at 810 cm−1 and the characteristics peak of CH2 at 1120 cm−1 in the FTIR spectra illustrate the fact that the number of C=O increases with increasing absorption rate, which means that roughness has increased on the HDPE surface. In the EPDM spectra, the extensive peaks at 1360 cm−1 and 2490 cm−1 are related to the O-H and C=C stretching vibrations respectively. The peaks at 3760 cm−1 and 2990 cm−1 are assigned to the -CH2- and C-H scissoring vibration and the stretching vibration of methyl respectively. Reduction that took place in the methyl and hydroxyl groups was over 67%, and 72% in the case of SiR, whereas it was almost 90% and 93% for EPDM and HDPE. Figure 8a,b clearly shows that, in the case of the combined effects of saline contamination and acidic cold fog, the surface of the EPDM and HDPE samples are more severely damaged during the oxidative degradation of organic compounds in air than that of SiR, because the Si-O bond has high bond energy, meaning that the SiR because the Si-O bond has high bond energy, meaning that the SiR has high heat resistance against degradation.
3.2.4. Surface Roughness
The presence of saline contamination, acidity and partial discharges caused erosion of insulation materials in a rough surface. Measurements of the surface roughness give a clue to this failure [31]. Optical surface profilers (Zygo) are white light interferometer systems which offer fast, non-contact, high precision surface roughness measurement. We can easily measure material profile roughness, or in surface area roughness, surface texture, and structural characterisation using this instrument. In this experiment surfaces of degraded samples are scanned with Zygo in order to measure surface roughness. Table 3 shows the surface roughness profiles and parameters of HDPE, SiR and EPDM. It is clearly shown that, after the acidic cold fog tests, the average roughness of SiR (3.29 ± 0.02 µm) is much smaller compared to both EPDM (2.82 ± 0.02 µm) and HDPE (4.06 ± 0.02 µm) with a temperature of 87 °C which may degrade the insulator surface. It can therefore be concluded that, after exposure to surface discharges on all samples, the SiR sample suffered lower degradation compared to the EPDM and HDPE samples. It is indicated that, for SiR, surface roughness in clean cold fog was 1.01 ± 0.02 µm and, after 150 h energisation, surface roughness increased up to 4.78 ± 0.02 µm with increasing temperature because of Joule heating on the sample surface and saline contamination contents. Meanwhile, surface roughness in acidic cold fog with saline contamination increased three times as compared to clean cold fog, which was 11.09 ± 0.02 µm. The reason for this is that, in acidic cold fog, the increase in surface roughness because of the ingestion of water and saline with higher acidity (pH = 3.2) on the surface of samples causes greater surface distortion than in the case of clean cold fog.
3.2.5. Dielectric and Physical Changes
4. Conclusions
After studying the aging surface roughness and degradation process of three types of insulator samples under acidic and normal cold fog, conclusions can be made as follows:
Acidic cold fog has a large erosion effect on outdoor insulators. As a result of erosion and surface degradation of acidic cold fog, the insulator surface is degraded and becomes rough so that its hydrophobicity decreases. The impact of acidic cold fog was also found to be more intense than that of clean cold fog, which unfolds that relative permittivity of acidic cold fog is much higher as compared to normal cold fog.
It was observed that, in an environment of −2 °C and at high acidity pH (3.6), the contact angles of the samples decreased remarkably. For example, the contact angle of the best hydrophobic material (SiR) was reduced from 97.40 ± 20 to 850 ± 2.20 when the nature of the fog was changed from clean to acidic. The hypothesis for this change was that acidic moisture was condensed at low temperature in the channels between submicron particles, and thus the air beneath the water droplets was to some extent removed to cause reduction in surface hydrophobicity. Consequently, at low temperature and in an acidic cold fog environment, the rough surface structure becomes less efficient for recovering hydrophobicity. At low temperature and with high acidity contents, the rough surface structure therefore becomes less effective for improving hydrophobicity.
The properties of materials vary considerably both physically and dielectrically. These are shown in Table 4 and Table 5. The samples exhibit small change permittivity and weight because of aging acidic cold fog. Moreover, discharge current and loss tangent change significantly, with EPDM showing extreme variation. HDPE showed a relatively higher discharge current with adequate loss tangent change. However, SiR exhibited the reverse behaviour, indicating that material properties can differ. These observations support the time to failure result under operational conditions.
From the SEM and FTIR results, it can be concluded that various oxygenated types such as hydroxyl, carbonyl and ester groups were formed when SiR, EPDM and HDPE were exposed in the application of the combined effect of saline contamination and acidic cold fog. Cracks and dents formed on the insulation samples as a result of surface degradation is found to be different under acidic cold fog than in normal condition.
Experiments carried out show that surface roughness under the presence of acidic cold fog can lead to higher hydroxylation of the polymeric insulators in comparison with surface roughness under normal cold fog.
Author Contributions
Muhammad Majid Hussain and Shahab Farokhi conceived and performed the experiments. They also analysed the experimental data and contributed to the paper write-up. Scott G. McMeekin and Masoud Farzaneh worked on the analysis part and helped in experiments, design and paper write-up. They provided useful input in the original concept and improved the initial idea. The final draft of paper was thoroughly reviewed by Scott G. McMeekin and Masoud Farzaneh.
Conflicts of Interest
The authors declare no conflict of interest.
References
- Wang, C.; Li, T.; Tu, Y.; Yuan, Z.; Li, R.; Zhang, F.; Gong, B. Heating phenomenon in unclean composite insulators. J. Eng. Fail. Anal. 2016, 50, 48–56. [Google Scholar] [CrossRef]
- Chang, J.W.; Gorur, R.S. Surface recovery of silicone rubber used for HV outdoor insulator. IEEE Trans. Dielectr. Electr. Insul. 1994, 2, 1039–1046. [Google Scholar] [CrossRef]
- Deng, H.; Hackam, R.; Cherney, E.A. Influence of thickness, substrate type, amount of silicone fluid and solvent type on electrical performance of RTV silicone rubber coatings. IEEE Trans. Power Deliv. 1996, 11, 431–444. [Google Scholar] [CrossRef]
- Kim, S.H.; Cherney, E.A.; Hackam, R.; Rutherford, K.G. Chemical changes at the surface of RTV silicone rubber coatings on insulators during dry-band arcing. IEEE Trans. Dielectr. Electr. Insul. 1996, 1, 106–123. [Google Scholar]
- Houlgate, G. Field Experience and Laboratory Research on Composite Insulators for Overhead Lines. In Proceedings of the CIGRE Session Papers and Proceedings, Paris, France, 26–31 August 1986. [Google Scholar]
- Schneider, H.M.; Guidi, W.W.; Burnham, J.T.; Gorur, R.S.; Hall, J.F. Accelerated aging and flashover tests on 138 kV nonceramic line post insulators. IEEE Trans. Power Derliv. 1993, 8, 325–336. [Google Scholar] [CrossRef]
- Kim, S.H.; Cherney, E.A.; Hackam, R. The loss and recovery of hydrophobicity of RTV silicone rubber insulator coatings. IEEE Trans. Power Deliv. 1990, 5, 1491–1500. [Google Scholar] [CrossRef]
- Ghunem, R.A. Using the inclined-plane test to evaluate the resistance of outdoor polymer insulating materials to electrical tracking and erosion. IEEE Electr. Insul. Mag. 2015, 31, 16–22. [Google Scholar] [CrossRef]
- Selection and Dimensioning of High-Voltage Insulators Intended for Use in Polluted Conditions; Technical Report IEC TS 60815-1; International Electrotechnical Commission: Geneva, Switzerland, October 2008.
- Montesinos, J.; Gorur, R.S.; Mobasher, B. Mechanical performance of GRP rods used innonceramic insulators after exposure to acid attack. In Proceedings of the 11th Internatioal Conference on High Voltage Engineering, London, UK, 27–23 August 1999; Volume 4. [Google Scholar]
- Claudia, O.; Philip, T.; Ignacio, M.; Raji, S. Influence of acid rain + multistress conditions on the long term performance of 28 kV polymeric insulators. In Proceedings of the 2005 Annual Report Conference on Electrical Insulation and Dielectric Phenomena, Nashville, TN, USA, 16–19 October 2005; pp. 341–344. [Google Scholar]
- Vet, R.; Artz, R.S.; Carou, S.; Shaw, M.; Ro, C.-U.; Aas, W.; Baker, A.; Bowersox, V.C.; Dentener, F.; Galy-Lacaux, C.; et al. A global assessment of precipitation chemistry and deposition of sulfur, nitrogen, sea salt, base cation, organic acids, acidity and pH and phosphorus. Atmos. Environ. 2014, 93, 3–100. [Google Scholar] [CrossRef] [Green Version]
- Chrzan, K.L.; Andino, J.M.; Twarowski, R. Effects of acid rain on outdoor insulators. In Proceedings of the International Conference on Advances in Processing, Testing and Application of Dielectric Materials, Wroclaw, Poland, 17–19 September 2001; pp. 212–216. [Google Scholar]
- Wang, X.; Kumagai, S.; Yoshimura, N. Contamination performance of silicone rubber insulator subjected to acid rain. IEEE Trans. Dielectr. Electr. Insul. 1998, 5, 909–916. [Google Scholar] [CrossRef]
- Calva, P.A.; Ruiz, E.P.; Marquez, M.G.; Cabrera, G.P. Measuring and analysis of the effect of acid rain in polluted polymer insulators at high altitude. In Proceedings of the Conference on Electrical Insulation and Dielectric Phenomena, Albuquerque, NM, USA, 19–22 October 2003; pp. 410–413. [Google Scholar]
- Sundararajan, R.; Godinez, V.; Amin, M. Performance of thermoplastic elastomeric and thermoset insulators under accelerated acid rain multistress conditions. In Proceedings of the 15th National Power Systems Conference, Bombay, India, 16–18 December 2008; pp. 356–360. [Google Scholar]
- Yoshimura, N.; Shikimura, A.; Hasegawa, S. The Effect of acid rain on the tracking resistance of organic insulating materials. IEEJ Trans. Fundam. Mater. 1995, 115, 890–895. [Google Scholar] [CrossRef]
- Moreno, V.M.; Gorur, R.S. Effect of long-term corona on nonceramic outdoor insulator housing materials. IEEE Trans. Dielectr. Electr. Insul. 2001, 8, 117–128. [Google Scholar] [CrossRef]
- Moreno, V.M.; Gorur, R.S. Impact of corona on the long-term performance of nonceramic insulators. IEEE Trans. Dielectr. Electr. Insul. 2003, 10, 80–95. [Google Scholar] [CrossRef]
- Zhu, Y.; Otsubo, M.; Honda, C.; Hashimoto, Y.; Ohno, A. Mechanism for change in leakage current waveform on a wet silicone rubber surface—A study using a dynamic 3-D model. IEEE Trans. Dielectr. Electrl. Insul. 2005, 12, 556–565. [Google Scholar]
- Ali, M.; Hackam, R. Recovery of hydrophobicity of HTV silicone rubber after accelerated aging in saline solutions. IEEE Trans. Dielectr. Electr. Insul. 2009, 16, 842–852. [Google Scholar] [CrossRef]
- Standard Test Methods for Liquid-Contaminant, Inclined-Plane Tracking and Erosion of Insulating Materials; Active Standard ASTM D2303-13; ASTM International: West Conshohocken, PA, USA, 1997.
- Meyer, L.; Jayaram, S.H.; Cherney, E.A. Thermal conductivity of filled silicone rubber and its relationship to erosion resistance in the inclined plane test. IEEE Trans. Dielectr. Electr. Insul. 2004, 11, 620–630. [Google Scholar] [CrossRef]
- The European Monitoring and Evaluation Programme. Available online: http://www.emep.int (accessed on 24 August 2016).
- Gene, E.L.; Richard, F.W.; James, N.G.; Thomas, J.B. Acid Rain: In recent decades the acidity of rain and snow has increased sharply over wide areas. The principal cause is the release of sulfur and nitrogen oxides by the of fossil fuels. Sci. Am. 1979, 241, 43–51. [Google Scholar]
- Tzimas, A.; Zachariades, C.; Rowland, S.M. Electric field analysis of 132kV EPDM insulator and correlation with ageing features. In Proceedings of the 2013 IEEE Electrical Insulation Conference, Ottawa, ON, Canada, 2–5 June 2013; pp. 210–214. [Google Scholar]
- Aras, F.; Alekperov, V.; Can, N.; Kirkici, H. Aging of 154 kV underground power cable insulation under combines thermal and electrical stresses. IEEE Electr. Insul. Mag. 2007, 23, 25–33. [Google Scholar] [CrossRef]
- Crine, J.P. On the interpretation of some electrical aging and relaxation phenomena in solid dielectrics. IEEE Trans. Dielectr. Electr. Insul., 2005, 12, 1089–1101. [Google Scholar] [CrossRef]
- Guidance on the Measurement of Wettabilityof Insulator Surfaces (IEC TS 62073); Technical Report; International Electrotechnical Commission: Geneva, Switzerland, June 2003.
- Papailiou, K.O.; Schmuck, F.M. Silicone Composite Insulators Materials, Design, Applications; Springer: Berlin, Germany, 2013. [Google Scholar]
- Deng, H.; Hackam, R. Electrical performance of RTV silicone rubber coating of different thickness on porcelain. IEEE Trans. Power Deliv. 1997, 12, 857–866. [Google Scholar] [CrossRef]
Figure 1.
Experimental samples of SiR, HPDE and EPDM.

Figure 2.
Experimental setup.
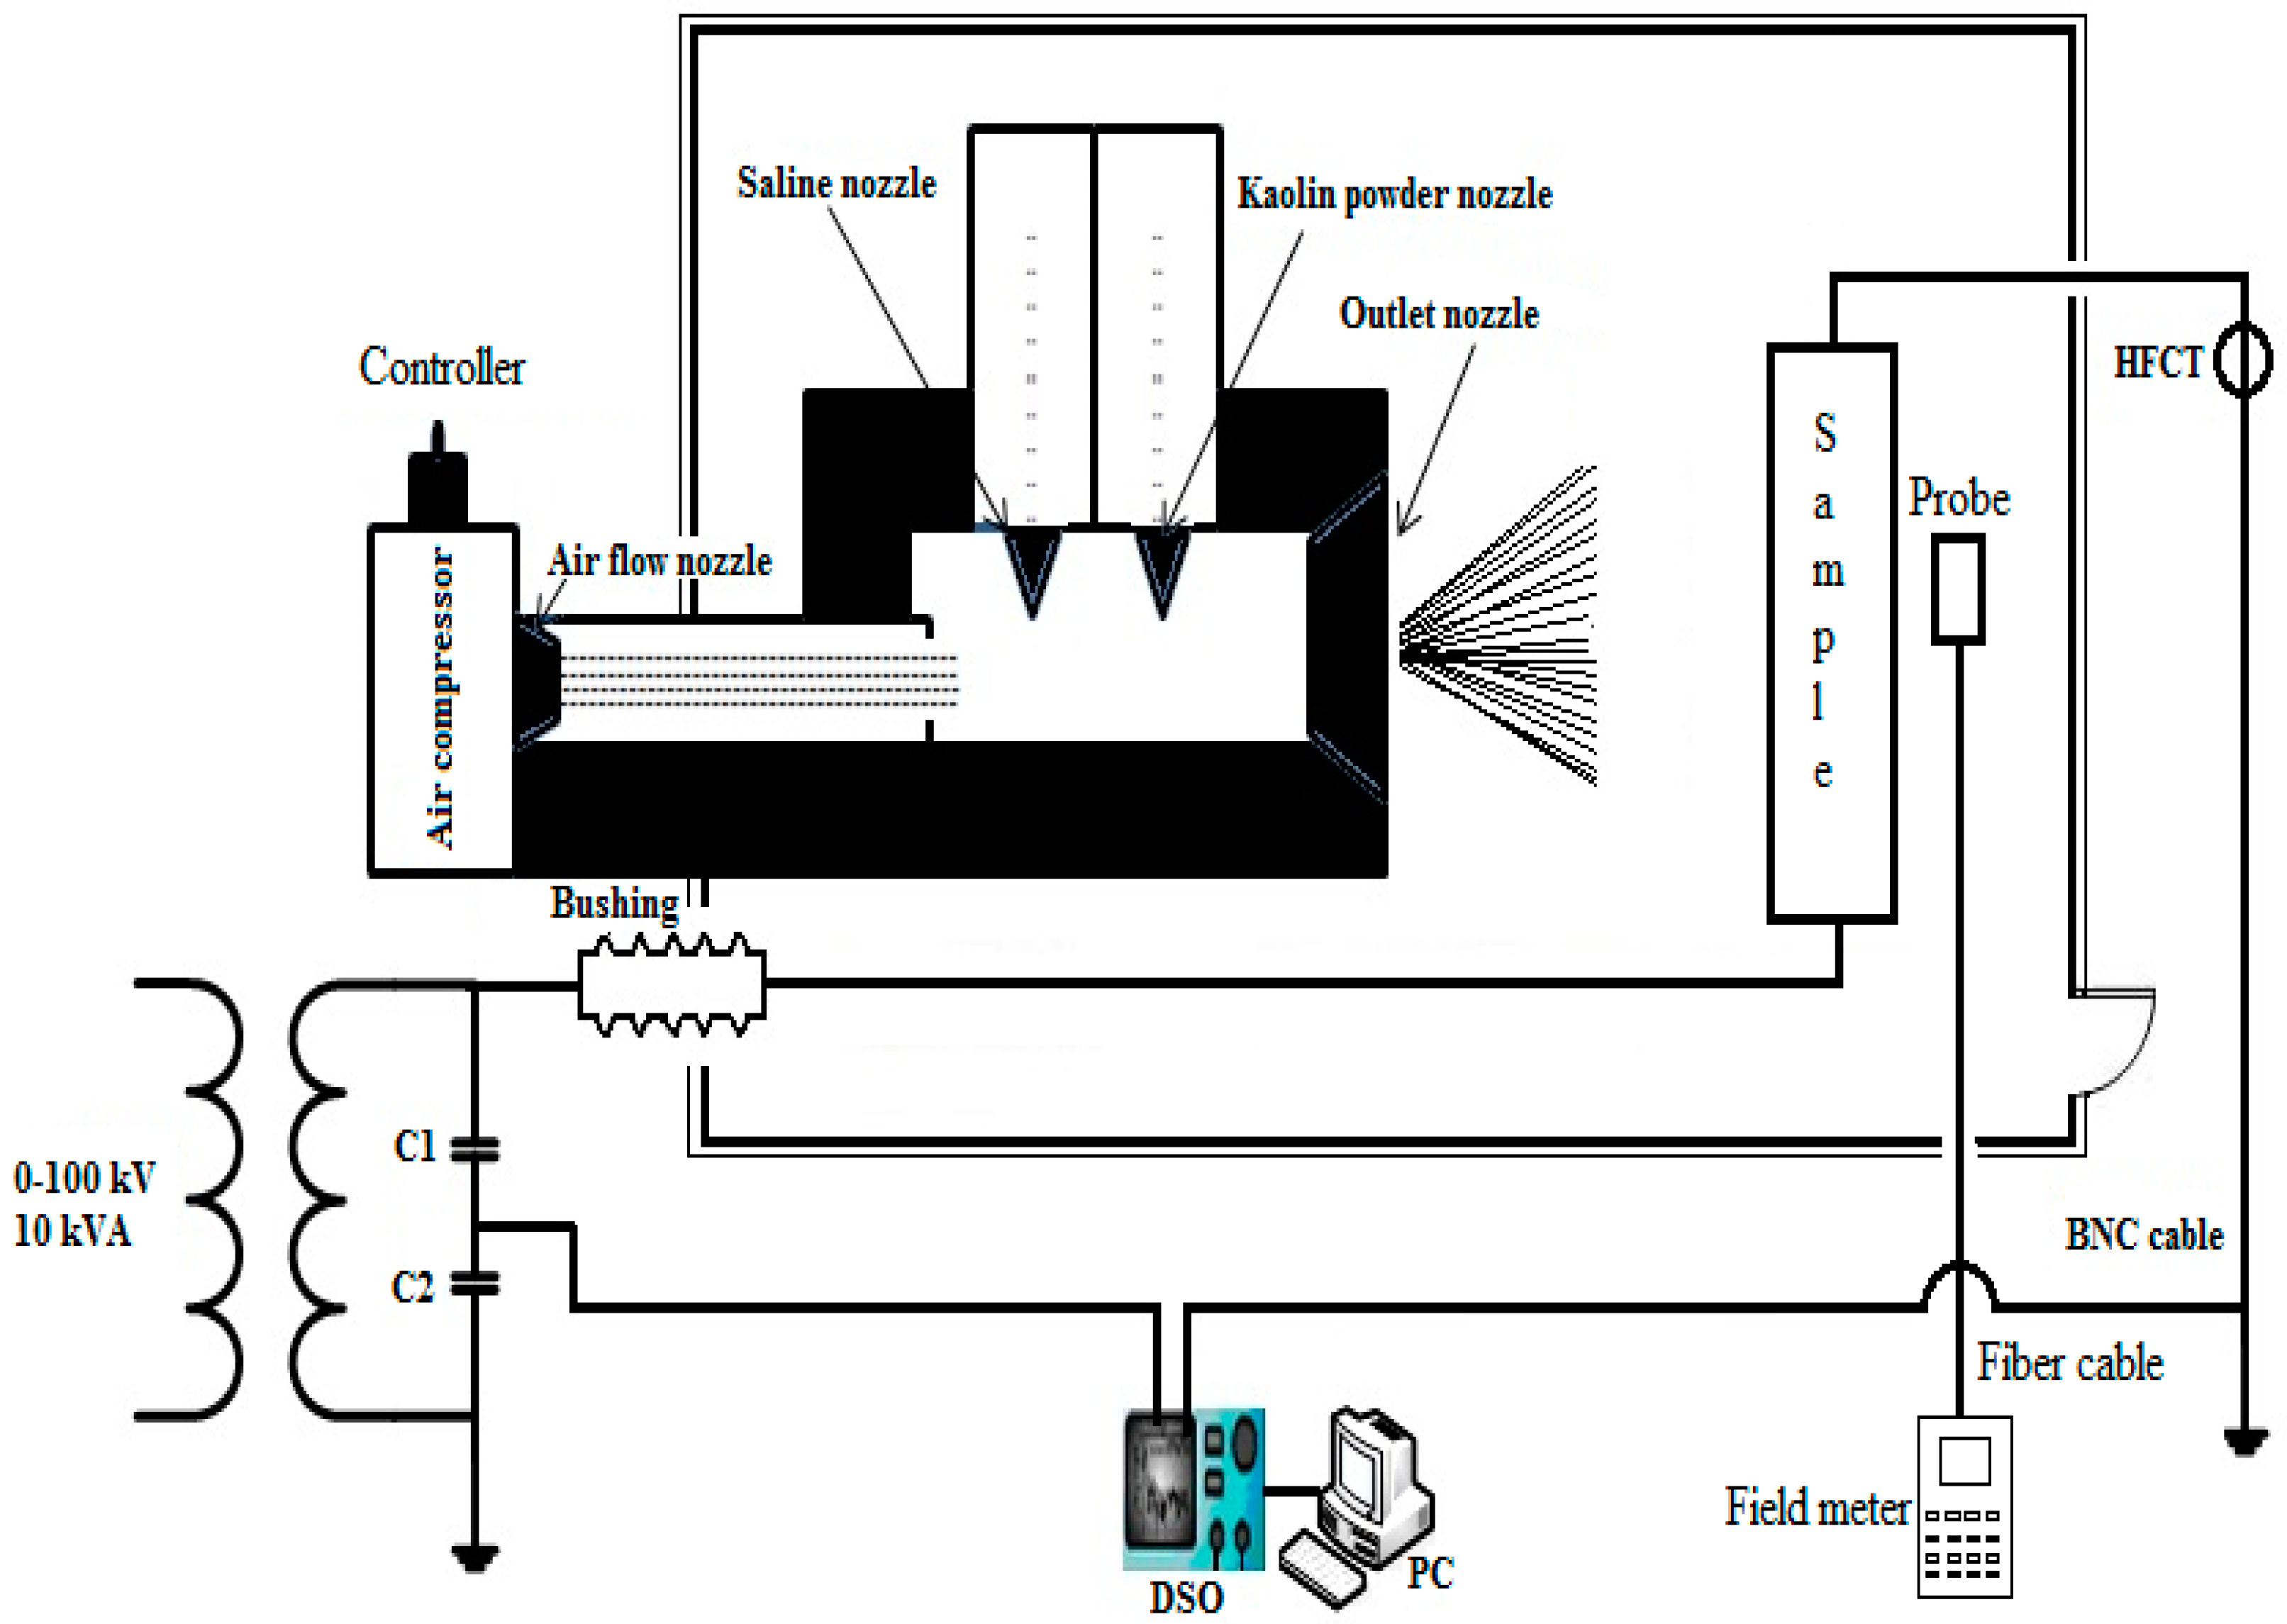
Figure 3.
Discharge current: (a) Under combined stress of saline contamination and acid cold fog; (b) under combined stress of saline contamination and normal cold fog.
Figure 3.
Discharge current: (a) Under combined stress of saline contamination and acid cold fog; (b) under combined stress of saline contamination and normal cold fog.
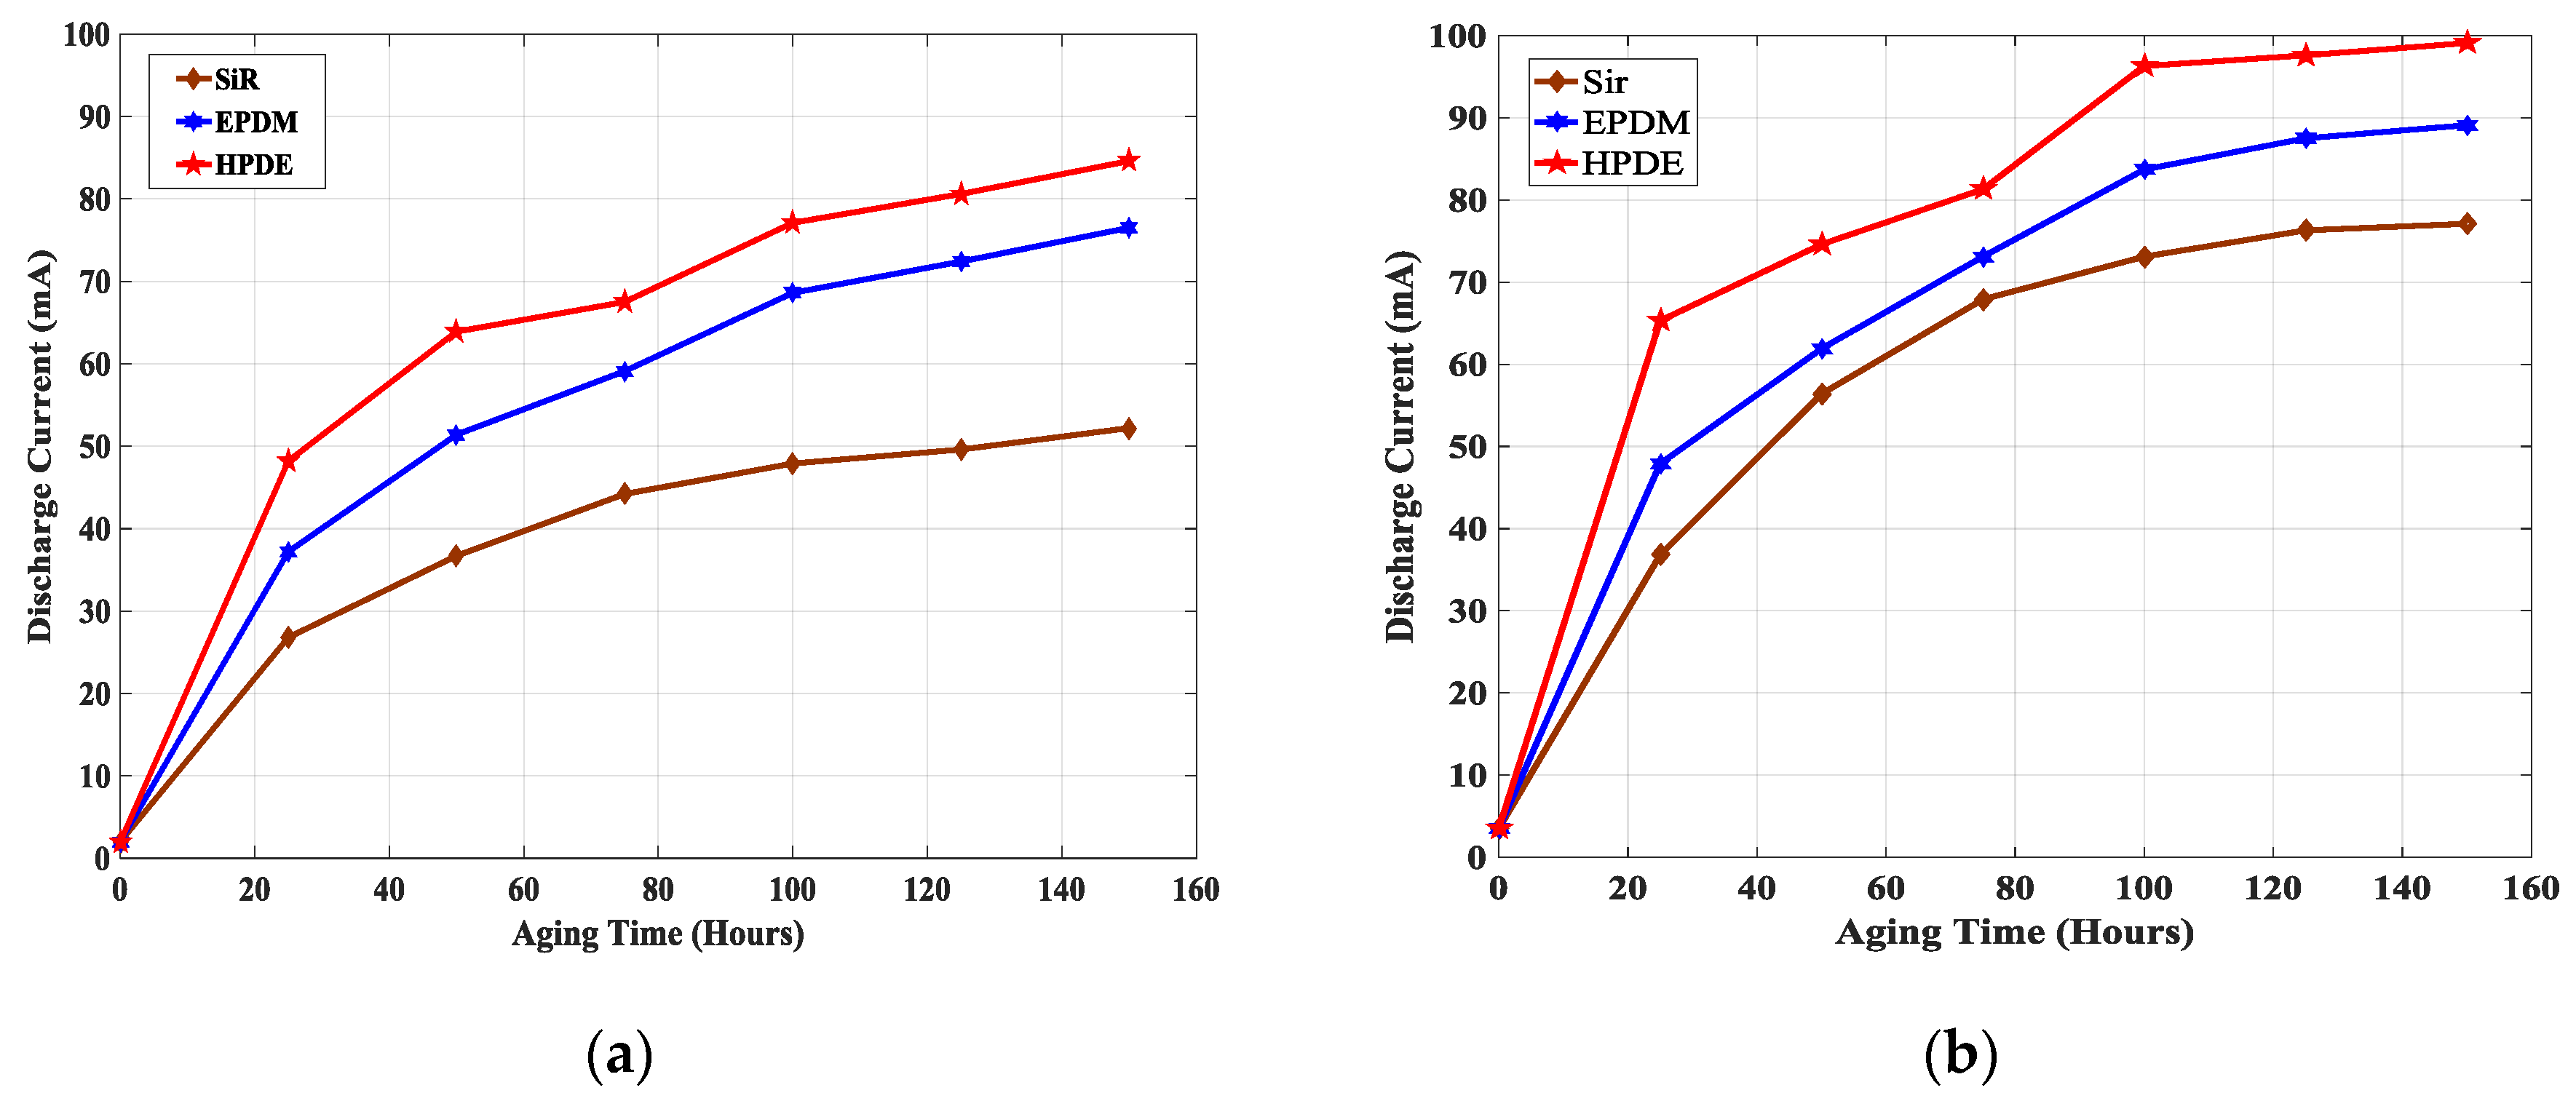
Figure 4.
E-field distribution along creepage distance: (a) During combined stress of saline contamination and acidic cold fog; (b) during combined stress of saline contamination and normal cold fog.
Figure 4.
E-field distribution along creepage distance: (a) During combined stress of saline contamination and acidic cold fog; (b) during combined stress of saline contamination and normal cold fog.
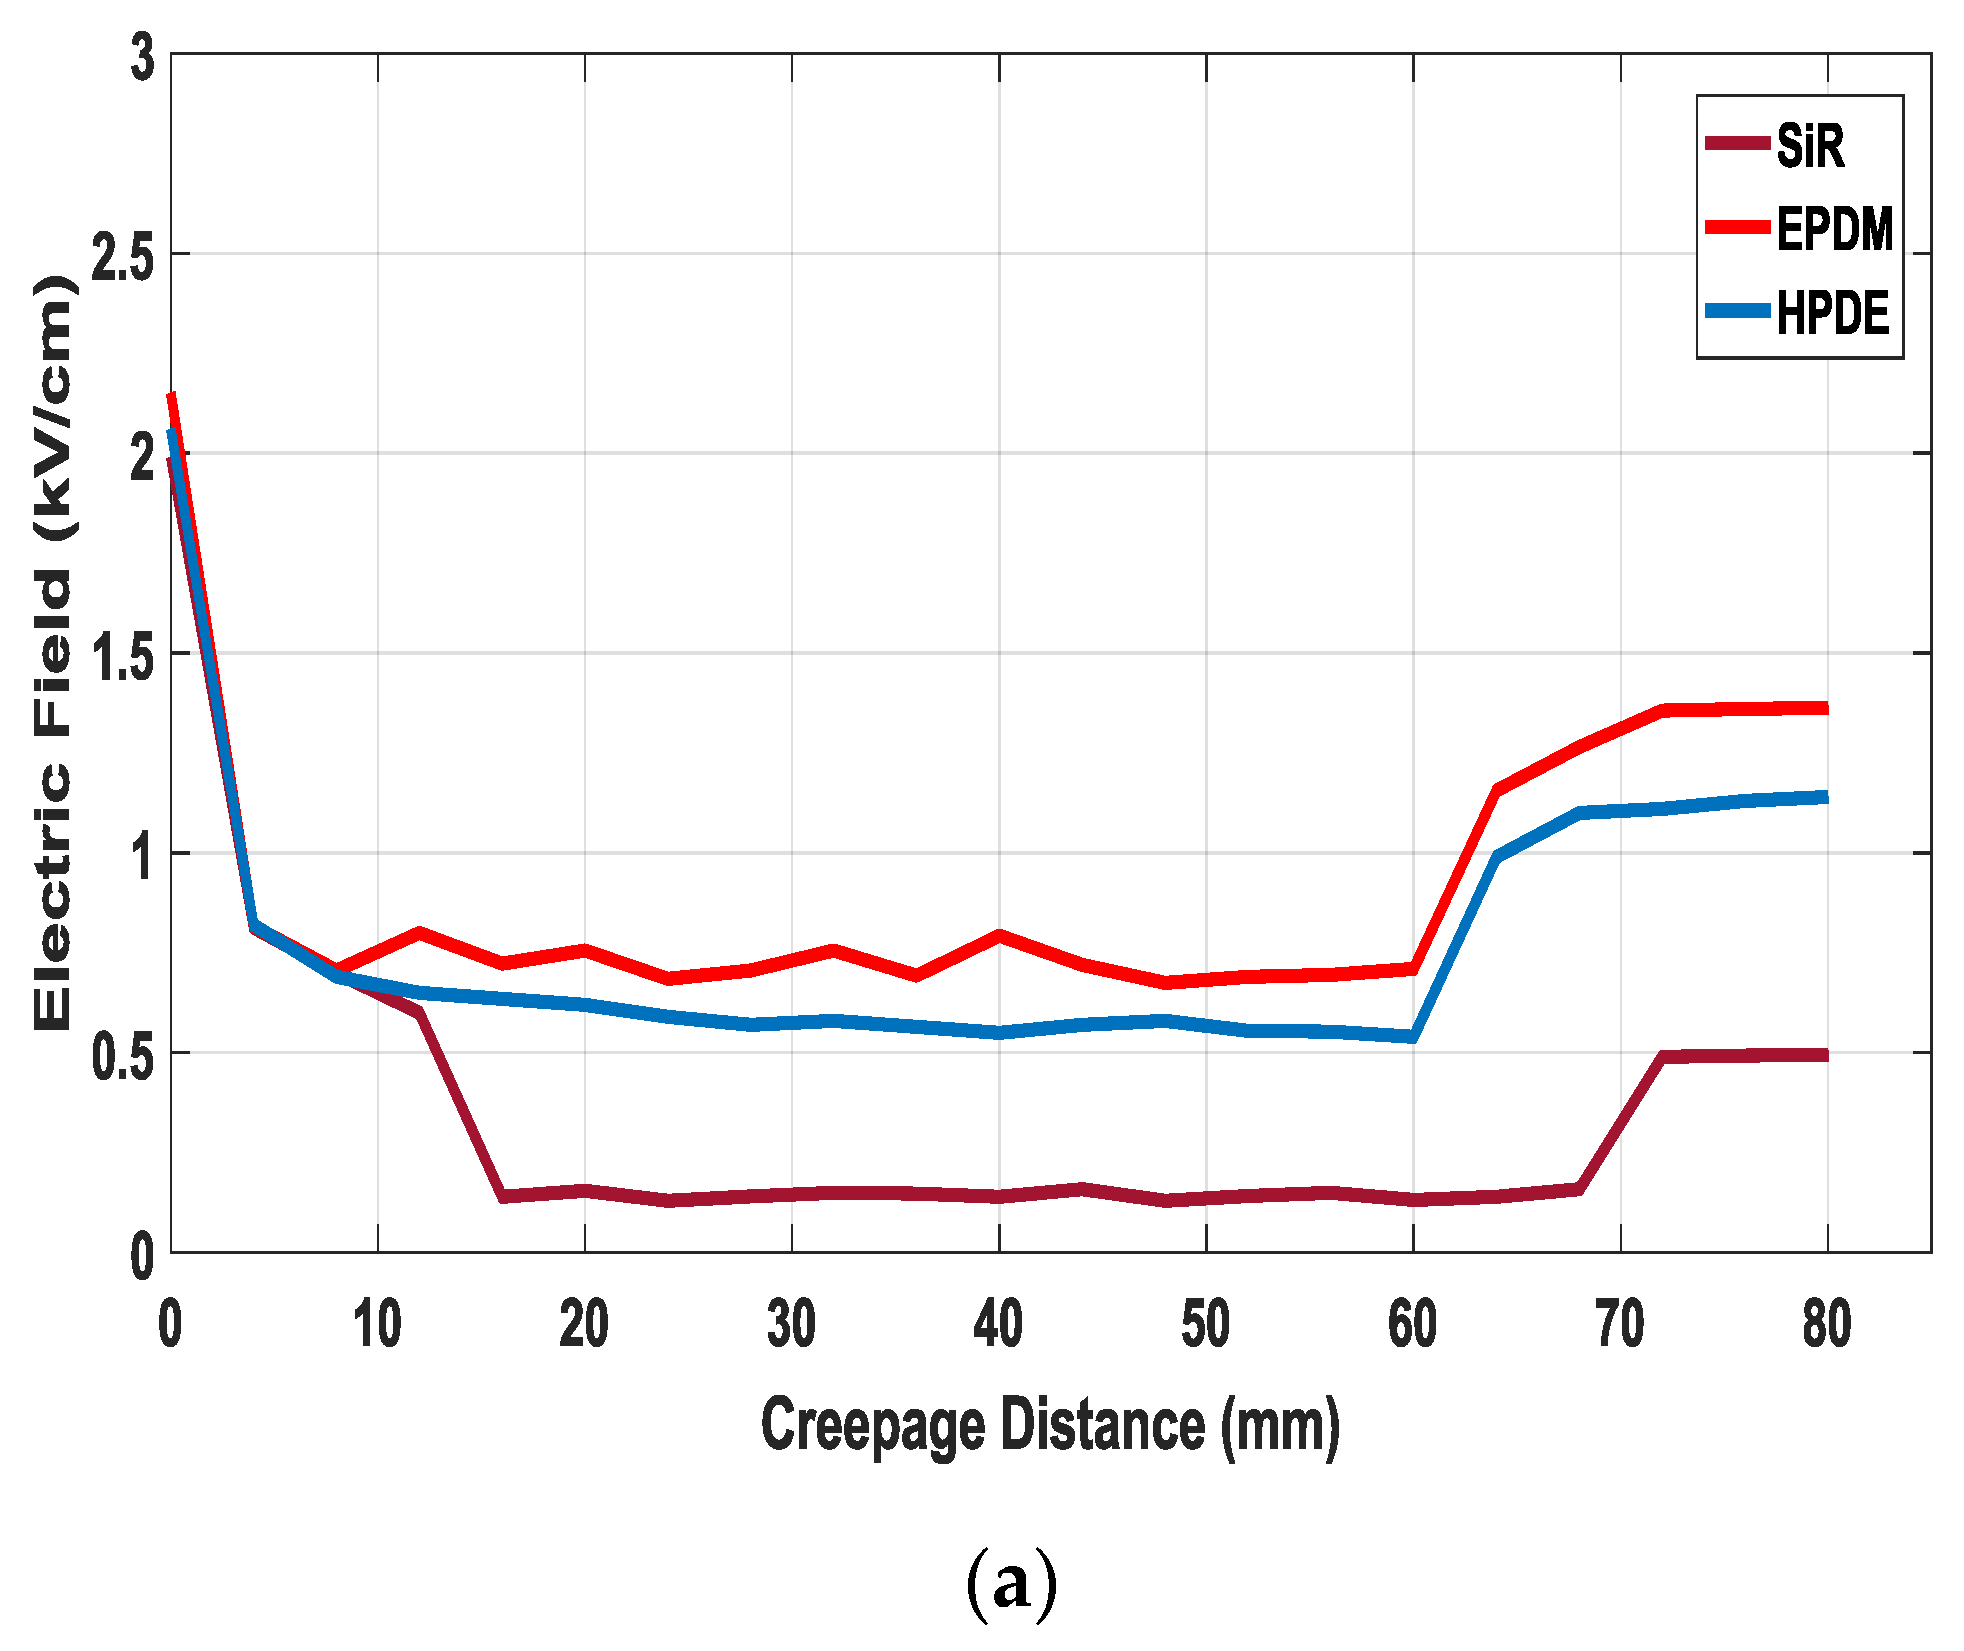
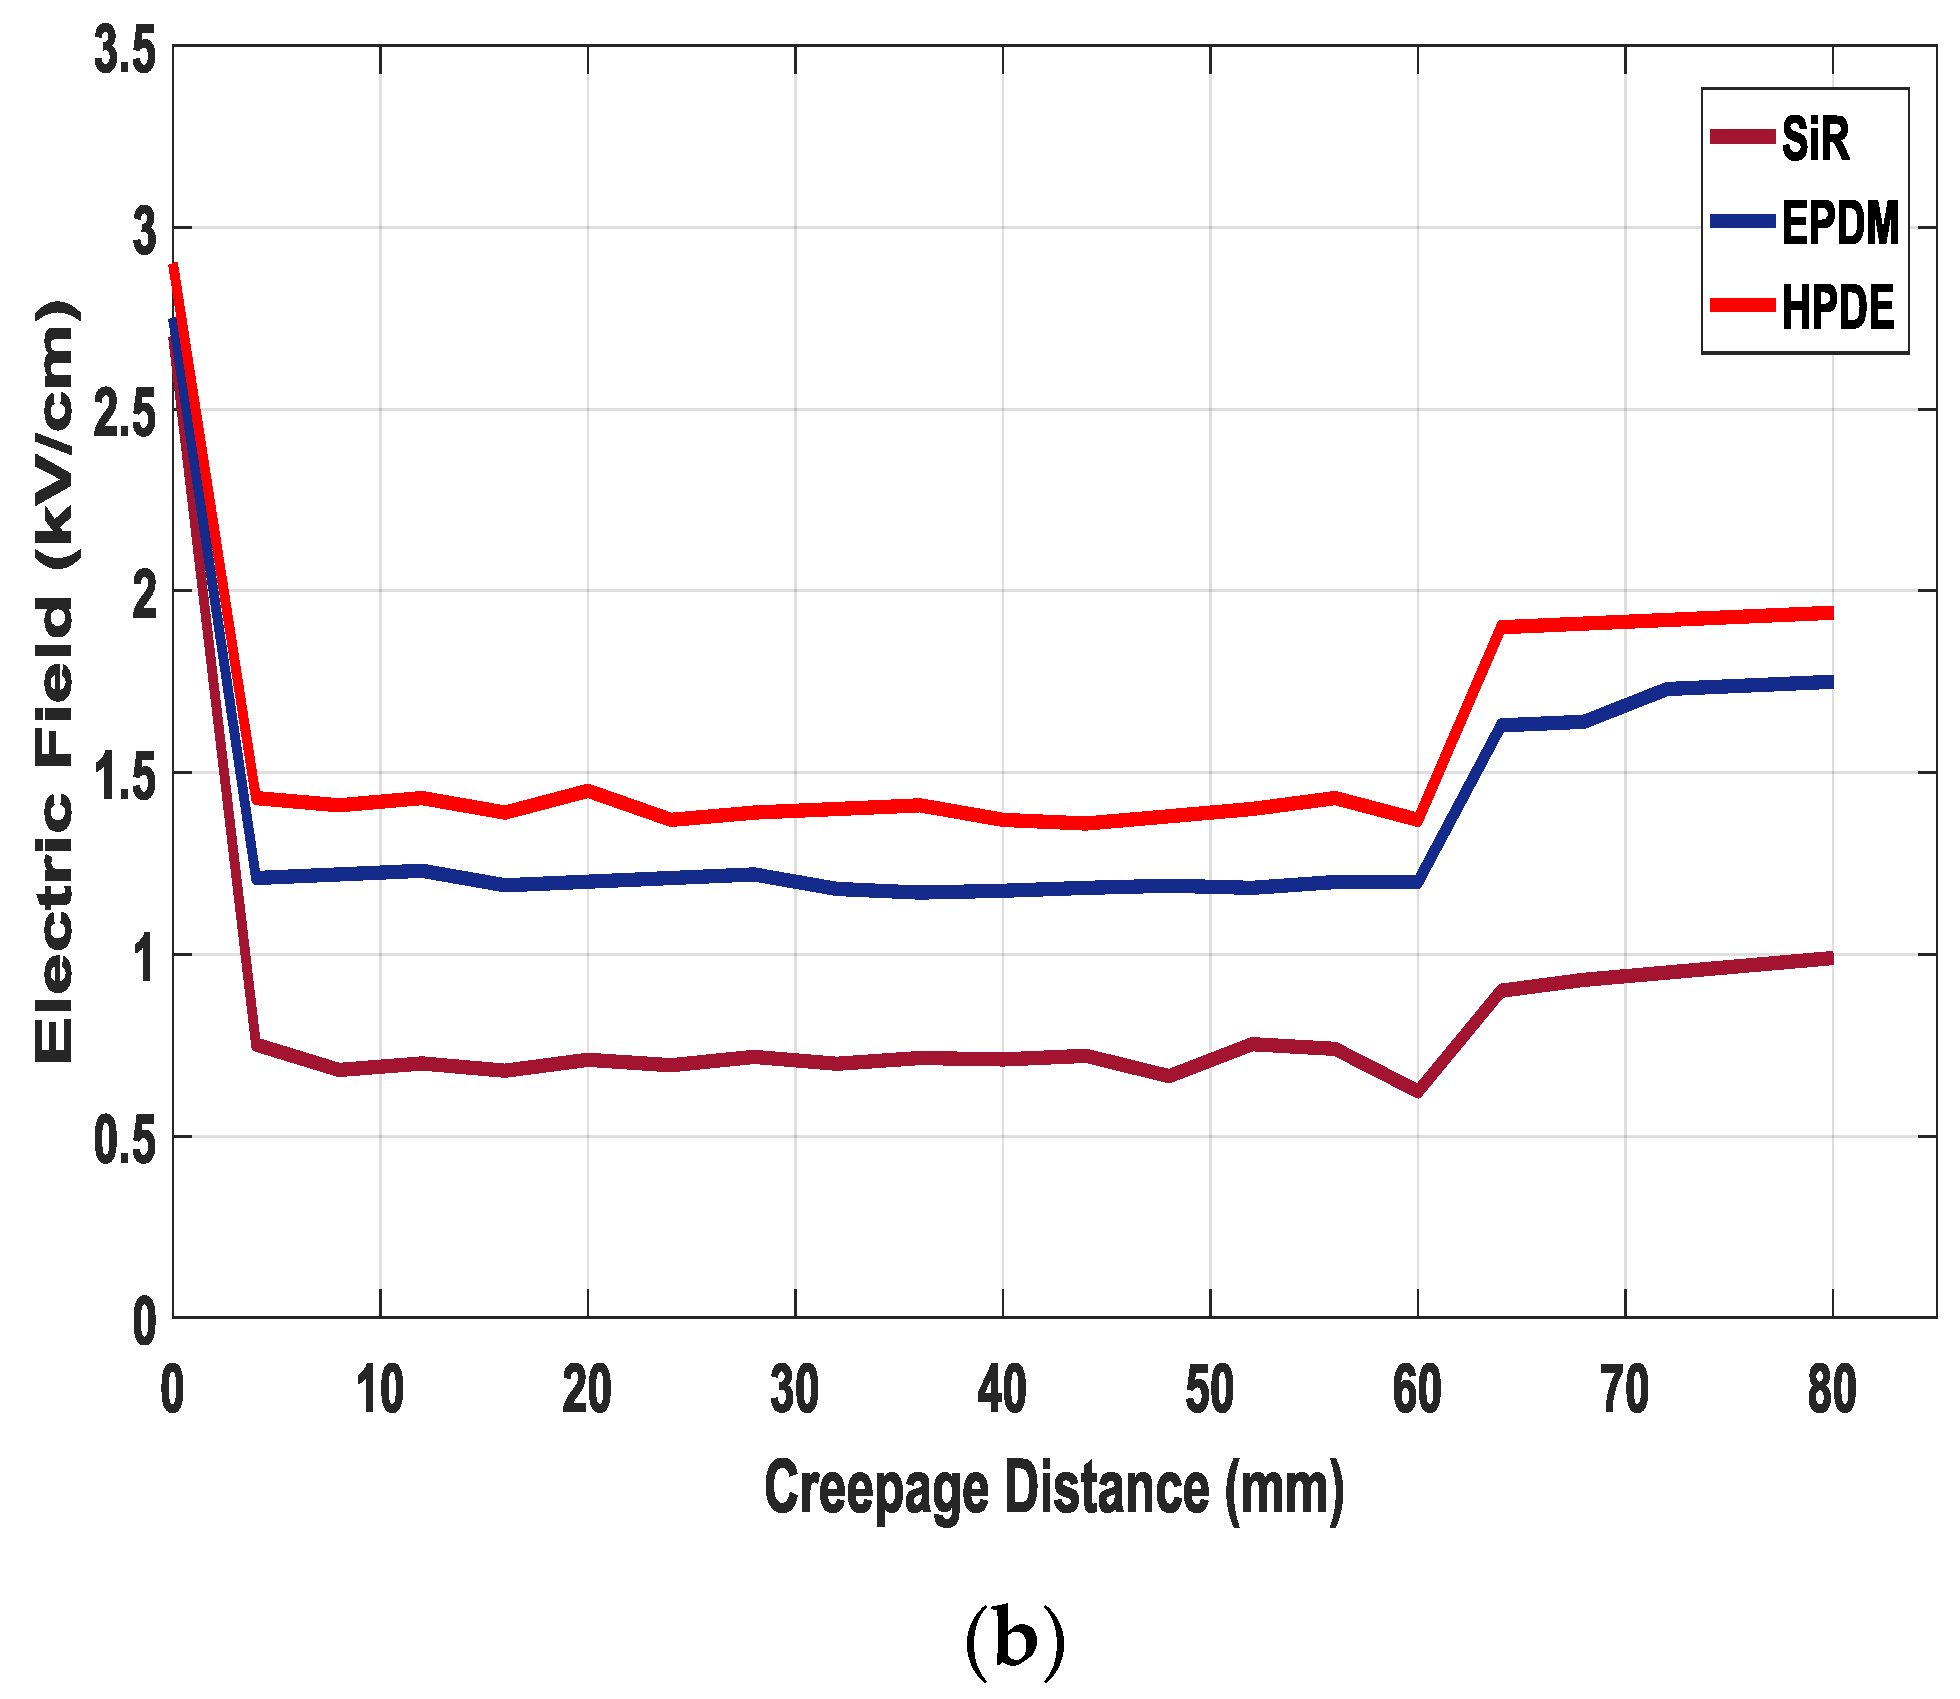
Figure 5.
Pieces of aged samples for physico-chemical analysis.

Figure 6.
Contact angles of virgin and aged samples.
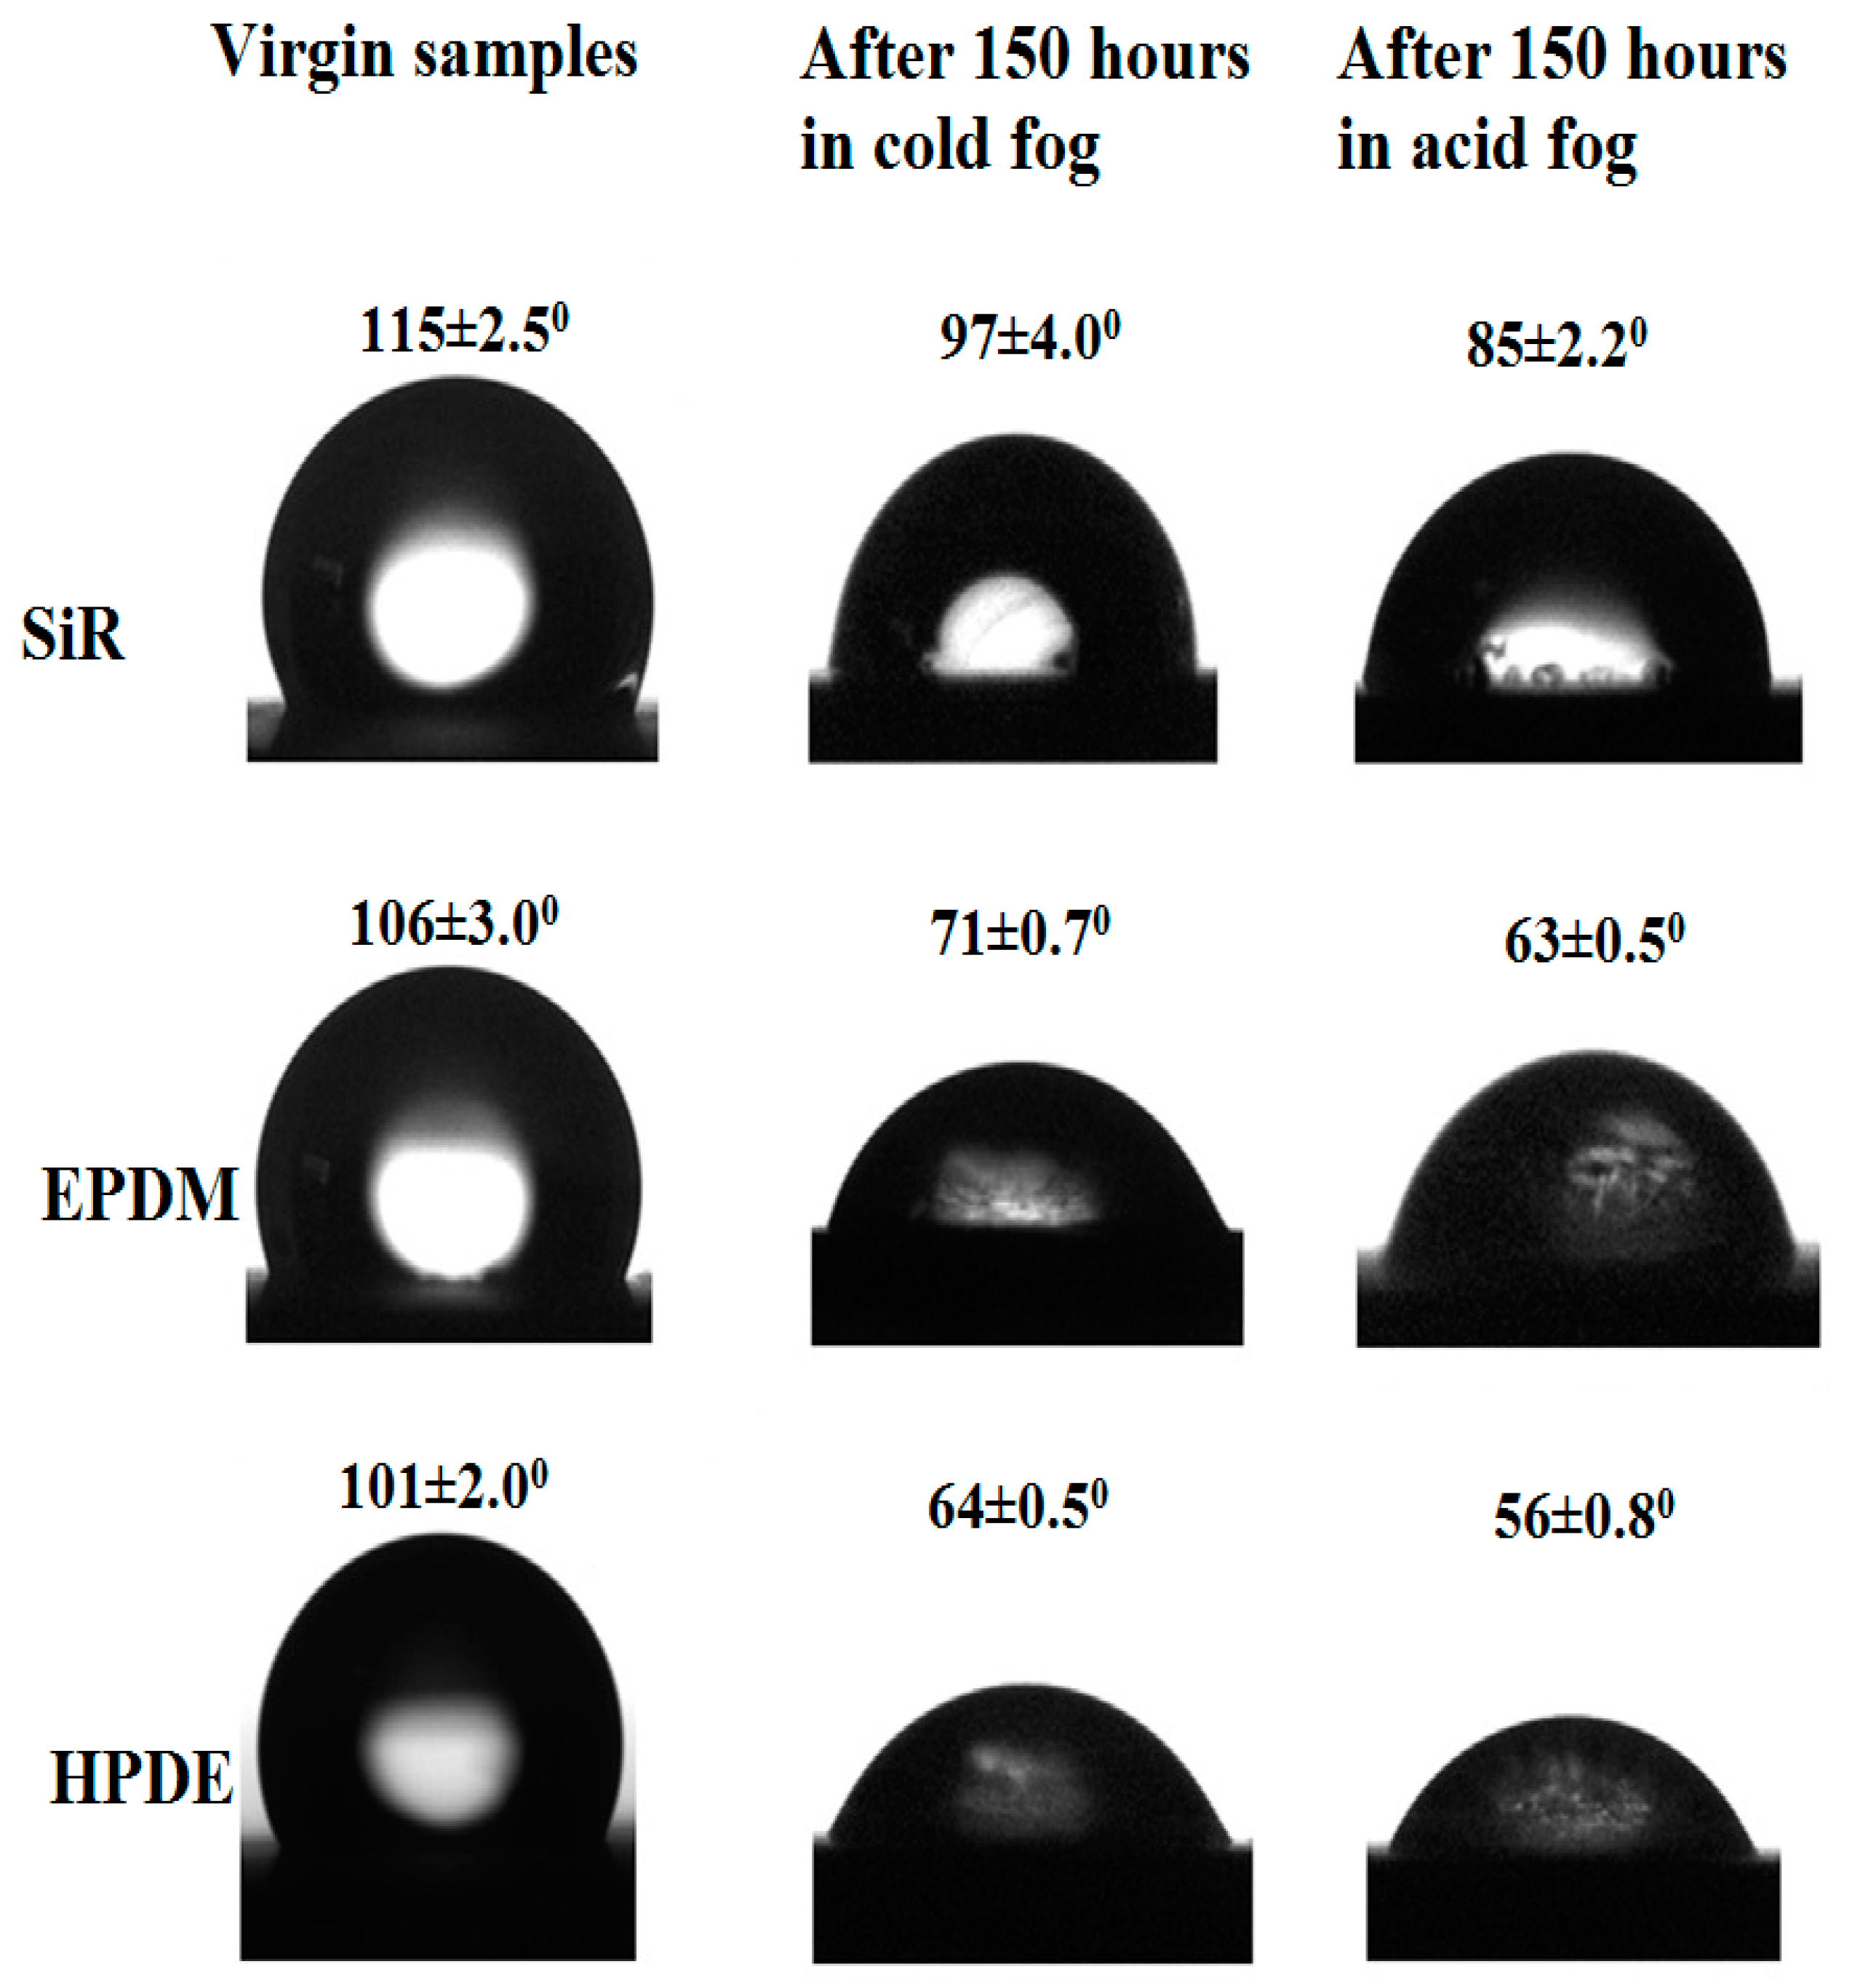
Figure 7.
SEM picture of insulator surface: (A) Surface aged in acidic cold fog for 150 h, (a) Virgin; (b) SiR; (c) EPDM; (d) HDPE; (B) surface aged in clean cold fog for 150 h, (a) SiR; (b) EPDM; (c) HDPE.
Figure 7.
SEM picture of insulator surface: (A) Surface aged in acidic cold fog for 150 h, (a) Virgin; (b) SiR; (c) EPDM; (d) HDPE; (B) surface aged in clean cold fog for 150 h, (a) SiR; (b) EPDM; (c) HDPE.
Figure 8.
Fourier Transform Infrared (FTIR) spectrum: (a) Aged sample of SiR, EPDM and HDPE in acidic cold fog; (b) aged samples of SiR, EPDM and HDPE in normal cold fog.
Figure 8.
Fourier Transform Infrared (FTIR) spectrum: (a) Aged sample of SiR, EPDM and HDPE in acidic cold fog; (b) aged samples of SiR, EPDM and HDPE in normal cold fog.


Table 1.
Composition for Acid of pH 3.6.
| Ingredients | Compositions (mg/L) |
|---|---|
| NH4Cl | 235 |
| KCl | 5.9 |
| HNO3 | 25 |
| MgSO4 | 35.2 |
| CaSO4·2H2O | 29.5 |
| NaCl | 170 |
Table 2.
Scenario during test.
| ON State | ON/OFF State |
|---|---|
| Saline contamination and acidic cold fog are deposited continuously from the start of the test at a constant voltage of 33 kV. | Saline contamination and acidic cold fog injections are periodically set to turn the setup on and off at constant voltage of 33 kV. |
Table 3.
Surface roughness parameters of all samples under various environmental.
| Types of Materials | Total SR (µm) | Root Mean sq. (SR) (µm) | Avg. SR (µm) |
|---|---|---|---|
| SiR | 4.78 ± 0.02 | 2.19 ± 0.02 | 1.01 ± 0.02 |
| 11.09 ± 0.02 | 3.330.02 | 3.29 ± 0.02 | |
| EPDM | 6.03 ± 0.02 | 2.46 ± 0.02 | 1.71 ± 0.02 |
| 16.51 ± 0.02 | 4.060.02 | 2.82 ± 0.02 | |
| HDPE | 7.93 ± 0.02 | 2.82 ± 0.02 | 1.99 ± 0.02 |
| 19.37 ± 0.02 | 4.40 ± 0.02 | 4.06 ± 0.02 |
Table 4.
Electric changes in acidic cold fog.
| Insulation Materials | Discharge Current (mA) | Tangent Loss % | Permittivity % |
|---|---|---|---|
| SiR | 77.1 | 54 | 1.1 |
| EPDM | 89.0 | 67 | 6.1 |
| HDPE | 99.1 | 285 | −5.2 |
Table 5.
Physical changes in acidic cold fog.
| Insulation Materials | Weight Loss % | Corrosion Speed (mg/h) |
|---|---|---|
| SiR | 0.05 | 0.016 |
| EPDM | 0.17 | 0.029 |
| HDPE | 0.19 | 0.95 |
© 2017 by the authors. Licensee MDPI, Basel, Switzerland. This article is an open access article distributed under the terms and conditions of the Creative Commons Attribution (CC BY) license (http://creativecommons.org/licenses/by/4.0/).
Share and Cite
MDPI and ACS Style
Hussain, M.M.; Farokhi, S.; McMeekin, S.G.; Farzaneh, M. Risk Assessment of Failure of Outdoor High Voltage Polluted Insulators under Combined Stresses Near Shoreline. Energies 2017, 10, 1661. https://doi.org/10.3390/en10101661
AMA Style
Hussain MM, Farokhi S, McMeekin SG, Farzaneh M. Risk Assessment of Failure of Outdoor High Voltage Polluted Insulators under Combined Stresses Near Shoreline. Energies. 2017; 10(10):1661. https://doi.org/10.3390/en10101661
Chicago/Turabian StyleHussain, Muhammad Majid, Shahab Farokhi, Scott G. McMeekin, and Masoud Farzaneh. 2017. "Risk Assessment of Failure of Outdoor High Voltage Polluted Insulators under Combined Stresses Near Shoreline" Energies 10, no. 10: 1661. https://doi.org/10.3390/en10101661
Note that from the first issue of 2016, this journal uses article numbers instead of page numbers. See further details here.