Gasification Performance of a Top-Lit Updraft Cook Stove

School of Mechanical and Materials Engineering, Washington State University, Pullman, WA 99164-2920, USA
*
Author to whom correspondence should be addressed.
Energies 2017, 10(10), 1529; https://doi.org/10.3390/en10101529
Submission received: 15 August 2017
/
Revised: 24 September 2017
/
Accepted: 26 September 2017
/
Published: 1 October 2017
Abstract
:This paper reports on an experimental study of a top-lit updraft cook stove with a focus on gasification. The reactor is operated with primary air only. The performance is studied for a variation in the primary airflow, as well as reactor geometry. Temperature in the reactor, air flow rate, fuel consumption rate, and producer gas composition were measured. From the measurements the superficial velocity, pyrolysis front velocity, peak bed temperature, air fuel ratio, heating value of the producer gas, and gasification rate were calculated. The results show that the producer gas energy content was maximized at a superficial velocity of 9 cm/s. The percent char remaining at the end of gasification decreased with increasing combustion chamber diameter. For a fixed superficial velocity, the gasification rate and producer gas energy content were found to scale linearly with diameter. The energy content of the producer gas was maximized at an air fuel (AF) ratio of 1.8 regardless of the diameter.
1. Introduction
In large portions of the world cooking and heating are traditionally done using biomass fuel sources, such as, wood, charcoal, or rice husks. Recently there has been considerable interest in producing affordable biomass cook stoves with relatively low emissions [1,2,3,4] because of the global health problem to women and children that traditional cooking methods pose.
In much of the world a traditional three-stone fire is used for cooking purposes. Numerous improved biomass cookstove designs have been developed. The most common design consists of a side-fed, cylindrical combustion chamber found in, for example, the rocket stove [5]. These stoves are batch-fed and typically burn small diameter wood sticks. There have been numerous studies conducted of the heating performance and emissions produced by these designs. MacCarty and Bryden [5] conducted a review of numerous studies to compile a comprehensive dataset. A review of the data showed that combustion chamber height and insulation had a substantial effect upon stove efficiency.
Small scale biomass gasifiers have emerged as a promising cook stove design. Gasifiers small enough to address this need are typically batch-fed and easy to control. The gasification is controlled by the air supply which may be introduced through the bottom of the gasifier (updraft) or the top/middle of the gasifier (downdraft). Cook stoves with this design typically have primary air ports at the bottom of the unit through which the air for gasification is introduced and secondary air ports to supply air for the combustion of the producer gas generated by gasification. Several studies have shown that gasification-based stoves have higher efficiencies and lower emissions than other designs [6,7,8]. These stoves may be used for cooking but also have the possibility to be used as a gasifier for producer gas generation or charcoal generation. These stoves may be used for cooking but also have the possibility to be used as a gasifier for producer gas generation or charcoal generation. The producer gas may be used for heating or for power production [9] in an engine.
Reed and colleagues were among the first to study a small-scale TLUD (Top-Lit Updraft Gasifier) [10]. Their work showed the impact of gas superficial velocity on the performance of the gasifier in terms of gasification rate and char production. The gasification rate increased with increasing superficial velocity. At very low superficial velocities operation was compromised by excessive condensable tars. Fatehi and Kaviany [11] conducted experimental and numerical studies of the flame front propagation in an updraft biomass reactor. They identified operating regimes based on the pore velocity (a function of the air supply rate) including extinction limits, as well as an oxygen-limited regime in which the front velocity increased with increasing pore velocity. Porteiro et al. [12] measured flame front velocity as a function of air supply rate in an updraft biomass reactor. Similar to Fatehi and Kaviany [11] they identified three distinctive regimes; an oxygen limited regime, a reaction limited regime, and a cooling or quenching regime. Ronnback et al. [13] also found similar regions in a downward flame propagation system.
There are numerous studies of TLUD cook stove performance in a standard water boil test characterized by parameters such as time to boil, fuel consumption rate, and efficiency [14,15,16,17]. Efficiency is often quantified as the ratio of the heat absorbed by the water to the heat content of the biomass. However, relatively few quantify the relative contributions of the heat provided by the producer gas and the charcoal. By quantifying the heat supplied by the producer gas the gasification efficiency may be determined. The gasification efficiencies for downdraft systems is reported by several investigators to be in range of 60–80% for the cold gas in large scale units [18,19,20]. Varun et al. [14] conducted experiments in a TLUD stove operated as a gasifier (no secondary air) in which the concentrations of producer gas were measured. They report a hot-gas gasification efficiency of 52%. The relatively low efficiency was postulated to be due to the ineffectiveness of the TLUD design in cracking heavy tars into lighter hydrocarbons. Ryu et al. [21] conducted experiments in an updraft biomass reactor with both primary and secondary air flows. Although some gas concentrations were measured they did not calculate a gasification efficiency. They did however, document the progression of the flame front through the reactor bed. They identified two regions for a reactor run, gasification during which the flame front propagated through the reactor, and char oxidation which began after the flame had reached the bottom boundary of the reactor. At this boundary they recorded the percent of the original fuel mass consumed. Typically 70% to 85% of the original fuel mass was consumed indicating that the char mass left at the end of gasification was 15% to 30% of the fuel mass [9].
In this study, experiments are conducted with a modular cook stove test apparatus that allows for independent control of stove geometry and airflows. In this investigation the cookstove is operated as a gasifier; that is, only primary air is supplied to the unit. The system is operated in a forced induction mode, that is, the primary air is supplied by a fan.
2. Materials and Methods
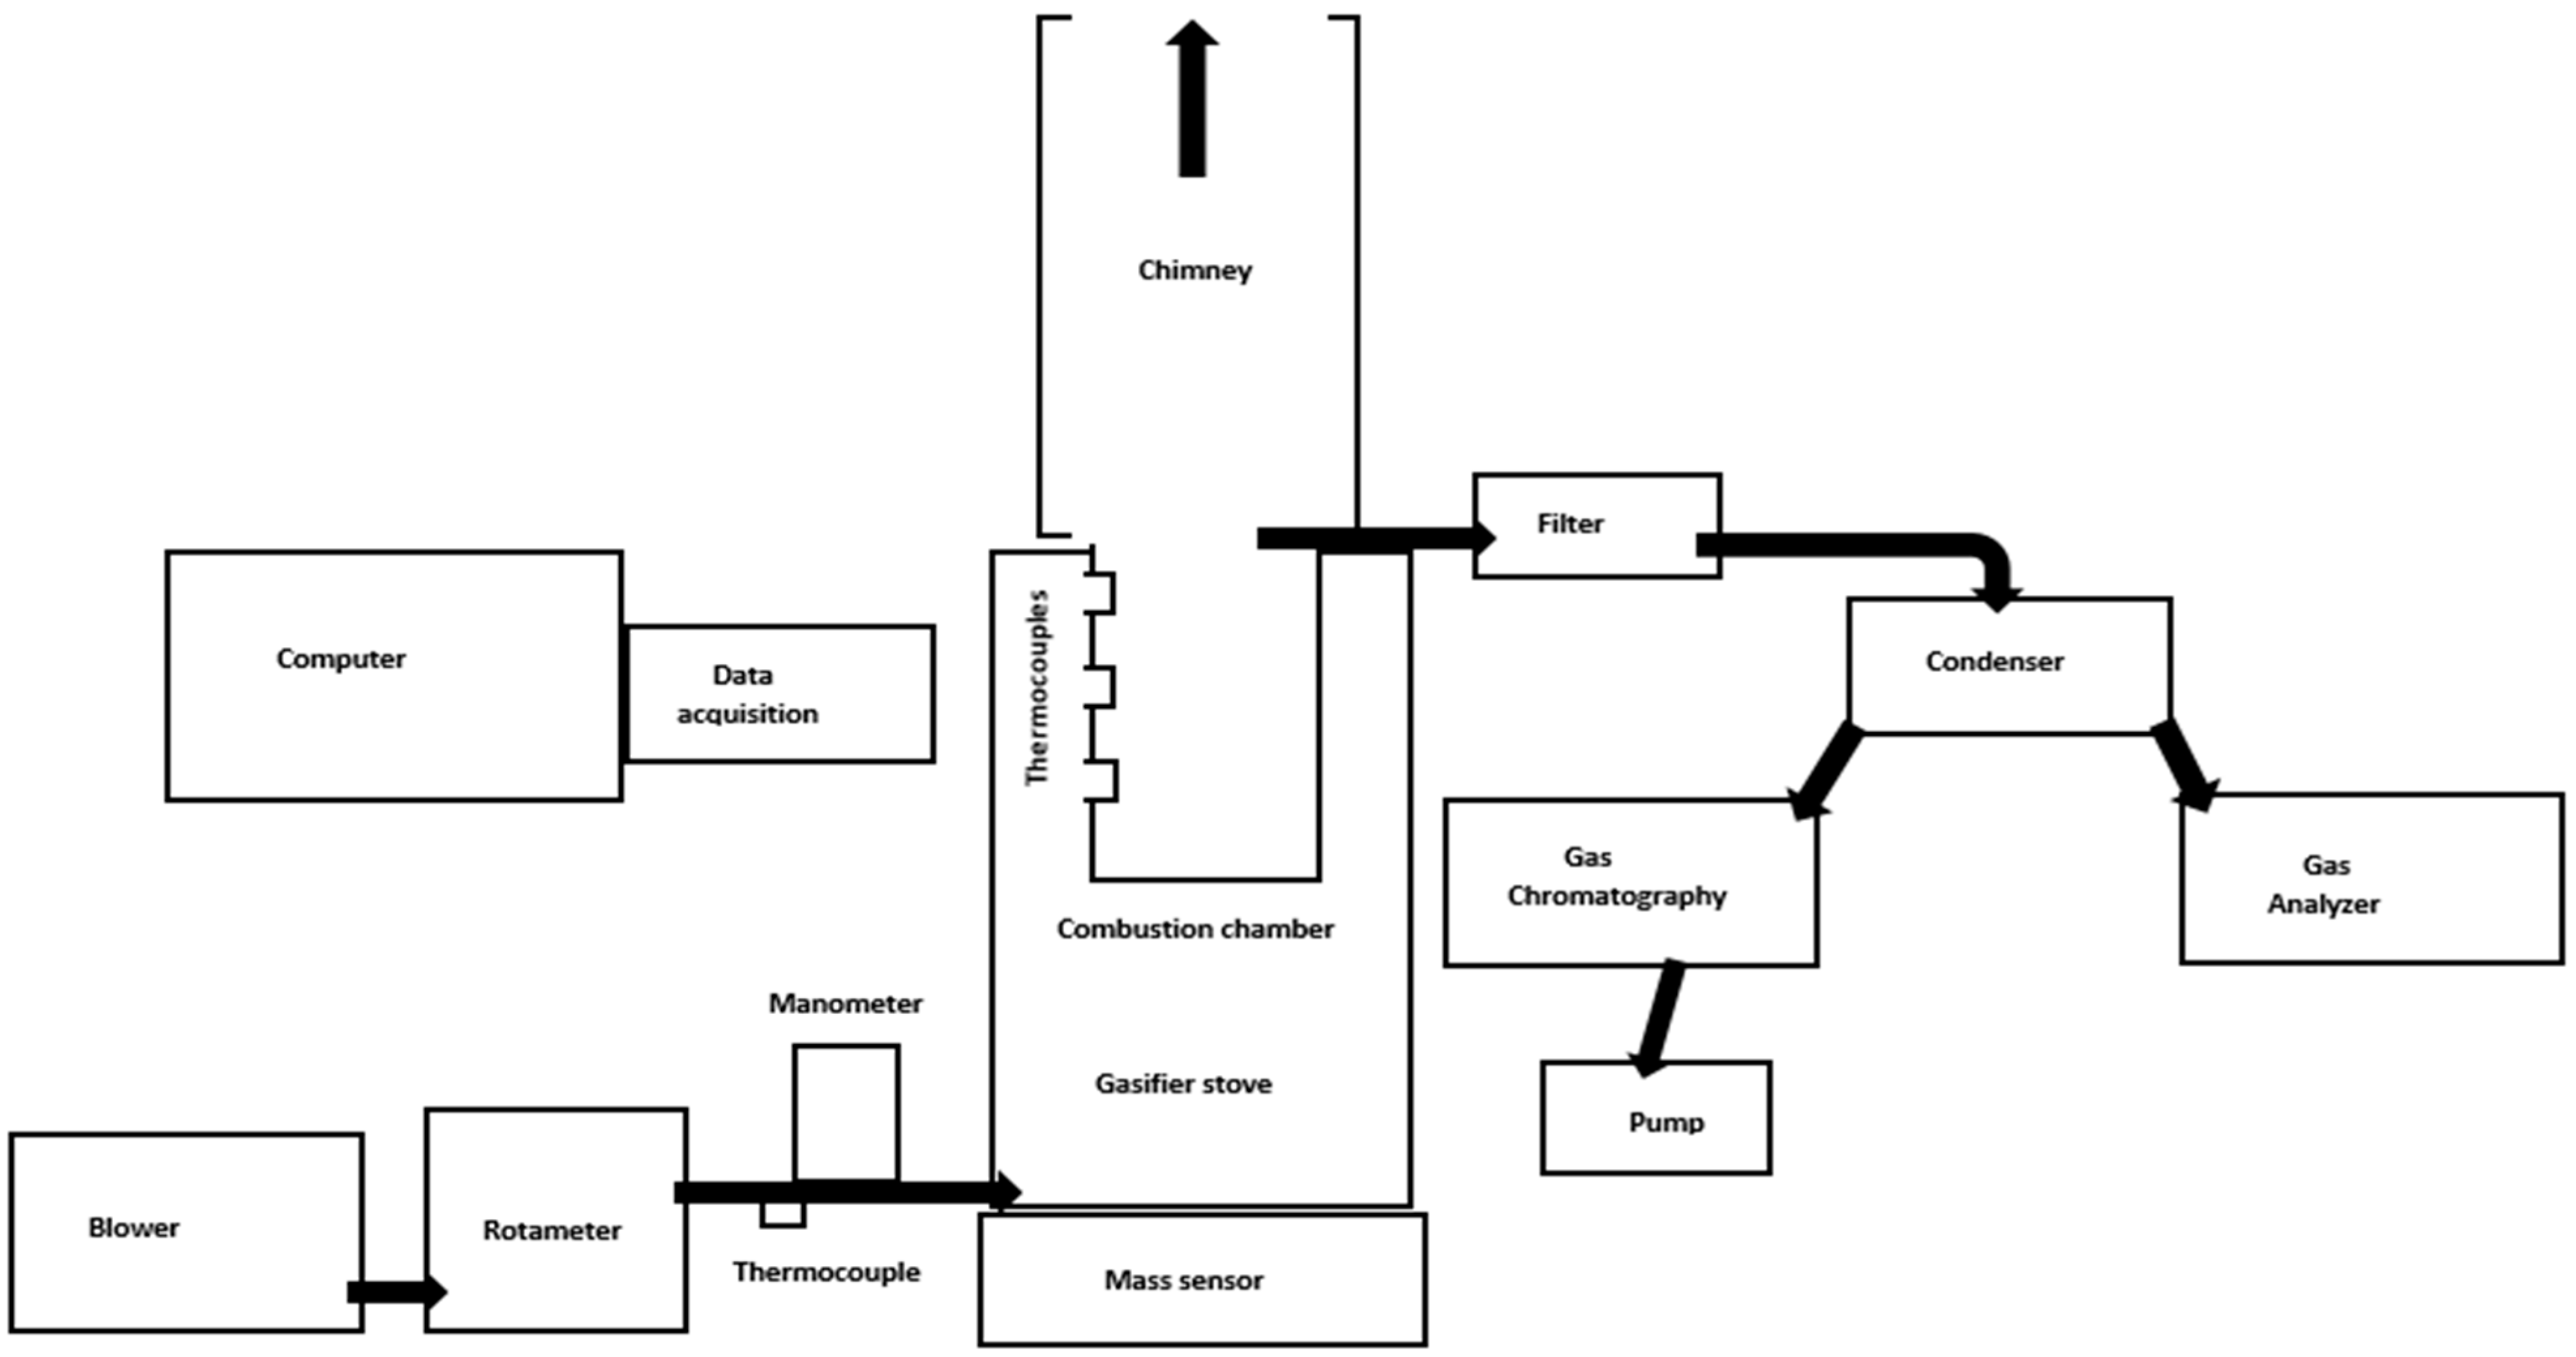
The experimental facility consisted of a small-scale batch gasifier, as shown in Figure 1. The housing or gasifier had an external diameter of 304 mm and a height of 457 mm. Combustion chambers of different diameters and lengths could be fit into this housing. The four different sizes of combustion chambers used in this study are shown in Table 1. Inlet air, provided by a blower, was introduced at the bottom of the gasifier and then entered the combustion chamber through 11 circular holes, located on the circumference of the chamber, each with a diameter of 3.175 mm. The air flow rate was monitored by a rotameter. The temperature and pressure of the incoming air was monitored using a type-K thermocouple and a manometer. Three equally-spaced type-K thermocouples were placed axially inside the combustion chamber along the wall of the combustion chamber as shown in Figure 1 and Figure 2. Fuel consumption, or mass loss, was monitored during the experiment by placing the entire gasifier on a digital scale. For monitoring mass loss and temperature as a function of time a data acquisition system with a sampling rate of 15 s was used to display results on computer. Gases (CO, H2, CH4, O2, CO2) were analyzed with two different methods. A fga4000xds infrared gas analyzer (Hayward, CA, USA) was used to measure gas concentrations in-situ. This device employs non-dispersive infrared technology to measure HC, CO, and CO2 concentration and an electrochemical cell to measure NOx and O2 concentration. In addition, batch samples of gas were acquired during each run for later analysis using GC (gas chromatography) (Agilent technologies, Santa Clara, CA, USA) which uses three step approach- 1. Injecting sample into the GC 2. Separating the sample into individual components 3. Detecting the compound in the sample. A vacuum pump was used downstream to collect samples of producer gas using a gas inlet port above the fuel layer. To separate moisture and tar (heavy hydrocarbons) from the gas sample a condenser and filter were placed inline upstream of the gas analyzer, as shown in Figure 1. Softwood pellets were selected as the biomass fuel for the experiment. The pellets ranged in size from 5 to 35 mm and had a lower heating value of 15 MJ/kg. Details of the fuel characteristics are provided in Table 2. The properties of the fuel were measured on a dry basis and the moisture content was measured before the start of each experiment to ensure uniform content. The fuel was packed into the combustion chamber at ambient conditions. The top layer of pellets was soaked in lighter fluid to aid ignition and to ensure a uniform distribution of the pyrolysis front. The pyrolysis front is defined as the 2-D reacting fuel layer in the packed bed which propagates downwards in the chamber as the fuel is consumed. In all of the experiments 10% of the total fuel weight was put into a container with a few grams of lighter fluid (petroleum based), and mixed before adding the pellets to the top of the fuel bed. The top layer was then ignited and once the flaming process started, air was supplied from bottom of the combustion chamber using the blower. The flaming pyrolysis front then progressed down through the fuel bed from the top layer to the bottom. Temperature and mass data acquisition was initiated 100–200 s after ignition (to allow flame stabilization) and continued throughout the experiment until the biomass was consumed. Gas concentration data were collected once the temperature at the midpoint of the combustor reached 700 °C. In addition, at the end of a run the amount of charcoal remaining was measured gravimetrically.
Experiments began with the 100 mm diameter reactor as a base case to establish the effects of superficial velocity on the operation of the TLUD gasifier. In further experiments, the geometry was varied. As shown in Table 1 three diameters and three lengths were tested. The air superficial velocity was defined as the velocity of supplied air through the combustor based on the cross-sectional area of the combustor and the volumetric flow rate of the ambient air. From the measurements the pyrolysis front velocity, peak bed temperature, air fuel ratio (AF), heating value of the producer gas, and gasification rate were calculated. The uncertainty in measurements, such as temperature, mass, gas composition, etc., were calculated by combining the bias and random errors to yield the total error. For calculated quantities, such as velocity, mass flow rate, etc., error propagation was used to arrive at the total uncertainty.
3. Results and Discussion
The 100 mm diameter reactor was tested over a range of air superficial velocities to establish the boundaries of four distinct operating regimes. The superficial velocity was varied from 0 to 30 cm/s. The effect of air superficial velocity on the mass loss rate is shown in Figure 3. The mass loss rate is defined as the amount of fuel consumed per unit time. For a superficial velocity less than 1.5 cm/s ignition did not occur. Between 1.5 cm/s and 2.5 cm/s, the pyrolysis front temperature was less than 500 °C, too low to sustain a flame. This region is classified as smoldering combustion based on [22,23]. The mass loss of fuel occurs not because of gas phase reactions occurring between air and the producer gas, but because of heterogeneous char reactions between the incoming air (gas) and the char surface [17]. From 2.5 to 16 cm/s the process is classified as gasification. The gasification rate is defined as the mass loss rate in the gasification regime (2.5 < Vs < 16 cm/s). The gasification rate shows a nearly linear increase with the superficial velocity. In this region the reaction is mixing limited, so that as airflow is increased more fuel reacts and the reaction moves towards stoichiometry (AF ~6). Mass loss rate increases with increasing superficial velocity until a maximum is reached. The mass loss rate in gasification regime is consistent with Varun et al. [14] data where the experiments on stoves were performed only between a superficial velocity of 3 cm/s to 6 cm/s for wood blocks as a fuel. However, the present study goes beyond 6 cm/s. Beyond a superficial velocity of 16 cm/s the mass loss rate becomes relatively constant. The mass loss rate is essentially independent of the superficial velocity. Thus, no gain in gasification performance is derived by adding more air. This region is defined as sub-stoichiometric combustion. The regions defined in Figure 3 are in agreement with those found in previous studies [11,12,13].
3.1. Effect of Superficial Velocity
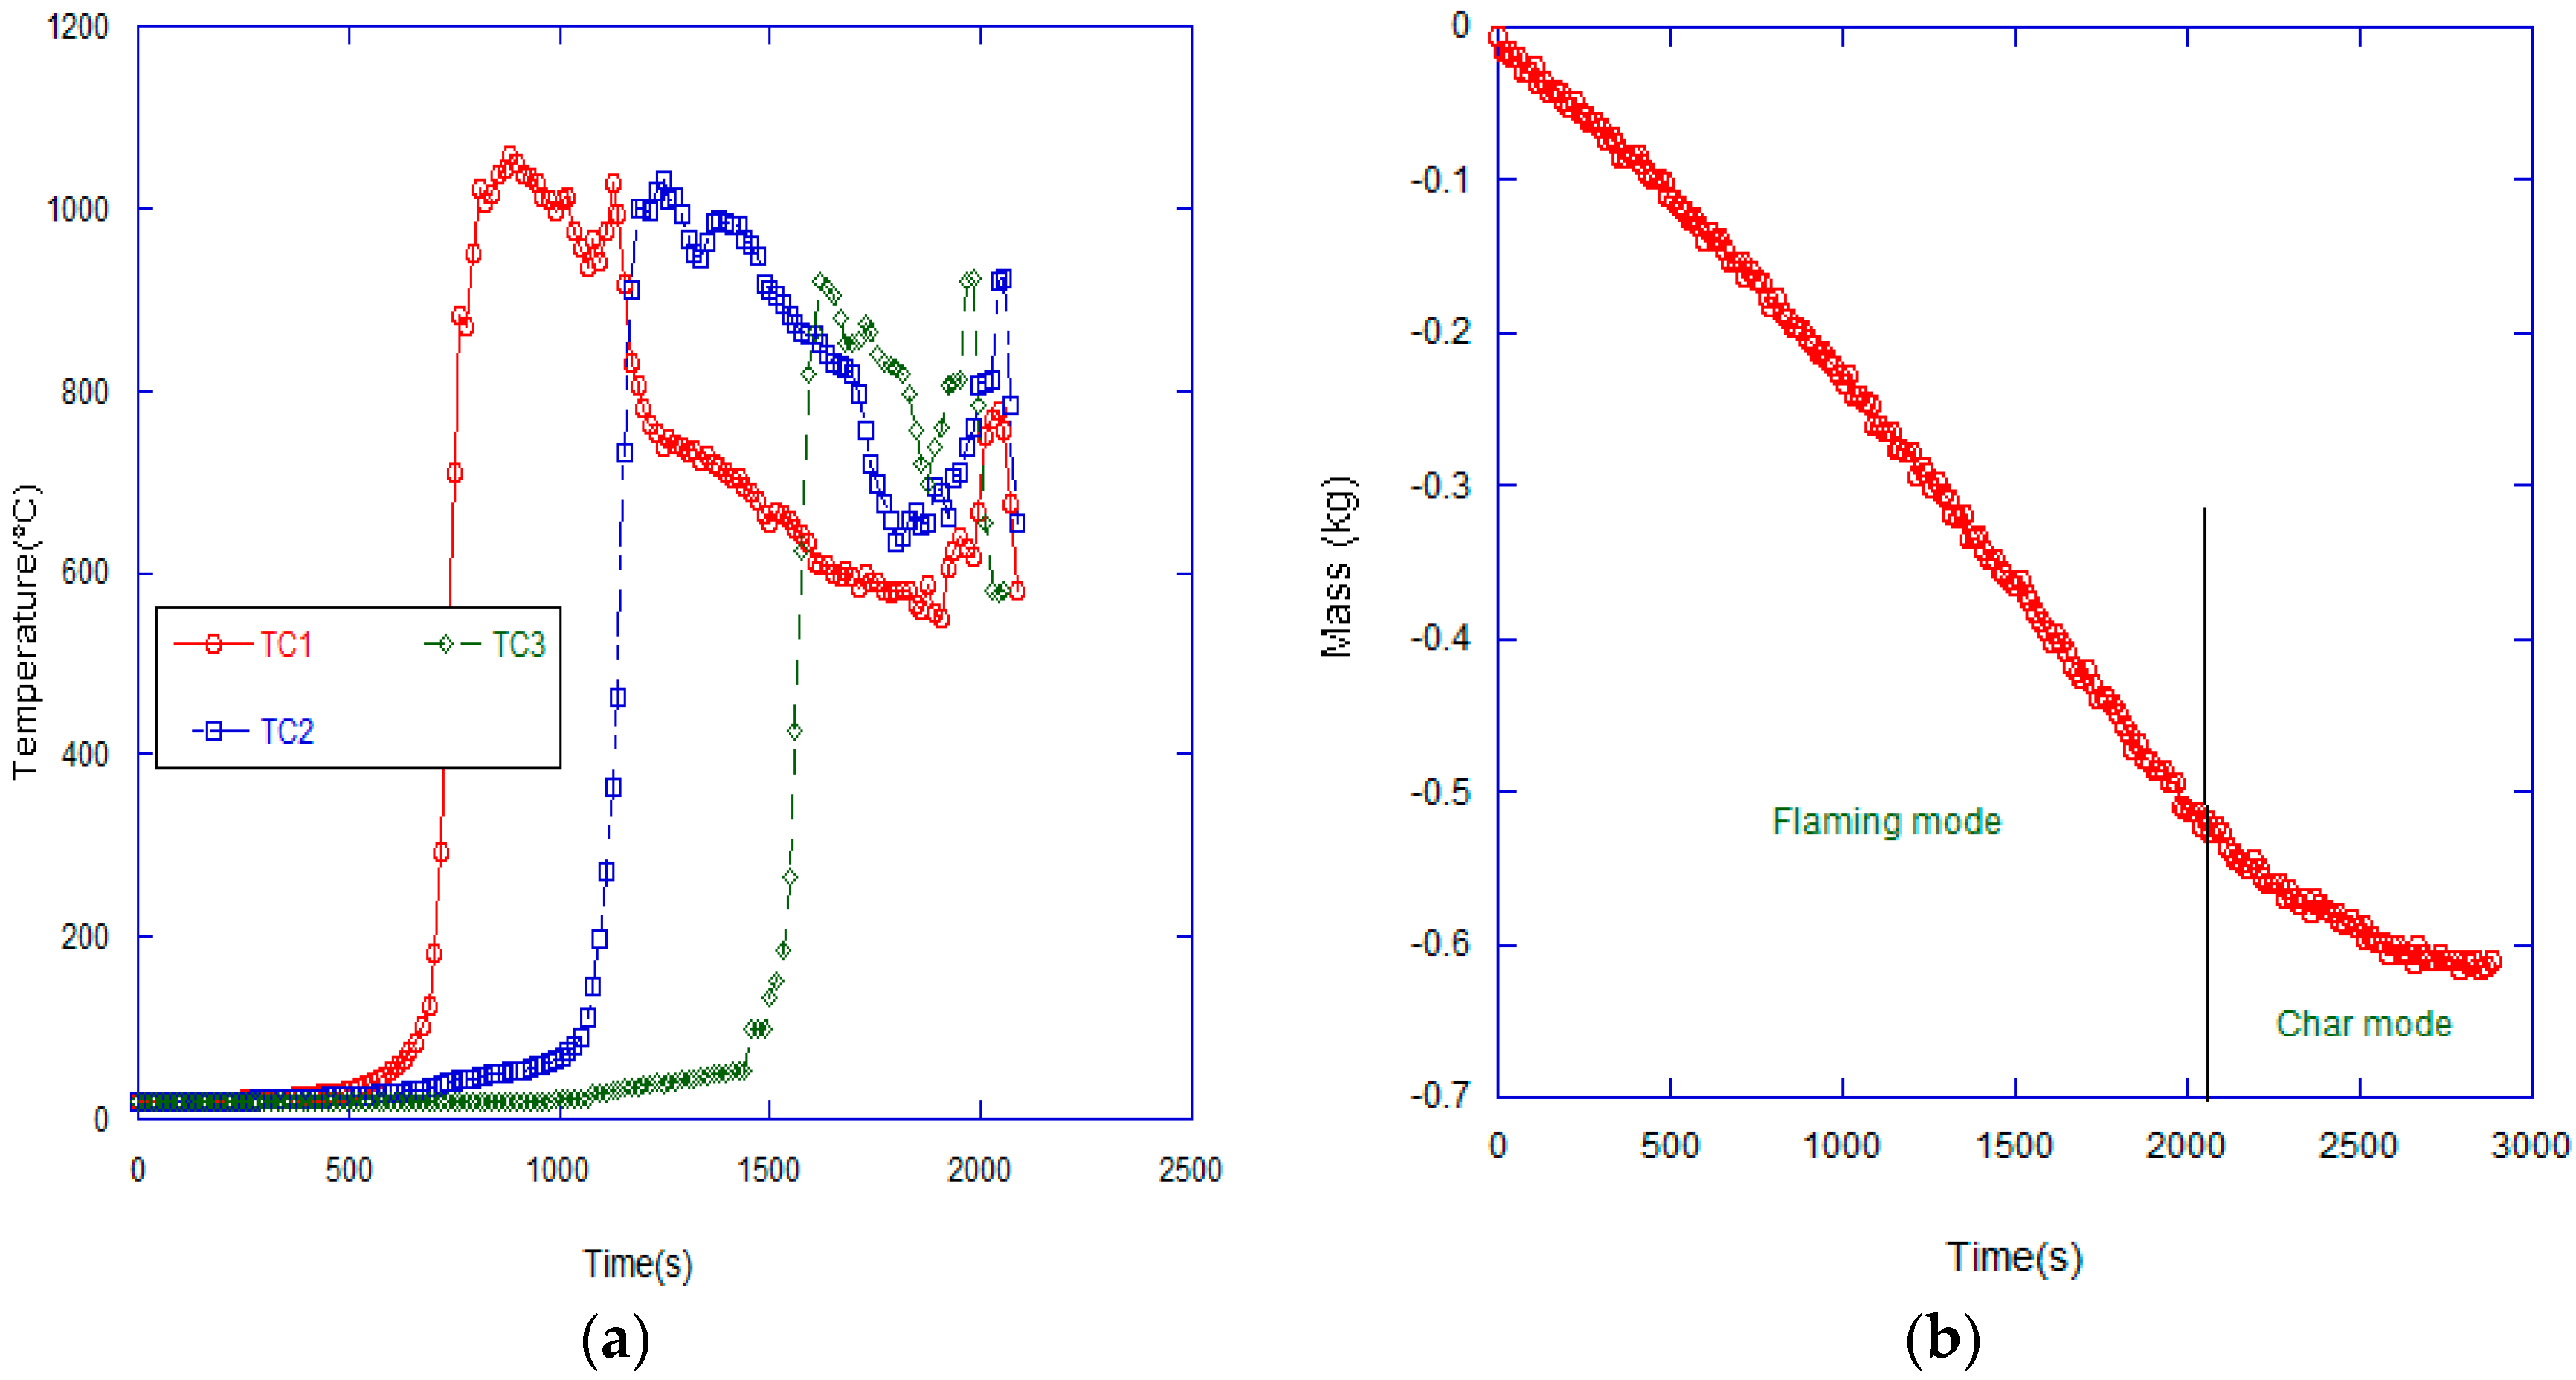
Four superficial velocities were selected to span the gasification regime; 2.5 cm/s, 6 cm/s, 9 cm/s, and 16 cm/s. In the gasification regime of operation there are four distinct processes; drying, pyrolysis, partial oxidation of volatiles, and reduction. In the TLUD chamber the flame front propagates down through the chamber. Heat transfer from the flame front down through the bed leads to evaporation of moisture from the fuel, or drying. Pyrolysis or devolitization begins to occur at approximately 300–400 °C. Here, char is produced and the volatile gases released include H2, CO, CO2, CH4, and higher hydrocarbons or tars. Partial oxidation of these volatiles releases additional heat required for reduction to occur. Reduction, or gasification, starts at approximately 700 °C, with higher temperatures leading to more producer gas generation. In the gasification process the char reacts with CO2 to produce CO and with H2O to produce H2 and CO. Methane, CH4, is generated by two main mechanisms: reaction of CO with H and reaction of char with H. Temperature history data for each of the three thermocouples placed in the gasifier are shown in Figure 4a. The history of each thermocouple can be correlated to each of the four processes discussed. Drying and pyrolysis occur as the temperature rises from ambient up to approximately 300–500 °C. Around the maximum temperature (~700–1000 °C) gasification begins and the temperature begins to drop afterwards. The time between temperature peaks occurring for each thermocouple can be used to calculate the flame front velocity. As the flame front moves from the top to the bottom of the char bed all the volatiles are removed and fixed carbon, char, is left behind. At this point, an oxidation reaction takes place between the incoming air and the char. The data at the end of each thermocouple reflects this. As with the other thermocouples, the temperature rises to a maximum and gasification occurs, but rather than a steady decline of temperature after the maximum is reached, the temperature rises as the char oxidation reaction begins. CO2 is produced and is subsequently reduced into CO and, further up the gasifier, a small amount of H2 is produced. This transition from pure gasification, the flaming mode, to the char mode can be seen in Figure 4b where the mass loss history of the fuel is presented.
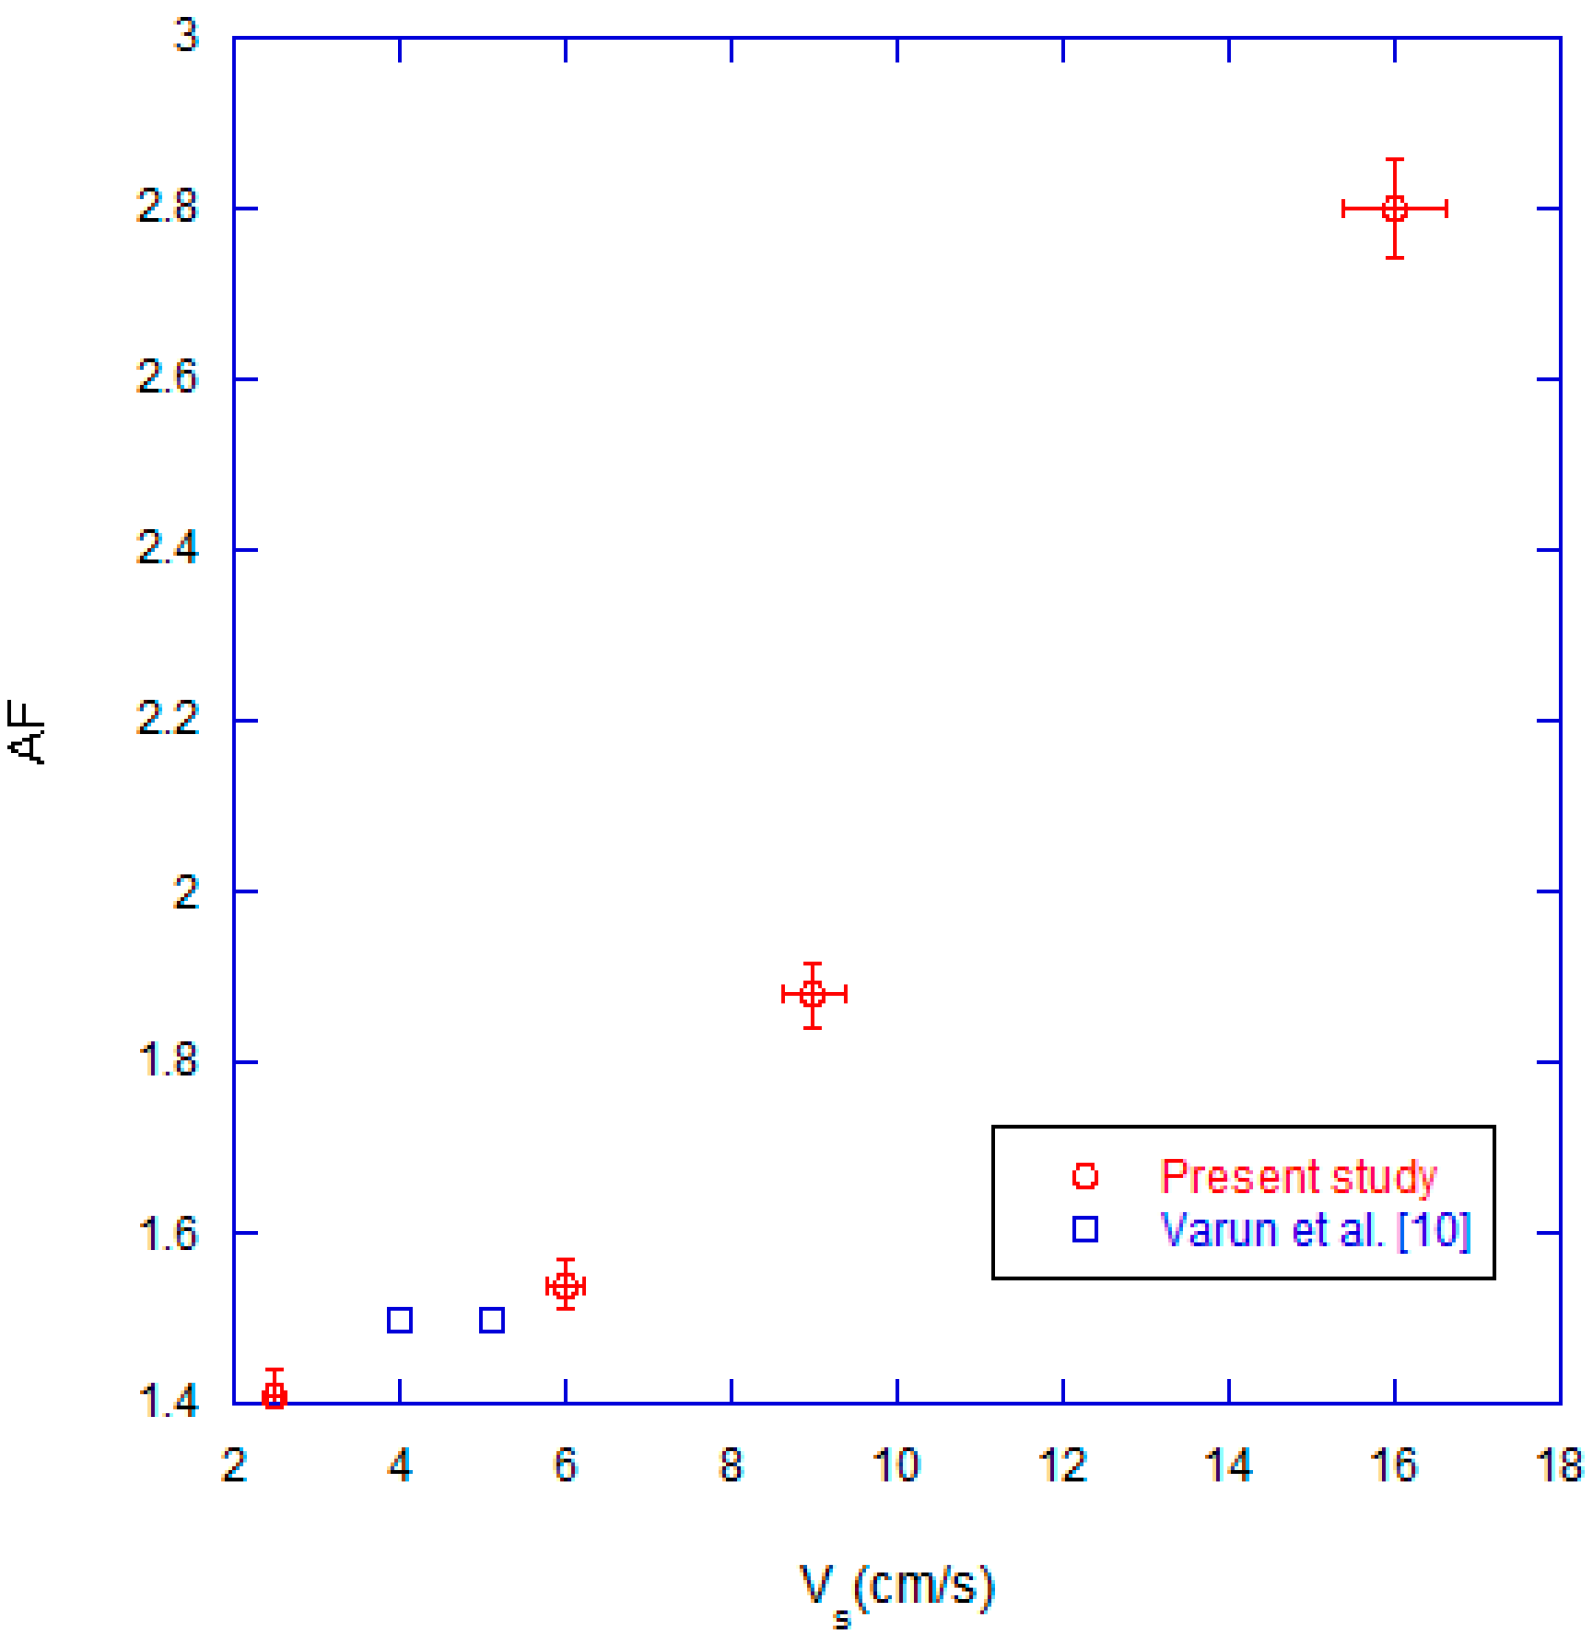
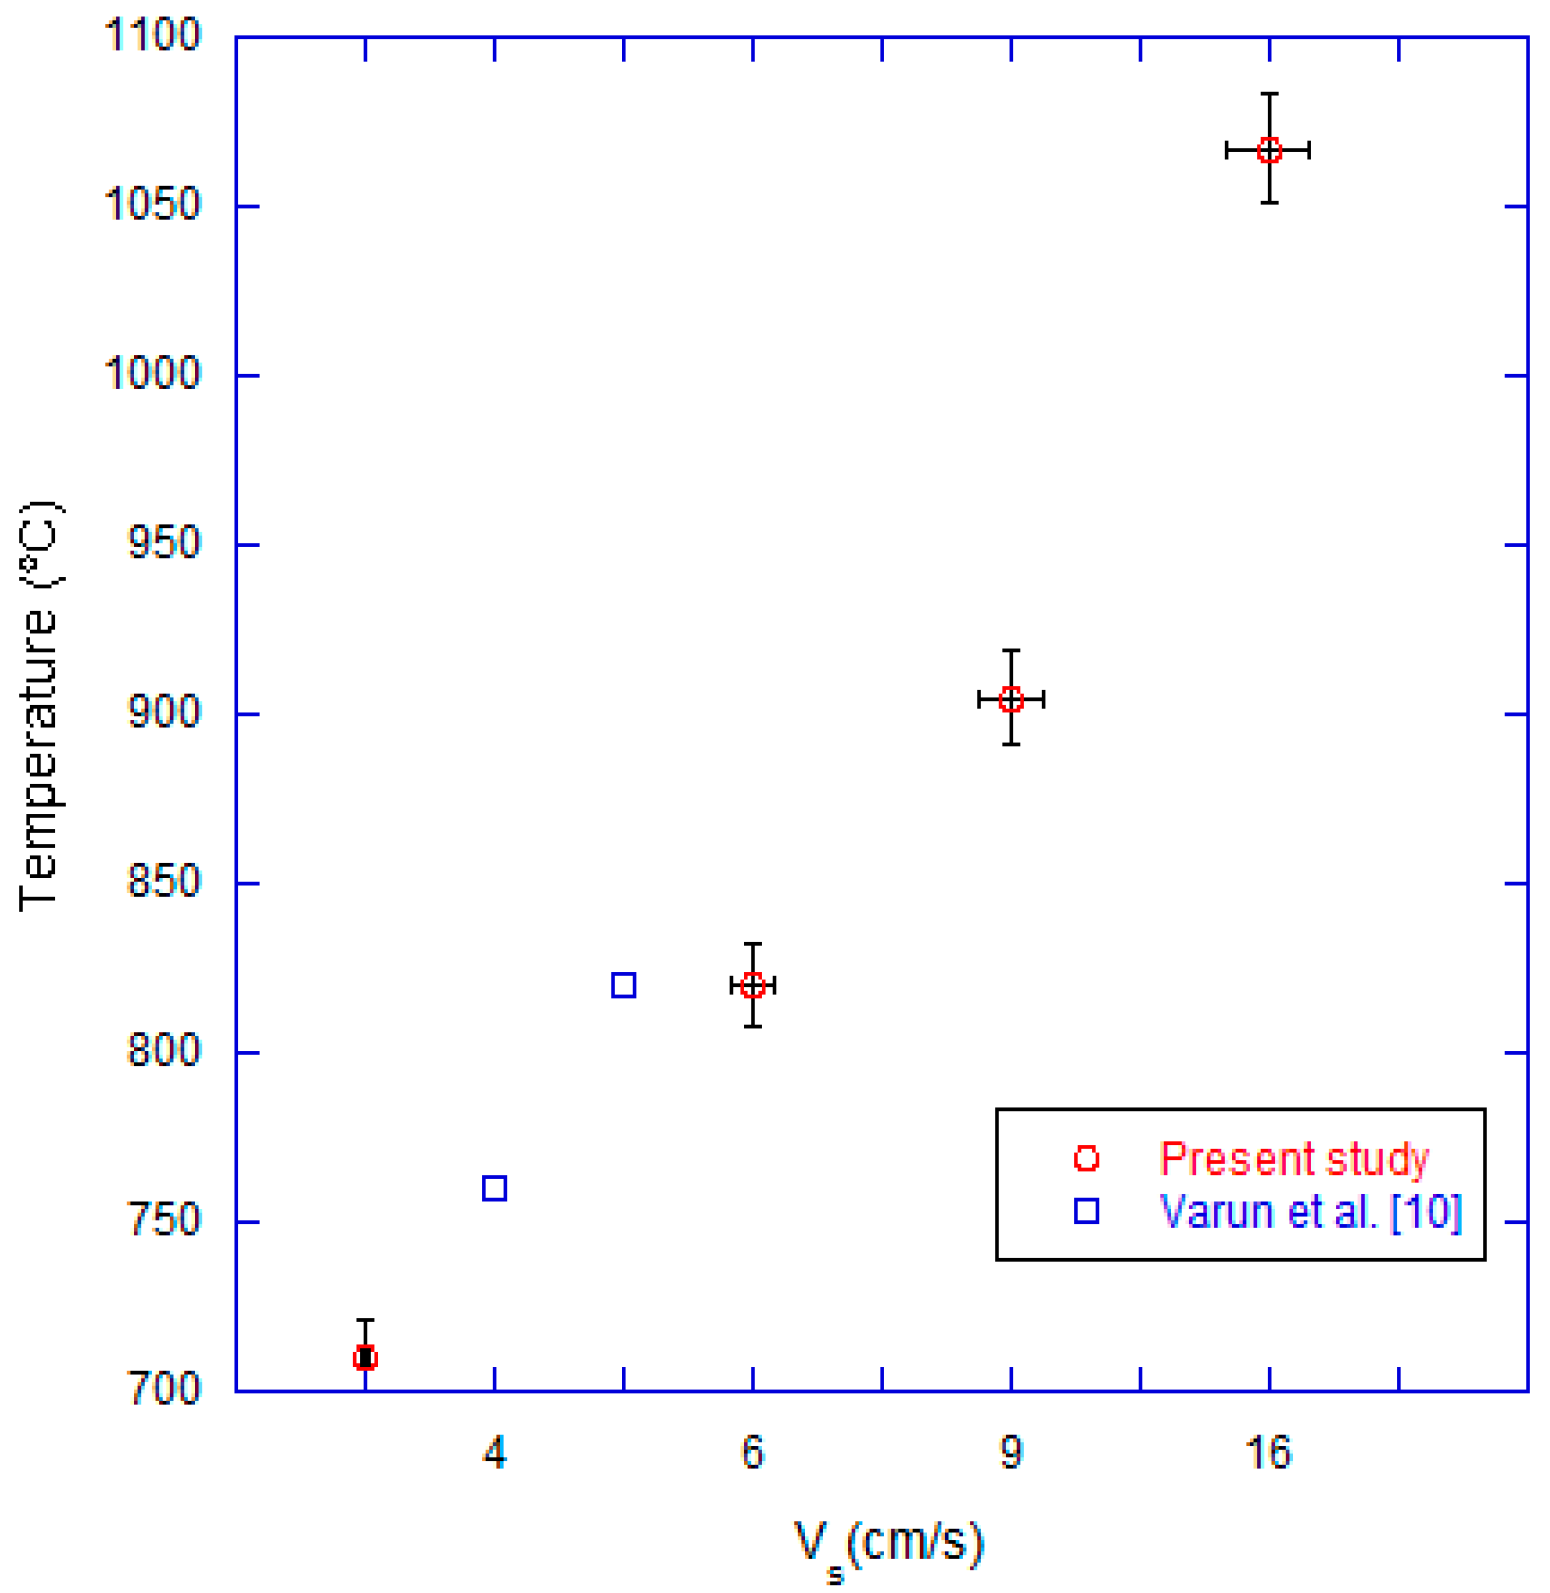
The air to fuel ratio (AF) increases in the gasification regime consistent with the gasification rate. However, below 6 cm/s the AF is less sensitive to superficial velocity, which indicates that the reaction is limited by kinetics. This is reflected in the data from this study and data from Varun et al. [14] which are shown in Figure 5. The maximum temperatures in the gasifier for each of the four superficial velocities are shown in Figure 6. The temperature increases with increasing superficial velocity which is consistent with the AF moving towards stoichiometry; i.e., higher flame temperatures. The pyrolysis front velocity is proportional to the superficial velocity as shown in Figure 7. To calculate the pyrolysis front velocity the known spacing between the thermocouples is divided by the difference in time taken by two adjacent thermocouples to reach 500 °C. The behavior of the pyrolysis front velocity is consistent with the temperature data of Figure 6. As Vs increases, the temperature rises, which increases the reaction rate and, thus, the front velocity. Although the front velocity increases almost linearly with increasing Vs, the slope starts to decrease near 16 cm/s as the end of the gasification regime is approached. As shown in the mass loss rate curve, beyond Vs = 16 cm/s the mass loss, or gasification rate, is essentially constant and, thus, it is expected that the front velocity will also be insensitive to changes in Vs. Gas composition data were collected for analysis via a gas sensor and gas chromatography midway through a run for the four superficial velocities.
Although the data are a snapshot of the gas concentration history, they may be used to deduce the effect of Vs on gas composition. Table 3 shows that, as Vs increases, the concentrations of the gases measured increase up to a superficial velocity of about 9 cm/s. As velocity is increased from 2.5 to 9 cm/s increased oxidation reactions and heat release create favorable conditions for further reduction reactions with char and, thus, an increase in producer gas concentrations. As Vs approaches 16 cm/s, the end of the gasification regime, the products consist of proportionately more CO2 and H2O and, consequently, CO and H2 concentrations drop. The concentrations of CH4 and other hydrocarbons are relatively insensitive to changes in Vs. Although the tars were not measured directly, it was observed that as Vs increases the amount of tars collected by the filter and condenser decreases.
Based on the composition of the producer gas, the energy content was calculated. The maximum energy content of the producer gas sample occurs at a superficial velocity of 9 cm/s, as shown in Figure 8. The charcoal remaining after gasification was complete was measured gravimetrically. In general the mass of charcoal remaining decreases with increasing superficial velocity. This is due to the fact that as Vs increases, the temperature increases, which results in an increase of the reduction reactions with the fixed charcoal during gasification. That is, more of the charcoal is consumed in the gasification process.
3.2. Effect of Combustion Chamber Geometry
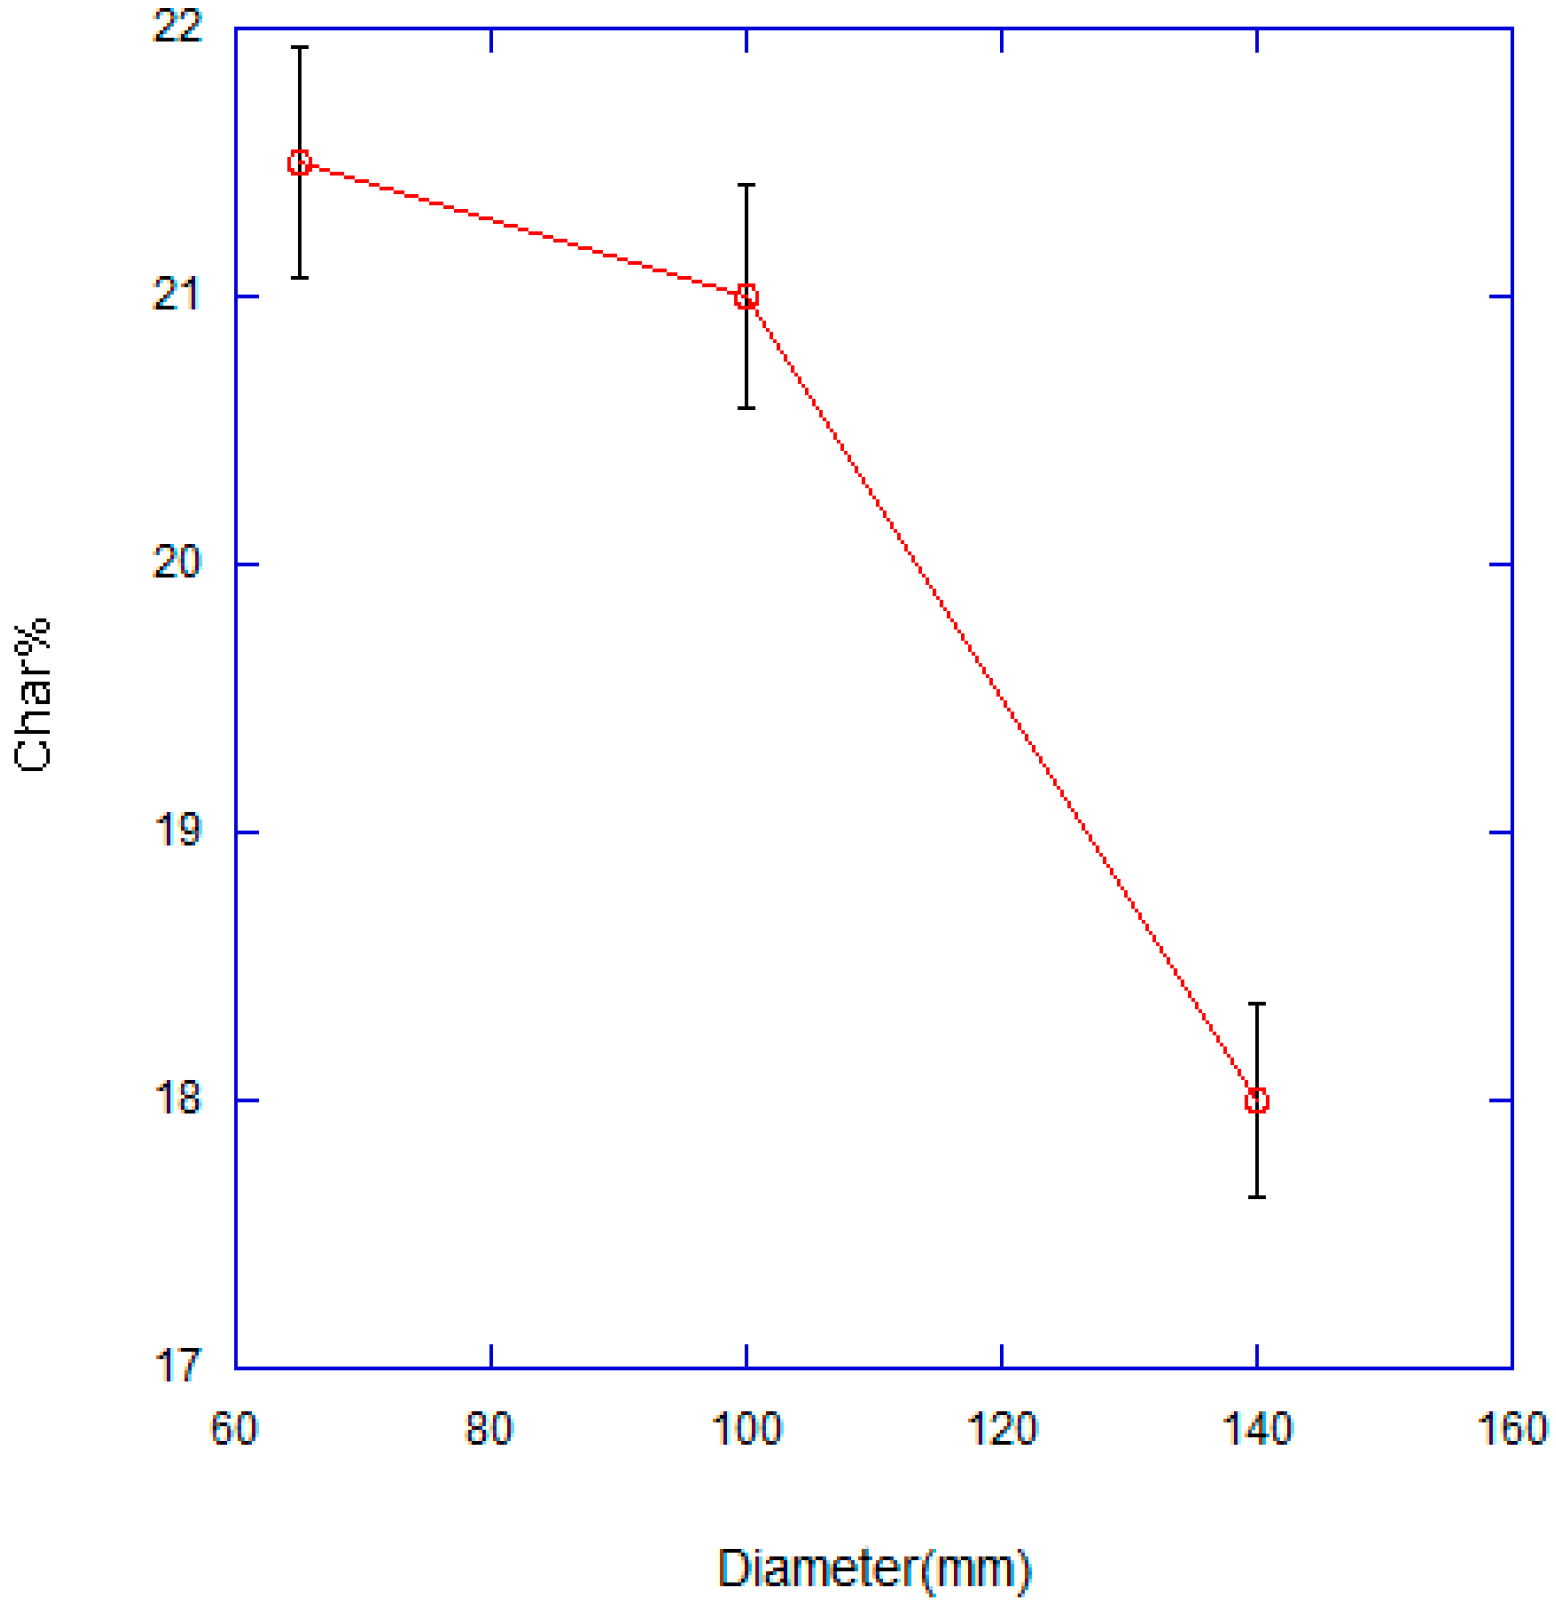
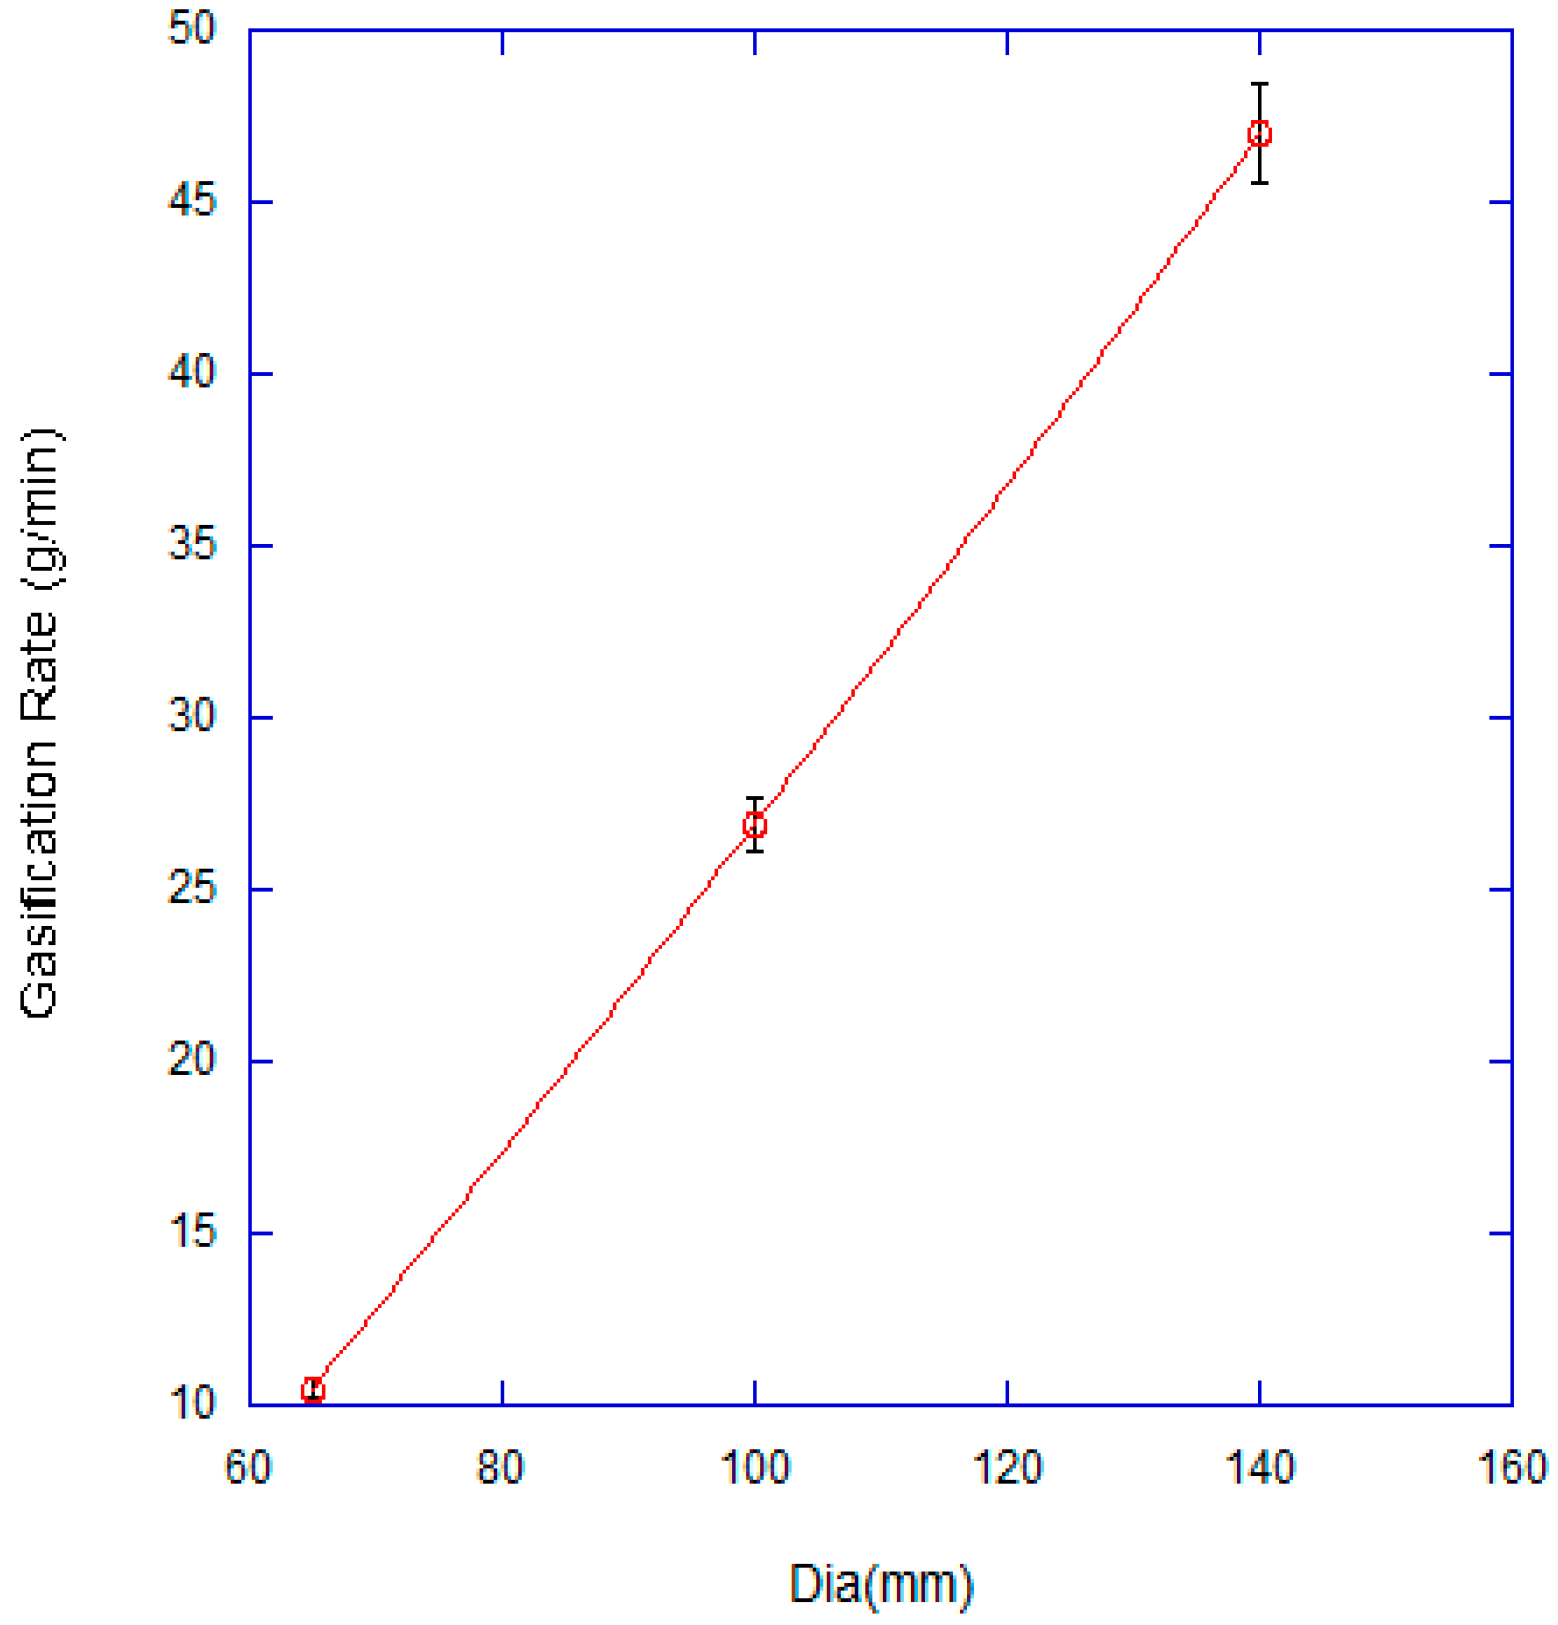
In addition to the 100 mm diameter gasifier, two other gasifiers with diameters of 65 and 140 mm were tested. Figure 9 shows the gasification rate measured in the three gasifiers. The data shown were acquired for a superficial velocity of 16 cm/s. Since the gasification rate is a surface area phenomenon, i.e., the pyrolysis front is a 2D phenomenon, the gasification rate scales linearly with diameter. The maximum energy content of the producer gas at 9 cm/s is plotted versus diameter in Figure 10. The energy content increases proportionally with the increase in diameter. When the data for the three reactors are plotted as AF versus energy content of the gas it becomes clear that a maximum energy content is achieved at an AF of approximately 1.8 regardless of diameter. Lastly, Figure 11 depicts the char left after the flaming mode ends for all three cases. There is a modest decrease in char percent with increasing diameter. The remaining char can be used to produce heat, may be collected for other uses, or integrated into soil. Char has a fairly high calorific content which makes it suitable for producing heat. For example, the 21% of char obtained during reactor 2 operation is equivalent to 294 g which has an energy content of 1.7 KW·h.
Many studies of cook stove performance are conducted with commercially-available stoves [8,17,24,25]. Although these studies provide useful information on the operation of units that are widely used, they are limited in providing general design guidelines. This is because the geometry (chamber diameter) of the commercial units being compared can vary substantially. In experiments with the primary air flow rate held constant, this means that the superficial velocity may not be the same in the units being compared. Our results clearly show the importance of the superficial velocity and diameter on the gasification rate and the heat content of the producer gas.
4. Conclusions
The gasification performance of a TLUD cook stove operated with a primary air supply only, has been studied experimentally. Three primary regimes were identified for a variation of the superficial velocity; a region in which a pyrolysis front is not maintained, a gasification region, and a sub-stoichiometric combustion region. The performance was studied in more detail in the gasification region. The gasification rate was found to increase with the superficial velocity in this region. Producer gas energy content was maximized at a superficial velocity of 9 cm/s. The percent char remaining at the end of gasification decreased with increasing diameter. The gasification rate and producer gas energy content were found to scale linearly with the diameter for a fixed superficial velocity. An AF ratio of 1.8 was found to give the maximum energy in the producer gas regardless of diameter.
The findings show that superficial velocity and diameter are dominant parameters for gasification performance in these cook stoves. Thus, when comparing different commercial units (which may have different geometries) investigators must be careful to control for the effects of superficial velocity and diameter in their tests. Designers should strive for a superficial velocity between 9 and 16 cm/s and scale the diameter to achieve the desired gasification rate. In future research we will address the secondary airflow and identify the parameters crucial to cook stove performance, such as secondary jet velocity, mass flow, and secondary/primary air flow rate.
Author Contributions
All authors contributed to the work. Yogesh Mehta conducted all the experiments. Cecilia Richards provided the tools, materials, and technical discussions necessary for the research. Yogesh Mehta and Cecilia Richards wrote the paper.
Conflicts of Interest
The authors declare no conflict of interest.
References
- Kshirsagar, M.P.; Kalamkar, V.R. A comprehensive review on biomass cookstoves and a systematic approach for modern cookstove design. Renew. Sustain. Energy Rev. 2014, 30, 580–603. [Google Scholar] [CrossRef]
- Arora, P.; Das, P.; Jain, S.; Kishore, V.V.N. A laboratory based comparative study of Indian biomass cookstove testing protocol and Water Boiling Test. Energy Sustain. Dev. 2014, 21, 81–88. [Google Scholar] [CrossRef]
- MacCarty, N.A.; Bryden, K.M. Modeling of household biomass cookstoves: A review. Energy Sustain. Dev. 2015, 26, 1–13. [Google Scholar] [CrossRef]
- Obeng, G.Y.; Mensah, E.; Ashiagbor, G.; Boahen, O.; Sweeney, D.J. Watching the smoke rise up: Thermal efficiency, pollutant emissions and global warming impact of three biomass Cookstoves in Ghana. Energies 2017, 10, 641. [Google Scholar] [CrossRef]
- MacCarty, N.A.; Bryden, K.M. A unified set of experimental data for cylindrical, natural draft, shielded single pot wood-fired cookstoves. Energy Sustain. Dev. 2015, 26, 62–71. [Google Scholar] [CrossRef]
- Kar, A.; Rehman, I.H.; Burney, J.; Puppala, S.P.; Suresh, R.; Singh, L.; Singh, V.K.; Ahmed, T.; Ramanathan, N.; Ramanathan, V. Real-time assessment of black carbon pollution in Indian households due to traditional and improved biomass cookstoves. Environ. Sci. Technol. 2012, 46, 2993–3000. [Google Scholar] [CrossRef] [PubMed]
- Jetter, J.; Zhao, Y.; Smith, K.R.; Khan, B.; Yelverton, T.; Decarlo, P.; Hays, M.D. Pollutant emissions and energy efficiency under controlled conditions for household biomass cookstoves and implications for metrics useful in setting international test standards. Environ. Sci. Technol. 2012, 46, 10827–10834. [Google Scholar] [CrossRef] [PubMed]
- Patel, S.; Leavey, A.; He, S.; Fang, J.; O’Malley, K.; Biswas, P. Characterization of gaseous and particulate pollutants from gasification-based improved cookstoves. Energy Sustain. Dev. 2016, 32, 130–139. [Google Scholar] [CrossRef]
- James R., A.M.; Yuan, W.; Boyette, M.D. The effect of biomass physical properties on top-lit updraft gasification of woodchips. Energies 2016, 9, 283. [Google Scholar] [CrossRef]
- Reed, T.; Walt, R.; Ellis, S.; Das, A.; Deutch, S. Superficial velocity—The key to downdraft gasification. In Proceedings of the Fourth Biomass Conference of the Americas, Oakland, CA, USA, 29 August–2 September 1999; pp. 343–356. [Google Scholar]
- Fatehi, M.; Kaviany, M. Adiabatic reverse combustion in a packed bed. Combust. Flame 1994, 99, 1–17. [Google Scholar] [CrossRef]
- Porteiro, J.; Patino, D.; Collazo, J.; Granada, E.; Moran, J.; Miguez, J. Experimental analysis of the ignition front propagation of several biomass fuels in a fixed-bed combustor. Fuel 2010, 89, 26–35. [Google Scholar] [CrossRef]
- Ronnback, M.; Axell, M.; Gustavsson, L.; Thunman, H.; Leckner, B. Combustion processes in a biomass fuel bed—Experimental results. In Progress in Thermochemical Biomass Conversion; Wiley: New York, NY, USA, 2001. [Google Scholar]
- Varunkumar, S.; Rajan, N.K.S.; Mukunda, H.S. Experimental and computational studies on a gasifier based stove. Energy Convers. Manag. 2012, 53, 135–141. [Google Scholar] [CrossRef]
- Adkins, E.; Tyler, E.; Wang, J.; Siriri, D.; Modi, V. Field testing and survey evaluation of household biomass cookstoves in rural sub-Saharan Africa. Energy Sustain. Dev. 2010, 14, 172–185. [Google Scholar] [CrossRef]
- Jetter, J.J.; Kariher, P. Solid fuel household cook stoves: Characterization of performance and emissions. Biomass Bioenergy 2009, 33, 294–305. [Google Scholar] [CrossRef]
- Chen, Y.; Shen, G.; Su, S.; Du, W.; Huangfu, Y.; Liu, G.; Wang, X.; Xing, B.; Smith, K.R.; Tao, S. Efficiencies and pollutant emissions from forced-draft biomass-pellet semi-gasifier stoves: Comparison of International and Chinese water boiling test protocols. Energy Sustain. Dev. 2016, 32, 22–30. [Google Scholar] [CrossRef]
- Caballero, M.A.; Corella, J.; Aznar, M.P.; Gil, J. Biomass gasification with air in fluidized bed. Hot gas cleanup with selected commercial and full-size nickel based catalysts. Ind. Eng. Chem. Res. 2000, 39, 1143–1154. [Google Scholar] [CrossRef]
- Warnecke, R. Gasification of biomass: Comparison of fixed bed and fluidized bed gasifier. Biomass Bioenergy 2000, 18, 489–497. [Google Scholar] [CrossRef]
- Kirubakaran, V.; Sivaramakrishnan, V.; Nalini, R.; Sekar, T.; Premalatha, M.; Subramanian, P. A review on gasification of biomass. Renew. Sustain. Energy Rev. 2009, 13, 179–186. [Google Scholar] [CrossRef]
- Ryu, C.; Yang, Y.; Khor, A.; Yates, N.; Sharifi, V.; Swithenbank, J. Effect of fuel properties on biomass combustion: Part I. Experiments—Fuel type, equivalence ratio and particle size. Fuel 2006, 85, 1039–1046. [Google Scholar] [CrossRef]
- Ohlemiller, T.J. Smoldering combustion. In SFPE Handbook of Fire Protection Engineering, 2nd ed.; National Fire Protection Association, Quincy, M.A., DiNenno, P.J., Beyler, C.L., Custer, R.L.P., Walton, W.D., Eds.; SFPE: Gaithersburg, MD, USA, 1995; Section 2, Chapter 11; Volume 2, pp. 171–179. [Google Scholar]
- Torero, J.L.; Kitano, M.; Femandez-Pello, A.C. Opposed forced flow smoldering of polyurethane foam. Combust. Sci. Technol. 1993, 91, 95–117. [Google Scholar] [CrossRef]
- Bäfver, L.S.; Leckner, B.; Tullin, C.; Berntsen, M. Particle emissions from pellets stoves and modern and old-type wood stoves. Biomass Bioenergy 2011, 35, 3648–3655. [Google Scholar] [CrossRef]
- Patil, R.; Shinde, Y.; Pandit, A. Optimization and development of solid biomass burning cookstoves. Int. J. Chem. Phys. Sci. 2013, 2, 1–10. [Google Scholar]
Figure 1.
Experimental setup.

Figure 2.
Combustion chamber details.
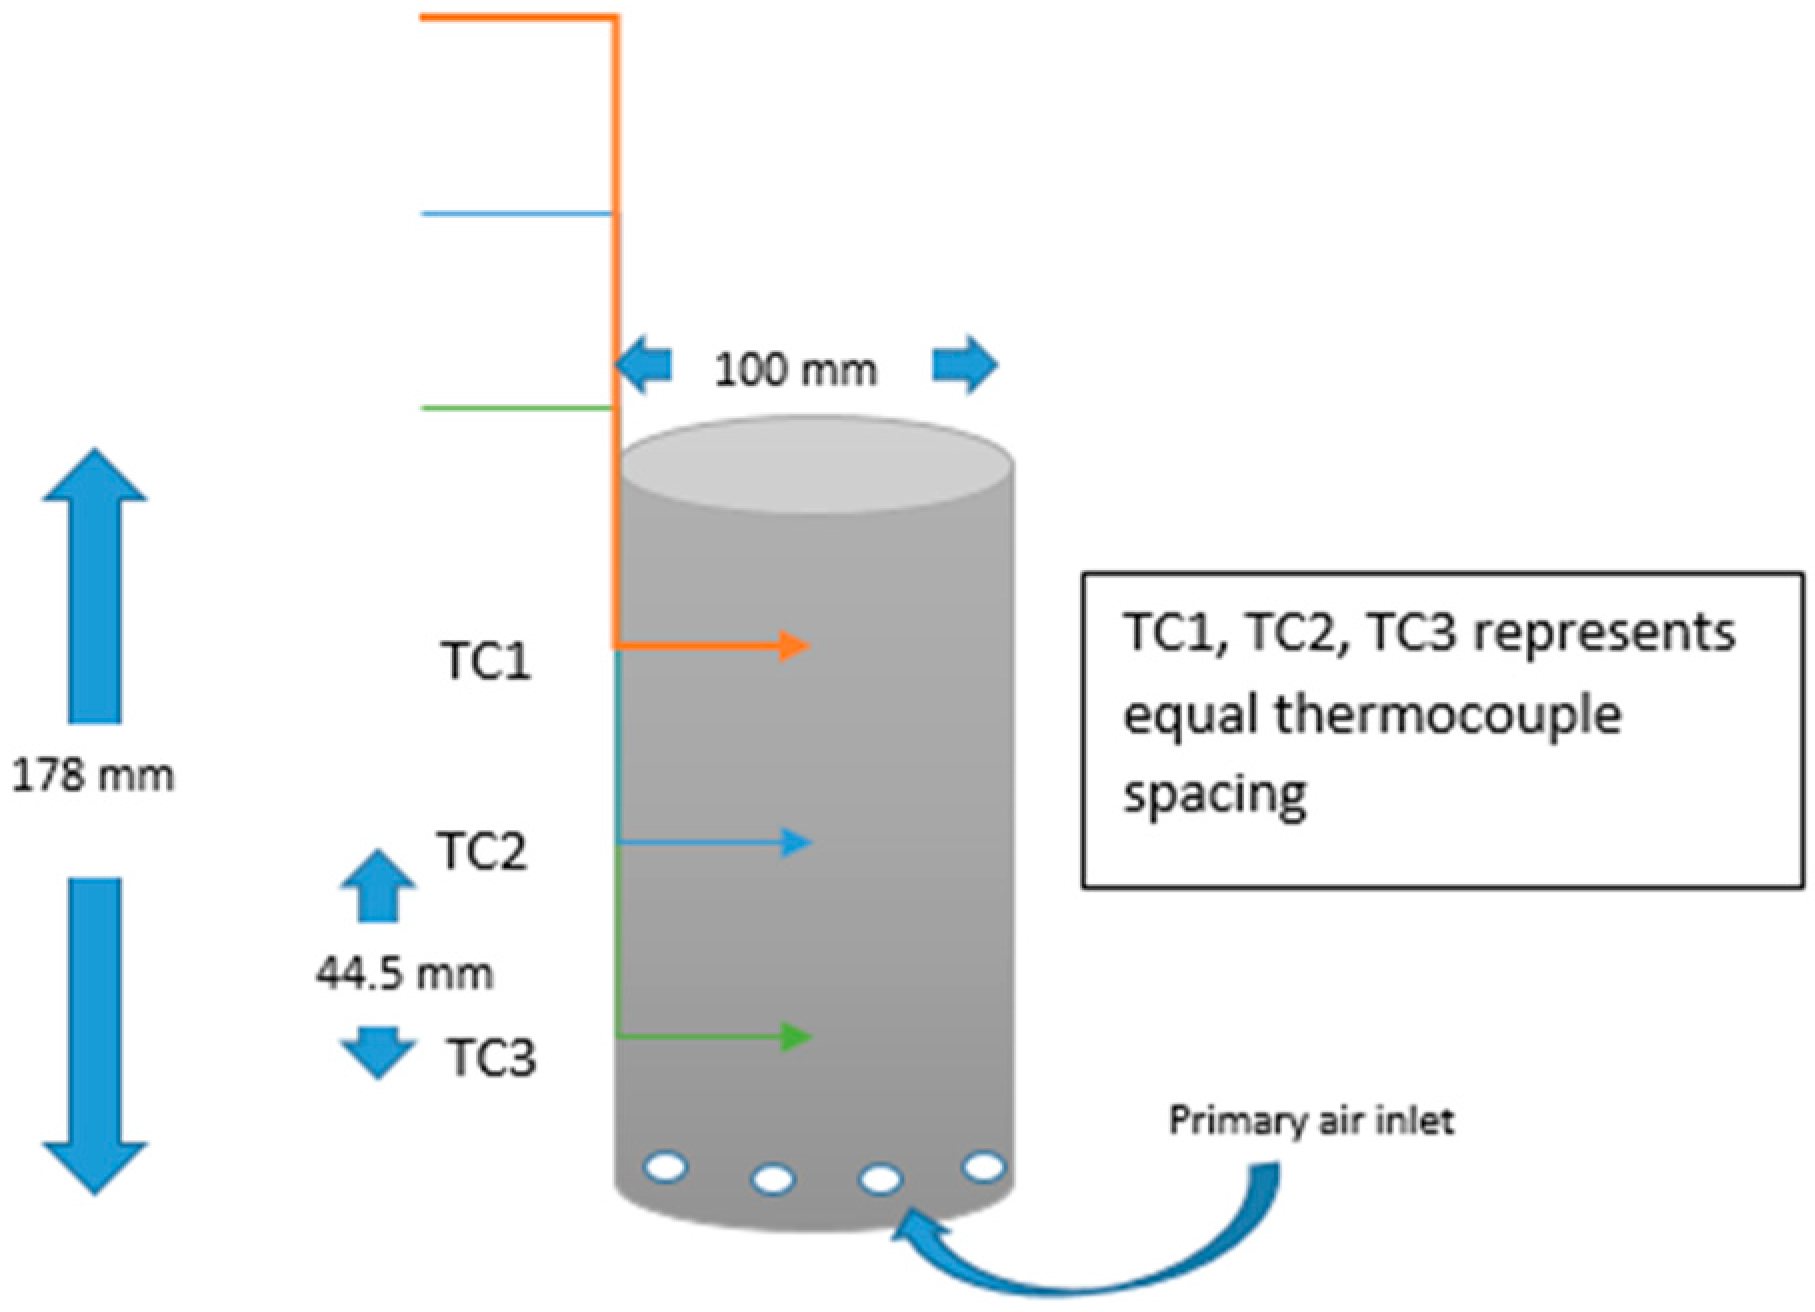
Figure 3.
Effect of the superficial velocity on the mass loss rate.
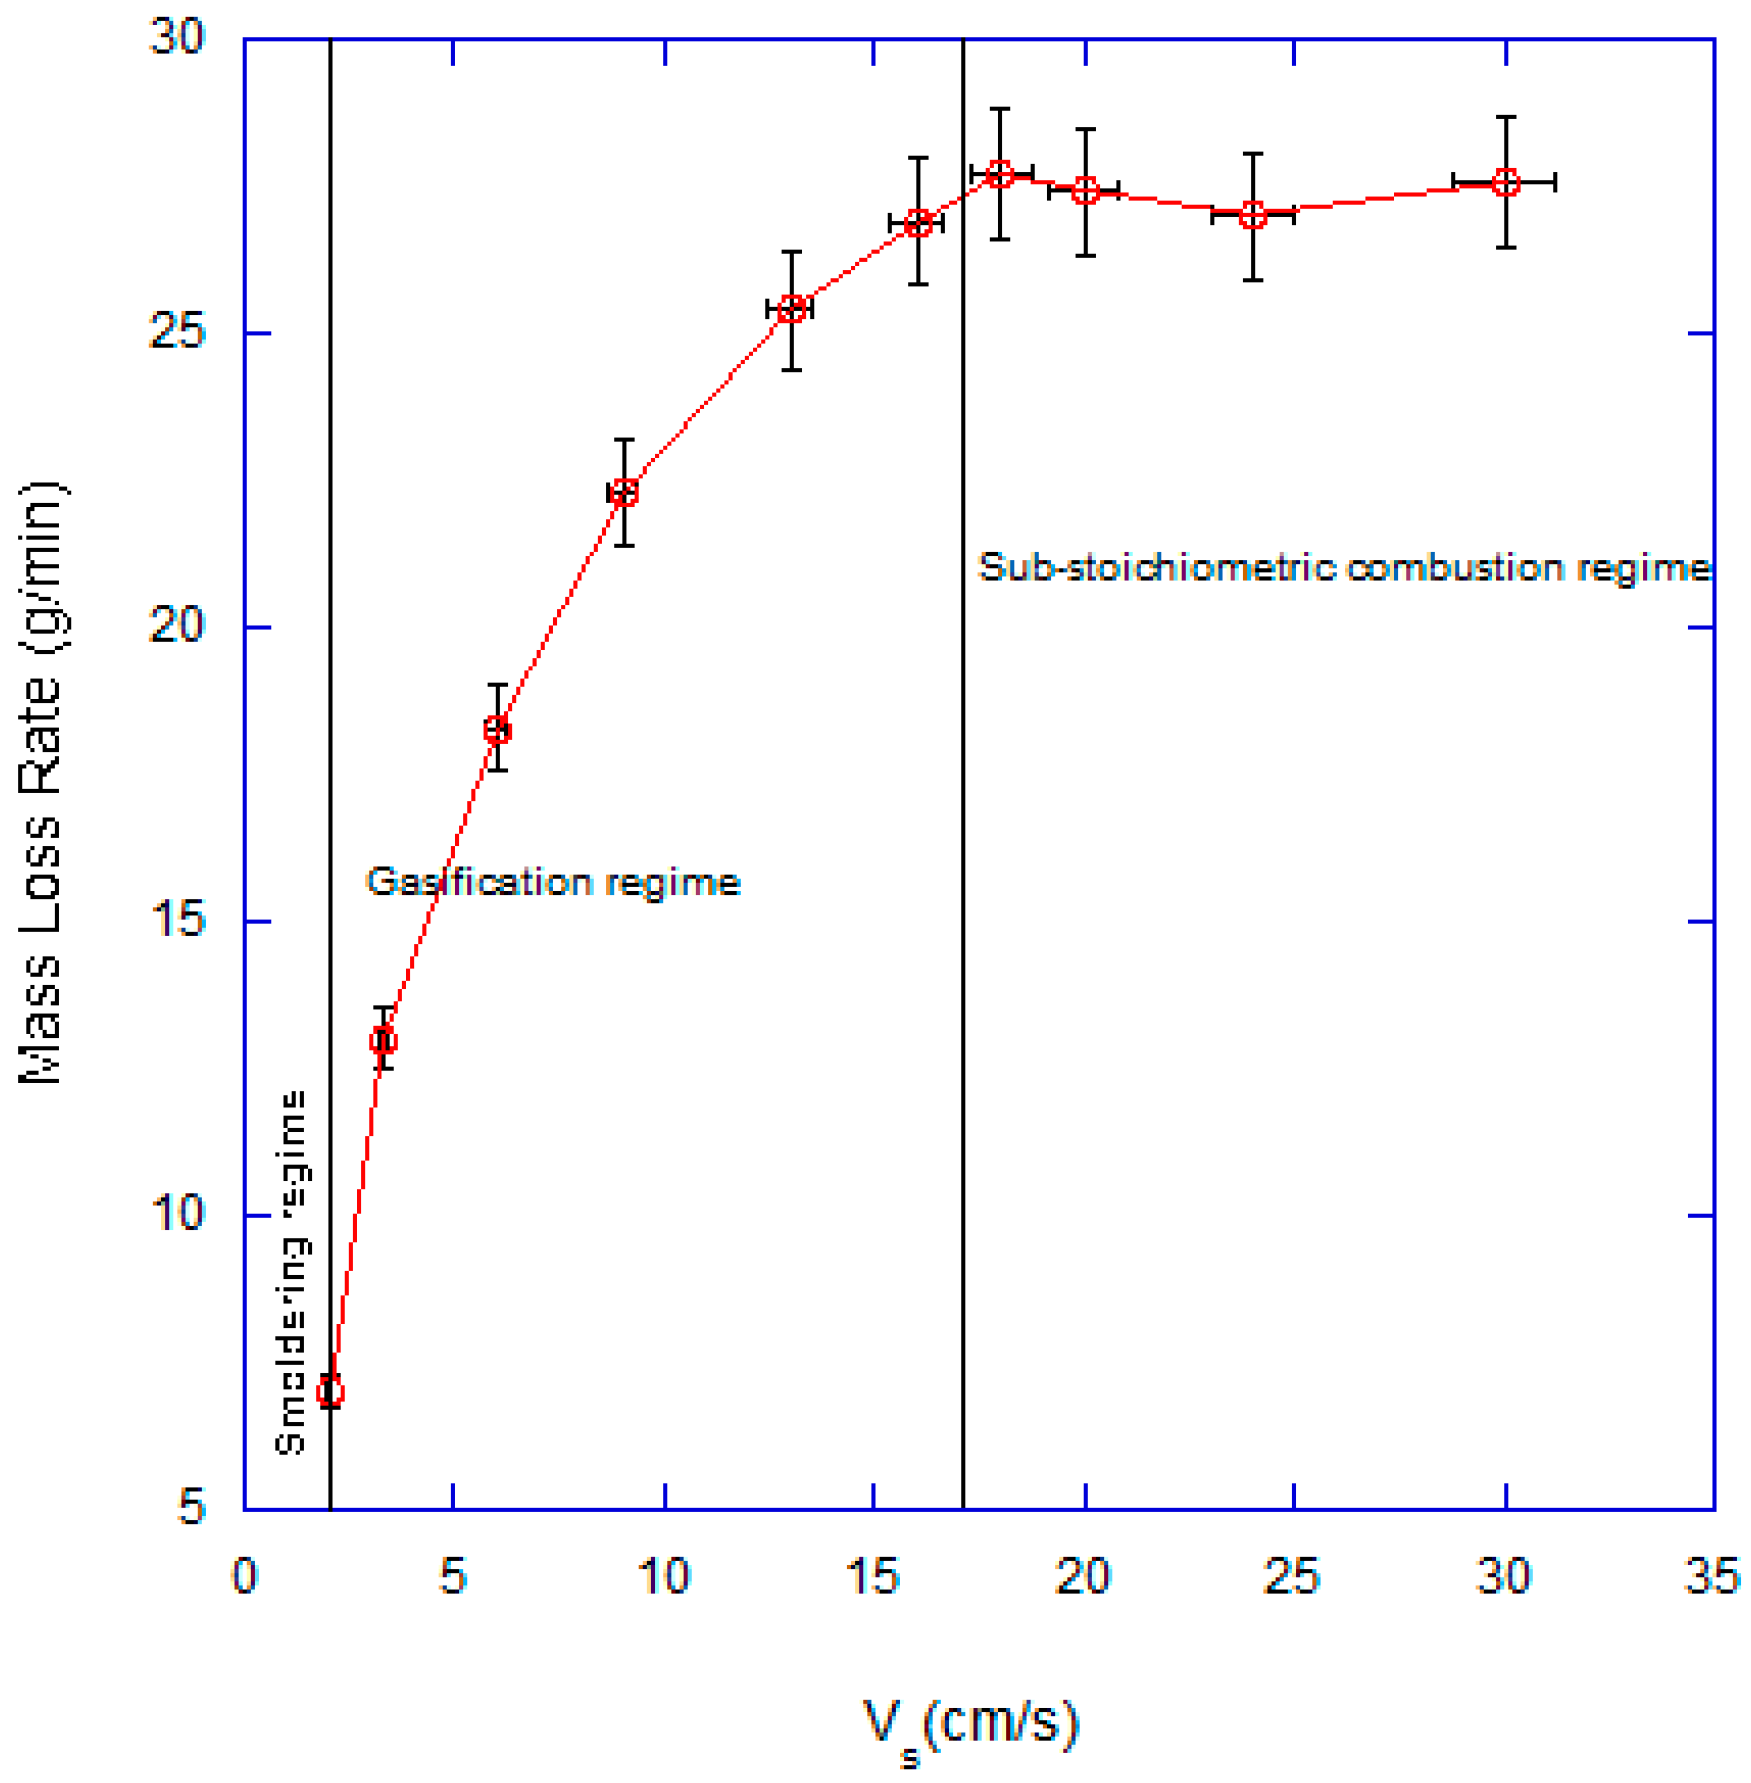
Figure 4.
(a) Temperature history reported by three thermocouples; and (b) mass loss history.

Figure 5.
Effect of the superficial velocity on Air Fuel ratio(AF).

Figure 6.
Effect of the superficial velocity on maximum temperature.

Figure 7.
Effect of the superficial velocity on the pyrolysis front velocity.
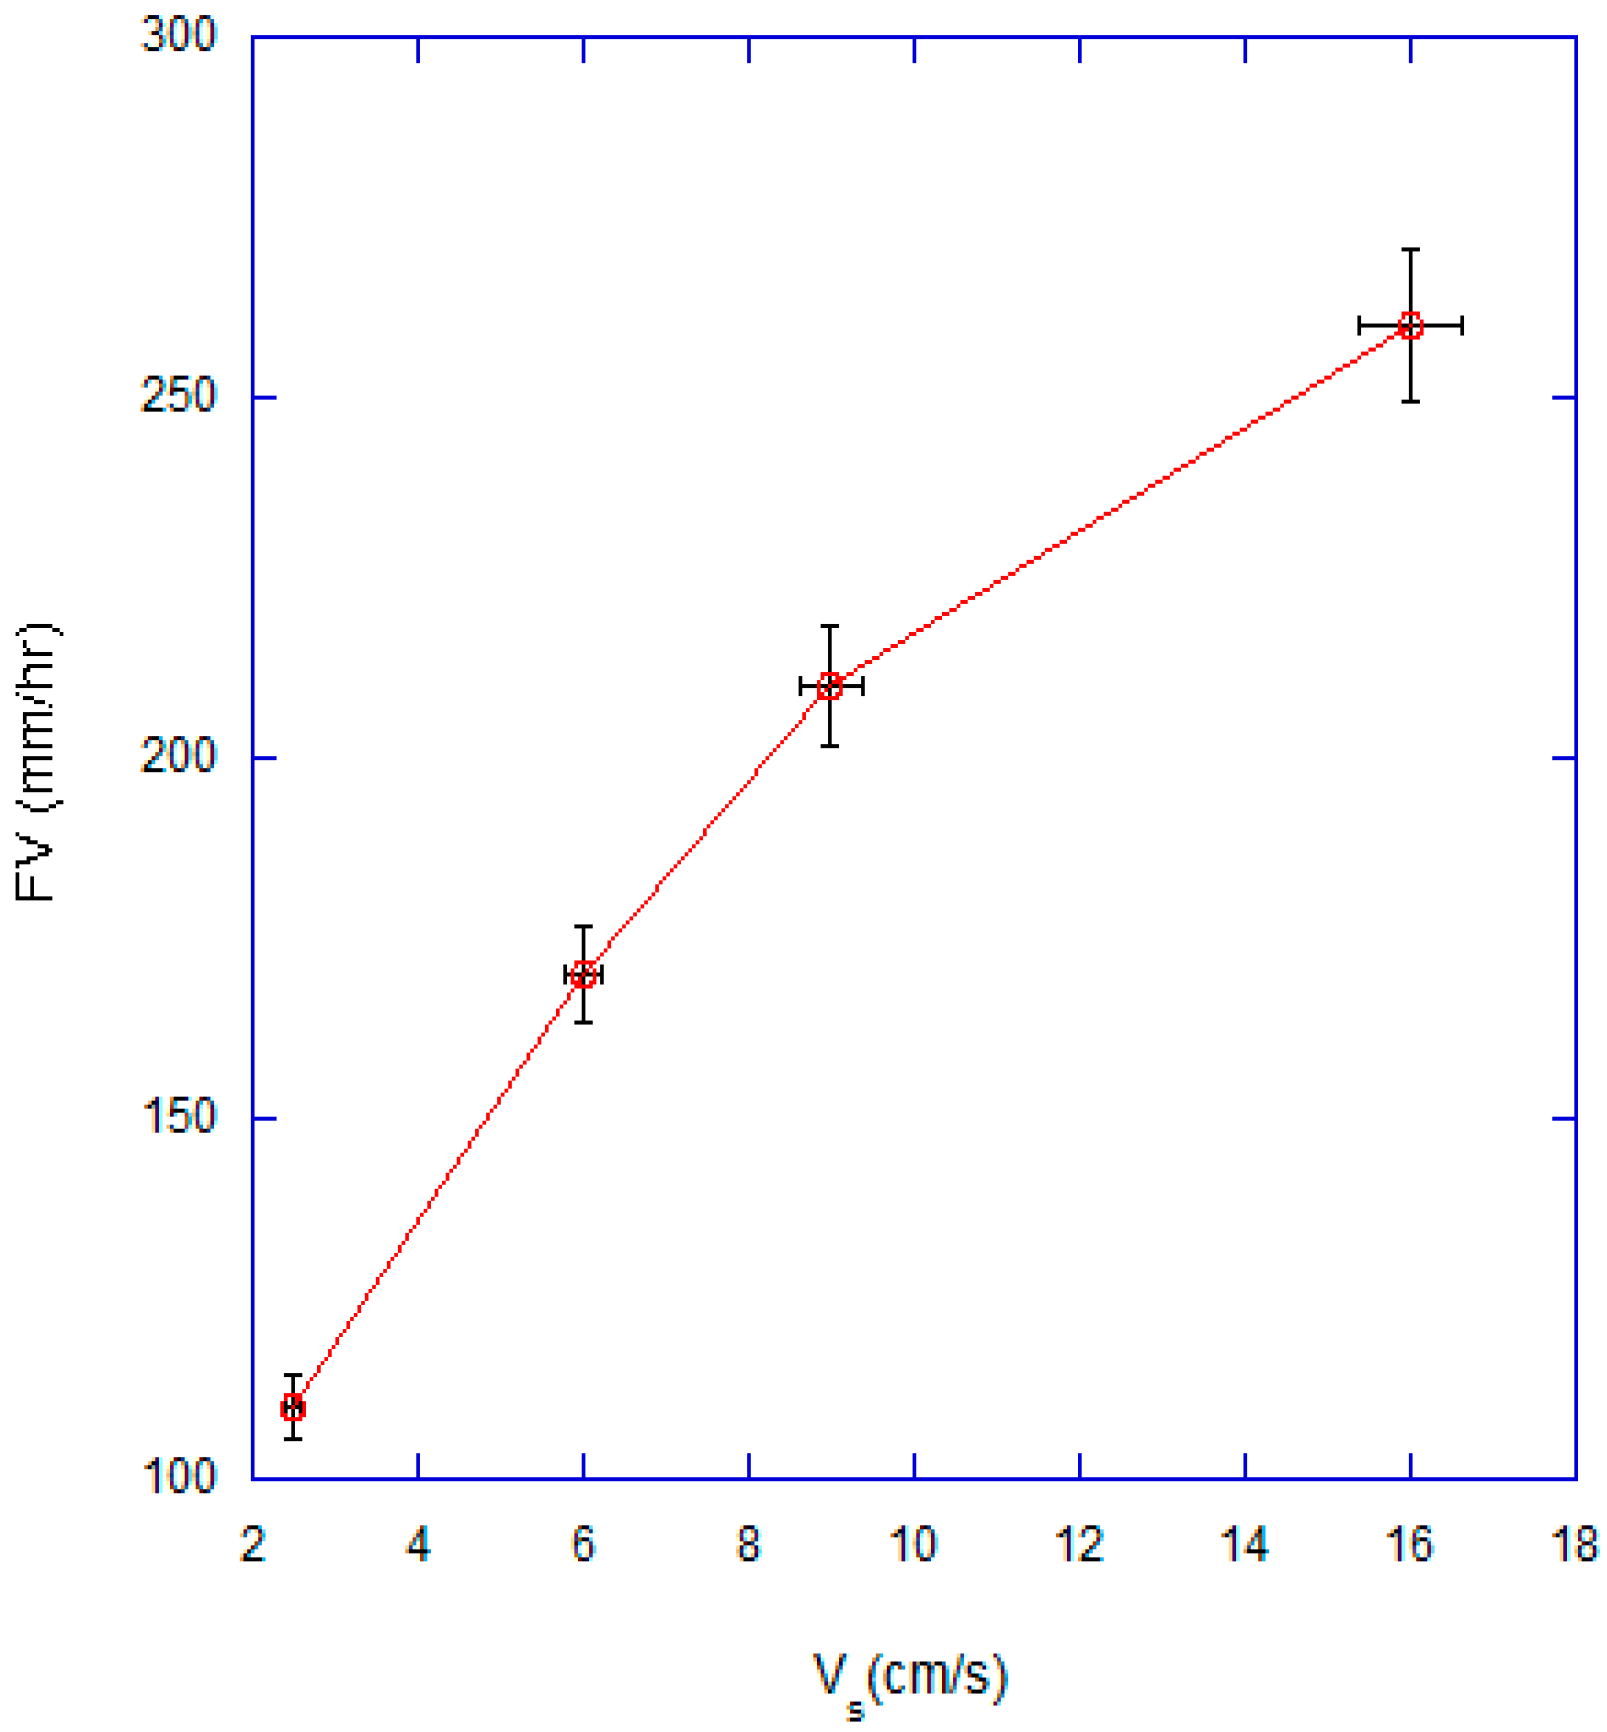
Figure 8.
Effect of superficial velocity on energy content.
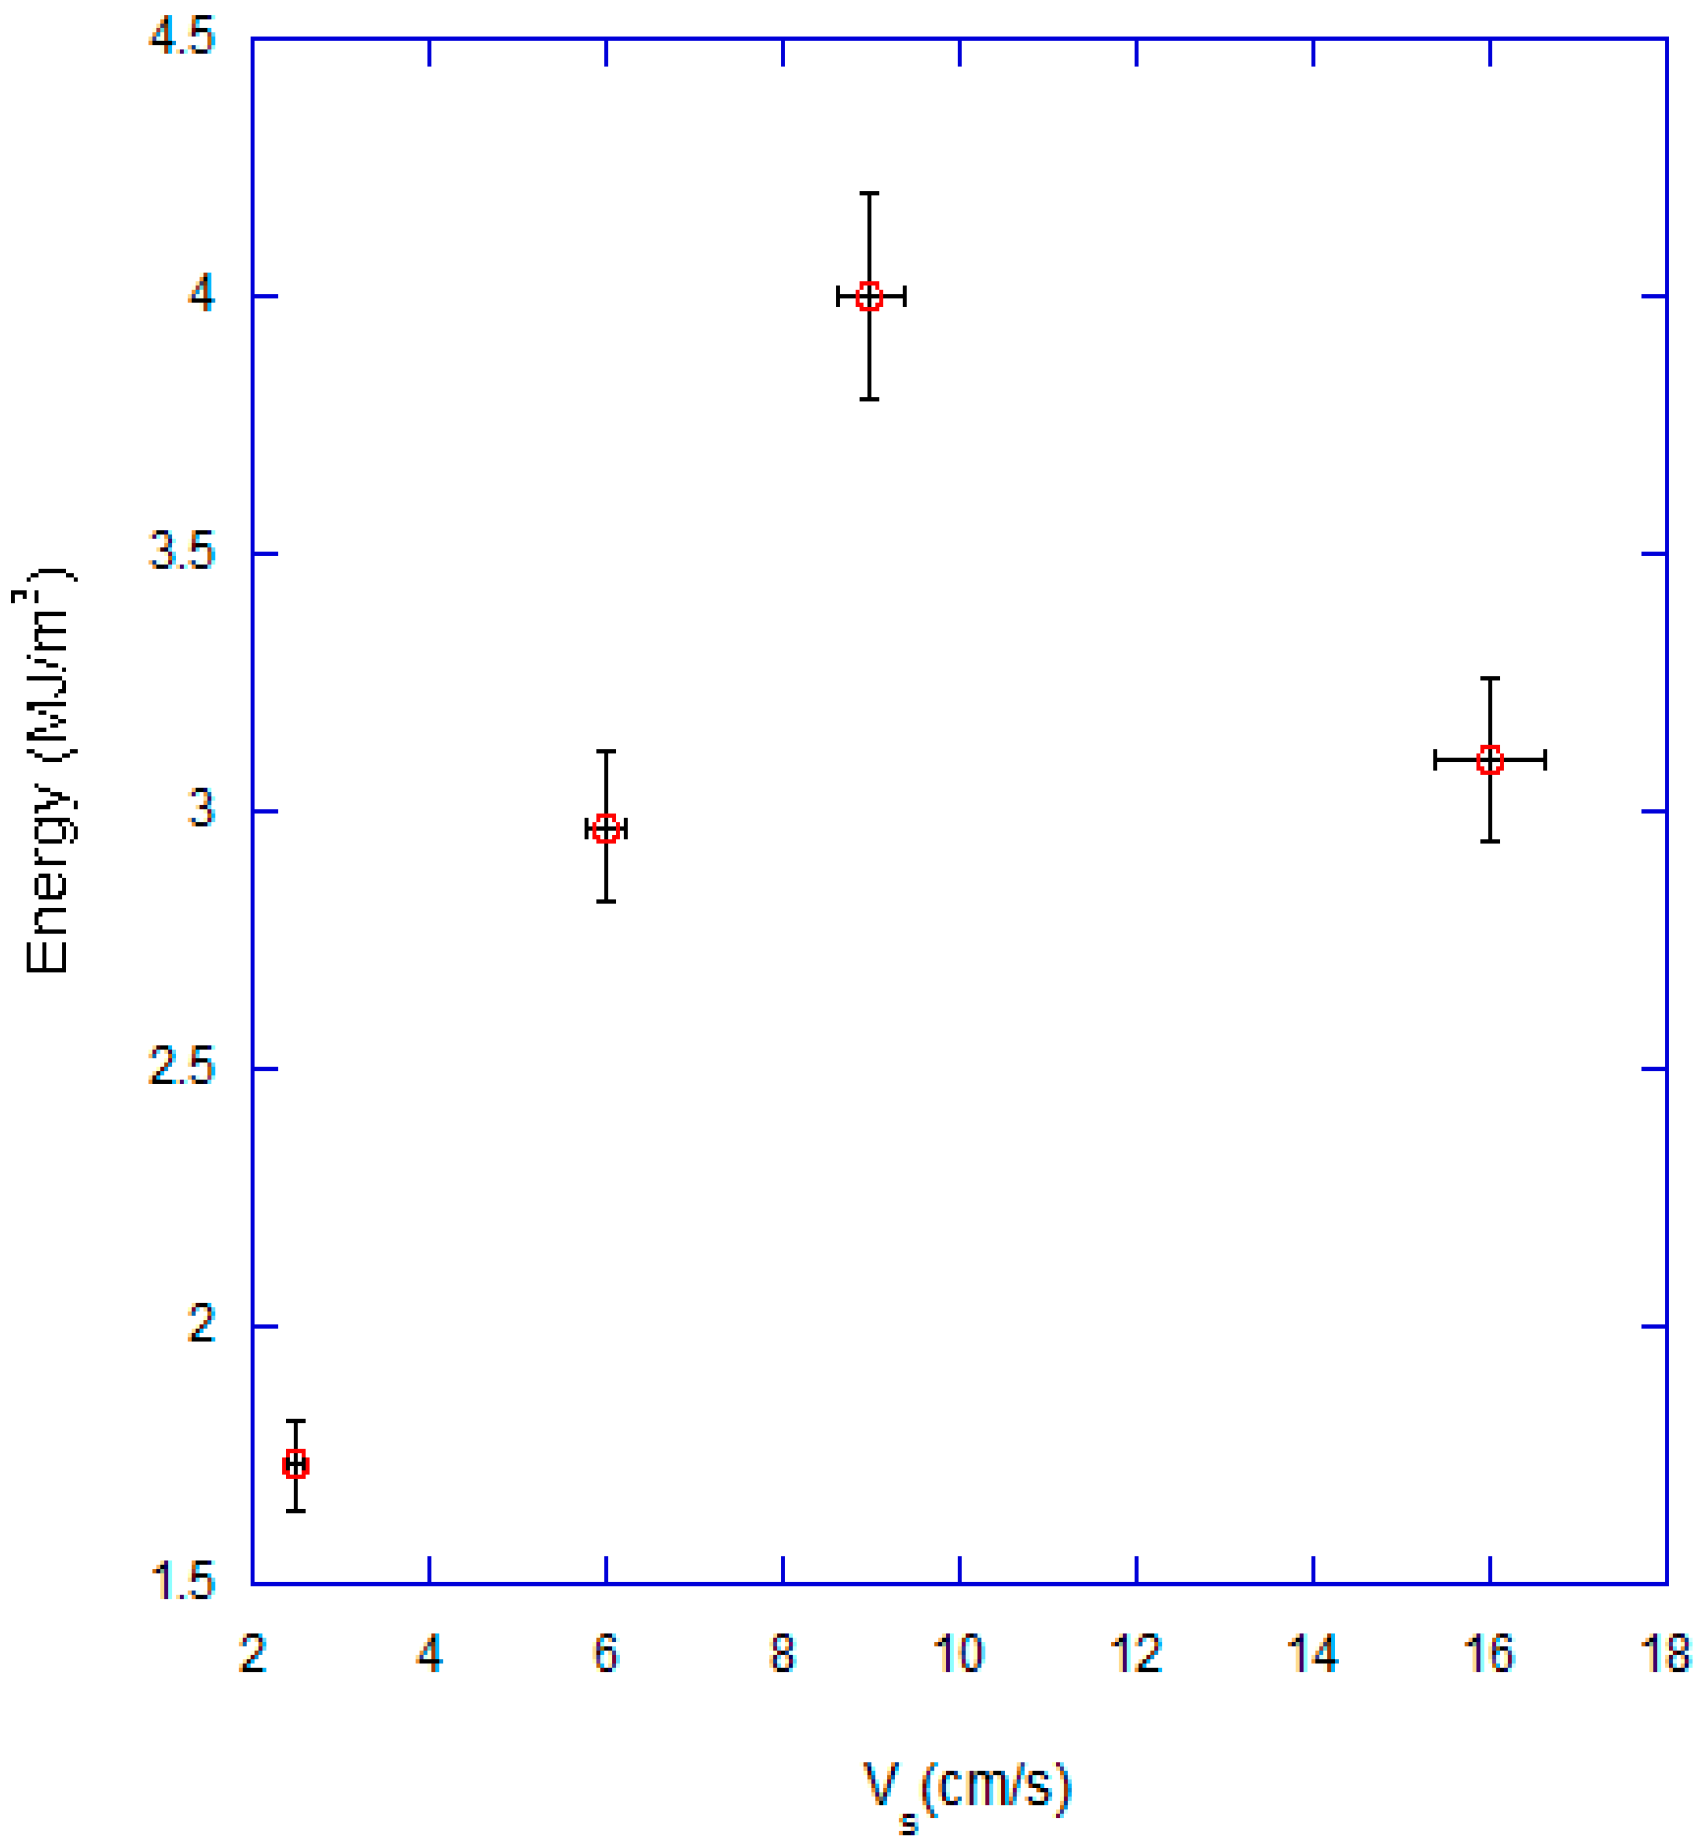
Figure 9.
Variation of gasification rate with diameter.

Figure 10.
Energy content versus AF for three reactors.
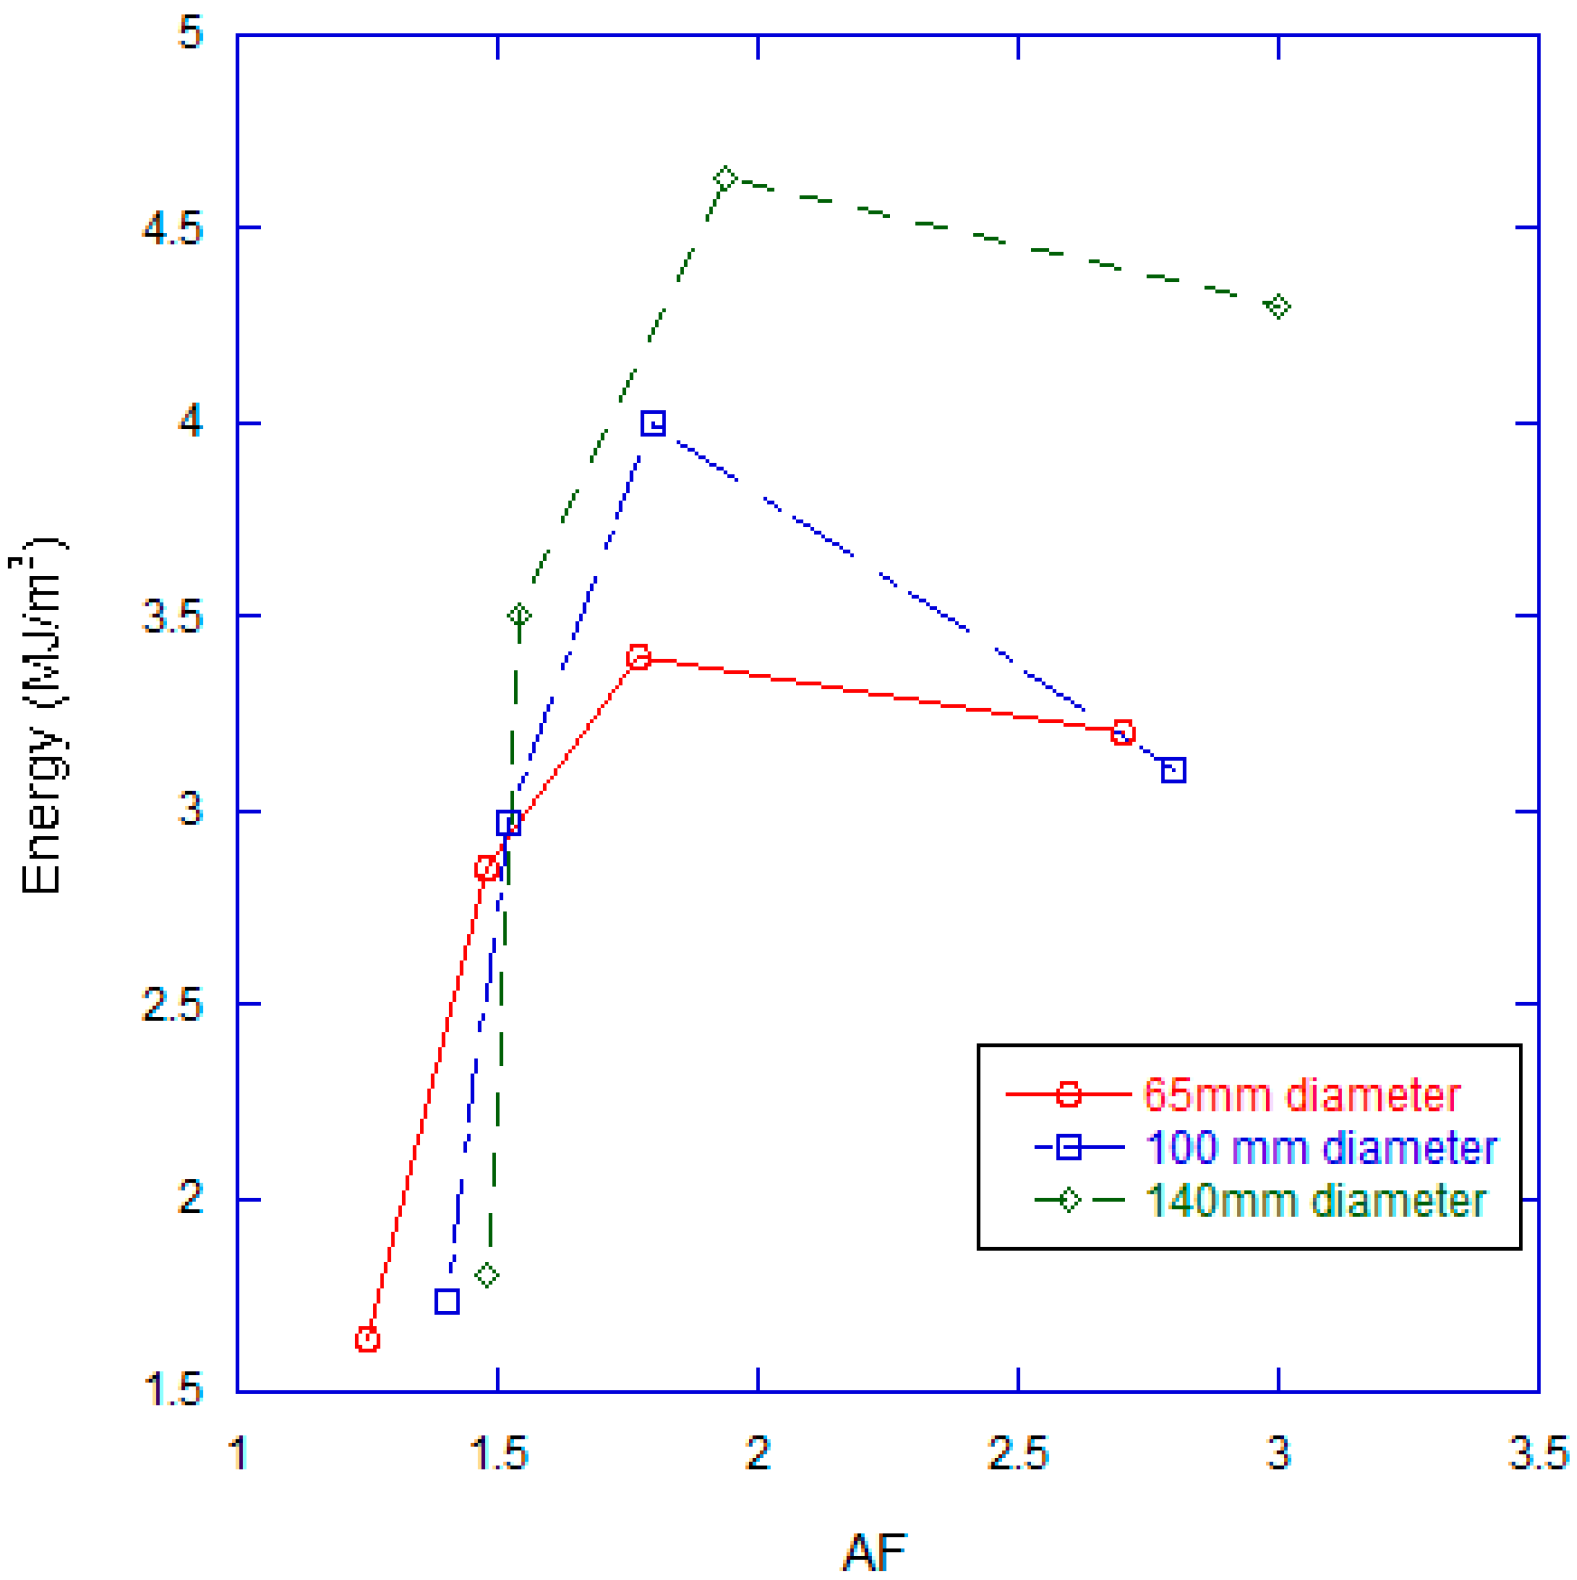
Figure 11.
Char left versus diameter.

Table 1.
Combustion chamber details.
| # | Length (mm) | Diameter (mm) | Fuel Capacity (g) |
|---|---|---|---|
| 1 | 178 | 100 | 800 |
| 2 | 305 | 100 | 1400 |
| 3 | 140 | 140 | 1200 |
| 4 | 140 | 65 | 250 |
Table 2.
Fuel description.
| Fuel Properties | Values |
|---|---|
| Size (mm) | 5–35 |
| Moisture Content (% D.B) | 10 ± 3 |
| Lower heating value (MJ/kg) | 15 |
| Ash (%) | <1 |
| Volatile Matter (%) | 77 |
| Fixed Carbon (%) | 23 |
Table 3.
Gas composition with superficial velocity.
| Vs (cm/s) | CO (%v/v) | H2 (%v/v) | CH4 (%v/v) | C2H6 (%v/v) | C3H8 (%v/v) |
|---|---|---|---|---|---|
| 2.5 | 5.4 ± 1.2 | 3.50 ± 1.2 | 1.74 ± 0.84 | 0.12 ± 0.01 | 0.0013 ± 0.0002 |
| 6 | 10.20 ± 0.82 | 8.44 ± 1.51 | 2.27 ± 0.51 | 0.13 ± 0.04 | 0.0027 ± 0.0007 |
| 9 | 13.45 ± 0.48 | 11.95 ± 2.2 | 2.34 ± 0.58 | 0.15 ± 0.02 | 0.024 ± 0.001 |
| 16 | 12.3 ± 1.5 | 10.1 ± 1.7 | 1.21 ± 0.52 | 0.02 ± 0.01 | 0.0032 ± 0.0005 |
© 2017 by the authors. Licensee MDPI, Basel, Switzerland. This article is an open access article distributed under the terms and conditions of the Creative Commons Attribution (CC BY) license (http://creativecommons.org/licenses/by/4.0/).
Share and Cite
MDPI and ACS Style
Mehta, Y.; Richards, C. Gasification Performance of a Top-Lit Updraft Cook Stove. Energies 2017, 10, 1529. https://doi.org/10.3390/en10101529
AMA Style
Mehta Y, Richards C. Gasification Performance of a Top-Lit Updraft Cook Stove. Energies. 2017; 10(10):1529. https://doi.org/10.3390/en10101529
Chicago/Turabian StyleMehta, Yogesh, and Cecilia Richards. 2017. "Gasification Performance of a Top-Lit Updraft Cook Stove" Energies 10, no. 10: 1529. https://doi.org/10.3390/en10101529
Note that from the first issue of 2016, this journal uses article numbers instead of page numbers. See further details here.