Article

COVID-19 Phenotypes and Comorbidity: A Data-Driven, Pattern Recognition Approach Using National Representative Data from the United States

by
George D. Vavougios
1,2,3,*,
Vasileios T. Stavrou
2,*,
Christoforos Konstantatos
4,
Pavlos-Christoforos Sinigalias
5,
Sotirios G. Zarogiannis
3,6,
Konstantinos Kolomvatsos
7,
George Stamoulis
7 and
Konstantinos I. Gourgoulianis
2,3
1
Department of Neurology, University of Cyprus, 75 Kallipoleos Street, Lefkosia 1678, Cyprus
2
Laboratory of Cardio-Pulmonary Testing and Pulmonary Rehabilitation, Department of Respiratory Medicine, Faculty of Medicine, University of Thessaly, Biopolis, 41500 Larissa, Greece
3
Department of Respiratory Medicine, Faculty of Medicine, School of Health Sciences, University of Thessaly, Biopolis, 41500 Larissa, Greece
4
Department of Business Administration, University of Patras, University Campus—Rio, 26504 Patras, Greece
5
Department of Mechanical Engineering and Aeronautics, University of Patras, 26504 Patras, Greece
6
Department of Physiology, Faculty of Medicine, School of Health Sciences, University of Thessaly, Biopois, 41500 Larissa, Greece
7
Department of Electrical and Computer Engineering, University of Thessaly, 37 Glavani—28th October Str., Deligiorgi Building, 4th Floor, 38221 Volos, Greece
*
Authors to whom correspondence should be addressed.
Int. J. Environ. Res. Public Health 2022, 19(8), 4630; https://doi.org/10.3390/ijerph19084630
Submission received: 4 March 2022 / Revised: 3 April 2022 / Accepted: 7 April 2022 / Published: 12 April 2022
(This article belongs to the Special Issue Healthcare and Health: Measures and Evaluation)

Abstract

:
The aim of our study was to determine COVID-19 syndromic phenotypes in a data-driven manner using the survey results based on survey results from Carnegie Mellon University’s Delphi Group. Monthly survey results (>1 million responders per month; 320,326 responders with a certain COVID-19 test status and disease duration <30 days were included in this study) were used sequentially in identifying and validating COVID-19 syndromic phenotypes. Logistic Regression-weighted multiple correspondence analysis (LRW-MCA) was used as a preprocessing procedure, in order to weigh and transform symptoms recorded by the survey to eigenspace coordinates, capturing a total variance of >75%. These scores, along with symptom duration, were subsequently used by the Two Step Clustering algorithm to produce symptom clusters. Post-hoc logistic regression models adjusting for age, gender, and comorbidities and confirmatory linear principal components analyses were used to further explore the data. Model creation, based on August’s 66,165 included responders, was subsequently validated in data from March–December 2020. Five validated COVID-19 syndromes were identified in August: 1. Afebrile (0%), Non-Coughing (0%), Oligosymptomatic (ANCOS); 2. Febrile (100%) Multisymptomatic (FMS); 3. Afebrile (0%) Coughing (100%) Oligosymptomatic (ACOS); 4. Oligosymptomatic with additional self-described symptoms (100%; OSDS); 5. Olfaction/Gustatory Impairment Predominant (100%; OGIP). Our findings indicate that the COVID-19 spectrum may be undetectable when applying current disease definitions focusing on respiratory symptoms alone.

1. Introduction

Since its emergence, COVID-19 has conceptually evolved from a viral pneumonia to a multisystem disease with insidious onset and diverse outcomes [1]. As additional cases caused a shift in case definitions, big data, and detailed symptom indexing arose as a necessity toward guiding evidence-based medicine and preventing severe outcomes [2]. An intrinsic perturbation in using expert-based definitions is inherent bias (i.e., as this is a hypothesis- or observation-driven approach), and an expected lack of recognition of fringe cases or spectrums that may however be deemed as such due to their underrepresentation within a given cohort.
Conversely, data-driven disease phenotyping aims to identify latent structures of potential or established disease descriptors within a given cohort; subsequently, the structures are scrutinized based their salient and unique characteristics in order to determine their characterization as true phenotypes [3]. This has been adopted by other research groups in obstructive sleep apnea, revealing that, i.e., severity based definitions could ignore non-linear relationships between disease characteristics and severity indices [3], as well as omit specific relationships (i.e., latent structures) between clinical manifestations and laboratory findings [4,5,6]. Other implementations in sleep-disordered breathing have shown that aside from classical definitions, i.e., based on an index of morbidity, different combinations of symptoms or laboratory findings could be used as phenotyping variables [7,8]. Aside from sleep-disordered breathing, this proposed methodology [3] has been used successfully in other disease models and implemented in other disease models, enabling the ad hoc development of diverse phenotyping concepts in idiopathic Parkinson’s disease, obesity, and venous thromboembolism [9,10,11,12]. Furthermore, data from multicenter studies have also been shown produce biologically relevant phenotypes via our proposed methodology [13]. These studies have shown that a data-driven, pattern recognition approach is both flexible, robust, and allows the discovery of phenotypes that are independent of clinical preconceptions, which are often subject to salience bias.
We hypothesized that data-driven recognition of COVID-19 phenotypes will allow an unbiased mapping of the global clinical spectrum. Furthermore, these data-driven phenotypes would enable the design of clinical studies and enhance outcome design and evaluation, producing efficacious, bias-free treatments and healthcare policy interventions.
Therefore, the specific aims of the study were the following:
  • The use of reported symptoms to identify latent structures via categorical PCA and dimension reduction approaches, using data from the COVID-19 Delphi Facebook study.
  • To scrutinize the previously created latent structures as potential COVID-19 phenotypes or phenotyping parameters via TSC and artificial intelligence-based classification.

2. Materials and Methods

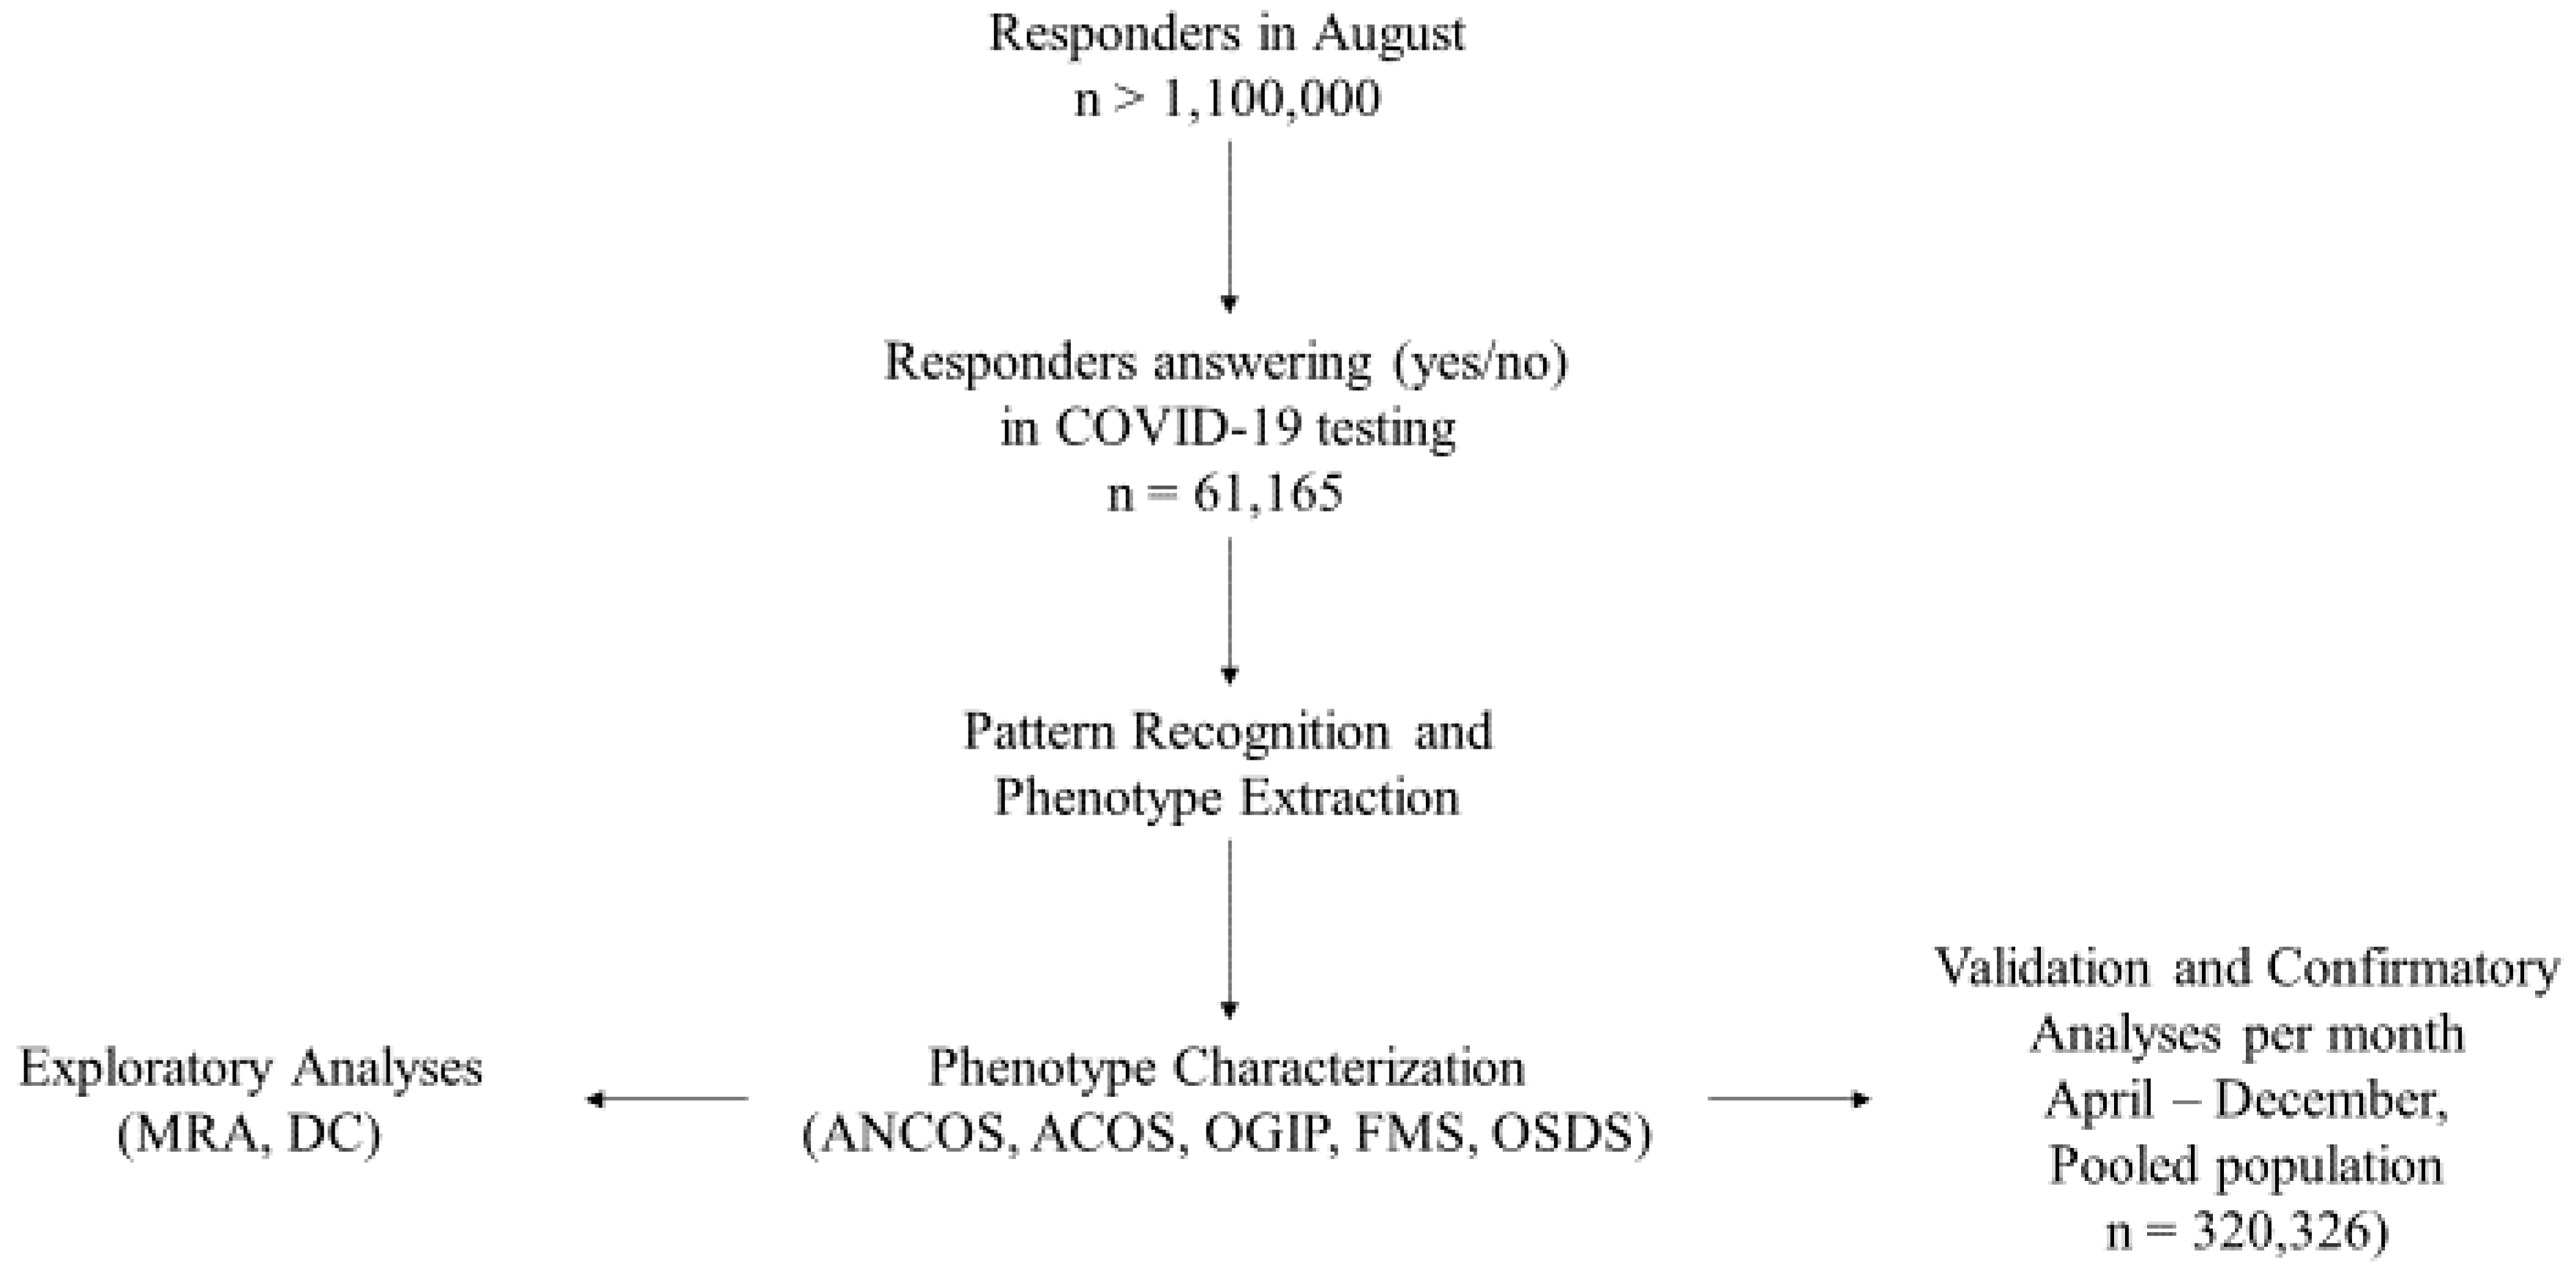
2.1. Study Population

Data for this study were extracted from the CTIS Trends and Impact Survey (CTIS), based on symptom surveys developed by the Delphi group at Carnegie Mellon University (CMU). Initially, Facebook selects a random sample among its users in the United States. The users are then presented with the option to participate in the study. In turn, participation entails the administration of the surveys’ iteration, and covers data on COVID-19-like symptoms, behavioral, mental health, and economic parameters, as well as estimates the impact of the pandemic on the responders daily life. Individual, anonymized survey responses are stored in CMU’s servers and made accessible to healthcare professionals under a project-specific data use agreement. Approximately 50,000 responders participate in the study per day, with monthly survey results comprising more than 1 million responders per month.
A detailed overview of the CTIS, its conception, and evolution are available from: https://delphi.cmu.edu/covid19/ctis/ (accessed on 25 April 2020).

2.2. Study Design

We performed a retrospective analysis of CTIS data collected between May to December in this study, and we included responders with a certain COVID-19 status, i.e., having answered either “Yes” or “No” in the corresponding item of the survey.
An indicative item structure from Wave 4 of the study is the following (note that B10 and B10a are the codes for the corresponding questionnaire items):
B10—Have you been tested for coronavirus (COVID-19) in the last 14 days?
B10a—Did this test find that you had coronavirus (COVID-19)?
A positive COVID-19 status was assigned to responders answering “Yes” in B10a, whereas a negative COVID-19 status was assigned to responders answering “No” in the same item. Responders that answered “I do not know” in item B10a were excluded from further analyses.
As a subsequent exclusion criterion, we employed a cutoff of ≤30 days in symptom duration. This cutoff was selected on the premises of an approximate “return to wellness”, estimated to occur at 14–21 days for 65% of patients a positive outpatient test result, in a recent report by the CDC [14]. The purpose of this cut-off was to simultaneously include COVID-19 patients with longer durations of illness and to exclude symptom durations unlikely to be attributable to COVID-19 manifestations, such as 60 days or more. In order for our approach to be forward and backward compatible, we opted to use the very first incarnation of symptoms attributed to COVID-19 and captured by the survey (i.e., the first wave). As such, a core of the 13 first symptoms recorded by the survey would remain the same, regardless of future additions.

2.3. Statistical Analysis

Pattern Recognition via Multiple Correspondence Analysis

Symptom data were used by combining a logistic regression-based case scoring (See Supplementary Materials) dimension reduction technique and cluster analysis algorithm, as previously described [9,15]. Specific COVID-19 symptoms, encoded as survey items, were used as input variables for multiple correspondence analysis (MCA). In turn, MCA derived object scores for each case, which were subsequently used as input variables for the cluster analysis, along with symptom duration of COVID-19 positive responders [9,16]. The optimal number of MCA-derived dimensions was determined based on achieving a total variance (i.e., cumulative variance per dimension) of >70% [17]. MCA and MCA preprocessing prior to cluster analysis are techniques that allow the identification of latent patterns within a population, based on a set of nominal response variables [18]; OR-weighting of the input variables was used here as a ranking scheme, based on their association with COVID-19-positive responders vs. COVID-19-negative responders.

2.4. Two-Step Clustering and Phenotype Extraction

OR-weighted MCA-produced case-wise object scores (i.e., composite quantifications of symptoms per case) along with symptom durations were subsequently used by the Two Step Clustering (TSC) algorithm to produce symptom phenotypes. Initially, Two Step Clustering merges raw input data into primary subclusters. The second step employs a hierarchical clustering method that aims to merge the subclusters into progressively larger clusters. This process does not require the a priori determination of a set number of clusters. As we and others have previously demonstrated, TSC is well suited for the identification of latent phenotypes in a given population [9,18]. In this study, the Log-likelihood was used as a distance measure, and the Bayesian Information Criterion (BIC) was used as the clustering criterion for the automatic determination of cluster number.

2.5. Phenotype Validation: Cross-Sectional and Longitudinal Aspects

The model that was created on the pilot analysis of 66.165 responders within the August dataset, and was subsequently validated in monthly data ranging from March–December 2020. Specifically, the procedure was as follows:
(a)
The weights extracted from August’s responders were applied to an MCA based on symptom data recorded for each subsequent and preceding month’s responders.
(b)
Object scores were calculated for each responder.
(c)
Object scores and symptom duration per month were used in TSC.

2.6. Crossectional Validation: Phenotypes vs. Controls

Cross sectional validation of the produced phenotypes essentially answers the question of whether a COVID-19 syndrome is associated with a positive COVID-19 test. For this purpose, Receiver Operator Characteristic (ROC) curves were used to determine the diagnostic accuracy of a symptom-based probability for each phenotype when compared to controls. Specifically, ROC curves were fitted by the probability pi, extracted from the application of the logistic regression model derived from August’s data. Hence, pi would be expressed as follows:
p i = e a 0 + a 1 i 1 + a 2 i 2 + a n i n 1 + e a 0 + a 1 i 1 + a 2 i 2 + a n i n   ,   0 < p < 1
where i1, i2, …, in is the symptom per i-th month, and a0, a1, …, an are the f extracted from August’s dataset. This computed probability Pi of cluster membership was used as an input variable for ROC curve fitting. Finally, COVID-19 status was used as a binary dependent variable for the ROC curve, and the area under curve (AUC) was calculated per month, for each cluster.

2.7. Longitudinal Validation: Phenotype Re-Emergence and Symptom Invariance

The primary criterion for validation was the emergence of consistent phenotypes in at least one month other than August, based on complete or quasi-complete symptom separation per phenotype. Essentially, this would translate to the identification of each phenotype based on the most salient symptoms.
The secondary criterion was based on the hypothesis that re-emergent phenotypes would be furthermore identified based on non-salient, non-preclusive symptoms. To meet this criterion, frequency tables for each symptom were constructed per each month and phenotype.
For each symptom S reported on each month M, for a number of months N, we consider the mean, μs:
μ s = S 1 + S 2 + S N N
In order to assess symptom perseverance and their non-random contribution as patterns within each phenotype, we perform a normality test under the null hypothesis that the distribution of a symptom/month [S1, S2, …, SN] is normal, and therefore 95% of the observations lie within two standard deviations of μs. The following concept has been previously used in face recognition algorithms [19]. Here, we used the Shapiro–Wilk test of normality, and a p-value < 0.05 was considered statistically significant. Symptoms achieving below threshold p-values were considered variable for each corresponding phenotype. Correspondingly, longitudinal symptom invariance (SI) is described as follows:
SI = 1 S v M
where Sv is the number of variant symptoms (defined by a Shapiro–Wilk p-value < 0.05) and M is the total number of symptoms. SI is equal to 1 (100%) when S(v) = 0 and SI is equal to 0 (0%) when S(v) = M.

2.8. Post-Hoc Analyses

Associations between each phenotype and symptoms were determined via a combination of the χ2 test with adjusted standardized residuals (Standardized Pearson residuals). A χ2 test p-value < 0.05 and adjusted standardized residuals either greater than 1.96 or less than -1.96 was considered statistically significant. Associations among phenotypes and responder demographic and medical history characteristics (age group, gender, and comorbidity) were investigated via a logistic regression model.

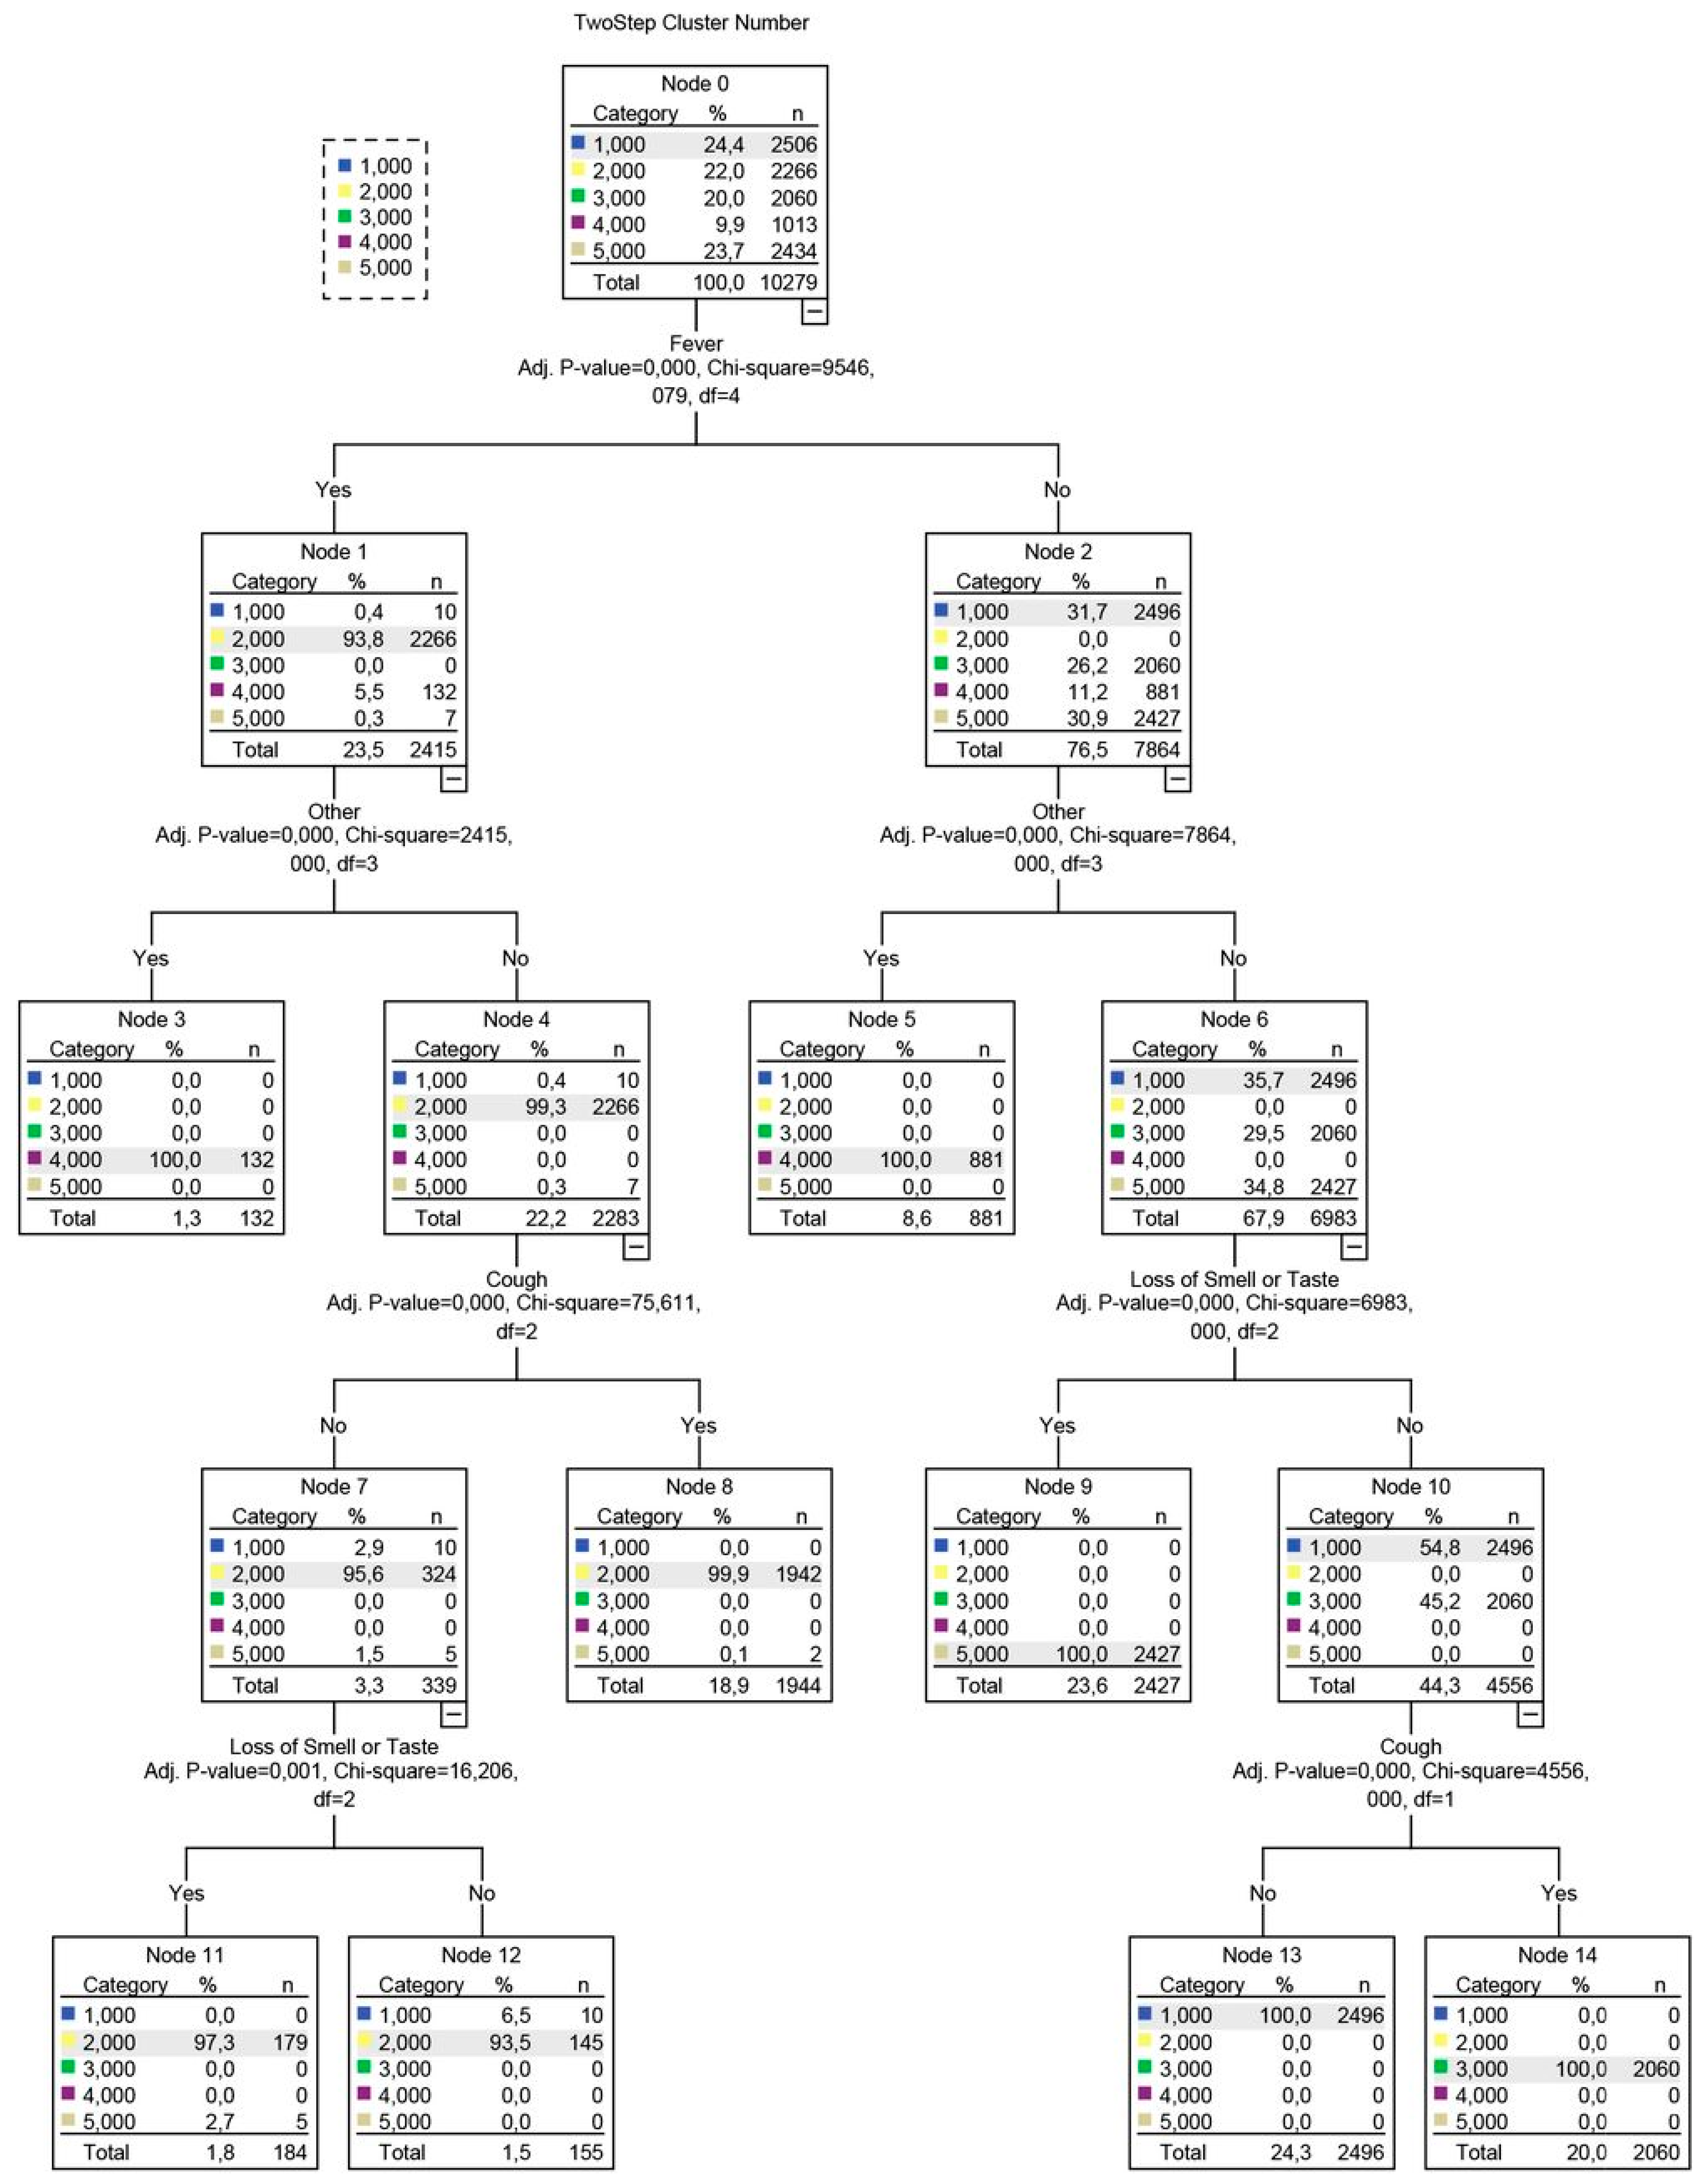
2.9. Determination of Data-Driven Diagnostic Rules via Decision Tree Analyses

For each of the symptom-based phenotypes, certain symptoms were obligatory, i.e., characterized 100% for this purpose; we performed Decision Tree Analyses (DTA) via the Quick, Unbiased, Efficient, Statistical Tree (QUEST) algorithm [20]. Decision tree analysis is a data mining technique that is implemented in order to create a classification scheme from a set of observations; in biomedical research, its main applications include the creation of data-driven diagnostic or predictive rules [21,22]. A detailed presentation of the method is included in Supplementary Materials.
Each p-value < 0.05 was considered statistically significant. All analyses were performed SPSS version 24.0 (IBM, Chicago, IL, USA).

3. Results

3.1. Study Population

The total study population included 320,326 responders with a certain COVID-19 test status and disease duration < 30 days (Figure 1). Table 1 presents the study population’s demographics per month. Supplementary Table S1 presents multinomial regression results per month and phenotype (A1–A5). Figure 2 presents temporal relationships between phenotypes and symptoms, i.e., whether clusters identified in August re-emerged in preceding and succeeding months. Based on our approach, rose charts can effectively visualize the (i) symptom invariance criterion and (ii) symptom pattern re-emergence, both of which were required for the recognition of phenotype stability from concept (August) to validation (preceding and succeeding months).

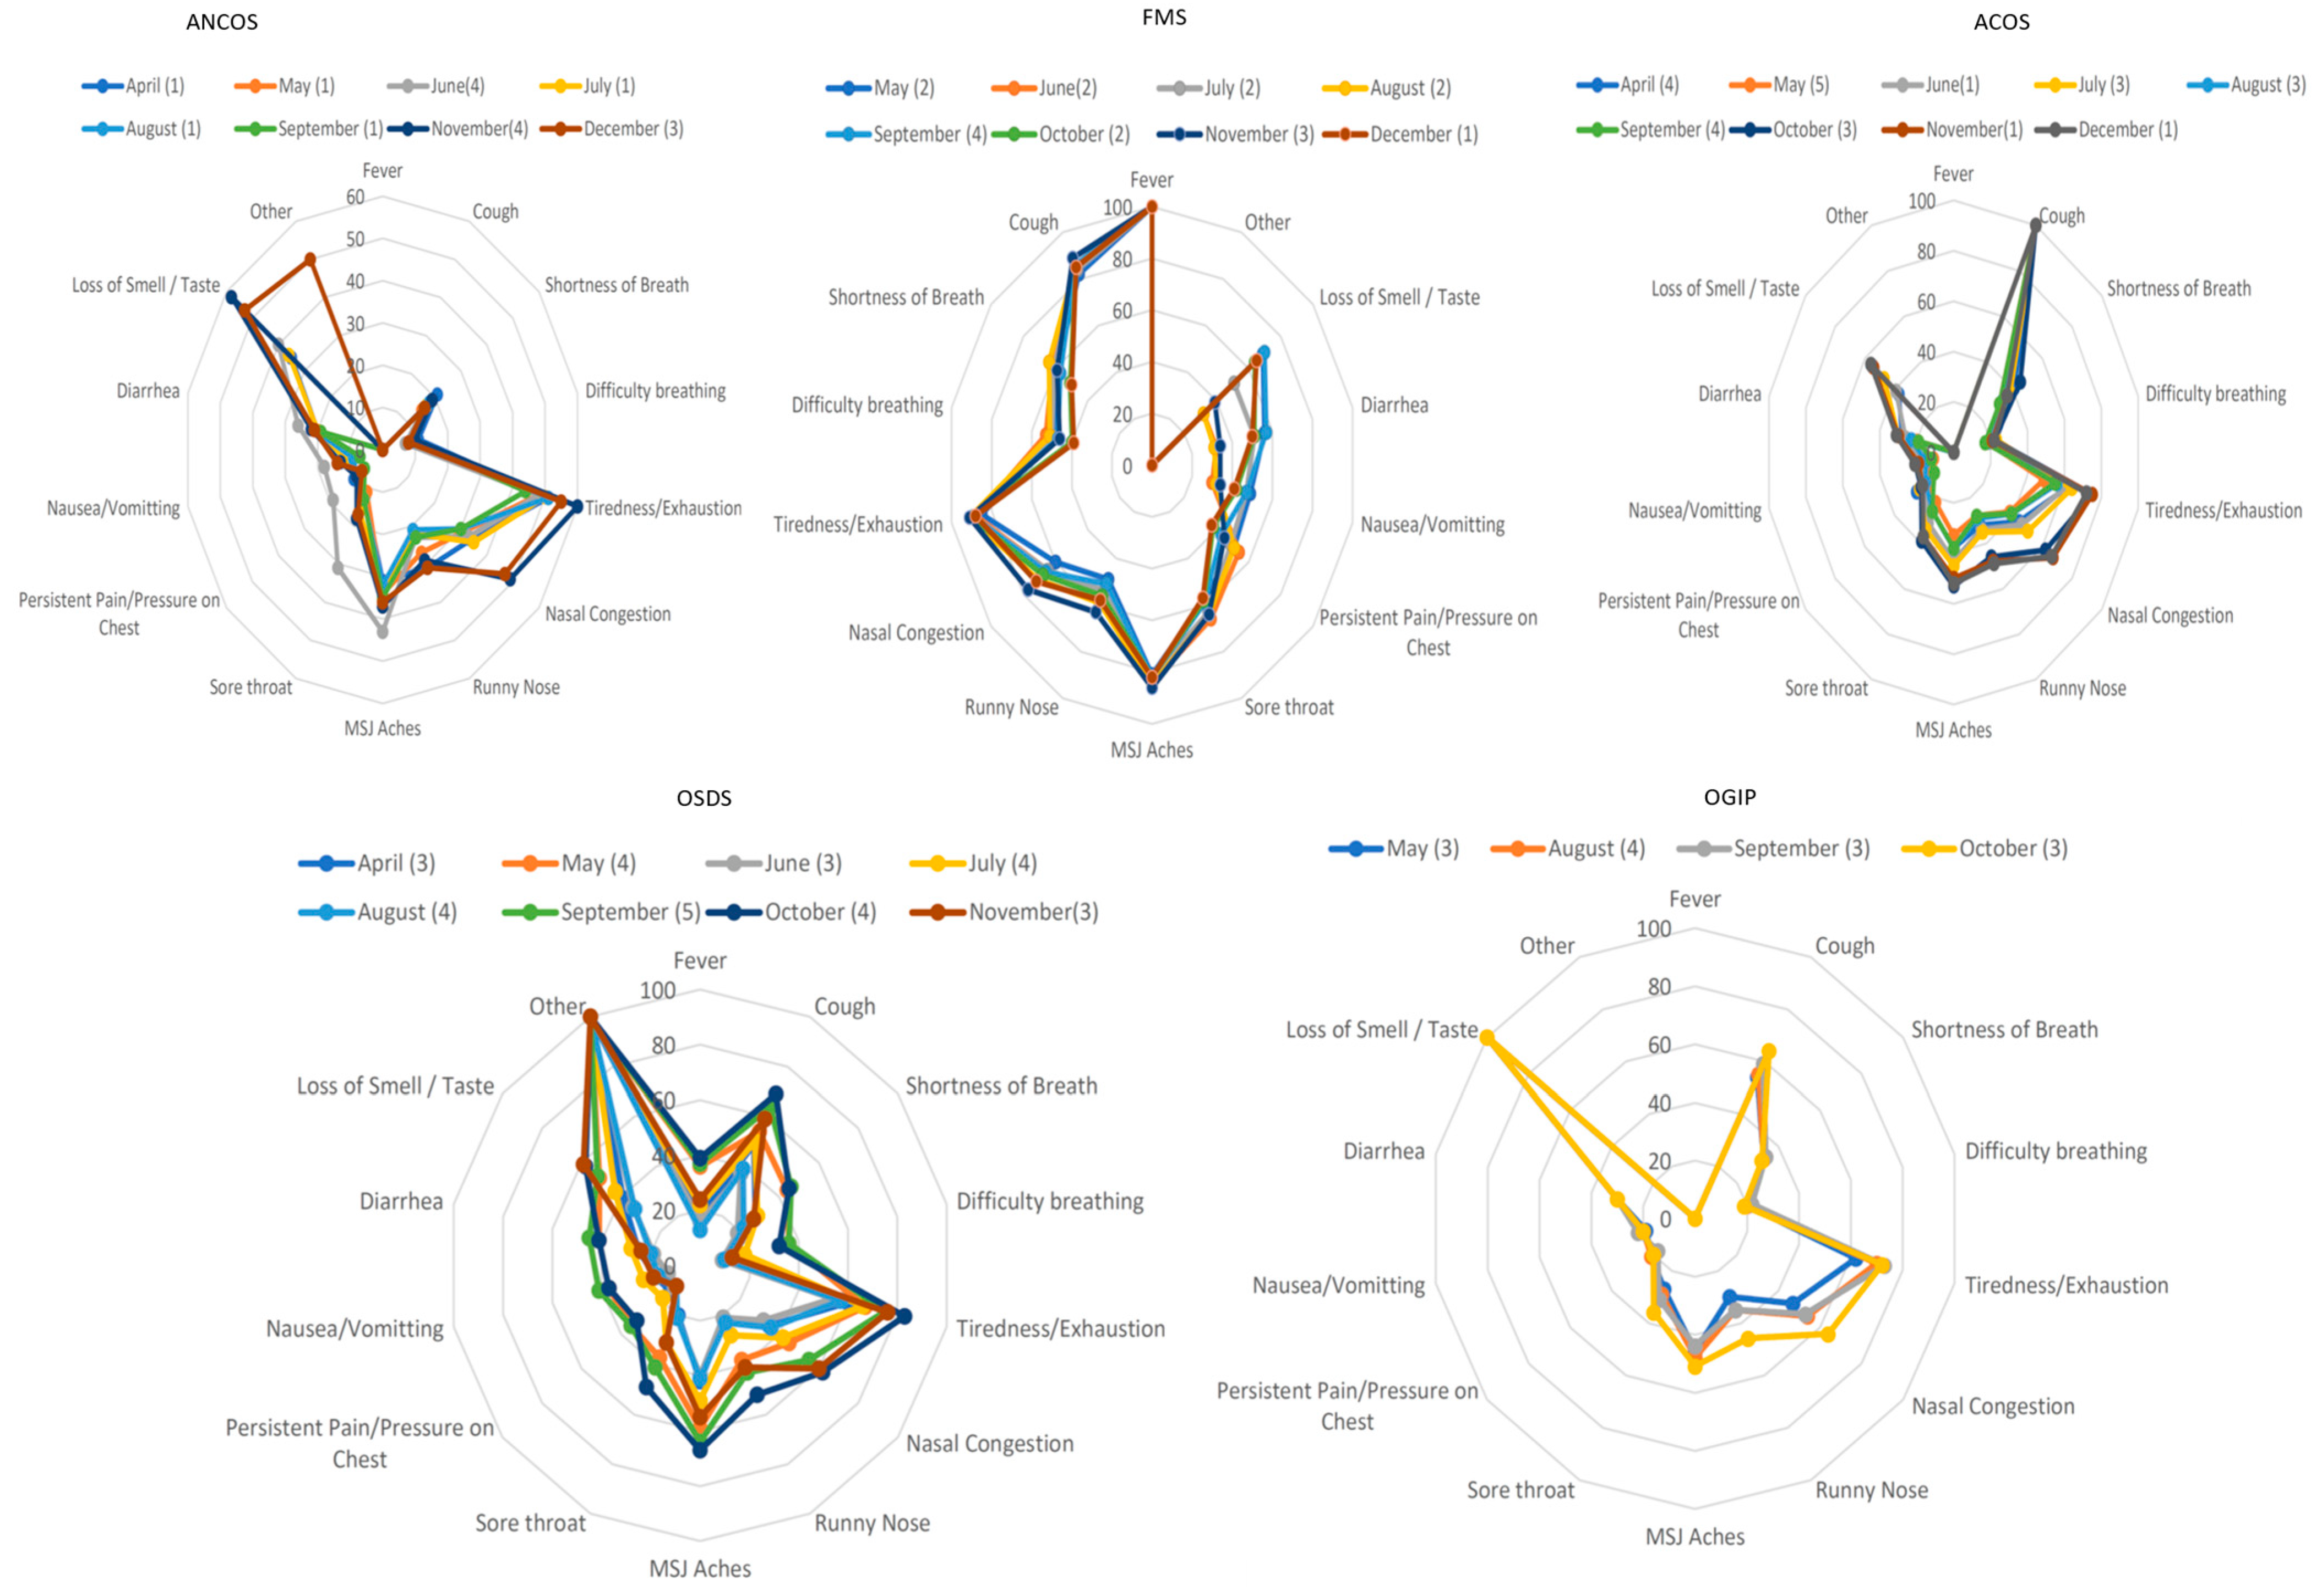
3.2. Phenotype Extraction

Based on the latent structures between symptom data and disease duration, five COVID-19 syndromes (Figure 2; Table 2) were extracted from August’s 61,165 responders:
  • Afebrile (0%), Non-Coughing (0%), Oligosymptomatic (ANCOS).
  • Febrile (100%) Multisymptomatic (FMS).
  • Afebrile (0%) Coughing (100%) Oligosymptomatic (ACOS).
  • Oligosymptomatic with additional self-described symptoms (100%; OSDS).
  • Olfaction/Gustatory Impairment Predominant (100%; OGIP).
Validation and further characterization
Repeating the multiple correspondence and cluster analyses per subsequent and preceding month (April–December), resulted in the validation of each phenotype as follows:
(a)
ANCOS and OSDS emerged in 10/10 months
(b)
MFS and ACOS emerged in 9/10 months
(c)
OGIP emerged in 4/10 months.
Based on the most salient symptoms, decision trees were subsequently constructed (Figure 3), providing a structured approach in identifying each phenotype.
Further characterization of these five phenotypes was achieved via identifying invariant symptoms between April–December (Figure 2); based on these observations and the results of the Shapiro–Wilk tests:
(a)
ANCOS was characterized by general malaise in the absence of fever and upper respiratory tract symptoms.
(b)
ACOS was characterized as a mainly afebrile upper respiratory tract viral infection.
(c)
FMS was a more typical, febrile syndrome covering respiratory and gastrointestinal (GI) manifestations.
(d)
OGIP, the most invariant syndrome, was characterized by the absence of fever and diarrhea.
(e)
OSDS did not typically include symptoms of pain or pressure on the chest, nor difficulty in breathing.
Interestingly, the implementation of “Headache” in December as a standalone question resulted in a decomposition of the OSDS phenotype. This is further exemplified by the comparison between text-mined headache as a symptom in August (10% of OSDS) versus a three-fold increase in prevalence when asked directly in December.
Multiple nominal regression of comorbidities, adjusted for age group and gender, revealed several statistically significant associations (Supplementary Table S1). Notably, a history of asthma and chronic lung disease were abortive comorbidities for certain phenotypes (ANCOS, ACOS, OGIP for asthma, and additionally OSDS for chronic lung disease). Gender and age group did not display sequentially consistent associations with any phenotype.

4. Discussion

In our study, five distinct COVID-19 phenotypes were identified: (a) Afebrile (0%), Non-Coughing (0%), Oligosymptomatic (ANCOS); (b) Febrile (100%) Multisymptomatic (FMS); (c) Afebrile (0%) Coughing (100%) Oligosymptomatic (ACOS); (d) Oligosymptomatic with additional self-described symptoms (100%; OSDS); (e) Olfaction/Gustatory Impairment Predominant (100%; OGIP). Validation of these phenotypes revealed that, based on symptom pattern re-emergence: (a) ANCOS and OSDS emerged in 10/10 months, (b) MFS and ACOS emerged in 9/10 months, (c) OGIP emerged in 4/10 months. The symptom invariance criterion revealed that, between April–December: (a) ANCOS was characterized by general malaise in the absence of fever and upper respiratory tract symptoms, (b) ACOS was characterized as a mainly afebrile upper respiratory tract viral infection, (c) FMS was a more typical, febrile syndrome covering respiratory and gastrointestinal (GI) manifestations, (d) OGIP, the most invariant syndrome, was characterized by the absence of fever and diarrhea, and (e) OSDS did not typically include symptoms of pain or pressure on the chest, nor difficulty in breathing. Additionally, direct inquiry for headache as a symptom in December resulted in a decomposition of the OSDS phenotype. This is further exemplified by the comparison between text-mined headache as a symptom in August (10% of OSDS) versus a three-fold increase in prevalence when asked directly in December. Multiple nominal regression of comorbidities, adjusted for age group and gender, revealed that asthma and chronic lung disease were abortive comorbidities for certain phenotypes (ANCOS, ACOS, OGIP for asthma, and additionally OSDS for chronic lung disease).
The presence or absence of fever, cough, olfactory/gustatory dysfunction, and atypical symptoms defined these phenotypes as their primary features. The concept of symptom invariance was subsequently used to further determine their stability regarding symptom composition, indicating that the olfactory/gustatory predominant phenotype OGIP was the most invariant, i.e., the most stable, across the 4 months that it emerged in. Finally, while several comorbidities such as heart disease and diabetes were associated with the risk of manifesting specific phenotypes, other comorbidities such as asthma were found to be abortive.
After its initial identification as a novel pneumonia, the increasing numbers of COVID-19 cases began to outline a spectrum [23], rather than a linear progression from mild viral infection to a severe one [24]. The recognition of COVID-19′s heterogeneity however was initially limited within the setting of treatment response or severity phenotypes [25,26], while the heterogeneity of non-severe cases or those lacking a salient respiratory aspect was not addressed. Even within the concept of point care phenotyping however, phenotypes similar to those identified in our study have been described by independent studies. Bayesian approaches have identified phenotypes corresponding to FMS, OGIP, and ACOS in the clinical setting, and have included them in diagnostic algorithms [27].
In our cohort, a similar diagnostic rule emerges and recurs in monthly aggregated data, corresponding to the phenotypes identified here (Figure 2).
The importance of phenotyping COVID-19 outside the initially severe or point of care spectrum becomes evident when examining previous iterations of diagnostic criteria; fever and respiratory symptoms were initially the only manifestations considered relevant in defining cases [28]. One of the largest studies on initially asymptomatic or non-respiratory symptom (NRS) phenotype of COVID-19 patients has shown that this approach may miss a portion of active cases that may subsequently convert to severe manifestations [29]. Our findings support this concept, with NRS overlapping with the OGIP, OSFS, and ANCOS phenotypes.
As previous research has suggested, comorbidities were found to be independent predictors of COVID-19 phenotypes, even after adjustments for age group and gender (Supplementary Table S1, S1–S5). As a general rule, two broad categorizations of comorbidities can be inferred: those that can intertwine with the pathophysiology of SARS-CoV-2, such as diabetes [30] and heart disease [31], and those where a treatment effect may restrict phenotype manifestations.
In this light, several noteworthy associations include comorbid asthma and chronic lung disease, which appear to reduce the risk of manifesting the FMS phenotype (Supplementary Table S1, S2). This seemingly paradoxical relationship has been previously explored in the literature, and mainly attributed to the protective effects of inhaled corticosteroids (ICS); Specifically, while their use may lead to quiescent type I/III interferon responses, the concomitant downregulation of ACE2 and TMPRSS2 may restrict SARS-CoV-2 from entering pneumonocytes [32,33]. As our data are limited regarding medication use and the specific respiratory disease of each responder, we cannot safely attribute the associations observed to ICS usage.
Based on current literature, ICS treatment plausibly presents a potential phenotype abortive effect in otherwise vulnerable populations such as asthma patients [34]. Recent evidence on the efficacy of ICS as ad hoc COVID-19 treatments provide further support for this concept [35].
In a similar fashion, the phenotype abortive effect of cancer as a comorbidity could reflect yet another treatment rather than disease effect. Such an effect may account for this association, considering that several anti-cancer treatments are undergoing trials as repurposed COVID-19 treatments [36]. As no data were collected on primary tumors, staging, or treatment [37], due to the nature of the survey, this hypothesis cannot be scrutinized further.

Limitations and Strengths

The results of our study should be interpreted within the context of their limitations. As a survey administered via Facebook, our source data incur the corresponding selection bias. This however is potentially balanced by the large sample size of the final cohort, and represents the single largest study of its kind. Survivor bias is also inherently present in our study, considering that responders are unlikely to have had severe COVID-19 at the time of survey administration. The lack of follow-up data correspondingly precludes that phenotype shifts (e.g., ANCOS or OSDS to FMS) cannot be explored. Another important consideration is that OSDS inevitably absorbs symptoms not originally covered by the initial study iterations and is correspondingly decomposed when these symptoms are identified and added. A prime example of this case is headache as symptom; when left to the discretion of the responder, it might not be evaluated properly as a feature [36]. This paradigm becomes evident by the discordance between text-mining (April–November data, 10% of OSDS) vs. being asked directly (i.e., 30% in all phenotypes and decomposition of OSDS as a “pure” phenotype). Comorbidities, reported by majority as broad categories, cannot be safely considered in strict interpretations as to their associations with phenotypes. Finally, as gender categories beyond male/female are underrepresented in the monthly samples, they cannot be safely used to extrapolate their contribution on clinical phenotypes. These intrinsic caveats of the study are inherited from the broader structure of the data, and the post-hoc extraction of a data subset for a specific concept (i.e., data driven phenotyping of COVID-19 syndromes).

5. Conclusions

The main strength of the study was the determination and retro- and anterograde validation of COVID-19 syndromes in the largest community sample to date. The phenotypes we uncovered solidify phenotypes previously described by independent studies, and furthermore provide the basis and tools for the development of utilizable diagnostic rules. One of the most important concepts explored here is that the febrile respiratory phenotype represents a lesser portion of COVID-19 phenotypes in the community, a finding that should be considered both in epidemiological profiling and healthcare provision. Our findings support the concept of symptom-based phenotypes of COVID-19 that remain distinct within 9–12 days from first symptom onset. The existence of phenotypes rather than severity strata may further explain the low diagnostic accuracy achieved by rule in or rule out algorithms based solely on symptoms, without accounting for their dependency and intercorrelations, even between different systems (i.e., GI and respiratory). In order to utilize our findings in the clinical setting and make them available to other researchers, we have developed an online application that calculates the symptom-based logistic probability Px (Available from: http://se8ec.csb.app, (accessed on 24 April 2020)). In this community-based sample, febrile respiratory disease was infrequent when compared to atypical presentations within a range of 9–12 days from symptom onset; this finding may be critical in current epidemiological surveillance and the development of transmission dynamics concepts.

Supplementary Materials

The following are available online at https://www.mdpi.com/article/10.3390/ijerph19084630/s1.

Author Contributions

G.D.V., C.K. and P.-C.S. conceived and designed the manuscript; G.D.V., V.T.S., C.K., P.-C.S., S.G.Z., K.K., G.S., K.I.G. wrote the final draft; G.D.V., V.T.S., C.K., P.-C.S., S.G.Z., K.K., G.S., K.I.G. edited the paper; C.K., P.-C.S. created study related software; V.T.S. copy-edited the manuscript and figures. All authors have read and agreed to the published version of the manuscript.

Funding

This research received no external funding.

Institutional Review Board Statement

Deidentified data were provided by Carnegie Mellon University to the University of Thessaly via a project-based collaboration between the two institutions, consolidated and outlined by a Research Data Use Agreement. The Research Data Use Agreement was made and entered into as of 21 August 2020 by and between Carnegie Mellon University, a Pennsylvania non-profit corporation, the Department of Respiratory Medicine, Faculty of Medicine, University of Thessaly, a Non-profit organization/University having its principal place of business at Biopolis, P.C. 41500 Larissa, Greece. The Carnegie Mellon University (CMU) CMU Institutional Review Board approved the original survey protocol and instrument (IRB Approval Registration Number: STUDY2020_00000162).

Informed Consent Statement

Informed consent was obtained from all subjects involved in the study.

Data Availability Statement

All data are available upon request.

Conflicts of Interest

The authors declare no conflict of interest.

References

  1. Lai, C.C.; Ko, W.C.; Lee, P.I.; Jean, S.S.; Hsueh, P.R. Extra-respiratory manifestations of COVID-19. Int. J. Antimicrob. Agents 2020, 56, 106024. [Google Scholar] [CrossRef] [PubMed]
  2. Cherian, R.; Chandra, B.; Tung, M.L.; Vuylsteke, A. COVID-19 conundrum: Clinical phenotyping based on pathophysiology as a promising approach to guide therapy in a novel illness. Eur. Respir. J. 2020, 56, 2002135. [Google Scholar] [CrossRef] [PubMed]
  3. Vavougios, G.D.; George, D.G.; Pastaka, C.; Zarogiannis, S.G.; Gourgoulianis, K.I. Phenotypes of comorbidity in OSAS patients: Combining categorical principal component analysis with cluster analysis. J. Sleep Res. 2016, 25, 31–38. [Google Scholar] [CrossRef] [PubMed]
  4. Zinchuk, A.V.; Gentry, M.J.; Concato, J.; Yaggi, H.K. Phenotypes in obstructive sleep apnea: A definition, examples and evolution of approaches. Sleep Med. Rev. 2017, 35, 113–123. [Google Scholar] [CrossRef]
  5. Lim, D.C.; Sutherland, K.; Cistulli, P.A.; Pack, A.I. P4 medicine approach to obstructive sleep apnoea. Respirology 2017, 22, 849–860. [Google Scholar] [CrossRef] [Green Version]
  6. Mihaicuta, S.; Udrescu, M.; Topirceanu, A.; Udrescu, L. Network science meets respiratory medicine for OSAS phenotyping and severity prediction. PeerJ 2017, 5, e3289. [Google Scholar] [CrossRef] [Green Version]
  7. Crawford, M.R.; Chirinos, D.A.; Iurcotta, T.; Edinger, J.D.; Wyatt, J.K.; Manber, R.; Ong, J.C. Characterization of Patients Who Present with Insomnia: Is There Room for a Symptom Cluster-Based Approach? J. Clin. Sleep Med. 2017, 13, 911–921. [Google Scholar] [CrossRef] [Green Version]
  8. Scarlata, S.; Pennazza, G.; Santonico, M.; Santangelo, S.; Rossi Bartoli, I.; Rivera, C.; Vernile, C.; De Vincentis, A.; Antonelli Incalzi, R. Screening of Obstructive Sleep Apnea Syndrome by Electronic-Nose Analysis of Volatile Organic Compounds. Sci. Rep. 2017, 7, 11938. [Google Scholar] [CrossRef] [Green Version]
  9. Vavougios, G.D.; Doskas, T.; Kormas, C.; Krogfelt, K.A.; Zarogiannis, S.G.; Stefanis, L. Identification of a prospective early motor progression cluster of Parkinson’s disease: Data from the PPMI study. J. Neurol. Sci. 2018, 387, 103–108. [Google Scholar] [CrossRef]
  10. Reategui, R.; Ratte, S.; Bautista-Valarezo, E.; Duque, V. Cluster Analysis of Obesity Disease Based on Comorbidities Extracted from Clinical Notes. J. Med. Syst. 2019, 43, 52. [Google Scholar] [CrossRef]
  11. Zinchuk, A.; Yaggi, H.K. Phenotypic Subtypes of OSA: A Challenge and Opportunity for Precision Medicine. Chest 2020, 157, 403–420. [Google Scholar] [CrossRef]
  12. Martins, T.D.; Annichino-Bizzacchi, J.M.; Romano, A.V.C.; Filho, R.M. Principal Component Analysis on Recurrent Venous Thromboembolism. Clin. Appl. Thromb. Hemost. 2019, 25, 1076029619895323. [Google Scholar] [CrossRef]
  13. Shoji, T.; Sato, N.; Fukuda, H.; Muraki, Y.; Kawata, K.; Akazawa, M. Clinical Implication of the Relationship between Antimicrobial Resistance and Infection Control Activities in Japanese Hospitals: A Principal Component Analysis-Based Cluster Analysis. Antibiotics 2022, 11, 229. [Google Scholar] [CrossRef]
  14. Tenforde, M.W.; Kim, S.S.; Lindsell, C.J.; Rose, E.B.; Shapiro, N.I.; Files, D.C.; Gibbs, K.W.; Erickson, H.L.; Steingrub, J.S.; Smithline, H.A.; et al. Symptom Duration and Risk Factors for Delayed Return to Usual Health Among Outpatients with COVID-19 in a Multistate Health Care Systems Network—United States, March–June 2020. MMWR Morb. Mortal. Wkly. Rep. 2020, 69, 993–998. [Google Scholar] [CrossRef]
  15. Costa, P.S.; Santos, N.C.; Cunha, P.; Cotter, J.; Sousa, N. The Use of Multiple Correspondence Analysis to Explore Associations between Categories of Qualitative Variables in Healthy Ageing. J. Aging Res. 2013, 2013, 302163. [Google Scholar] [CrossRef]
  16. Van Horn, A.; Weitz, C.A.; Olszowy, K.M.; Dancause, K.N.; Sun, C.; Pomer, A.; Silverman, H.; Lee, G.; Tarivonda, L.; Chan, C.W.; et al. Using multiple correspondence analysis to identify behaviour patterns associated with overweight and obesity in Vanuatu adults. Public Health Nutr. 2019, 22, 1533–1544. [Google Scholar] [CrossRef]
  17. Benassi, M.; Garofalo, S.; Ambrosini, F.; Sant’Angelo, R.P.; Raggini, R.; De Paoli, G.; Ravani, C.; Giovagnoli, S.; Orsoni, M.; Piraccini, G. Using Two-Step Cluster Analysis and Latent Class Cluster Analysis to Classify the Cognitive Heterogeneity of Cross-Diagnostic Psychiatric Inpatients. Front. Psychol. 2020, 11, 1085. [Google Scholar] [CrossRef]
  18. Song, Y.Y.; Lu, Y. Decision tree methods: Applications for classification and prediction. Shanghai Arch. Psychiatry 2015, 27, 130–135. [Google Scholar]
  19. Girard, C.I.; Warren, C.E.; Romanchuk, N.J.; Del Bel, M.J.; Carsen, S.; Chan, A.D.; Benoit, D.L. Decision Tree Learning Algorithm for Classifying Knee Injury Status Using Return-to-Activity Criteria. In Proceedings of the 42nd Annual International Conference of the IEEE Engineering in Medicine & Biology Society, Montreal, QC, Canada, 20–24 July 2020; Volume 2020, pp. 5494–5497. [Google Scholar]
  20. Ramezankhani, A.; Hadavandi, E.; Pournik, O.; Shahrabi, J.; Azizi, F.; Hadaegh, F. Decision tree-based modelling for identification of potential interactions between type 2 diabetes risk factors: A decade follow-up in a Middle East prospective cohort study. BMJ Open 2016, 6, e013336. [Google Scholar] [CrossRef]
  21. Venkatasubramaniam, A.; Wolfson, J.; Mitchell, N.; Barnes, T.; JaKa, M.; French, S. Decision trees in epidemiological research. Emerg. Themes Epidemiol. 2017, 14, 11. [Google Scholar] [CrossRef]
  22. Loh, W.; Shih, Y. Split selection methods for classification trees. Stat. Sin. 1997, 7, 815–840. [Google Scholar]
  23. Jain, A.; Doyle, D.J. Stages or phenotypes? A critical look at COVID-19 pathophysiology. Intensive Care Med. 2020, 46, 1494–1495. [Google Scholar] [CrossRef]
  24. Voutouri, C.; Nikmaneshi, M.R.; Hardin, C.C.; Patel, A.B.; Verma, A.; Khandekar, M.J.; Dutta, S.; Stylianopoulos, T.; Munn, L.L.; Jain, R.K. In silico dynamics of COVID-19 phenotypes for optimizing clinical management. Proc. Natl. Acad. Sci. USA 2021, 118, e2021642118. [Google Scholar] [CrossRef]
  25. Rello, J.; Storti, E.; Belliato, M.; Serrano, R. Clinical phenotypes of SARS-CoV-2: Implications for clinicians and researchers. Eur. Respir. J. 2020, 55, 2001028. [Google Scholar] [CrossRef] [PubMed]
  26. Smith, D.S.; Richey, E.A.; Brunetto, W.L. A Symptom-Based Rule for Diagnosis of COVID-19. SN Compr. Clin. Med. 2020, 2, 1947–1954. [Google Scholar] [CrossRef] [PubMed]
  27. Zhou, T.T.; Wei, F.X. Primary stratification and identification of suspected Corona virus disease 2019 (COVID-19) from clinical perspective by a simple scoring proposal. Mil. Med. Res. 2020, 7, 16. [Google Scholar] [CrossRef] [PubMed]
  28. Bello-Chavolla, O.Y.; Antonio-Villa, N.E.; Vargas-Vazquez, A.; Fermin-Martinez, C.A.; Marquez-Salinas, A.; Bahena-Lopez, J.P. Profiling cases with non-respiratory symptoms and asymptomatic SARS-CoV-2 infections in Mexico City. Clin. Infect. Dis. 2020, 72, e655–e658. [Google Scholar] [CrossRef] [PubMed]
  29. Muniyappa, R.; Gubbi, S. COVID-19 pandemic, coronaviruses, and diabetes mellitus. Am. J. Physiol. Endocrinol. Metab. 2020, 318, E736–E741. [Google Scholar] [CrossRef] [Green Version]
  30. Bansal, M. Cardiovascular disease and COVID-19. Diabetes Metab. Syndr. 2020, 14, 247–250. [Google Scholar] [CrossRef]
  31. Hughes-Visentin, A.; Paul, A.B.M. Asthma and COVID-19: What do we know now. Clin. Med. Insights Circ. Respir. Pulm. Med. 2020, 14, 1179548420966242. [Google Scholar] [CrossRef]
  32. Higham, A.; Mathioudakis, A.; Vestbo, J.; Singh, D. COVID-19 and COPD: A narrative review of the basic science and clinical outcomes. Eur. Respir. Rev. 2020, 29, 200199. [Google Scholar] [CrossRef]
  33. Peters, M.C.; Sajuthi, S.; Deford, P.; Christenson, S.; Rios, C.L.; Montgomery, M.T.; Woodruff, P.G.; Mauger, D.T.; Erzurum, S.C.; Johansson, M.W.; et al. COVID-19-related Genes in Sputum Cells in Asthma. Relationship to Demographic Features and Corticosteroids. Am. J. Respir. Crit. Care Med. 2020, 202, 83–90. [Google Scholar] [CrossRef]
  34. Hosoki, K.; Chakraborty, A.; Sur, S. Molecular mechanisms and epidemiology of COVID-19 from an allergist’s perspective. J. Allergy Clin. Immunol. 2020, 146, 285–299. [Google Scholar] [CrossRef]
  35. Borcherding, N.; Jethava, Y.; Vikas, P. Repurposing Anti-Cancer Drugs for COVID-19 Treatment. Drug Des. Dev. Ther. 2020, 14, 5045–5058. [Google Scholar] [CrossRef]
  36. Struyf, T.; Deeks, J.J.; Dinnes, J.; Takwoingi, Y.; Davenport, C.; Leeflang, M.M.; Spijker, R.; Hooft, L.; Emperador, D.; Domen, J.; et al. Signs and symptoms to determine if a patient presenting in primary care or hospital outpatient settings has COVID-19 disease. Cochrane Database Syst. Rev. 2020, 7, CD013665. [Google Scholar]
  37. Friedman, B.W.; Grosberg, B.M. Diagnosis and management of the primary headache disorders in the emergency department setting. Emerg. Med. Clin. N. Am. 2009, 27, 71–87. [Google Scholar] [CrossRef] [Green Version]
Figure 1. Study Workflow. Phenotype legends: 1. Afebrile (0%), Non-Coughing (0%), Oligosymptomatic (ANCOS); 2. Febrile (100%) Multisymptomatic (FMS); 3. Afebrile (0%) Coughing (100%) Oligosymptomatic (ACOS); 4. Oligosymptomatic with additional self-described symptoms (100%; OSDS); 5. Olfaction/Gustatory Impairment Predominant (100%; OGIP).
Ijerph 19 04630 g001
Figure 2. Rose charts presenting the temporal relationships between phenotypes and symptoms. Phenotype legends: 1. Afebrile (0%), Non-Coughing (0%), Oligosymptomatic (ANCOS); 2. Febrile (100%) Multisymptomatic (FMS); 3. Afebrile (0%) Coughing (100%) Oligosymptomatic (ACOS); 4. Oligosymptomatic with additional self-described symptoms (100%; OSDS); 5. Olfaction/Gustatory Impairment Predominant (100%; OGIP). The numbers in parentheses represent the cluster numbers from the validation process, e.g., cluster number n in August and cluster number c in June would both correspond to FMS.
Ijerph 19 04630 g002
Figure 3. Decision tree developed using the QUEST algorithm. The decision tree’s branches are based on splits, i.e., variables that were selected based on a Chi-squared test-determined p-value. The dependent variable for this analysis was a cluster number, represented as a nominal categorical variable with 5 levels, corresponding to the initial 5 clusters detected in August.
Ijerph 19 04630 g003
Table 1. Demographics per month of the study population.
April
(n = 22,320)
May
(n = 38,043)
June
(n = 51,582)
July
(n = 78,951)
August
(n = 66,155)
September
(n = 12,801)
October
(n = 19,137)
November
(n = 22,698)
December
(n = 48,629)
COVID-19 40004955657313,37010,2791773593610,02621,617
Age Group18–24178329734202704759651194121116063312
25–3448567423983715,55912,1582204335348059002
35–4447947249891914,45011,5022116388648569529
45–5442817030888613,66011,1462119351940958809
55–6432206235866112,38510,7752173332032277440
65–74144735975655779172181483180815393907
>753129071632231721555315734271181
NA16272629379057425246981146721435449
GenderM5001975413,23020,31317,42734344555475210,684
F15,45924,98533,67251,55642,364817012,73215,36031,612
NB149284366613532104141176347
SD10221925235729772119144248
NA153325449653565100128128322
N/A14562486361354594980921146221385416
Cancer 12232338320943533783816108210402289
HD65567768845013,35210,79220364738621312,229
HTN395246825129826364861302297939317785
Asthma 12,22219,03524,96238,64532,205603111,46114,30928,597
CLD936114,94619,20130,19725,7285141964412,50425,272
KD803512,26414,66822,83019,3933907820310,02920,615
AD880714,70219,36528,43823,6924587845010,53321,677
DiabetesT1D48178313995017,18112,82226275102556512,807
T2D420243974556769858991110280339337743
IC30915150584710,235732514755351940879238
Notes: Age Groups are measured in years. Cancer was specified as any form of neoplasm except skin cancer. AD: Autoimmune Disease; CLD: Chronic Lung Disease such as COPD; F: Female; HD: Heart Disease; HTN: Hypertension; IC: Immunocompromised. KD: Kidney Disease; M: Male; N/A: Not answered; NA: Not available; NB: Non-Binary; SD: Self-Described. Please note that for November’s responders we selected participants that received wave 4 of Delphi Study Questionnaire.
Table 2. Cluster composition and symptom-based prediction vs. COVID-19—(controls)—August.
NAUCp-Value95% CI
ANCOS (1)2506<0.5NANA
FMS (2)22660.963<0.0010.961–0.965
ACOS (3)20600.737<0.0010.729–0.746
OSDS (4)10130.777<0.0010.762–0.792
OGIP (5)24340.983<0.0010.982–0.984
Notes: Five COVID-19 syndromes were identified in August: 1. Afebrile (0%), Non-Coughing (0%), Oligosymptomatic (ANCOS); 2. Febrile (100%) Multisymptomatic (FMS); 3. Afebrile (0%) Coughing (100%) Oligosymptomatic (ACOS); 4. Oligosymptomatic with additional self-described symptoms (100%; OSDS); 5. Olfaction/Gustatory Impairment Predominant (100%; OGIP). AUC: Area Under Curve.
Publisher’s Note: MDPI stays neutral with regard to jurisdictional claims in published maps and institutional affiliations.

