
Comparing the Metabolic Profiles Associated with Fitness Status between Insulin-Sensitive and Insulin-Resistant Non-Obese Individuals
 , , , and
Abstract
:1. Introduction
2. Materials and Methods
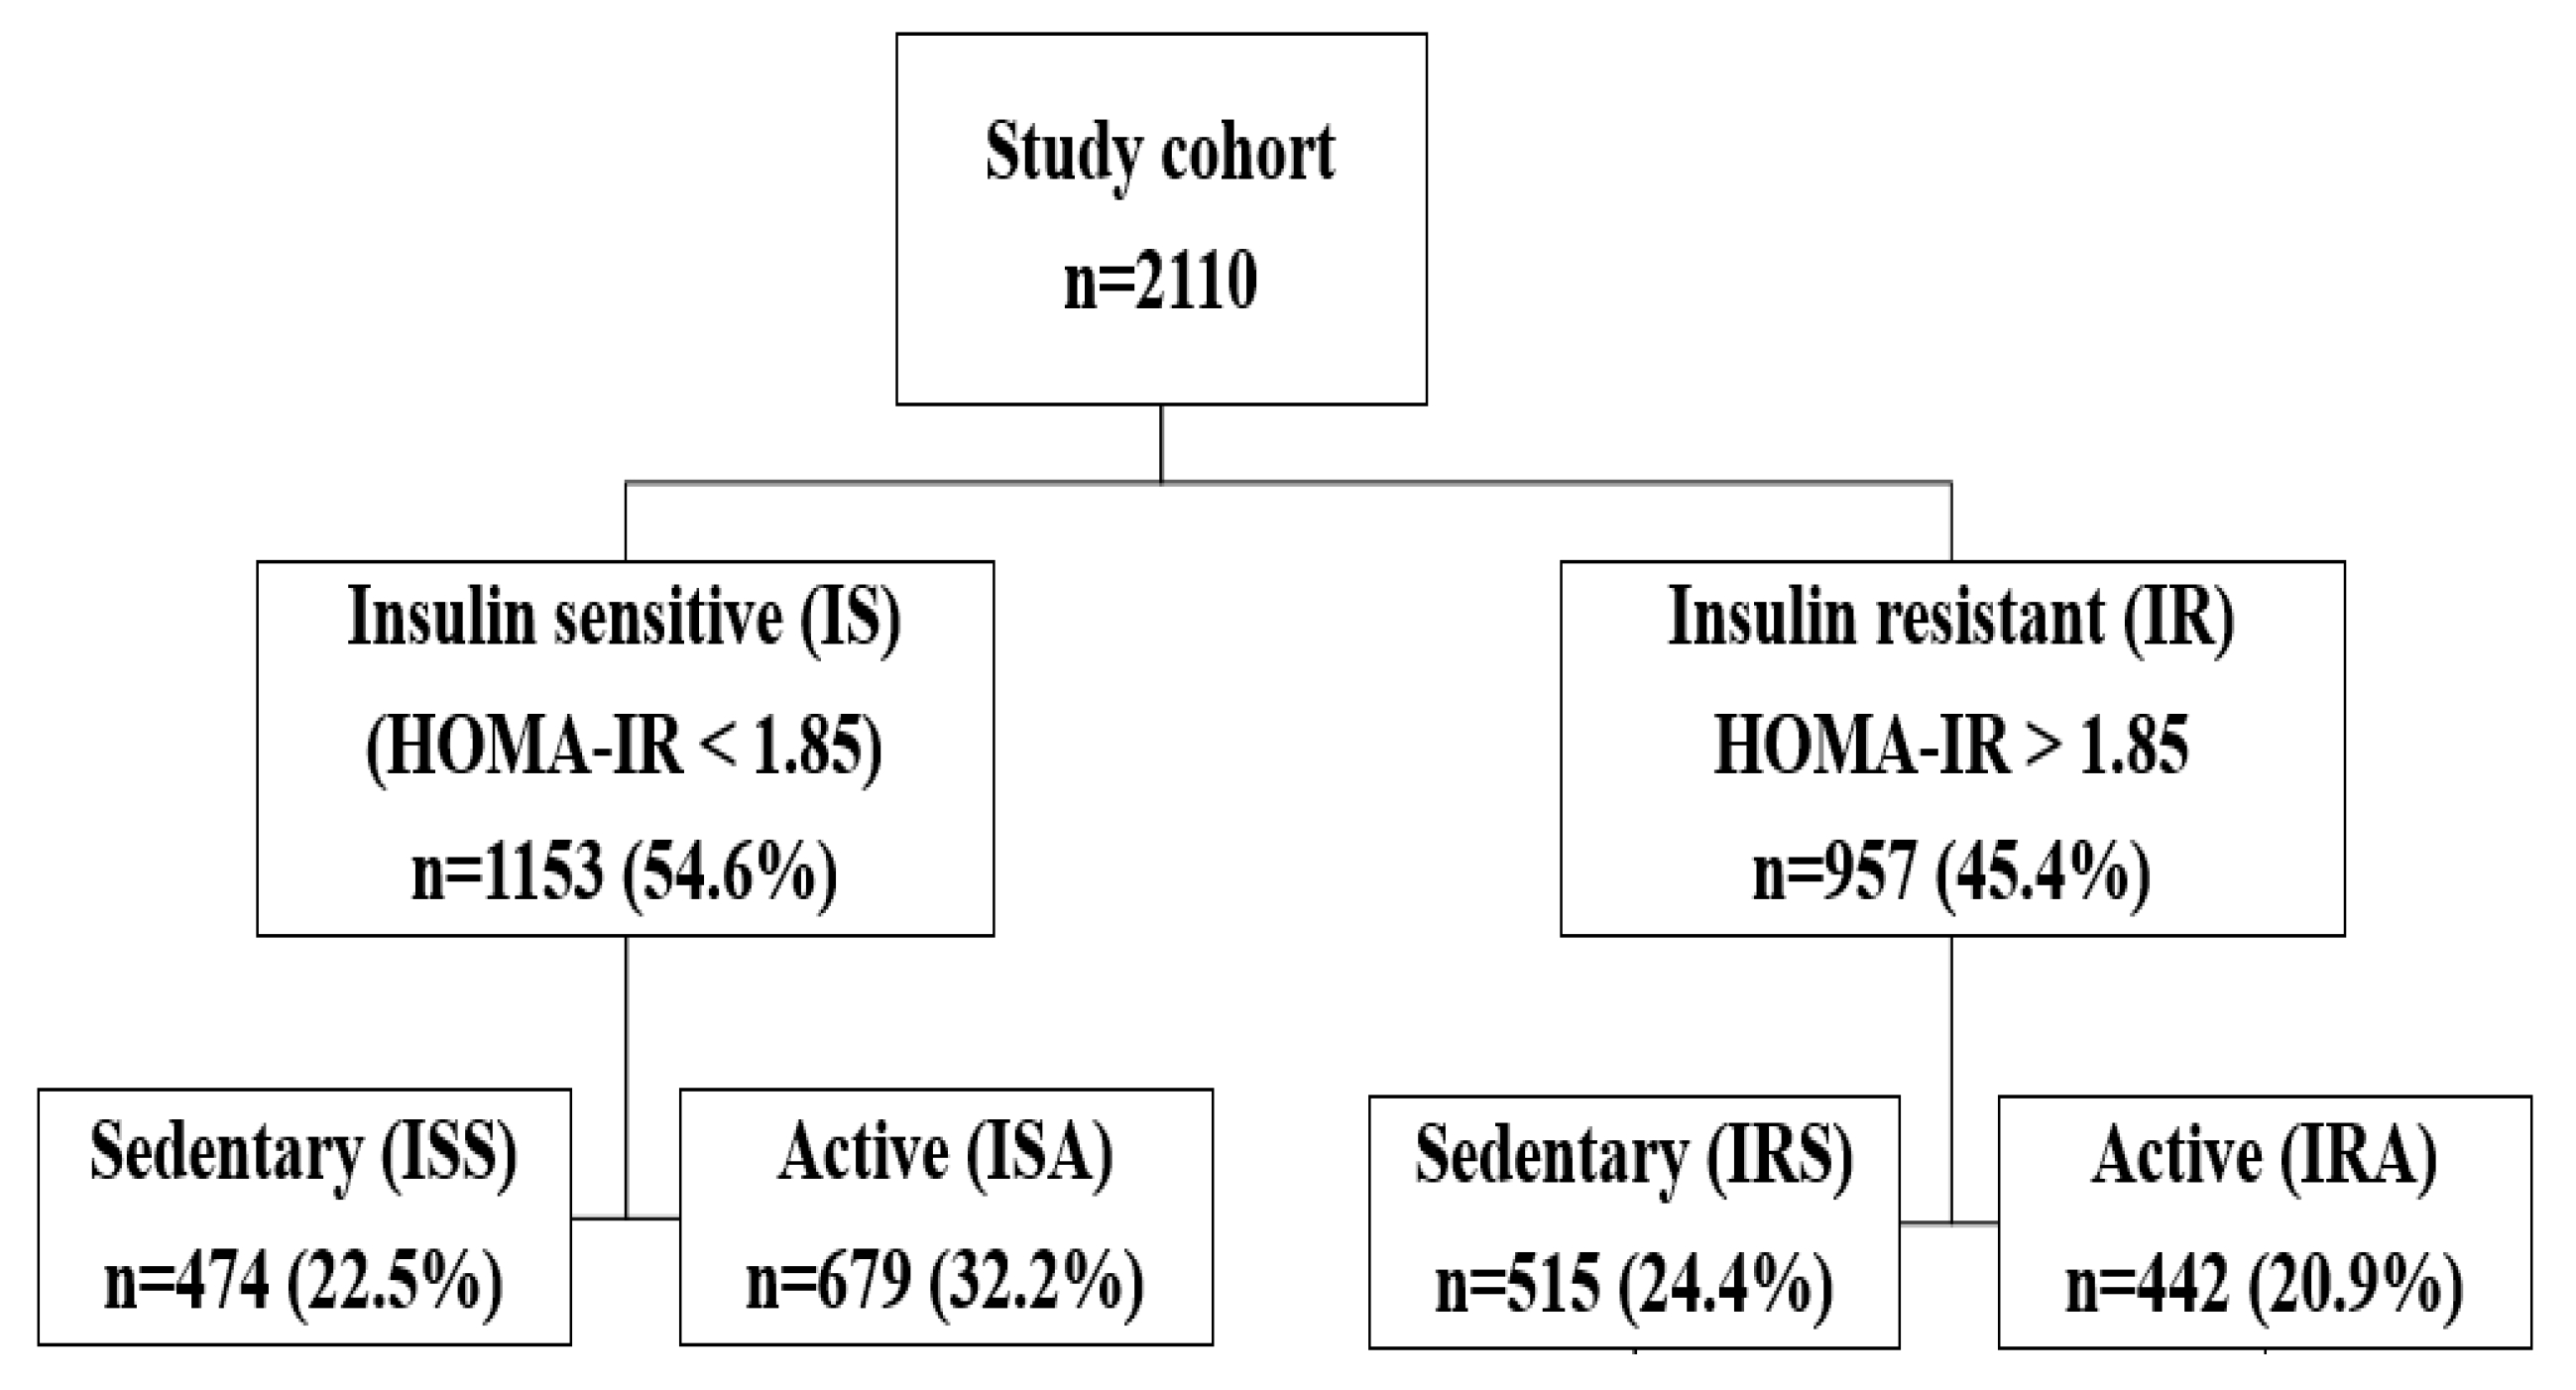
2.1. Data Source and Study Participants
2.2. Statistical Analysis
3. Results
3.1. Differences between IS and IR Individuals Regardless of Physical Activity Status
3.1.1. BMI, Pulse Rate, Glucose, and C-Peptide Levels
3.1.2. Hematological Parameters, Liver Function Tests, and Lipid Profile
3.1.3. Iron Profile and Hormones
3.2. Comparing the Effect of Physical Activity in IS and IR Subjects
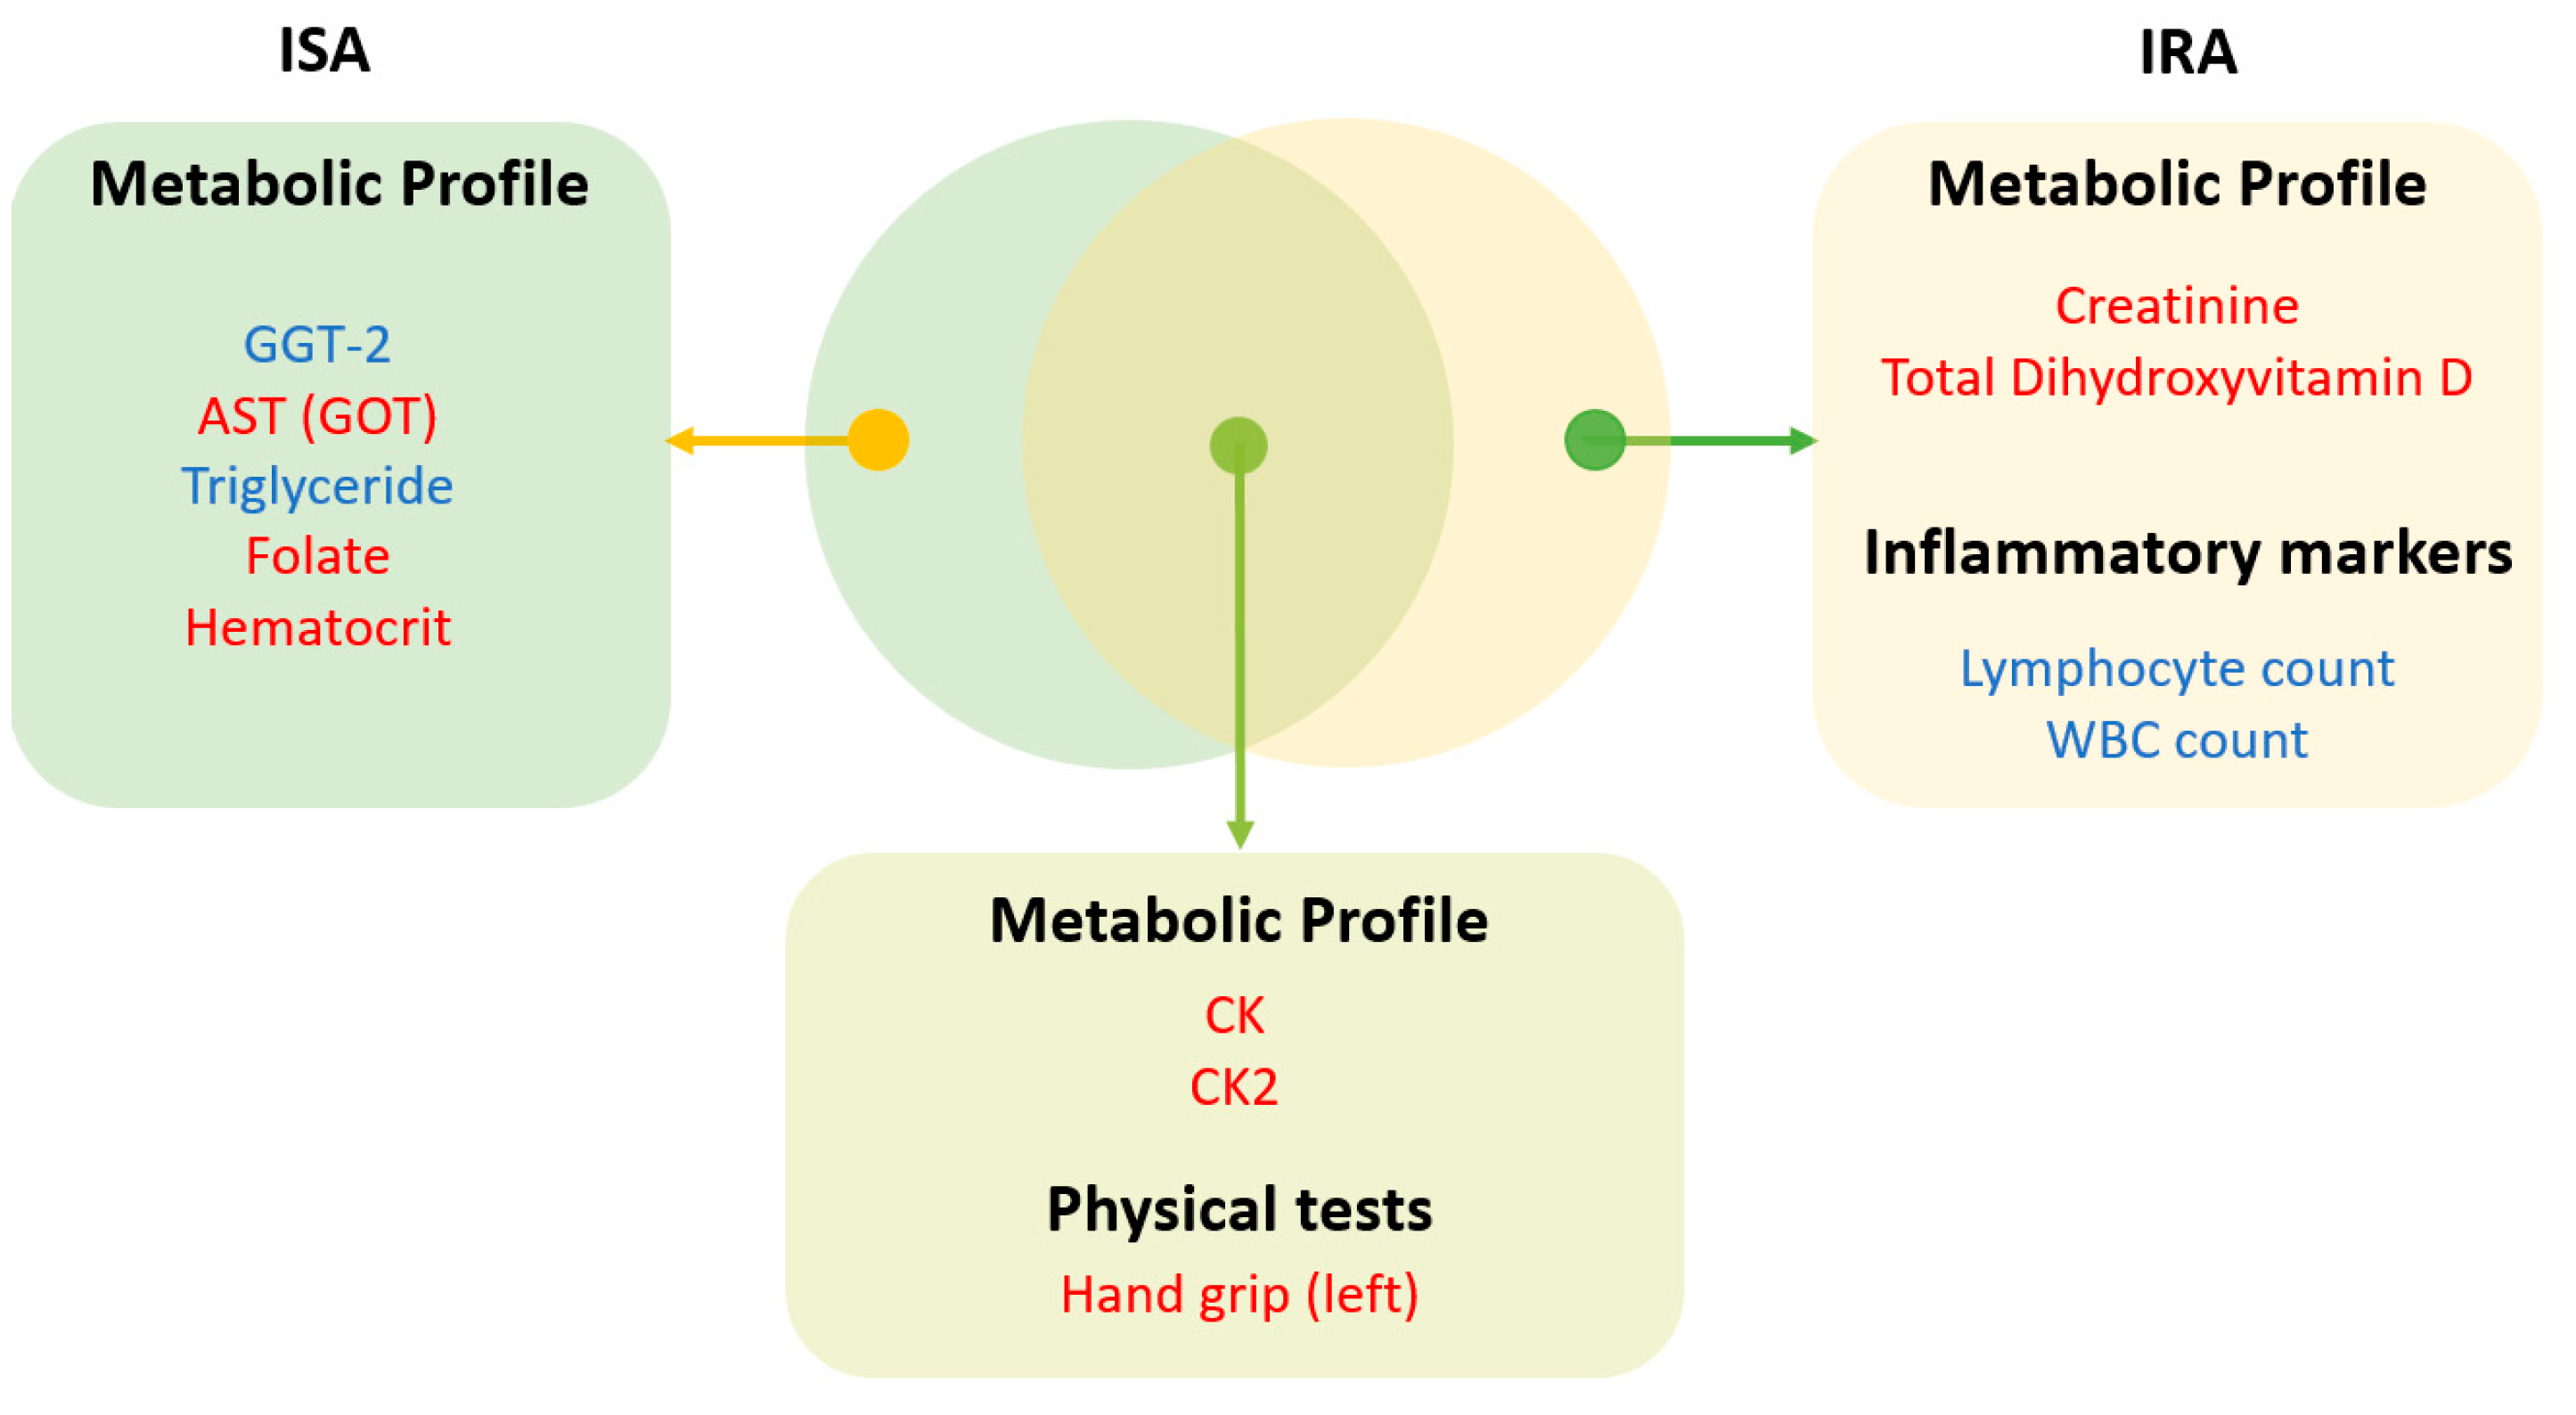
3.3. Differential Metabolic Response to Physical Activity in IS vs. IR
4. Discussion
4.1. Association between IR and BMI, Pulse Rate, and Hematological Parameters
4.2. Association between IR and Kidney and Liver Function Tests
4.3. Association between IR and Hormones and Lipid Profile
4.4. Association between IR and Iron Profile and Vitamins
4.5. Association between Physical Activity and Cardiac Markers
4.6. Association between Physical Activity and Hematological Parameters
4.7. Association between Physical Activity and Lipid Profile and Vitamin D
4.8. Difference in the Metabolic Profile Due to Physical Activity between Males and Females of Different HOMA-IR Groups
5. Conclusions
Supplementary Materials
Author Contributions
Funding
Institutional Review Board Statement
Informed Consent Statement
Data Availability Statement
Acknowledgments
Conflicts of Interest
References
- Dal Canto, E.; Ceriello, A.; Rydén, L.; Ferrini, M.; Hansen, T.B.; Schnell, O.; Standl, E.; Beulens, J.W. Diabetes as a cardiovascular risk factor: An overview of global trends of macro and micro vascular complications. Eur. J. Prev. Cardiol. 2019, 26, 25–32. [Google Scholar] [CrossRef] [PubMed]
- Bener, A.; Mohammad, A.-G.; Ismail, A.N.; Zirie, M.; Abdullatef, W.K.; Al-Hamaq, A.O. Gender and Age-Related Differences in Patients with the Metabolic Syndrome in A Highly Endogamous Population. Bosn. J. Basic Med. Sci. 2010, 10, 210–217. [Google Scholar] [CrossRef] [PubMed]
- Mabry, R.M.; Reeves, M.M.; Eakin, E.; Owen, N. Gender differences in prevalence of the metabolic syndrome in Gulf Cooperation Council Countries: A systematic review. Diabet. Med. 2010, 27, 593–597. [Google Scholar] [CrossRef] [PubMed]
- Elrayess, M.A.; Rizk, N.M.; Fadel, A.S.; Kerkadi, A. Prevalence and Predictors of Insulin Resistance in Non-Obese Healthy Young Females in Qatar. Int. J. Environ. Res. Public Health 2020, 17, 5088. [Google Scholar] [CrossRef] [PubMed]
- Luc, K.; Schramm-Luc, A.; Guzik, T.J.; Mikolajczyk, T.P. Oxidative stress and inflammatory markers in prediabetes and diabetes. J. Physiol. Pharmacol. 2019, 70, 809–824. [Google Scholar]
- World Health Organization. Physical status: The use and interpretation of anthropometry. Report of a WHO Expert Committee. World Health Organ. Tech. Rep. Ser. 1995, 854, 1–452. [Google Scholar]
- McLaughlin, T.; Allison, G.; Abbasi, F.; Lamendola, C.; Reaven, G. Prevalence of insulin resistance and associated cardiovascular disease risk factors among normal weight, overweight, and obese individuals. Metabolism 2004, 53, 495–499. [Google Scholar] [CrossRef]
- St-Onge, M.P.; Janssen, I.; Heymsfield, S.B. Metabolic syndrome in normal-weight Americans: New definition of the metabolically obese, normal-weight individual. Diabetes Care 2004, 27, 2222–2228. [Google Scholar] [CrossRef]
- Owei, I.; Umekwe, N.; Provo, C.; Wan, J.; Dagogo-Jack, S. Insulin-sensitive and insulin-resistant obese and non-obese phenotypes: Role in prediction of incident pre-diabetes in a longitudinal biracial cohort. BMJ Open Diabetes Res. Care 2017, 5, e000415. [Google Scholar] [CrossRef]
- Al-Khelaifi, F.; Donati, F.; Botrè, F.; Latiff, A.; Abraham, D.; Hingorani, A.; Georgakopoulos, C.; Suhre, K.; Yousri, N.A.; Elrayess, M.A. Metabolic profiling of elite athletes with different cardiovascular demand. Scand. J. Med. Sci. Sports 2019, 29, 933–943. [Google Scholar] [CrossRef]
- Horton, E.S. Effects of Lifestyle Changes to Reduce Risks of Diabetes and Associated Cardiovascular Risks: Results from Large Scale Efficacy Trials. Obesity 2009, 17 (Suppl. 3), S43–S48. [Google Scholar] [CrossRef] [PubMed]
- Ruderman, N.; Chisholm, D.; Pi-Sunyer, X.; Schneider, S. The metabolically obese, normal-weight individual revisited. Diabetes 1998, 47, 699–713. [Google Scholar] [CrossRef] [PubMed]
- Stanford, K.I.; Goodyear, L.J. Exercise and type 2 diabetes: Molecular mechanisms regulating glucose uptake in skeletal muscle. Adv. Physiol. Educ. 2014, 38, 308–314. [Google Scholar] [CrossRef]
- Tuomilehto, J.; Lindström, J.; Eriksson, J.G.; Valle, T.T.; Hämäläinen, H.; Ilanne-Parikka, P.; Keinänen-Kiukaanniemi, S.; Laakso, M.; Louheranta, A.; Rastas, M.; et al. Prevention of Type 2 Diabetes Mellitus by Changes in Lifestyle among Subjects with Impaired Glucose Tolerance. N. Engl. J. Med. 2001, 344, 1343–1350. [Google Scholar] [CrossRef]
- Blonde, L. Current Antihyperglycemic Treatment Guidelines and Algorithms for Patients with Type 2 Diabetes Mellitus. Am. J. Med. 2010, 123, S12–S18. [Google Scholar] [CrossRef]
- Mondon, C.E.; Dolkas, C.B.; Reaven, G.M. Site of enhanced insulin sensitivity in exercise-trained rats at rest. Am. J. Physiol. Metab. 1980, 239, E169–E177. [Google Scholar] [CrossRef]
- James, D.; Kraegen, E.W.; Chisholm, D.J. Effects of exercise training on in vivo insulin action in individual tissues of the rat. J. Clin. Investig. 1985, 76, 657–666. [Google Scholar] [CrossRef]
- Eriksson, J.; Taimela, S.; Koivisto, V.A. Exercise and the metabolic syndrome. Diabetologia 1997, 40, 125–135. [Google Scholar]
- Schneider, S.H.S.; Vitug, A.; Ruderman, N. Atherosclerosis and physical activity. Diabetes Metab. Rev. 1986, 1, 513–553. [Google Scholar] [CrossRef] [PubMed]
- Holloszy, J.O.; Schultz, J.; Kusnierkiewicz, J.; Hagberg, J.M.; Ehsani, A.A. Effects of Exercise on Glucose Tolerance and Insulin Resistance. Acta Medica Scand. 2009, 220, 55–65. [Google Scholar] [CrossRef]
- Meigs, J.B.; D’Agostino, R.B., Sr.; Wilson, P.W.; Cupples, L.A.; Nathan, D.M.; Singer, D.E. Risk variable clustering in the insulin resistance syndrome. The Framingham Offspring Study. Diabetes 1997, 46, 1594–1600. [Google Scholar] [CrossRef] [PubMed]
- Beck, E.; Esser, N.; Paquot, N.; Scheen, A.J. Metabolically obese normal-weight individuals and metabolically healthy, but obese, subjects. Rev. Med. Suisse 2009, 5, 1644–1646, 1648–1649. [Google Scholar] [PubMed]
- Oliveros, E.; Somers, V.K.; Sochor, O.; Goel, K.; Lopez-Jimenez, F. The Concept of Normal Weight Obesity. Prog. Cardiovasc. Dis. 2014, 56, 426–433. [Google Scholar] [CrossRef] [PubMed]
- Chaabna, K.; Mamtani, R.; Abraham, A.; Maisonneuve, P.; Lowenfels, A.B.; Cheema, S. Physical Activity and Its Barriers and Facilitators among University Students in Qatar: A Cross-Sectional Study. Int. J. Environ. Res. Public Health 2022, 19, 7369. [Google Scholar] [CrossRef] [PubMed]
- Sayegh, S.; Van Der Walt, M.; Al-Kuwari, M.G. One-year assessment of physical activity level in adult Qatari females: A pedometer-based longitudinal study. Int. J. Women’s Health 2016, 8, 287–293. [Google Scholar] [CrossRef]
- Griffin, A.; Roselli, T.; Clemens, S.L. Trends in Total Physical Activity Time, Walking, and Vigorous Physical Activity Time in Queensland Adults from 2004–2008. J. Phys. Act. Health 2020, 17, 592–602. [Google Scholar] [CrossRef]
- Majed, L.; Sayegh, S.; Chrismas, B.C.R. Reference Walking Speeds for Healthy Young Adults in Qatar: Moderating Effect of Obesity and Physical Activity. SAGE Open 2022, 12, 21582440221079919. [Google Scholar] [CrossRef]
- Pfützner, A.; Schöndorf, T.; Hanefeld, M.; Forst, T. High-Sensitivity C-Reactive Protein Predicts Cardiovascular Risk in Diabetic and Nondiabetic Patients: Effects of Insulin-Sensitizing Treatment with Pioglitazone. J. Diabetes Sci. Technol. 2010, 4, 706–716. [Google Scholar] [CrossRef]
- Mahdiani, A.; Kheirandish, M.; Bonakdaran, S. Correlation between White Blood Cell Count and Insulin Resistance in Type 2 Diabetes. Curr. Diabetes Rev. 2019, 15, 62–66. [Google Scholar] [CrossRef]
- Talukdar, S.; Bandyopadhyay, G.; Li, D.; Xu, J.; McNelis, J.; Lu, M.; Li, P.; Yan, Q.; Zhu, Y.; Ofrecio, J.; et al. Neutrophils mediate insulin resistance in mice fed a high-fat diet through secreted elastase. Nat. Med. 2012, 18, 1407–1412. [Google Scholar] [CrossRef]
- Lou, M.; Luo, P.; Tang, R.; Peng, Y.; Yu, S.; Huang, W.; He, L. Relationship between neutrophil-lymphocyte ratio and insulin resistance in newly diagnosed type 2 diabetes mellitus patients. BMC Endocr. Disord. 2015, 15, 9. [Google Scholar] [CrossRef] [PubMed]
- Barbieri, M.; Ragno, E.; Benvenuti, E.; Zito, G.A.; Corsi, A.; Ferrucci, L.; Paolisso, G. New aspects of the insulin resistance syndrome: Impact on haematological parameters. Diabetologia 2001, 44, 1232–1237. [Google Scholar] [CrossRef] [PubMed]
- Lima, W.G.; Martins-Santos, M.E.S.; Chaves, V.E. Uric acid as a modulator of glucose and lipid metabolism. Biochimie 2015, 116, 17–23. [Google Scholar] [CrossRef] [PubMed]
- Yang, M.; Ni, C.; Chang, B.; Jiang, Z.; Zhu, Y.; Tang, Y.; Li, Z.; Li, C.; Li, B. Association between serum total bilirubin levels and the risk of type 2 diabetes mellitus. Diabetes Res. Clin. Pract. 2019, 152, 23–28. [Google Scholar] [CrossRef]
- Choi, S.; Yun, K.; Choi, H. Relationships between serum total bilirubin levels and metabolic syndrome in Korean adults. Nutr. Metab. Cardiovasc. Dis. 2013, 23, 31–37. [Google Scholar] [CrossRef]
- Khoei, N.S.; Wagner, K.-H.; Sedlmeier, A.M.; Gunter, M.J.; Murphy, N.; Freisling, H. Bilirubin as an indicator of cardiometabolic health: A cross-sectional analysis in the UK Biobank. Cardiovasc. Diabetol. 2022, 21, 54. [Google Scholar] [CrossRef]
- Son, D.-H.; Ha, H.-S.; Lee, Y.-J. Association of Serum Alkaline Phosphatase with the TG/HDL Ratio and TyG Index in Korean Adults. Biomolecules 2021, 11, 882. [Google Scholar] [CrossRef]
- Liu, C.; Shao, M.; Lu, L.; Zhao, C.; Qiu, L.; Liu, Z. Obesity, insulin resistance and their interaction on liver enzymes. PLoS ONE 2021, 16, e0249299. [Google Scholar] [CrossRef]
- Azarpazhooh, M.R.; Najafi, F.; Darbandi, M.; Kiarasi, S.; Oduyemi, T.; Spence, J.D. Triglyceride/High-Density Lipoprotein Cholesterol Ratio: A Clue to Metabolic Syndrome, Insulin Resistance, and Severe Atherosclerosis. Lipids 2021, 56, 405–412. [Google Scholar] [CrossRef]
- Almuraikhy, S.; Kafienah, W.; Bashah, M.; Diboun, I.; Jaganjac, M.; Al-Khelaifi, F.; Abdesselem, H.; Mazloum, N.A.; Alsayrafi, M.; Mohamed-Ali, V.; et al. Interleukin-6 induces impairment in human subcutaneous adipogenesis in obesity-associated insulin resistance. Diabetologia 2016, 59, 2406–2416. [Google Scholar] [CrossRef]
- Al-Sulaiti, H.; Diboun, I.; Agha, M.V.; Mohamed, F.F.S.; Atkin, S.; Dömling, A.S.; Elrayess, M.A.; Mazloum, N.A. Metabolic signature of obesity-associated insulin resistance and type 2 diabetes. J. Transl. Med. 2019, 17, 348. [Google Scholar] [CrossRef] [PubMed]
- Al-Sulaiti, H.; Diboun, I.; Banu, S.; Al-Emadi, M.; Amani, P.; Harvey, T.M.; Dömling, A.S.; Latiff, A.; Elrayess, M.A. Triglyceride profiling in adipose tissues from obese insulin sensitive, insulin resistant and type 2 diabetes mellitus individuals. J. Transl. Med. 2018, 16, 175. [Google Scholar] [CrossRef] [PubMed]
- Diboun, I.; Al-Mansoori, L.; Al-Jaber, H.; Albagha, O.; Elrayess, M.A. Metabolomics of Lean/Overweight Insulin-Resistant Females Reveals Alterations in Steroids and Fatty Acids. J. Clin. Endocrinol. Metab. 2020, 106, e638–e649. [Google Scholar] [CrossRef]
- Moriyama, K.; Urata, N.; Masuda, Y.; Oda, K.; Okuno, C.; Yamada, C.; Takashimizu, S.; Kubo, A.; Kishimoto, N.; Nishizaki, Y. Usefulness of Triglyceride to High-Density Lipoprotein Ratio and Alanine Aminotransferase for Predicting Insulin Resistance and Metabolic Syndrome in the Japanese Population. Metab. Syndr. Relat. Disord. 2021, 19, 225–232. [Google Scholar] [CrossRef]
- Chiang, J.-K.; Lai, N.-S.; Chang, J.-K.; Koo, M. Predicting insulin resistance using the triglyceride-to-high-density lipoprotein cholesterol ratio in Taiwanese adults. Cardiovasc. Diabetol. 2011, 10, 93. [Google Scholar] [CrossRef]
- Grossmann, M.; Thomas, M.; Panagiotopoulos, S.; Sharpe, K.; MacIsaac, R.J.; Clarke, S.; Zajac, J.D.; Jerums, G. Low Testosterone Levels Are Common and Associated with Insulin Resistance in Men with Diabetes. J. Clin. Endocrinol. Metab. 2008, 93, 1834–1840. [Google Scholar] [CrossRef]
- Souteiro, P.; Belo, S.; Oliveira, S.C.; Neves, J.S.; Magalhães, D.; Pedro, J.; Bettencourt-Silva, R.; Costa, M.M.; Varela, A.; Queiros, J.; et al. Insulin resistance and sex hormone-binding globulin are independently correlated with low free testosterone levels in obese males. Andrologia 2018, 50, e13035. [Google Scholar] [CrossRef] [PubMed]
- Benites-Zapata, V.A.; Urrunaga-Pastor, D.; Torres-Mallma, C.; Prado-Bravo, C.; Guarnizo-Poma, M.; Lazaro-Alcantara, H. Is free triiodothyronine important in the development of insulin resistance in healthy people? Diabetes Metab. Syndr. 2017, 11 (Suppl. 2), S663–S667. [Google Scholar] [CrossRef]
- Ferrannini, E.; Iervasi, G.; Cobb, J.; Ndreu, R.; Nannipieri, M. Insulin resistance and normal thyroid hormone levels: Prospective study and metabolomic analysis. Am. J. Physiol. Metab. 2017, 312, E429–E436. [Google Scholar] [CrossRef]
- Chen, Y.; Wan, J.; Xia, H.; Li, Y.; Xu, Y.; Lin, H.; Iftikhar, H. Total iron binding capacity (TIBC) is a potential biomarker of left ventricular remodelling for patients with iron deficiency anaemia. BMC Cardiovasc. Disord. 2020, 20, 4–9. [Google Scholar] [CrossRef]
- Dutta, D.; Maisnam, I.; Shrivastava, A.; Sinha, A.; Ghosh, S.; Mukhopadhyay, P.; Mukhopadhyay, S.; Chowdhury, S. Serum vitamin-D predicts insulin resistance in individuals with prediabetes. Indian J. Med. Res. 2013, 138, 853–860. [Google Scholar] [PubMed]
- Wimalawansa, S.J. Associations of vitamin D with insulin resistance, obesity, type 2 diabetes, and metabolic syndrome. J. Steroid Biochem. Mol. Biol. 2018, 175, 177–189. [Google Scholar] [CrossRef] [PubMed]
- Adaikalakoteswari, A.; Vatish, M.; Alam, M.T.; Ott, S.; Kumar, S.; Saravanan, P. Low Vitamin B12 in Pregnancy Is Associated With Adipose-Derived Circulating miRs Targeting PPARgamma and Insulin Resistance. J. Clin. Endocrinol. Metab. 2017, 102, 4200–4209. [Google Scholar] [CrossRef] [PubMed] [Green Version]
- Cigerli, O.; Parildar, H.; Unal, A.D.; Tarcin, O.; Kut, A.; Eroglu, H.; Guvener, N. Vitamin Deficiency and Insulin Resistance in Nondiabetic Obese Patients. Acta Endocrinol. (Buchar.) 2016, 12, 319–327. [Google Scholar] [CrossRef]
- Zhang, H.; Wang, X.; Zhang, J.; Guan, Y.; Xing, Y. Early supplementation of folate and vitamin B12 improves insulin resistance in intrauterine growth retardation rats. Transl. Pediatr. 2022, 11, 466–473. [Google Scholar] [CrossRef]
- Banfi, G.; Colombini, A.; Lombardi, G.; Lubkowska, A. Metabolic markers in sports medicine. Adv. Clin. Chem. 2012, 56, 1–54. [Google Scholar] [CrossRef]
- Nealon, D.A.; Pettit, S.M.; Henderson, A.R. Activation of human creatine kinase isoenzymes by pH and various sulfhydryl and chelating agents. Clin. Chem. 1981, 27, 402–404. [Google Scholar] [CrossRef]
- Takagi, Y.; Yasuhara, T.; Gomi, K. Creatine kinase and its isozymes. Rinsho Byori Suppl. 2001, 116, 52–61. [Google Scholar]
- Oliveira, C.P.; Sanches, P.D.L.; de Abreu-Silva, E.O.; Marcadenti, A. Nutrition and Physical Activity in Nonalcoholic Fatty Liver Disease. J. Diabetes Res. 2015, 2016, 4597246. [Google Scholar] [CrossRef]
- Evans, D.L. Cardiovascular Adaptations to Exercise and Training. Veter-Clin. N. Am. Equine Pract. 1985, 1, 513–531. [Google Scholar] [CrossRef]
- Mairbäurl, H. Red blood cells in sports: Effects of exercise and training on oxygen supply by red blood cells. Front. Physiol. 2013, 4, 332. [Google Scholar] [CrossRef] [PubMed]
- Hu, M.; Lin, W. Effects of Exercise Training on Red Blood Cell Production: Implications for Anemia. Acta Haematol. 2012, 127, 156–164. [Google Scholar] [CrossRef] [PubMed]
- Seibaek, M.; Vestergaard, H.; Burchardt, H.; Sloth, C.; Torp-Pedersen, C.; Nielsen, S.L.; Hildebrandt, P.; Pedersen, O. Insulin resistance and maximal oxygen uptake. Clin. Cardiol. 2003, 26, 515–520. [Google Scholar] [CrossRef]
- Covington, J.D.; Tam, C.S.; Pasarica, M.; Redman, L.M. Higher circulating leukocytes in women with PCOS is reversed by aerobic exercise. Biochimie 2016, 124, 27–33. [Google Scholar] [CrossRef] [PubMed] [Green Version]
- Pundir, C.; Kumar, P.; Jaiwal, R. Biosensing methods for determination of creatinine: A review. Biosens. Bioelectron. 2019, 126, 707–724. [Google Scholar] [CrossRef] [PubMed]
- Hammouda, O.; Chtourou, H.; Chaouachi, A.; Chahed, H.; Ferchichi, S.; Kallel, C.; Chamari, K.; Souissi, N. Effect of Short-Term Maximal Exercise on Biochemical Markers of Muscle Damage, Total Antioxidant Status, and Homocysteine Levels in Football Players. Asian J. Sports Med. 2012, 3, 239–246. [Google Scholar] [CrossRef]
- Janssen, G.M.E.; Degenaar, C.P.; Menheere, P.P.C.A.; Habets, H.M.L.; Geurten, P. Plasma Urea, Creatinine, Uric Acid, Albumin, and Total Protein Concentrations Before and After 15-, 25-, and 42-km Contests. Endoscopy 1989, 10 (Suppl. 3), S132–S138. [Google Scholar] [CrossRef]
- Kim, E.S.; Im, J.-A.; Kim, K.C.; Park, J.H.; Suh, S.-H.; Kang, E.S.; Kim, S.H.; Jekal, Y.; Lee, C.W.; Yoon, Y.-J.; et al. Improved Insulin Sensitivity and Adiponectin Level after Exercise Training in Obese Korean Youth. Obesity 2007, 15, 3023–3030. [Google Scholar] [CrossRef]
- Marinho, S.M.S.D.A.; Mafra, D.; Pelletier, S.; Hage, V.; Teuma, C.; Laville, M.; Eduardo, J.C.C.; Fouque, D. In Hemodialysis Patients, Intradialytic Resistance Exercise Improves Osteoblast Function: A Pilot Study. J. Ren. Nutr. 2016, 26, 341–345. [Google Scholar] [CrossRef]
- Wilson-Barnes, S.L.; Hunt, J.E.A.; Mendis, J.; Williams, E.L.; King, D.; Roberts, H.; Lanham-New, S.A.; Manders, R.J.F. The relationship between vitamin D status, intake and exercise performance in UK University-level athletes and healthy inactive controls. PLoS ONE 2021, 16, e0249671. [Google Scholar] [CrossRef]
- Enhörning, S.; Struck, J.; Wirfält, E.; Hedblad, B.; Morgenthaler, N.G.; Melander, O. Plasma Copeptin, A Unifying Factor behind the Metabolic Syndrome. J. Clin. Endocrinol. Metab. 2011, 96, E1065–E1072. [Google Scholar] [CrossRef] [PubMed]
- Stella, A.B.; Yardley, J.; Francescato, M.P.; Morrison, S. Fluid Intake Habits in Type 1 Diabetes Individuals during Typical Training Bouts. Ann. Nutr. Metab. 2018, 73, 10–18. [Google Scholar] [CrossRef]
- Brunkwall, L.; Ericson, U.; Nilsson, P.M.; Enhörning, S. High water intake and low urine osmolality are associated with favorable metabolic profile at a population level: Low vasopressin secretion as a possible explanation. Eur. J. Nutr. 2020, 59, 3715–3722. [Google Scholar] [CrossRef] [PubMed] [Green Version]


| Insulin Sensitive | Insulin Resistant | p Value | |||||||||
|---|---|---|---|---|---|---|---|---|---|---|---|
| All (1153) | Sedentary (474) | Active (679) | All (957) | Sedentary (515) | Active (442) | ISS vs. ISA | IRS vs. IRA | IS vs. IR | ANOVA | ||
| Vital signs | Age | 25.9 (2.9) | 25.8 (3.0) | 26.0 (2.8) | 25.7 (3.1) | 25.8 (3.1) | 25.6 (3.1) | 0.327 | 0.349 | 0.186 | 0.194 |
| BMI (continuous) | 24.5 (2.6) | 24.3 (2.6) | 24.7 (2.6) | 25.6 (2.7) | 25.6 (2.7) | 25.7 (2.6) | 0.024 | 0.302 | ≤0.001 | ≤0.001 | |
| Average systolic BP | 105.2 (9.4) | 103.7 (9.5) | 106.2 (9.3) | 108.4 (9.9) | 107.8 (9.6) | 109.0 (10.3) | ≤0.001 | 0.065 | ≤0.001 | ≤0.001 | |
| Average diastolic BP | 62.3 (8.1) | 62.6 (8.3) | 62.1 (7.9) | 64.6 (8.4) | 65.0 (8.3) | 64.0 (8.4) | 0.387 | 0.062 | ≤0.001 | ≤0.001 | |
| Average pulse rate | 69.2 (10.4) | 70.4 (9.8) | 68.3 (10.7) | 72.7 (10.4) | 73.3 (10.2) | 72.0 (10.7) | ≤0.001 | 0.035 | ≤0.001 | ≤0.001 | |
| Blood sugar marker | Fasting Time (min) | 539.3 (289.9) | 530.1 (303.9) | 545.8 (279.6) | 458.7 (304.2) | 439.3 (309.3) | 481.1 (296.9) | 0.165 | 0.019 | ≤0.001 | ≤0.001 |
| HOMA-IR | 1.2 (0.4) | 1.3 (0.3) | 1.2 (0.4) | 3.6 (3) | 3.7 (3.0) | 3.6 (3.0) | 0.126 | 0.964 | ≤0.001 | ≤0.001 | |
| C-Peptide (ng/mL) | 4.7 (0.4) | 1.5 (0.5) | 1.4 (0.4) | 4.9 (1.3) | 2.8 (1.4) | 2.7 (1.1) | 0.020 | 0.969 | 0.524 | ≤0.001 | |
| Insulin (uU/mL) | 6.1 (1.7) | 6.2 (1.7) | 6.0 (1.7) | 16.4 (11.3) | 16.7 (11.8) | 16.1 (10.7) | 0.106 | 0.827 | ≤0.001 | ≤0.001 | |
| HBA1C | 5.1 (0.3) | 5.1 (0.3) | 5.1 (0.3) | 5.2 (0.4) | 5.2 (0.4) | 5.2 (0.4) | 0.535 | 0.884 | ≤0.001 | ≤0.001 | |
| Glucose (mmol/L) | 4.6 (0.4) | 4.6 (0.4) | 4.6 (0.4) | 4.9 (0.8) | 5.0 (0.9) | 4.9 (0.6) | 0.770 | 0.016 | ≤0.001 | ≤0.001 | |
| Physical tests | Sitting height | 90.6 (13.7) | 90.8 (15.1) | 90.4 (12.7) | 90.3 (12.7) | 90.3 (13.2) | 90.3 (12.0) | 0.001 | 0.096 | 0.176 | 0.983 |
| Weight | 68.1 (11.1) | 66.2 (10.9) | 69.5 (11.1) | 71.7 (11.3) | 70.6 (11.2) | 73.0 (11.4) | ≤0.001 | 0.002 | ≤0.001 | ≤0.001 | |
| Waist size (cm) | 77.1 (8.4) | 76.1 (8.6) | 77.8 (8.2) | 80.7 (9.1) | 80.2 (9.0) | 81.2 (9.2) | ≤0.001 | 0.084 | ≤0.001 | ≤0.001 | |
| Hips size (cm) | 99.6 (6.7) | 99.6 (6.7) | 99.6 (6.7) | 101.7 (6.3) | 101.5 (6.5) | 101.9 (6.2) | 0.954 | 0.395 | ≤0.001 | ≤0.001 | |
| Waist-to-hip ratio | 0.8 (0.1) | 0.8 (0.1) | 0.8 (0.1) | 0.8 (0.1) | 0.8 (0.1) | 0.8 (0.1) | ≤0.001 | 0.251 | ≤0.001 | ≤0.001 | |
| Hand grip (left) | 33.3 (13) | 30.2 (12.1) | 35.4 (13.2) | 33.4 (12.9) | 31.7 (12.6) | 35.3 (13.1) | ≤0.001 | ≤0.001 | 0.76 | ≤0.001 | |
| Hand grip (right) | 34.5 (13.1) | 31.5 (12.5) | 36.5 (13.1) | 34.3 (12.8) | 32.9 (12.7) | 35.9 (12.8) | ≤0.001 | ≤0.001 | 0.902 | ≤0.001 | |
| Planned run time (s) | 592.1 (160.5) | 575.4 (174.0) | 603.8 (149.3) | 602.2 (155.7) | 590.5 (167.8) | 615.8 (139.4) | 0.242 | 0.334 | 0.129 | ≤0.001 | |
| Blood inflammatory markers | Hemoglobin (g/dL) | 13.9 (1.7) | 13.5 (1.7) | 14.1 (1.6) | 13.9 (1.8) | 13.8 (1.8) | 14.0 (1.8) | ≤0.001 | 0.076 | 0.383 | ≤0.001 |
| Hematocrit | 41.2 (4.5) | 40.2 (4.5) | 41.9 (4.3) | 41.4 (4.8) | 41.2 (4.7) | 41.7 (4.9) | ≤0.001 | 0.070 | 0.272 | ≤0.001 | |
| Red Blood Cell (×106 μL) | 5 (0.6) | 4.9 (0.6) | 5.0 (0.5) | 5.1 (0.6) | 5.1 (0.6) | 5.1 (0.6) | ≤0.001 | 0.013 | ≤0.001 | ≤0.001 | |
| White Blood Cell (×103 μL) | 6.3 (1.8) | 6.4 (1.9) | 6.1 (1.7) | 6.7 (1.8) | 6.9 (1.9) | 6.5 (1.7) | 0.009 | 0.001 | ≤0.001 | ≤0.001 | |
| Monocyte% | 7.7 (2) | 7.5 (1.9) | 7.8 (2.0) | 7.7 (2.1) | 7.7 (2.0) | 7.8 (2.2) | 0.020 | 0.540 | 0.546 | 0.166 | |
| Neutrophil (×103 μL) | 3.4 (1.4) | 3.5 (1.4) | 3.3 (1.4) | 3.7 (1.4) | 3.8 (1.5) | 3.5 (1.3) | 0.011 | 0.003 | ≤ 0.001 | ≤0.001 | |
| Neutrophil% | 52.1 (10.4) | 52.3 (10.8) | 51.9 (10.0) | 53.9 (9.9) | 54.2 (10.1) | 53.5 (9.7) | 0.166 | 0.228 | ≤0.001 | ≤0.001 | |
| Lymphocyte (×103 μL) | 2.2 (0.6) | 2.3 (0.7) | 2.2 (0.6) | 2.3 (0.7) | 2.3 (0.8) | 2.2 (0.6) | 0.010 | 0.008 | 0.054 | 0.002 | |
| Lymphocyte% | 36.9 (9.1) | 36.7 (9.4) | 36.9 (9.0) | 35 (8.9) | 34.9 (9.1) | 35.2 (8.7) | 0.398 | 0.395 | ≤0.001 | ≤0.001 | |
| Eosinophil% | 2.7 (2.1) | 2.7 (2.0) | 2.8 (2.1) | 2.8 (2) | 2.7 (1.7) | 2.9 (2.3) | 0.208 | 0.557 | 0.215 | 0.319 | |
| Basophil% | 0.6 (0.3) | 0.6 (0.4) | 0.6 (0.3) | 0.6 (0.3) | 0.6 (0.4) | 0.6 (0.3) | 0.647 | 0.435 | 0.891 | 0.844 | |
| C-Reactive Protein (mg/L) | 4.7 (6.6) | 4.9 (6.5) | 4.5 (6.7) | 4.9 (5.9) | 5.1 (5.5) | 4.6 (6.3) | 0.105 | 0.014 | 0.524 | 0.019 | |
| Kidney profile | Sodium (mmol/L) | 140 (2.3) | 139.9 (2.3) | 140.1 (2.2) | 140.1 (2.2) | 140.1 (2.2) | 140.1 (2.1) | 0.199 | 0.649 | 0.462 | 0.451 |
| Potassium (mmol/L) | 4.3 (0.3) | 4.3 (0.3) | 4.3 (0.3) | 4.3 (0.3) | 4.3 (0.3) | 4.3 (0.3) | 0.010 | 0.437 | 0.657 | 0.107 | |
| Chloride (mmol/L) | 101.5 (2.3) | 101.6 (2.2) | 101.4 (2.3) | 101.4 (2.3) | 101.4 (2.2) | 101.6 (2.4) | 0.096 | 0.179 | 0.428 | 0.263 | |
| Bicarbonate (mmol/L) | 25.9 (2.4) | 25.8 (2.3) | 25.9 (2.4) | 25.6 (2.4) | 25.7 (2.4) | 25.6 (2.5) | 0.140 | 0.952 | 0.011 | 0.064 | |
| Urea (mmol/L) | 4.3 (1.4) | 4.1 (1.3) | 4.5 (1.4) | 4.2 (1.2) | 4.1 (1.1) | 4.3 (1.2) | 0.000 | 0.004 | 0.061 | ≤0.001 | |
| Creatinine (mmol/L) | 66.9 (15.4) | 64.1 (16.1) | 68.9 (14.6) | 66.8 (14.8) | 65.0 (14.3) | 68.9 (15.1) | 0.000 | ≤0.001 | 0.896 | ≤0.001 | |
| Calcium (mmol/L) | 2.4 (0.1) | 2.4 (0.1) | 2.4 (0.1) | 2.4 (0.1) | 2.4 (0.1) | 2.4 (0.1) | 0.051 | 0.491 | 0.507 | 0.202 | |
| Calcium Corrected (mmol/L) | 2.3 (0.1) | 2.3 (0.1) | 2.3 (0.1) | 2.3 (0.1) | 2.3 (0.1) | 2.3 (0.1) | 0.351 | 0.213 | ≤0.001 | 0.002 | |
| Phosphorus (mmol/L) | 1.2 (0.1) | 1.2 (0.1) | 1.2 (0.1) | 1.2 (0.2) | 1.2 (0.2) | 1.2 (0.2) | 0.113 | 0.862 | ≤0.001 | ≤0.001 | |
| Uric Acid (umol/L) | 282 (76.6) | 268.0 (77.9) | 291.8 (74.2) | 289.6 (76.4) | 283.4 (74.7) | 296.8 (77.8) | ≤0.001 | 0.009 | 0.016 | ≤0.001 | |
| Creatine Kinase | 206.8 (602.2) | 157.2 (595.6) | 244.3 (605.6) | 168.5 (639.8) | 103.2 (116.3) | 257.2 (968.0) | ≤0.001 | 0.007 | 0.204 | ≤0.001 | |
| Creatine Kinase-1 (ng/mL) | 47.3 (107.3) | 46.1 (103.0) | 48.1 (111.5) | 73.5 (289.1) | 113.7 (399.8) | 30.9 (63.3) | 0.864 | 0.808 | 0.459 | 0.914 | |
| Creatine Kinase-2 (U/L) | 208.7 (1216.2) | 124.1 (280.4) | 263.4 (1542.5) | 133.3 (275.2) | 119.2 (257.1) | 147.9 (292.6) | ≤0.001 | 0.002 | 0.063 | ≤0.001 | |
| Magnesium (umol/L) | 0.8 (0.1) | 0.8 (0.1) | 0.8 (0.1) | 0.8 (0.1) | 0.8 (0.1) | 0.8 (0.1) | 0.712 | 0.323 | 0.111 | 0.203 | |
| Total Protein (g/L) | 74.4 (4) | 74.2 (4.0) | 74.5 (4.0) | 74.8 (3.9) | 74.9 (3.9) | 74.8 (3.8) | 0.313 | 0.771 | 0.01 | 0.038 | |
| Homocysteine (umol/L) | 9.6 (3.2) | 9.4 (3.2) | 9.7 (3.1) | 9.5 (3.2) | 9.4 (3.2) | 9.6 (3.2) | 0.027 | 0.371 | 0.298 | 0.152 | |
| Liver function | Bilirubin Total (umol/L) | 9.7 (5.6) | 9.0 (5.0) | 10.3 (5.8) | 8.2 (4.7) | 8.0 (4.5) | 8.4 (4.9) | ≤0.001 | 0.206 | ≤0.001 | ≤0.001 |
| Albumin (g/L) | 44.6 (3.4) | 44.4 (3.5) | 44.8 (3.4) | 44.1 (3.6) | 44.2 (3.6) | 44.1 (3.6) | 0.052 | 0.621 | ≤0.001 | 0.001 | |
| Alkaline Phosphatase (U/L) | 65 (18.4) | 65.8 (19.3) | 64.5 (17.7) | 69.9 (21.5) | 70.9 (23.0) | 68.8 (19.6) | 0.538 | 0.080 | ≤0.001 | ≤0.001 | |
| ALT (GPT) (U/L) | 20.3 (18.1) | 19.1 (18.7) | 21.1 (17.6) | 23.6 (19.2) | 23.5 (20.8) | 23.7 (17.1) | ≤0.001 | 0.198 | ≤0.001 | ≤0.001 | |
| AST (GOT) (U/L) | 20.6 (20.1) | 18.5 (9.6) | 22.1 (24.8) | 19.6 (10.7) | 19.2 (10.5) | 20.1 (10.9) | ≤0.001 | 0.047 | 0.922 | ≤0.001 | |
| GGT (U/L) | 16.8 (12) | 16.6 (12.3) | 17.1 (11.9) | 22.8 (25.8) | 23.8 (28.3) | 21.2 (21.5) | 0.459 | 0.312 | 0.033 | 0.118 | |
| GGT-2 (U/L) | 20.4 (26.9) | 22.2 (39.2) | 19.1 (13.5) | 25 (24.3) | 25.1 (24.0) | 25.0 (24.6) | 0.230 | 0.690 | ≤0.001 | ≤0.001 | |
| Lipid profile | HDL Cholesterol (mmol/L) | 1.5 (0.4) | 1.5 (0.4) | 1.5 (0.4) | 1.4 (0.4) | 1.4 (0.4) | 1.4 (0.4) | 0.063 | 0.708 | ≤0.001 | ≤0.001 |
| LDL Cholesterol (mmol/L) | 2.7 (0.8) | 2.7 (0.8) | 2.7 (0.8) | 2.7 (0.8) | 2.7 (0.8) | 2.7 (0.8) | 0.372 | 0.290 | 0.47 | 0.493 | |
| Triglyceride (mmol/L) | 0.9 (0.4) | 0.9 (0.5) | 0.9 (0.4) | 1.2 (0.7) | 1.2 (0.7) | 1.1 (0.6) | 0.283 | 0.307 | ≤0.001 | ≤0.001 | |
| Hormones | Testosterone Total (nmol/L) | 12.1 (12.1) | 9.7 (11.3) | 13.7 (12.4) | 10 (9.5) | 9.4 (9.3) | 10.7 (9.7) | 0.000 | 0.103 | ≤0.001 | ≤0.001 |
| Estradiol (pmol/L) | 292.8 (638.1) | 332.8 (895.3) | 264.7 (359.2) | 262.5 (314.9) | 271.5 (332.6) | 252.1 (292.9) | 0.002 | 0.780 | 0.155 | 0.015 | |
| SHBG (nmol/L) | 57.4 (48.1) | 60.7 (53.6) | 54.9 (43.4) | 47.8 (46.9) | 49.0 (46.5) | 46.1 (47.5) | 0.086 | 0.163 | ≤0.001 | ≤0.001 | |
| Free Thyroxine (pmol/L) | 14.4 (2.5) | 14.3 (2.4) | 14.5 (2.6) | 14.6 (2.8) | 14.5 (2.9) | 14.7 (2.6) | 0.216 | 0.251 | 0.525 | 0.2 | |
| Free Triiodothyronine | 4.4 (0.8) | 4.3 (0.8) | 4.4 (0.8) | 4.7 (0.9) | 4.6 (1.0) | 4.7 (0.9) | 0.294 | 0.189 | ≤0.001 | ≤0.001 | |
| TSH mI (U/L) | 2.3 (5.3) | 2.2 (4.8) | 2.3 (5.7) | 2.1 (3.3) | 2.2 (4.2) | 2.0 (1.8) | 0.968 | 0.906 | 0.696 | 0.871 | |
| Iron profile | Iron (umol/L) | 16.4 (7.2) | 15.8 (7.8) | 16.9 (6.8) | 14.7 (6.5) | 14.5 (6.5) | 14.9 (6.5) | 0.002 | 0.428 | ≤0.001 | ≤0.001 |
| TIBC (umol/L) | 63.5 (11.7) | 64.4 (12.3) | 62.9 (11.2) | 66 (11.2) | 65.7 (11.4) | 66.3 (10.9) | 0.089 | 0.259 | ≤0.001 | ≤0.001 | |
| UIBC (umol/L) | 42.8 (13) | 44.2 (13.8) | 41.7 (12.2) | 47.2 (13.5) | 47.9 (14.0) | 46.4 (12.7) | 0.024 | 0.268 | ≤0.001 | ≤0.001 | |
| Ferritin (μg/L) | 68.8 (70) | 59.5 (64.8) | 75.3 (72.7) | 73.6 (86.5) | 71.8 (93.2) | 75.7 (78.1) | ≤ 0.001 | 0.107 | 0.83 | ≤0.001 | |
| Vitamins | Folate (nmol/L) | 20.3 (8.7) | 19.8 (8.9) | 20.6 (8.6) | 19.1 (7.6) | 18.9 (8.0) | 19.2 (7.2) | 0.051 | 0.270 | 0.002 | 0.003 |
| Dihydroxyvitamin D (ng/mL) | 17.2 (10.9) | 16.8 (11.5) | 17.4 (10.4) | 15.4 (8.6) | 14.7 (8.1) | 16.1 (9.2) | 0.052 | 0.025 | ≤0.001 | ≤0.001 | |
| Vitamin B12 (pmol/L) | 312.4 (146.6) | 309.3 (160.5) | 314.6 (136.1) | 290.4 (117.4) | 286.7 (117.2) | 294.7 (117.6) | 0.230 | 0.362 | 0.003 | 0.003 | |
| Insulin Sensitive (HOMA-IR < 1.85) | Insulin Resistant (HOMA-IR > 1.85) | |||||||
|---|---|---|---|---|---|---|---|---|
| Estimate # | SE | p-Value | FDR | Estimate # | SE | p-Value | FDR | |
| Handgrip out left | 0.044 | 0.015 | 0.003 | 0.027 | 0.073 | 0.016 | ≤0.001 | ≤0.001 |
| Weight | 0.004 | 0.003 | 0.329 | 0.540 | 0.015 | 0.005 | 0.001 | 0.023 |
| Creatine kinase | 0.273 | 0.071 | 0.000 | 0.005 | 0.207 | 0.075 | 0.006 | 0.052 |
| Creatine kinase-2 (μ/L) | 0.202 | 0.051 | 0.000 | 0.005 | 0.153 | 0.055 | 0.005 | 0.052 |
| AST (GOT) (μ/L) | 0.069 | 0.020 | 0.001 | 0.012 | 0.027 | 0.022 | 0.208 | 0.552 |
| GGT-2 (μ/L) | −0.106 | 0.032 | 0.001 | 0.012 | −0.040 | 0.034 | 0.229 | 0.585 |
| Folate (nmol/L) | 0.086 | 0.025 | 0.001 | 0.012 | 0.048 | 0.027 | 0.080 | 0.276 |
| Dihydroxyvitamin D (ng/mL) | 0.069 | 0.031 | 0.028 | 0.108 | 0.093 | 0.034 | 0.006 | 0.052 |
| Creatinine (mmol/L) | 0.018 | 0.009 | 0.039 | 0.142 | 0.040 | 0.009 | 0.000 | 0.001 |
| Triglyceride (mmol/L) | −0.074 | 0.026 | 0.005 | 0.041 | −0.036 | 0.028 | 0.204 | 0.552 |
| Hematocrit | 0.012 | 0.005 | 0.007 | 0.055 | −0.001 | 0.005 | 0.997 | 0.997 |
| White Blood Cell (×103 μL) | −0.041 | 0.017 | 0.014 | 0.100 | −0.059 | 0.018 | 0.001 | 0.023 |
| Lymphocyte Auto (×103 μL) | −0.040 | 0.017 | 0.023 | 0.100 | −0.055 | 0.019 | 0.003 | 0.042 |
Publisher’s Note: MDPI stays neutral with regard to jurisdictional claims in published maps and institutional affiliations. |
© 2022 by the authors. Licensee MDPI, Basel, Switzerland. This article is an open access article distributed under the terms and conditions of the Creative Commons Attribution (CC BY) license (https://creativecommons.org/licenses/by/4.0/).
Share and Cite
AlMuraikhy, S.; Anwardeen, N.; Naeem, A.; Sellami, M.; Domling, A.; Agouni, A.; Elrayess, M.A. Comparing the Metabolic Profiles Associated with Fitness Status between Insulin-Sensitive and Insulin-Resistant Non-Obese Individuals. Int. J. Environ. Res. Public Health 2022, 19, 12169. https://doi.org/10.3390/ijerph191912169
AlMuraikhy S, Anwardeen N, Naeem A, Sellami M, Domling A, Agouni A, Elrayess MA. Comparing the Metabolic Profiles Associated with Fitness Status between Insulin-Sensitive and Insulin-Resistant Non-Obese Individuals. International Journal of Environmental Research and Public Health. 2022; 19(19):12169. https://doi.org/10.3390/ijerph191912169
Chicago/Turabian StyleAlMuraikhy, Shamma, Najeha Anwardeen, Aisha Naeem, Maha Sellami, Alexander Domling, Abdelali Agouni, and Mohamed A. Elrayess. 2022. "Comparing the Metabolic Profiles Associated with Fitness Status between Insulin-Sensitive and Insulin-Resistant Non-Obese Individuals" International Journal of Environmental Research and Public Health 19, no. 19: 12169. https://doi.org/10.3390/ijerph191912169