Article

Study on Ecosystem Service Value (ESV) Spatial Transfer in the Central Plains Urban Agglomeration in the Yellow River Basin, China

1
College of Resource and Environment, Henan University of Economics and Law, Zhengzhou 450046, China
2
Academician Laboratory for Urban and Rural Spatial Data Mining of Henan Province, Henan University of Economics and Law, Zhengzhou 450046, China
3
Research Center for Coordinated Economic Development of the Yellow River Basin, Henan University of Economics and Law, Zhengzhou 450046, China
4
College of Business Administration, Henan University of Animal Husbandry and Economy, Zhengzhou 450046, China
5
Chengdu Academy of Environmental Sciences, Chengdu 610000, China
6
Institute of Geographical Sciences, Henan Academy of Sciences, Zhengzhou 450052, China
*
Author to whom correspondence should be addressed.
Int. J. Environ. Res. Public Health 2021, 18(18), 9751; https://doi.org/10.3390/ijerph18189751
Submission received: 15 July 2021 / Revised: 5 September 2021 / Accepted: 8 September 2021 / Published: 16 September 2021

Abstract

:
Urban agglomeration is the key area to realizing regional sustainable development. Timely and accurate assessment of its ESV spatial transfer can provide a scientific basis for intercity environmental cooperation to solve transboundary environmental problems. The ESV and its spatial transfer characteristics in the Central Plains Urban Agglomeration in 2000 and 2018 were quantified by introducing the breaking point model. The findings were as follows: Firstly, taking the central city of Zhengzhou as the transferred-in area, ESV spatial transfer distributions and changes presented a trend of hinterland > metropolitan area. Secondly, the ESV spatial transfer intensity from the metropolitan area to the central city presented an increase trend, with an increase of RMB 498,400–1,053,000/km2, and the ESV spatial transfer intensity from the hinterland to the central city presented a decrease trend, with a decrease of RMB 15,200–814,000/km2 in contrast. Thirdly, a total of RMB 294.763–331.471 billion worth of ESV has been transferred, and only that worth RMB 0.534–1.716 billion reached the central city, accounting for 0.181–0.518% of the total ESV transferred and 2.760–17.482% of the central city’s ESV. Fourthly, the ESV spatial transfer radius of each city was 25.47–214.17 km, but the ESV spatial transfer range of a few cities could reach the central city. Lastly, there was inefficiency in the ESV spatial transfer only in the natural driving spatial transfer pattern due to the spatial heterogeneity of ESV distribution, and there was potential for strengthening the ecological interactions based on space guidance provided by ESV spatial transfer.

1. Introduction

In the new era, central cities and urban agglomerations are becoming the main spatial forms that carry development elements in China, as well as important symbols of the level of regional economic development [1,2]. In addition, urban agglomeration has become the most prominent and concentrated area where ecological protection and high-quality development interact, and its ecological support is related to the overall situation of China’s sustainable development [3,4,5,6]. The Central Plains Urban Agglomeration is one of the three major urban agglomerations in the Yellow River Basin which plays a leading role in the coordinated development of the basin, and adequate ecological service support would provide the Central Plains Urban Agglomeration with a well-developed material and environmental basis for implementing the strategy of “ecological conservation and high-quality development of the Yellow River Basin (YRB)” [7,8,9].
As an important natural resource and a socioeconomic factor of production, ecosystem services (ES) have been considered the foundation of regional development and an important indicator to measure the coordinative development between the economy and the environment since the end of the last century, and the spatial mismatch between ES supply and demand is seen as the key factor restricting and affecting sustainable regional development [10,11,12,13,14]. Unfortunately, the supply and demand of ES in different regions are always spatially mismatched due to the significant spatial heterogeneity of natural resource endowment and socioeconomic development among regions in reality [15,16,17,18].
It was found that ecosystem products could naturally move across regions in the media of water, air, soil, etc., which entailed the consequent spatial transfer of ecological services between regions [19,20,21,22,23]. Through such spatial transfer, some service functions could be transferred to areas with appropriate external conditions outside the ecosystem habitat, thus generating benefits for a larger area than the ecosystem habitat area to support socioeconomic development [4,22,24,25]. This provides a path to adjust the ES gap between supply and demand in various regions and to maintain the balance of ecosystem-derived materials and energy inside and outside each region to realize regional sustainable development goals while avoiding the degradation of ecosystems caused by an output “overload” or ecosystem service shortages in society [10,15,20,21]. In this context, valuing the ES, scientificand accurate assessment of the ESV spatial transfer, understanding the ESV spatial transfer characteristics are the basis for optimizing ecosystem service management actions, adjusting regional ecological assets, and implementing cross-regional policies for both national economic development and ecological protection [15,26,27,28]. At present, scholars at home and abroad have carried out quantitative studies on ESV and its spatial transfer in basins and cities, showing good theoretical support and important practical application value in the establishment of basin ecological compensation policy decision support [15,20,21], selection of regional sustainable development strategies [13,23,29], and planning and management of urban ES [3,30]. However, previous studies concerning both the ESV and urban agglomerations area were still concentrated in the static evaluation, and studies focusing on ESV spatial transfer of urban agglomerations are still rare [31,32,33].
With the rapid population growth and fast urbanization of the Central Plains Urban Agglomeration, the spatial imbalance of ESV has broken through the administrative boundary of a single city, undermining sustainable development of urban agglomerations. The transboundary problem can not be solved by individual cities using management style of “each fights its own battle” within the Central Plains Urban Agglomeration [34,35]. With the development of social and economic integration, how to promote the flow of ESV among regions and give full play to the overall benefits of ES has become an important issue. However, previous studies were not enough to support the Central Plains Urban Agglomeration to make ES-related intercity cooperation policies, and help the region promoting all-round cooperation in ecological co-protection, co-management and co-construction among cities.
In this paper, the ES of the Central Plains Urban Agglomeration was valued as ESV according to the land use composition, the economic value of food production services per unit of farm area and the adjusted equivalent factor table. And ESV spatial transfer characteristics in a natural state were quantitatively refined by introducing the breaking point model on the ArcGIS platform. It aims to provide a scientific reference for promoting the flow and integration of ES in the Central Plains Urban Agglomeration; to form a complementary advantage pattern of ecological sharing, ecological co-construction, and co-management; and to realize sustainable development for the Central Plains Urban Agglomeration.

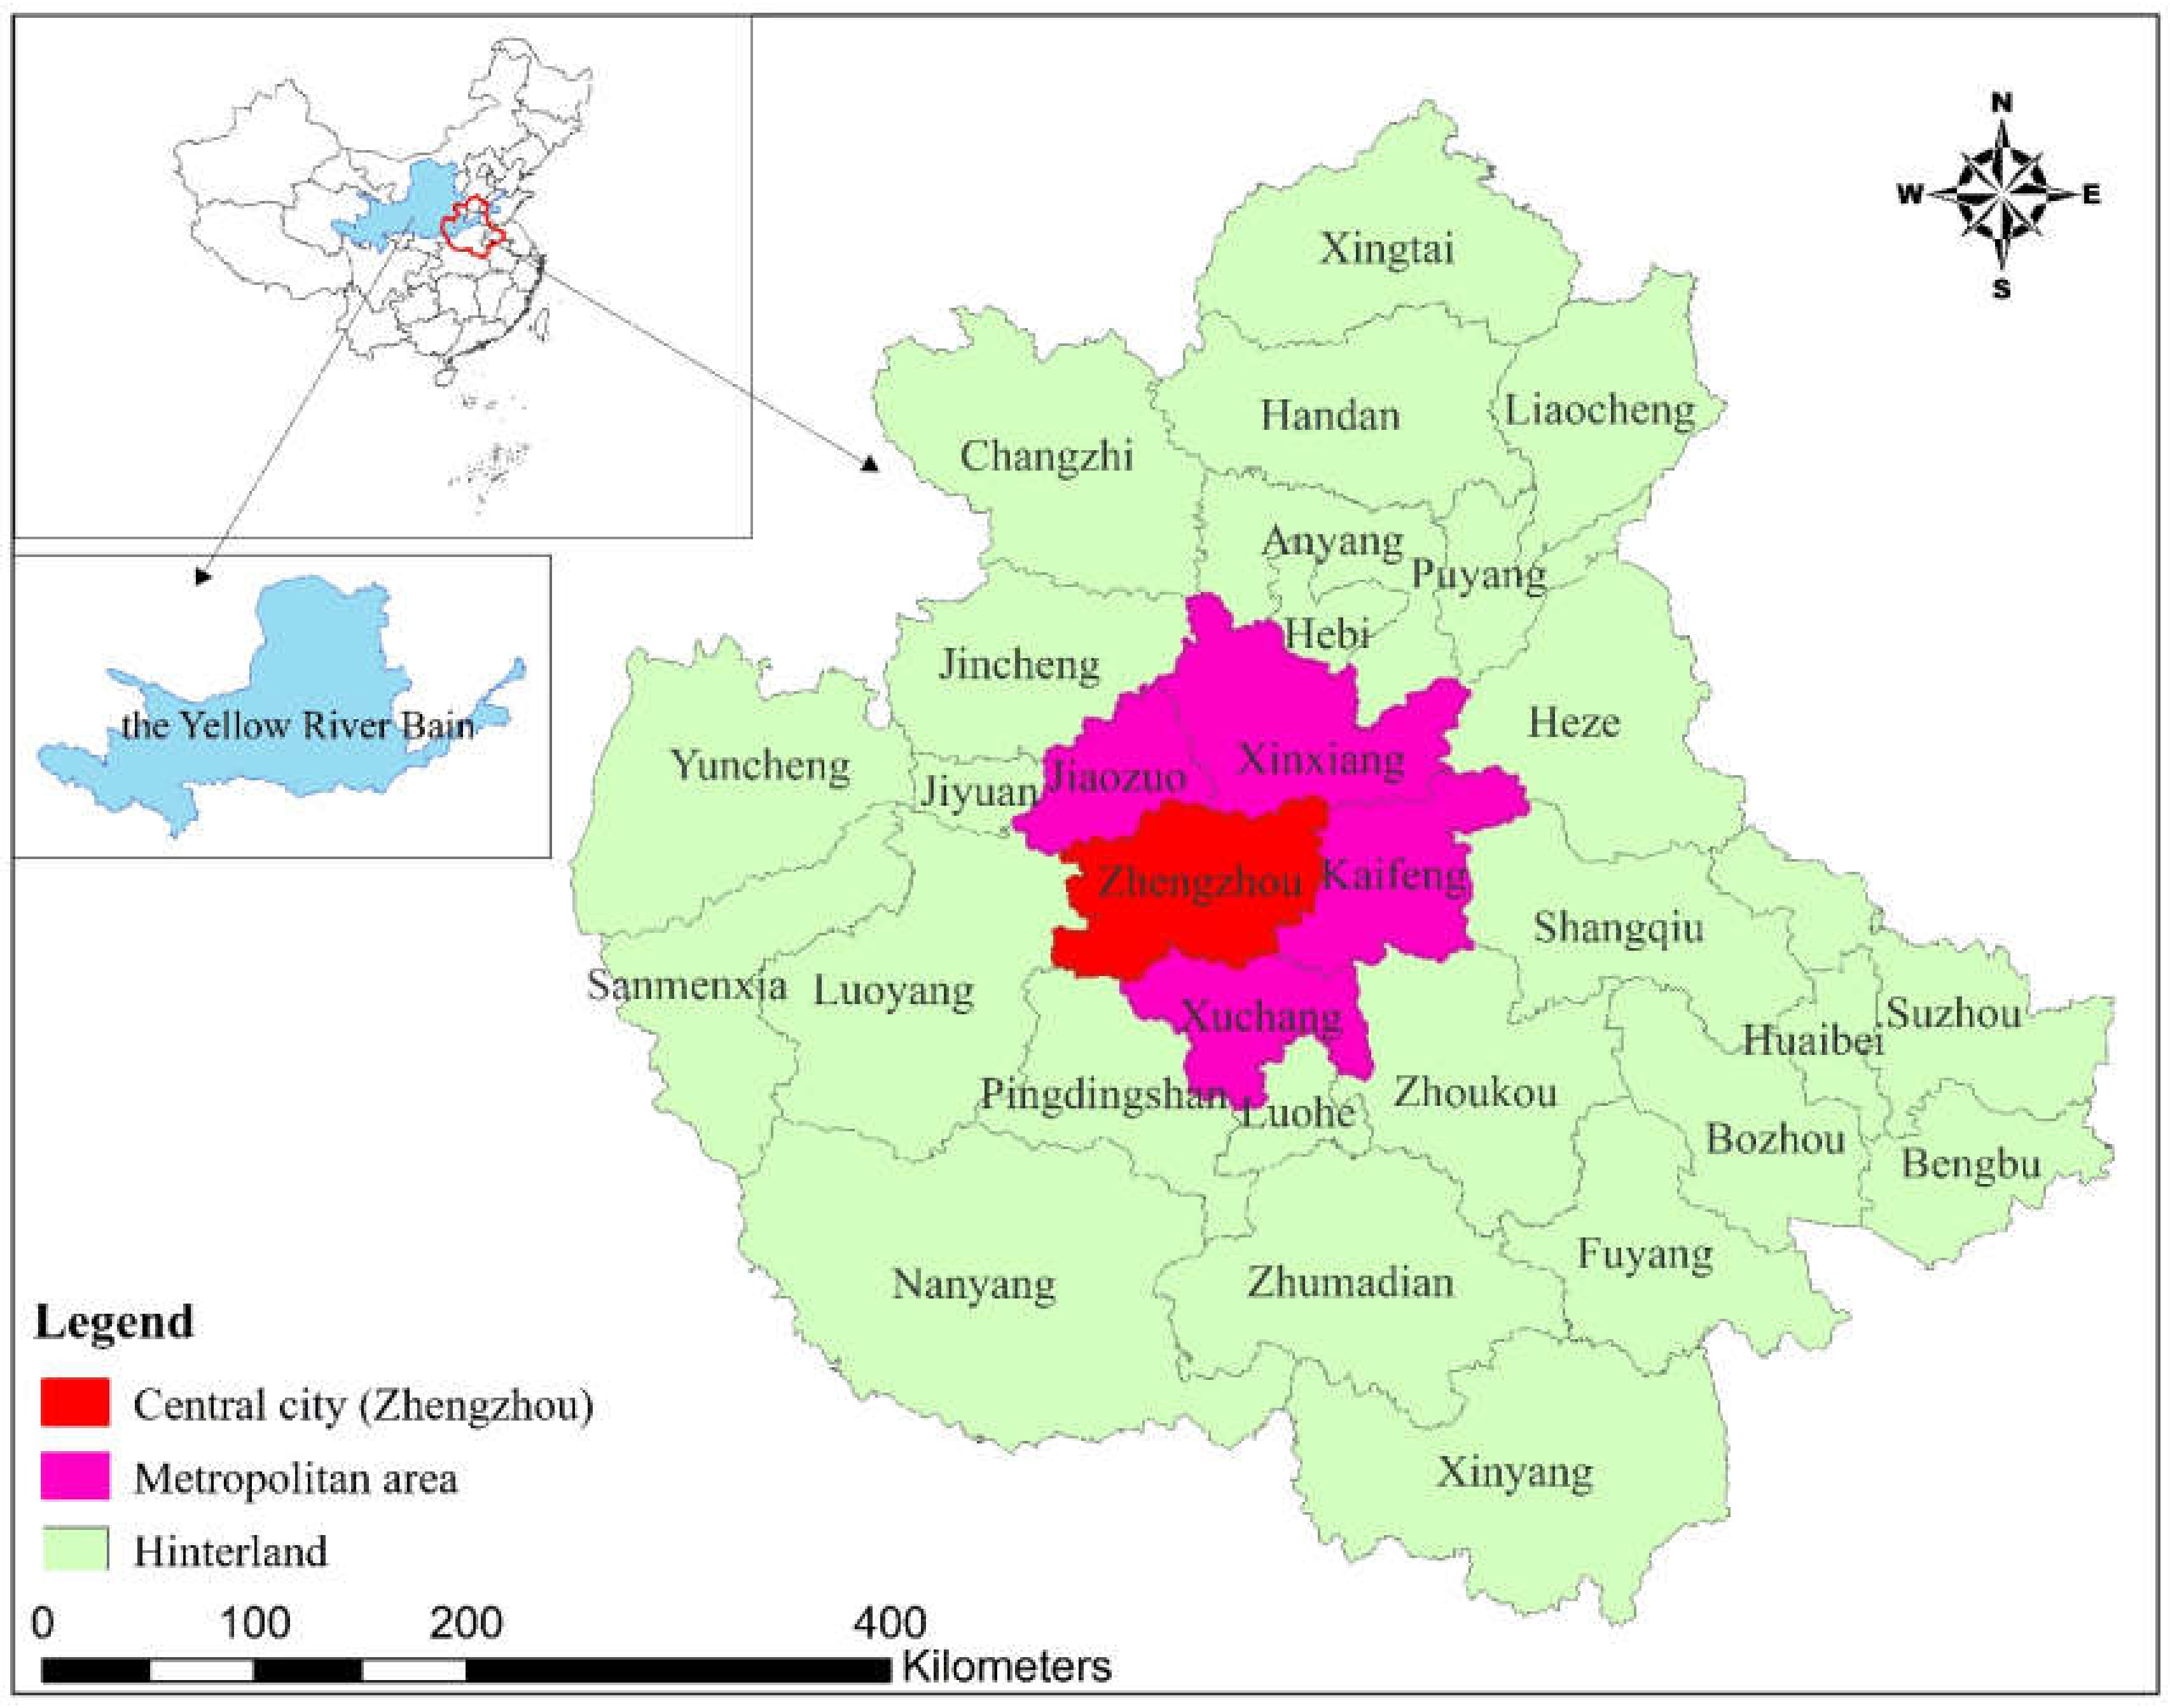
2. Overview of Study Area

With Zhengzhou as the central city; Kaifeng, Xuchang, Xinxiang, and Jiaozuo as the metropolitan area; and Xinyang, Nanyang, and 25 other cities as the hinterland (Figure 1), the Central Plains Urban Agglomeration is the largest urban group in YRB, China, with the densest population, great economic strength, rapid industrialization and urbanization, and a prominent traffic location advantage within a radius of 500 km. With a land area of 287,000 km2 and covering 30 prefecture-level cities in five provinces, it is an important hub “connecting the East and the West” and “connecting the North and the South” [9,35,36,37].
The Central Plains Urban Agglomeration is endowed with superior natural resources, covering three mountain ranges: the Dabie–Tongbai mountains, the Taihang Mountains, and the Funiu Mountains. It is the water source of the Middle Route Project of South-to-North Water Diversion Project and an important ecological environment protection area in China, with abundant ecosystem species. The population and economic activities are highly concentrated in cities with different scales and functions, forming the spatial structure (Figure 1) of central city–metropolitan area–hinterland [9].
At present, urban expansion and economic growth have caused transboundary environmental problems among cities in the Central Plains Urban Agglomeration, but there are no effective countermeasures or suggestions in place guiding intercity cooperation for ecological environment co-management; The Central Plains Urban Agglomeration has become one of the areas with the most prominent contradiction between humans and nature in the YRB [12,38]. Therefore, Assessing ESV spatial transfer and providing scientific basis to improve human well-beings from ecosystem-based management is of great significance to regional sustainable development [15,38,39].

3. Data and Methods

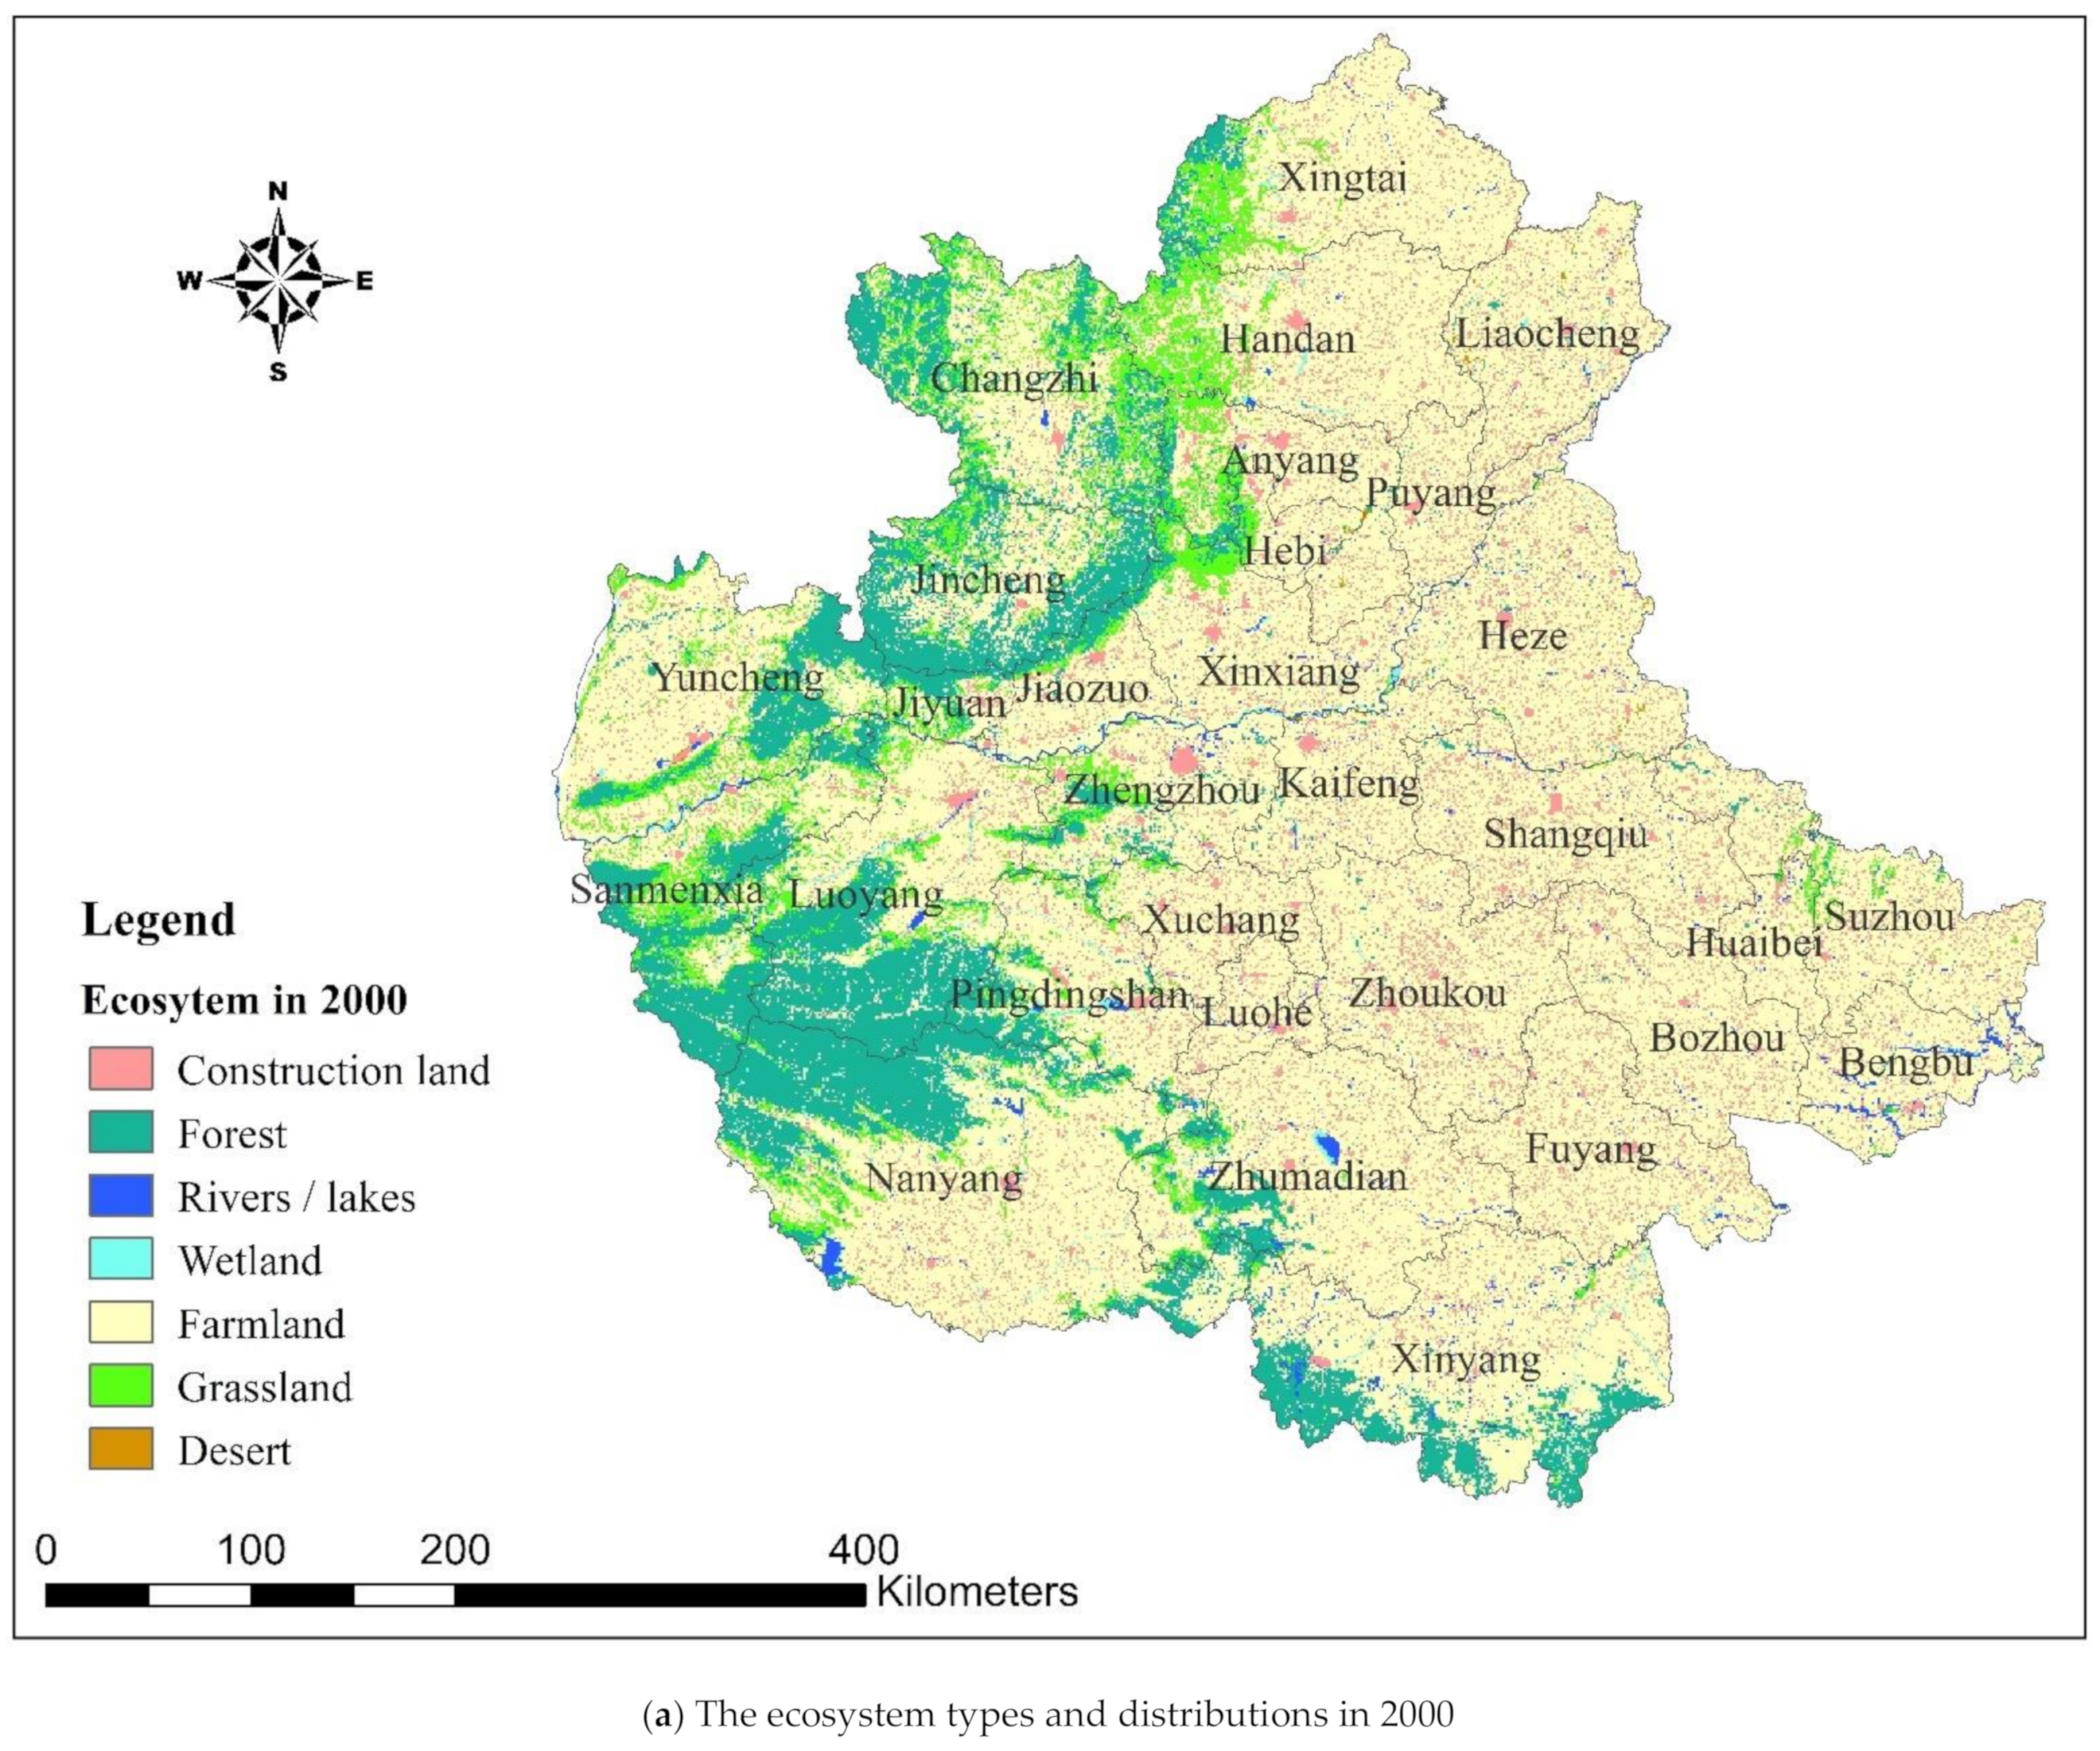
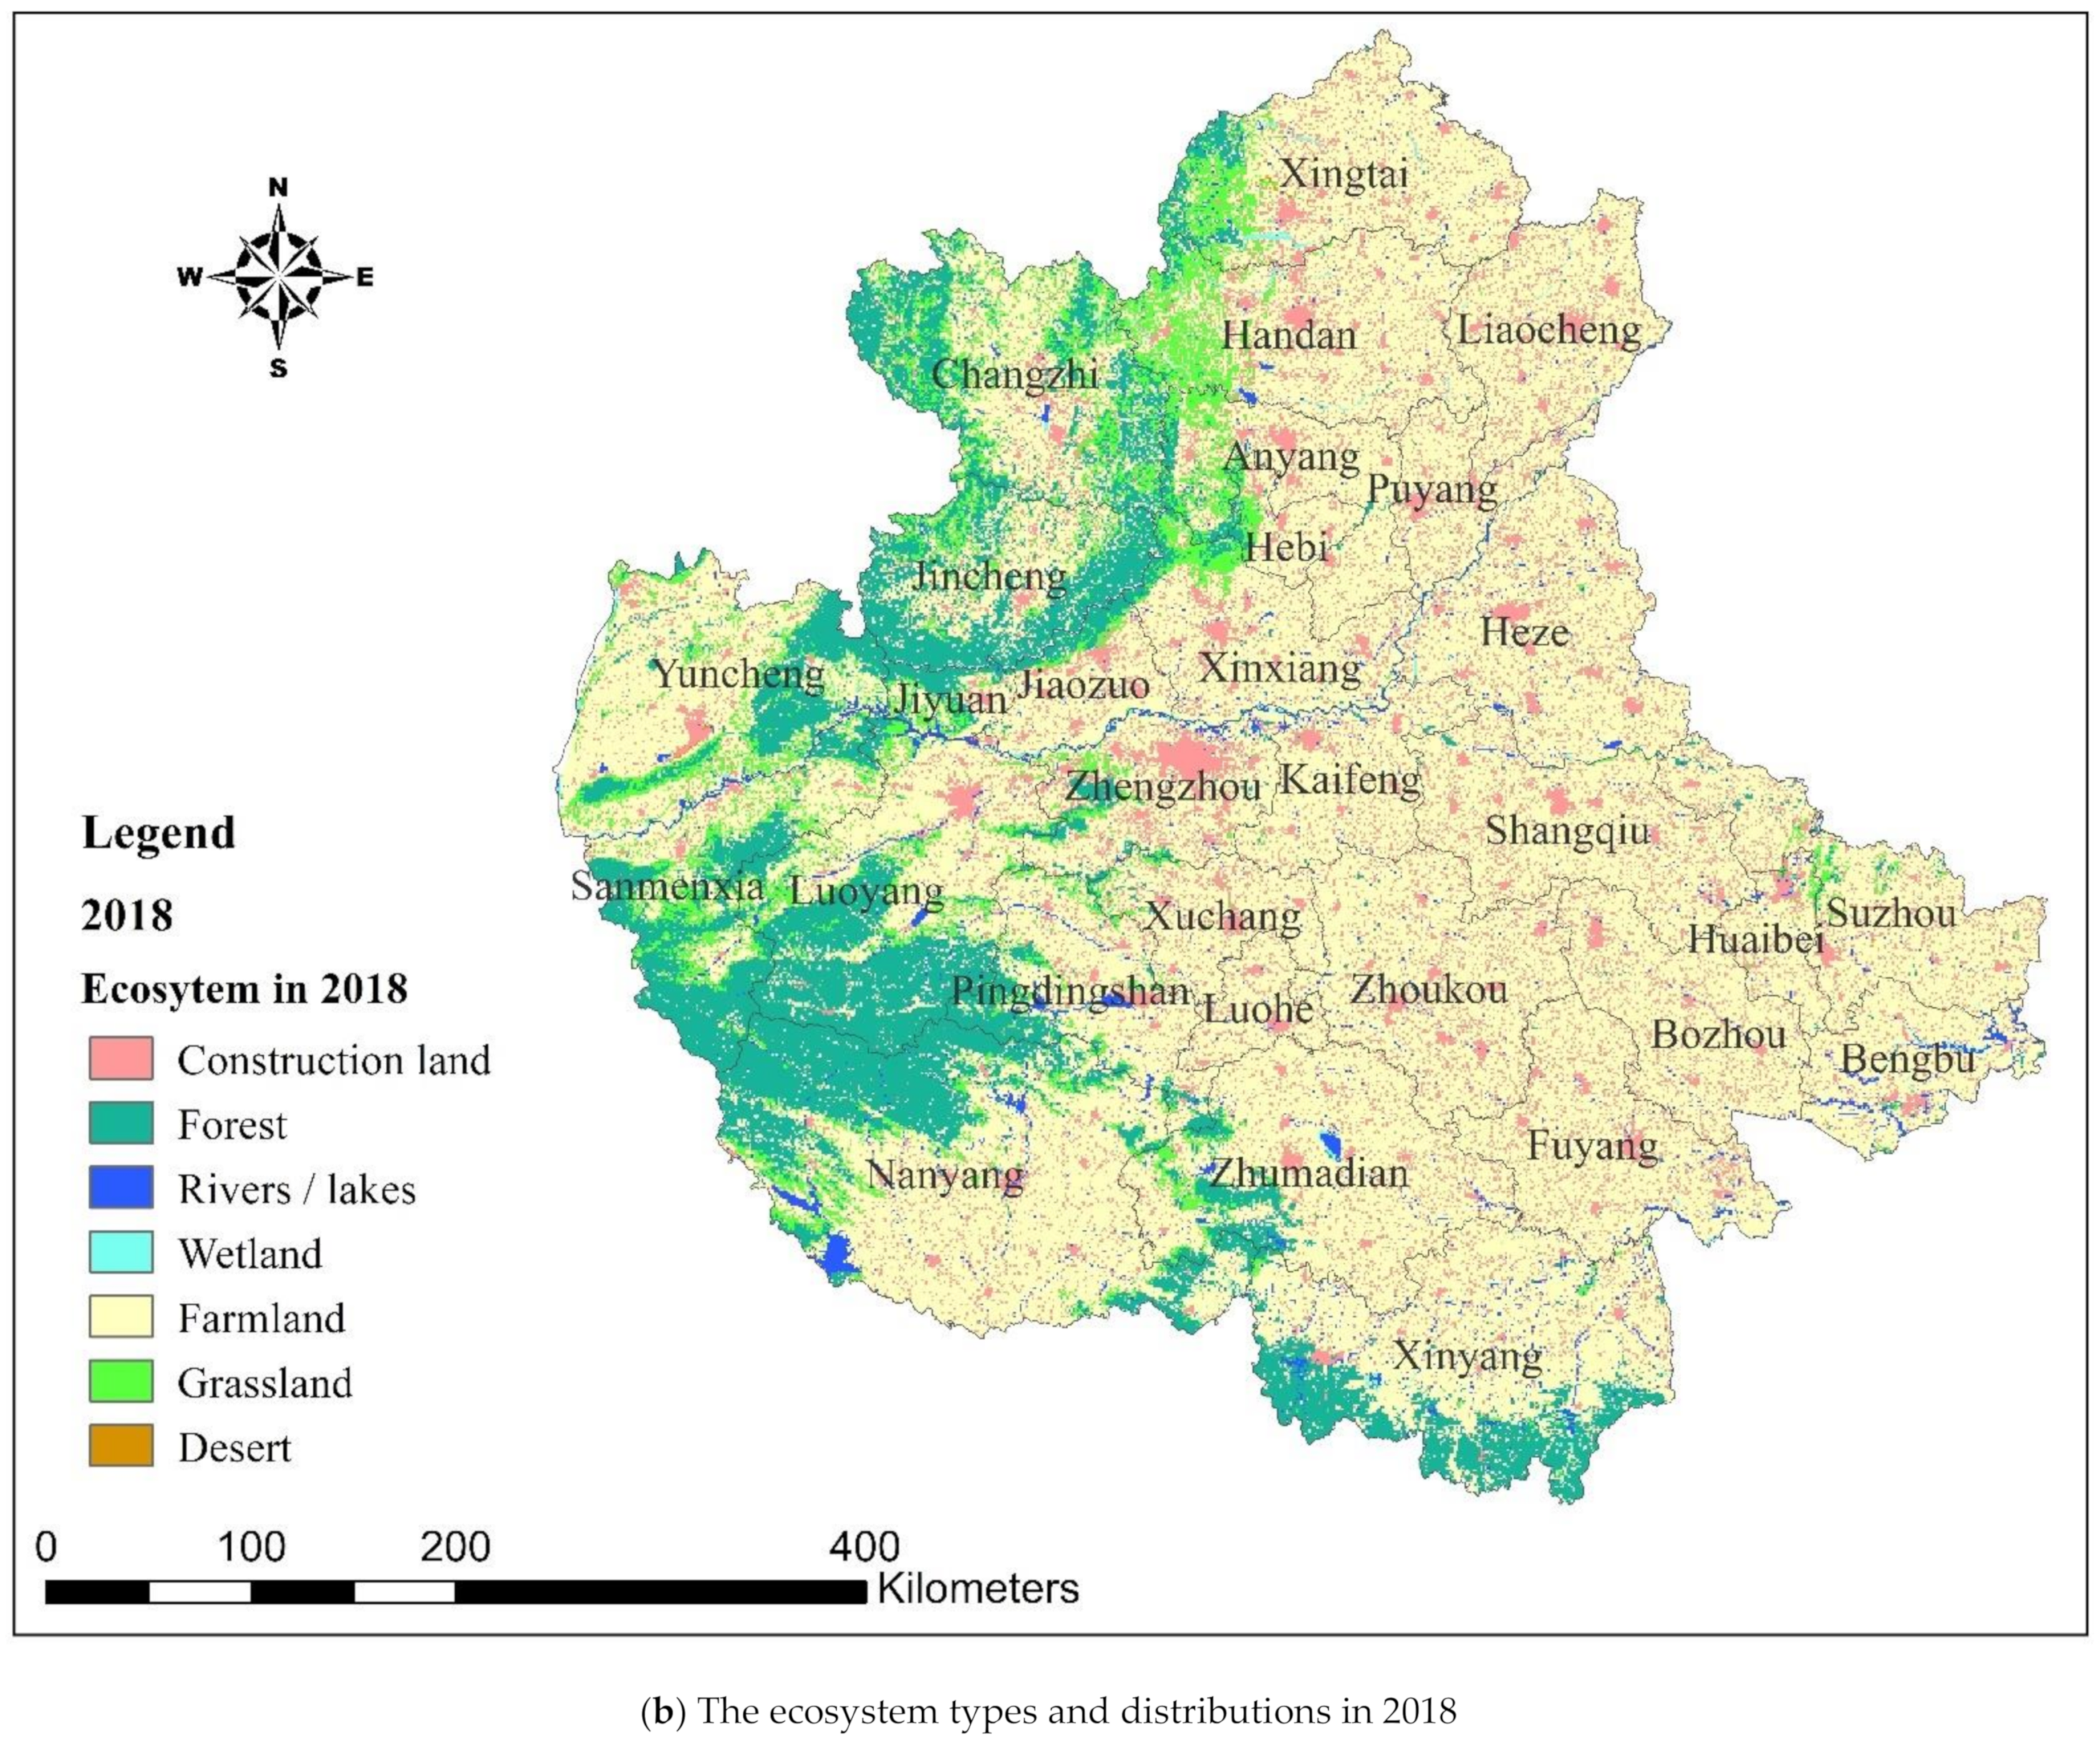
3.1. Data Sources and Processing

The spatial data selected for this study all came from the Resource and Environment Science and Data Center (https://www.resdc.cn/, accessed on 1 May 2020), including land use types, annual net primary production (NPP), and annual normalized difference vegetation index (NDVI) with a resolution of 1000 m; the data of main grain market price and grain yield per unit area are from the National Bureau of Statistics of China (http://www.stats.gov.cn/, accessed on 7 July 2020) and the National Food and Strategic Reserves Administration of China (http://www.lswz.gov.cn/html/zmhd/lysj/lsjg.shtml, accessed on 13 July 2020), respectively.
The ecosystem types were obtained from a reclassification of the original land use type data (Table 1), and the ecosystem distributions are demonstrated in Figure 2.

3.2. ESV Calculation Method

3.2.1. Unit Equivalent Value

The unit equivalent value (E) refers to the “ESV Equivalent Table Per Unit Area of Terrestrial Ecosystem in China” (Table 2) [40,41]. It determined that the economic value of an ESV equivalent factor was equal to 1/7 of the national average market value of grain yield per unit area of farmland in that year. The calculation formula is as follows:
E = QF/7
Vci = Eaci
where Q refers to the average yield per unit area of main grain in the Central Plains Urban Agglomeration from 2000 to 2018, to match the regional ecosystem characteristics of the Central Plains Urban Agglomeration and improve the accuracy of the calculation results; F refers to the average price of the main grain in China from 2000 to 2018, i.e., RMB 2497.50·t−1; aci refers to the ESV equivalent of different ecosystems; and Vci refers to the unit area value of the type i ecosystem service of the category c ecosystem.
The ESV calculation method adopted in this paper was prompted on the base of the unit equivalent value of the national average status and was developed without considering the effect of people’s willingness to pay on setting the price of the unit equivalent value of ES. Regarding the disadvantages, it was pointed out in the original work that the ecosystem correction factor can be used to solve the price problem caused by the diversity of the ecosystems. To make the method more suitable for the study area, the following improvement was made to the method in this paper: a local correction of the average yield per unit area of main grain in the Central Plains Urban Agglomeration from 2000 to 2018 was conducted to make the method localized according to the economic value of farmland ecosystem food yield in the study area. According to the calculation method, the unit equivalent value (E) of ecological services in the Central Plains Urban Agglomeration was RMB 1894.61·hm−2. a−1, and the ESVs of ecosystems per unit area are shown in Table 3.

3.2.2. Amount Calculation

After localizing the parameters, the ESV calculation adopts the quantitative remote sensing data [20,21,42]:
ESV = c = 1 n V c
where ESV refers to the total ESV; c = 1, 2, …, n refers to the type of ecosystem; and Vc refers to the ESV value of category c:
V c = i = 1 n j = 1 m R ij × V ci × S ij
where i = 1, 2, …, n refers to the ith ecosystem service function of the category c ecosystem; Vci refers to the unit area value of the ith ecosystem service type of the category c ecosystem; j = 1, 2, …, m refers to the number of patches of Vci in a certain area; Sij refers to the area of each patch; and Rij refers to the adjustment coefficient of Vci in different patches, which is determined by the quality of the ecosystem. Rij is the adjustment coefficient of ecosystem quality, usually characterized by the fractional vegetation cover (FVC), f, and the net primary production (NPP):
Rij = (NPPj/NPPmean + fj/fmean)/2
where NPPmean and fmean refer to the average values of NPP and FVC, respectively, and NPPj and fj are the NPP and FVC of the jth patch.
f = (NDVI − NDVIs)/(NDVIv − NDVIs)
where f is the FVC; NDVI is the vegetation index of the plot or pixel; and NDVIv and NDVIs are the vegetation indexes corresponding to pure vegetation and pure soil pixels, respectively.

3.3. ESV Spatial Transfer Calculation Method

Based on the existing research [19,20,21], this paper introduced the breaking point formula to quantify the spatial transfer intensity and radiation radius of the ESV, and the ESV spatial transfer amount and radiation range were calculated on the ArcGIS10.1 platform.
In this paper, the ESV spatial transfer characteristics were evaluated on the basis that Zhengzhou city was considered the transfer-in area and all the cities except Zhengzhou in the Central Plains Urban Agglomeration constituted the transfer-out area.

3.3.1. Spatial Transfer Radius

The ESV spatial transfer radius was calculated using the following formula:
D o = D oi 1 + V i V 0
where Do refers to the radius of the ESV spatial transfer; o refers to the transfer-out area; i refers to the transfer-in area (Zhengzhou city); Doi refers to the distance from the core point of the transfer-out area to the core point of the transfer-in area; and Vo and Vi refer to the value of the ES in the transfer-out area and transfer-in area, respectively.

3.3.2. Spatial Transfer Intensity

The ESV spatial transfer intensity was calculated using the following formula:
I oi = V o D oi 2
where Ioi refers to the average transfer intensity of ESV from the o region to the i region, i.e., radiation intensity.

3.3.3. Spatial Transfer Amount

The ESV spatial transfer amount was calculated using the following formula:
Voi = koiIoiA
where Koi refers to the influencing factor of ESV in natural circulation from the transfer-out area o to the transfer-in area i, with a value between 0 and 1, and combined with the landform of the Central Plains Urban Agglomeration and the characteristics of the ecosystem, the value is 0.6 [19,20,21,32]; i refers to the type of ESV; Ioi refers to the radiation intensity; and A refers to the ESV spatial transfer radiation area, calculated using the buffer analysis function and overlay analysis function in the ArcGIS10.1 platform.

4. Results

4.1. ESV Amount and Distribution

4.1.1. Amounts and Changes

As shown in Table 4, between 2000 and 2018, Xinyang, Luoyang, and Nanyang in the hinterland of the urban agglomeration had the largest total ESV at RMB 35.267–44.566 billion, 31.899–46.870 billion, and 52.009–64.349 billion, respectively, and also had higher ESV densities and larger scales within the urban agglomeration.
In terms of change, the cities with large decreases and the cities and counties with large increases in the total ESV were all mainly located in the hinterland, such as Luoyang, Sanmenxia, Jincheng, Xinyang, Nanyang, and Jiyuan, with changes of −31.942%, −29.328%, −23.230%, −20.866%, −19.178%, and –4.169%, respectively, while Handan, Puyang, and Liaocheng in the hinterland increased by 95.715%, 90.631%, and 89.953%, respectively.
The total ESV in the cities and counties in the metropolitan area for transfer basically remained stable, except in Zhengzhou and Xuchang. For Zhengzhou, as the central city, the total ESV in some areas increased due to the ecological protection and ecological construction along the northern Mang Mountain and the Yellow River and the construction of the Longhu water system in the Zhengdong New Area. Additionally, Xuchang’s 81.062% increase benefitted from the South-to-North Water Diversion Project.

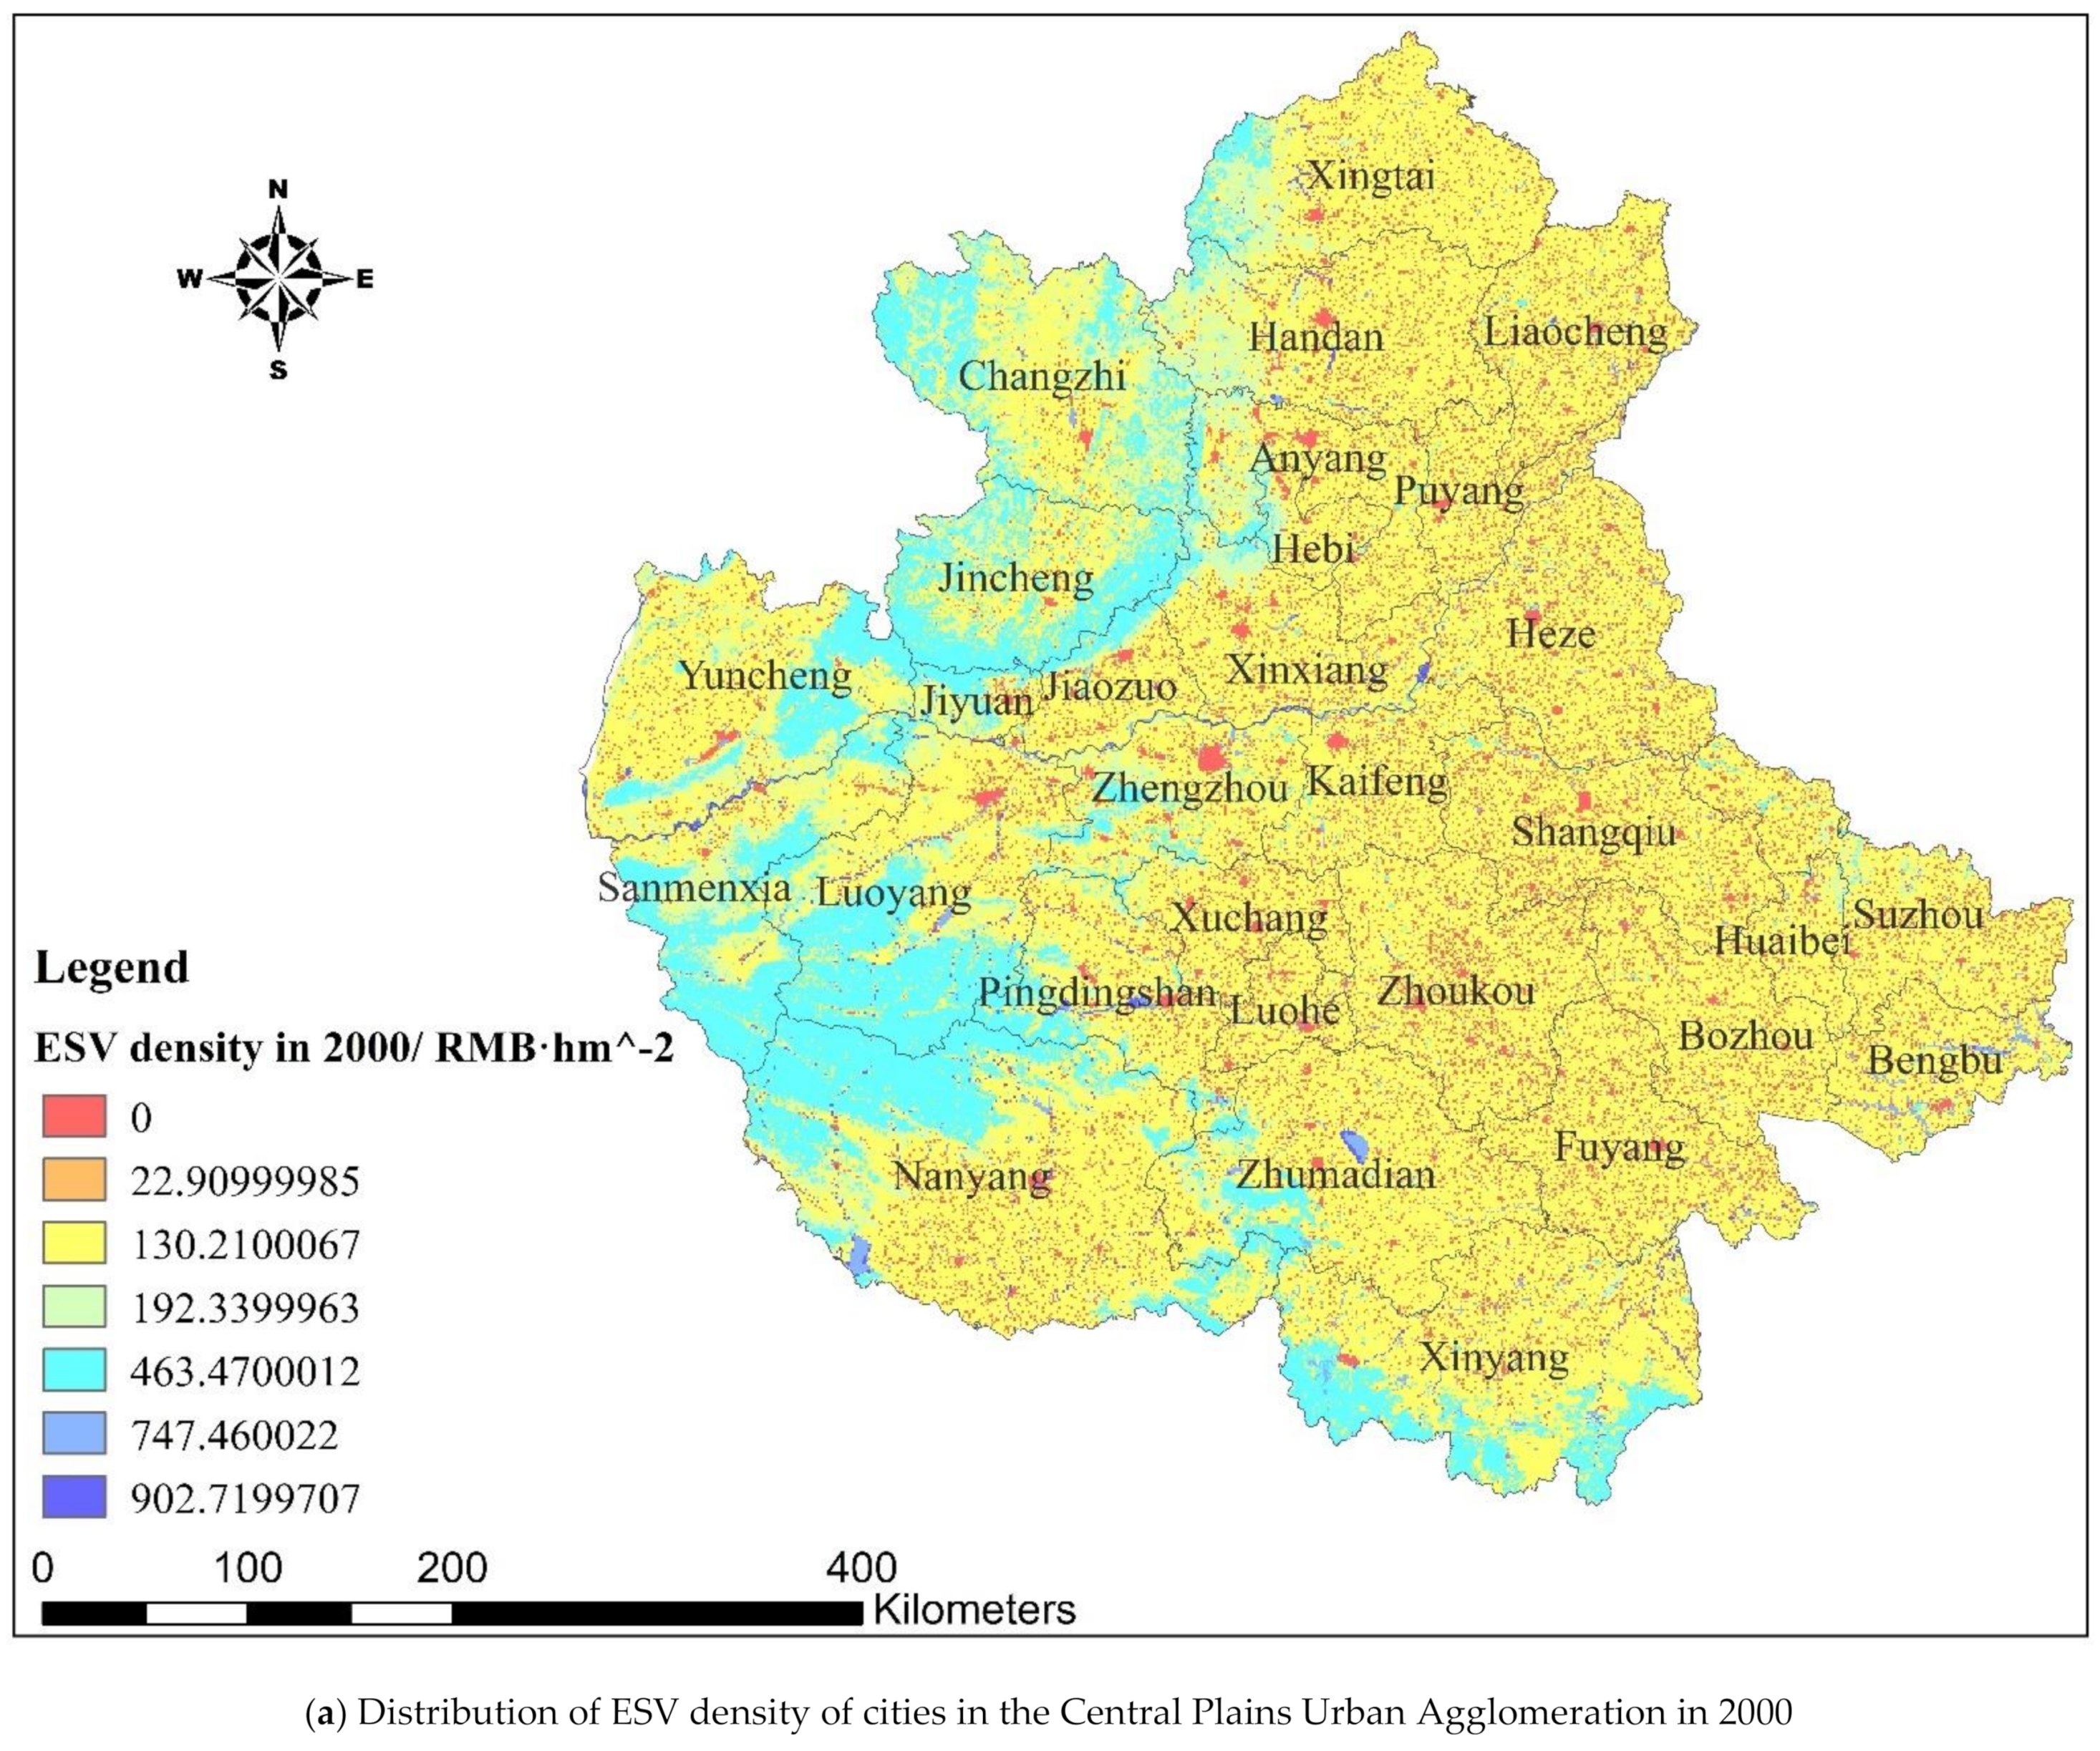
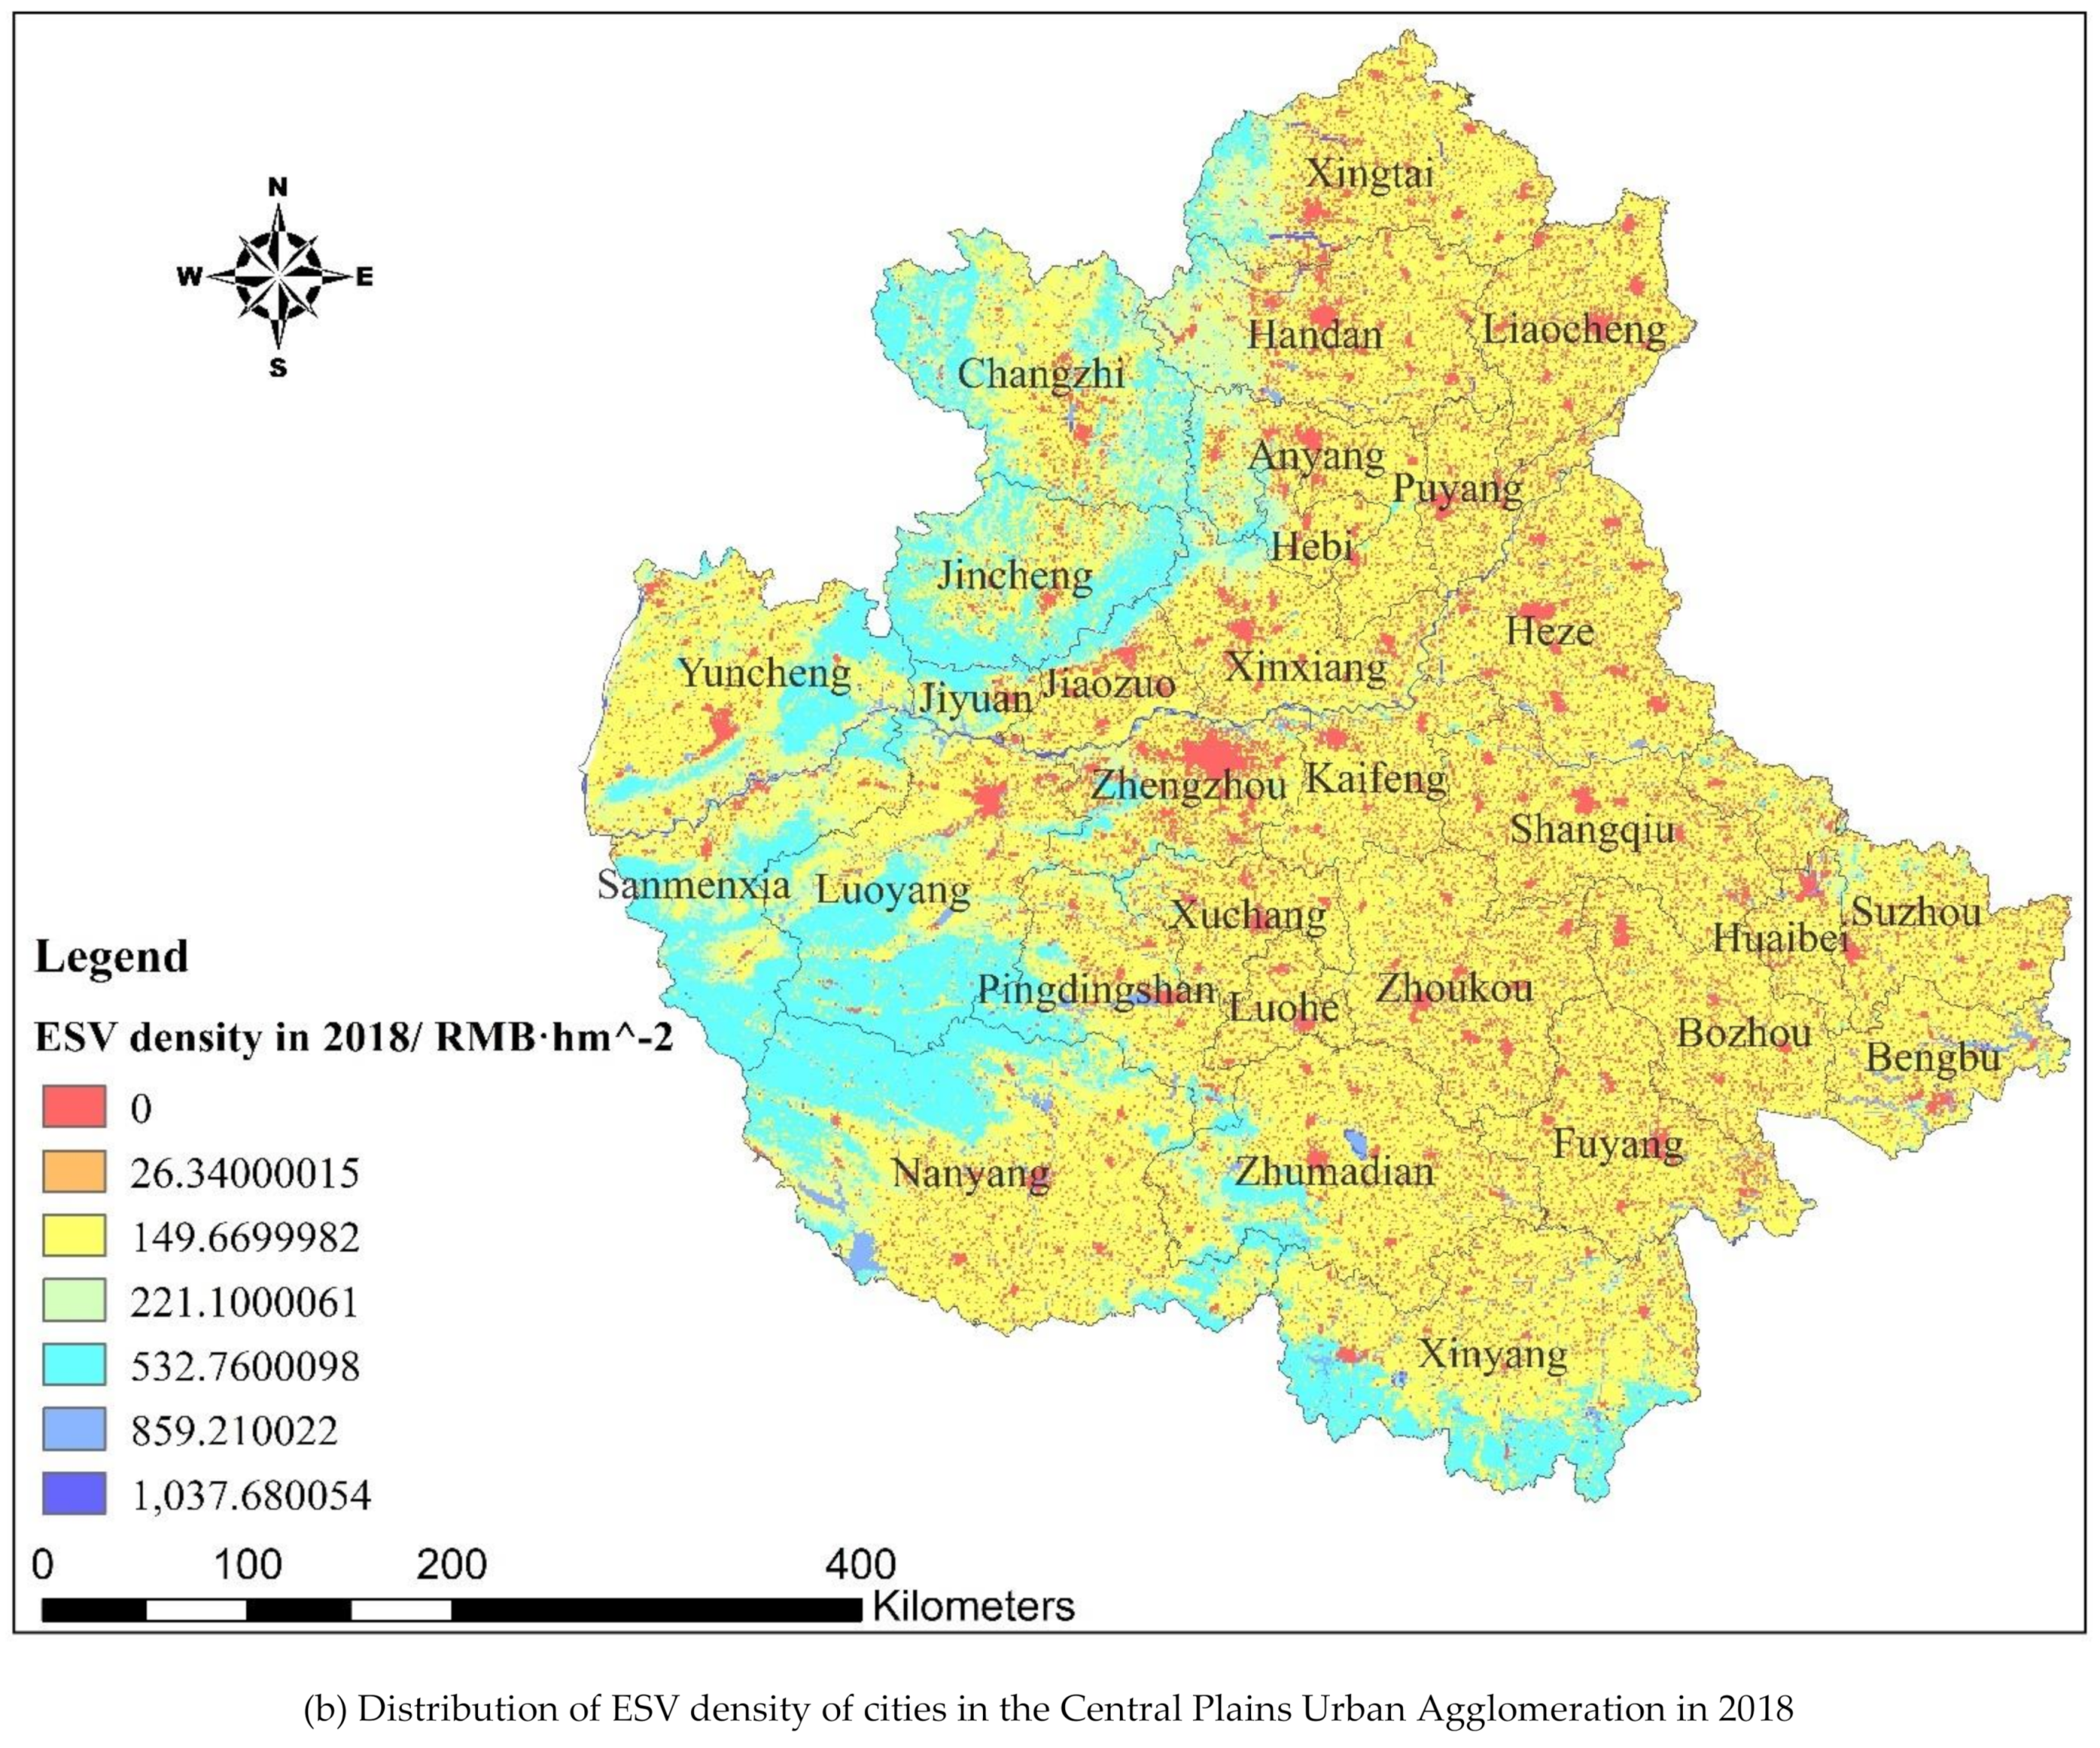
4.1.2. Density Distribution

Using the “Natural Breaks” classification method on ArcGIS 10.1, the ESV density distribution of the Central Plains Urban Agglomeration was demonstrated. As shown in Figure 3, the ESV density distribution of the Central Plains Urban Agglomeration formed a spatial circle structure of hinterland–metropolitan area–central city from 2000 to 2018. In terms of distribution, there are obvious spatial differences in the ESV distribution in the Central Plains Urban Agglomeration, with the northwest and south of the hinterland being high ESV distribution areas, the metropolitan area being the main distribution area of medium ESV, and the central city (Zhengzhou) being the main distribution area of low ESV.
Comparing the years 2018 and 2000 in the Central Plains Urban Agglomeration, the northwest and the south of the ”hinterland” were the main areas showing an increase in ESV. The density of ESV in the “metropolitan area” remained stable, without an obvious change. The ESV of the central city (Zhengzhou) showed an overall decreasing trend.

4.2. ESV Spatial Transfer Intensity and Amount

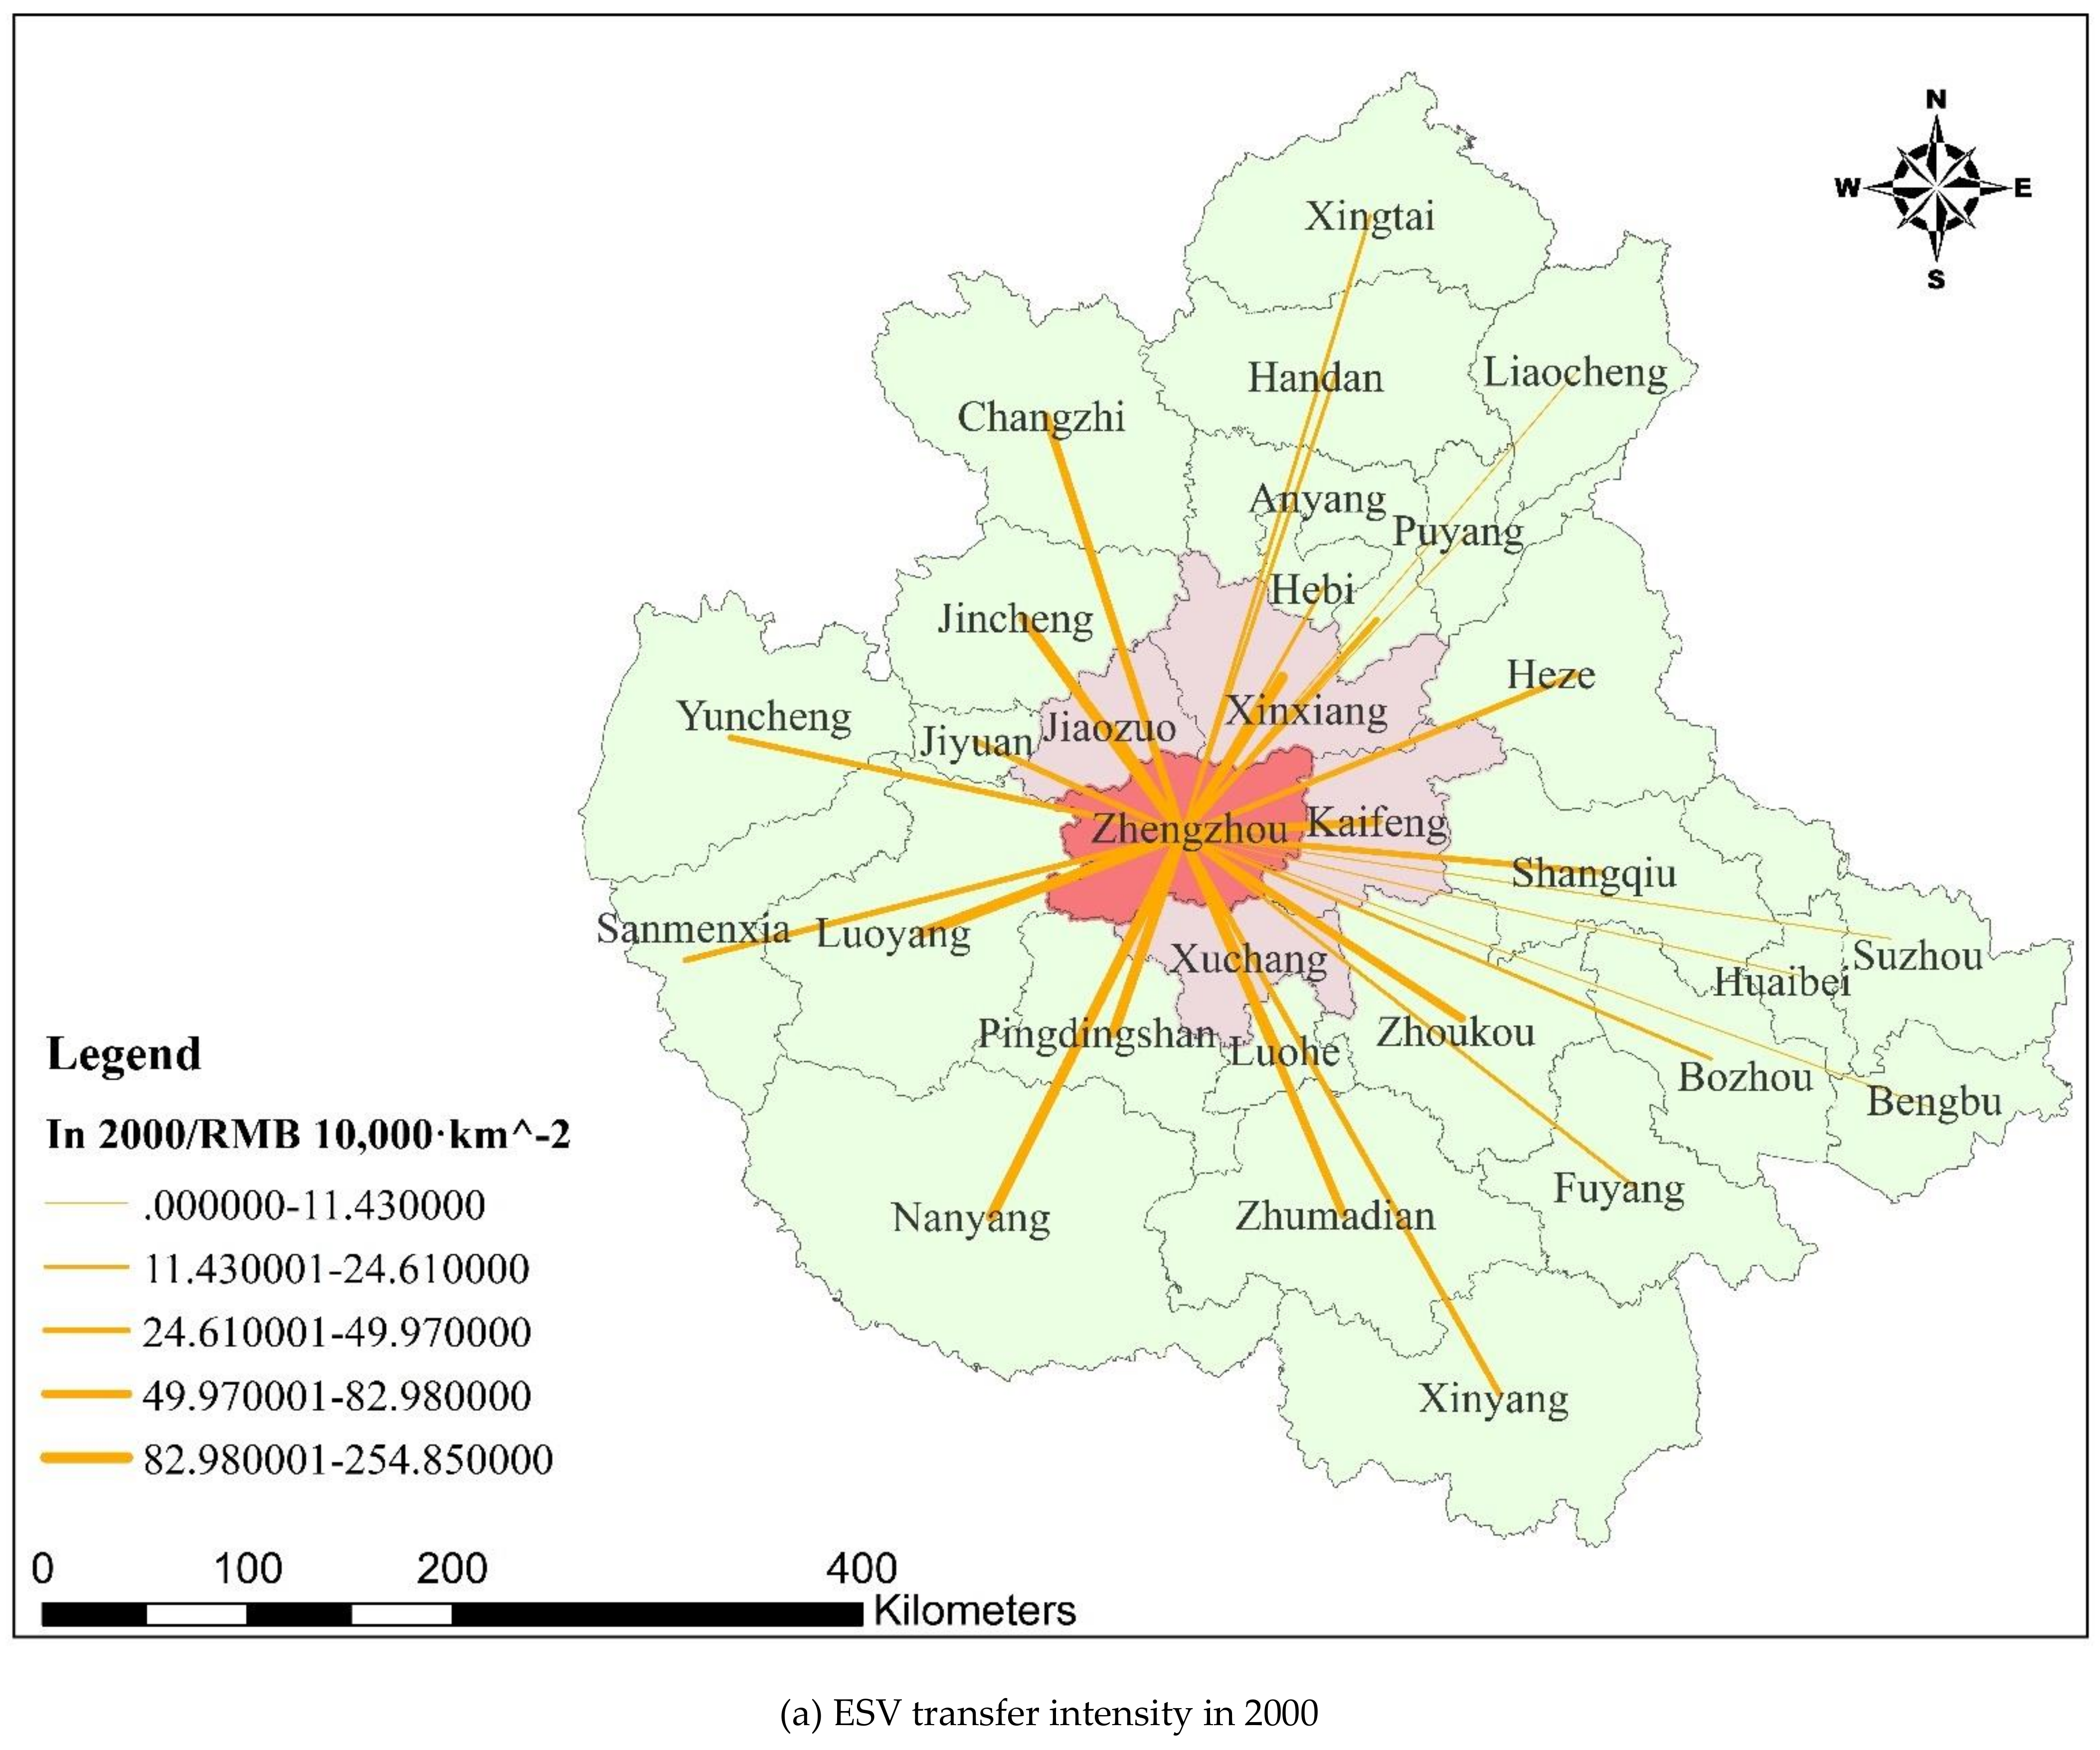
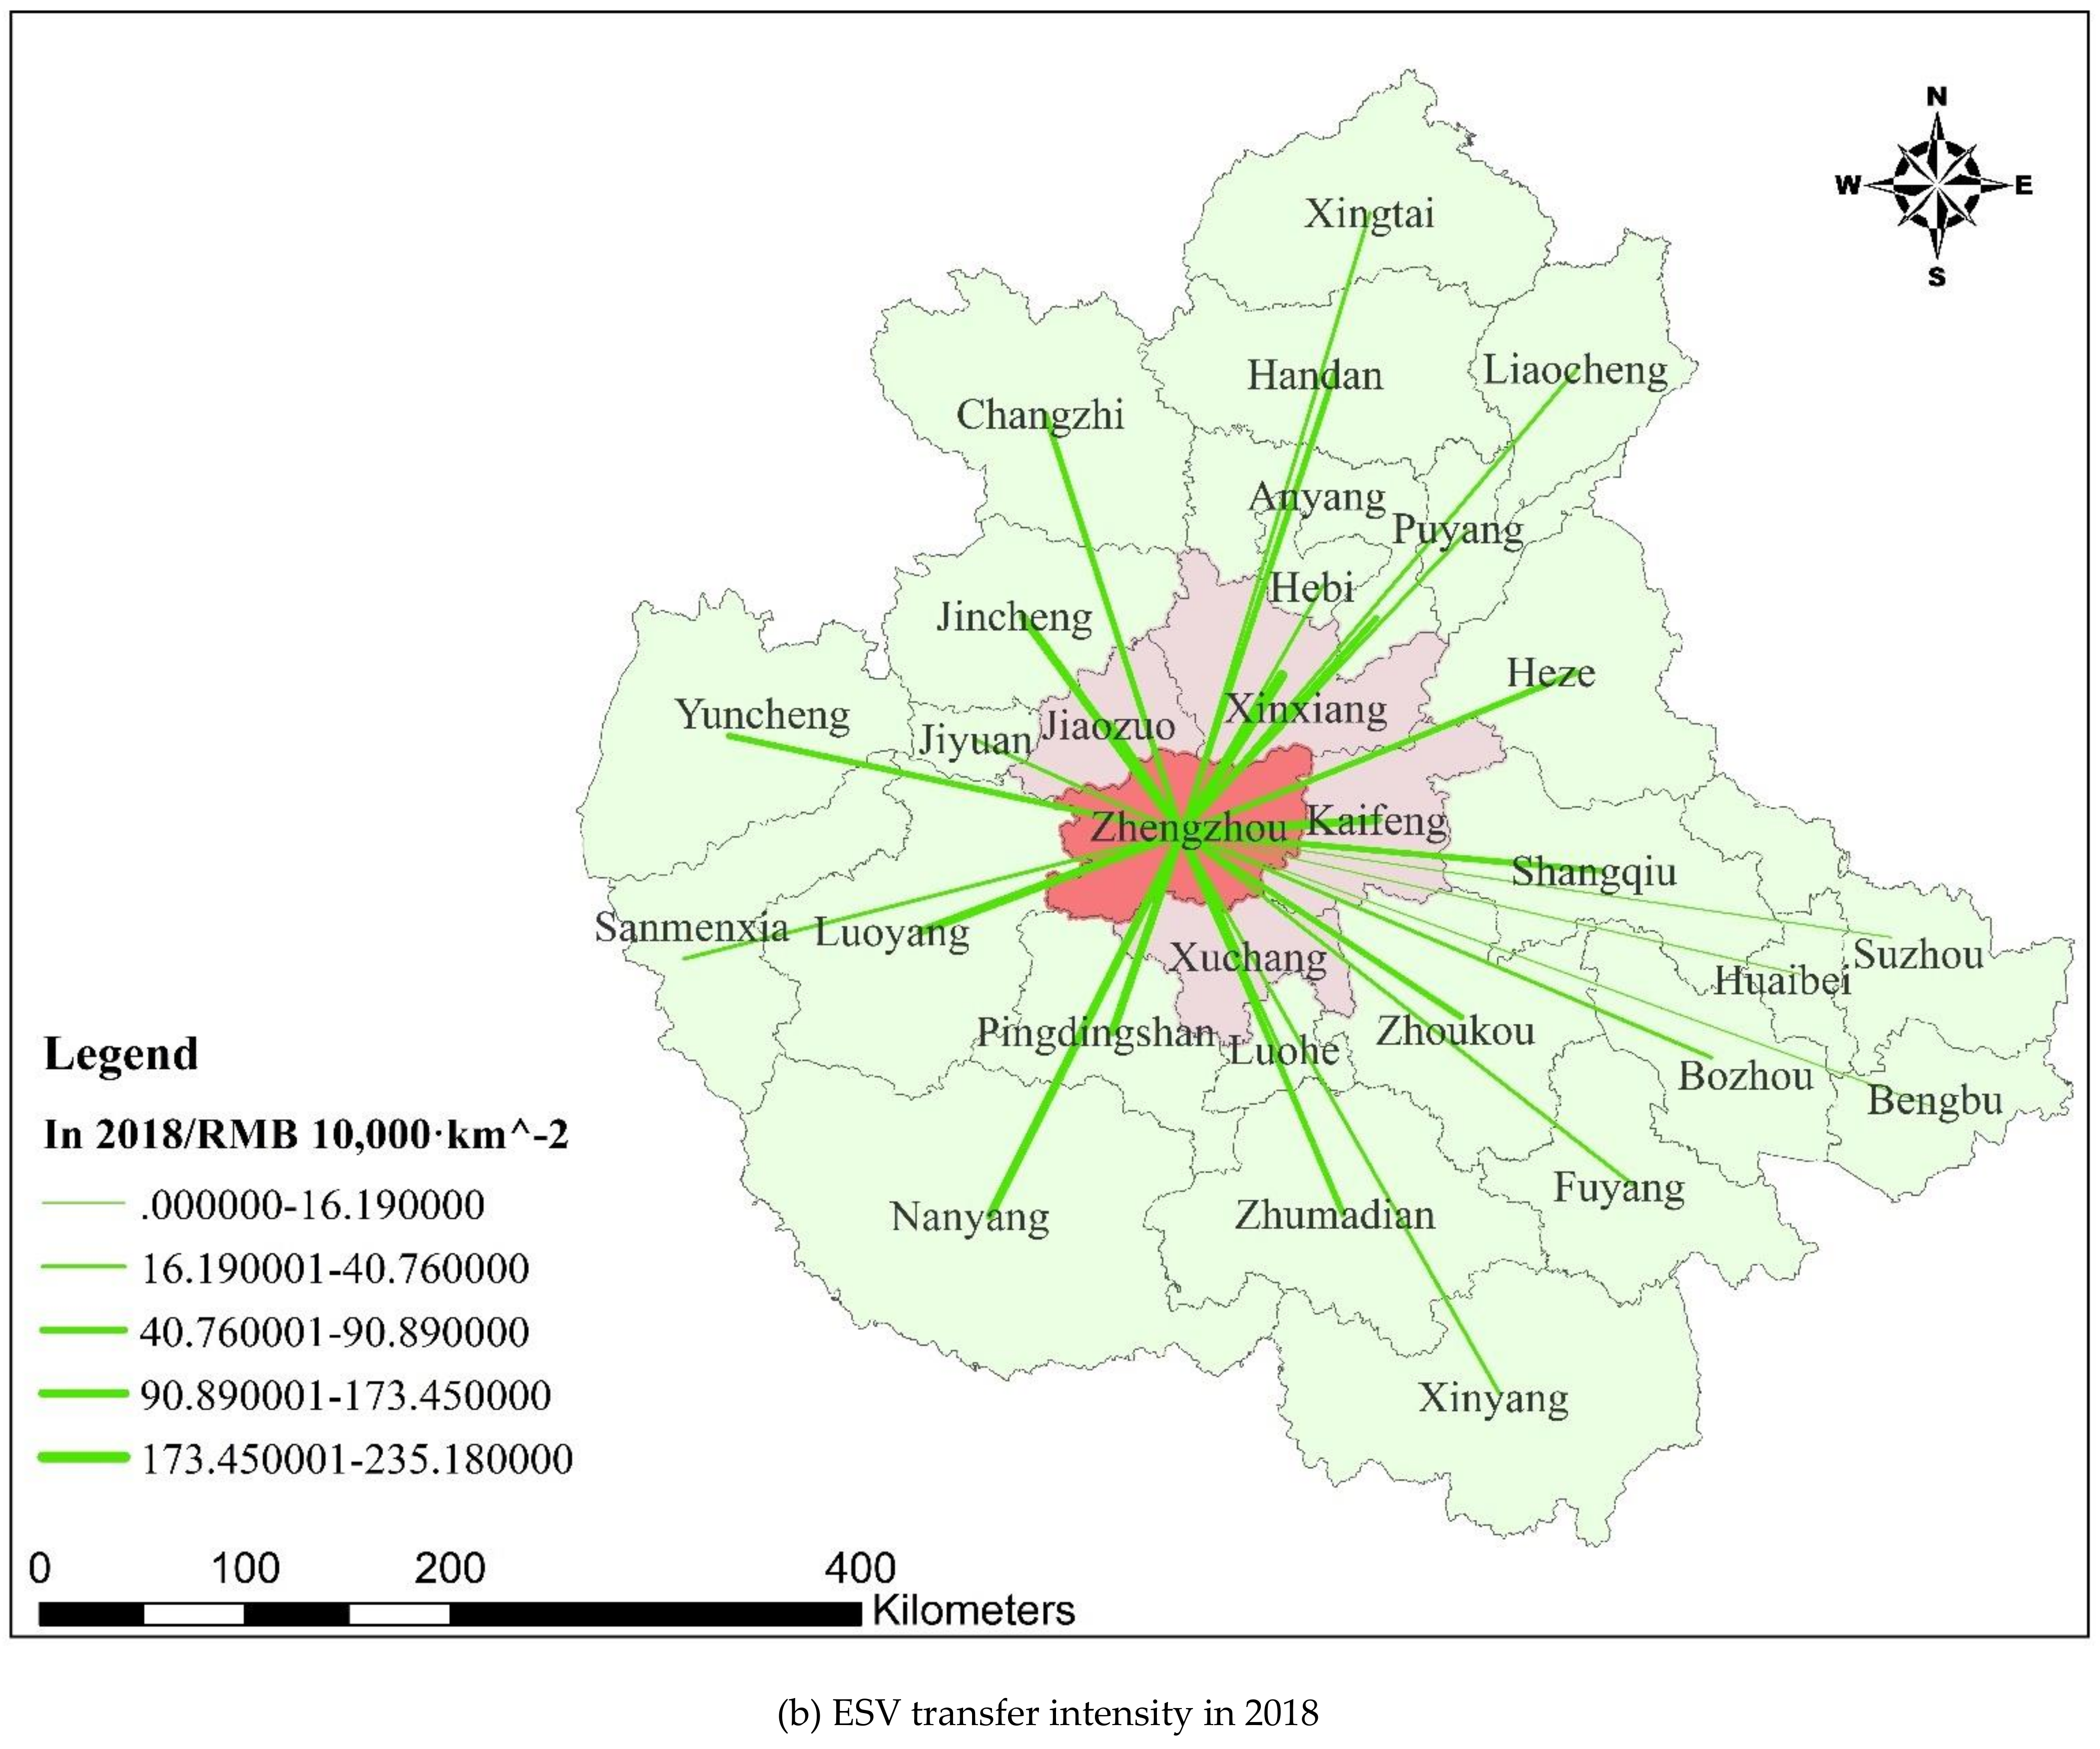
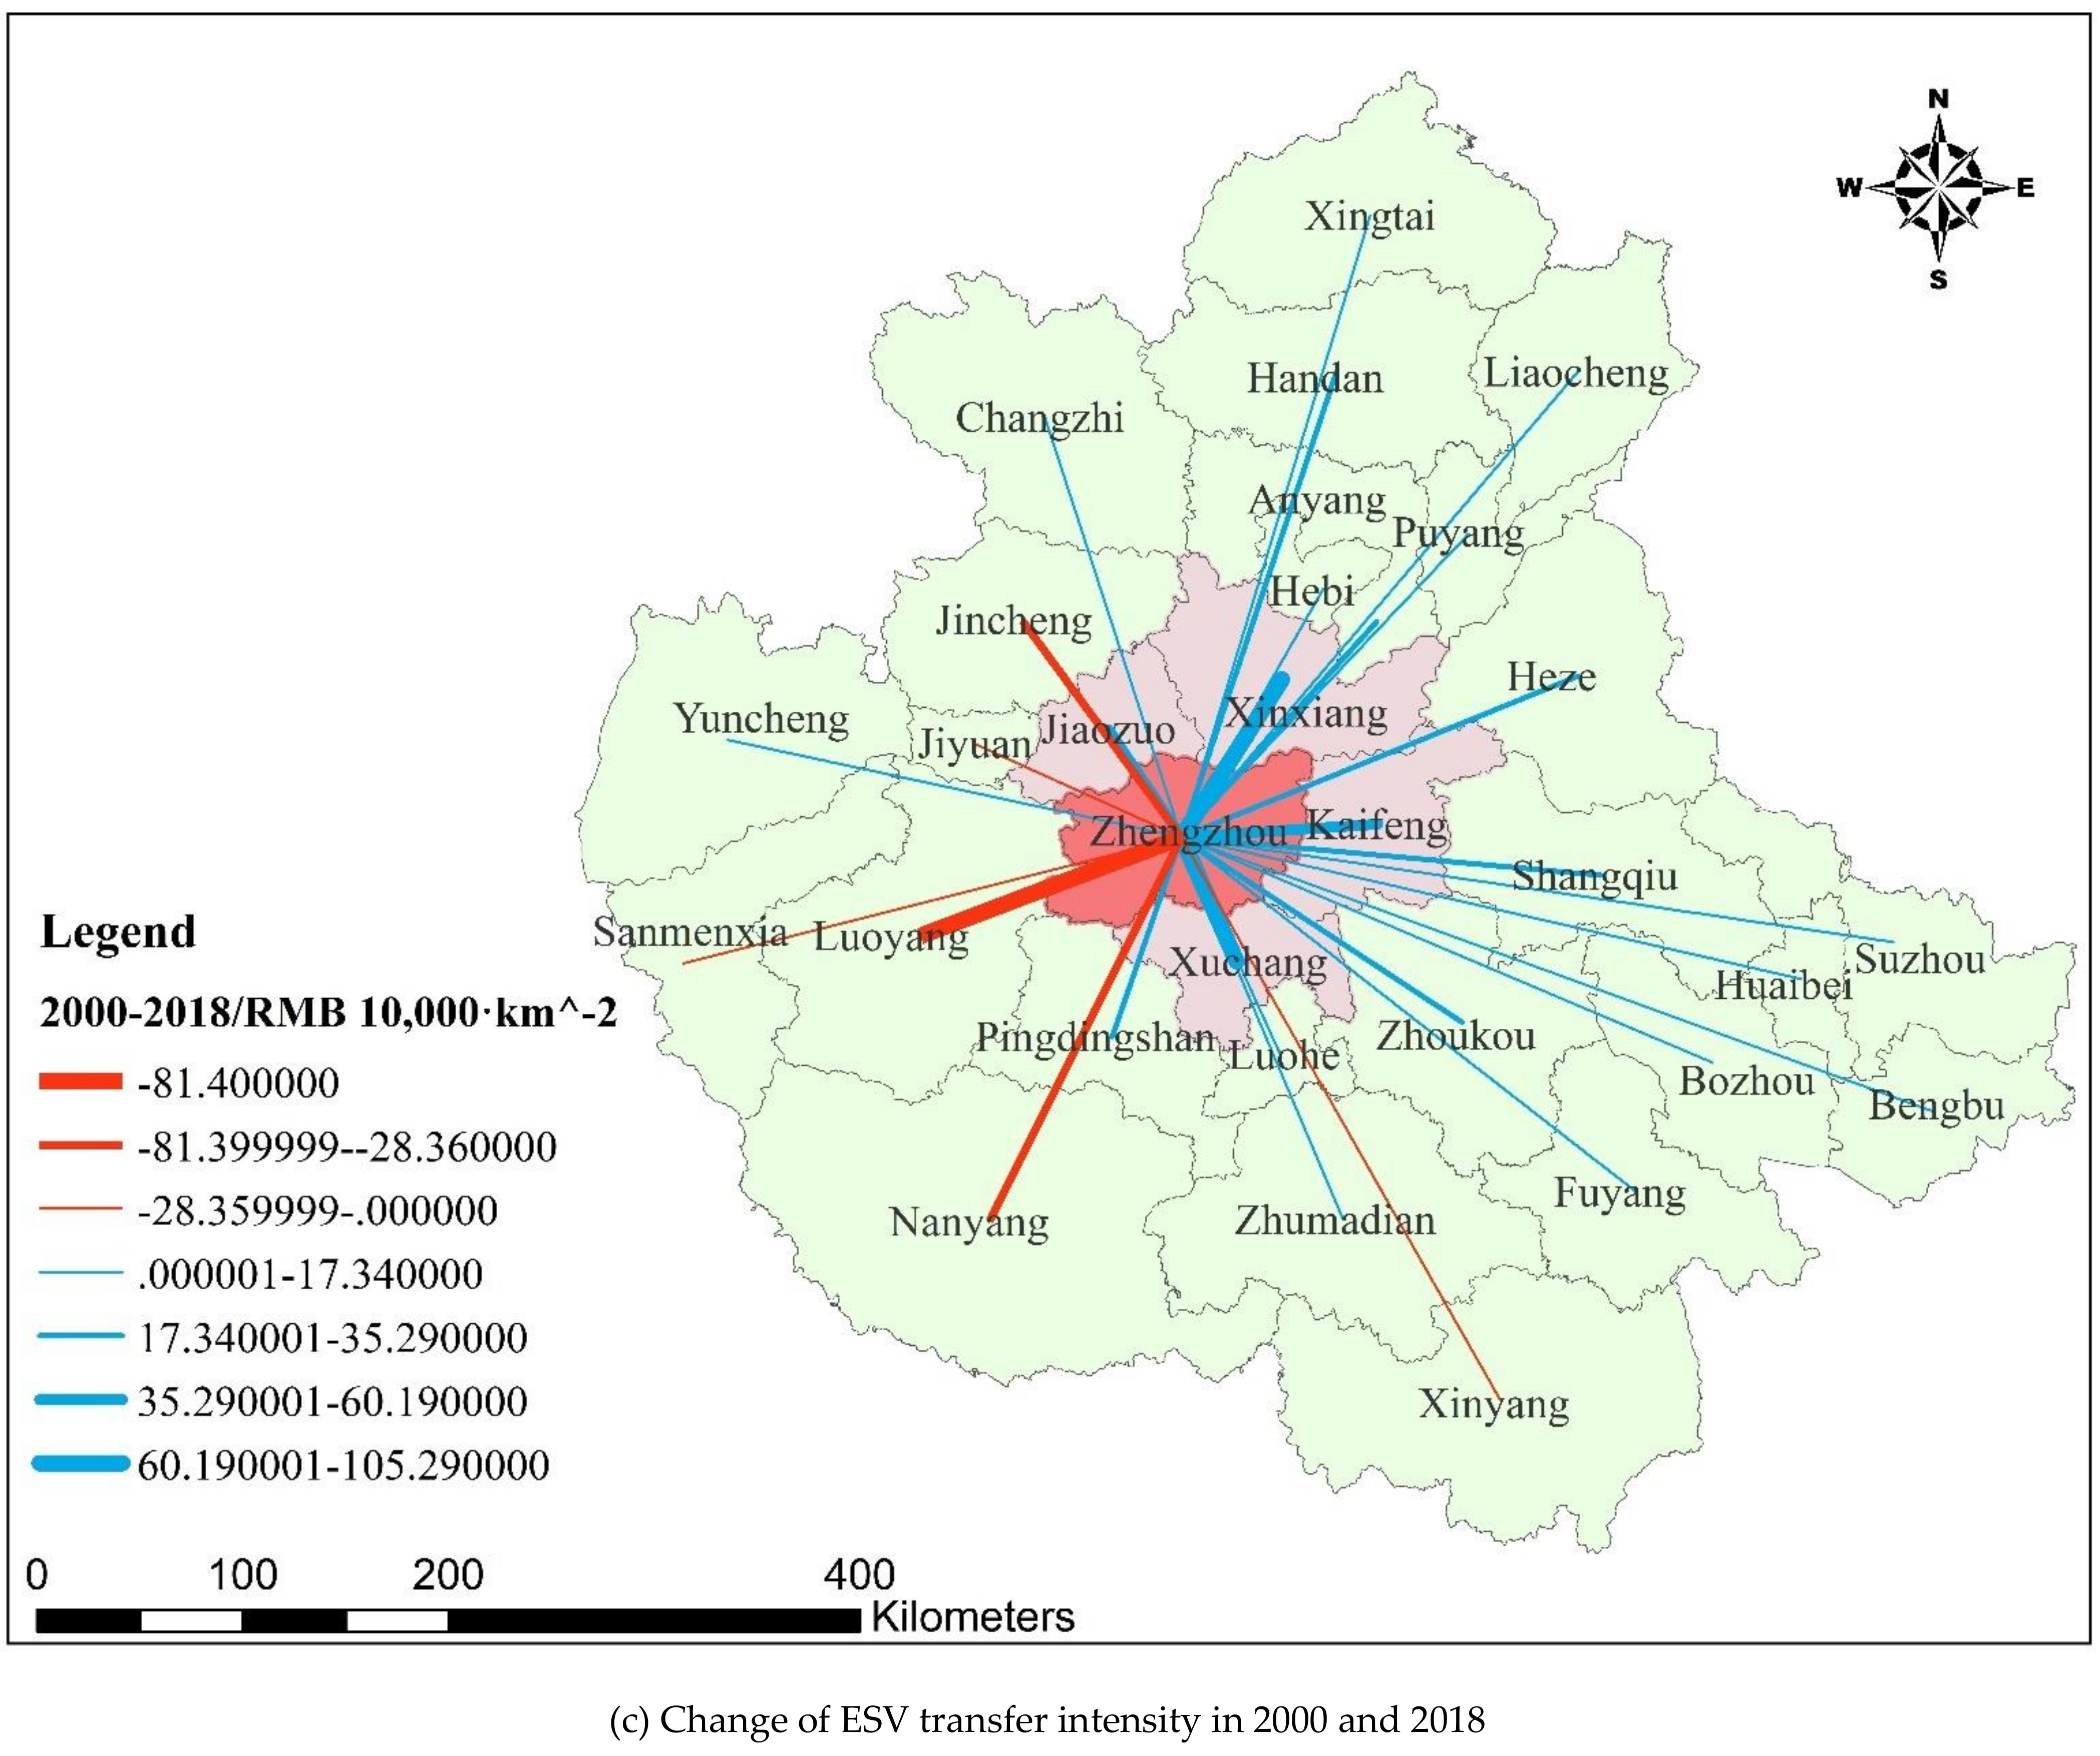
4.2.1. Spatial Transfer Intensity

As shown in Table 5 and Figure 4, from 2000 to 2018, the spatial transfer intensity of ESV from metropolitan areas to the central city increased. The average spatial transfer intensity of ESV from Xuchang, Kaifeng, Xinxiang, and Jiaozuo to the central city has shown an overall increasing trend with an increase of RMB 498,400–1,053,000/km2, with Xuchang increasing the most.
The ESV spatial transfer intensity increase–decrease polarization phenomenon occurred in the cities of the hinterland. On the decrease side, from Heze, Xinyang, Sanmenxia, and Luoyang, the average spatial transfer intensity of ESV decreased by RMB 15,200–814,000/km2, with Luoyang decreasing the most, and the mobility of ESV to the central city became worse. On the increase side, the average spatial transfer intensity of ESV increased by RMB 23,700–352,900/km2 from Huaibei and Zhoukou, respectively.
The results from the ESV spatial transfer of cities in the metropolitan area suggested that ecological co-construction and cooperation in urban agglomerations is an important way to initiate the development momentum of urban agglomerations in the Central Plains Urban Agglomeration.

4.2.2. Spatial Transfer Amount

From 2000 to 2018, the total amount of ESV spatial transfer in the urban agglomeration was RMB 294.763–331.471 billion, among which RMB 13.083–18.638 billion was transferred from the metropolitan area and RMB 276.123–331.471 billion was transferred from the hinterland, with Nanyang transferring the most at RMB 37.806–62.697 billion, followed by Xinyang and Luoyang (Table 6). As shown in Table 7, from 2000 to 2018, the total ESV transferred into Zhengzhou city was RMB 0.534–1.716 billion, accounting for 0.181–0.517% of the total transfer and 0.276–1.748% of the total ESV of Zhengzhou. Due to the change in the transfer radius and radiation range, the total ESV transferred into Zhengzhou decreased by RMB 1.18 billion, with a total decrease of 68.80%.
In terms of the change in transfer amount, it increased in the metropolitan area but decreased in the hinterland. However, the transfer number of the whole urban agglomeration was generally decreasing, with a total decrease of RMB 36.710 billion. The transfer amount mainly decreased in the hinterland with a total decrease of RMB 42.265 billion. Nanyang showed the largest reduction of RMB 24.891 billion, followed by Luoyang and Xinyang with decreases of RMB 22.566 billion and 16.962 billion, respectively. A total decrease of RMB 64.419 billion occurred in the three cities, accounting for 72.53% of the total decrease. The transfer amount mainly increased in metropolitan areas, with a total increase of RMB 5.555 billion, accounting for 42.46% of the total transfer amount of ESV in the metropolitan area.
Based on the results, we can draw the conclusion that natural spatial transfer may not be enough to match the ESV supply and demand, and an ecosystem conservation network composed of high-quality ES and “production base” systems in the hinterland and “ecological corridor” systems in metropolitan areas could be promoted to strengthen the ecological interaction by taking advantage of ESV spatial transfer among the hinterland, metropolitan areas, and the central city.

4.3. ESV Spatial Transfer Radius and Radiation Range

4.3.1. Spatial Transfer Radius

The ESV spatial transfer enabled the cities and counties to transfer their ESV outside their administrative scope and increase the efficiency within the entire Central Plains Urban Agglomeration. As shown in Table 8, from 2000 to 2018, the range of the ESV spatial transfer radius of each city of the Central Plains Urban Agglomeration was 25.47–214.17 km, with Xinyang having the largest one at 180.79–214.17 km and Jiaozuo having the smallest one at 25.47–28.30 km. Compared with 2000, the ESV spatial transfer radius in 2018 showed a downward trend in all cities and counties. Among them, Xinyang decreased the most by 33.39 km, a decrease of 15.59%, followed by Sanmenxia and Nanyang, which decreased by 31.18 and 20.44 km, respectively, down by 19.61% and 13.62%, with Handan showing the smallest change with a decrease of 0.21 km, accounting for 0.16%.

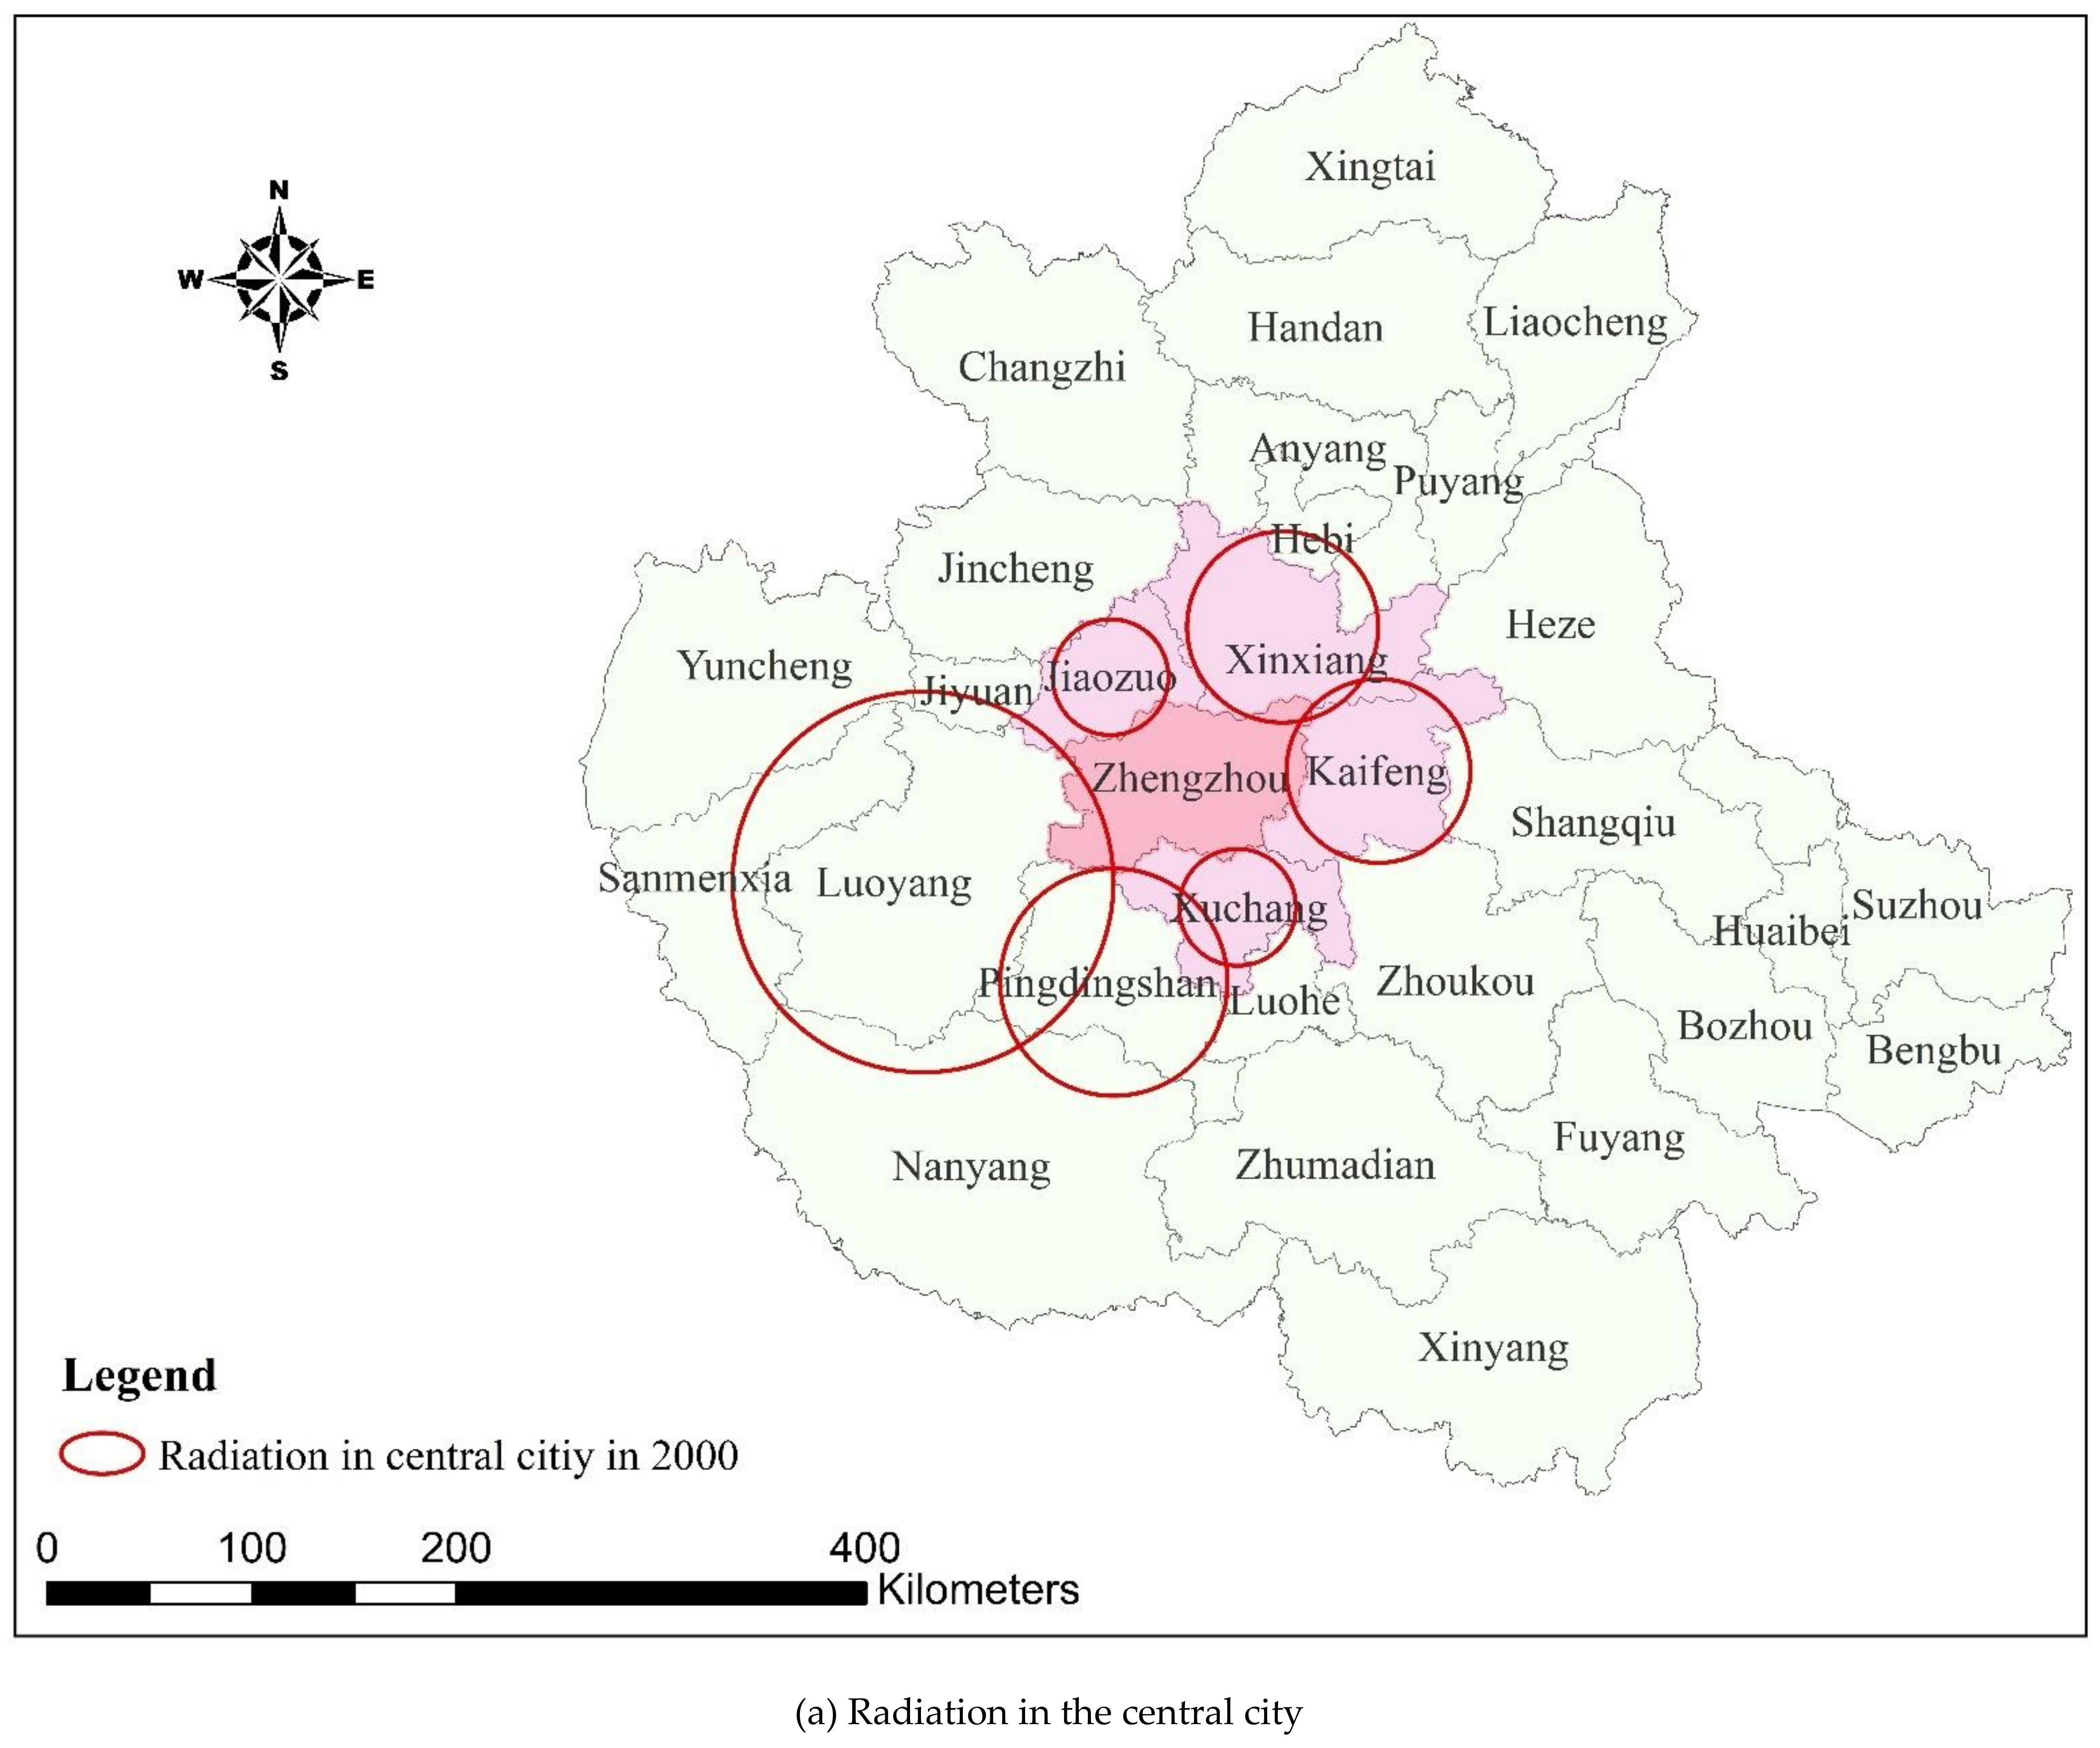
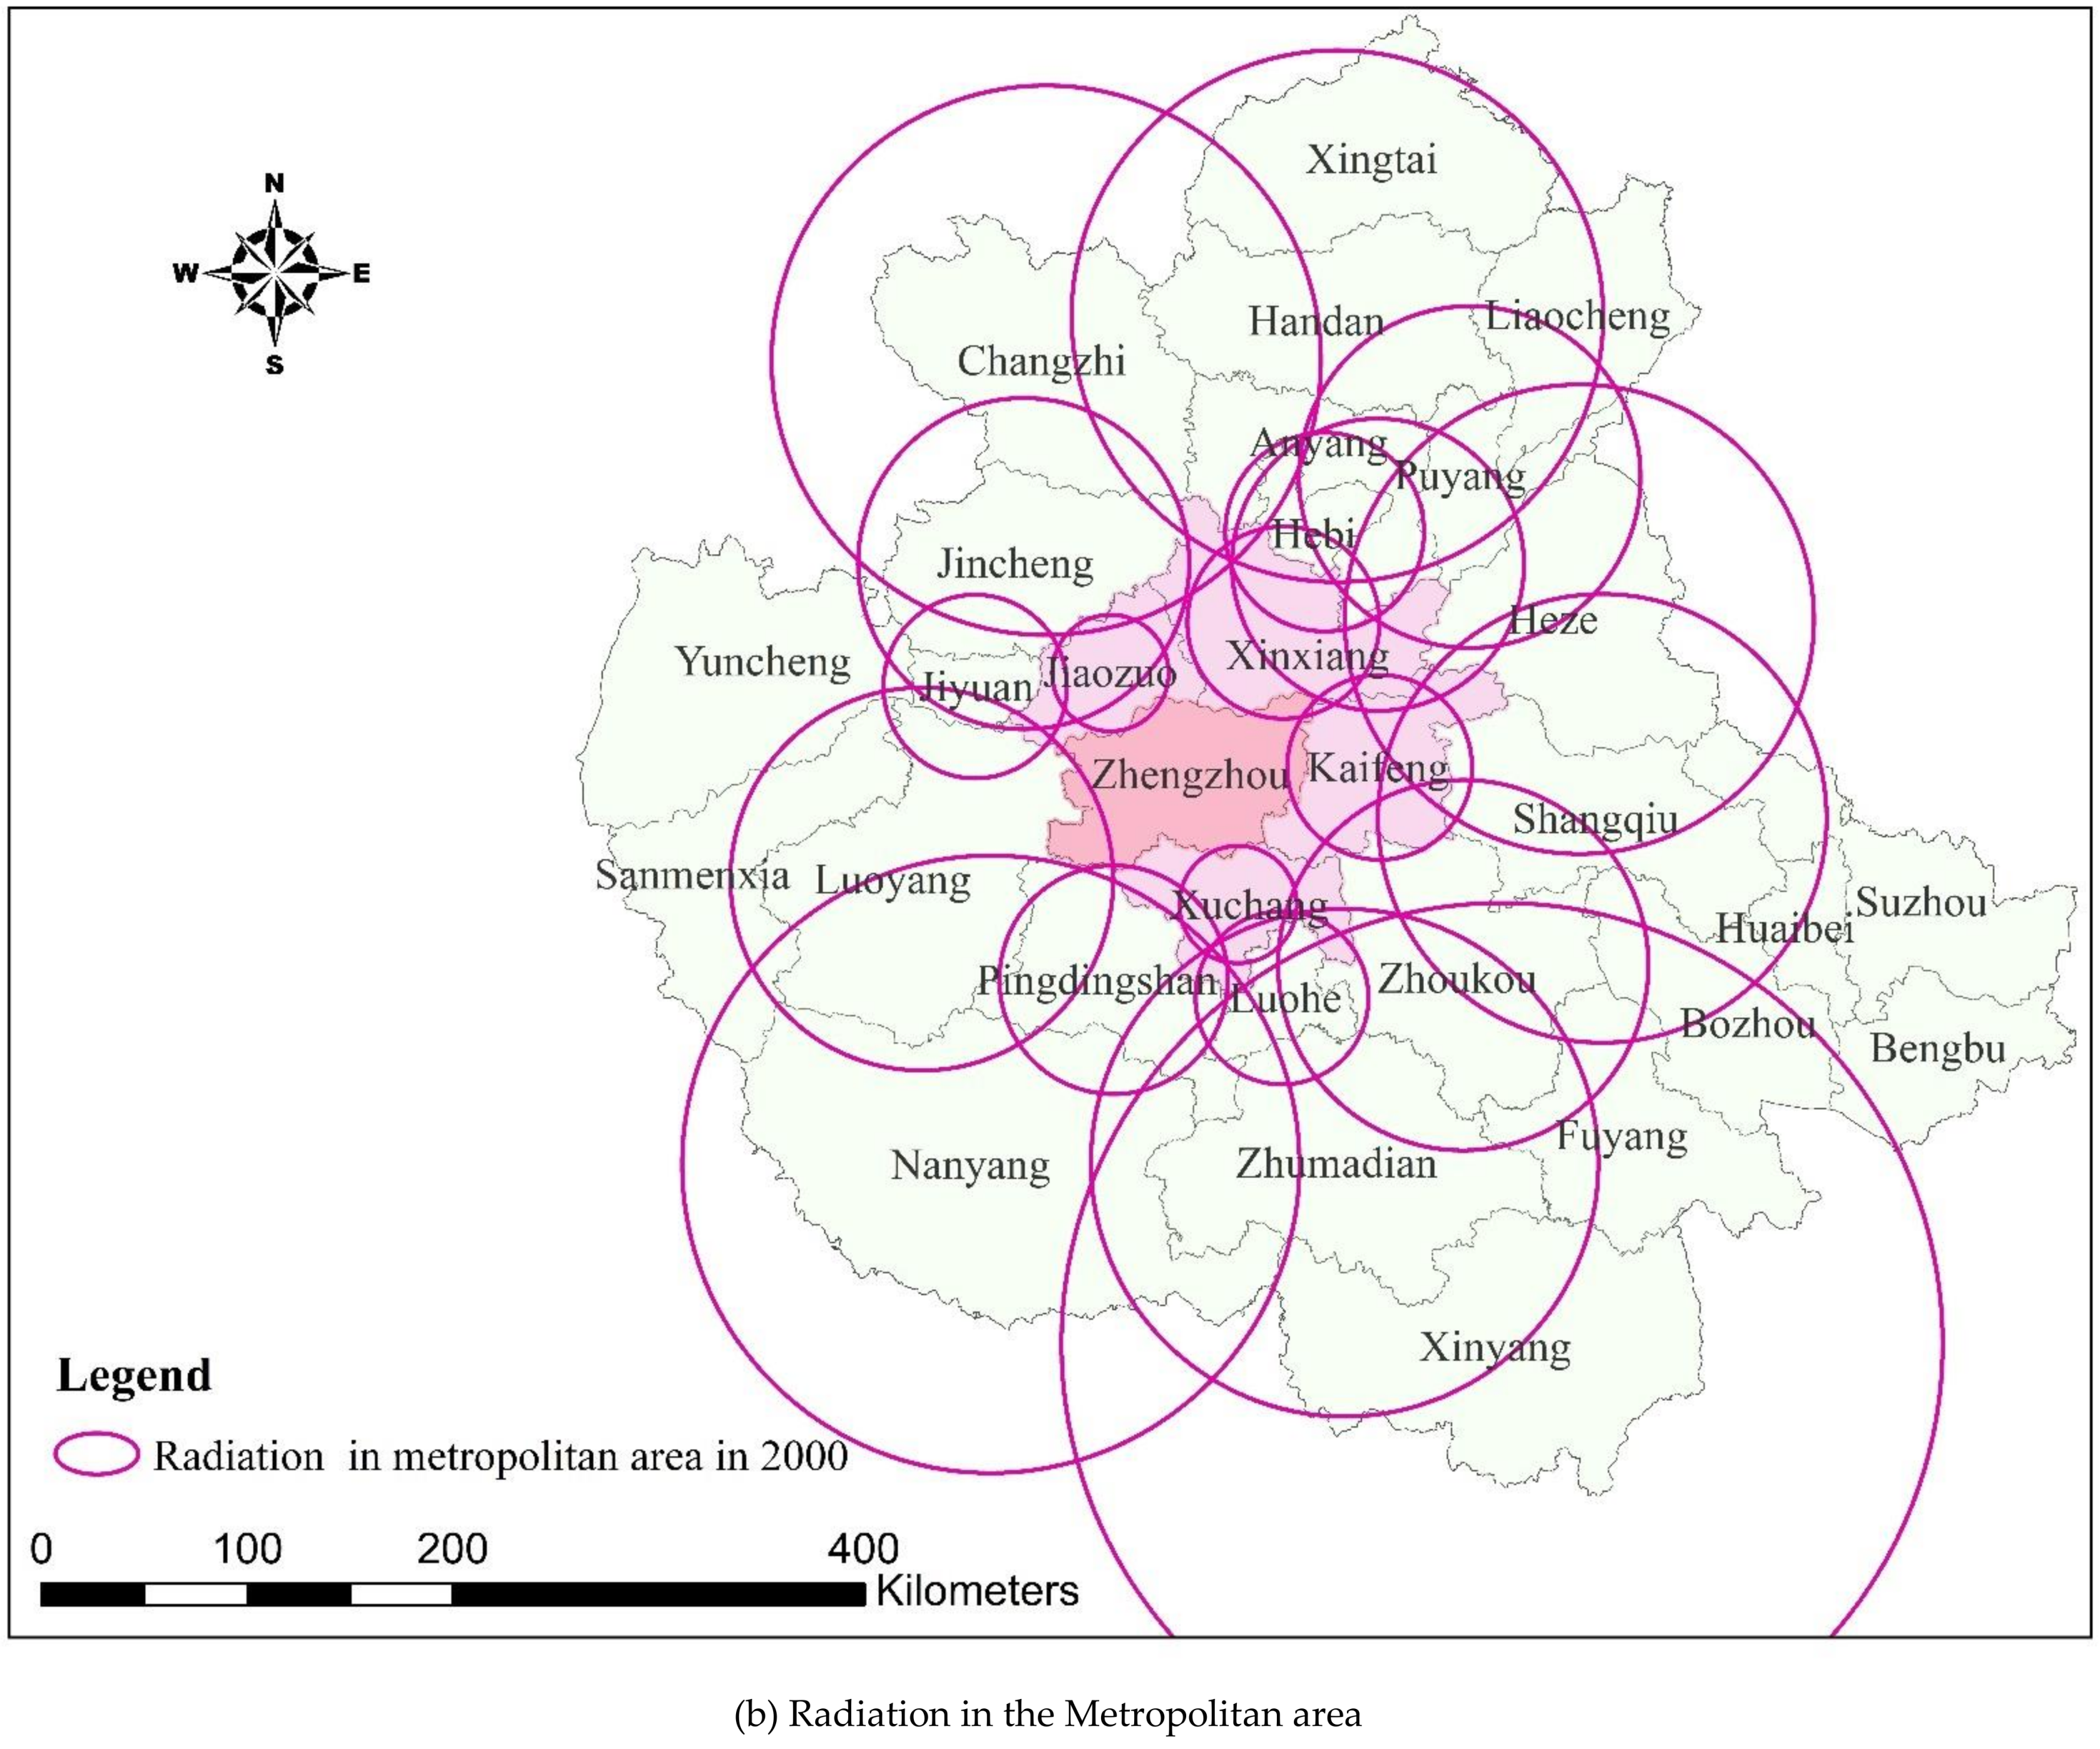
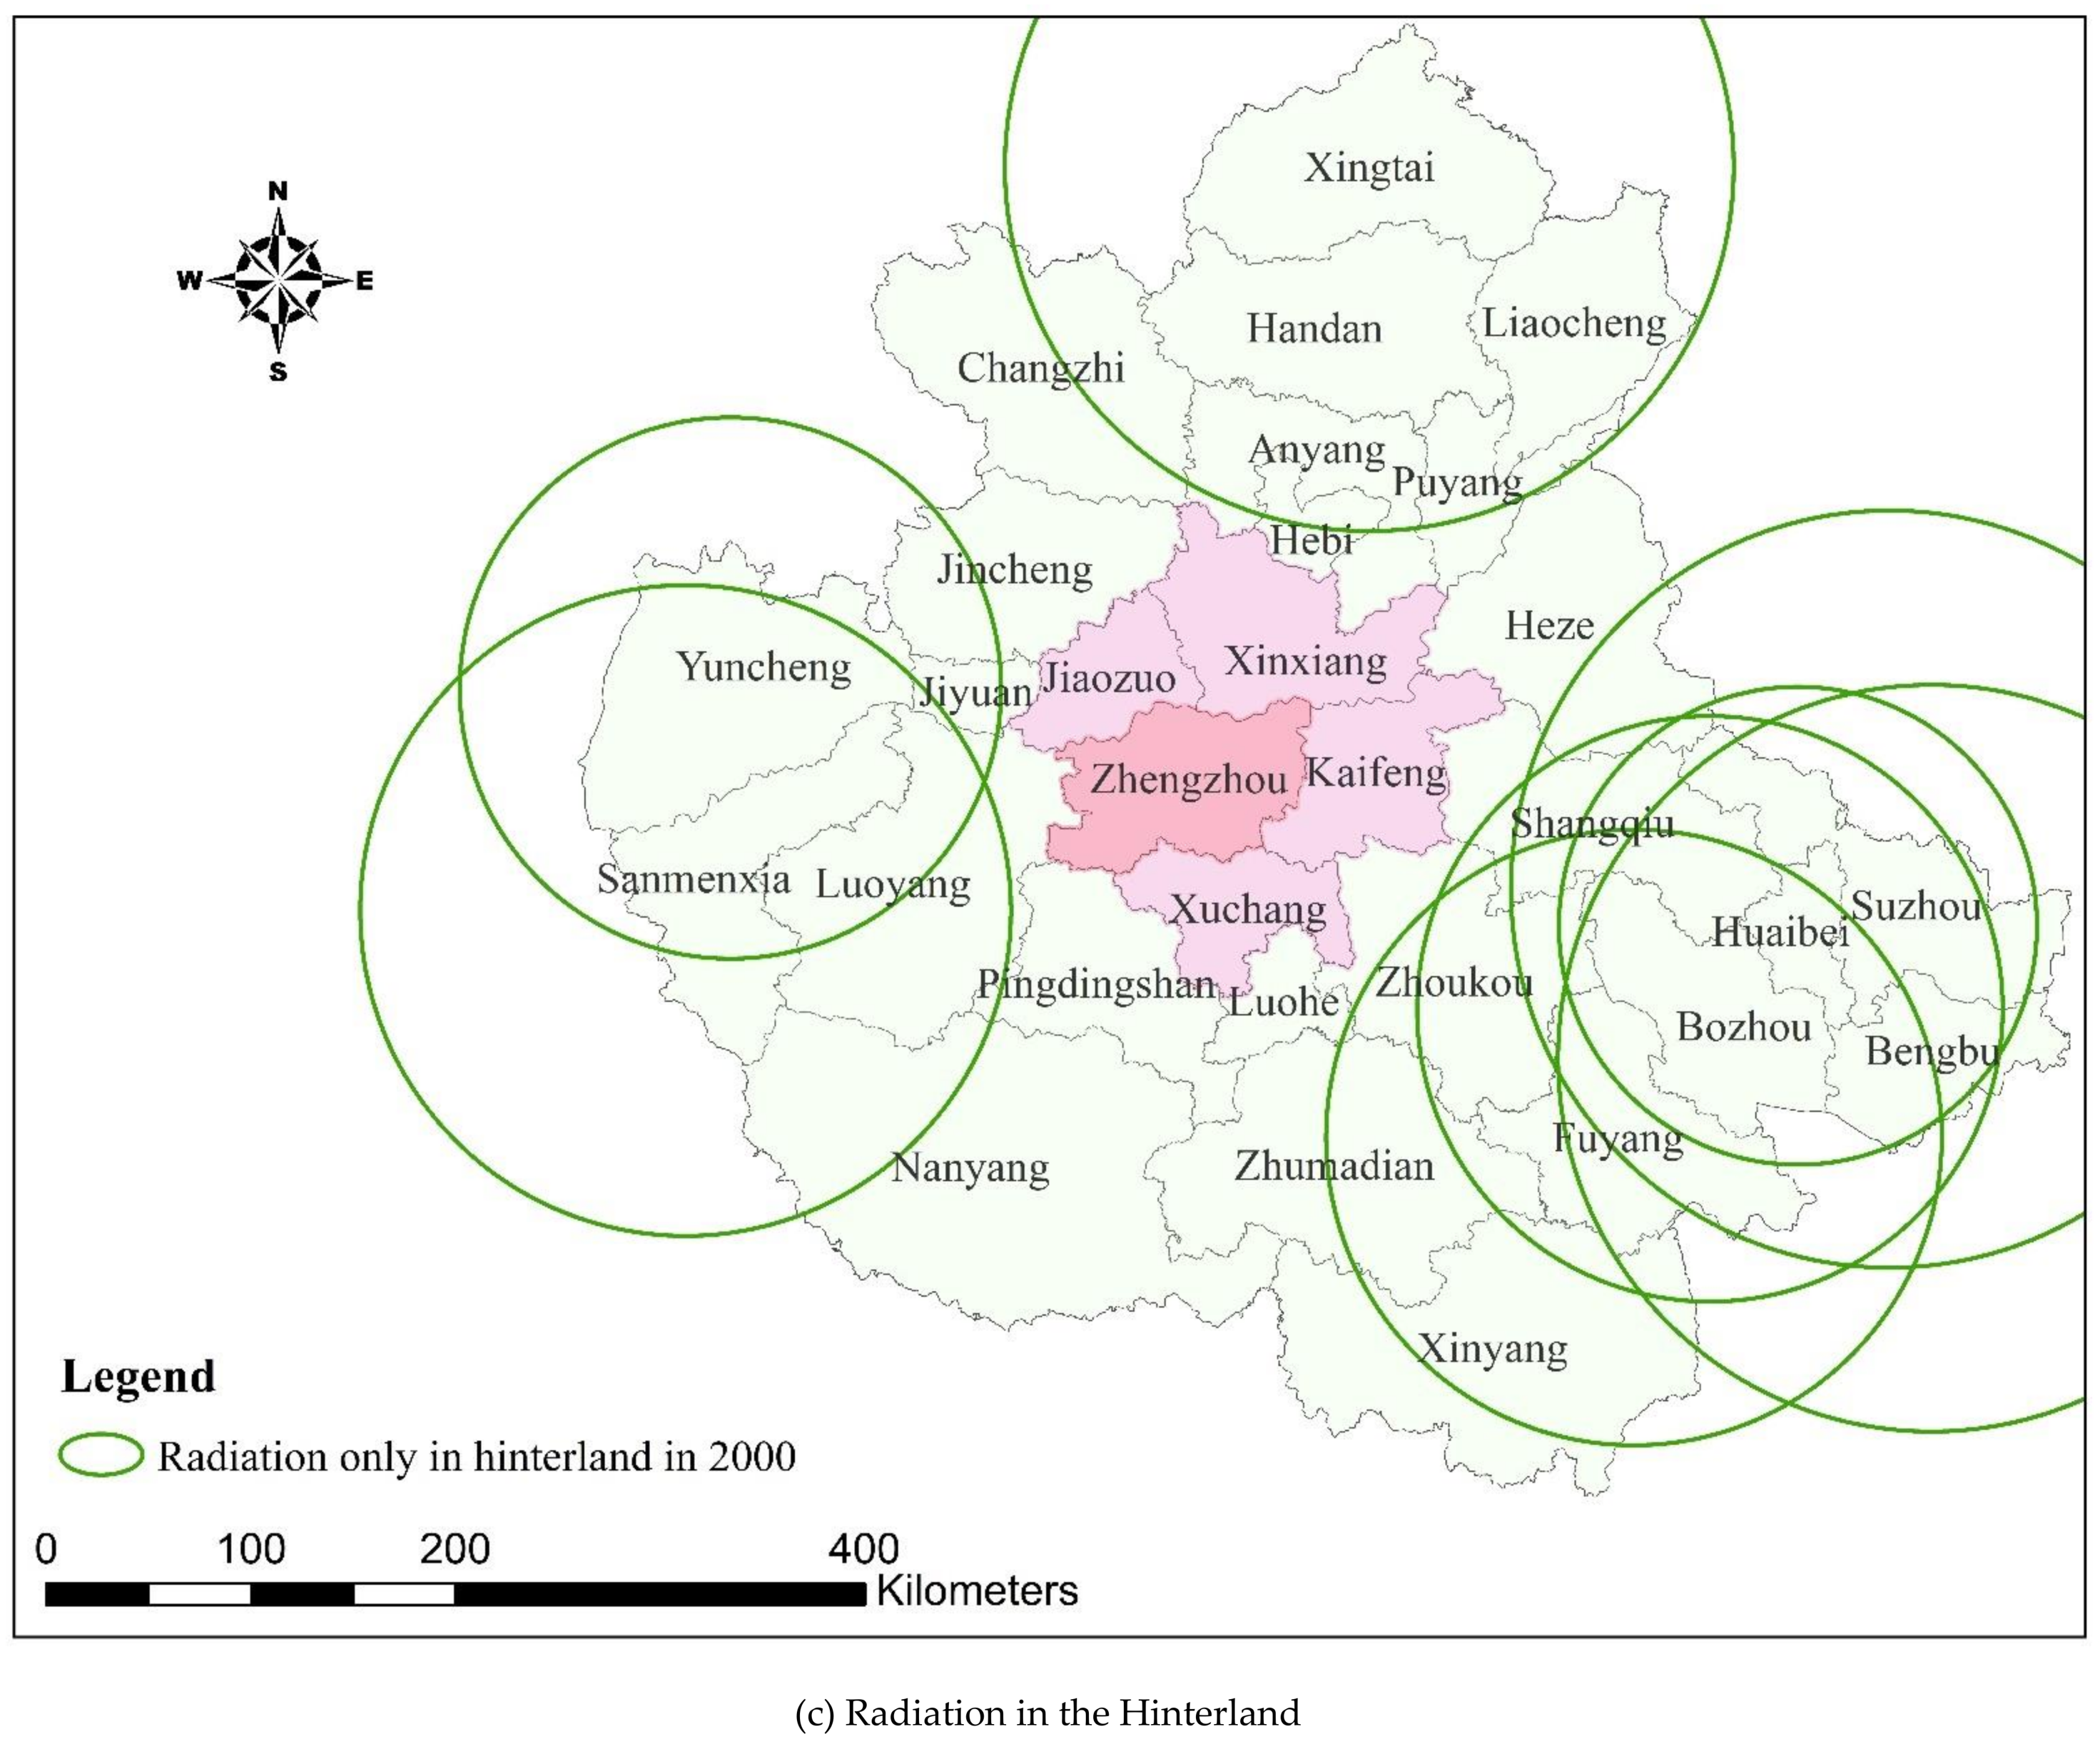
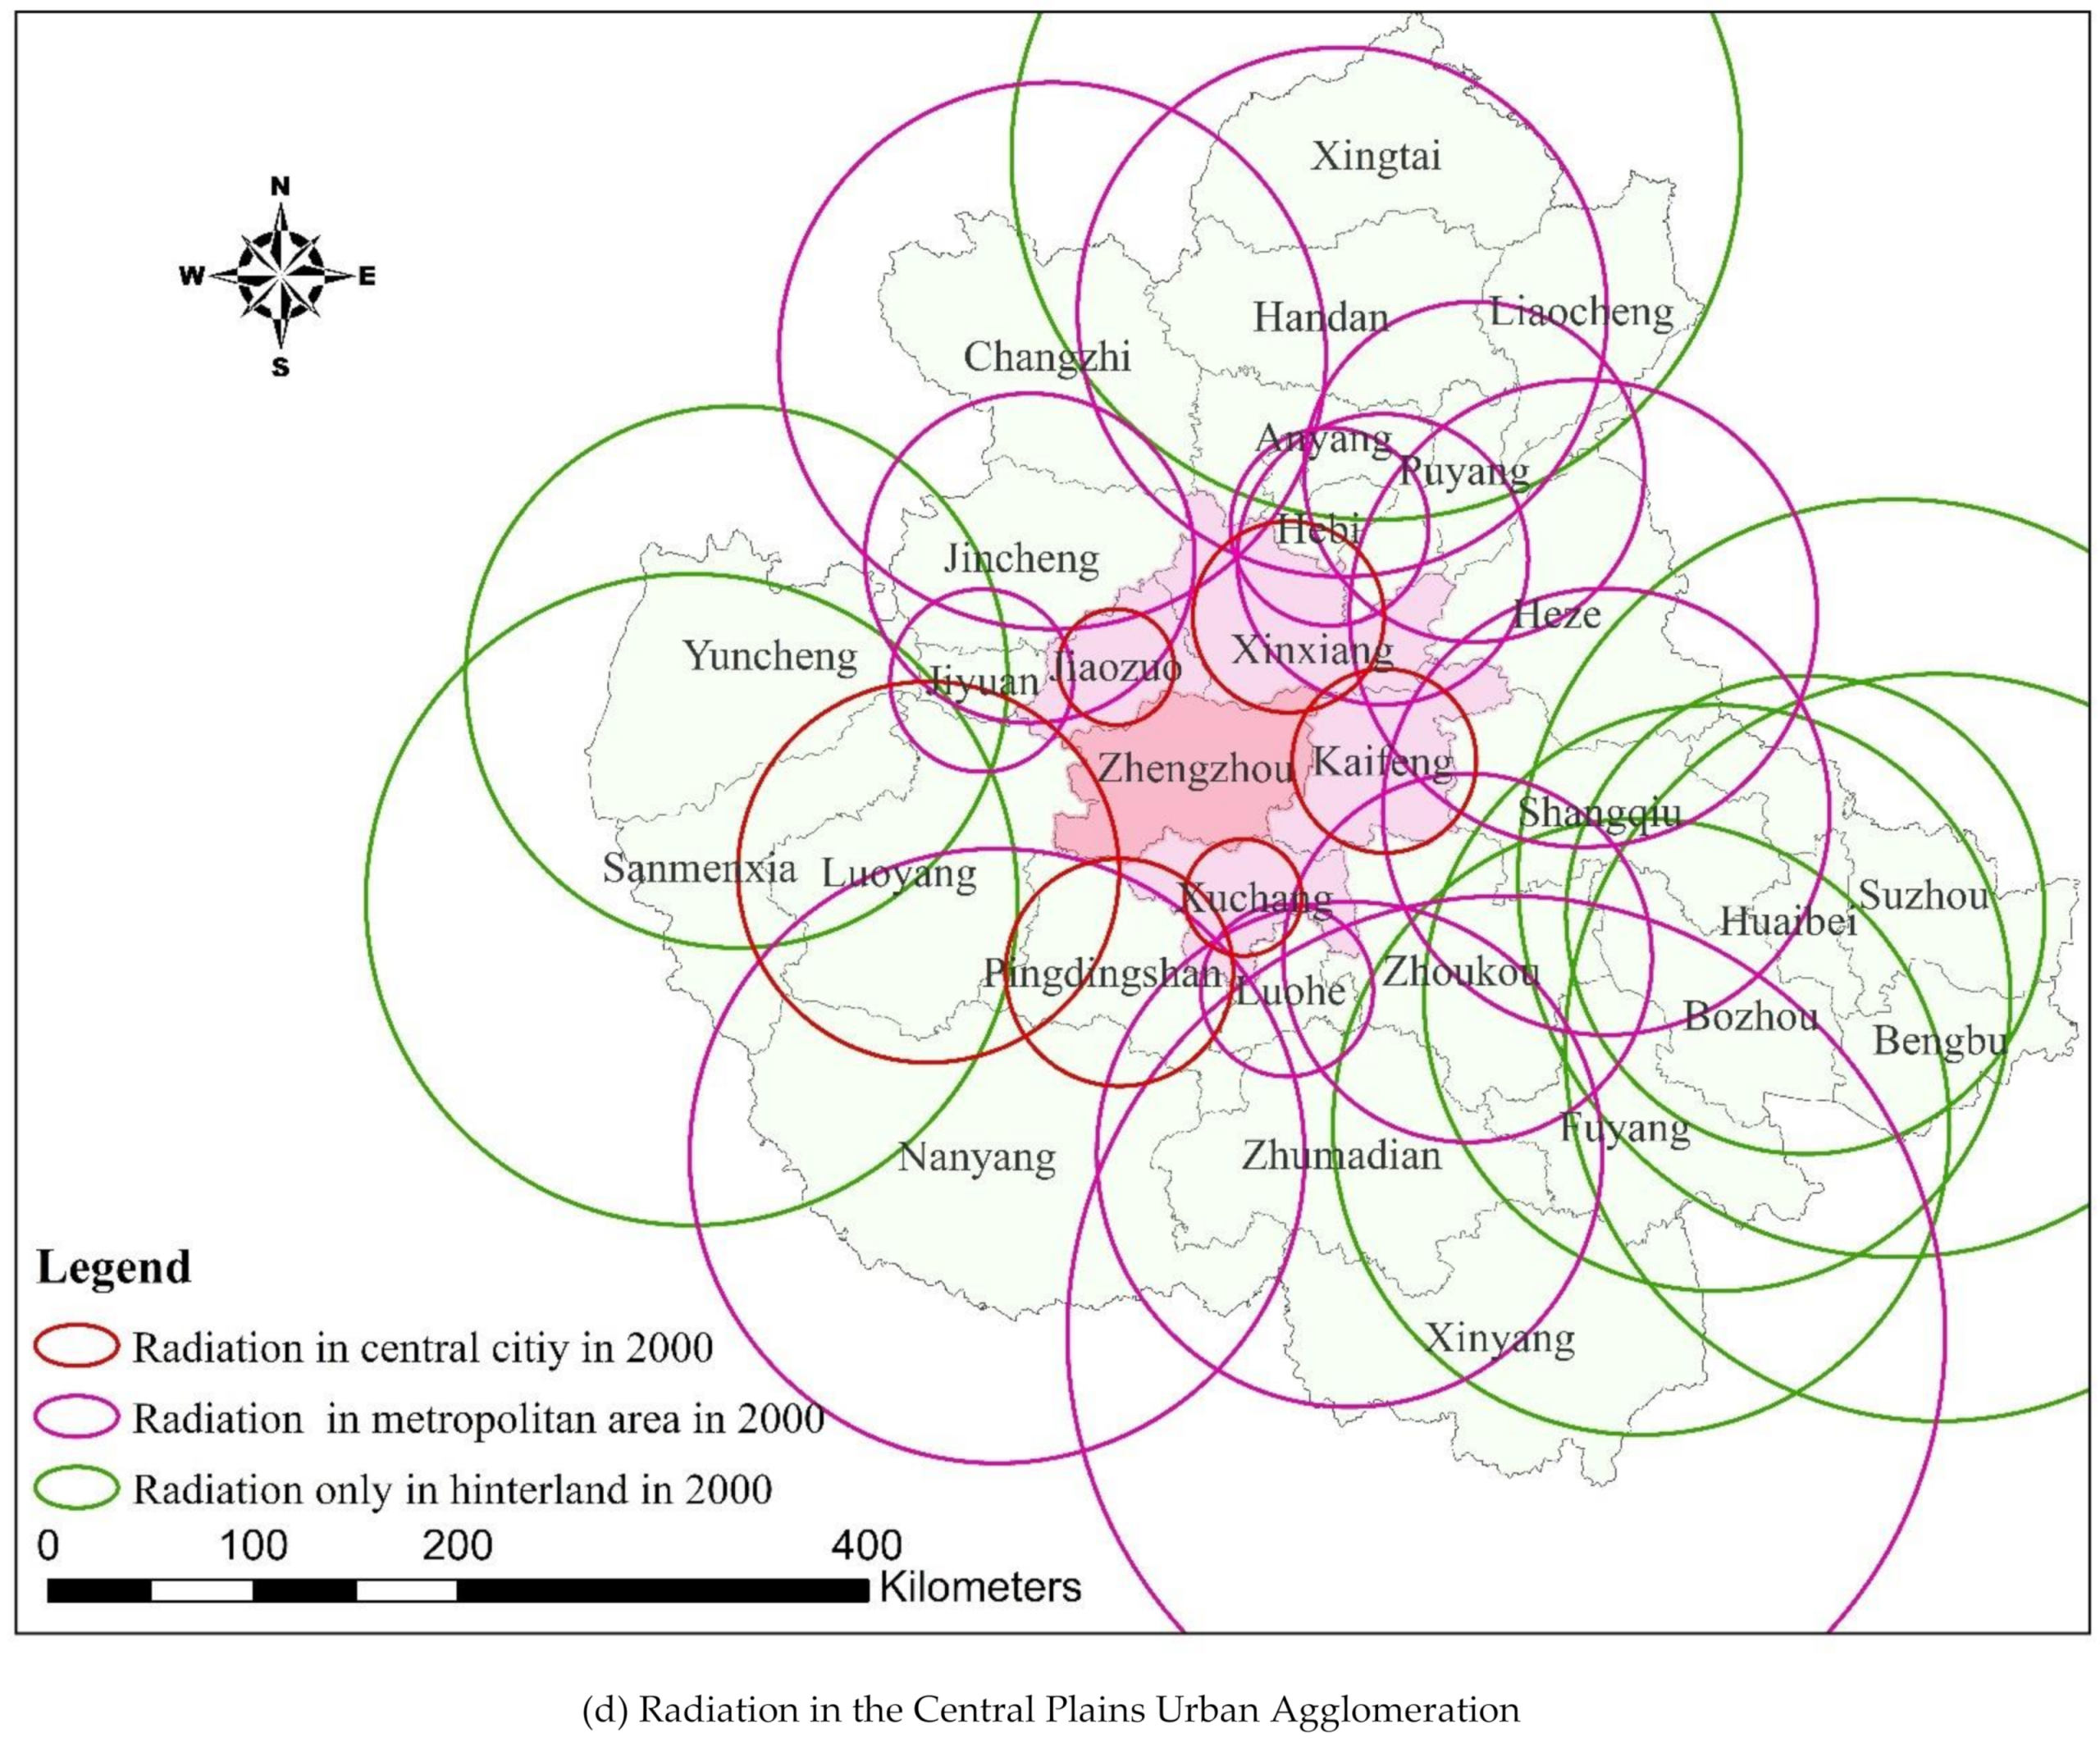
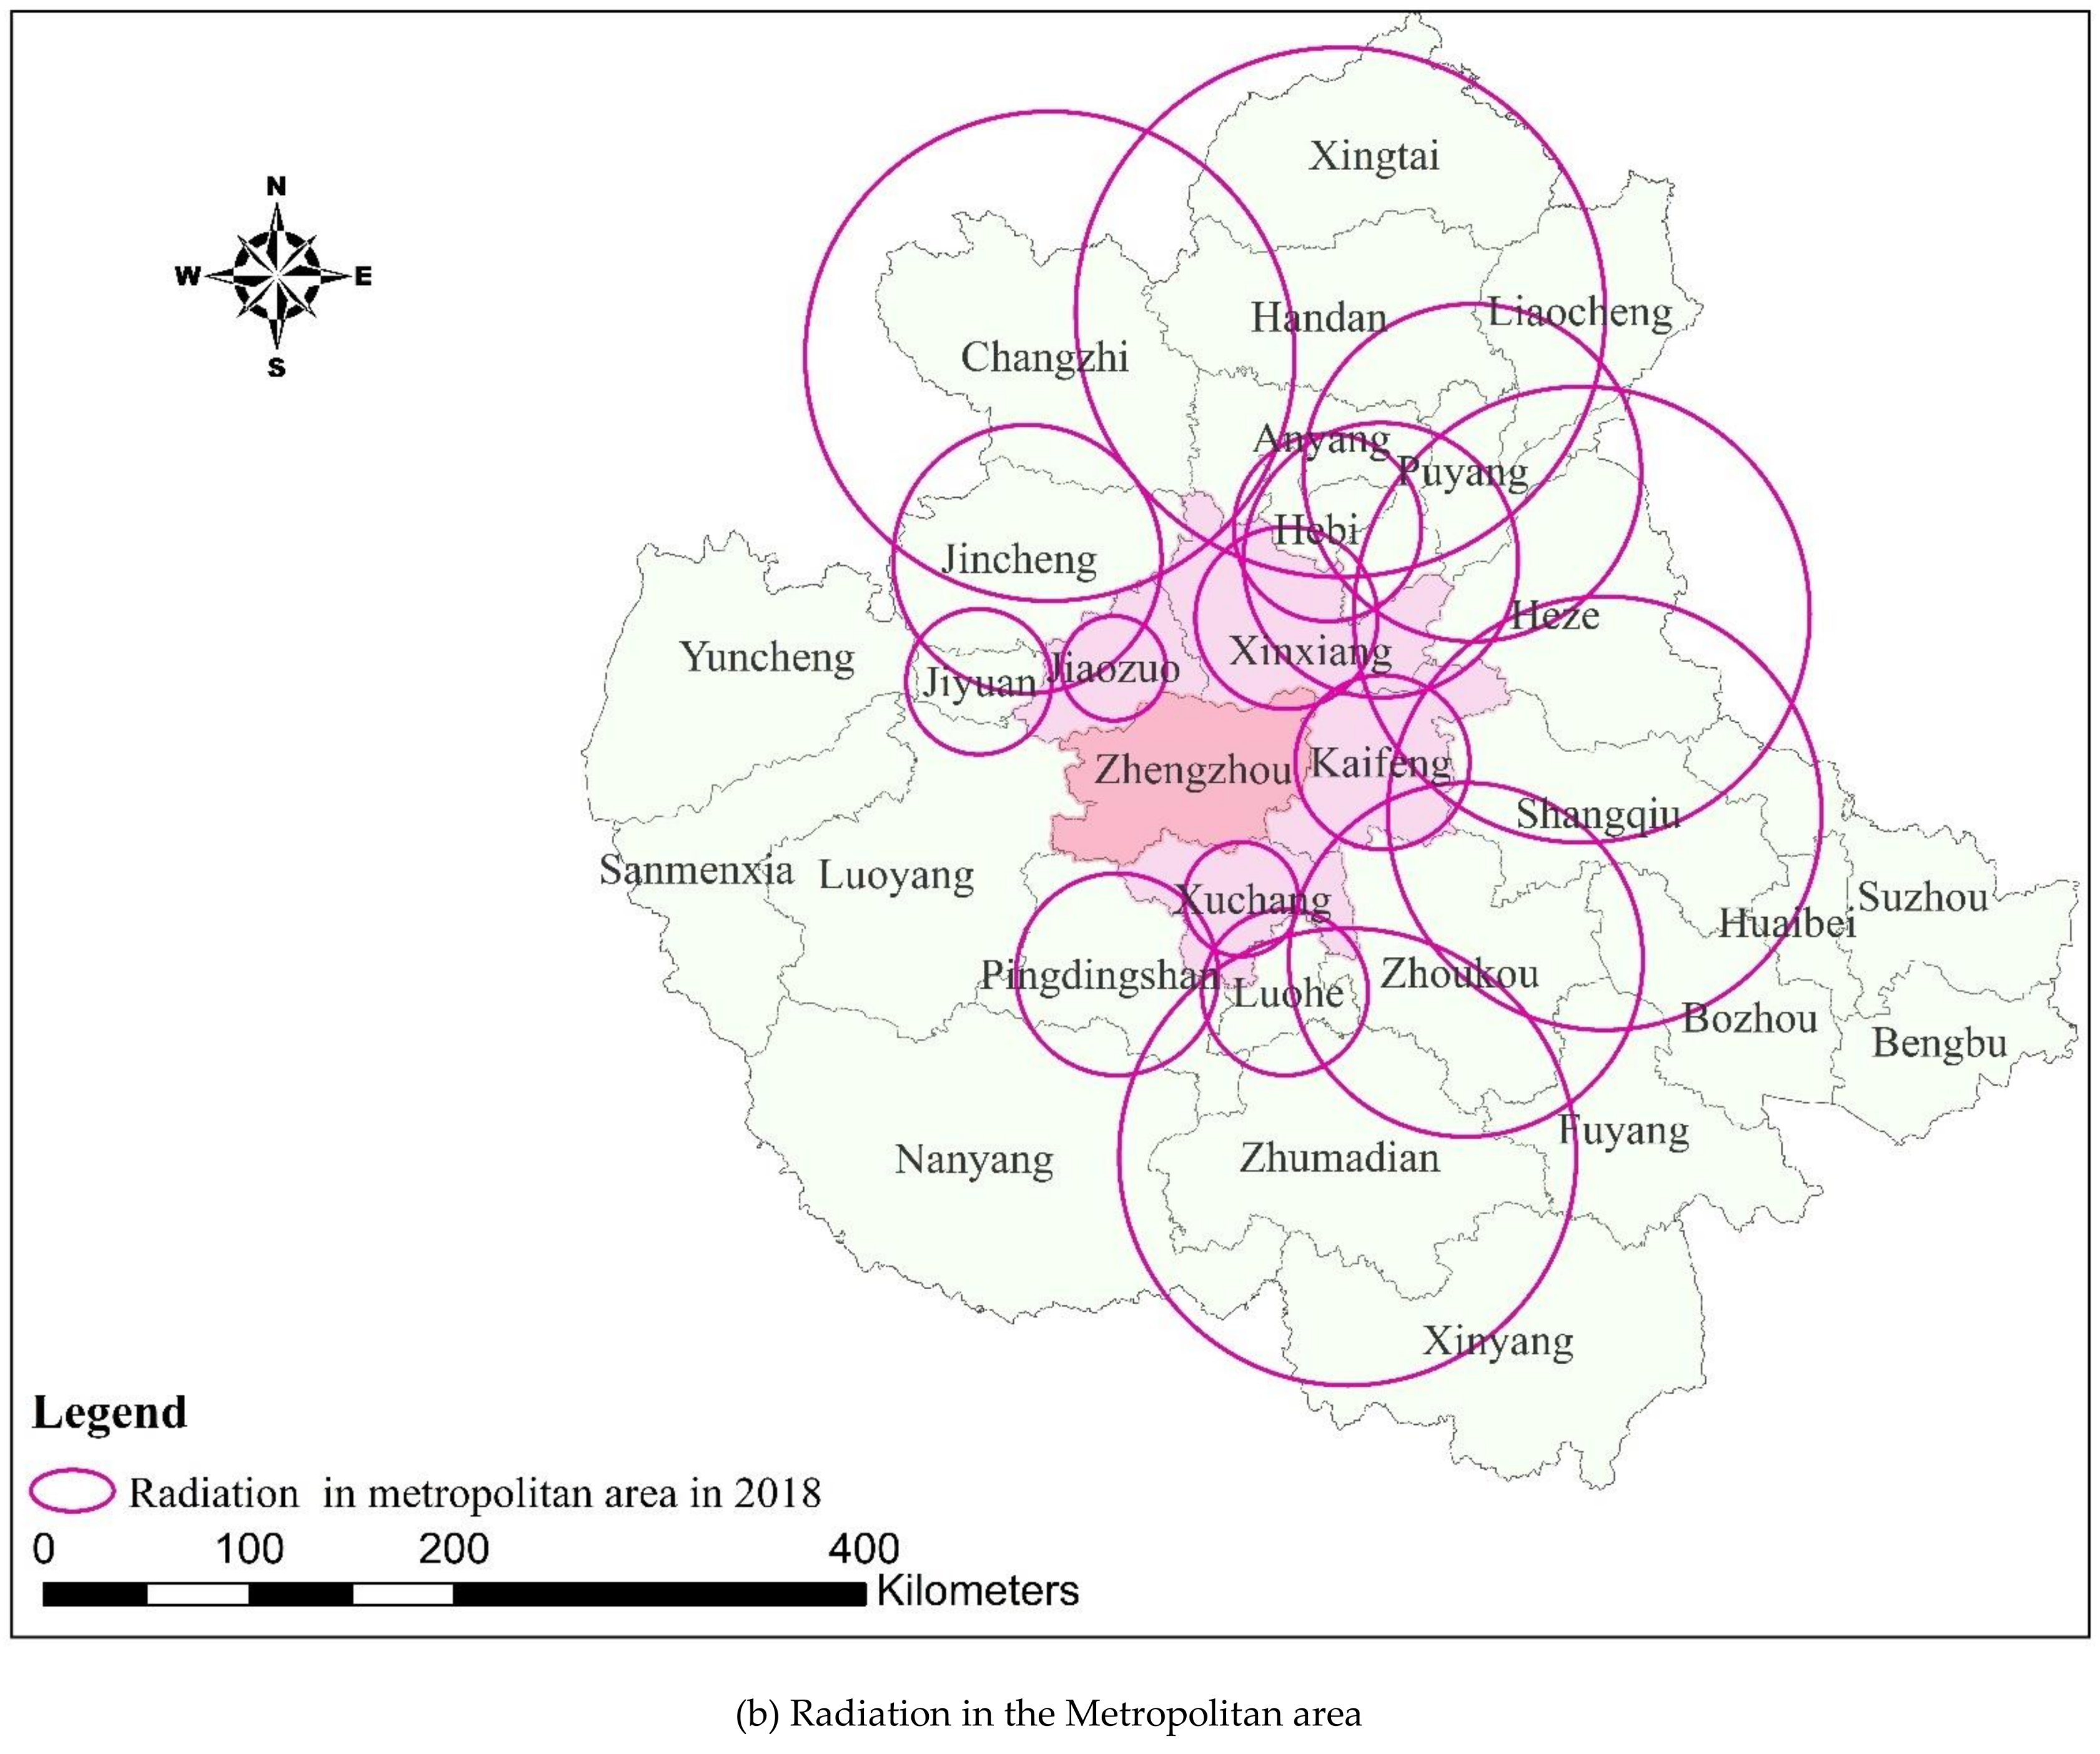
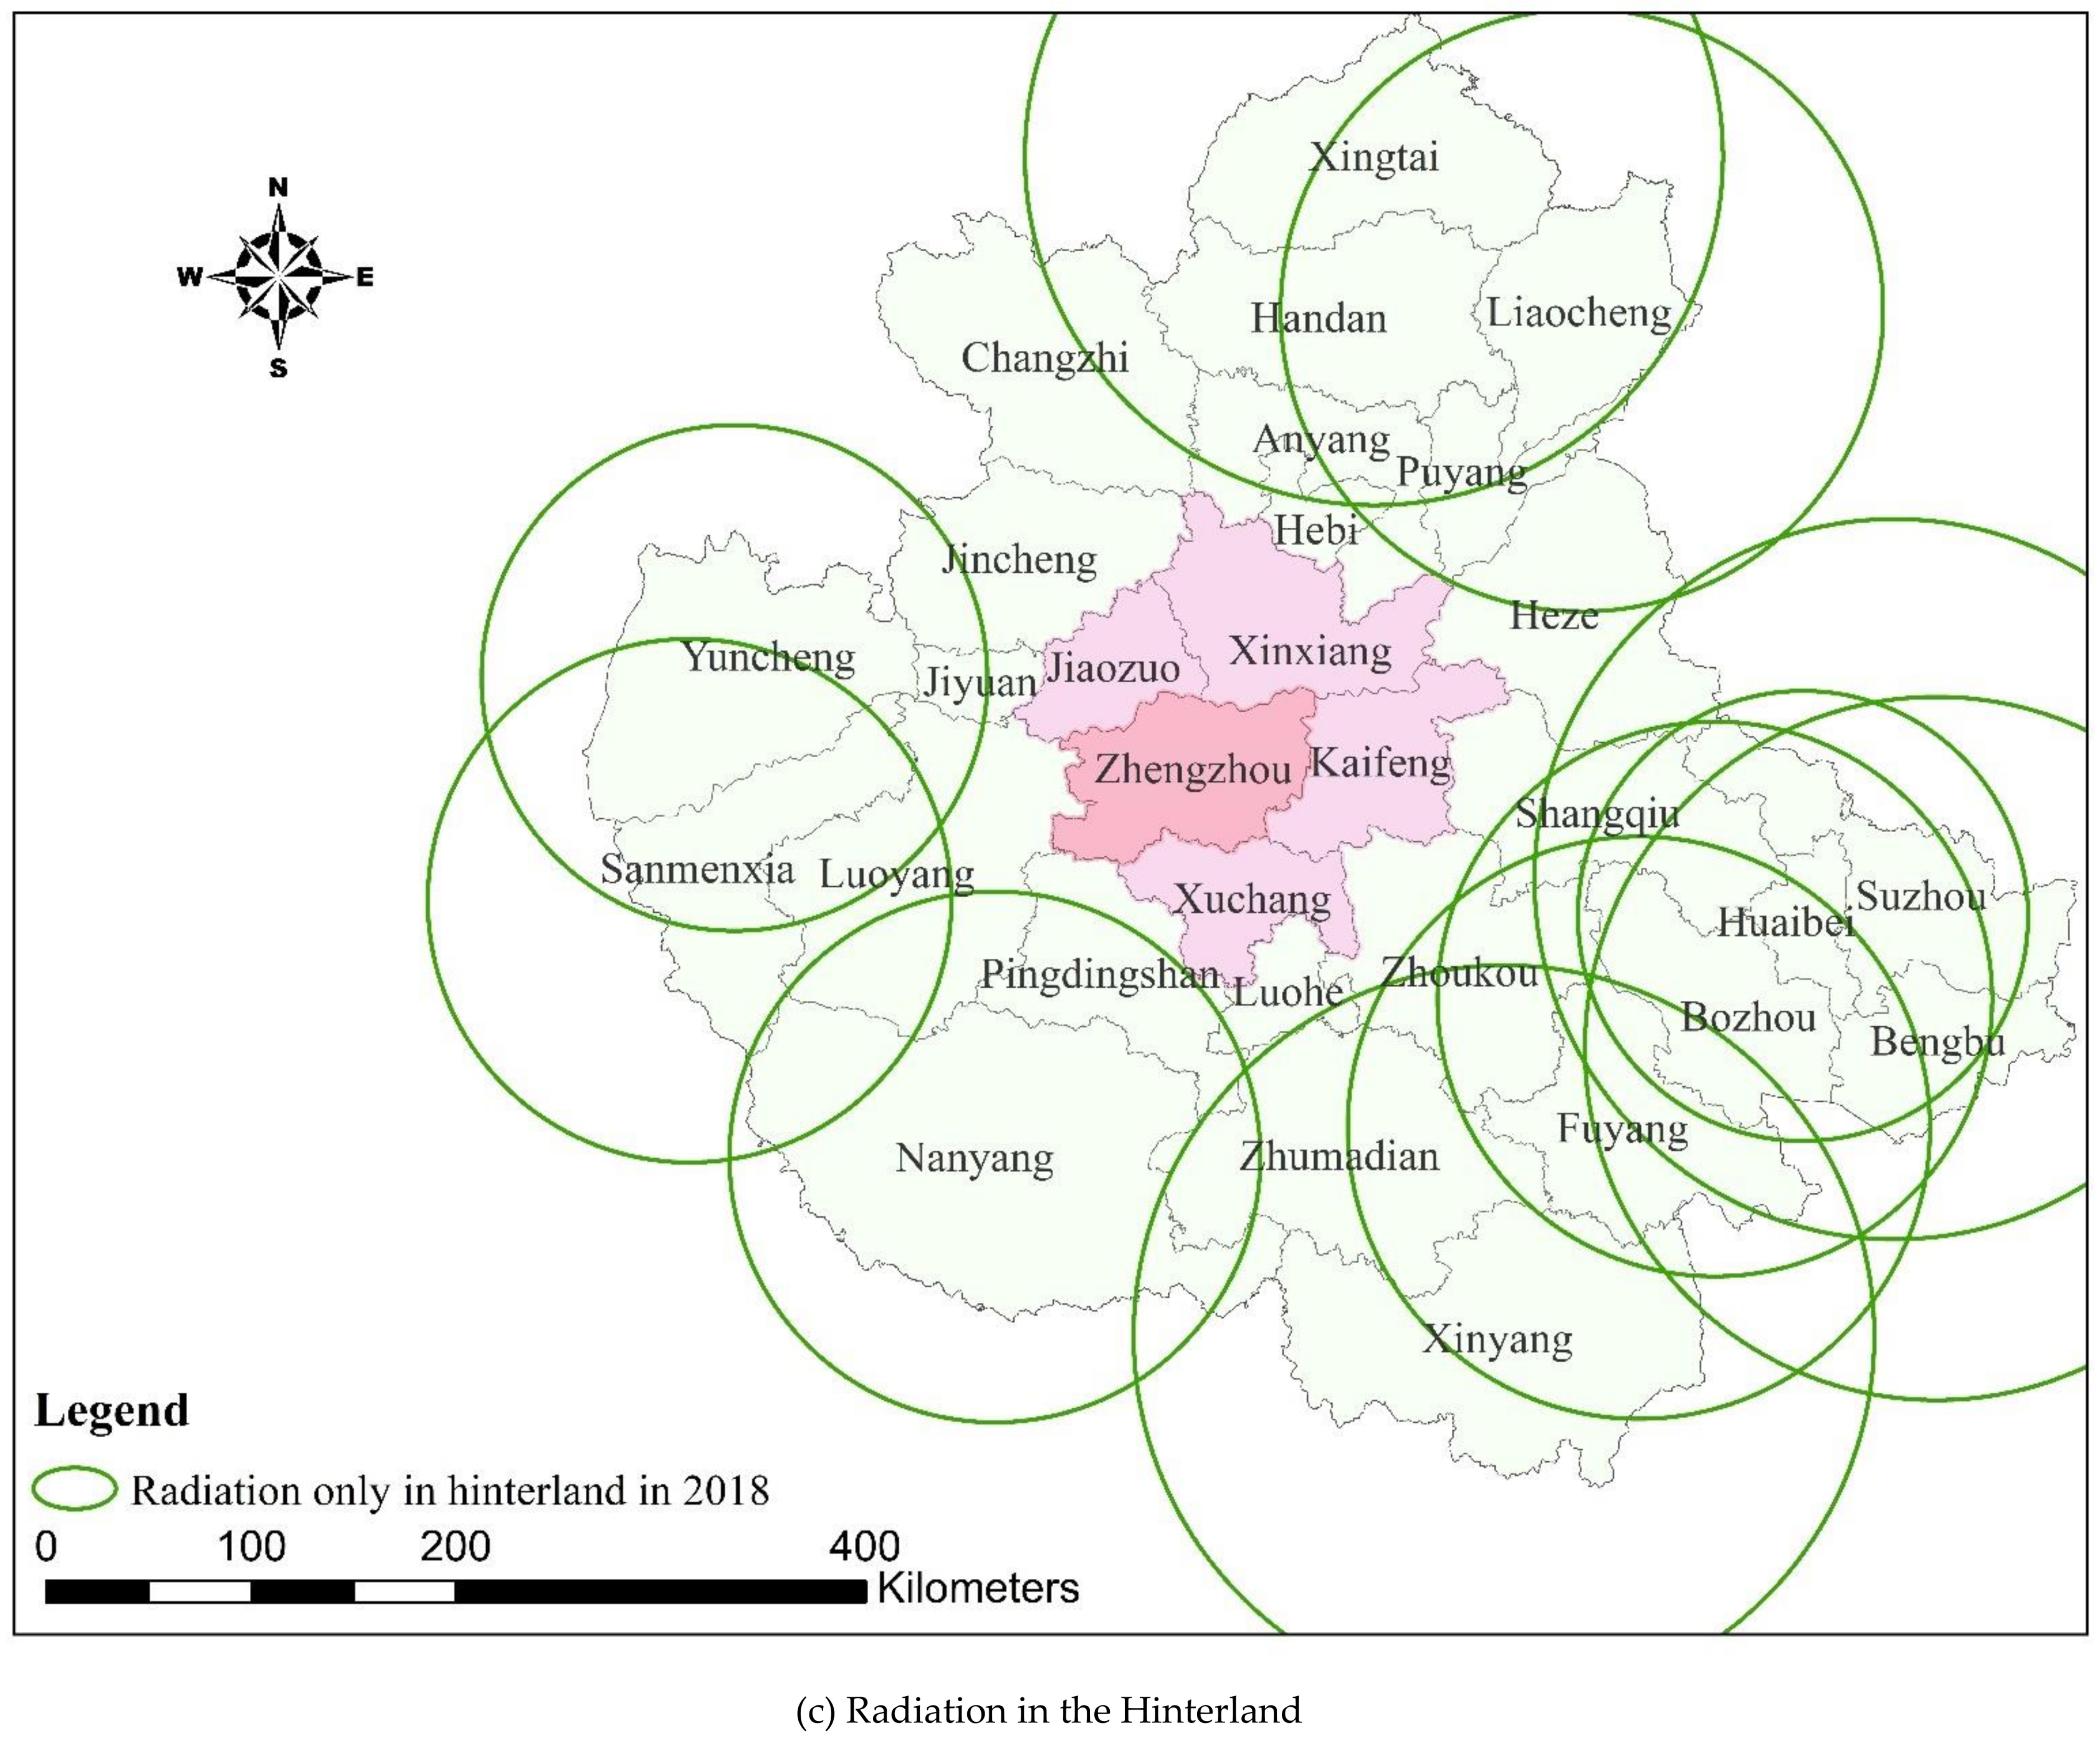
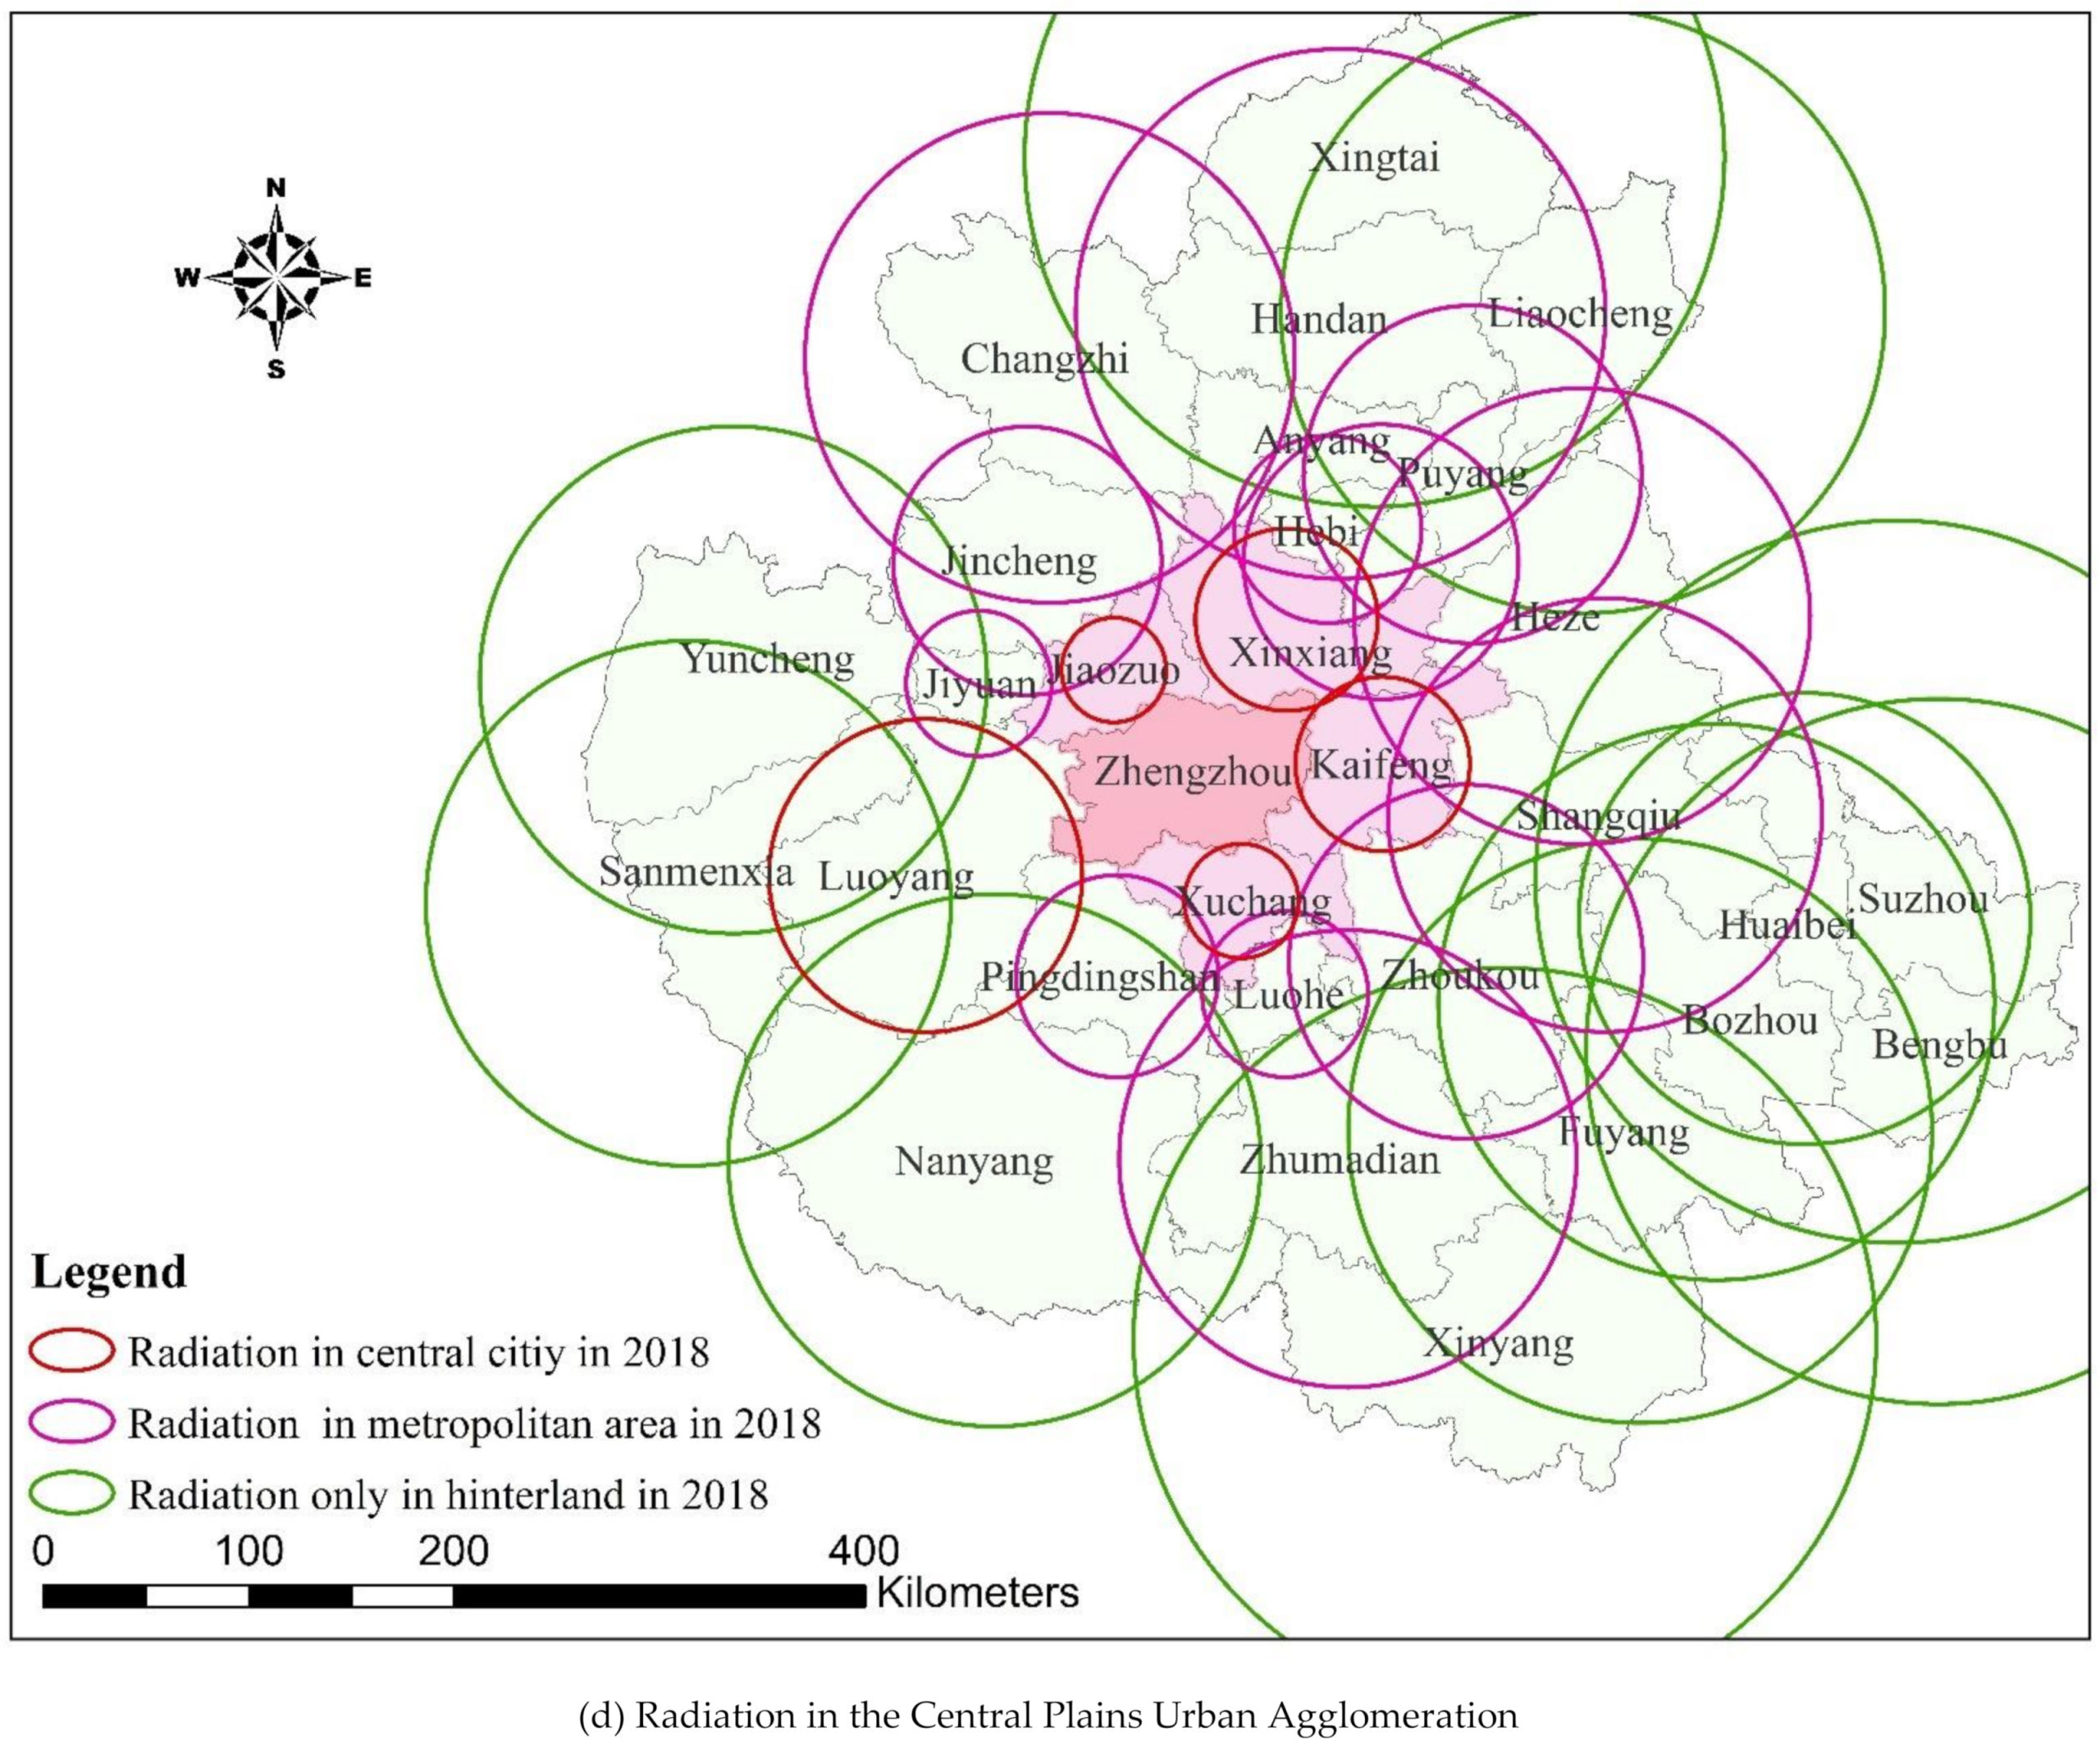
4.3.2. Spatial Radiation Range

As shown in Figure 5 and Figure 6, the radiation range of ESV in the cities and counties of the urban agglomeration after spatial transfer generally reduced between 2000 and 2018. In 2000, in addition to the cities in the metropolitan area that are part of the ESV spatial transfer to the central city, there was also Pingdingshan in the hinterland. However, in 2018, only the cities and counties in the metropolitan area transferred ESV to the central city, as the radiation range of ESV spatial transfer in Pingdingshan became smaller and so could not reach the central city. In 2000, ESV was transferred to 20 cities and counties in the metropolitan area, including Handan, Liaocheng, and Changzhi in the northern hinterland; Heze, Shangqiu, and Puyang in the eastern hinterland; Xinyang, Nanyang, and Zhumadian in the southern hinterland; and Sanmenxia in the western hinterland. However, in 2018, the ESV of Sanmenxia in the west and Xinyang in the south had not radiated to the metropolitan area.
According to the GIS overlay analysis (Figure 4 and Figure 5), the ESVs of cities and counties in the urban agglomeration can exceed their administrative scope after spatial transfer and play an ecological role in urban agglomeration. Additionally, the efficiency coverage formed after the transfer of ESV has obvious spatial agglomeration characteristics and there were many intersection cities. Taking the intersection city as the core, the ESV formed an obvious spatial cluster settlement after the transfer and formed the spatial efficiency pattern of intersection city–cluster–urban agglomeration. For example, in 2000, the Anyang–Hebi–Xinxiang cluster with Hebi city as the intersection, the Jiyuan–Jiaozuo–Jincheng–Luoyang cluster with Jiyuan as the intersection, the Xuchang–Luohe–Pingdingshan cluster with Luohe as the intersection, and the Kaifeng–Zhoukou–Heze–Shangqiu cluster with Shangqiu as the intersection. This efficiency pattern can provide clear spatial guidance for the construction of the ecological network of the Central Plains Urban Agglomeration and for coordinated ecological governance/management.
Based on the radiation range of ESV spatial transfer, it indicated that the concepts of a “big region” and a “big environment” view are needed to help people to establish regional collaborative governance mechanisms to integrate ecosystem-based management among cities for solving transboundary environmental problems caused by urban expansion and the spatial heterogeneity of natural endowments.

5. Discussion

5.1. Implications

Transboundary environmental problems are common problems of urban agglomerations, and they need all-round cooperation among cities in the region to solve these problems [15]. At present, transboundary environmental problems of the Central Plains Urban Agglomeration have become an obstacle to further development, and the existing eco-management pattern conducted by individual cities is insufficient. It is urgent to promote the integration of environmental protection and governance among cities in the region. In this context, ES spatial transfer provides a path to strengthen the co-construction and sharing among cities in the region to release the development momentum of urban agglomerations. However, based on the results, the ESV amount and density of a given city is limited by the ecosystem type and its habitat distribution, which directly influences the ESV spatial transfer amount, intensity and radius among cities, affecting intercity ecological cooperation in the region, causing low efficiency of ES spatial transfer between cities under natural conditions. Diversified cooperation mechanisms should be established to promote the ES flow and integration to strengthen intercity cooperation.
For the work mechanism at intercity ecological construction and protection, we pro-pose to establish a four-level Joint Meeting mechanism among central city, metropolitan area, hinterland, and urban agglomeration to form complementary work programs, to fully implement ecological environmental protection plans and policies conducted by the nation, the basin, and individual cities, and to solve transboundary environmental problems.
In terms of ecological construction, based on the intercity ecosystem status and its ES spatial transfer characteristics, we propose to build a sustainable network of ES “production”-”flow”-”consumption”, which composites of high-quality ES “pro-duction base” systems for ES “supply” in the hinterland, ecological corridor systems for ES “flow” in metropolitan areas, and green infrastructure systems for ES “consumption” in built area inside the city. The system could be considered as nature’s porters to help ES spatial transfer, guiding the cities to perform regional and comparative advantages in ES management and integrate regional ecological resources to achieve intercity cooperation.
For institutional improvement, we propose to establish intercity ecological compensation policies among cities based on the ESV spatial transfer to ensure sustainable ES man-agement through sustainable land use management in ES surplus cities, enabling the ESV transfer sustainably between ES “supply” city and ES “consumption” city to achieve regional sustainable development.

5.2. Contributions and Limitations

At present, studies have connected ESV spatial transfer with interregional ecological linkage analysis and policy making at ecological cooperation in regions [15]. Some of these studies have used ESV spatial transfer analysis as a scientific basis for ecological compensation policy decision support to establish a cooperation pattern between the upstream cities and downstream cities in watershed regions [20,21]. Some studies applied ESV spatial transfer to reveal the emergence of transboundary ecological and environmental problems and seek solutions [15]. In addition, some urban ecological planning and managements were made according to the ESV intercity spatial transfer for human well-being from ecosystem-based management [3,28,43,44]. Urban agglomeration area usually facing transboundary environmental problems because of its remarkable population growth and urbanization. There are urgent demands for ecological integration and cooperation based on ESV spatial movements. However, studies concerning ESV spatial transfer and urban agglomeration area were still rare. This study quantitively evaluated the ESV spatial transfer characteristics of the urban agglomeration area and identified the ESV spatial transfer structure inside Central Plains Urban Agglomeration, and that can provide a scientific basis for intercity cooperation to support all-round environmental policy decision making and solve the transboundary environmental problems in urban agglomeration regions.
In this study, to value the ES is the premise of the ESV spatial transfer calculation. But the value of ES is difficult to be measured accurately, and the uniform criterion, principle, and methods of ES evaluation is lacking until now. In this study, an expert knowledge-based “equivalent value” method was used to convert different types of ESs into monetary values [25,30]. Although it still needs further refinement in this value conversion method [41,45,46], the monetized ES have been improved to be both convenient and analytically effective through validation by interviews of local experts across China [20,21,40,47]. In this study, we evaluated the monetary value of ESs based on the land use /cover, major grain-producing areas in the Central Plains Urban Agglomeration, and China’s main grain prices from 2000 to 2018, and the results were consistent with that of Chen [47], Yang [31], and Wang [32].
In addition, subject to the implementation of the minimum purchase price policy in major grain-producing areas, China’s main grain prices have not changed much since 2004, and this led to the ESV during the research period being relatively stable, resulting in the ESV in the study area mainly changing with the change in urban land use type. Therefore, in the results, it was found that the distribution and change of the ESV were mainly driven by natural resource endowment, social and economic development, and management policy differences. Firstly, there were differences in the types of natural ecosystems and their distribution. The northwest and the southern parts of the “hinterland” mainly contained forest, wetland, water systems, and other ecosystems, with a high ESV per unit area, making the region the main distribution area of high ESV. There were more agricultural lands in the metropolitan area, with a medium ESV per unit area and a basically stable scale of agricultural land, which was also the basis for the stability of the ESV in the metropolitan area. The central city (Zhengzhou) consisted of highly concentrated “construction land area”, with a low ESV per unit area. Secondly, there were differences in the urbanization levels of cities in the Central Plains Urban Agglomeration. With the evolution of the spatial circle structure of the Central Plains Urban Agglomeration, the central city (Zhengzhou), the regional central city, and the surrounding towns in its hinterland have gradually entered the stage of polarization development [34,35], and the social and economic development level, urban function, and intensity of urban development and construction of each city have initially formed a spatial circle structure of central city > metropolitan area > hinterland. Moreover, urban expansion and economic growth turns a lot of land types into construction land, especially farmland, forest, river/lakes, wetland…, these land types are high-ESV land, the increase in urban construction land has led to resulting in the decrease in high-ESV land, bringing about the spatial differences in ESV change and making the central city the main ESV reduction area and one with a lower ESV density. Finally, there were differences in the spatial protection policies within urban agglomerations. In recent years, China has made unprecedented efforts to protect the ecological environment of ecological spaces. In Central Plains Urban Agglomeration, the government has made a series of eco-plans and a series of ecological restoration and construction projects to protect the mountains, forests, farmland, river/lakes, grassland. With the implementation of these plans and projects, the ecosystem quality has been improved as well as the ESV density. Such initiatives include the Tongbai–Dabie Mountains Ecological Barrier Area, the Funiu Mountains Ecological Barrier Area, the Taihang Mountains Ecological Barrier Area, the Ecological Corridor in the Middle Route of the South-to-North Water Diversion Project, the Ecological Corridor Along the Middle and Lower Reaches of the Yellow River, the Ecological Corridor of the Old Course of the Yellow River in the Ming–Qing Dynasties, and the “Three Barriers and Four Corridors” Ecological Space of Ecological Economic Corridor Along the Huaihe River. The “Three Barriers and Four Corridors” Ecological Space has become the main distribution area of high ESV. As the main distribution areas of ecological space, the northwest, south, and central parts of the hinterland have also become the main growth areas of ESV. In brief, the natural endowments, urbanization state, and management policies varied in the different areas, which resulted in the spatial differences in the ESV amount, distribution, and demands in the Central Plains Urban Agglomeration. The spatial mismatch caused by these factors between the high ESV density area, also known as the high ESV “supply” area, and the low ESV density area Zhengzhou, also known as the high ESV “demand” area, created a realistic need for an integrated management of ES in the urban agglomeration based on ESV spatial transfer.

6. Conclusions

This paper draws the following conclusions:
(1)
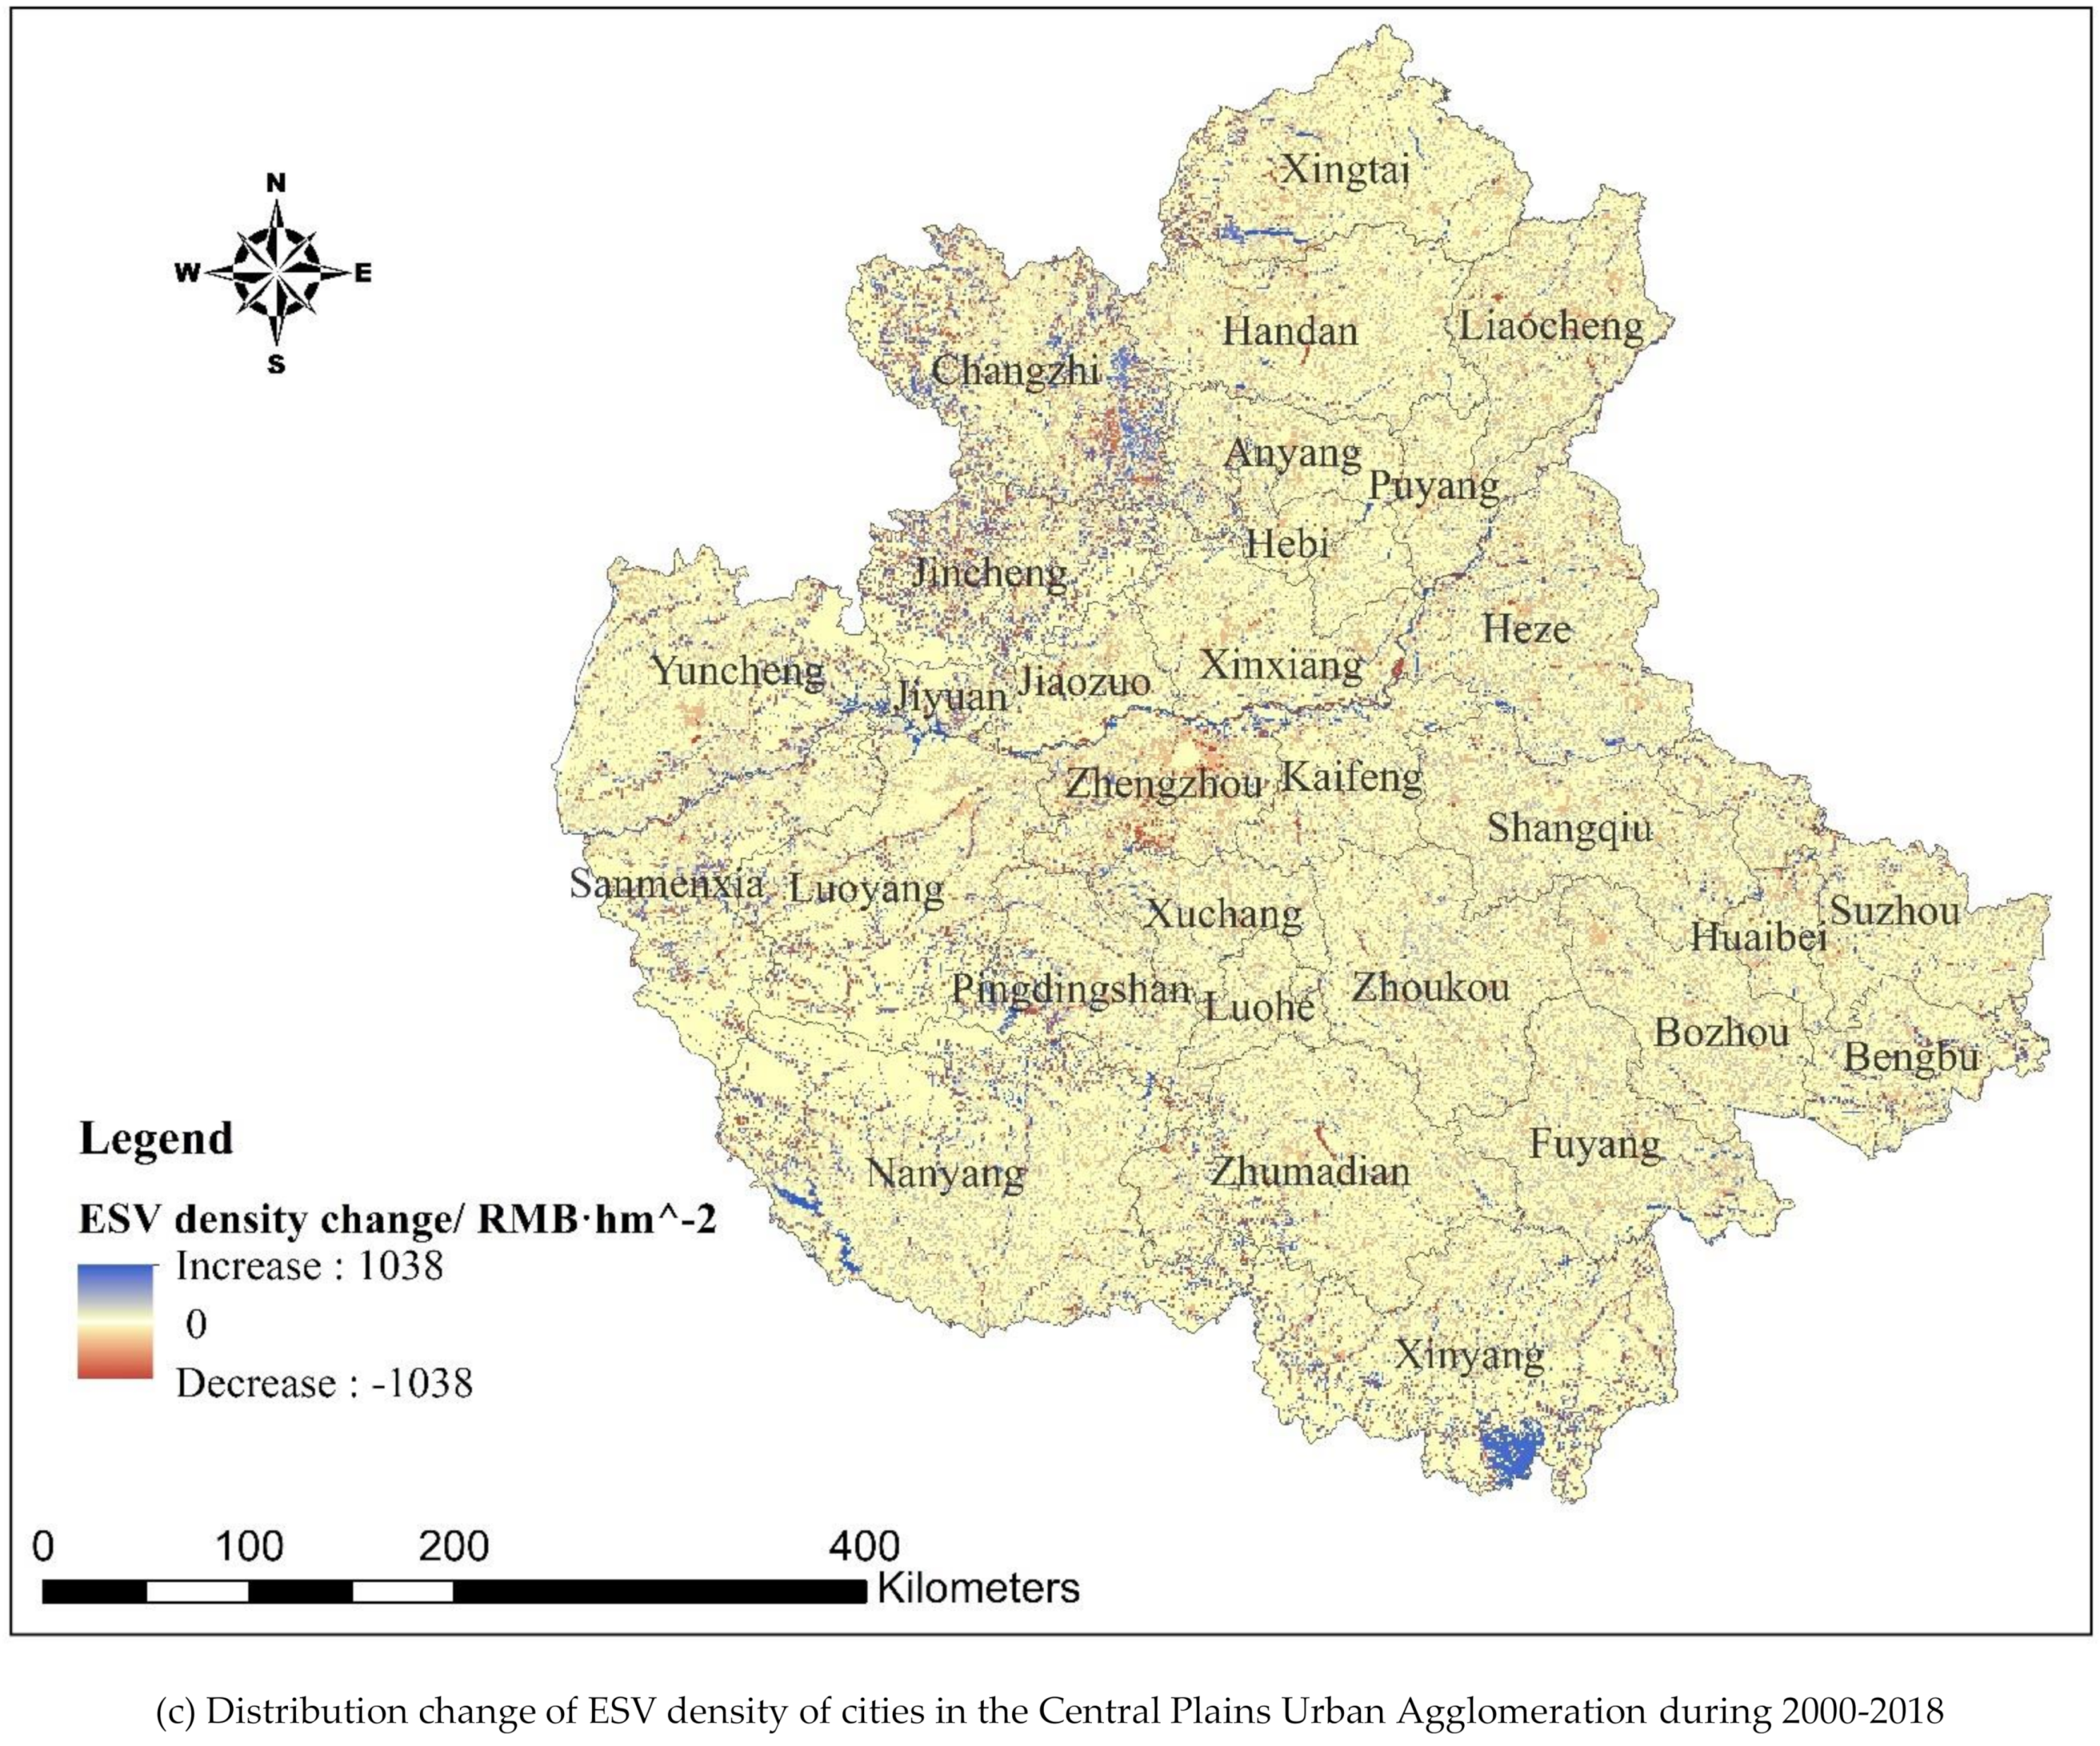
The ESV distributions presented a trend of hinterland > metropolitan area > central city due to the spatial heterogeneity of natural resource endowment and socioeconomic development level in the Central Plains Urban Agglomeration. Additionally, the ESV could naturally be transferred from the hinterland, the main ESV transferred-out area showing increases, and the metropolitan area to the central city. The distributions of transferred ESV presented a trend of hinterland > metropolitan area.
(2)
The spatial transfer intensity of ESV from the hinterland to the central city was reduced, indicating a “weakening” ecological correlation between the hinterland and the central city. The spatial transfer intensity of ESV from the metropolitan area to the central city was increased due to the preliminary integration of ecological protection and governance among cities in the metropolitan area, which could ensure the central city benefit from cities in this region in terms of ES.
(3)
Spatial transfer was a pathway of ES delivery from the hinterland and the metropolitan area to the central city. But only very small part of ESV was delivered under natural conditions in this paper. There is still great potential for strengthening all-round intercity cooperation at the ecological protection and governance among the hinterland, the metropolitan area, and the central city, to achieve sustainable development of the urban agglomeration area.
(4)
The ESV spatial transfer radius and the radiation range of each city was tended to shrink. The ESV spatial transfer radius of most cities in the hinterland and the metropolitan area could not reach the central city, resulting in the inefficiency of the ESV spatial integration within the Central Plains Urban Agglomeration.
(5)
According to the characteristics of ESV spatial transfer, some works could be suggested to accelerate the spatial movement of ESV as well as the ecosystem-derived material and energy to provide an ecological path, solving the transboundary problems and increasing the development momentum of the Central Plains Urban Agglomeration: Firstly, the concepts of a “big region” and a “big environment” view should be established. Secondly, the intercity integration of ecological protection and governance should be promoted, especially a long-run administrative mechanism should be promoted to strengthen all-round cooperation among cities. Thirdly, an ecosystem network consisting of high-quality ES “production base” system, well connected “ecological corridor” system and feasible ES “consumption” infrastructures should be built based on current “conservation land” system and ecological infrastructures in prospective to provide carrier for ESV transfer.

Author Contributions

Conceptualization, M.L. and J.F.; Data curation, Y.W.; Formal analysis, J.F.; Methodology, M.L.; Resources, C.H.; Software, C.H.; Validation, J.F.; Writing–original draft, M.L. All authors have read and agreed to the published version of the manuscript.

Funding

This research was funded by National Natural Science Foundation of China (grant number 41901238, grant number 41801103), Foundation of the Education Department of Henan Province (grant number 2019-ZZJH-094), Scientific Research and Innovation Foundation of Henan University of Animal Husbandry and Economy (grant number XKYCXJJ2020016). And the APC was funded by National Natural Science Foundation of China, grant number 41901238.

Institutional Review Board Statement

Not applicable.

Informed Consent Statement

Not applicable.

Data Availability Statement

Data is contained within the article. For detailed information of each part, please contact the corresponding author.

Acknowledgments

The authors would like to thank Professor Xiaojian Li for critically reviewing the manuscript, Yuanzheng Li for excellent technical support and Qizheng Mao for material support and spiritual encouragement. Specially, we would like to thank the editor Maxine Tian and the reviewers for their efforts, comments and suggestions to improve the paper.

Conflicts of Interest

The authors declare no conflict of interest.

References

  1. Fang, C. Important Progress and Prospects of China’s Urbanization and Urban Agglomeration in the Past 40 Years of Reform and Opening-Up. Econ. Geogr. 2018, 38, 1–9. [Google Scholar] [CrossRef]
  2. Yao, S.; Zhou, C.; Zhang, T.; Jin, W.; Shi, C. New Features and Ideas of China’s Urban Agglomerations in the 21st Century. Urban Insight 2017, 2, 26–31. [Google Scholar] [CrossRef]
  3. Zhang, D.; Huang, Q.; He, C.; Yin, D.; Liu, Z. Planning urban landscape to maintain key ecosystem services in a rapidly urbanizing area: A scenario analysis in the Beijing-Tianjin-Hebei urban agglomeration, China. Ecol. Indic. 2019, 96, 559–571. [Google Scholar] [CrossRef]
  4. Chen, Y.; Li, X.; Zhang, Y.; Huang, M. Tele-connecting China’s future urban growth to impacts on ecosystem services under the shared socioeconomic pathways. Sci. Total Environ. 2019, 652, 765–779. [Google Scholar] [CrossRef] [PubMed]
  5. Fang, C.; Song, J.; Zhang, Q.; Li, M. The Formation, Development and Spatial Heterogeneity Patterns for the Structures System of Urban Agglomerations in China. Acta Geogr. Sin. 2005, 60, 827–840. [Google Scholar] [CrossRef]
  6. Ye, C.; Liu, Z.; Cai, W.; Chen, R.; Liu, L.; Cai, Y. Spatial Production and Governance of Urban Agglomeration in China 2000–2015: Yangtze River Delta as a Case. Sustainability 2019, 11, 1343. [Google Scholar] [CrossRef] [Green Version]
  7. Liu, M. Ecological Protection and High-Quality Development in the Yellow River Basin Have Become National Strategies. Available online: https://baijiahao.baidu.com/s?id=1645427504296794897&wfr=spider&for=pc (accessed on 23 September 2019).
  8. Liu, R. How to Coordinate Development along the Yellow River? A Corridor for Advanced Manufacturing and a Cultural Tourism Belt Will be Built along the Yellow River. Available online: https://news.dahebao.cn/dahe/appcommunity/1592160 (accessed on 1 November 2020).
  9. National Development and Reform Commission. Development Planning of the Central Plains Urban Agglomeration. Available online: https://www.ndrc.gov.cn/xxgk/zcfb/ghwb/201701/t20170105_962218.html (accessed on 5 January 2017).
  10. Gao, J.; Fan, X. Connotation, Traits and Research Trends of Eco-Assets. Res. Environ. Sci. 2007, 20, 137–143. [Google Scholar]
  11. Ouyang, Z.; Wang, R.; Zhao, J. Ecosystem services and their economic valuation. Chin. J. Appl. Ecol. 1999, 10, 635–640. [Google Scholar] [CrossRef]
  12. Yu, Y.; Han, P.; Yang, N.; Li, X.; Guo, J. Research of Carrying Capacity on Resource and environment in Core Cities of Central Henan Urban Agglomeration. Acta Sci. Nat. Univ. Pekin. 2018, 54, 407–414. [Google Scholar] [CrossRef]
  13. Shi, P.; Zhang, S.; Pan, Y.; Wang, J.; Hong, S.; Shen, P.; Zhu, W.; Ye, T. Ecosystem Capital and Regional Sustainable Development. J. Beijing Norm. Univ. (Soc. Sci.) 2005, 2, 131–137. [Google Scholar]
  14. Loomes, R.; O’Neill, K. Nature’s Services: Societal Dependence on Natural Ecosystems. Pac. Conserv. Biol. 1997, 6, 220–221. [Google Scholar] [CrossRef] [Green Version]
  15. Cai, W.; Wu, T.; Jiang, W.; Peng, W.; Cai, Y. Integrating Ecosystem Services Supply—Demand and Spatial Relationships for Intercity Cooperation: A Case Study of the Yangtze River Delta. Sustainability 2020, 12, 4131. [Google Scholar] [CrossRef]
  16. Luo, Q.; Zhou, J.; Li, Z.; Yu, B. Spatial differences of ecosystem services and their driving factors: A comparation analysis among three urban agglomerations in China’s Yangtze River Economic Belt. Sci. Total Environ. 2020, 725, 138452. [Google Scholar] [CrossRef] [PubMed]
  17. Ouyang, X.; He, Q.; Zhu, X. Simulation of Impacts of Urban Agglomeration Land Use Change on Ecosystem Services Value under Multi-Scenarios: Case Study in Changsha-Zhuzhou-Xiangtan Urban agglomeration. Econ. Geogr. 2020, 40, 10. [Google Scholar] [CrossRef]
  18. Pickard, B.R.; Van Berkel, D.; Petrasova, A.; Meentemeyer, R.K. Forecasts of urbanization scenarios reveal trade-offs between landscape change and ecosystem services. Landsc. Ecol. 2016, 32, 617–634. [Google Scholar] [CrossRef]
  19. Fan, X.; Gao, J.; WEN, W. ExplOratOry Study On ECO-Assets Transferring and the VaIuating Models. Res. Environ. Sci. 2007, 20, 5. [Google Scholar]
  20. Wen, Y.; Ma, L.; Xie, J.; Ma, Y.; Zhu, Y.; Liu, G. Quantitative Research of Ecosystem Service Function Space Transfer-A Case of Guanting Reservoir Watershed Region. Environ. Prot. Sci. 2018, 44, 8. [Google Scholar]
  21. Qiao, X.; Yang, Y.; Yang, D. Assessment of Ecosystem Service value Transfer in Weigan River Basin, Xinjiang, China. J. Desert Res. 2011, 31, 7. [Google Scholar]
  22. Guo, Z.; Li, D. Transfer of Value of Biodiversity and Method of Valuation of Process-Benefit. Sci. Technol. Rev. 1997, 58–60. [Google Scholar]
  23. Matthias, S.; Koellner, T.; Alkemade, R.; Arnhold, S.; Bagstad, K.J.; Erb, K.H.; Frank, K.; Kastner, T.; Kissinger, M.; Liu, J. Interregional flows of ecosystem services: Concepts, typology and four cases. Ecosyst. Serv. 2018, 31, 231–241. [Google Scholar] [CrossRef]
  24. Guo, Z.; Gan, Y. Some scientific questions for ecosystem services. Biodivers. Sci. 2003, 11, 7. [Google Scholar]
  25. Burkhard, B.; Kandziora, M.; Hou, Y.; Müller, F. Ecosystem Service Potentials, Flows and Demands—Concepts for Spatial Localisation, Indication and Quantification. Landsc. Online 2014, 34, 1–32. [Google Scholar] [CrossRef]
  26. Li, B.; Chen, D.; Wu, S.; Zhou, S.; Wang, T.; Chen, H. Spatio-temporal assessment of urbanization impacts on ecosystem services: Case study of Nanjing City, China. Ecol. Indic. 2016, 71, 416–427. [Google Scholar] [CrossRef]
  27. Breslow, S.J.; Allen, M.; Holstein, D.; Sojka, B.; Barnea, R.; Basurto, X.; Carothers, C.; Charnley, S.; Coulthard, S.; Dolšak, N.; et al. Evaluating indicators of human well-being for ecosystem-based management. Ecosyst. Health Sustain. 2017, 3, 1–18. [Google Scholar] [CrossRef]
  28. Chen, J.; Jiang, B.; Bai, Y.; Xu, X.; Alatalo, J.M. Quantifying ecosystem services supply and demand shortfalls and mismatches for management optimisation. Sci. Total Environ. 2019, 650, 1426–1439. [Google Scholar] [CrossRef]
  29. Zhang, S.; Chen, Y.; Li, X.; Pan, Y.; Li, J.; Shi, P. Measurement of Ecological Capital and Ecological Construction in Inner Mongolia. Resour. Sci. 2004, 26, 22–28. [Google Scholar] [CrossRef]
  30. Burkhard, B.; Kroll, F.; Nedkov, S.; Müller, F. Mapping ecosystem service supply, demand and budgets. Ecol. Indic. 2012, 21, 17–29. [Google Scholar] [CrossRef]
  31. Yang, C. Study on Spatial-Temporal Differentiation of Land Ecosystem Service Value and Driving Factors in Central Plains Urban Agglomeration. Master’s Thesis, Hebei University of Economics and Business, Shijiazhuang, China, 2018. [Google Scholar]
  32. Wang, W.; Sun, T.; Wang, J. Annual Dynamic Monitoring of Regional Ecosystem Service Value Based on Multi-source Remote Sensing Data: A Case of Central Plains Urban Agglomeration Region. Sci. Geogr. Sin. 2019, 39, 680–687. [Google Scholar] [CrossRef]
  33. Liu, J.; Sun, H.; Zhan, W. Analysis on driving forces of ecological capital in the Yangtze River Delta region. Res. Soil Water Conserv. 2013, 20, 5. [Google Scholar]
  34. Gao, J. New Characteristics and New Requirements for the Development of Central Plains Urban Agglomeration. Available online: http://newpaper.dahe.cn/hnrb/html/2017-03/30/content_133017.htm (accessed on 30 March 2017).
  35. Lu, J. On the Spatial Pattern Evolution of Central Plains Urban Agglomeration under the New Strategic Orientation. J. Henan Univ. Technol. 2018, 14, 9. [Google Scholar] [CrossRef]
  36. Miao, C.; Wang, H. On the direction and intensity of urban economic contacts in Henan Province. Geogr. Res. 2006, 25, 222–232. [Google Scholar] [CrossRef]
  37. Wang, F.; Lv, J. The evaluation and spatial-temporal evolvement of the city competitiveness of Zhongyuan Urban Agglomeration. Geogr. Res. 2011, 30, 49–60. [Google Scholar] [CrossRef]
  38. Lv, B.; Sun, L.; Tan, W. Urban Carrying Capacity Evaluation of Zhongyuan city Agglomeration. China Popul. Resour. Environ. 2008, 18, 53–58. [Google Scholar] [CrossRef]
  39. Luo, Y.; Lu, Y.; Fu, B.; Zhang, Q.; Li, T.; Hu, W.; Comber, A. Half century change of interactions among ecosystem services driven by ecological restoration: Quantification and policy implications at a watershed scale in the Chinese Loess Plateau. Sci. Total Environ. 2019, 651, 2546–2557. [Google Scholar] [CrossRef] [PubMed] [Green Version]
  40. Xie, G.; Lu, C.; Leng, Y.; Zheng, D.; Li, S. Ecological assets valuation of the Tibetan Plateau. J. Nat. Resour. 2003, 18, 8. [Google Scholar]
  41. Xie, G.; Zhang, C.; Zhang, L.; Chen, W.; Li, S. Improvement of the Evaluation Method for Ecosystem Service Value Based on Per Unit Area. J. Nat. Resour. 2015, 30, 12. [Google Scholar] [CrossRef]
  42. Pan, Y.; Shi, P.; Zhu, W.; Gu, X.; Fan, Y.; Li, J. Valuation of the Ecological Assets by Terrestrial Ecosystems in China Based on Remote Sensing. Sci. China: Ser. D 2004, 34, 10. [Google Scholar] [CrossRef]
  43. Shen, J.; Wang, Y. Allocating and mapping ecosystem service demands with spatial flow from built-up areas to natural spaces. Sci. Total Environ. 2021, 798, 149330. [Google Scholar] [CrossRef]
  44. Groot, R.S.D.; Wilson, M.A.; Boumans, R.M.J. A typology for the classification, description and valuation of ecosystem functions, goods and services. Ecol. Econ. 2002, 41, 393–408. [Google Scholar] [CrossRef] [Green Version]
  45. Xue, M.; Xing, L.; Wang, X. Spatial Correction and Evaluation of Ecosystem Services in China. China Land Sci. 2018, 32, 8. [Google Scholar] [CrossRef]
  46. Xie, G.; Zhen, L.; Lu, C.; Xiao, Y.; Chen, C. Expert Knowledge Based Valuation Method of Ecosystem Services in China. J. Nat. Resour. 2008, 23, 19. [Google Scholar] [CrossRef]
  47. Chen, J.; Li, T. Changes of Spatial Variations in Ecosystem Service Value in China. Acta Sci. Nat. Univ. Pekin. 2019, 55, 951–961. [Google Scholar] [CrossRef]
Figure 1. Scope and division of the Central Plains Urban Agglomeration.
Ijerph 18 09751 g001
Figure 2. The ecosystem types and distributions obtained from the land use data of the Central Plains Urban Agglomeration in 2000 and 2018.
Ijerph 18 09751 g002aIjerph 18 09751 g002b
Figure 3. Distribution and its change of ESV density of cities in the Central Plains Urban Agglomeration in 2000 and 2018.
Ijerph 18 09751 g003aIjerph 18 09751 g003bIjerph 18 09751 g003c
Figure 4. ESV transfer intensity and change of cities in the Central Plains Urban Agglomeration.
Ijerph 18 09751 g004aIjerph 18 09751 g004bIjerph 18 09751 g004c
Figure 5. ESV spatial radiation range of cities in the Central Plains Urban Agglomeration in 2000.
Ijerph 18 09751 g005aIjerph 18 09751 g005bIjerph 18 09751 g005cIjerph 18 09751 g005d
Figure 6. The ESV spatial radiation range of cities in the Central Plains Urban Agglomeration in 2018.
Ijerph 18 09751 g006aIjerph 18 09751 g006bIjerph 18 09751 g006cIjerph 18 09751 g006d
Table 1. Ecosystem types and reclassification of original land use data.
EcosystemsLand Use Types of the Original Land Use Data
ForestBroad-leaved evergreen forests, deciduous broad-leaved forests, evergreen coniferous forests, deciduous coniferous forests, mixed coniferous and broad-leaved forests, evergreen broad-leaved shrub forests, deciduous broad-leaved shrub forests, evergreen coniferous shrub forests, arbor garden, shrubby garden, arbor green space, shrub green space, sparse forests, sparse shrubbery
GrasslandWater meadow, grassland, thick growth of grass, herbaceous green space, sparse grassland
FarmlandPaddy field, dry land
WetlandWetland, forest swamp, shrub swamp, herbaceous swamp
Rivers/lakesLake, reservoir/pond, rivers, canal/ditch
DesertMoss/lichen, bare rock, bare soil, desert/sand, saline alkali land
Construction landResidential land, industrial land, traffic land, mining area
Table 2. ESV equivalent table per unit area of terrestrial ecosystem in China [40,41].
ESForestGrasslandFarmlandWetlandRivers/LakesDesertConstruction Land
Supply servicesFood production0.330.431.000.360.530.020.00
Raw material production2.980.360.390.240.350.040.00
Regulatory servicesGas regulation4.321.500.722.410.510.060.00
Climate regulation4.071.560.9713.552.060.130.00
Hydrological regulation4.091.520.7713.4418.770.070.00
Waste disposal1.721.321.3914.414.850.260.00
Support servicesSoil conservation4.022.241.471.990.410.170.00
Biodiversity4.511.871.023.693.430.400.00
Culture servicesAesthetic landscape2.080.870.174.694.440.240.00
Table 3. ESVs of different ecosystems per unit area in the Central Plains Urban Agglomeration (RMB ·hm−2.a−1).
EcosystemsFood ProductionRaw Material ProductionGas RegulationClimate RegulationHydrological RegulationWaste DisposalSoil ConservationBiodiversityAesthetic Landscape
Forest625.225645.948184.727711.067748.953258.737616.338544.693940.79
Grassland814.68682.062841.922955.592879.812500.894243.933542.921648.31
Farmland1894.61738.901364.121837.771458.852633.512785.081932.50322.08
Wetland682.06454.714566.0125,671.9725,463.5627,282.383770.276991.118885.72
Rivers/lakes1004.14663.11966.253902.9035,561.8328,134.96776.796498.518412.07
Desert37.8975.78113.68246.30132.62492.60322.08757.84454.71
Construction land0.000.000.000.000.000.000.000.000.00
Table 4. The ESV amount and change rate of cities in the Central Plains Urban Agglomeration.
RegionCities2000 (RMB, Billion)2018 (RMB, Billion)2018–2000 (RMB, Billion)Change Rate
(%)
Central cityZhengzhou9.81619.3469.53197.097
Metropolitan areaKaifeng7.62612.2064.58060.058
Jiaozuo6.5588.9412.38436.353
Xuchang5.66610.2604.59381.062
Xinxiang10.94717.6556.70861.277
HinterlandAnyang9.98415.6335.64956.581
Bengbu7.58611.9694.38257.764
Bozhou10.66016.8786.21758.321
Fuyang13.17920.4937.31555.505
Handan13.90927.22213.31395.715
Heze14.43725.34110.90475.528
Hebi2.7834.6271.84566.295
Huaibei3.6265.8922.26662.493
Jiyuan4.4624.276−0.186−4.169
Jincheng25.23919.377−5.863−23.230
Liaocheng9.67518.3788.70389.953
Luoyang46.87031.899−14.971−31.942
Luohe3.1605.5002.34074.051
Nanyang64.34952.009−12.341−19.178
Pingdingshan13.68516.4452.76020.168
Puyang4.7078.9734.26690.631
Sanmenxia29.94121.160−8.781−29.328
Shangqiu12.72921.9409.21172.362
Xinyang44.56635.267−9.299−20.866
Xingtai16.42726.59410.16761.892
Suzhou12.39019.7977.40759.782
Yuncheng19.75528.3448.58843.473
Changzhi26.58130.1643.58413.483
Zhoukou14.81624.2209.40463.472
Zhumadian24.25229.2875.03520.761
Total490.380590.09199.71120.333
Table 5. Intensity and change of ESV spatially transferred from the cities to Zhengzhou.
RegionCity2000 (RMB, 10,000/km2)2018 (RMB, 10,000/km2)2018–2000 (RMB, 10,000/km2)
Central cityZhengzhou///
Metropolitan areaKaifeng82.98132.8249.84
Jiaozuo165.61225.8060.20
Xuchang129.89235.18105.30
Xinxiang132.50213.7081.20
HinterlandAnyang49.9778.2428.27
Bengbu4.997.872.88
Bozhou13.5621.477.91
Changzhi57.6965.477.78
Fuyang16.7826.099.31
Handan24.6148.1723.56
Hebi14.4123.969.55
Heze33.3558.5425.19
Huaibei3.86.172.37
Jincheng147.85113.51−34.34
Jiyuan36.3934.87−1.52
Liaocheng10.920.79.8
Luohe23.4240.7617.34
Luoyang254.85173.45−81.4
Nanyang147.85119.49−28.35
Pingdingshan130.02156.2426.22
Puyang11.4321.7910.36
Sanmenxia47.8933.84−14.05
Shangqiu30.3652.3321.97
Suzhou10.1316.196.06
Xingtai16.4826.6910.2
Xinyang4535.61−9.39
Yuncheng38.8655.7516.89
Zhoukou55.690.8935.29
Zhumadian59.5571.9212.37
Table 6. ESV spatial transfer amount and its changes in the Central Plains Urban Agglomeration from 2000 to 2018.
RegionCity2000 (RMB, Billion)2018 (RMB, Billion)2018–2000 (RMB, Billion)Change Rate
(%)
Central cityZhengzhou////
Metropolitan areaKaifeng3.1534.5071.35442.943
Xinxiang5.4417.942.49945.929
Jiaozuo2.4992.7590.2610.404
Xuchang1.993.4321.44272.462
Subtotal13.08318.6385.55542.460
HinterlandHebi0.6330.940.30748.499
Luohe0.781.2530.47360.641
Huaibei0.9761.4040.42843.852
Jiyuan1.3630.824−0.539−39.545
Puyang1.4852.7751.2986.869
Bengbu3.1284.3711.24339.738
Liaocheng4.5248.4353.91186.450
Anyang4.7436.61.85739.152
Bozhou5.237.4162.18641.797
Suzhou6.5349.4322.89844.353
Shangqiu6.79810.9934.19561.709
Fuyang7.1539.9322.77938.851
Pingdingshan7.5587.129−0.429−5.676
Handan7.7415.0987.35895.065
Heze8.17113.5985.42766.418
Zhoukou8.48312.7234.2449.982
Xingtai9.84514.5934.74848.228
Yuncheng12.80516.0123.20725.045
Zhumadian17.06716.791−0.276−1.617
Jincheng18.0389.134−8.904−49.362
Changzhi19.37517.523−1.852−9.559
Sanmenxia22.8110.417−12.393−54.331
Xinyang38.89221.93−16.962−43.613
Luoyang41.5618.994−22.566−54.297
Nanyang62.69737.806−24.891−39.700
Subtotal318.388276.123−42.265−13.275
Total331.471294.763−36.71−11.075
Table 7. The ESV spatial transfer amount into Zhengzhou and its change from 2000 to 2018.
RegionCity2000 (RMB, Billion)2018 (RMB, Billion)2018–2000 (RMB, Billion)2000–2018 (%)
Metropolitan areaKaifeng0.1400.120−0.020−14.286
Xinxiang0.1940.2060.0126.186
Jiaozuo0.0760.026−0.050−65.789
Xuchang0.0320.0420.01031.250
Subtotal0.4420.394−0.048−10.860
HinterlandLuoyang1.2640.140−1.124−88.924
Pingdingshan0.0100.000−0.010−100.000
Subtotal1.2740.140−1.134−89.011
Total1.7160.534−1.182−68.881
Table 8. ESV spatial transfer radius of cities in the Central Plains Urban Agglomeration from 2000 to 2018.
RegionCity2000 (km)2018 (km)2018–2000 (km)Change Rate (%)
Central cityZhengzhou////
Metropolitan areaJiaozuo28.3025.47−2.83−10.02
Xuchang28.5227.83−0.69−2.40
Xinxiang46.6944.41−2.28−4.88
Kaifeng44.9142.44−2.47−5.51
HinterlandLuohe42.0540.40−1.65−3.93
Jiyuan44.5935.41−9.18−20.59
Hebi48.2945.65−2.64−5.47
Pingdingshan55.5549.21−6.33−11.40
Anyang70.9866.91−4.06−5.72
Jincheng80.4765.35−15.12−18.79
Puyang83.0382.21−0.82−0.99
Zhoukou89.9986.20−3.79−4.21
Luoyang93.0476.24−16.80−18.05
Shangqiu109.02105.60−3.42−3.14
Heze114.03111.04−2.99−2.63
Huaibei116.79109.87−6.93−5.93
Zhumadian123.33111.32−12.01−9.74
Handan129.19128.98−0.21−0.16
Yuncheng132.25123.47−8.78−6.64
Changzhi133.51119.19−14.32−10.73
Bozhou143.09135.41−7.68−5.36
Liaocheng148.45147.07−1.37−0.93
Nanyang150.03129.59−20.44−13.62
Fuyang150.43142.15−8.28−5.51
Sanmenxia159.00127.82−31.18−19.61
Xingtai178.05170.37−7.68−4.31
Bengbu182.45171.70−10.76−5.89
Suzhou184.99175.83−9.16−4.95
Xinyang214.17180.79−33.39−15.59
Publisher’s Note: MDPI stays neutral with regard to jurisdictional claims in published maps and institutional affiliations.

