
The Effects of the Urban Built Environment on Mental Health: A Cohort Study in a Large Northern Italian City


Abstract
:1. Introduction
2. Methods


| Covariate | Median (Cut-Off Value) | Min Value | Max Value |
|---|---|---|---|
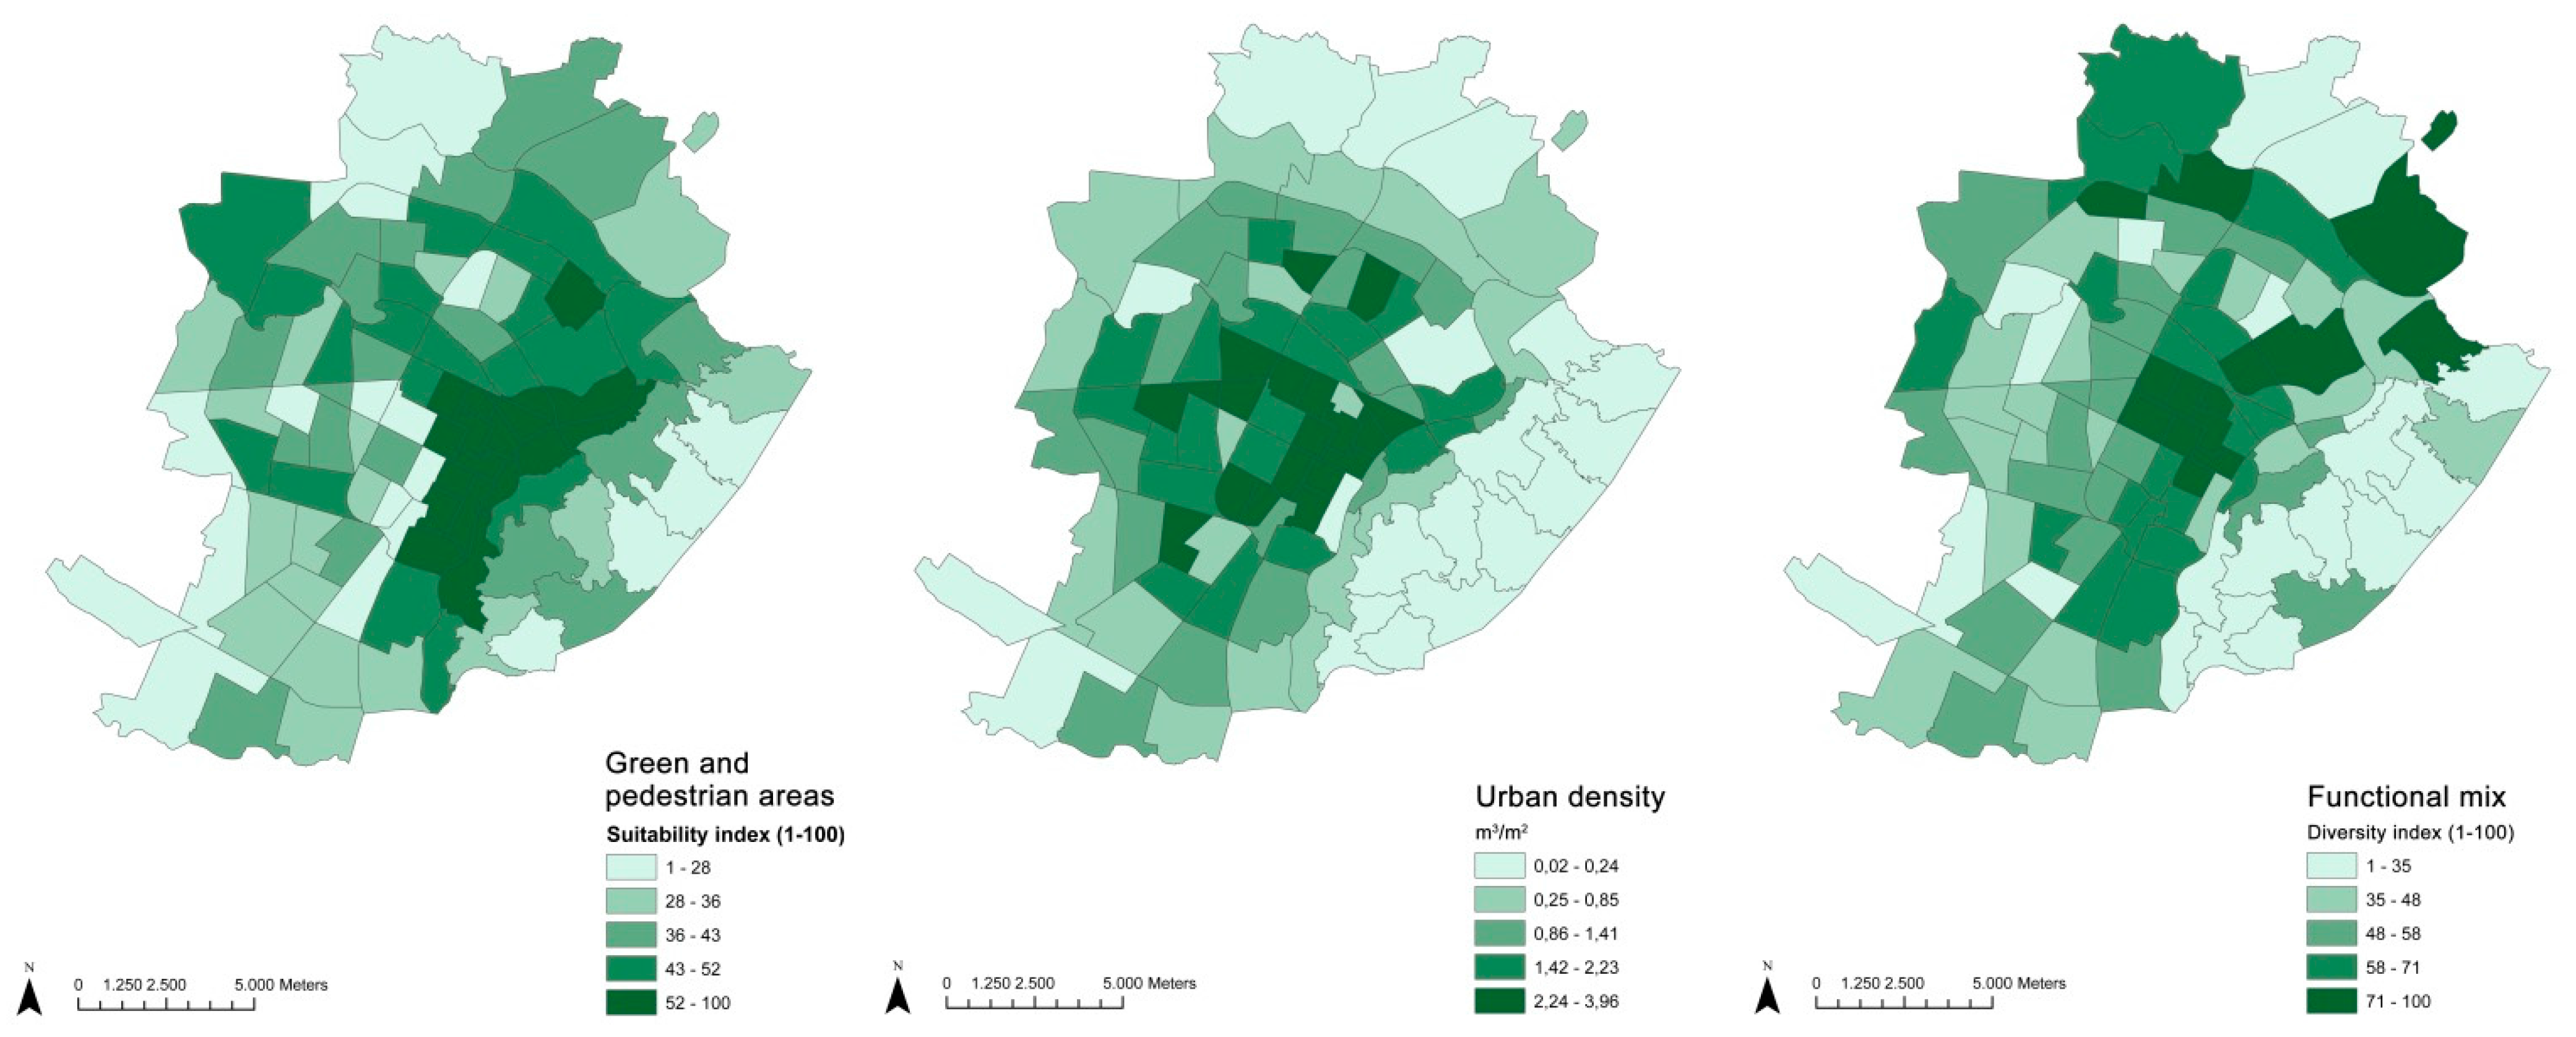
| Functional mix | 56 | 1 | 100 |
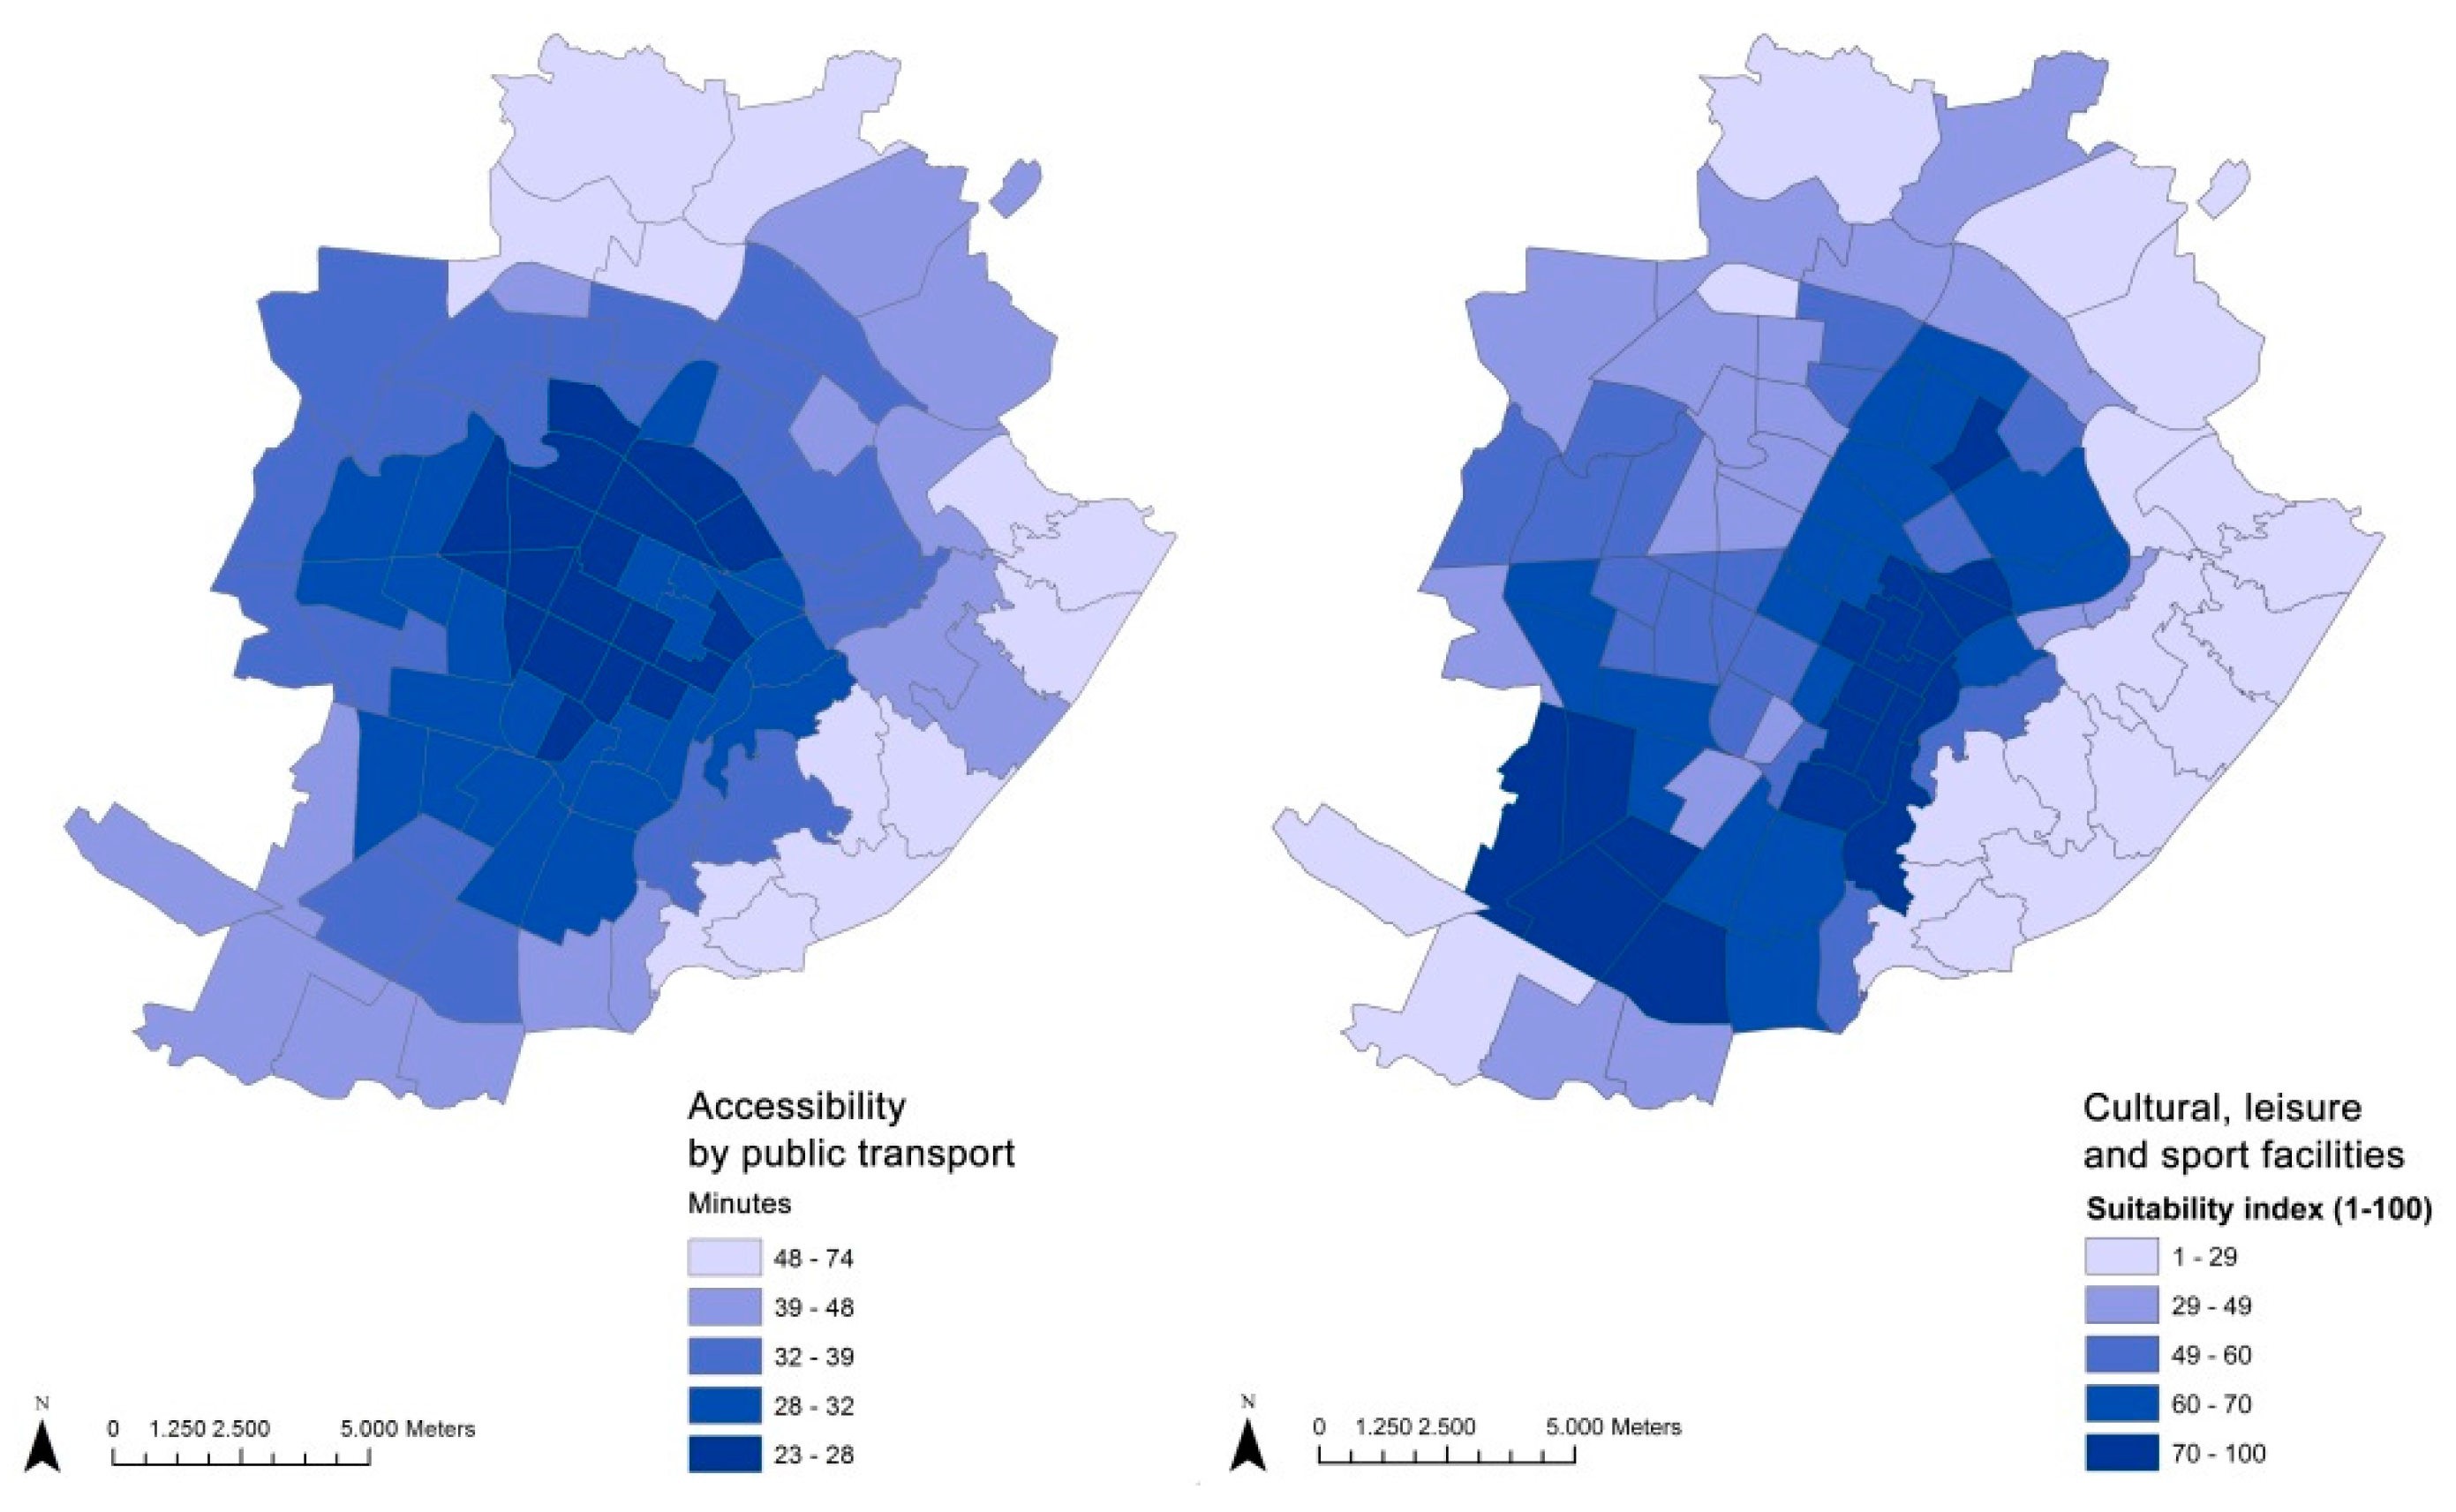
| Accessibility by public transport | 32 | 23 | 49 |
| Cultural leisure and sport facilities | 59.63 | 7.45 | 100 |
| Green and pietonal areas | 42.30 | 2.53 | 78.62 |
| Urban density | 1.35 | 0.07 | 3.96 |
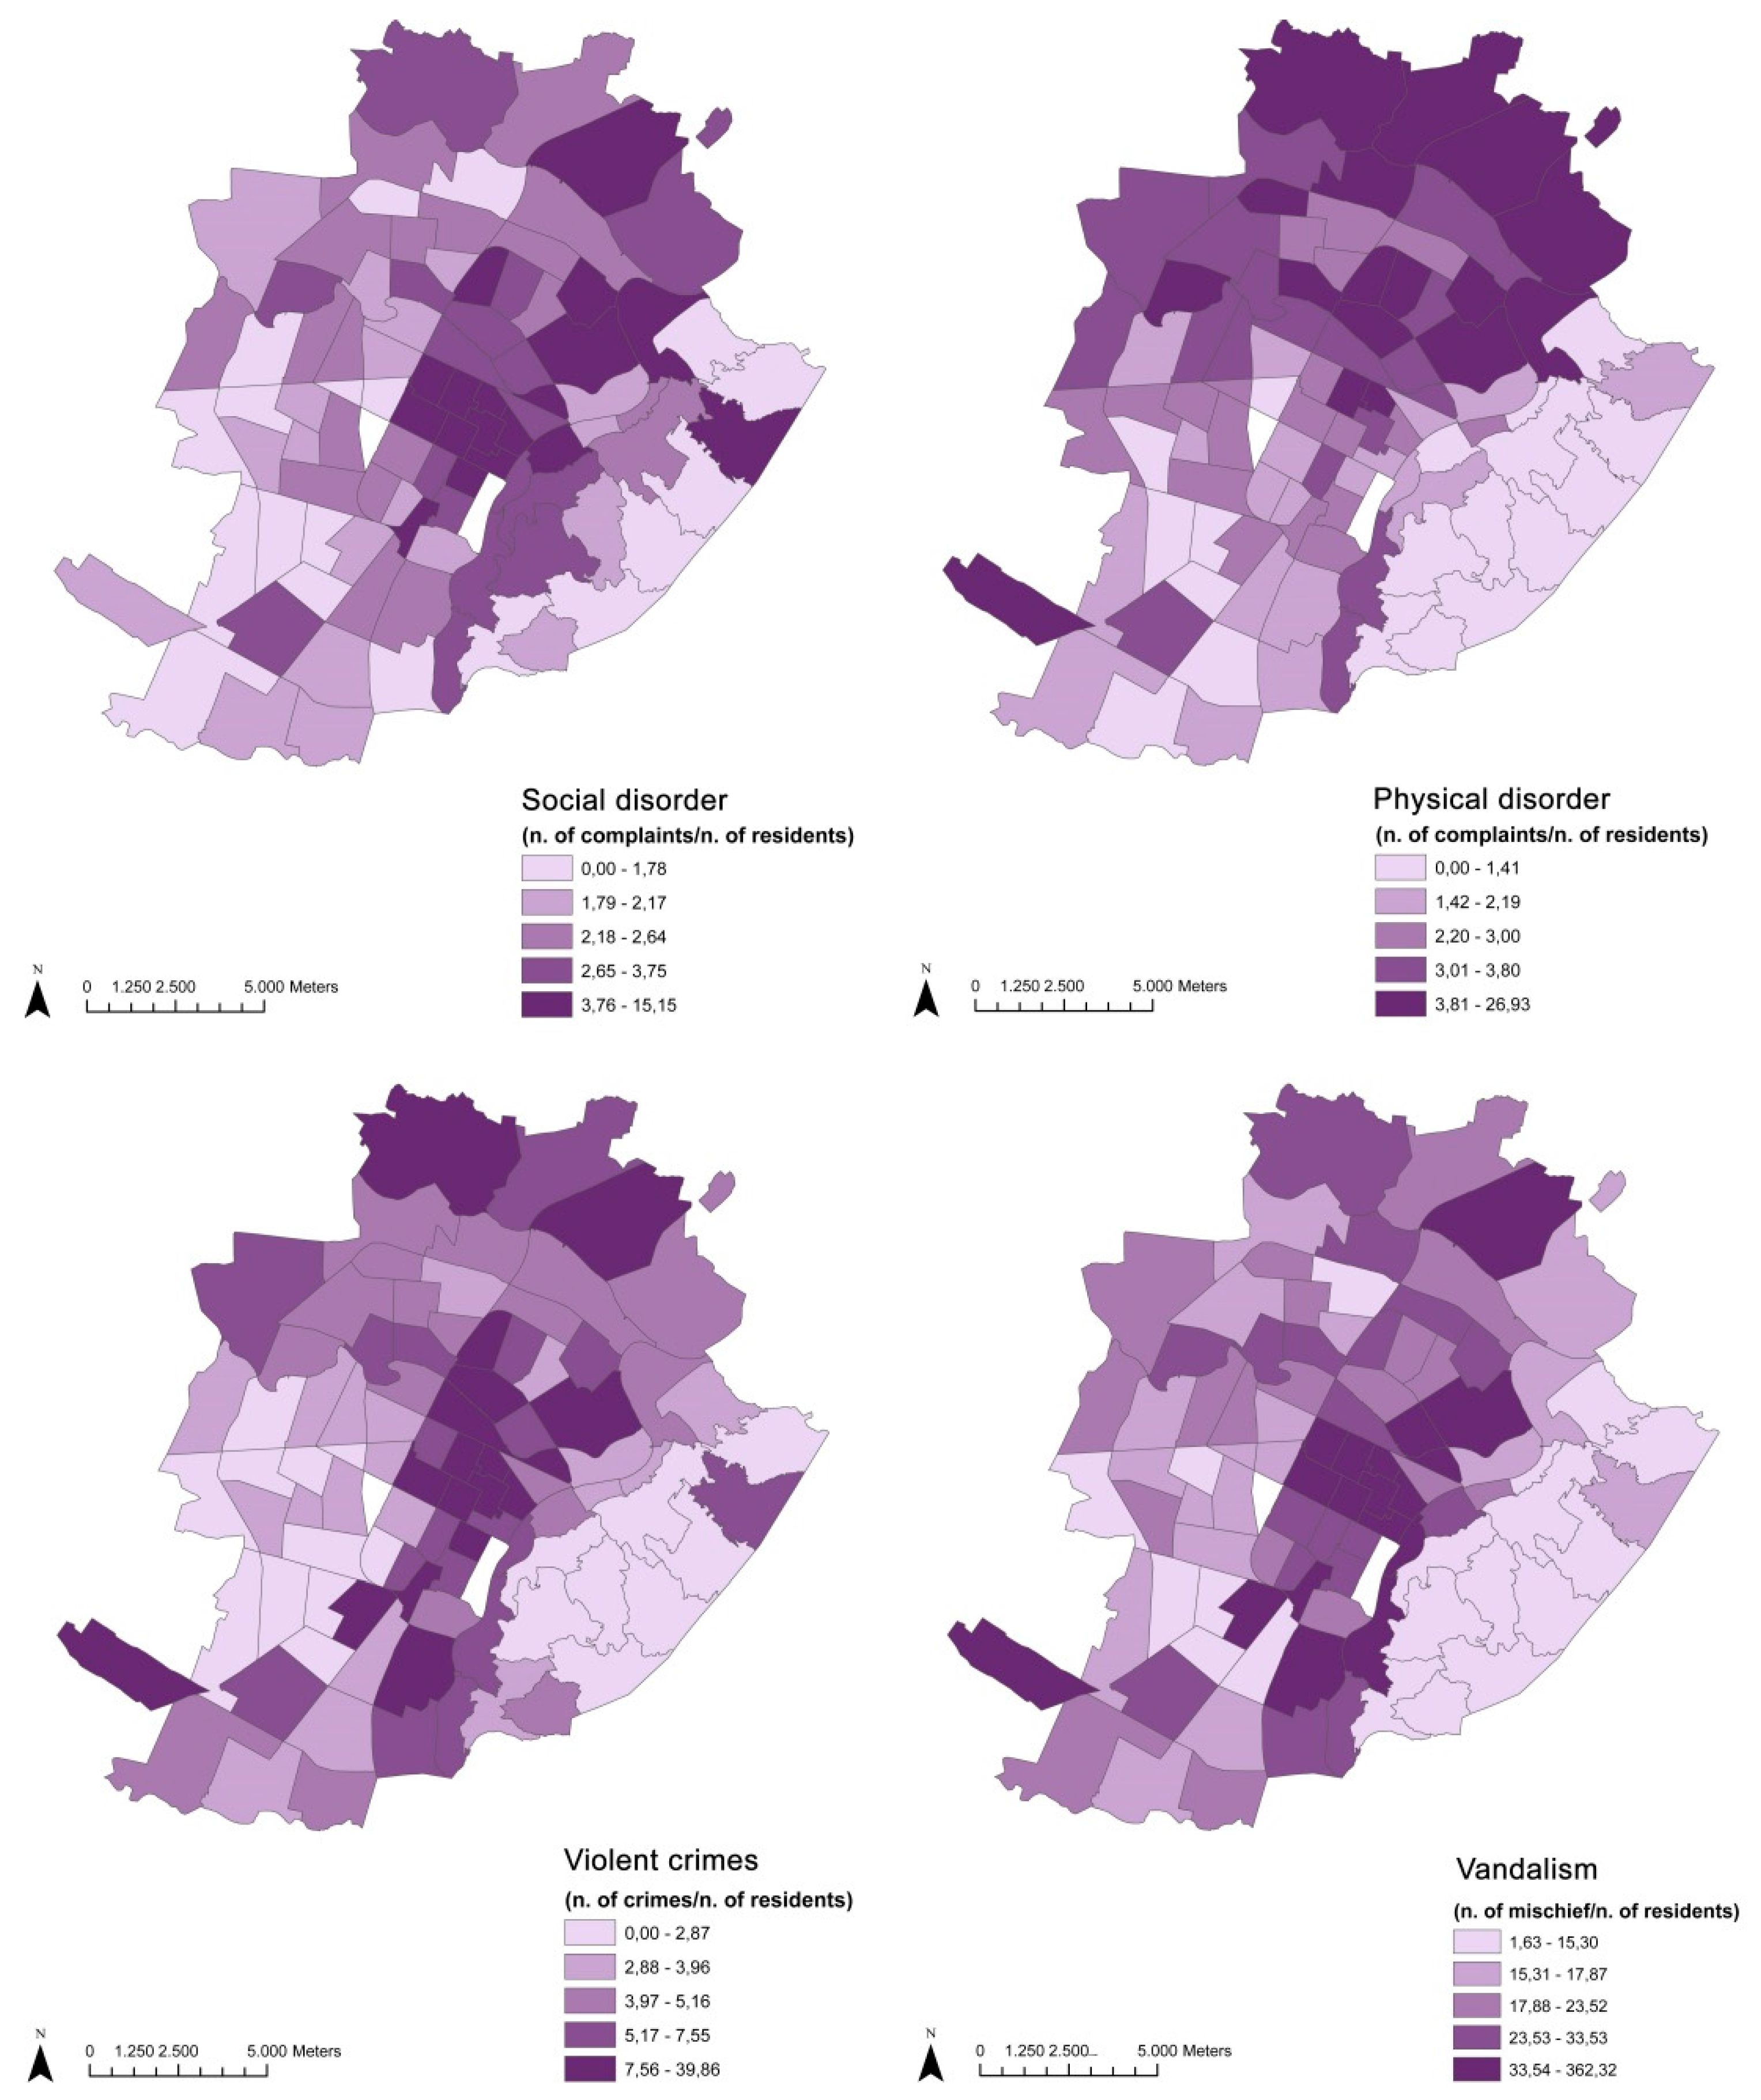
| Vandalism | 22.01 | 12.29 | 362.32 |
| Violent crimes | 4.79 | 1.88 | 39.86 |
| Physical disorder | 2.44 | 1.10 | 15.15 |
| Social disorder | 2.82 | 0.99 | 22.43 |
3. Results and Discussion
3.1. Results
| Variable | N | N | First Prescriptions | % First Prescriptions |
|---|---|---|---|---|
| Gender | ||||
| male | 272,516 | 49.80% | 16,691 | 6.12% |
| female | 274,747 | 50.20% | 34,010 | 12.38% |
| TOT | 547,263 | 50,701 | 9.26% | |
| Age | ||||
| 20–34 | 168,979 | 30.88% | 9029 | 5.34% |
| 35–49 | 204,802 | 37.42% | 18,996 | 9.27% |
| 50–64 | 173,482 | 31.70% | 22,676 | 13.07% |
| Educational level | ||||
| high | 276,598 | 50.54% | 23,460 | 8.48% |
| low | 270,048 | 49.35% | 27,238 | 10.09% |
| missing | 617 | 0.11% | 3 | 0.50% |
| Citizenship | ||||
| Italian | 496,283 | 90.68% | 49,288 | 9.93% |
| foreign | 50,411 | 9.21% | 1413 | 2.80% |
| missing | 569 | 0.11% | ||
| Activity status | ||||
| active | 286,517 | 52.35% | 25,341 | 8.84% |
| non active | 162,808 | 29.75% | 19,435 | 11.94% |
| missing | 97,938 | 17.9% | 5925 | 6.05% |
| Residential stability | ||||
| resident | 463,073 | 84.62% | 43,492 | 9.39% |
| not resident | 71,737 | 13.11% | 5873 | 8.19% |
| missing | 12,453 | 2.27% | 1336 | 10.73% |
| MEN (IRR) | |||||||
| Model 1 | 20–34 | 35–49 | 50–64 | ||||
| A | B | A | B | A | B | ||
| Educational level (low) | 1.16 (1.07; 1.26) | 1.16 (1.07;1.26) | 0.98 (0.93; 1.04) | 0.98 (0.93; 1.04) | 0.85 (0.81; 0.90) | 0.86 (0.82; 0.91) | |
| Citizenship (foreign) | 0.29 (0.21; 0.41) | 0.29 (0.21;0.41) | 0.25 (0.20; 0.32) | 0.25 (0.20; 0.32) | 0.31 (0.20; 0.47) | 0.31 (0.20; 0.47) | |
| Residential stability (<3 years. at address) | 1.01 (0.91; 1.12) | 1.01 (0.91;1.12) | 0.9 (0.83; 0.97) | 0.9 (0.83; 0.97) | 0.69 (0.63; 0.75) | 0.69 (0.63; 0.75) | |
| Activity status (non active) | 1.49 (1.37; 1.64) | 1.49 (1.37;1.64) | 1.92 (1.78; 2.06) | 1.92 (1.78; 2.06) | 1.34 (1.27; 1.42) | 1.34 (1.27; 1.42) | |
| Urban density (high) | 0.99 (0.91; 1.09) | 0.98 (0.93; 1.04) | 0.92 (0.86; 0.97) | ||||
| Public transport (high accessibility) | 0.95 (0.87; 1.04) | 0.99 (0.94; 1.05) | 0.92 (0.87; 0.97) | 0.93 (0.87; 0.98) | |||
| Green and pietonal areas (high) | 1.03 (0.94; 1.13) | 0.99 (0.93; 1.05) | 0.98 (0.92; 1.04) | ||||
| Cultural leisure and sport facilities (high) | 1.07 (0.99; 1.17) | 0.98 (0.93; 1.04) | 0.97 (0.91; 1.03) | ||||
| Functional mix (high) | 1.02 (0.94; 1.12) | 1.00 (0.94; 1.06) | 0.99 (0.93; 1.05) | ||||
| Physical disorder (high) | 1.07 (1.01; 1.14) | ||||||
| WOMEN (IRR) | |||||||
| Model | 20–34 | 35–49 | 50–64 | ||||
| A | B | A | B | A | B.1 | B.2 | |
| Educational level (low) | 1.2 (1.14;1.29) | 1.2 (1.14;1.29) | 1.12 (1.08;1.17) | 1.12 (1.08;1.17) | 0.94 (0.91;0.98) | 0.94 (0.91;0.98) | 0.94 (0.91;0.98) |
| Citizenship (foreign) | 0.4 (0.32;0.48) | 0.4 (0.32;0.48) | 0.49 (0.42;0.56) | 0.49 (0.42;0.56) | 0.42 (0.33;0.55) | 0.42 (0.33;0.55) | 0.42 (0.33;0.55) |
| Residential stability (<3 yrs at address) | 0.98 (0.90;1.06) | 0.98 (0.90;1.06) | 0.9 (0.84;0.96) | 0.9 (0.84;0.96) | 0.77 (0.71;0.82) | 0.77 (0.71;0.82) | 0.77 (0.71;0.82) |
| Activity status (non active) | 1.14 (1.07;1.22) | 1.14 (1.07;1.22) | 1.15 (1.11;1.20) | 1.15 (1.11;1.20) | 1.19 (1.15;1.23) | 1.19 (1.15;1.23) | 1.19 (1.15;1.23) |
| Urban density (high) | 0.96 (0.90;1.02) | 0.98 (0.94;1.02) | 0.95 (0.92;0.98) | 0.96 (0.92;0.99) | |||
| Public transport (high accessibility) | 0.94 (0.88;0.99) | 0.94 (0.88;0.99) | 0.95 (0.92;0.99) | 0.95 (0.92;0.99) | 0.95 (0.92;0.98) | 0.95 (0.92;0.98) | |
| Green and pietonal areas (high) | 0.97 (0.90;1.02) | 0.96 (0.91;1.01) | 1.00 (0.96;1.08) | ||||
| Cultural leisure and sport facilities (high) | 0.97 (0.91;1.03) | 0.97 (0.93;1.01) | 0.99 (0.96;1.03) | ||||
| Functional mix (high) | 0.94 (0.89;1.00) | 0.98 (0.94;1.02) | 1.00 (0.96;1.03) | ||||
| Physical disorder (high) | 1.04 (1.01;1.08) | 1.04 (1.01;1.08) | |||||
3.2. Discussion
3.3. Limits of the Study
4. Conclusions
Acknowledgments
Author Contributions
Conflicts of Interest
References
- Ståhl, T.; ismar, M.; Lila, E.; Lahtine, E.; Leppo, K. Health in all Policies: Prospects and Potentials; Finnish Ministry of Social Affairs and Health: Helsinki, Finland; European Observatory on Health Systems and Policies: Brussels, Belgium, 2006. [Google Scholar]
- Dalgard, O.S.; Tambs, K. Urban environment and mental health. A longitudinal study. Br. J. Psychiatry 1997, 171, 530–536. [Google Scholar] [CrossRef] [PubMed]
- Ross, C.E. Neighborhood disadvantage and adult depression. J. Health Soc. Behav. 2000, 41, 177–187. [Google Scholar] [CrossRef]
- Duncan, C.; Jones, K.; Moon, G. Psychiatric morbidity: A multilevel approach to regional variations in the UK. J. Epidemiol. Community Health 1995, 49, 290–295. [Google Scholar] [CrossRef] [PubMed]
- Pickett, K.E.; Pearl, M. Multilevel analyses of neighbourhood socioeconomic context and health outcomes: A critical review. J. Epidemiol. Community Health 2001, 55, 111–122. [Google Scholar] [CrossRef] [PubMed]
- Reijneveld, S.A.; Schene, A.H. Higher prevalence of mental disorders in socioeconomically deprived urban areas in The Netherlands: Community or personal disadvantage? J. Epidemiol. Community Health 1998, 52, 2–7. [Google Scholar] [CrossRef] [PubMed]
- Surtees, P.; Wainwright, N.; Luben, R.; Khaw, K.T.; Day, N. Sense of coherence and mortality in men and women in the EPIC-Norfolk United Kingdom prospective cohort study. Am. J. Epidemiol. 2003, 158, 1202–1209. [Google Scholar] [CrossRef] [PubMed]
- Weich, S.; Blanchard, M.; Prince, M.; Burton, E.; Erens, B.; Sproston, K. Mental health and the built environment: Cross-sectional survey of individual and contextual risk factors for depression. Br. J. Psychiatry 2002, 180, 428–433. [Google Scholar] [CrossRef] [PubMed]
- Weich, S.; Holt, G.; Twigg, L.; Jones, K.; Lewis, G. Geographic variation in the prevalence of common mental disorders in Britain: A multilevel investigation. Am. J. Epidemiol. 2003, 157, 730–737. [Google Scholar] [CrossRef] [PubMed]
- Araya, R.; Dunstan, F.; Playle, R.; Thomas, H.; Palmer, S.; Lewis, G. Perceptions of social capital and the built environment and mental health. Soc. Sci. Med. 2006, 62, 3072–3083. [Google Scholar] [CrossRef] [PubMed]
- Mitchell, D. The Right to the City: Social Justice and the Fight for Public Space; Guilford Press: New York, NY, USA, 2003. [Google Scholar]
- Frank, L.D.; Kavage, S. Urban planning and public health: A story of separation and reconnection. J. Public Health Manag. Pract. 2008, 14, 214–220. [Google Scholar] [CrossRef] [PubMed]
- Duncan, D.T.; Piras, G.; Dunn, E.C.; Johnson, R.M.; Melly, S.J.; Molnar, B.E. The built environment and depressive symptoms among urban youth: A spatial regression study. Spat. Spatiotemporal Epidemiol. 2013, 5, 11–25. [Google Scholar] [CrossRef] [PubMed]
- Dreger, S.; Buck, C.; Bolte, G. Material, psychosocial and sociodemographic determinants are associated with positive mental health in Europe: A cross-sectional study. BMJ Open 2014. [Google Scholar] [CrossRef] [PubMed]
- Guite, H.; Clark, C.; Ackrill, G. The impact of the physical and urban environment on mental well-being. Public Health 2006, 120, 1117–1126. [Google Scholar] [CrossRef] [PubMed]
- Annerstedt, M.; Ostergren, P.O.; Björk, J.; Grahn, P.; Skärbäck, E.; Währborg, P. Green qualities in the neighbourhood and mental health—Results from a longitudinal cohort study in Southern Sweden. BMC Public Health 2012. [Google Scholar] [CrossRef] [PubMed]
- Kirkbride, J.B.; Fearon, P.; Morgan, C.; Dazzan, P.; Morgan, K.; Murray, R.M.; Jones, P.B. Neighbourhood variation in the incidence of psychotic disorders in Southeast London. Soc. Psychiatry Psychiatr. Epidemiol. 2007, 42, 438–445. [Google Scholar] [CrossRef] [PubMed]
- Fone, D.; Dunstan, F.; Lloyd, K.; Williams, G.; Watkins, J.; Palmer, S. Does social cohesion modify the association between area income deprivation and mental health? A multilevel analysis. Int. J. Epidemiol. 2007, 36, 338–345. [Google Scholar] [CrossRef] [PubMed]
- Curry, A.; Latkin, C.; Davey-Rothwell, M. Pathways to depression: The impact of neighborhood violent crime on inner-city residents in Baltimore, Maryland, USA. Soc. Sci. Med. 2008, 67, 23–30. [Google Scholar] [CrossRef] [PubMed]
- Ellaway, A.; Morris, G.; Curtice, J.; Robertson, C.; Allardice, G.; Robertson, R. Associations between health and different types of environmental incivility: A Scotland-wide study. Public Health 2009, 123, 708–713. [Google Scholar] [CrossRef] [PubMed] [Green Version]
- Dannon, P.N.; Lowengrub, K.; Iancu, I.; Kotler, M. Paroxetine in panic disorder: Clinical management and long-term follow-up. Expert Rev. Neurother. 2004, 4, 191–198. [Google Scholar] [CrossRef] [PubMed]
- Hansen, R.A.; Gaynes, B.N.; Gartlehner, G.; Moore, C.G.; Tiwari, R.; Lohr, K.N. Efficacy and tolerability of second-generation antidepressants in social anxiety disorder. Int. Clin. Psychopharmacol. 2008, 23, 170–179. [Google Scholar] [CrossRef] [PubMed]
- D’Errico, A.; Cardano, M.; Landriscina, T.; Marinacci, C.; Pasian, S.; Petrelli, A.; Costa, G. Workplace stress and prescription of antidepressant medications: A prospective study on a sample of Italian workers. Int. Arch. Occup. Environ. Health 2011, 84, 413–424. [Google Scholar] [CrossRef] [PubMed]
- Kivimäki, M.; Gunnell, D.; Lawlor, D.A.; Smith, G.D.; Pentti, J.; Virtanen, M.; Elovainio, M.; Klaukka, T.; Vahtera, J. Social inequalities in antidepressant treatment and mortality: A longitudinal register study. Psychol. Med. 2007, 37, 373–382. [Google Scholar] [CrossRef] [PubMed]
- Bocquier, A.; Cortaredona, S.; Verdoux, H.; Sciortino, V.; Nauleau, S.; Verger, P. Social inequalities in new antidepressant treatment: A study at the individual and neighborhood levels. Ann. Epidemiol. 2013, 23, 99–105. [Google Scholar] [CrossRef] [PubMed]
- Hansen, D.G.; Søndergaard, J.; Vach, W.; Gram, L.F.; Rosholm, J.U.; Mortensen, P.B.; Kragstrup, J. Socio-economic inequalities in first-time use of antidepressants: A population-based study. Eur. J. Clin. Pharmacol. 2004, 60, 51–55. [Google Scholar] [CrossRef] [PubMed]
- Hollander, A.C. Social inequalities in mental health and mortality among refugees and other immigrants to Sweden—Epidemiological studies of register data. Glob. Health Action 2013. [Google Scholar] [CrossRef] [PubMed]
- Brendler-Lindqvist, M.; Norredam, M.; Hjern, A. Duration of residence and psychotropic drug use in recently settled refugees in Sweden-a register-based study. Int. J. Equity Health 2014, 13, 1–9. [Google Scholar] [CrossRef] [PubMed]
- Marinacci, C.; Spadea, T.; Biggeri, A.; Demaria, M.; Caiazzo, A.; Costa, G. The role of individual and contextual socioeconomic circumstances on mortality: Analysis of time variations in a city of north west Italy. J. Epidemiol. Community Health 2004, 58, 199–207. [Google Scholar] [CrossRef] [PubMed]
- Stringhini, S.; Spadea, T.; Stroscia, M.; Onorati, R.; Demaria, M.; Zengarini, N.; Costa, G. Decreasing educational differences in mortality over 40-years: Evidence from the Turin Longitudinal Study (Italy). Eur. J. Public Health 2014. [Google Scholar] [CrossRef] [PubMed]
- Melis, G.; Masala, E.; Tabasso, M. From the smart city to the people-friendly city: Usability of tools and data. In Handbook of Research on Social, Economic, and Environmental Sustainability in the Development of Smart Cities; IGI Global: Hershey, PA, USA, 2015; p. 363. [Google Scholar]
- Shannon, C.E. A mathematical theory of distribution. Bell Syst. Techn. 1948, 27, 623. [Google Scholar] [CrossRef]
- Frank, L.D.; Pivo, G. Impacts of Mixed Use and Density on Utilization of Three Modes of Travel: Single-Occupant Vehicle, Transit, and Walking; Transportation Research Record; Transportation Research Board: Washington, DC, USA, 1994; pp. 37–43. [Google Scholar]
- Fryers, T.; Melzer, D.; Jenkins, R. Social inequalities and the common mental disorders. Soc. Psychiatry Psychiatr. Epidemiol. 2003, 38, 229–237. [Google Scholar] [CrossRef] [PubMed]
- Fryers, T.; Melzer, D.; Jenkins, R.; Brugha, T. The distribution of the common mental disorders: Social inequalities in Europe. Clin. Pract. Epidemiol. Ment. Health 2005. [Google Scholar] [CrossRef] [PubMed]
- Lorant, V.; Deliège, D.; Eaton, W.; Robert, A.; Philippot, P.; Ansseau, M. Socioeconomic inequalities in depression: A meta-analysis. Am. J. Epidemiol. 2003, 157, 98–112. [Google Scholar] [CrossRef] [PubMed]
- Sundquist, K.; Ahlen, H. Neighbourhood income and mental health: A multilevel follow-up study of psychiatric hospital admissions among 4.5 million women and men. Health Place 2006, 12, 594–602. [Google Scholar] [CrossRef] [PubMed]
- Green, M.J.; Benzeval, M. The development of socioeconomic inequalities in anxiety and depression symptoms over the lifecourse. Soc. Psychiatry Psychiatr. Epidemiol. 2013, 48, 1951–1961. [Google Scholar] [CrossRef] [PubMed] [Green Version]
- Green, M.J.; Espie, C.A.; Benzeval, M. Social class and gender patterning of insomnia symptoms and psychiatric distress: A 20-year prospective cohort study. BMC Psychiatry 2014. [Google Scholar] [CrossRef] [PubMed]
- Klanšček, H.J.; Ziberna, J.; Korošec, A.; Zurc, J.; Albreht, T. Mental health inequalities in Slovenian 15-year-old adolescents explained by personal social position and family socioeconomic status. Int. J. Equity Health 2014. [Google Scholar] [CrossRef] [PubMed]
- Reiss, F. Socioeconomic inequalities and mental health problems in children and adolescents: A systematic review. Soc. Sci. Med. 2013, 90, 24–31. [Google Scholar] [CrossRef] [PubMed]
- Saarloos, D.; Alfonso, H.; Giles-Corti, B.; Middleton, N.; Almeida, O.P. The built environment and depression in later life: The health in men study. Am. J. Geriatric Psychiatry 2011, 19, 461–470. [Google Scholar] [CrossRef] [PubMed]
- Almedom, A.M. Social capital and mental health: An interdisciplinary review of primary evidence. Soc. Sci. Med. 2005, 61, 943–964. [Google Scholar] [CrossRef] [PubMed]
- Evans, G.W. The built environment and mental health. J. Urban Health 2003, 80, 536–555. [Google Scholar] [CrossRef] [PubMed]
- Renalds, A.; Smith, T.H.; Hale, P.J. A systematic review of built environment and health. Fam. Community Health 2010, 33, 68–78. [Google Scholar] [CrossRef] [PubMed]
- Latkin, C.A.; Curry, A.D. Stressful neighborhoods and depression: A prospective study of the impact of neighborhood disorder. J. Health Soc. Behav. 2003, 44, 34–44. [Google Scholar] [CrossRef] [PubMed]
- Lee, A.; Maheswaran, R. The health benefits of urban green spaces: A review of the evidence. J. Public Health 2011, 33, 212–222. [Google Scholar] [CrossRef] [PubMed]
- Sturm, R.; Cohen, D.A. Suburban sprawl and physical and mental health. Public Health 2004, 118, 488–496. [Google Scholar] [CrossRef] [PubMed]
- Galster, G. Quantifying the effect of neighbourhood on individuals: Challenges, alternative approaches, and promising directions. Schmollers Jahrb. 2008, 128, 7–48. [Google Scholar] [CrossRef]
- Vallée, J.; Cadot, E.; Roustit, C.; Parizot, I.; Chauvin, P. The role of daily mobility in mental health inequalities: The interactive influence of activity space and neighbourhood of residence on depression. Soc. Sci. Med. 2011, 73, 1133–1144. [Google Scholar] [CrossRef] [PubMed] [Green Version]
- Roux, S. Transition of motorisation in France in the 20th century. Ph.D Thesis, Panthéon-Sorbonne University Paris 1, Paris, France, 2012. [Google Scholar]
- Knoll, B.; Szalai, E. Gender Mainstreaming und Mobilität in Niederösterreich; Amt der NÖ Landesregierung-Abteilung Gesamtverkehrsangelegenheiten: St. Pölten, Austria, 2005. [Google Scholar]
- McDonald, N.C. Does residential density affect the travel “gender gap”. In Conference Proceedings 35: Research on Women’s Issues in Transportation; Transportation Research Board of the National Academies: Washington, DC, USA, 2005. [Google Scholar]
- Hurez, C.; Richer, C. Does the City’s Pulse Beat at the SAME RAte for Men and Women? Gender Time-Geography. In Proceedings of the Women’s Issues in Transportation, Paris, France, 14–16 April 2014.
- Rosenbloom, S. Understanding women’s and men’s travel patterns. In Research on Women’s Issues in Transportation: Report of a Conference; Transportation Research Board: Washington, DC, USA, 2006. [Google Scholar]
- Davidson, J.R.; Meltzer-Brody, S.E. The underrecognition and undertreatment of depression: What is the breadth and depth of the problem? J. Clin. Psychiatry 1999, 60, 4–9. [Google Scholar] [PubMed]
- Demyttenaere, K.; Bruffaerts, R.; Posada-Villa, J.; Gasquet, I.; Kovess, V.; Lepine, J.P.; Angermeyer, M.C.; Bernert, S.; de Girolamo, G.; Morosini, P.; et al. Prevalence, severity, and unmet need for treatment of mental disorders in the World Health Organization World Mental Health Surveys. JAMA 2004, 291, 2581–2590. [Google Scholar] [PubMed]
© 2015 by the authors; licensee MDPI, Basel, Switzerland. This article is an open access article distributed under the terms and conditions of the Creative Commons Attribution license (http://creativecommons.org/licenses/by/4.0/).
Share and Cite
Melis, G.; Gelormino, E.; Marra, G.; Ferracin, E.; Costa, G. The Effects of the Urban Built Environment on Mental Health: A Cohort Study in a Large Northern Italian City. Int. J. Environ. Res. Public Health 2015, 12, 14898-14915. https://doi.org/10.3390/ijerph121114898
Melis G, Gelormino E, Marra G, Ferracin E, Costa G. The Effects of the Urban Built Environment on Mental Health: A Cohort Study in a Large Northern Italian City. International Journal of Environmental Research and Public Health. 2015; 12(11):14898-14915. https://doi.org/10.3390/ijerph121114898
Chicago/Turabian StyleMelis, Giulia, Elena Gelormino, Giulia Marra, Elisa Ferracin, and Giuseppe Costa. 2015. "The Effects of the Urban Built Environment on Mental Health: A Cohort Study in a Large Northern Italian City" International Journal of Environmental Research and Public Health 12, no. 11: 14898-14915. https://doi.org/10.3390/ijerph121114898