Analysis of the Influence of Different Settings of Scan Sequence Parameters on Vibration and Noise Generated in the Open-Air MRI Scanning Area †


Institute of Measurement Science, Slovak Academy of Sciences, 841 04 Bratislava, Slovakia
*
Author to whom correspondence should be addressed.
†
This paper is an extended version of the conference paper: Přibil, J.; Přibilová, A.; Frollo, I. Analysis of Energy Relations between Noise and Vibration Signals in the Scanning Area of an Open-Air MRI Device, In Proceedings of the 5th International Electronic Conference on Sensors and Applications, 15–30 November, 2018.
Sensors 2019, 19(19), 4198; https://doi.org/10.3390/s19194198
Submission received: 14 August 2019
/
Revised: 24 September 2019
/
Accepted: 25 September 2019
/
Published: 27 September 2019
(This article belongs to the Special Issue Selected Papers from the 5th International Electronic Conference on Sensors and Applications)
Abstract
:A system of gradient coils of the magnetic resonance imaging (MRI) device produces significant vibration and noise. Energetic relations of these phenomena are analyzed depending on MRI scan parameters (sequence type, repetition time (TR), echo time (TE), slice orientation, body weight). This issue should be investigated because of negative physiological and psychological effects on a person exposed to vibration and acoustic noise. We also measured the sound pressure level in the MRI scanning area and its vicinity in order to minimize these negative impacts, depending on intensity and time duration of exposition. From the recorded vibration and noise signals, the energy parameters were determined and statistically analyzed, and the obtained results were visually and numerically compared. Finally, subjective evaluation by a listening test method was used to analyze the influence of the generated MRI noise on the human psyche.
1. Introduction
Magnetic resonance imaging (MRI) is an effective method for structure investigation of biological samples [1] or human body parts, such as a head [2,3], a thorax [4], etc. In addition to the standard closed-bore MRI scanner, the open-air one is increasingly used in special cases, e.g., in claustrophobic patients [5]. In this MRI device, two parallel permanent magnets form a static magnetic field between them [6]. A gradient system consisting of two internal planar coils parallel to the magnets is used to select slices in three dimensions. A tested object is placed in the magnetic field, together with an external radio frequency (RF) receiving/transmitting coil.
The coil current changes quickly during gradient switching, resulting in undesirable vibration of the whole structure [7], and subsequent acoustic noise disturbing the speech recorded during articulation and concurrent three-dimensional (3D) MRI scanning for examination of dynamic changes in the shape of the vocal tract and vocal folds [8]. In this case, a speech denoising method must be applied on the recorded signal. Another solution includes the recording of a speech signal by a special fiber optical microphone that can be located in the MRI scanning area [9]. Here, real-time speech processing is enabled during MR scanning at the expense of rather complicated practical realization involving synchronization of both processes, special hardware for an MRI device, etc. A cheaper type of an optical microphone (e.g., the first or the second generation of the Optoacoustics FOMRI microphone) has a limited frequency response in the range between 50 and 4000 Hz that is insufficient for our purpose. The third generation of the Optoacoustics FOMRI microphone system using fiber-optic technology and active noise reduction [10] can solve this problem; however, this solution is more expensive.
Acoustic noise interference is not only a technical problem, but a physiological and psychological one as well. These negative effects on humans are well known in industrial environments with long-term noise exposure [11]; however, they evolve gradually and can be observed first on a short-term scale. The intensity of the vibration and the resulting acoustic noise and the time duration of its exposure are crucial factors affecting the degree of their physiological, as well as psychological impact.
Motivation of our work was an exploration of energetic relations between the vibration and the noise in the scanning area of the low-field open-air MRI device and its surroundings to find a proper choice of a scan sequence and its parameters—sequence type, repetition time (TR), echo time (TE), slice orientation, etc. In addition, the volume inserted in the scanning area influenced the intensity of the vibration and noise produced in the scanning area of the MRI device. Finally, a tested object with its mechanical properties caused the change in the overall mechanical impedance when it loaded the system of lower gradient coils placed in the patient’s bed.
The experimental part has the following structure: In the preliminary phase, the sensitivity and the frequency response of the used vibration sensor were determined. Time-domain vibration and noise signals were recorded and processed, along with the measured sound pressure level (SPL), to find energetic features that were then evaluated statistically. Next, analysis of the influence of scan parameters on the time duration of the executed MR sequence and on the quality factor of the obtained MR images was carried out. Finally, the energetic features determined from the measured data were compared with the results of the subjective evaluation based on the listening test method.
2. Subject and Methods
As the open-air MRI is used primarily in medical practice, planes perpendicular to three axes of the Cartesian coordinate system are called according to medical terminology [12]. Anterior and posterior parts of a human body are divided by a frontal (coronal) plane. Another vertical plane divides a body to its left and right sides and is called a sagittal plane. The third plane dividing a body horizontally into superior and inferior parts is called a cross-sectional (transverse) plane. The scan orientation is selected by activation of the corresponding gradient coils, so the current flowing through them, as well as the resulting vibration and acoustic noise during execution of the scan sequence, depend on this selection. Two of the fundamental pulse sequences are preferably used in this MRI device: A spin echo (SE), being an excitation pulse followed by one or more refocusing pulses, and a gradient echo (GE), produced by conjunction of an excitation pulse with a gradient field reversal [13]. For optimal operation of the MRI unit, different parameters of the used scan sequence (the field of view, the number of slices, the thickness of a slice, etc.) are used for different scanned objects. The intensity of the vibration and noise produced by the MRI system depends not only on the setting of these parameters, but on the volume and the weight of the examined object as well. The tested object (a person, a sample, or a phantom) loads the lower gradient coil structure and thus becomes a part of the mechanical vibration system with its mass, stiffness, and damping.
If the vibration is to be picked up while the MRI sequence is executed, the vibration sensor placed in the MRI scanning area must not contain any ferromagnetic part to prevent its interaction with the static magnetic field, which may decrease the quality of the acquired image. It is essential that the sensor has good sensitivity with as small a dependence on frequency as possible. Using the reference sensitivity Ba0 at a chosen reference frequency, the frequency-dependent sensitivity (frequency response) of an accelerometer Ba [mV/ms−2] may be expressed in [dB] by a relation:
The sensor’s frequency range should cover harmonic frequencies of the vibration and noise signals concentrated in the low band due to limited frequency spectrum of the gradient pulse sequence. These requirements can be fulfilled by sensors constructed for acoustic pickup in musical instruments, or other ones based on the piezoelectric principle. First usage of all these vibration sensors must be preceded by measurement of their sensitivity and frequency response.
For obtaining high-quality MR images without artifacts, the acoustic sensors (the measuring microphone and the sound level meter) containing ferromagnetic parts must be placed beyond the influence of this static magnetic field, although, adequately close to the noise source. The sensitivity of the recording microphone and its directional pattern are selected in regard to effective rejection of the ambient noise. The sound level meter enables choice of the type of frequency weighting to match human perception of silent sounds (A weighting with more suppressed low and high frequencies) and loud sounds (C weighting with much less suppression of low frequencies than A weighting). Due to high measured sound pressure levels, we chose C weighting.
Several approaches can be applied for determination of the signal energy. Three of them represent the basis of our comparisons:
- The standard root mean square (RMS) is calculated from a signal x(n) in a defined frame (window) with the length of M samples:
- The third approach uses the short-term NFFT-point fast Fourier transform (FFT) to compute the power spectrum |S(k)|2, and in each frame, the energy is assessed from the first cepstral coefficient c0 or from the autocorrelation coefficient r0:
Next, the basic and supplementary spectral properties are determined from the recorded noise and vibration signals. Methods similar to those used in speech signal analysis can be applied for processing of these signals whose spectral content lies within the standard audio frequency range. The basic spectral properties (basic resonance frequencies FV1 and FV2 and their ratios, spectral decrease, etc.) are usually determined from the spectral envelope. The supplementary spectral features (spectral centroid (SC), harmonic-to-noise ratio (HNR), spectral entropy, etc.) describe the shape of the power spectrum of the analyzed signal.
3. Performed Experiments and Results
The experiments were carried out on the open-air, low-field (up to 0.2 T) MRI system E-scan Opera manufactured by the company Esaote S.p.A., Genoa, Italy [6]. This MRI system is located at the Institute of Measurement Science (IMS) in Bratislava, in the laboratory of the department of imaging methods. The piezoelectric vibration sensor was located in the scanning area of the MRI device; the microphone and the sound level meter were placed in its vicinity. The time course of the output voltage signals of the vibration sensor and the microphone was recorded, together with the measured noise SPL. The stored data were further processed to analyze the vibration and noise conditions by the energetic signal properties.
3.1. Automatic Measurement of Relative Sensitivity and Frequency Response of Vibration Sensors Suitable for Working in the Low Magnetic Field Environment
The preliminary measurements of the sensitivity and the frequency response of the vibration sensors were done using the vibration exciter ESE 201 on which the sensors were mounted. The Audio Precision System One (AP S1) with two programmable input and output channels was used as a signal generator for the exciter, as well as an input for simultaneous measurement of electrical signals from the sensors. The AP S1 output voltage for the exciter and the AP S1 input signal from the measured sensor were checked in parallel by the digital oscilloscope Rigol DS1102E. Three types of vibration sensors with the main element based on the piezoelectric principle were measured and tested:
- RFT heart microphone device HM 692 with a 20-mm disc transducer comprising a piezoelectric element integrated in the aluminum metal cover with a 30-mm diameter; and
- SDT1-028K sensor (by Sensor Solutions—TE Connectivity) consisting of a rectangular piezo film element (with dimensions of 28.6 × 11.2 × 0.13 mm), together with a molded plastic housing, typically used in safety and industrial applications.
The vibration sensors were measured and compared by two types of parameters:
- Relative sensitivity at the reference frequency fref = 125 Hz; and
- Frequency response in the range of 20 Hz to 2 kHz at a chosen AP S1 output voltage for the vibration exciter (UBa0 = 360 mVef = 1 V p-p).
3.2. Description of Main Measurement and Auxiliary Experiments
For all basic measurements, a plastic sphere-phantom of a 140-mm diameter filled with doped water [6] was placed inside the knee RF coil; see the arrangement photo in Figure 2. For acoustic noise SPL measurement in the MRI device vicinity, the multi-function environment meter Lafayette DT 8820 was used. Its distance from the center of the scanning area was 60 cm, its height from the floor was 75 cm (at the level of the bottom gradient coils), and it was oriented at 30 degrees from the left corner where the temperature stabilizer was placed. First, the noise SPL was mapped in the range of distances from 45 to 90 cm—the obtained values for Hi-Res SE and GE sequences are presented in Figure 3. As a result of the preliminary measurements, the SB-1 sensor was used to record the vibration signal from the solid surface of the plastic holder of the bottom gradient coils in the MRI scanning area—see position P0 in Figure 2. This figure also shows positions of the sound level meter (Lafayette DT 8820) and the dual diaphragm condenser microphone (Behringer B-2 PRO) on a stand with shock mounting for the noise SPL and signal pick up. The signals of the vibration and noise were routed through the Behringer Podcast Studio equipment by USB connection to PC. The signals with duration of about 15 s were sampled at 32 kHz and then processed in the sound editor program Sound Forge 9.0a.
The main experimental measurement was aimed at investigation of the impact of MRI scan parameters on the recorded vibration and noise. As presented in our earlier paper [17], only five types of scanning sequences are implemented in the investigated MRI device [6]:
- SE sequences (11 sub-types);
- GE sequences (9 sub-types);
- Turbo (multi echo) sequences (4 sub-types);
- 3D sequences (5 sub-types); and
- Hi-Res sequences (8 sub-types).
In practice, two basic types of scan sequences are commonly used for non-invasive examination of human body parts by acquiring high-quality MR images in this type of MRI device:
- High-resolution SE/GE pulse sequences (Hi-Res); and
- 3D sequences to create 3D models of various biological objects.
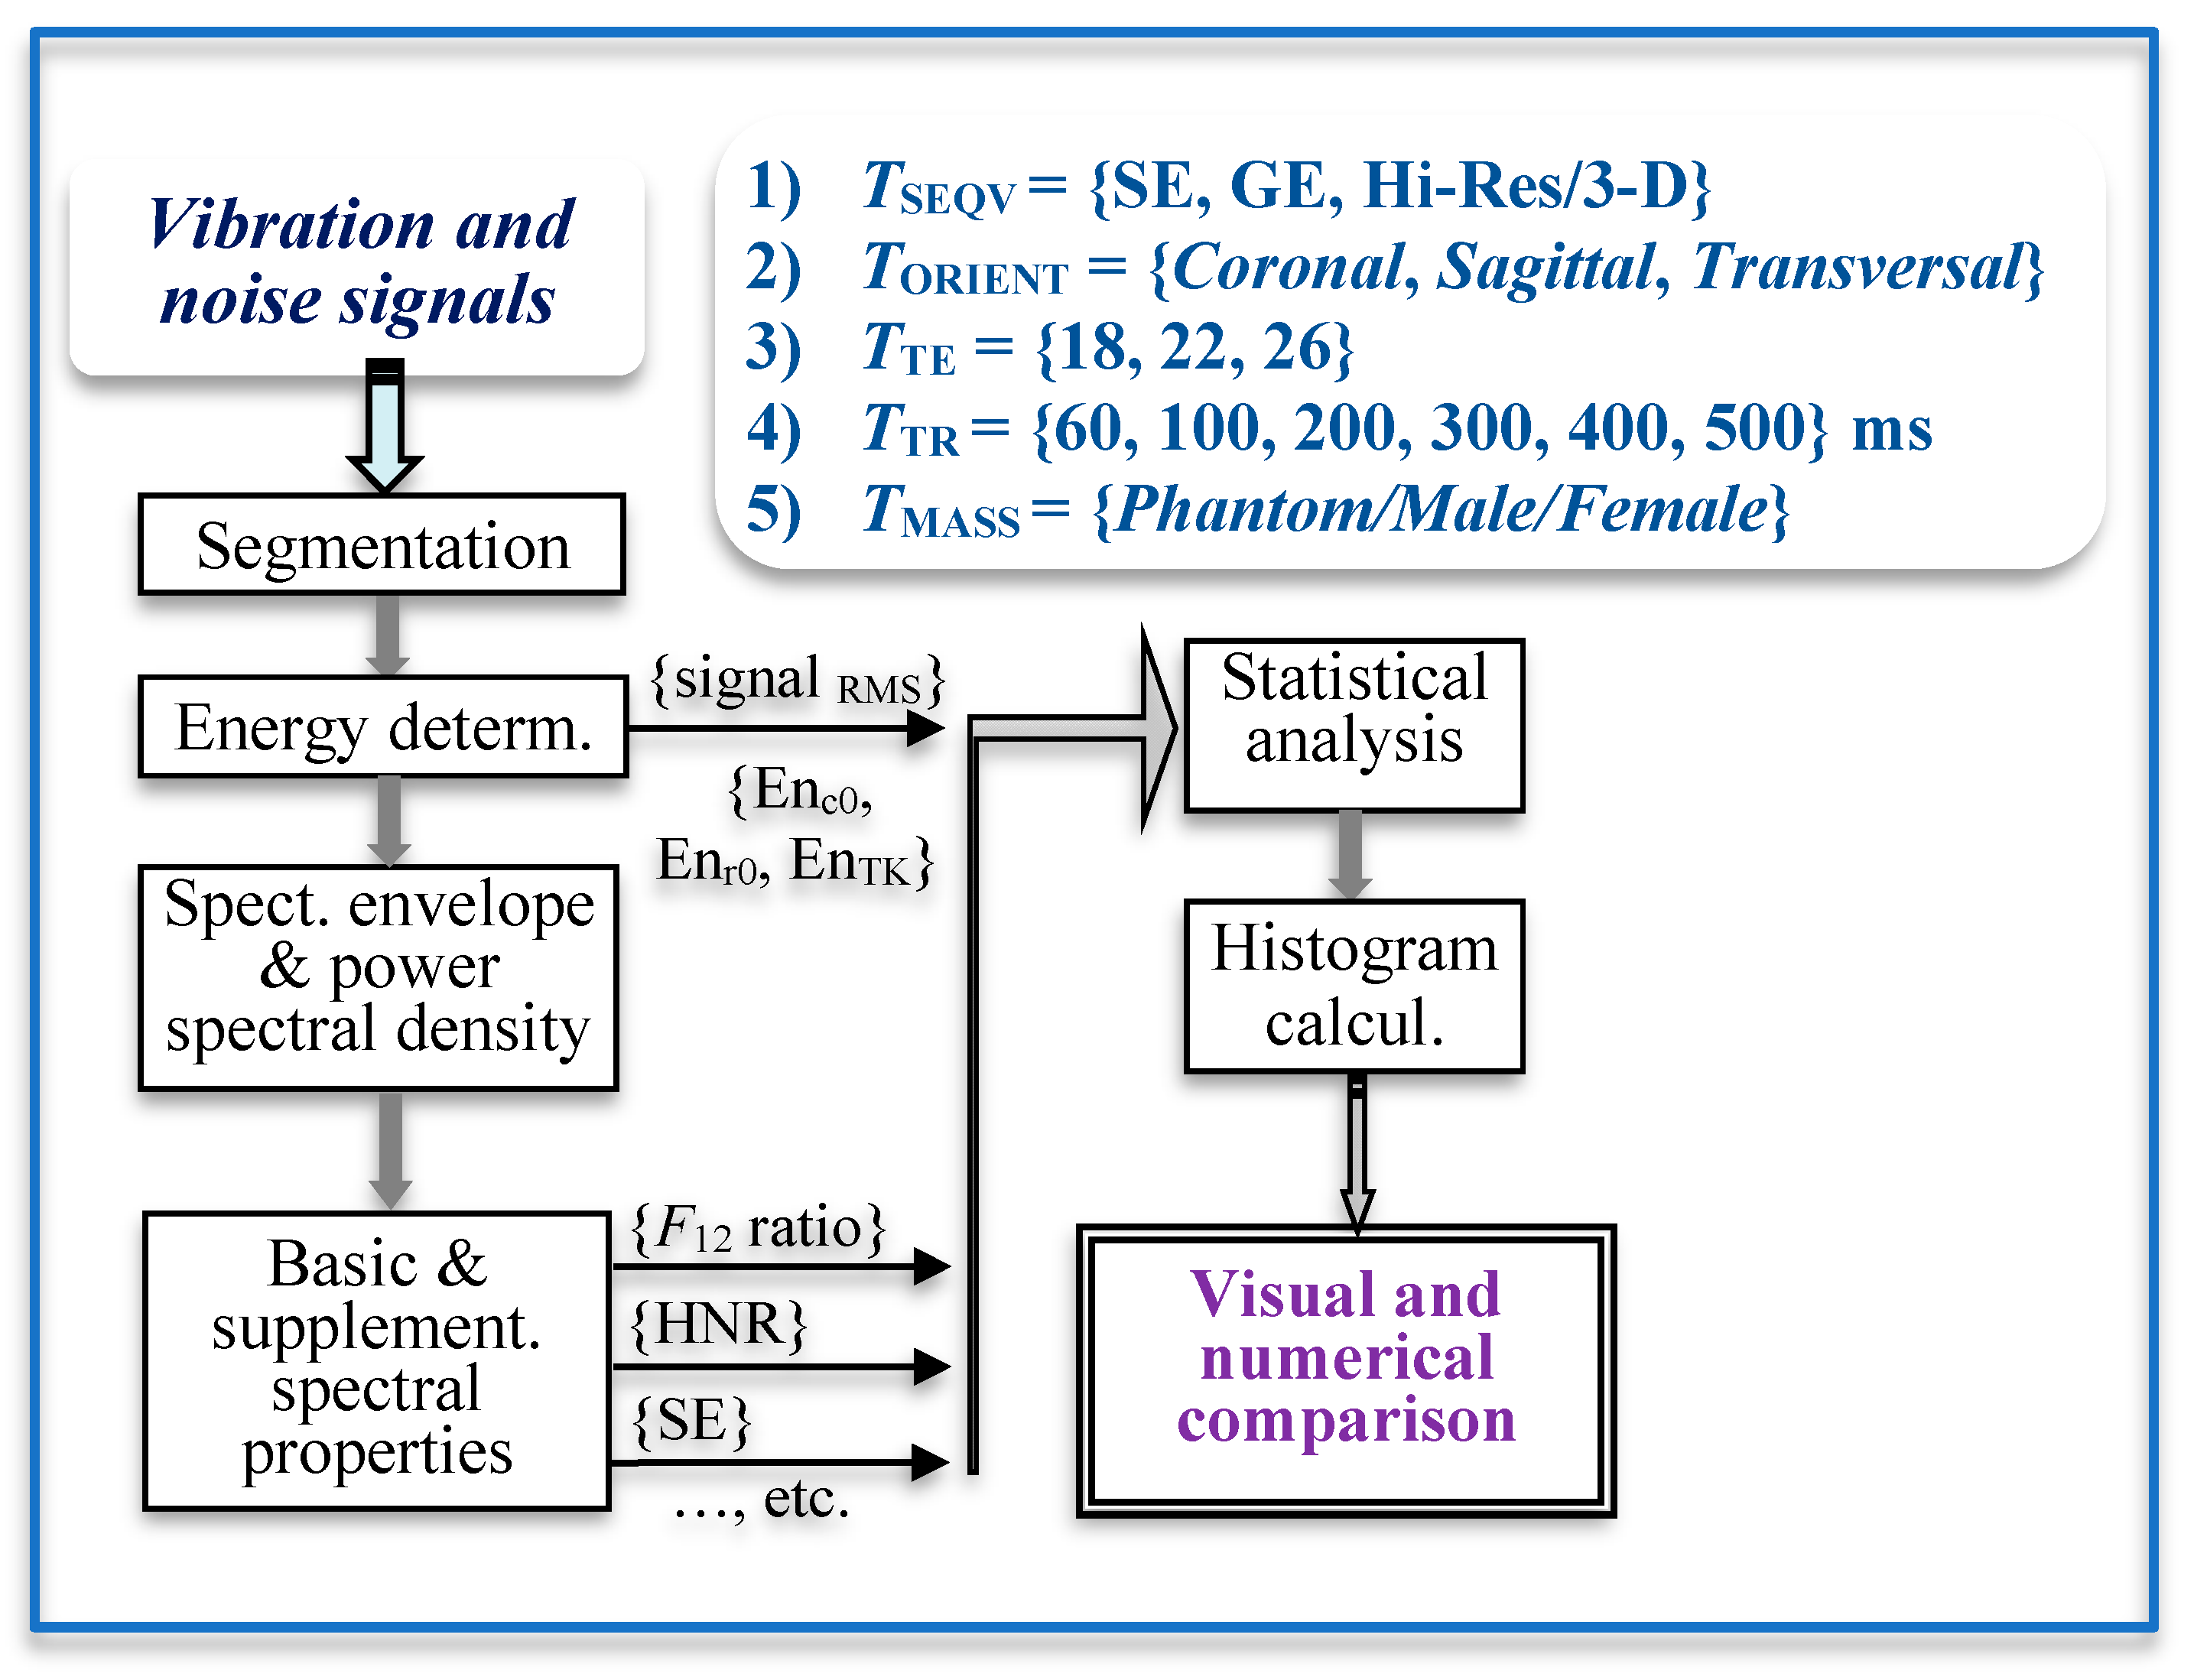
The baseline measurement and recording of the vibration and noise signals were carried out during the execution of MR scan sequences typical for 3D imaging of the human vocal tract. Figure 4 shows how the energetic and spectral parameters of the picked-up vibration and noise signals are determined and processed.
Scan parameters of five tested MR sequences (TSEQV = {Hi-Res SE 18 HF, Hi-Res SE 26 HF, Hi-Res GE T2, SS-3Dbalanced, 3D-CE}) were set as shown in Table 1. Graphical comparison of energetic relations between the measured vibration and noise signals can be seen in Figure 5. Then, analysis of the influence of scan parameters on properties of the vibration and noise signals was executed for different parameters:
- Scan slice orientation TORIENT = {Coronal, Sagittal, Transversal}—results for energetic and basic spectral features are visualized in Figure 6;
- Mass of the object/subject TMASS = {Phantom/Male/Female} placed in the MRI scanning area (the testing phantom with the total weight of 0.75 kg or a head and a neck of a lying male/female person weighing approximately 80/55 kg was placed in the RF scan coil between the upper and lower gradient coils of the MRI device)—numerical comparison can be found in Table 2.
3.3. Parameters Determinig the Scan Sequence Duration and the MR Image Quality Factor
The final scanning time is practically defined by a chosen scan sequence and basic scan parameters (TR and TE). The default configuration [6] is often modified manually by changing these two parameters; however, other scan settings (number of slices, slice thickness, number of accumulations NACC of the free induction decay (FID) signal [13], etc.) also have influence on duration, as well as on the MR image quality. The main aim is to obtain final MR images with maximum quality factor (QF) and minimum scan time duration (TDUR).
Using the operating console of the Esaote Opera MRI device [6], we analyzed how the predicted MR image QF and the scan-sequence time duration are affected by the following scan parameters:
3.4. Subjective Evaluation by the Listening Test Method
Various emotions can be induced in humans by various auditory and/or visual stimuli. A set of six basic emotions is conventionally used by psychologists, although these discrete emotions can be projected into a two-dimensional plane with continuous values of pleasure and arousal axes [18]. The pleasure can change from negative (anger, sadness, fear, disgust) through neutral to positive (surprise, joy). The arousal can acquire values from low (passive emotions like apathetic sleepiness or boredom) to high (active emotion like frantic excitement) [19].
Our subjective method of evaluation based on the listening test was focused on analysis of influence of vibration and noise generated by the gradient system of the MRI device on the human psyche. The aim of the test was to assess how listeners perceive different noises from emotional point of view. The server realization of the listening test “Evaluation of pleasure and arousal of sound” was operated at the internet site http://www.lef.um.savba.sk/Scripts/itstposl2.dll. This automatic application runs on the server PC as an MS ISAPI/NSAPI DLL script and communicates with the user within the framework of the HTTP protocol by means of the HTML pages—see an example of a screenshot in Figure 11. This system, designed originally for assessment of speech signal quality [20], serves at present the purpose of the MRI noise and vibration evaluation. Twenty-seven evaluators (8 women and 19 men) within the age range of 20 to 57 years participated in the listening test experiment open from 26 February to 20 March 2019. For compatibility with other emotional databases, like the International Affective Digitized Sounds [21], the listeners were instructed to use two parameters: Pleasantness (pleasure) and intensity (arousal), within the evaluation range of 1 to 9. The entire test consisted of 10 sets with 4 sounds each, so 40 different noises were evaluated. The listeners were allowed to play the audio stimuli as many times as they wished; low acoustic noise conditions and headphones were advised. The obtained evaluation results of the recorded MRI noises were presented by bar-graph comparisons. Figure 12 shows the emotional influence of the SE sequence with different slice orientations and the GE sequence with different TR times. Figure 13 gives the impact of the SE sequence for different masses in the scanning area, and finally, the effect of different scan sequences.
4. Discussion of Obtained Results
For 3D MR scanning of the vocal tract [1,8] during phonation, the frequency range of 25 Hz to 3.5 kHz covering pitch and formant frequencies must be included in the recordings. A preliminary analysis of the properties of the vibration sensors suitable for measurement in the low magnetic field environment confirmed a general presumption of inverse relationship between the diameter of the used sensor and the minimum frequency of vibration picked up from the measured surface. At the same time, the maximum frequency, as well as the sensitivity, were decreased in the massive aluminum microphone capsule of the phonocardiographic sensor HM692—its frequency response in Figure 1b shows a local maximum at about 50 Hz, which makes it useless for our purpose. The piezo film vibration sensor SDT1 has the best sensitivity but its frequency response shows higher non-linearity in comparison with the sensor SB-1. In addition, the vibration sensor SB-1 has the highest low frequency sensitivity, so it was finally chosen for all next recording and measurement experiments.
The acoustic noise intensity was measured at several distances from the center of the scanning area, beginning with 45 cm because, for shorter distances, the magnetic field inhomogeneity due to interaction with metal parts of the sound level meter causes the display of a warning message on the MRI control console and interruption of further scanning to prevent failure of the MRI device [6]. At distances longer than 90 cm, the measured sound level approached the background noise level of the temperature stabilizer. The results of these measurements for high-resolution SE and GE pulse sequences can be seen in Figure 3. All the following measurements were carried out at the distance of 60 cm.
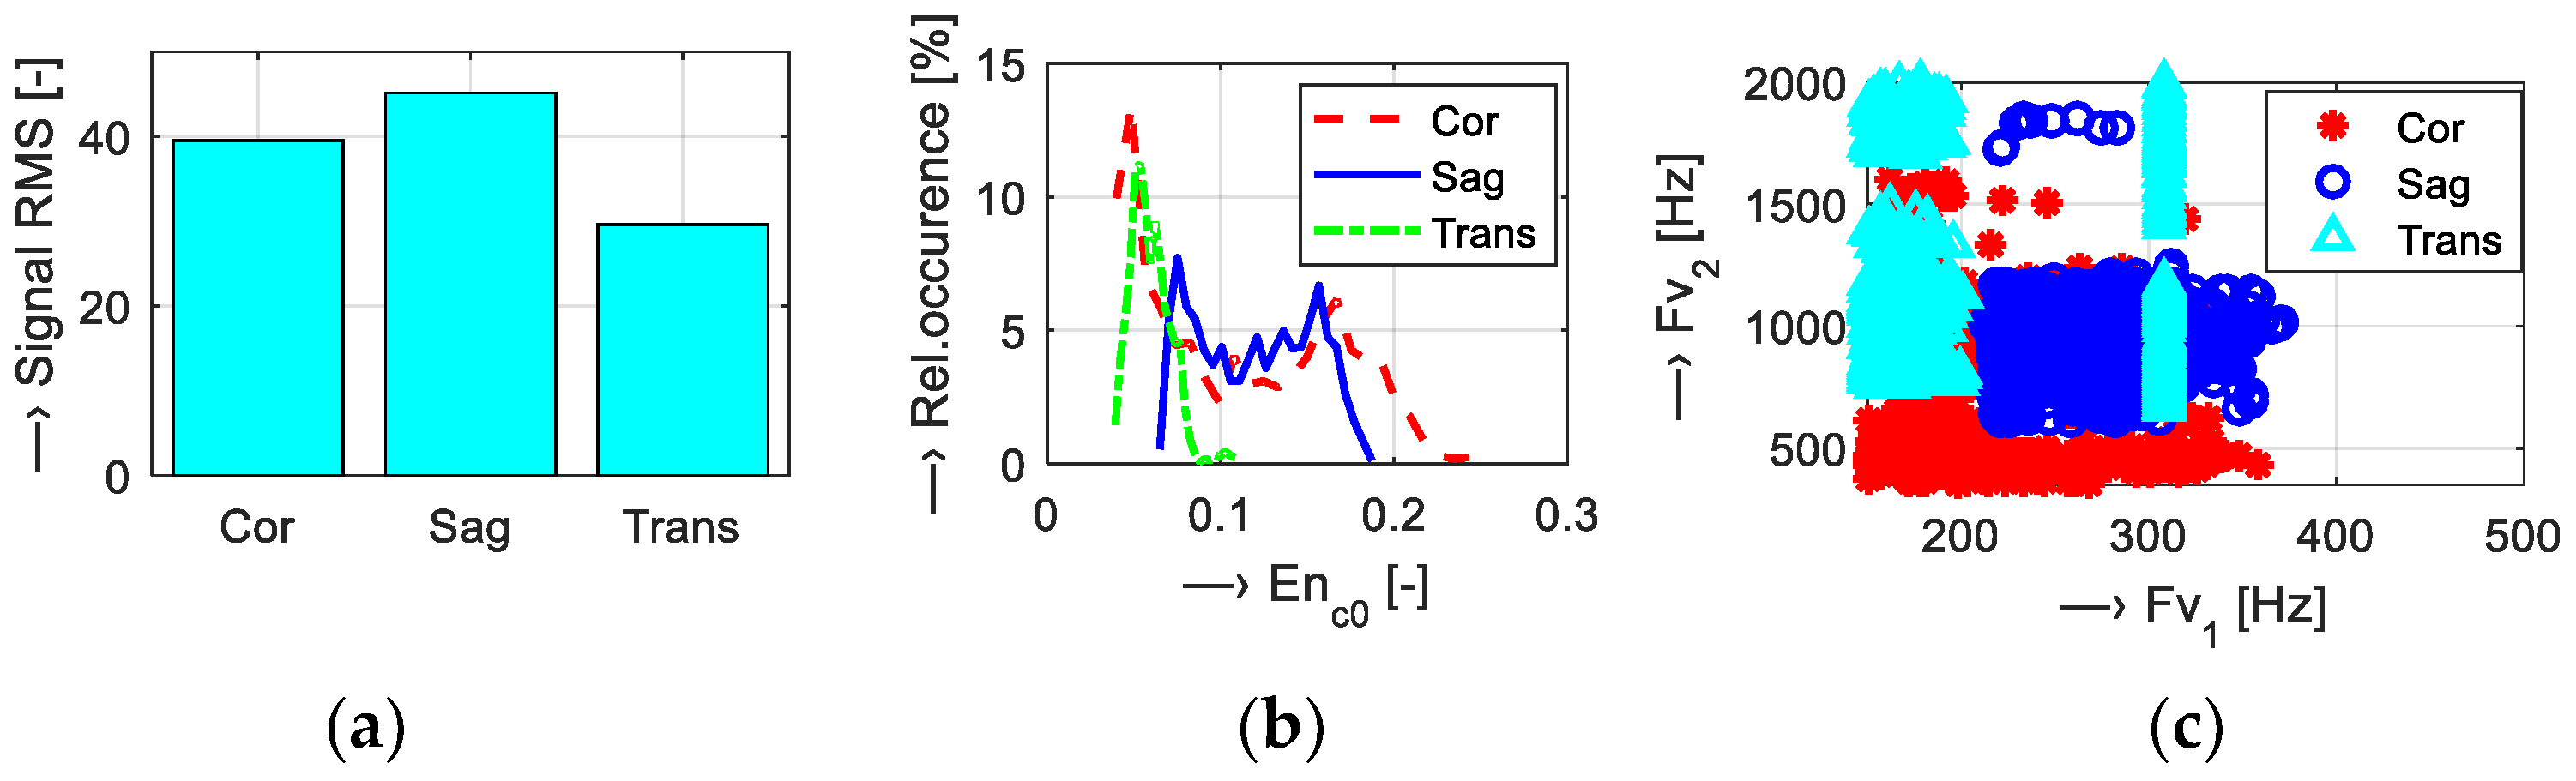
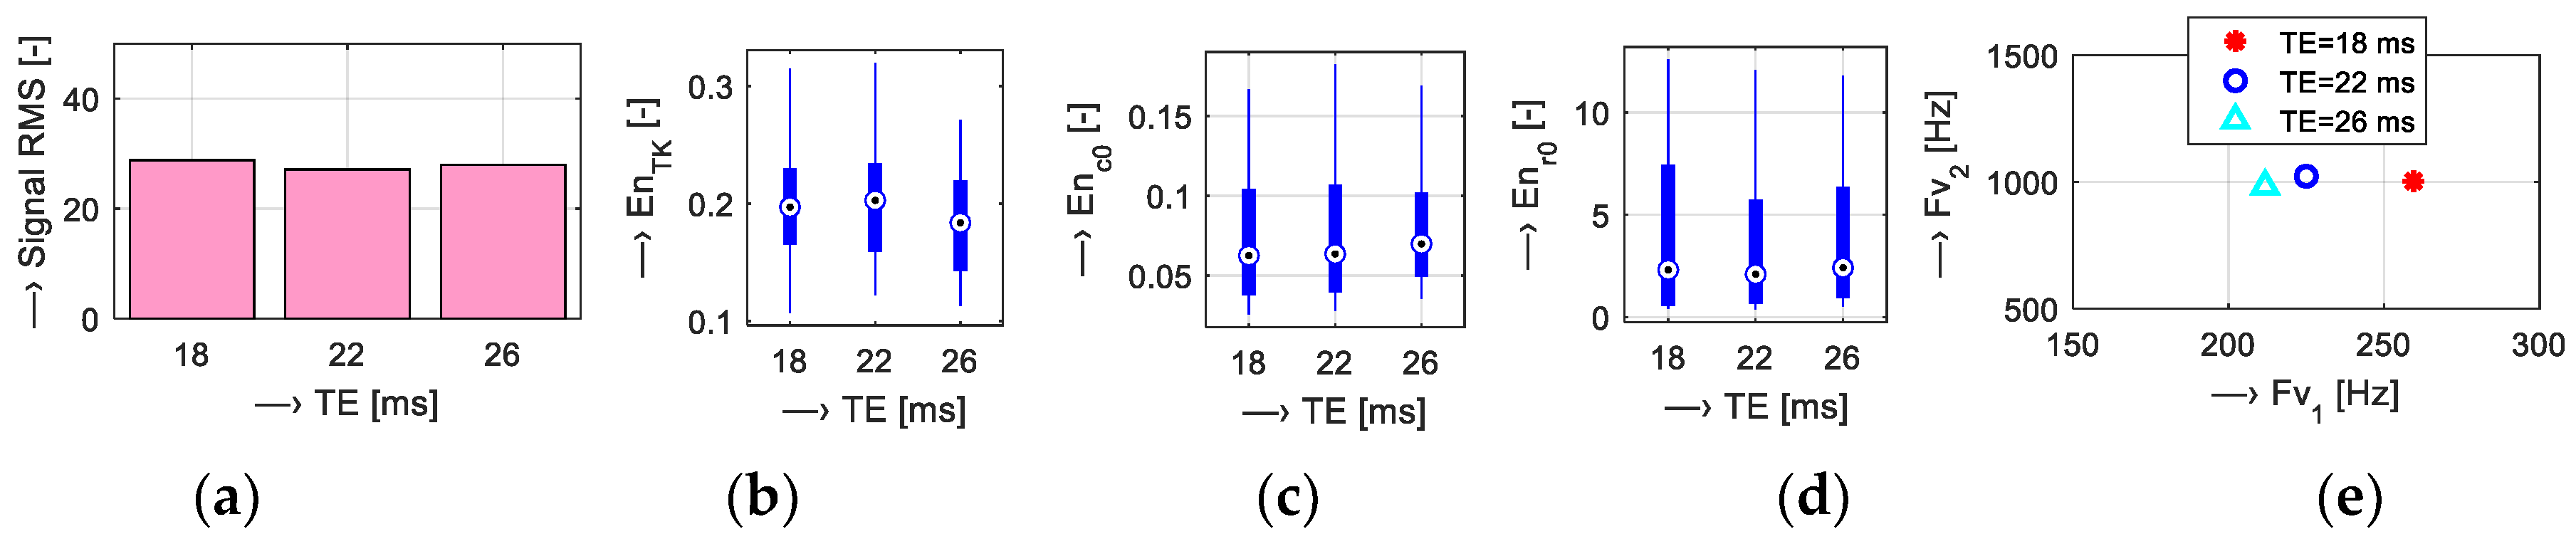
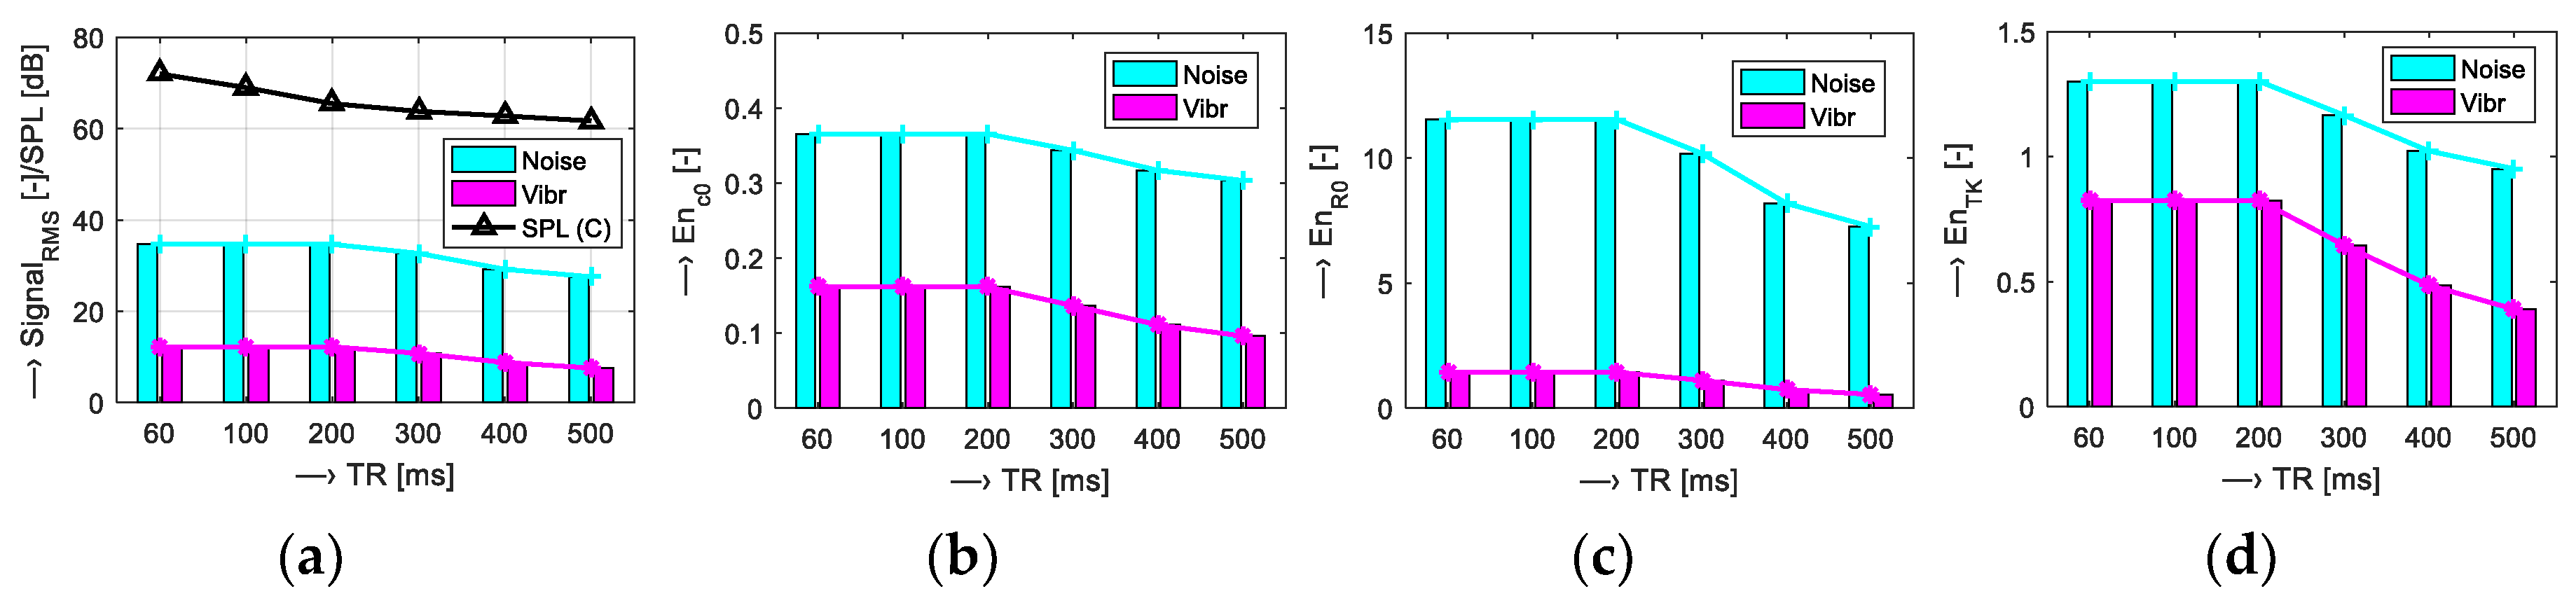
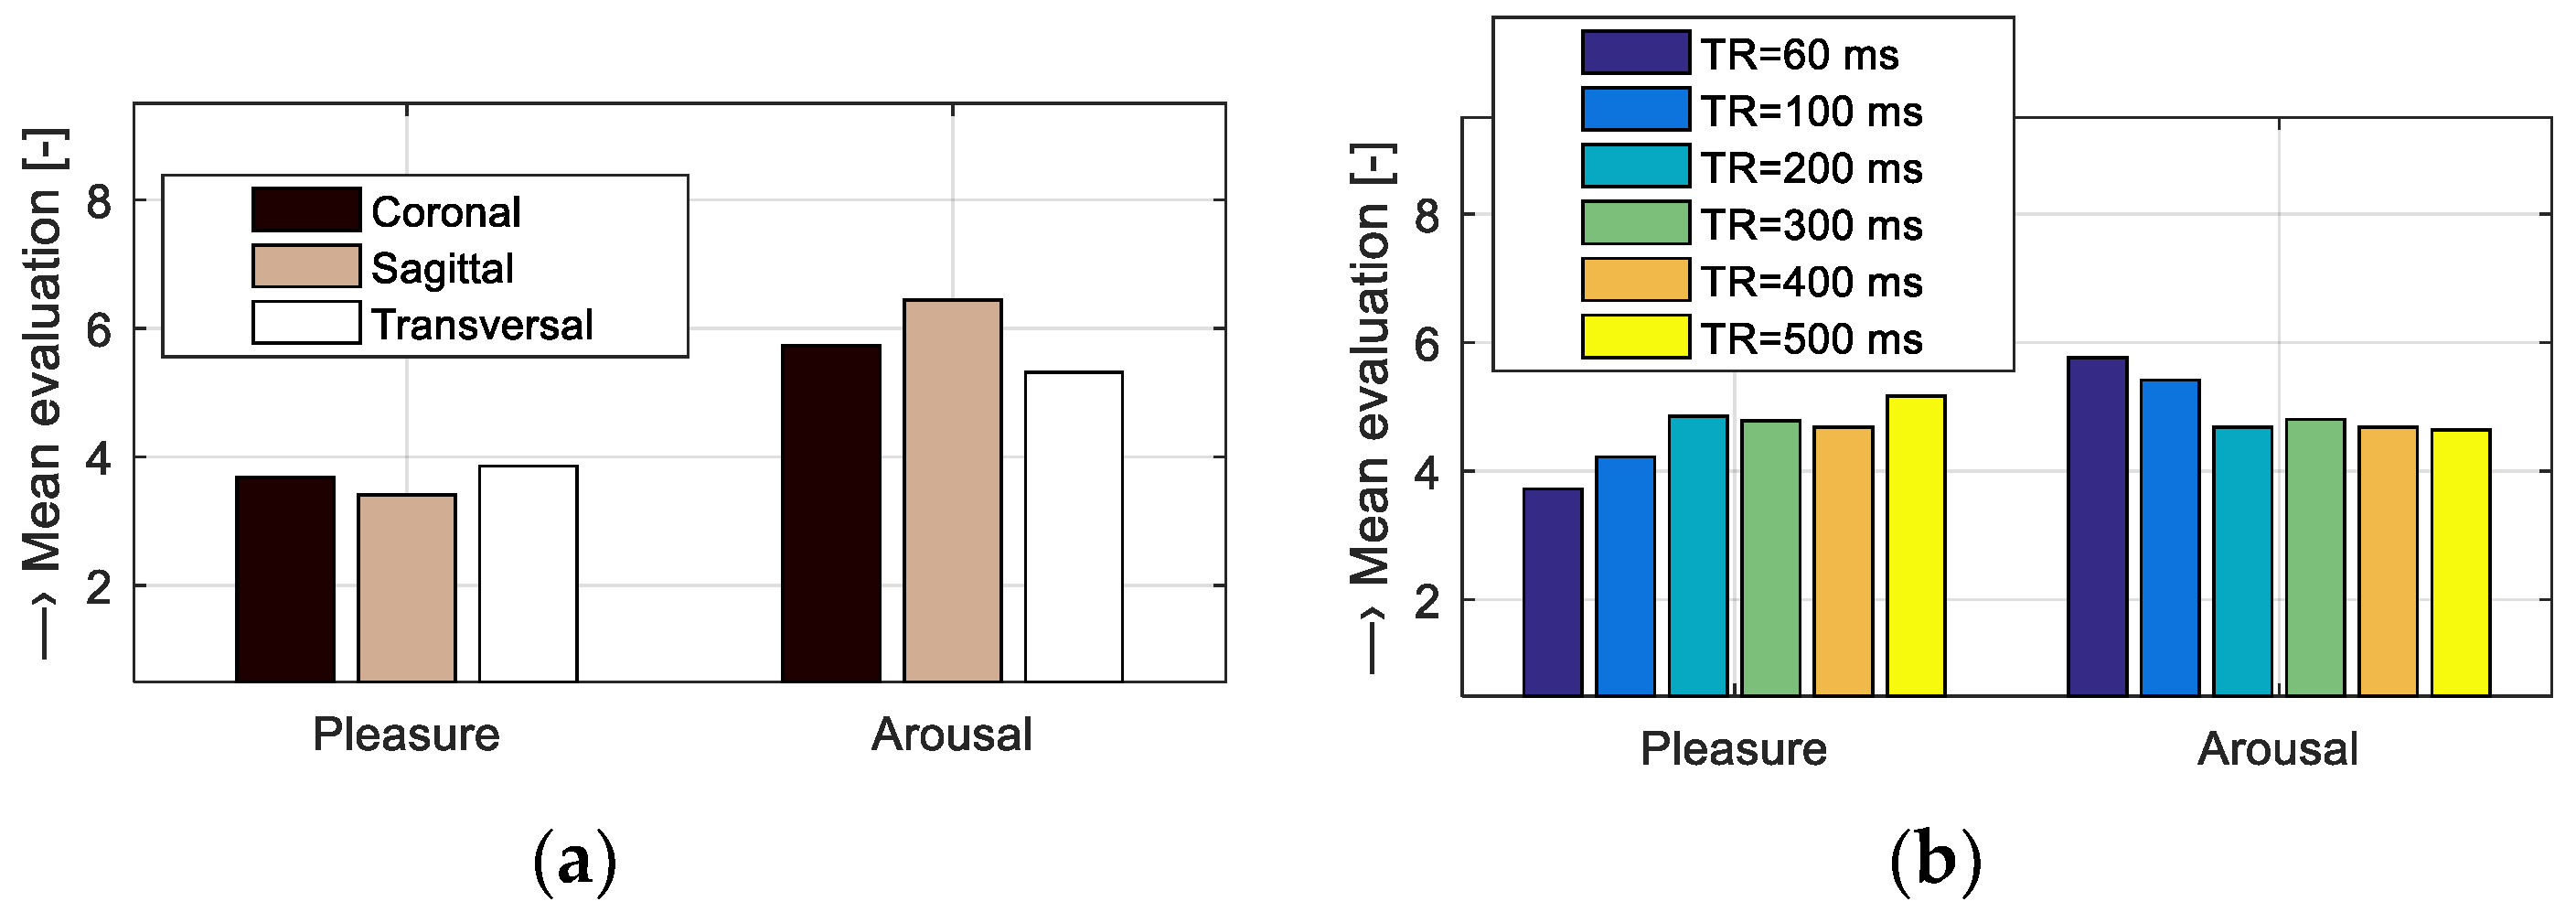
Results of the first comparison of energetic relations of vibration and noise signals are documented in Figure 5. Small differences were found for all sequence types, but the 3D-CE sequence produced the noise with minimal intensity expressed by the signal RMS parameter and SS-3Dbal calculated using the Enc0 parameter. Further investigation was aimed at the influence of the choice of slice orientation on the energy of the produced vibration and noise signals. The graphs in Figure 6 show maximum energy in the sagittal plane and minimum energy in the transversal plane. Sagittal orientation was used in the remaining experiments to explore the worst case. In accordance with our previous research [15,16,17], the current experiments confirm the influence of TR and TE times on the vibration and acoustic noise properties. Prolongation of the TE time was accompanied by a slight lowering of the final signal energy with decreased first dominant frequency FV1, as documented in Figure 7. Higher TR parameter determining the fundamental frequency FV0 had greater influence on lowering the signal energy, especially for TR = 400 and 500 ms, as can be seen in Figure 8. The obtained vibration signal energy was higher for the water phantom than for the lying person (see Table 2), due to partial attenuation of vibration pulses by higher effective weight pressing on the bottom plastic holder of the gradient coils. At the same time, the noise signal energy had its maximum for the lying male person because of higher noise induced by vibration of the upper gradient coils that are not loaded by the tested object. From a physical point of view, larger volume of a person in the MRI scanning area needs higher electrical currents in the gradient coils, causing higher Lorentz forces and greater vibration of upper gradient coils for the examined human body in comparison with the 140-mm diameter spherical testing phantom.
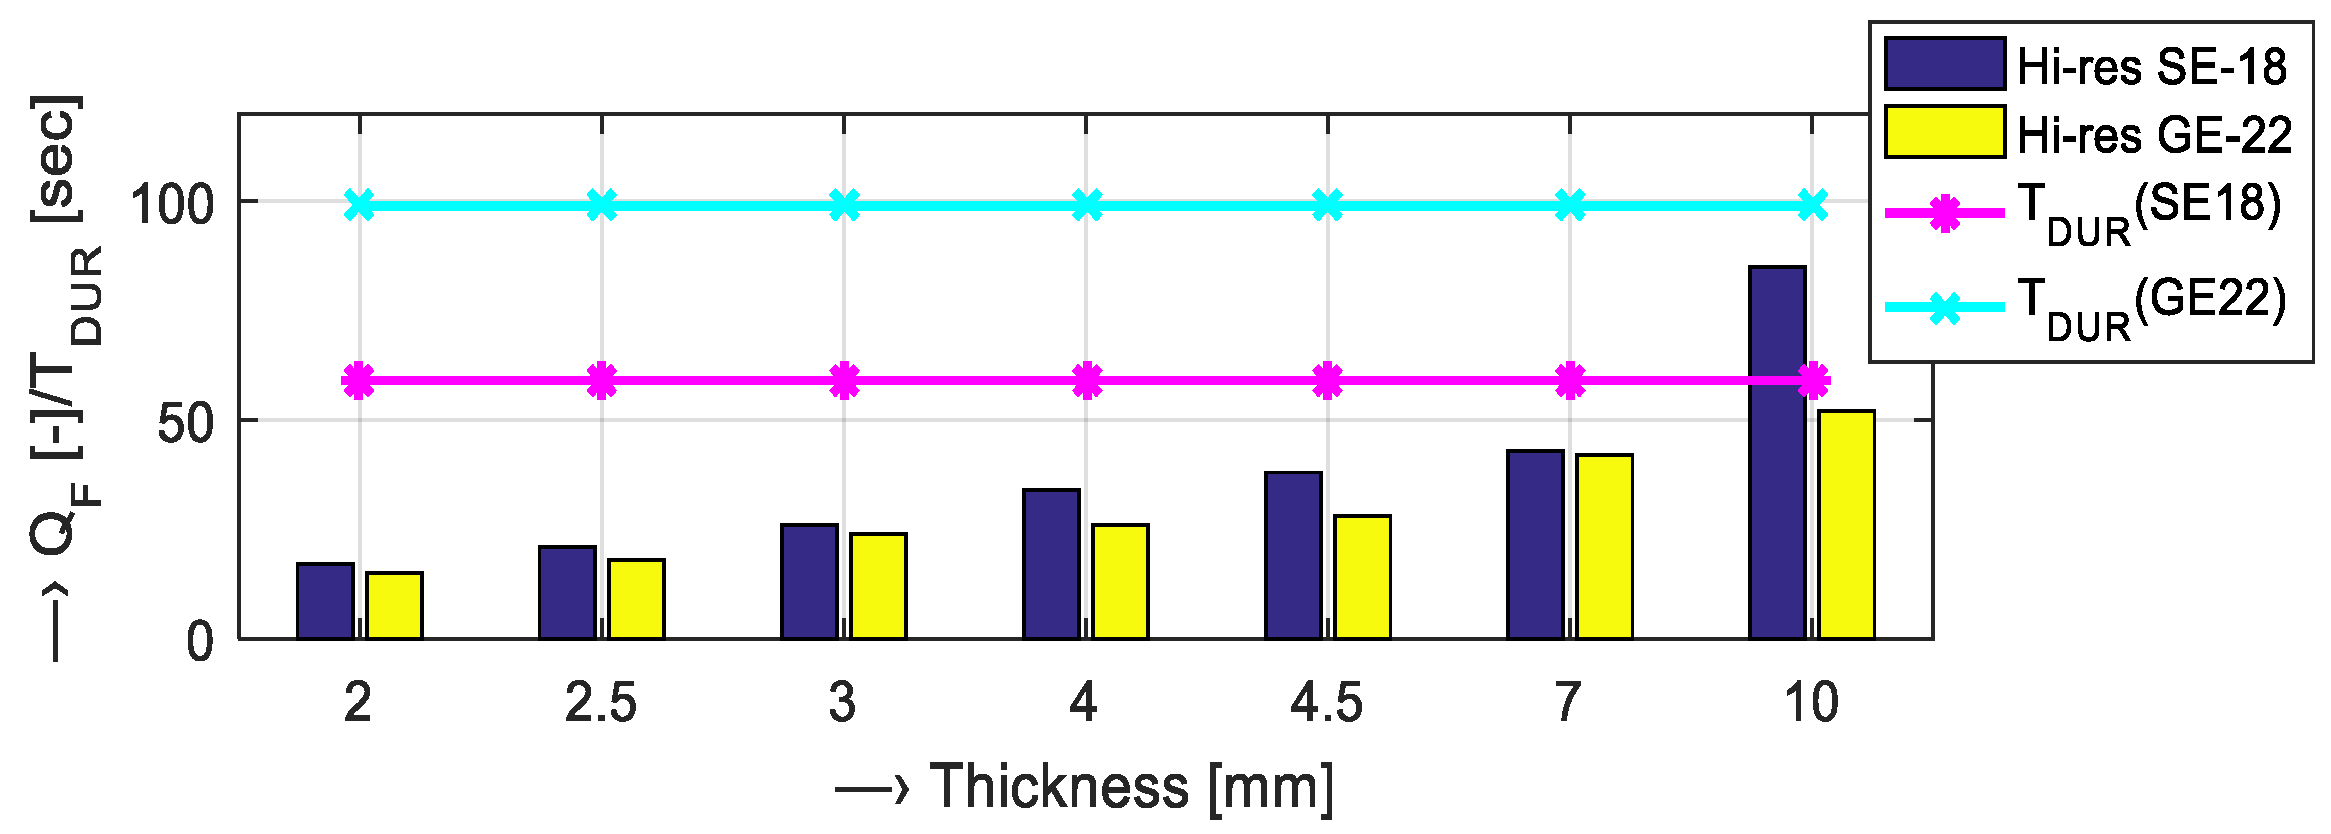
Preliminary analysis shows positive influence of increased slice thickness on the predicted MR image QF for both SE and GE Hi-Res scanning sequences—compare Figure 9. The effect of TR and NACC on TDUR and predicted QF of the executed scanning sequence is shown in Table 3 and Table 4. While the increased repetition time caused only slightly greater overall time duration, the number of accumulations affected the final time duration very much. This applies for both types of Hi-Res sequences: Increasing NACC from 1 to 16 resulted in about 4 times greater QF and about 15 times greater TDUR. The same trend was observed for increased TR, its change from 60 to 500 ms caused about 7 (1.9) times greater QF and about 7 (8) times greater TDUR for SE (GE). This course is valid also for two 3D scanning sequences, as seen in Figure 10. Here, the increased time duration was influenced also by the number of 3D phases being an equivalent to the number of slices (selected by the slice thickness) in Hi-Res sequences.
5. Conclusions
The results of the performed measurements help in precise description of the process of mechanical vibration excitation and the acoustic noise radiation in the scanning area and vicinity of the MRI device [22,23]. Comparison with a similar low-field MRI tomograph can be used for optimization of acoustic noise suppression in parallel with speech recording applied in 3D modeling of the human vocal tract [8]. The main usage of the obtained results is expected in experimental practice, when the used scan sequence and its parameters must often be changed depending on the person being tested. So far, our MRI experiments with vocal tract scanning were realized only on healthy people—typically, the trained MRI operators from the IMS and the authors of this paper themselves. In future, we plan cooperation with a medical center certified for work with patients. Then, our MRI equipment can be used for monitoring progress in treatment of diseases of the vocal cords and the vocal tract. For other users of this type of an open-air MRI device (in our country or in neighboring countries), we can only recommend choice of proper MR sequences, as well as modification of scan parameters as a compromise between noise and vibration exposition of an examined person and obtaining high-quality MR images.
We are aware of the limits of this study—at present, there exist a lot of modern MRI devices enabling parallel processing of MR images, thus rapidly shortening the necessary scanning time duration and subsequently minimizing the negative noise and vibration effect on patients. As the gradient coils are the integral part of the whole MRI equipment [6], we as users cannot make any changes to them; only external RF coils can be developed and connected to the system [24]. For the same reason, any system interference (e.g., adding new materials for damping of mechanical vibrations) cannot be recommended or advised as the output of this study.
Combination of the vibration and acoustic analysis can also be used in fault diagnosis of vibrating mechanical systems [25]. In our case, abnormal vibration and acoustic noise could reflect some fault in the MRI sequence generation. The performed measurement can also be reproducible on other types of low-field MRI devices; however, in the case of whole-body tomographs, picking up the vibration, as well as recording and measurement of the acoustic noise, are more difficult. In this case, the results obtained with an open-air device can be applied. A comparison study, including a discussion to this problem, has already been published in our last journal article [26].
The maximum noise SPL of about 78 dB (C) was measured at the closest distance from the central point of the MRI scanning area (45 cm), while the GE scan sequence with short TE and TR was running and the sagittal orientation was set. Although special hearing protection aids are not unconditionally necessary, ear plugs or ear muffs can contribute to the comfort of the examined person. If the scanned part of the human body inserted between the upper and the lower gradient coils is farther from the head, the ears are exposed by much lower noise. However, the absolute values of the vibration and noise signal RMS depend on signal amplification by the recording device, microphone directional pattern, and vibration sensor placement. The measurement of the noise itself is affected by a chosen measuring range (Lo/Hi) and a weighting filter (A/C) of the SPL meter. Therefore, direct comparison with the three relative energetic parameters calculated by Equations (3) and (4) is not possible. The scanning time duration depends on the chosen number of slices and their thickness. For 3D and Hi-Res sequences, it is usually lower than 15 minutes (typically about 3 to 5 minutes), so the vibration and noise exposition of the examined person does not mean a threat to his/her health. If more detailed MR images with higher quality factor QF must be done (e.g., scans of particular parts of the human brain, the eye, the middle and inner ear, etc.), the patient will be exposed to the vibration and acoustic noise for a longer time TDUR (exceeding half an hour), which might be followed by a rather great physiological and psychological stress. Only urgent cases justify using these scan parameters in medical practice.
Our next research will be focused on detailed investigation of the negative influence of the generated acoustic noise on the physiological and psychological state of the examined person lying in the scanning area of the low-field MRI device. This negative influence on a human body can be monitored by measuring the blood pressure (BP) and heart rate (HR), as the stress is manifested by changes in the bloodstream. These changes can also be successfully determined directly from MR images of different parts of the human body—typically from the veins in the handbreadth area [27]. In addition, we plan parallel measurement of BP and HR parameters of the currently scanned person during execution of the whole MR scan sequence. For this purpose, we will apply photo-plethysmography (PPG) using optical sensors for non-invasive retrieval of vital information about the cardiovascular system from the skin surface [28,29]. Variations in the photo-detector signal are related to changes in the blood volume inside the tissue. Signal filtering and further processing will be necessary to obtain a clean PPG waveform, which can then be used to derive the instantaneous heart rate. This optical-based approach is fully in compliance with the requirements for sensors working in the magnetic field environment where RF and electromagnetic disturbances are present.
Author Contributions
Conception and design of the study, J.P., A.P., and I.F.; measurement, J.P.; data collection and processing, J.P.; writing, J.P. and A.P.); English correction, A.P.; paper review and advice, I.F.
Funding
This work was funded by the Slovak Scientific Grant Agency project VEGA 2/0001/17 and the Slovak Research and Development Agency, project no. APVV-15-0029.
Acknowledgments
We would like to thank all of our colleagues and other volunteers who participated in the listening test evaluation experiment.
Conflicts of Interest
The authors declare no conflicts of interest.
References
- Wellard, R.M.; Ravasio, J.P.; Guesne, S.; Bell, C.; Oloyede, A.; Tevelen, G.; Pope, J.M.; Momot, K.I. Simultaneous magnetic resonance imaging and consolidation measurement of articular cartilage. Sensors 2014, 14, 7940–7958. [Google Scholar] [CrossRef]
- Filippi, M.; Preziosa, P.; Rocca, M.A. Brain mapping in multiple sclerosis: Lessons learned about the human brain. NeuroImage 2019, 190, 32–45. [Google Scholar] [CrossRef] [PubMed]
- Masqsood, M.; Nazir, F.; Khan, U.; Aadil, F.; Jamal, H.; Mehmood, I.; Song, O. Transfer learning assisted classification and detection of Alzheimer’s disease stages using 3D MRI scans. Sensors 2019, 19, 2645. [Google Scholar] [CrossRef] [PubMed]
- Nedoma, J.; Kepak, S.; Fajkus, M.; Cubik, J.; Siska, P.; Martinek, R.; Krupa, P. Magnetic resonance imaging compatible non-invasive fibre-optic sensors based on the Bragg gratings and interferometers in the application of monitoring heart and respiration rate of the human body: A comparative study. Sensors 2018, 18, 3713. [Google Scholar] [CrossRef] [PubMed]
- Fischbach, K.; Kosiek, O.; Friebe, B.; Wybranski, C.; Schnackenburg, B.; Schmeisser, A.; Smid, J.; Ricke, J.; Pech, M. Cardiac Magnetic Resonance Imaging Using an Open 1.0T MR Platform: A Comparative Study ith a 1.5T Tunnel System. Pol. J. Radiol. 2017, 82, 498–505. [Google Scholar] [CrossRef] [PubMed]
- Esaote SpA. E-Scan Opera. User’s Manual; Revision A; Esaote SpA: Genoa, Italy, 2008. [Google Scholar]
- Panych, L.P.; Madore, B. The physics of MRI safety. J. Magn. Reson. Imaging 2018, 47, 28–43. [Google Scholar] [CrossRef] [PubMed]
- Schickhofer, L.; Malinen, J.; Mihaescu, M. Compressible flow simulations of voiced speech using rigid vocal tract geometries acquired by MRI. J. Acoust. Soc. Am. 2019, 145, 2049–2061. [Google Scholar] [CrossRef] [PubMed]
- Bresch, E.; Nielsen, J.; Nayak, K.; Narayanan, S. Synchronized and noise-robust audio recordings during real-time magnetic resonance imaging scans. J. Acoust. Soc. Am. 2006, 120, 1791–1794. [Google Scholar] [CrossRef] [PubMed]
- Optoacoustics, Ltd. FOMRI-III™ Fiber Optic Microphone for Functional MRI (Version 1.2, January 2010). Available online: http://www.optoacoustics.com/ (accessed on 11 April 2012).
- Alimohammadi, I.; Kanrash, F.A.; Abolaghasemi, J.; Afrazandeh, H.; Rahmani, K. Effect of Chronic Noise Exposure on Aggressive Behavior of Automotive Industry Workers. Int. J. Occup. Environ. Med. 2018, 9, 170–175. [Google Scholar] [CrossRef] [PubMed]
- Diedrichsen, J.; Balsters, J.H.; Flavell, J.; Cussans, E.; Ramnani, R. A probabilistic MR atlas of the human cerebellum. NeuroImage 2009, 46, 39–46. [Google Scholar] [CrossRef] [PubMed]
- Bernstein, M.A.; King, K.F.; Zhou, X.J. Handbook of MRI Pulse Sequences; Elsevier Academic Press: Burlington, MA, USA, 2004. [Google Scholar]
- Boudraaa, A.-O.; Fabien Salzenstein, F. Teager–Kaiser energy methods for signal and image analysis: A review. Digit. Signal Process. 2018, 78, 338–375. [Google Scholar] [CrossRef]
- Přibil, J.; Přibilová, A.; Frollo, I. Mapping and spectral analysis of acoustic vibration in the scanning area of the weak field magnetic resonance imager. J. Vib. Acoust. 2014, 136, 51005. [Google Scholar] [CrossRef]
- Přibil, J.; Přibilová, A.; Frollo, I. Comparison of mechanical vibration and acoustic noise in the open-air MRI. Appl. Acoust. 2016, 105, 13–23. [Google Scholar] [CrossRef]
- Přibil, J.; Přibilová, A.; Frollo, I. Analysis of spectral properties of acoustic noise produced during magnetic resonance imaging. Appl. Acoust. 2012, 73, 687–697. [Google Scholar] [CrossRef]
- Trabelsi, I.; Bouhlel, M.S.; Dey, N. Discrete and continuous emotion recognition using sequence kernels. Int. J. Intell. Eng. Inform. 2017, 5, 194–205. [Google Scholar] [CrossRef]
- Nicolau, M.A.; Gunes, H.; Pantic, M. Continuous Prediction of Spontaneous Affect from Multiple Cues and Modalities in Valence-Arousal Space. IEEE Trans. Affect. Comput. 2011, 2, 92–105. [Google Scholar] [CrossRef]
- Přibil, J.; Přibilová, A. Internet Application for Collective Realization of Speech Evaluation by Listening Tests. In Proceedings of the International Conference on Applied Electronics (AE2013), Plzeň, Czech Republic, 10–12 September 2013; pp. 225–228. [Google Scholar]
- Bradley, M.M.; Lang, P.J. The International Affective Digitized Sounds (IADS-2): Affective Ratings of Sounds and Instruction Manual, 2nd ed.; Technical Report B-3; University of Florida: Gainesville, FL, USA, 2007. [Google Scholar]
- Přibil, J.; Přibilová, A.; Frollo, I. Analysis of Energy Relations between Noise and Vibration Signals in the Scanning Area of an Open-Air MRI Device. In Proceedings of the 5th International Electronic Conference on Sensors and Applications, 15–30 November 2018. [Google Scholar] [CrossRef]
- Přibil, J.; Přibilová, A.; Frollo, I. Analysis of Energy Relations between Noise and Vibration Produced by a Low-Field MRI Device. (to be published). [CrossRef]
- Přibil, J.; Gogola, D.; Dermek, T.; Frollo, I. Design, Realization and Experiments with a new RF Head Probe Coil for Human Vocal Tract Imaging in an NMR device. Meas. Sci. Rev. 2012, 12, 98–103. [Google Scholar] [CrossRef]
- Glowacz, A. Fault detection of electric impact drills and coffee grinders using acoustic signals. Sensors 2019, 19, 269. [Google Scholar] [CrossRef] [PubMed]
- Přibil, J.; Přibilová, A.; Frollo, I. Vibration and noise in magnetic resonance imaging of the vocal tract: Differences between whole-body and open-air devices. Sensors 2018, 18, 1112. [Google Scholar] [CrossRef] [PubMed]
- Valkovič, L.; Juráš, V.; Dermek, T.; Vojtíšek, L.; Frollo, I. The effect of stress on MR image contrast in the human hand at low field NMR. In ELITECH ’10, Proceedings of the 12th Conference of Doctoral Students; Kozáková, A., Ed.; Faculty of Electrical Engineering and Information Technology, Slovak University of Technology: Bratislava, Slovakia, 2010; ISBN 978-80-227-3303-8. [Google Scholar]
- Hu, S.; Peris, V.A.; Echiadis, A.; Zheng, J.; Shi, P. Development of effective photoplethysmographic measurement techniques: From contact to non-contact and from point to imaging. In Proceedings of the 2009 Annual International Conference of the IEEE Engineering in Medicine and Biology Society, Minneapolis, MN, USA, 3–6 September 2009. [Google Scholar] [CrossRef]
- Daimiwal, N.; Sundhararajan, M.; Shriram, R. Comparative analysis of LDR and OPT 101 detectors in reflectance type PPG sensor. In Proceedings of the International Conference on Communication and Signal Processing, Melmaruvathur, India, 3–5 April 2014. [Google Scholar] [CrossRef]
Figure 1.
Graphs of (a) measured sensors’ sensitivities and (b) relative frequency responses [dB] in the range of 20 Hz to 2 kHz; fref =125 Hz; UexcBa0 =360 mV; Ba0 = {12.9 (SB-1), 2.45 (HM692), 26.0 (SDT1)} mV/m·s−2.
Figure 1.
Graphs of (a) measured sensors’ sensitivities and (b) relative frequency responses [dB] in the range of 20 Hz to 2 kHz; fref =125 Hz; UexcBa0 =360 mV; Ba0 = {12.9 (SB-1), 2.45 (HM692), 26.0 (SDT1)} mV/m·s−2.
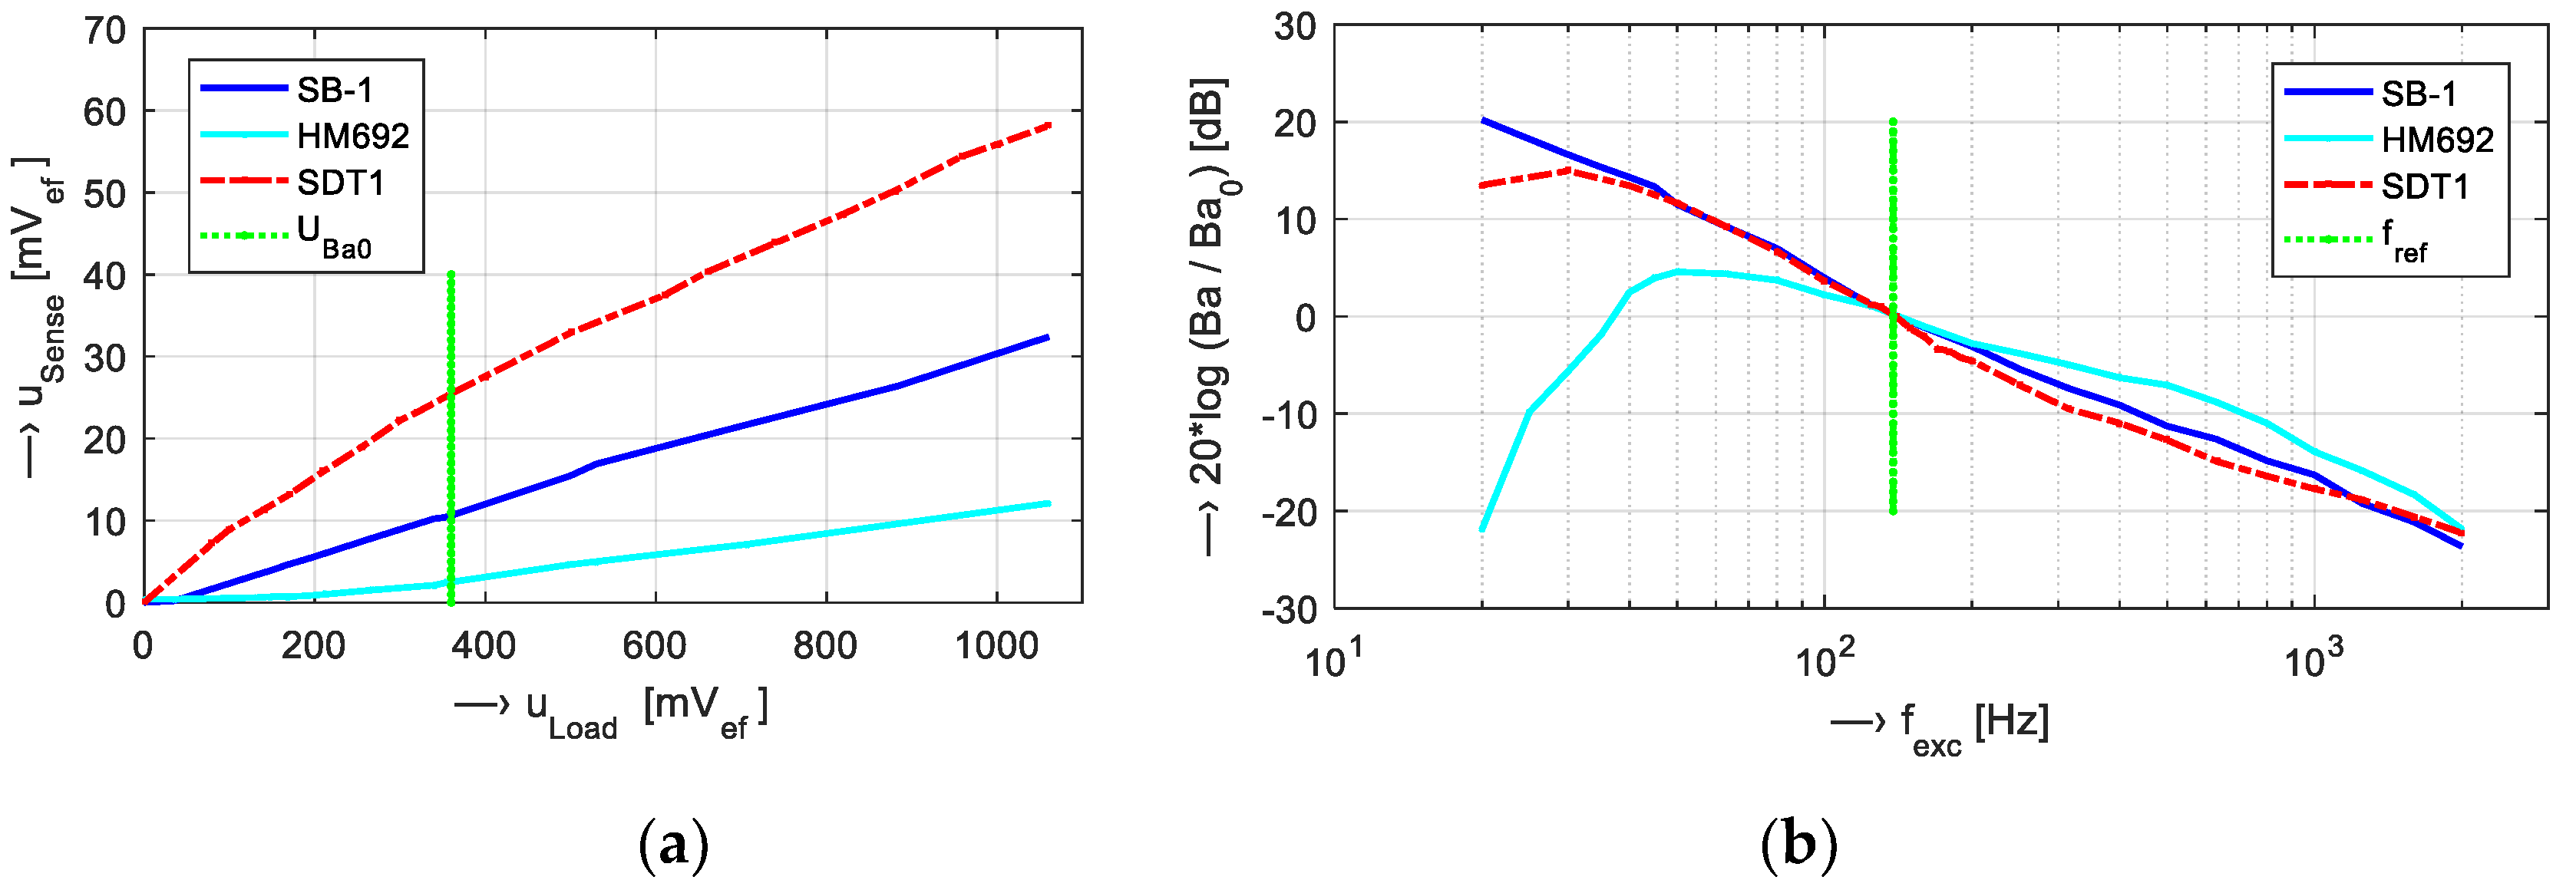
Figure 2.
Arrangement photo of SPL noise measurement and parallel recording of noise and vibration signals of the open-air MRI device Opera using the testing phantom.
Figure 2.
Arrangement photo of SPL noise measurement and parallel recording of noise and vibration signals of the open-air MRI device Opera using the testing phantom.
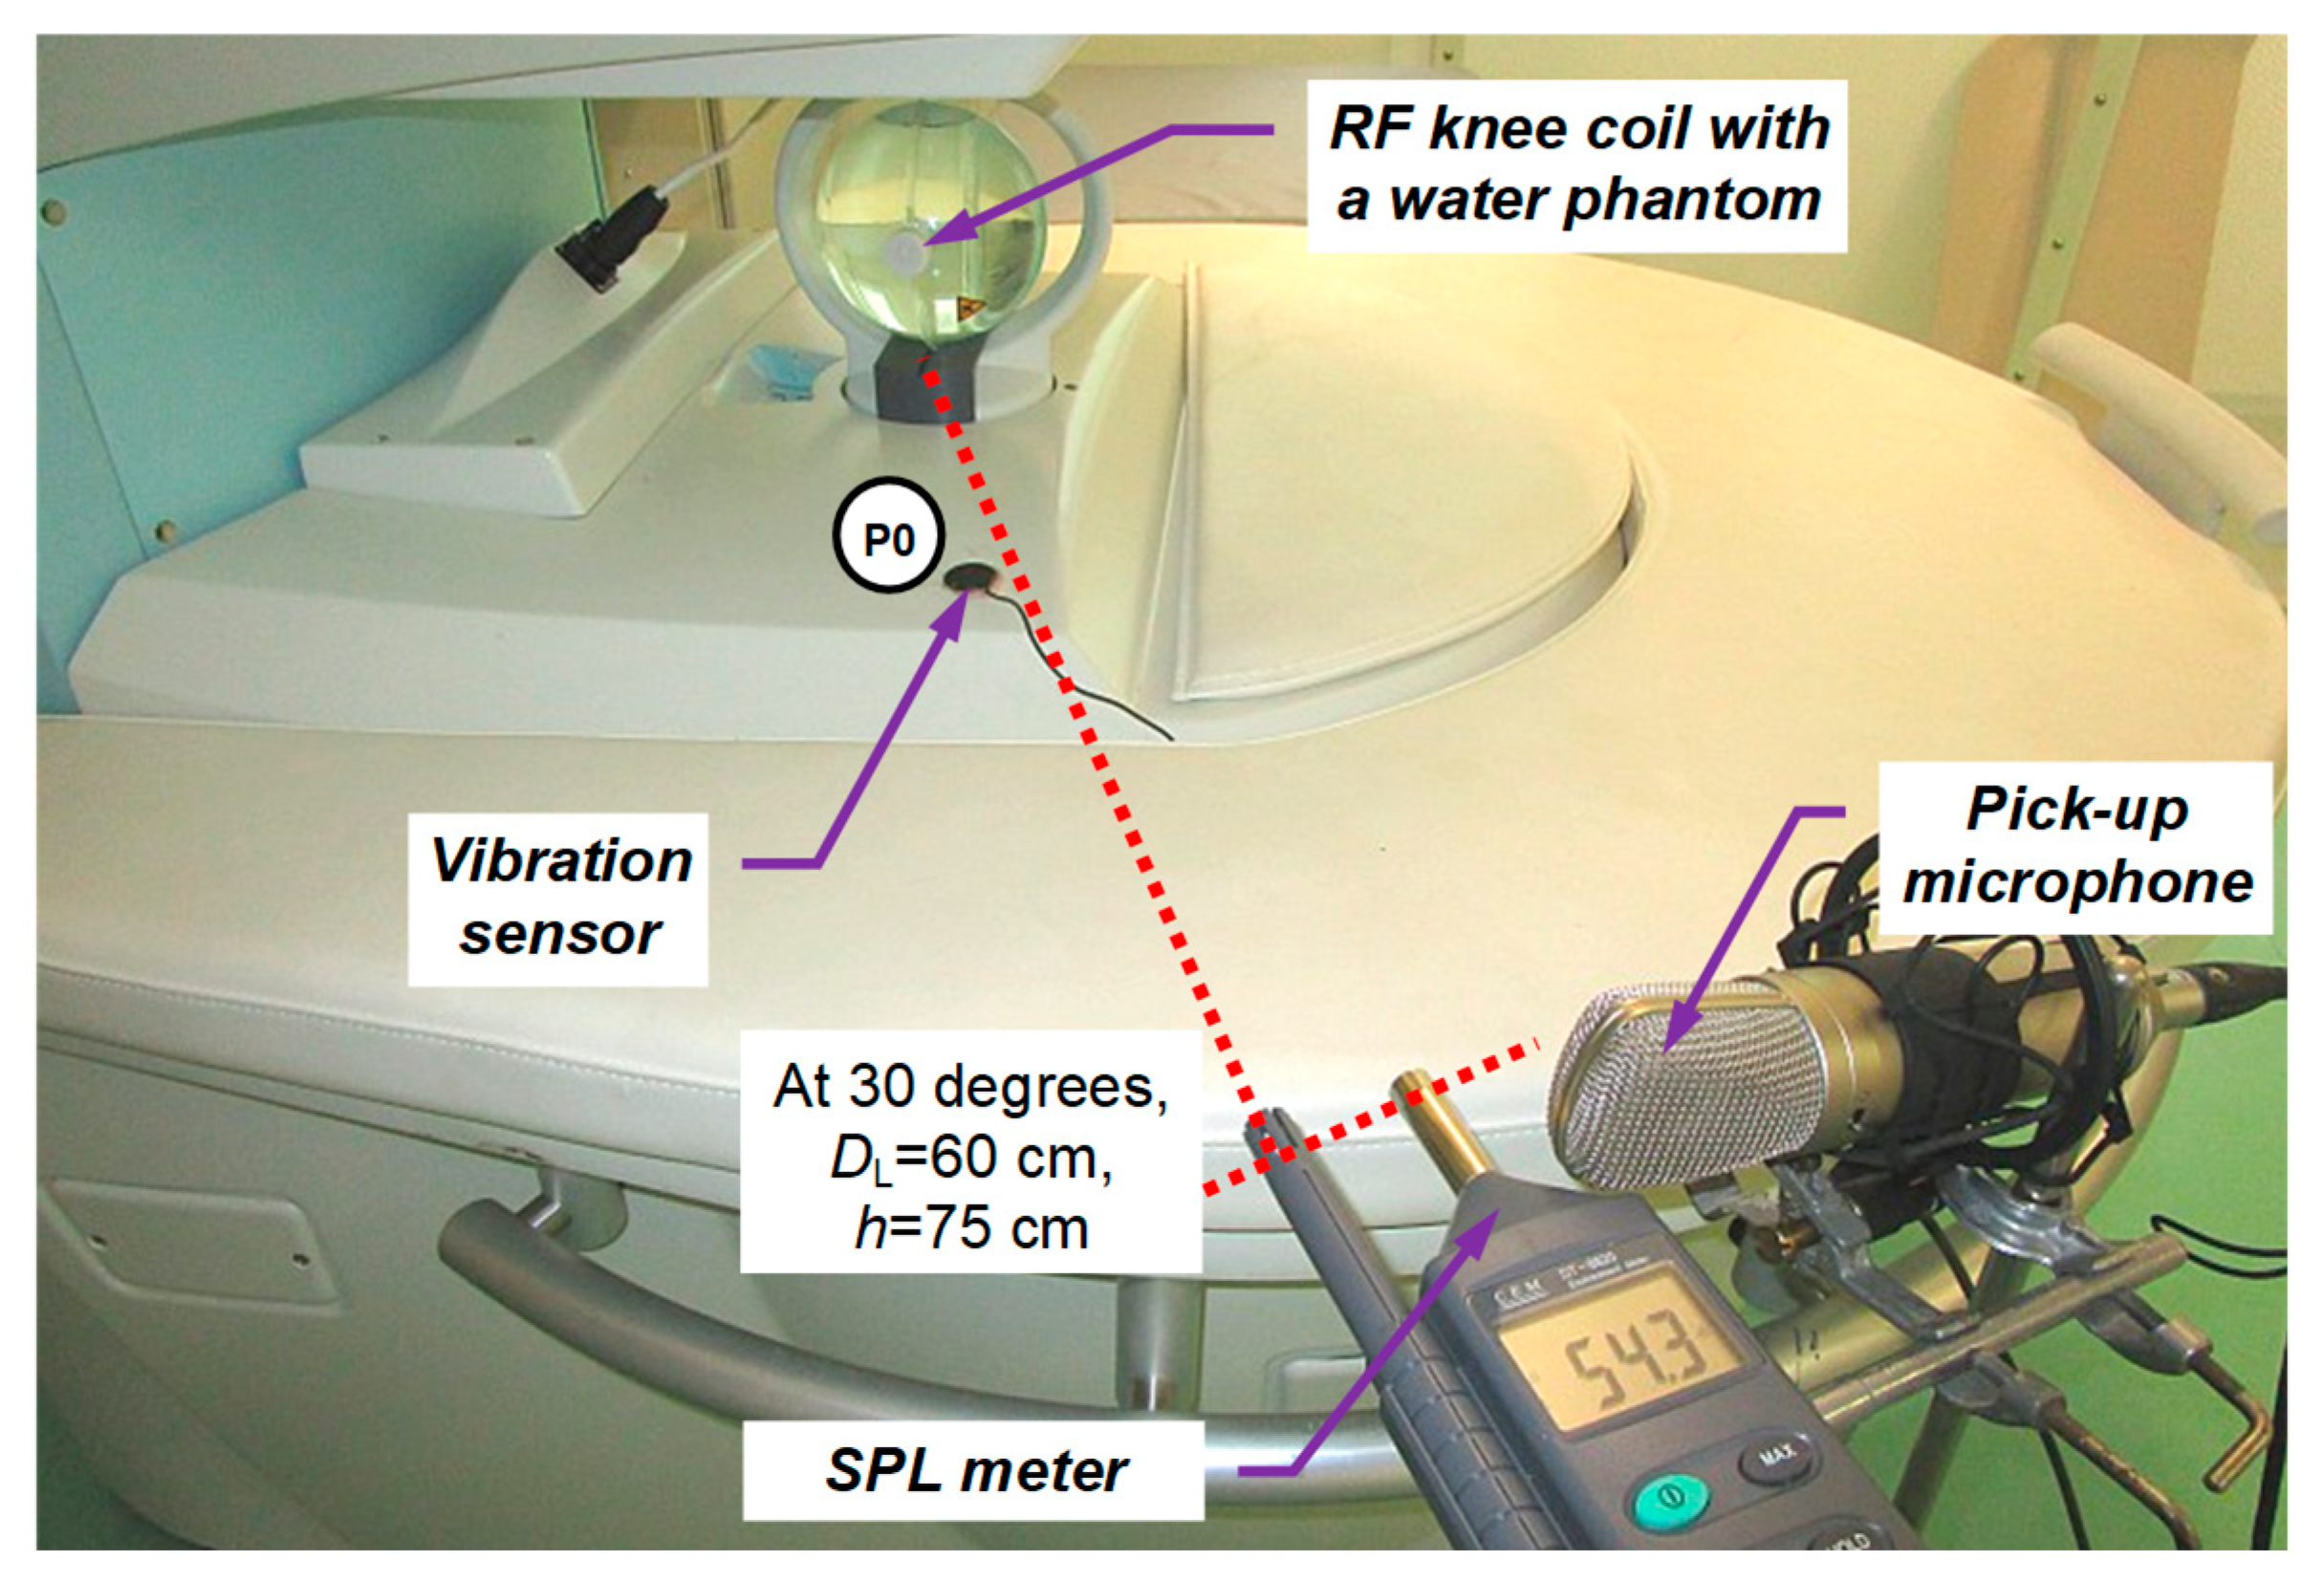
Figure 3.
Mapping of the acoustic noise SPL at different distances DX = {45, 50, 55, 60, 70, 80, and 90} cm from the middle of the scanning area of the MRI device for SE/GE sequences: (a) SPL values together with the background ones (SPL0), and (b) box-plot of their basic statistical parameters.
Figure 3.
Mapping of the acoustic noise SPL at different distances DX = {45, 50, 55, 60, 70, 80, and 90} cm from the middle of the scanning area of the MRI device for SE/GE sequences: (a) SPL values together with the background ones (SPL0), and (b) box-plot of their basic statistical parameters.
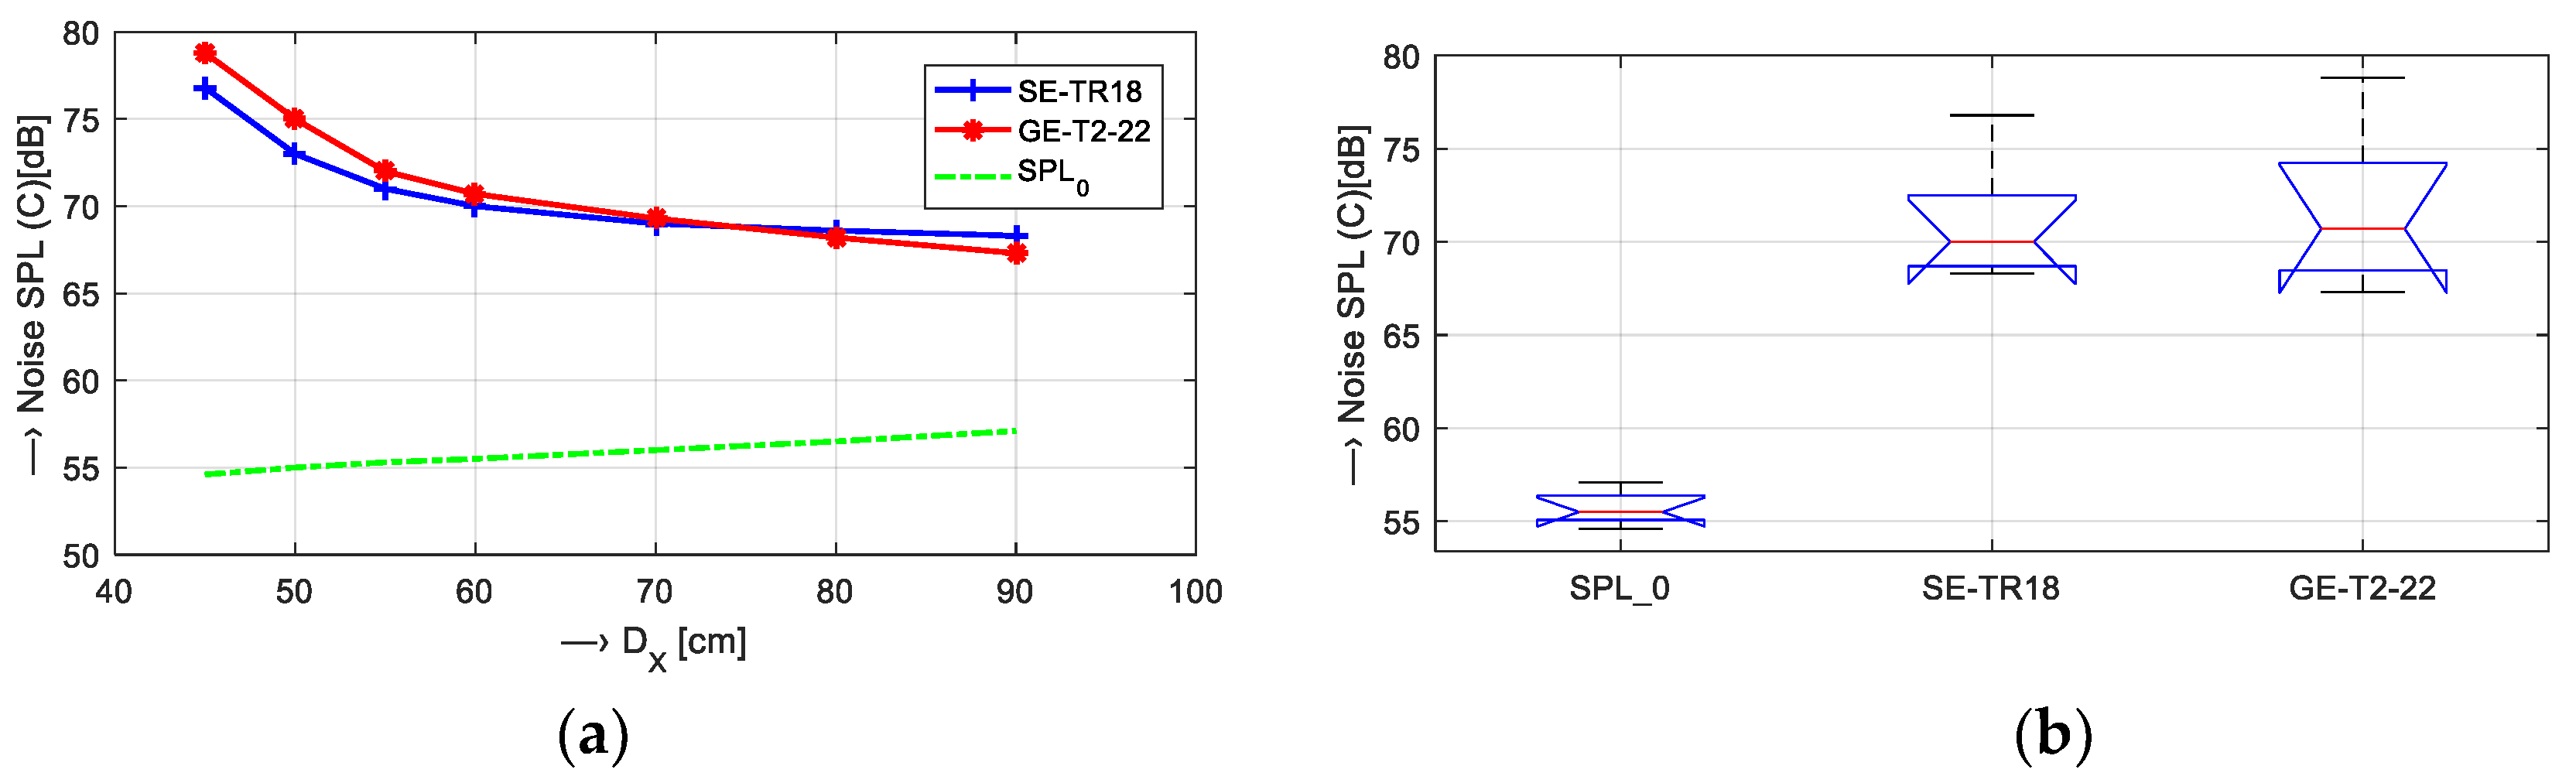
Figure 4.
Block diagram of processing and comparison of vibration and noise signals.

Figure 5.
Comparison of energetic relations of vibration and noise signals for different sequence types—Hi-Res {SE-HE, SE-HF, GE-T2} and 3D {SS-3Dbal, 3D-CE}; (a) signal RMS together with SPL values; (b) bar-graphs of basic statistical parameters of Enc0 values; (c) corresponding histograms for Enr0 parameter. In all cases, a sagittal slice orientation was used.
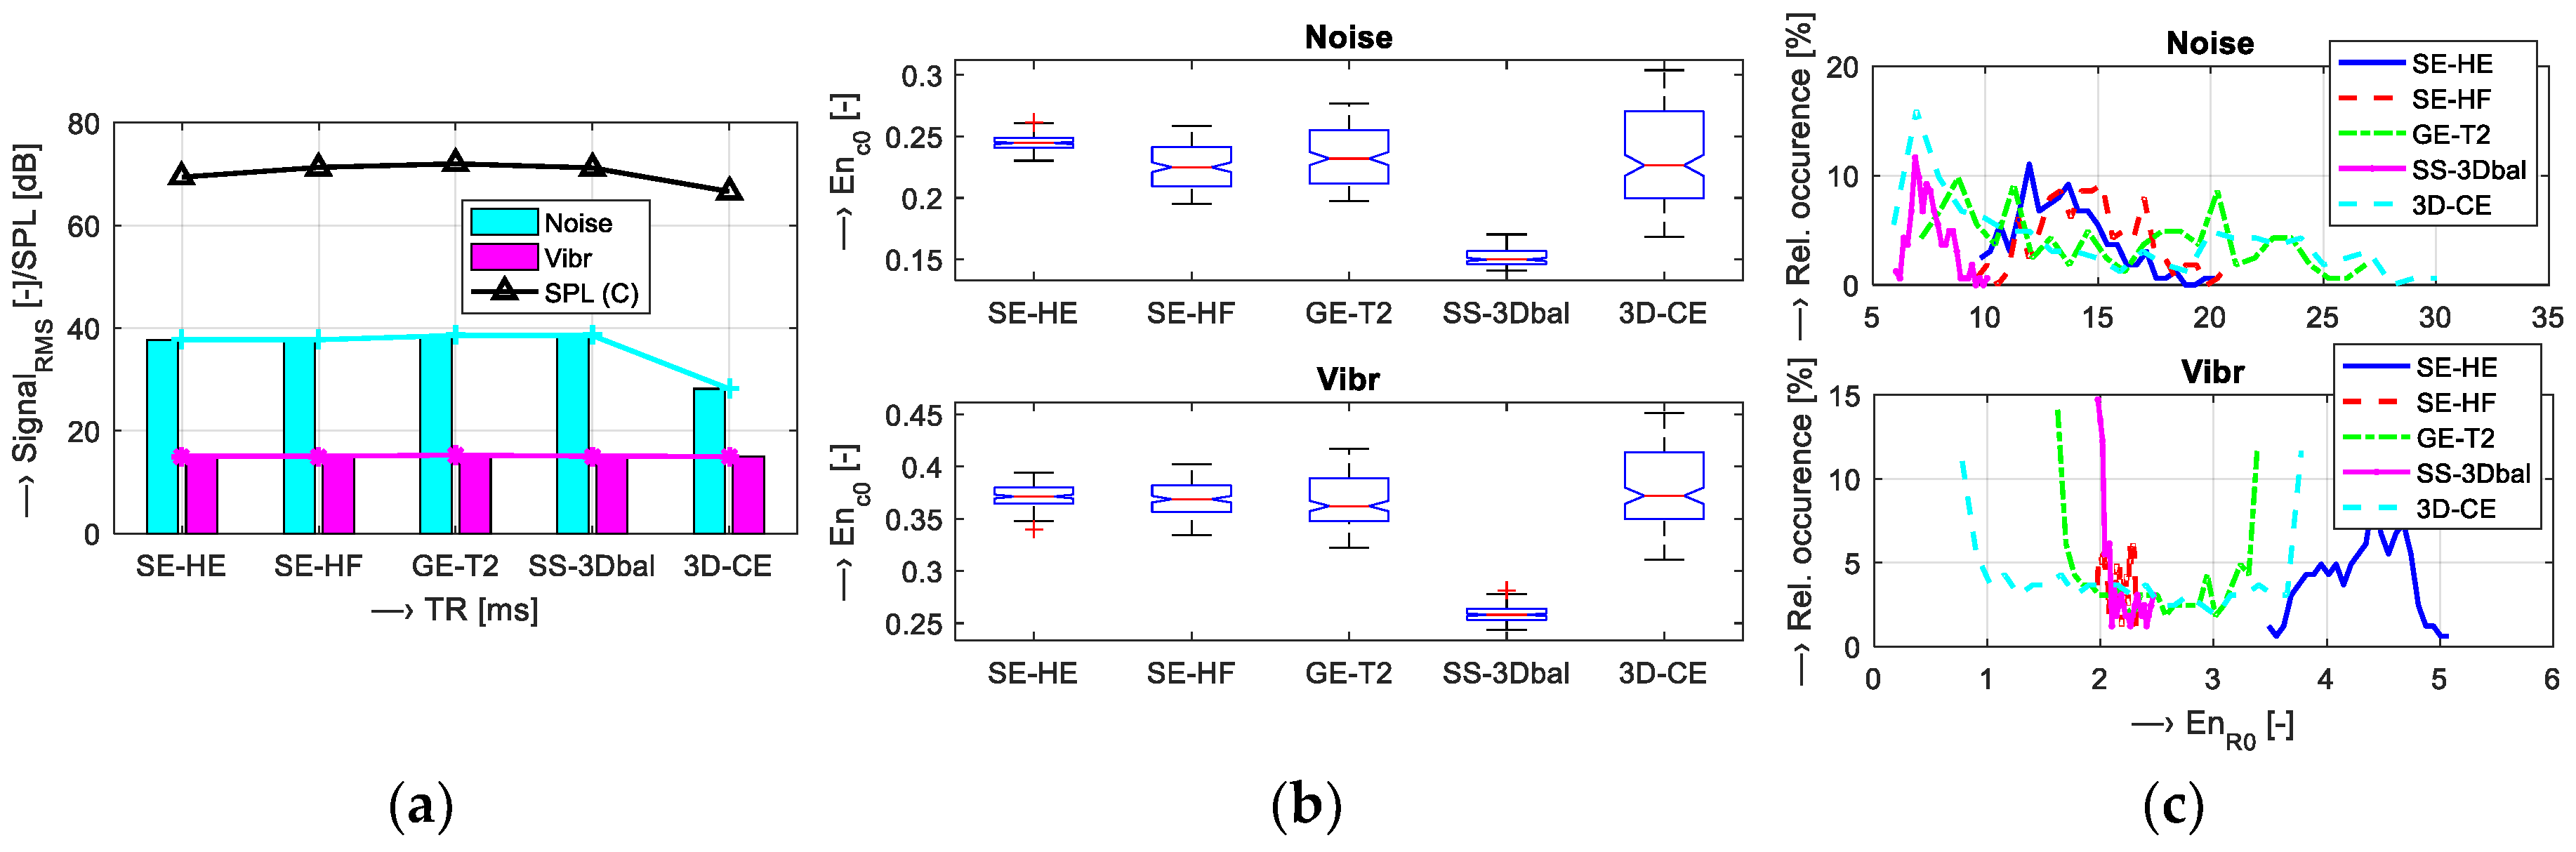
Figure 6.
Visualization of vibration signal features for different slice orientations: {Coronal, sagittal, transversal}; (a) bar-graph of signal RMS values; (b) histograms of Enc0; (c) mutual Fv1/Fv2 positions for Hi-Res SE scan sequences with TE = 18 ms and TR = 500 ms.
Figure 6.
Visualization of vibration signal features for different slice orientations: {Coronal, sagittal, transversal}; (a) bar-graph of signal RMS values; (b) histograms of Enc0; (c) mutual Fv1/Fv2 positions for Hi-Res SE scan sequences with TE = 18 ms and TR = 500 ms.

Figure 7.
Visualization of vibration signal features for different TE times: {18, 22, 26} ms; (a) bar-graphs of signal RMS values and basic statistical parameters: (b) EnTK; (c) Enc0; (d) Enr0; (e) mean mutual Fv1/Fv2 positions for Hi-Res SE-HF sequences (TR = 500 ms, sagittal orientation).
Figure 7.
Visualization of vibration signal features for different TE times: {18, 22, 26} ms; (a) bar-graphs of signal RMS values and basic statistical parameters: (b) EnTK; (c) Enc0; (d) Enr0; (e) mean mutual Fv1/Fv2 positions for Hi-Res SE-HF sequences (TR = 500 ms, sagittal orientation).

Figure 8.
Visualization of energetic relations of vibration and noise signals for different TR times: {60, 100, 200, 300, 400, 500} ms; (a) signal RMS together with noise SPL values; (b) mean Enc0; (c) mean Enr0; (d) mean EnTK; used Hi-Res GE-T2 sequences with TE = 22 ms, and sagittal orientation.
Figure 8.
Visualization of energetic relations of vibration and noise signals for different TR times: {60, 100, 200, 300, 400, 500} ms; (a) signal RMS together with noise SPL values; (b) mean Enc0; (c) mean Enr0; (d) mean EnTK; used Hi-Res GE-T2 sequences with TE = 22 ms, and sagittal orientation.

Figure 9.
Influence of the thickness of the slice sample on the predicted quality factor and the time duration for the scan sequences Hi-Res SE18 HE and GE T2 22 (TR = 500 ms, NACC = 1).
Figure 9.
Influence of the thickness of the slice sample on the predicted quality factor and the time duration for the scan sequences Hi-Res SE18 HE and GE T2 22 (TR = 500 ms, NACC = 1).

Figure 10.
Influence of the number of FID signal accumulations on (a) the predicted image quality factor and (b) the time duration; analyzed scan sequences SS-3Dbalanced (TE = 10 ms, TR=20 ms, 3D phases = 24) and 3D-CE (TE = 30 ms, TR = 40 ms, 3D phases = 8).
Figure 10.
Influence of the number of FID signal accumulations on (a) the predicted image quality factor and (b) the time duration; analyzed scan sequences SS-3Dbalanced (TE = 10 ms, TR=20 ms, 3D phases = 24) and 3D-CE (TE = 30 ms, TR = 40 ms, 3D phases = 8).
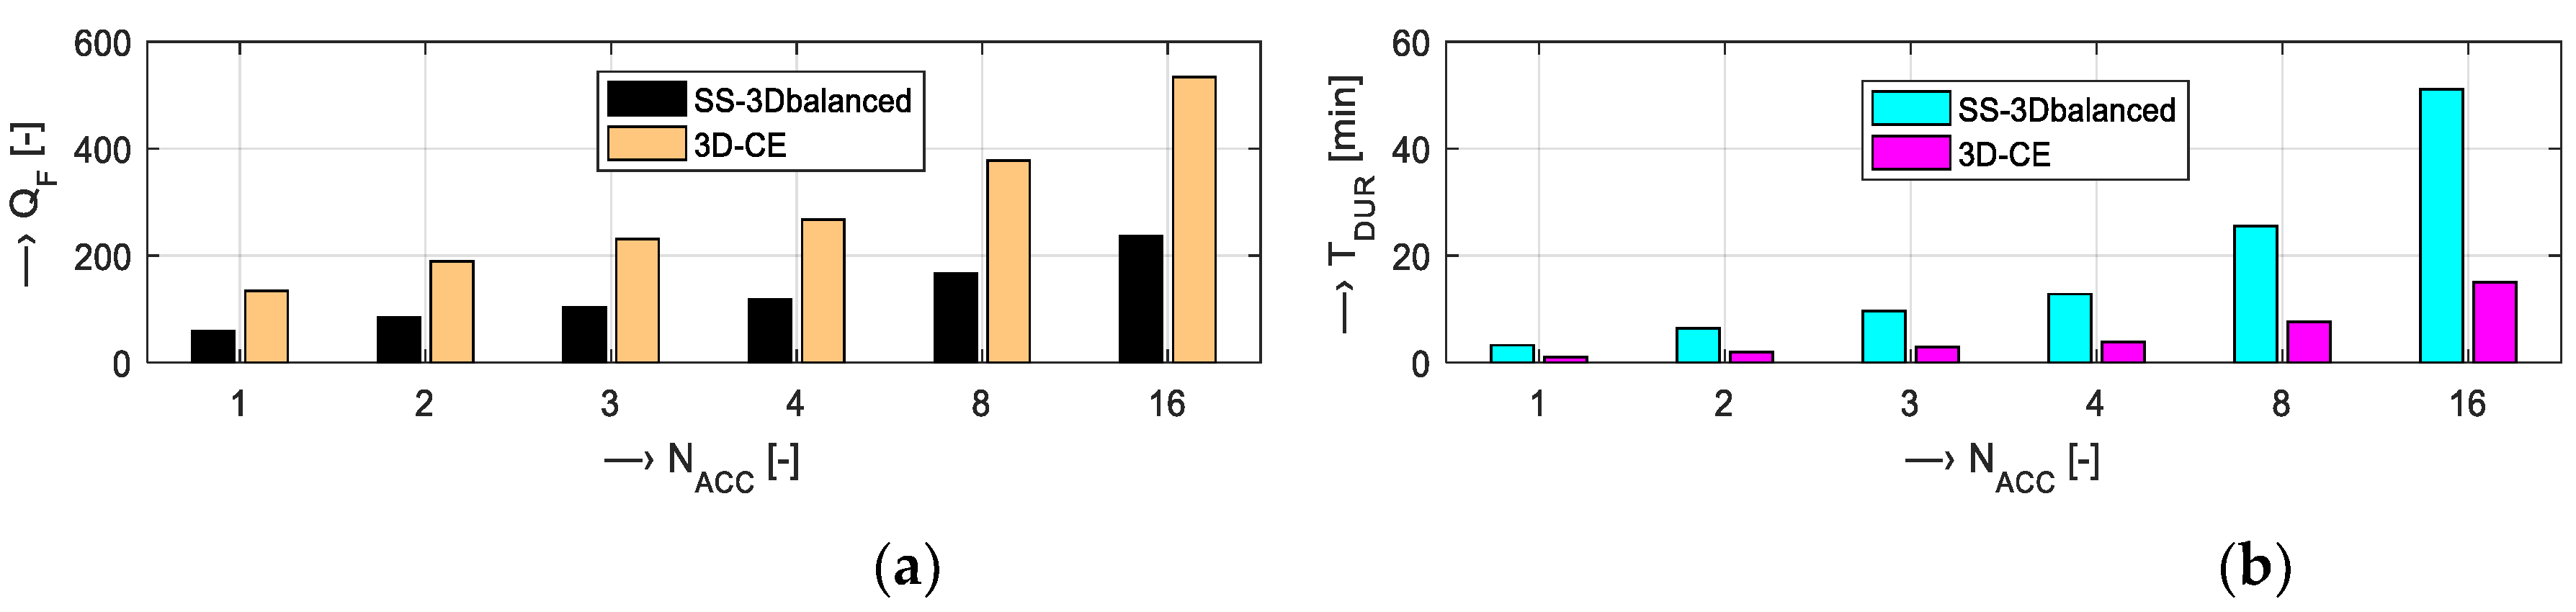
Figure 11.
Screen shot of the user communication HTML page used to perform the listening test evaluation.
Figure 11.
Screen shot of the user communication HTML page used to perform the listening test evaluation.
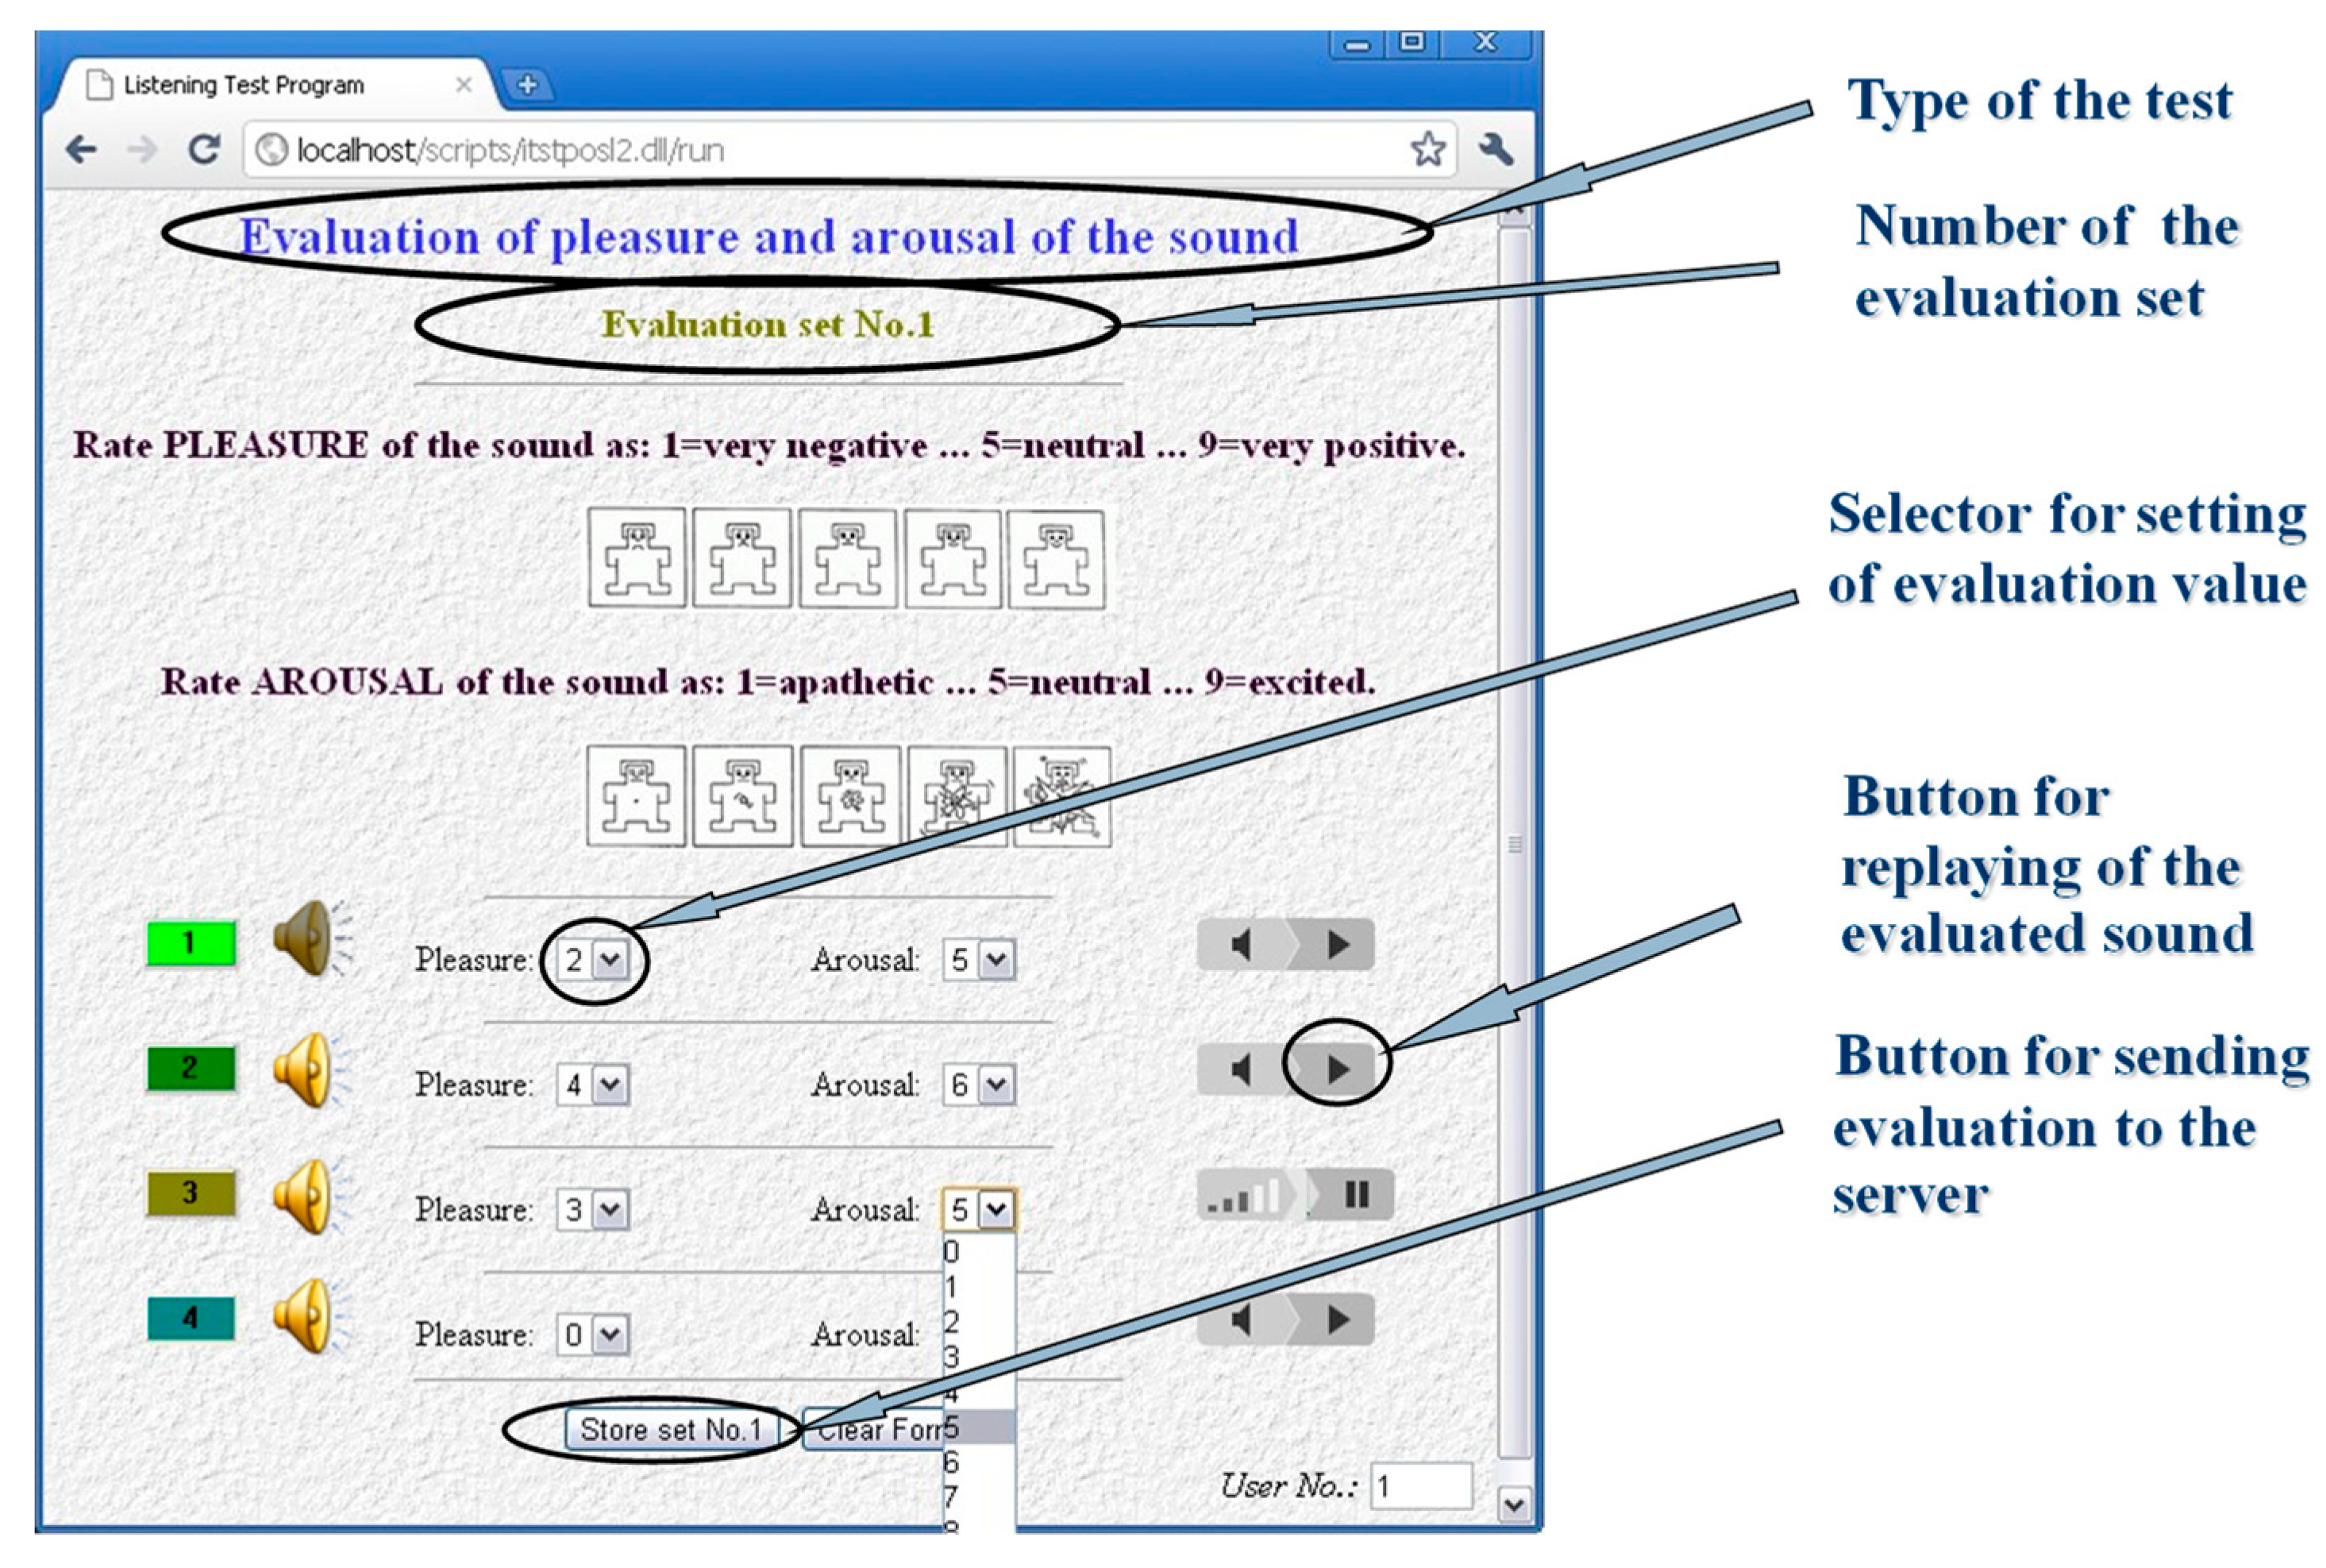
Figure 12.
Bar-graph comparisons of evaluated pleasure and arousal parameters for MRI noises of (a) the Hi-Res SE sequence with different slice orientations, and (b) the Hi-Res GE sequence with different TR times.
Figure 12.
Bar-graph comparisons of evaluated pleasure and arousal parameters for MRI noises of (a) the Hi-Res SE sequence with different slice orientations, and (b) the Hi-Res GE sequence with different TR times.

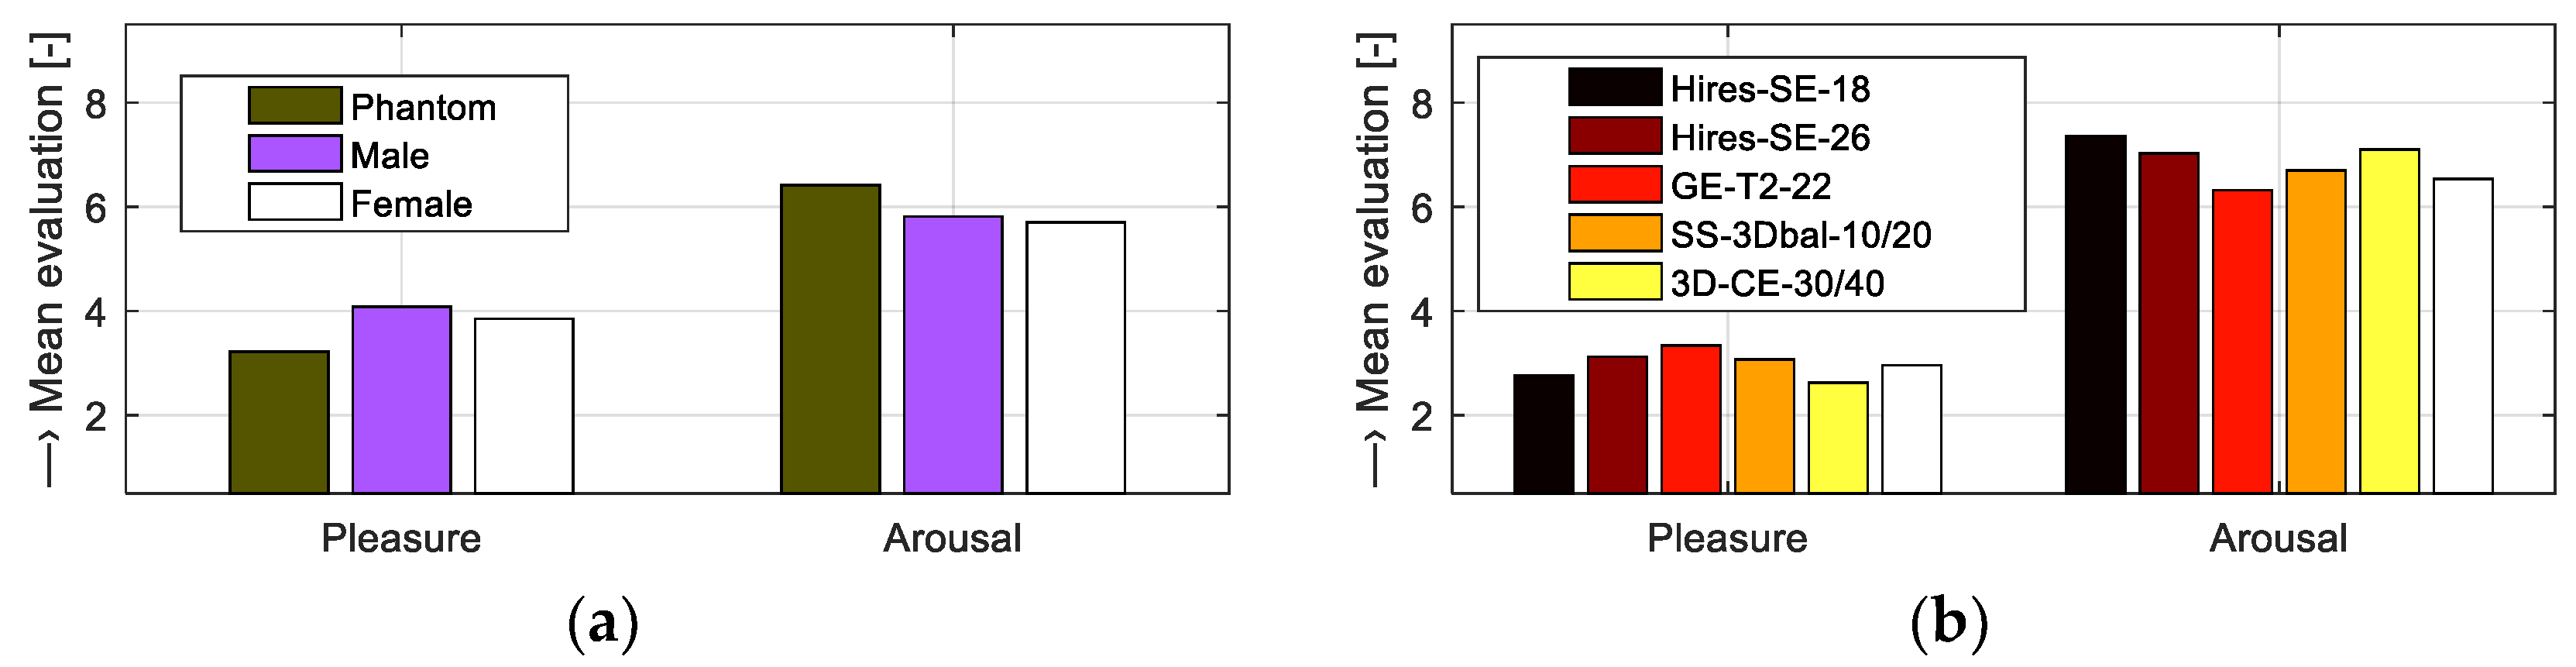
Figure 13.
Bar-graph comparisons of evaluated pleasure and arousal parameters for MRI noises of the Hi-Res SE sequence for (a) different objects placed in the MRI scanning area and (b) different sequence types {Hi-Res SE-HE, Hi-Res SE-HF, Hi-Res GE-T2, SS-3Dbal, 3D-CE} using a water phantom; sagittal slice orientation in all cases.


Table 1.
Basic scan parameters of used MR sequences.
| Type | Name of Sequence | TE (ms) | TR (ms) | FOV | Matrix Size |
|---|---|---|---|---|---|
| Hi-Res | SE 18 HF | 18 | 500 | 250 × 250 × 200 | 256 × 256 |
| Hi-Res | SE 26 HF | 26 | 500 | 250 × 250 × 200 | 256 × 256 |
| Hi-Res | GE T2 | 22 | 60 | 250 × 250 × 200 | 256 × 256 |
| 3D | SS 3D balanced | 5 | 10 | 200 × 200 × 192 | 200 × 200 |
| 3D | 3D-CE | 30 | 40 | 150 × 150 × 192 | 192 × 192 |
Table 2.
Comparison of mean energy values of vibration and noise signals for different objects placed in the scanning area of the MRI device.
Table 2.
Comparison of mean energy values of vibration and noise signals for different objects placed in the scanning area of the MRI device.
| Subject Type 1 | Vibrations (SB-1) | Noise (B2-Pro) | ||||||
|---|---|---|---|---|---|---|---|---|
| RMS | EnTK | Enc0 | Enr0 | RMS | EnTK | Enc0 | Enr0 | |
| Water phantom | 34.6 | 4.69 | 0.0380 | 24.0 | 20.1 | 4.05 | 0.0255 | 8.5 |
| Female | 28.7 | 4.93 | 0.0402 | 16.6 | 23.2 | 4.19 | 0.0286 | 10.6 |
| Male | 26.8 | 4.96 | 0.0404 | 14.4 | 25.5 | 4.51 | 0.0328 | 15.9 |
1 Used Hi-Res SE-HF scan sequences with TE = 18 ms, TR = 400 ms, and sagittal orientation.
Table 3.
Dependence of the MR image quality factor QF and the scanning time duration TDUR [min:sec] on TR and NACC parameters; used Hi-Res SE26 HF sequence, slice thickness = 4.5 mm.
Table 3.
Dependence of the MR image quality factor QF and the scanning time duration TDUR [min:sec] on TR and NACC parameters; used Hi-Res SE26 HF sequence, slice thickness = 4.5 mm.
| NACC [–] | Parameters | TR [ms] | |||||
|---|---|---|---|---|---|---|---|
| 60 | 100 | 200 | 300 | 400 | 500 | ||
| 1 | QF [–] | 6 | 12 | 23 | 32 | 38 | 42 |
| TDUR [min:sec] | 0:09 | 0:14 | 0:25 | 0:36 | 0:48 | 0:59 | |
| 8 | QF [–] | 16 | 33 | 66 | 90 | 107 | 500 |
| TDUR [min:sec] | 0:57 | 1:33 | 3:04 | 4:34 | 6:04 | 7:35 | |
| 16 | QF [–] | 23 | 47 | 93 | 127 | 151 | 168 |
| TDUR [min:sec] | 1:51 | 3:03 | 6:04 | 9:05 | 12:06 | 15:07 | |
Table 4.
Dependence of the MR image quality factor QF and the scanning time duration TDUR [min:sec] on TR and NACC parameters; used Hi-Res GE-T2 22 sequence, slice thickness = 4.5 mm.
Table 4.
Dependence of the MR image quality factor QF and the scanning time duration TDUR [min:sec] on TR and NACC parameters; used Hi-Res GE-T2 22 sequence, slice thickness = 4.5 mm.
| NACC [–] | Parameters | TR [ms] | |||||
|---|---|---|---|---|---|---|---|
| 60 | 100 | 200 | 300 | 400 | 500 | ||
| 1 | QF [–] | 15 | 18 | 24 | 26 | 27 | 28 |
| TDUR [min:sec] | 0:14 | 0:24 | 0:42 | 1:00 | 1:20 | 1:39 | |
| 8 | QF [–] | 42 | 52 | 67 | 74 | 77 | 79 |
| TDUR [min:sec] | 1:35 | 2:37 | 5:12 | 7:46 | 10:20 | 12:55 | |
| 16 | QF [–] | 59 | 74 | 95 | 104 | 109 | 112 |
| TDUR [min:sec] | 3:08 | 5:11 | 10:20 | 15:29 | 20:38 | 25:47 | |
© 2019 by the authors. Licensee MDPI, Basel, Switzerland. This article is an open access article distributed under the terms and conditions of the Creative Commons Attribution (CC BY) license (http://creativecommons.org/licenses/by/4.0/).
Share and Cite
MDPI and ACS Style
Přibil, J.; Přibilová, A.; Frollo, I. Analysis of the Influence of Different Settings of Scan Sequence Parameters on Vibration and Noise Generated in the Open-Air MRI Scanning Area. Sensors 2019, 19, 4198. https://doi.org/10.3390/s19194198
AMA Style
Přibil J, Přibilová A, Frollo I. Analysis of the Influence of Different Settings of Scan Sequence Parameters on Vibration and Noise Generated in the Open-Air MRI Scanning Area. Sensors. 2019; 19(19):4198. https://doi.org/10.3390/s19194198
Chicago/Turabian StylePřibil, Jiří, Anna Přibilová, and Ivan Frollo. 2019. "Analysis of the Influence of Different Settings of Scan Sequence Parameters on Vibration and Noise Generated in the Open-Air MRI Scanning Area" Sensors 19, no. 19: 4198. https://doi.org/10.3390/s19194198
Note that from the first issue of 2016, this journal uses article numbers instead of page numbers. See further details here.