1. Introduction
Obesity is a worldwide epidemic, recognized by the World Health Organization as an established problem for both developed and developing nations for the burdens exerted on national healthcare systems due to the massive drain of resources resulting from associated pathologies [
1]. The major issue lies with associated pathologies to obesity, ranging from diabetes, cardiovascular problems, and to even certain types of cancer [
2]. Despite extensive research and attempts to find a cure for obesity, pharmacological intervention has failed to resolve most of obesity’s issues, where only typically a surgical bariatric reduction intervention associated with a dramatic lifestyle alteration has shown any consistent gains.
In the past couple of decades, research on the anti-obesity effects of bile acids (BA), in particular cholic and deoxycholic acids (CA and CDCA, respectively) has shown tremendous potential to achieve this goal of a single pharmacological cure for obesity. Studies in obese mice [
3,
4,
5,
6] have demonstrated that BA can reverse obesity and ameliorate associated conditions. Initially, most studies attributed these effects to the activation of an orphan nuclear BA receptor, the Farnesoid X Receptor (FXR) [
5,
7,
8]. However, later studies have questioned the role of FXR in metabolic improvement, for it appears that specific FXR agonism could in fact be detrimental [
6,
9]. As such, the consensus for BA effects now hinges on the activation of another BA receptor, the Takeda G-protein receptor 5, or TGR5 [
6]. TGR5 activation is reported to lead to the intracellular brown adipose tissue (BAT) generation of triiodothyronine (T3) from internalized thyroxine (T4). T3 is a known thermogenic hormone, leading to the activation of a non-shivering thermogenic program in BAT, which is responsible for the controlled dissipation of mitochondrial membrane potential (ΔΨ) as heat (due to the activation of the BAT-specific mitochondrial uncoupling protein 1-UCP1, also known as thermogenin), resulting in the burning of excess nutrients and thus leading to decreased obesity [
10,
11]. TGR5 activation by CDCA was even shown in humans, albeit non-obese ones [
12]. This is particularly interesting since adult humans do not possess large depots of BAT as small mammals and infants, which heavily rely on BAT for the maintenance of the core temperature, while larger mammals typically hinge on the skeletal muscle spontaneous contraction (also known as shivering) for temperature maintenance needs. As such, it would appear that the use of BA for tackling human obesity reached a dead-end due to the dependency of these effects on BAT activity. In fact, a pair of recent publications highlighted how hypothalamic TGR5 is required, in a mice model of obesity, for dietary BA effects [
13,
14].
We have, in a previous work [
3], questioned the established TGR5 model, where it was shown that exposing a cell line of cultured white adipocytes (3T3-L1 adipocytes) to CDCA also significantly reduced adiposity, with a concomitant increase in metabolic fluxes and mitochondrial activity, without the input of thyroid hormones. This work suggested the possibility of BA having other, non-TGR5-dependent, effects on metabolism. Here, we aimed to understand if these effects were truly independent of TGR5. To achieve this, a CRISPR/Cas9 3T3-L1 model of TGR5 knockdown was developed and we tested if CDCA could still show metabolic acceleration and obesity reduction. This work reports that CDCA could indeed reduce the obesity of these cells, increase their metabolic rate, and improve overall metabolism as before, but with limited TGR5 involvement. This work proposes that the low dose of CDCA used in these studies (50 µM) is enough to cause a non UCP1-dependent thermogenic dissipation of ΔΨ due to its known protonophoric effect [
15], while not harmful to the cells, as previously shown [
3], thus concluding that BA still have an enormous potential for human use, despite the absence of large depots of UCP1-carrying BAT.
3. Discussion
Our previous work [
3] sought to understand if the BA CDCA could also have metabolic effects on cultured 3T3-L1 white adipocytes, which was indeed the case. CDCA reversed many of the metabolic alterations induced by obesity in these cells, resulting in an acceleration of metabolic activity and mitochondrial function, despite the lack of a thyroid gland to supply the cells with T4 or ß-adrenergic stimulation. This led us to push further into trying to finally understand if the effects of BA on metabolism are solely driven by TGR5 on BAT or if there are other avenues of effect that are masked by the high relevance of BAT for small animals. To achieve this goal, the experimental design was intentionally driven away from a BAT model and more into the effects of the BA CDCA in a TGR5 CRISPR/Cas9 knockdown model.
The results reported here confirm that CDCA is capable of driving a metabolic acceleration and nutrient consumption in 3T3-L1 adipocytes despite the reduction in
gpbar1 and
dio2 expression (
Figure 1). Triglyceride deposition analysis and metabolic profiling by NMR spectroscopy clearly indicates that CDCA does not require TGR5 for metabolic normalization (
Figure S1), in a stark parallel to a previous work [
3] and to the animal models [
4,
5,
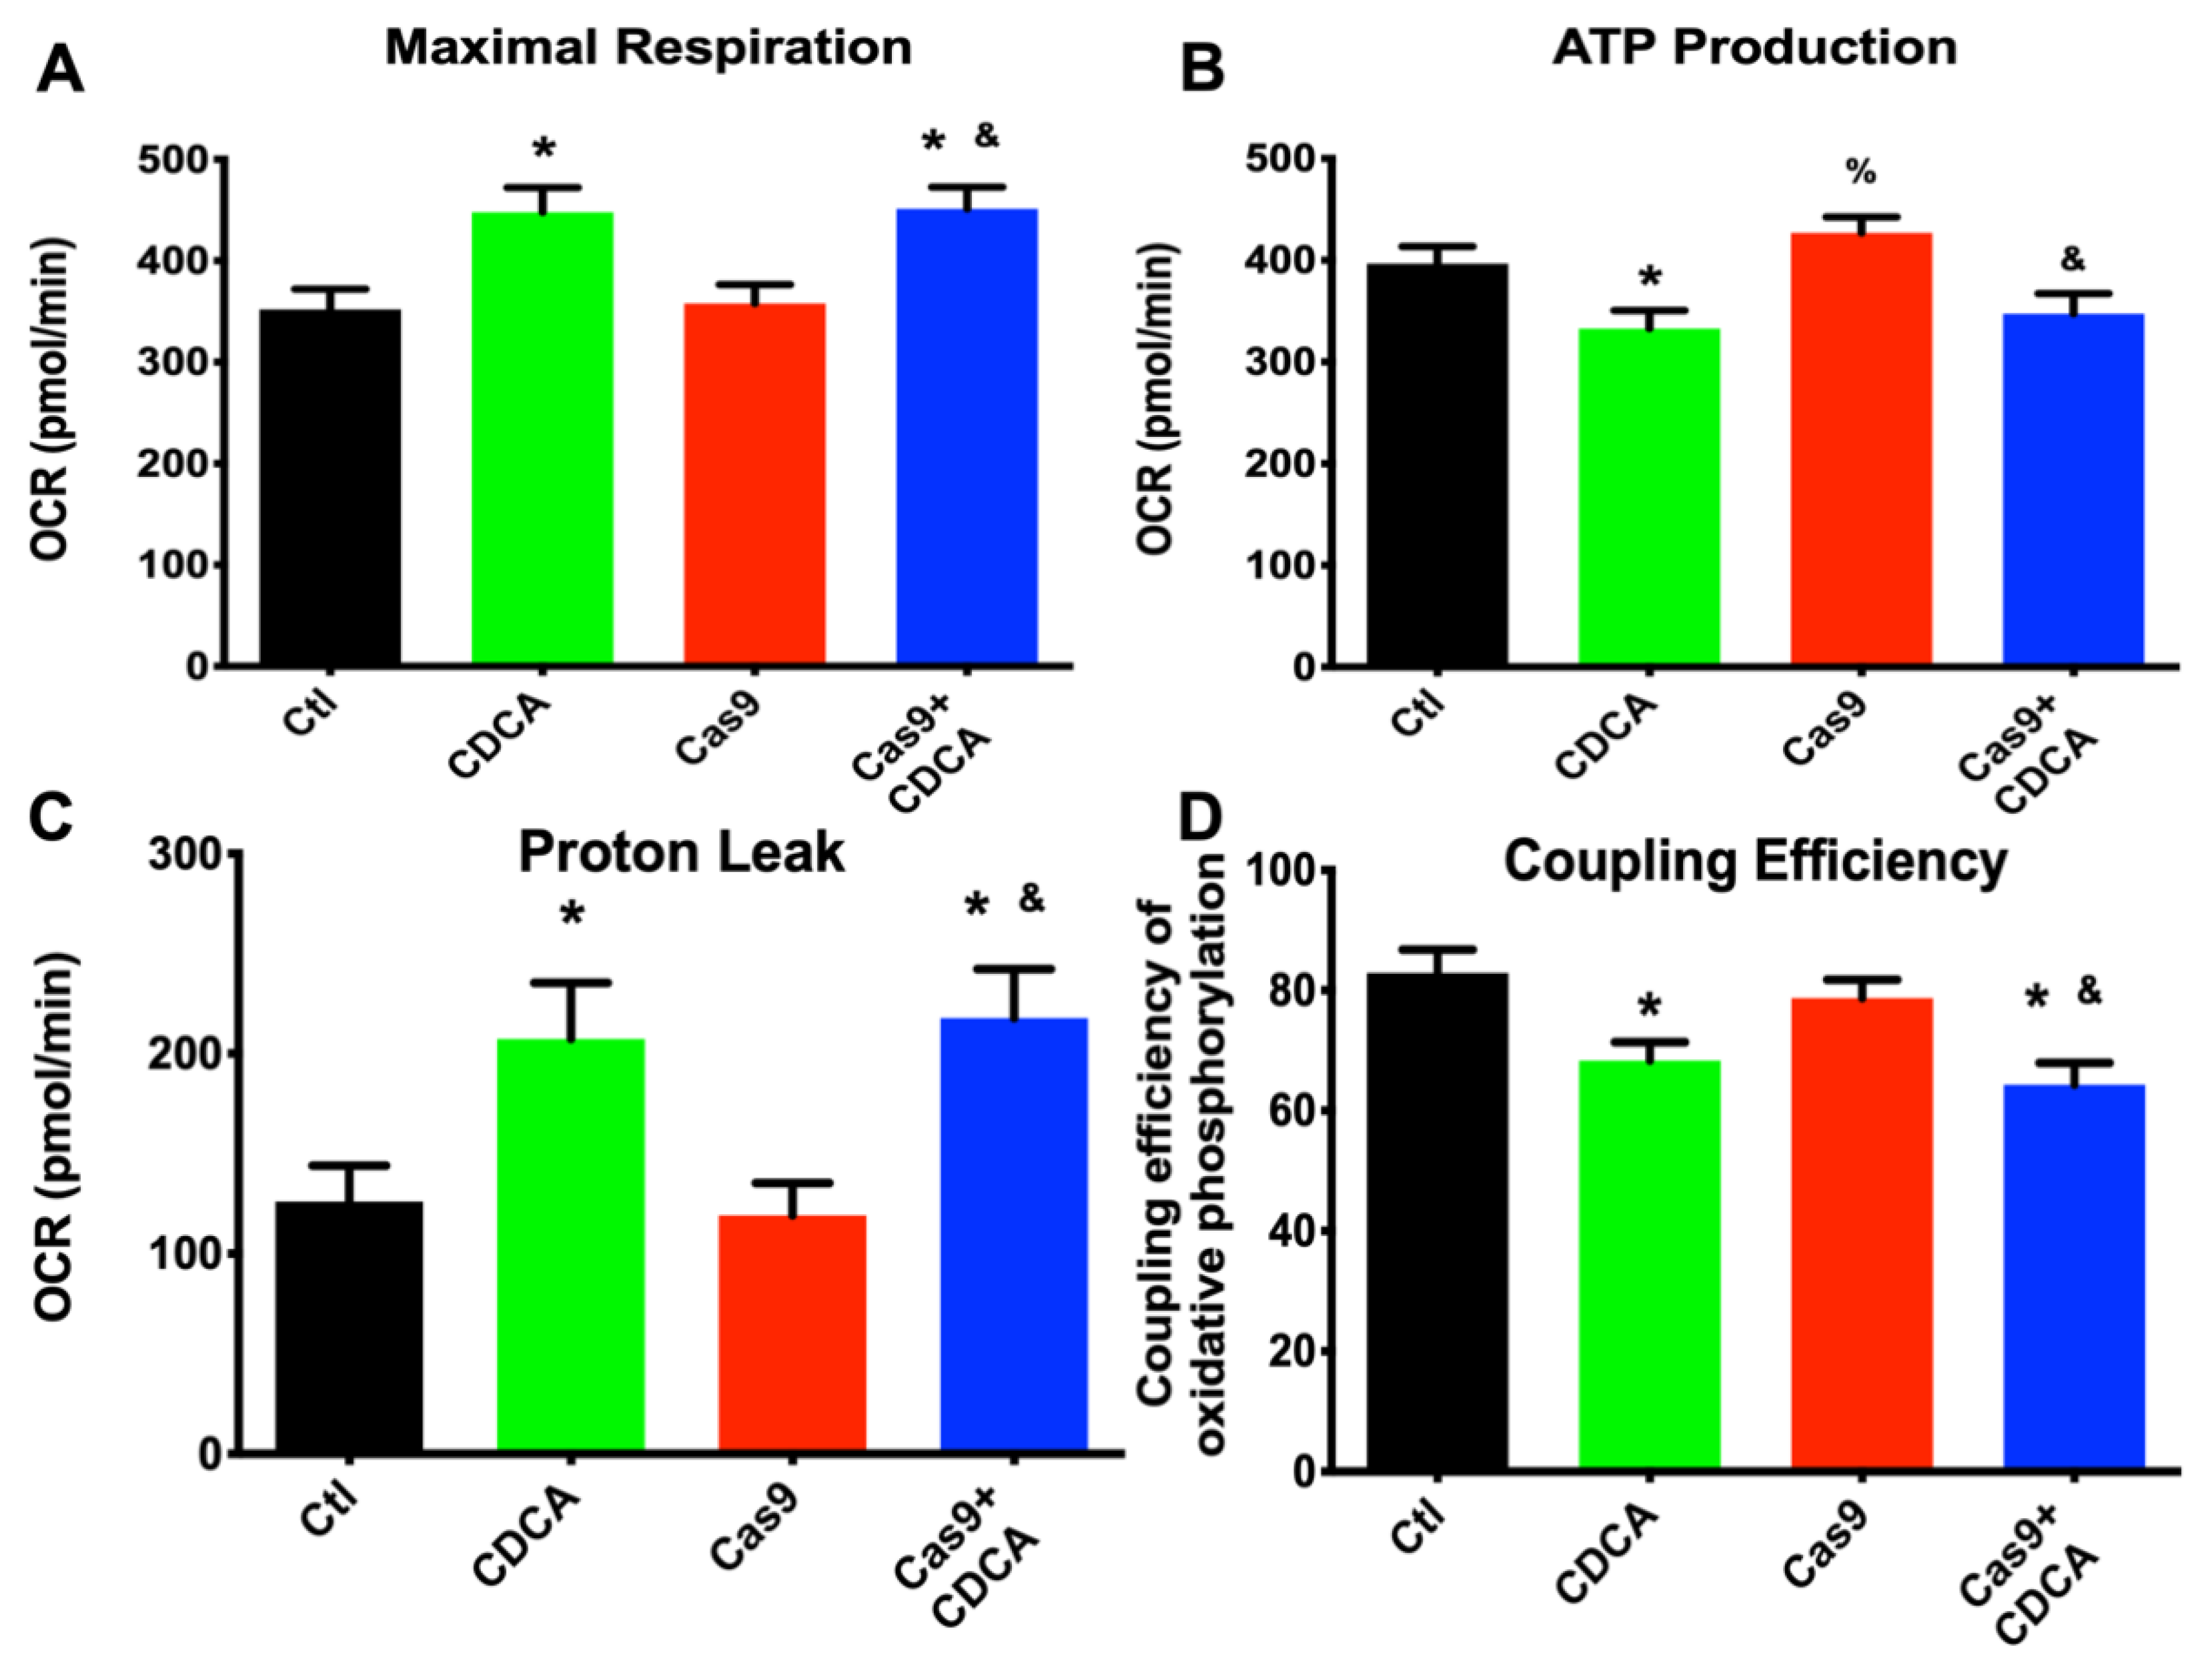
17]. Given this finding, the metabolic and mitochondrial effects of CDCA on these cells were further explored and what (if any) effects would the TGR5 reduced content cause. For the most part, this reduction did not affect the evaluated parameters. In fact, CDCA was TGR5-independently capable of reducing mitochondrial membrane potential and cellular ROS generation (
Figure S2) and drive up the mitochondrial oxygen consumption by a clear reduction in membrane potential (
Figure 2).
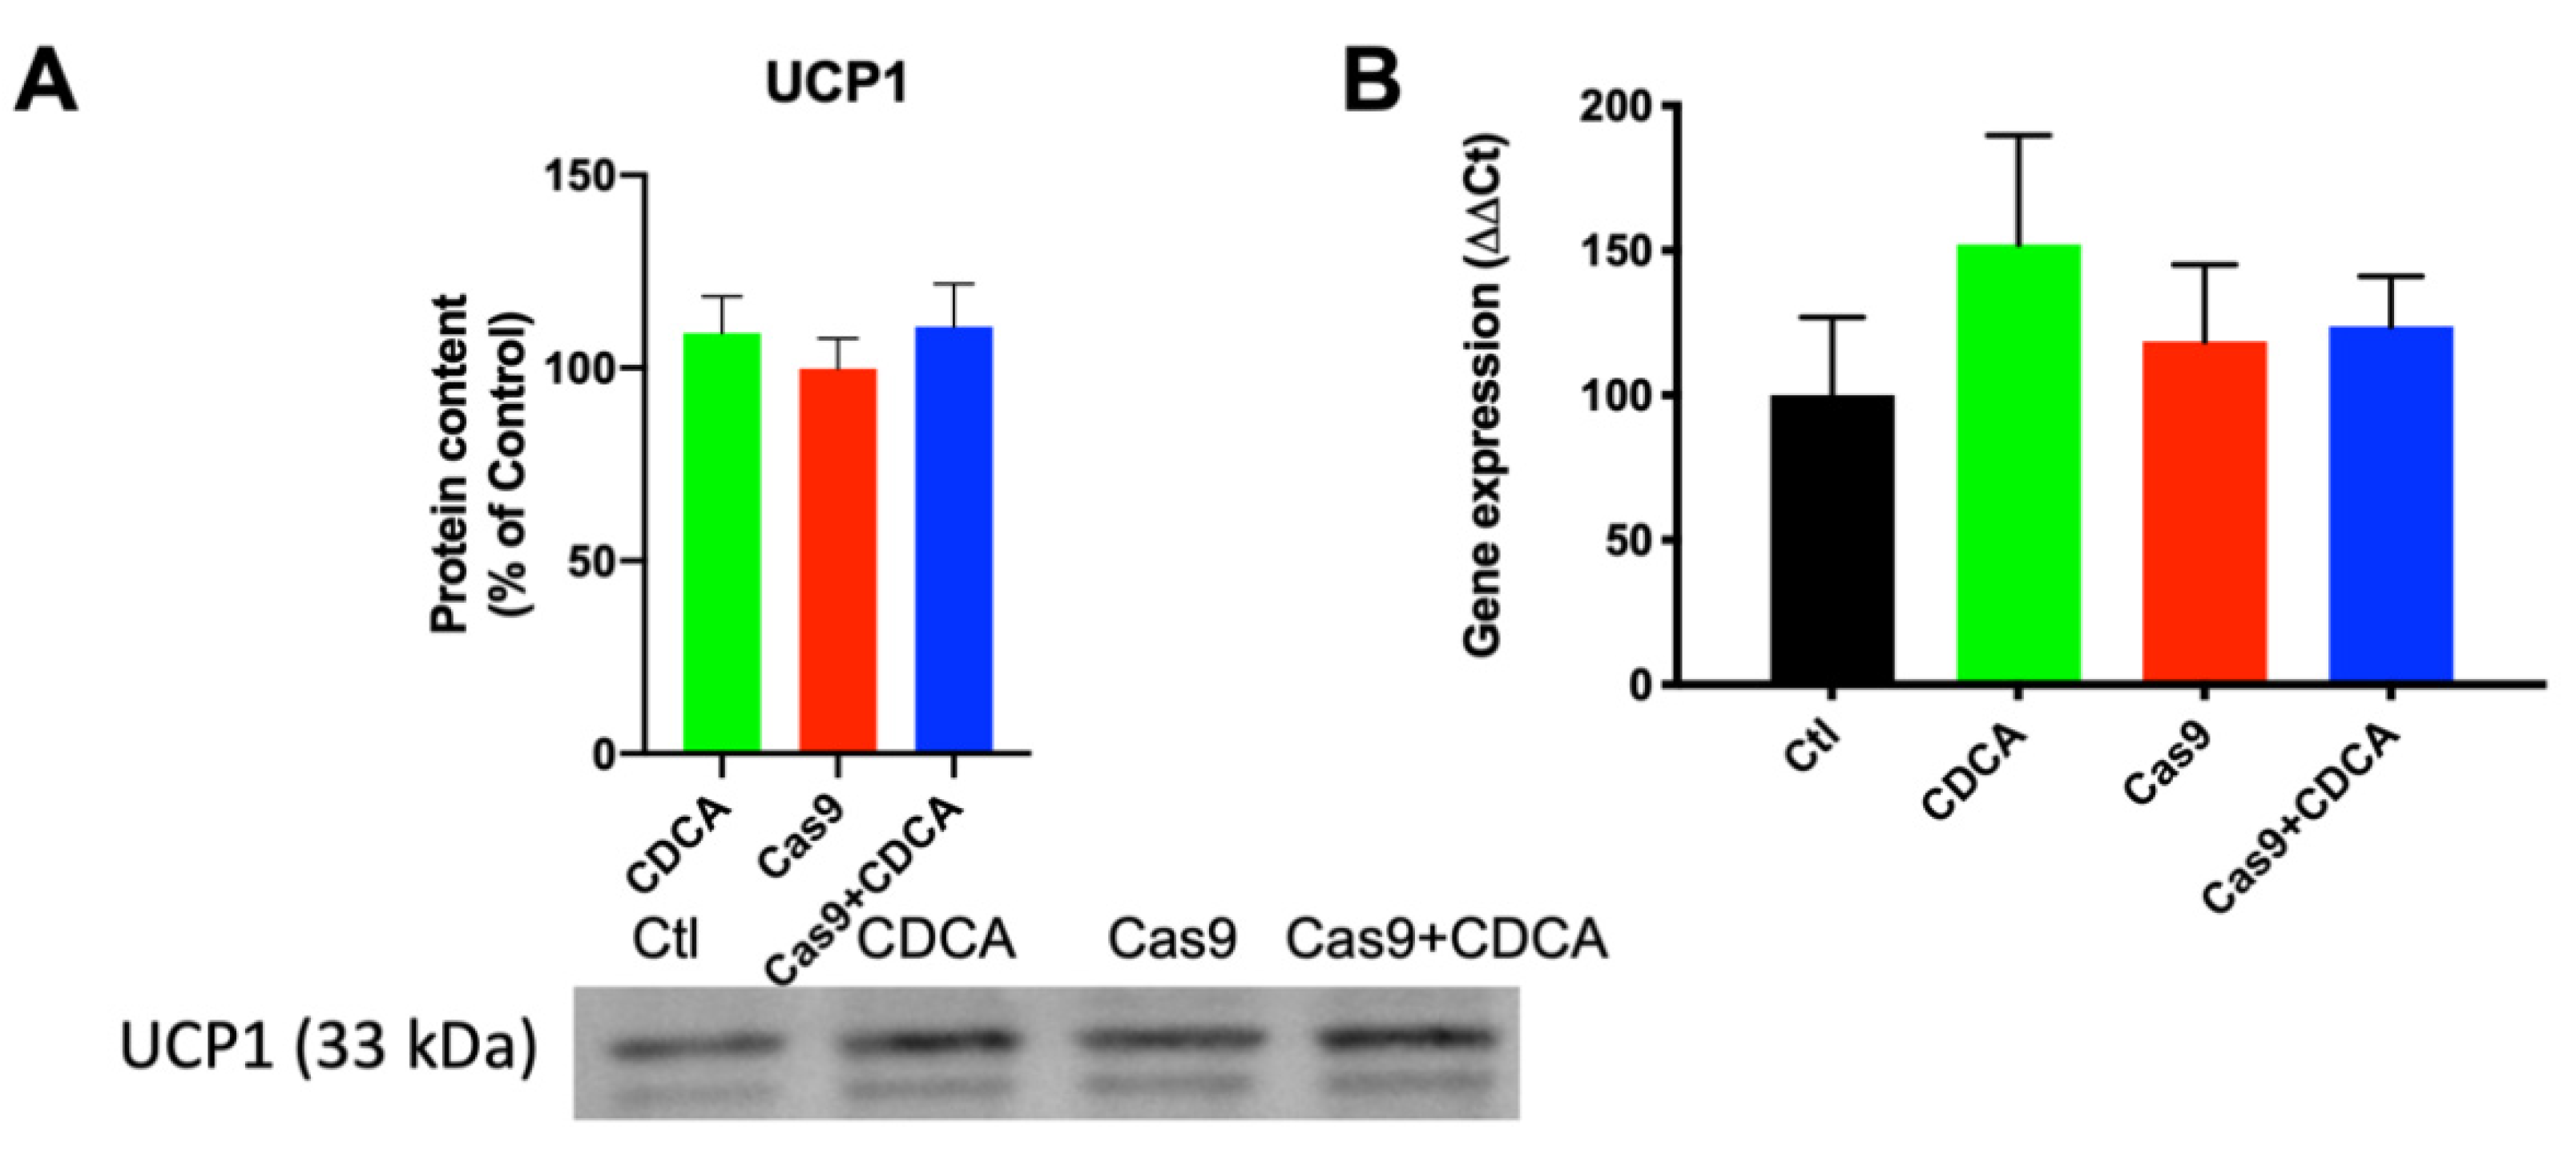
The next step was to understand if CDCA was inducing UCP1 levels as happens in the mice models used in previous studies. Encouragingly, UCP1 content was not altered, nor was its gene expression induced (
Figure 3). This is in clear contrast with the animal data from virtually all previous studies and clearly indicated that there is probably another mechanism of mitochondrial membrane potential dissipation by CDCA that was being overlooked by the overbearing prevalence of thermogenic effects of BAT in mice. Interestingly, a recent work using a different BA (obeticholic acid, OBA), resulted in a UCP1 induction in vitro [
18], which appears contradictory with our results. However, the cell line used in this study is a fibroblast cell line, functionally akin to a mesenchymal stem cell. As such, it is quite probable that OBA is inducing a brown fat differentiation program on these cells, a possibility clearly stated by the authors of that study [
18].
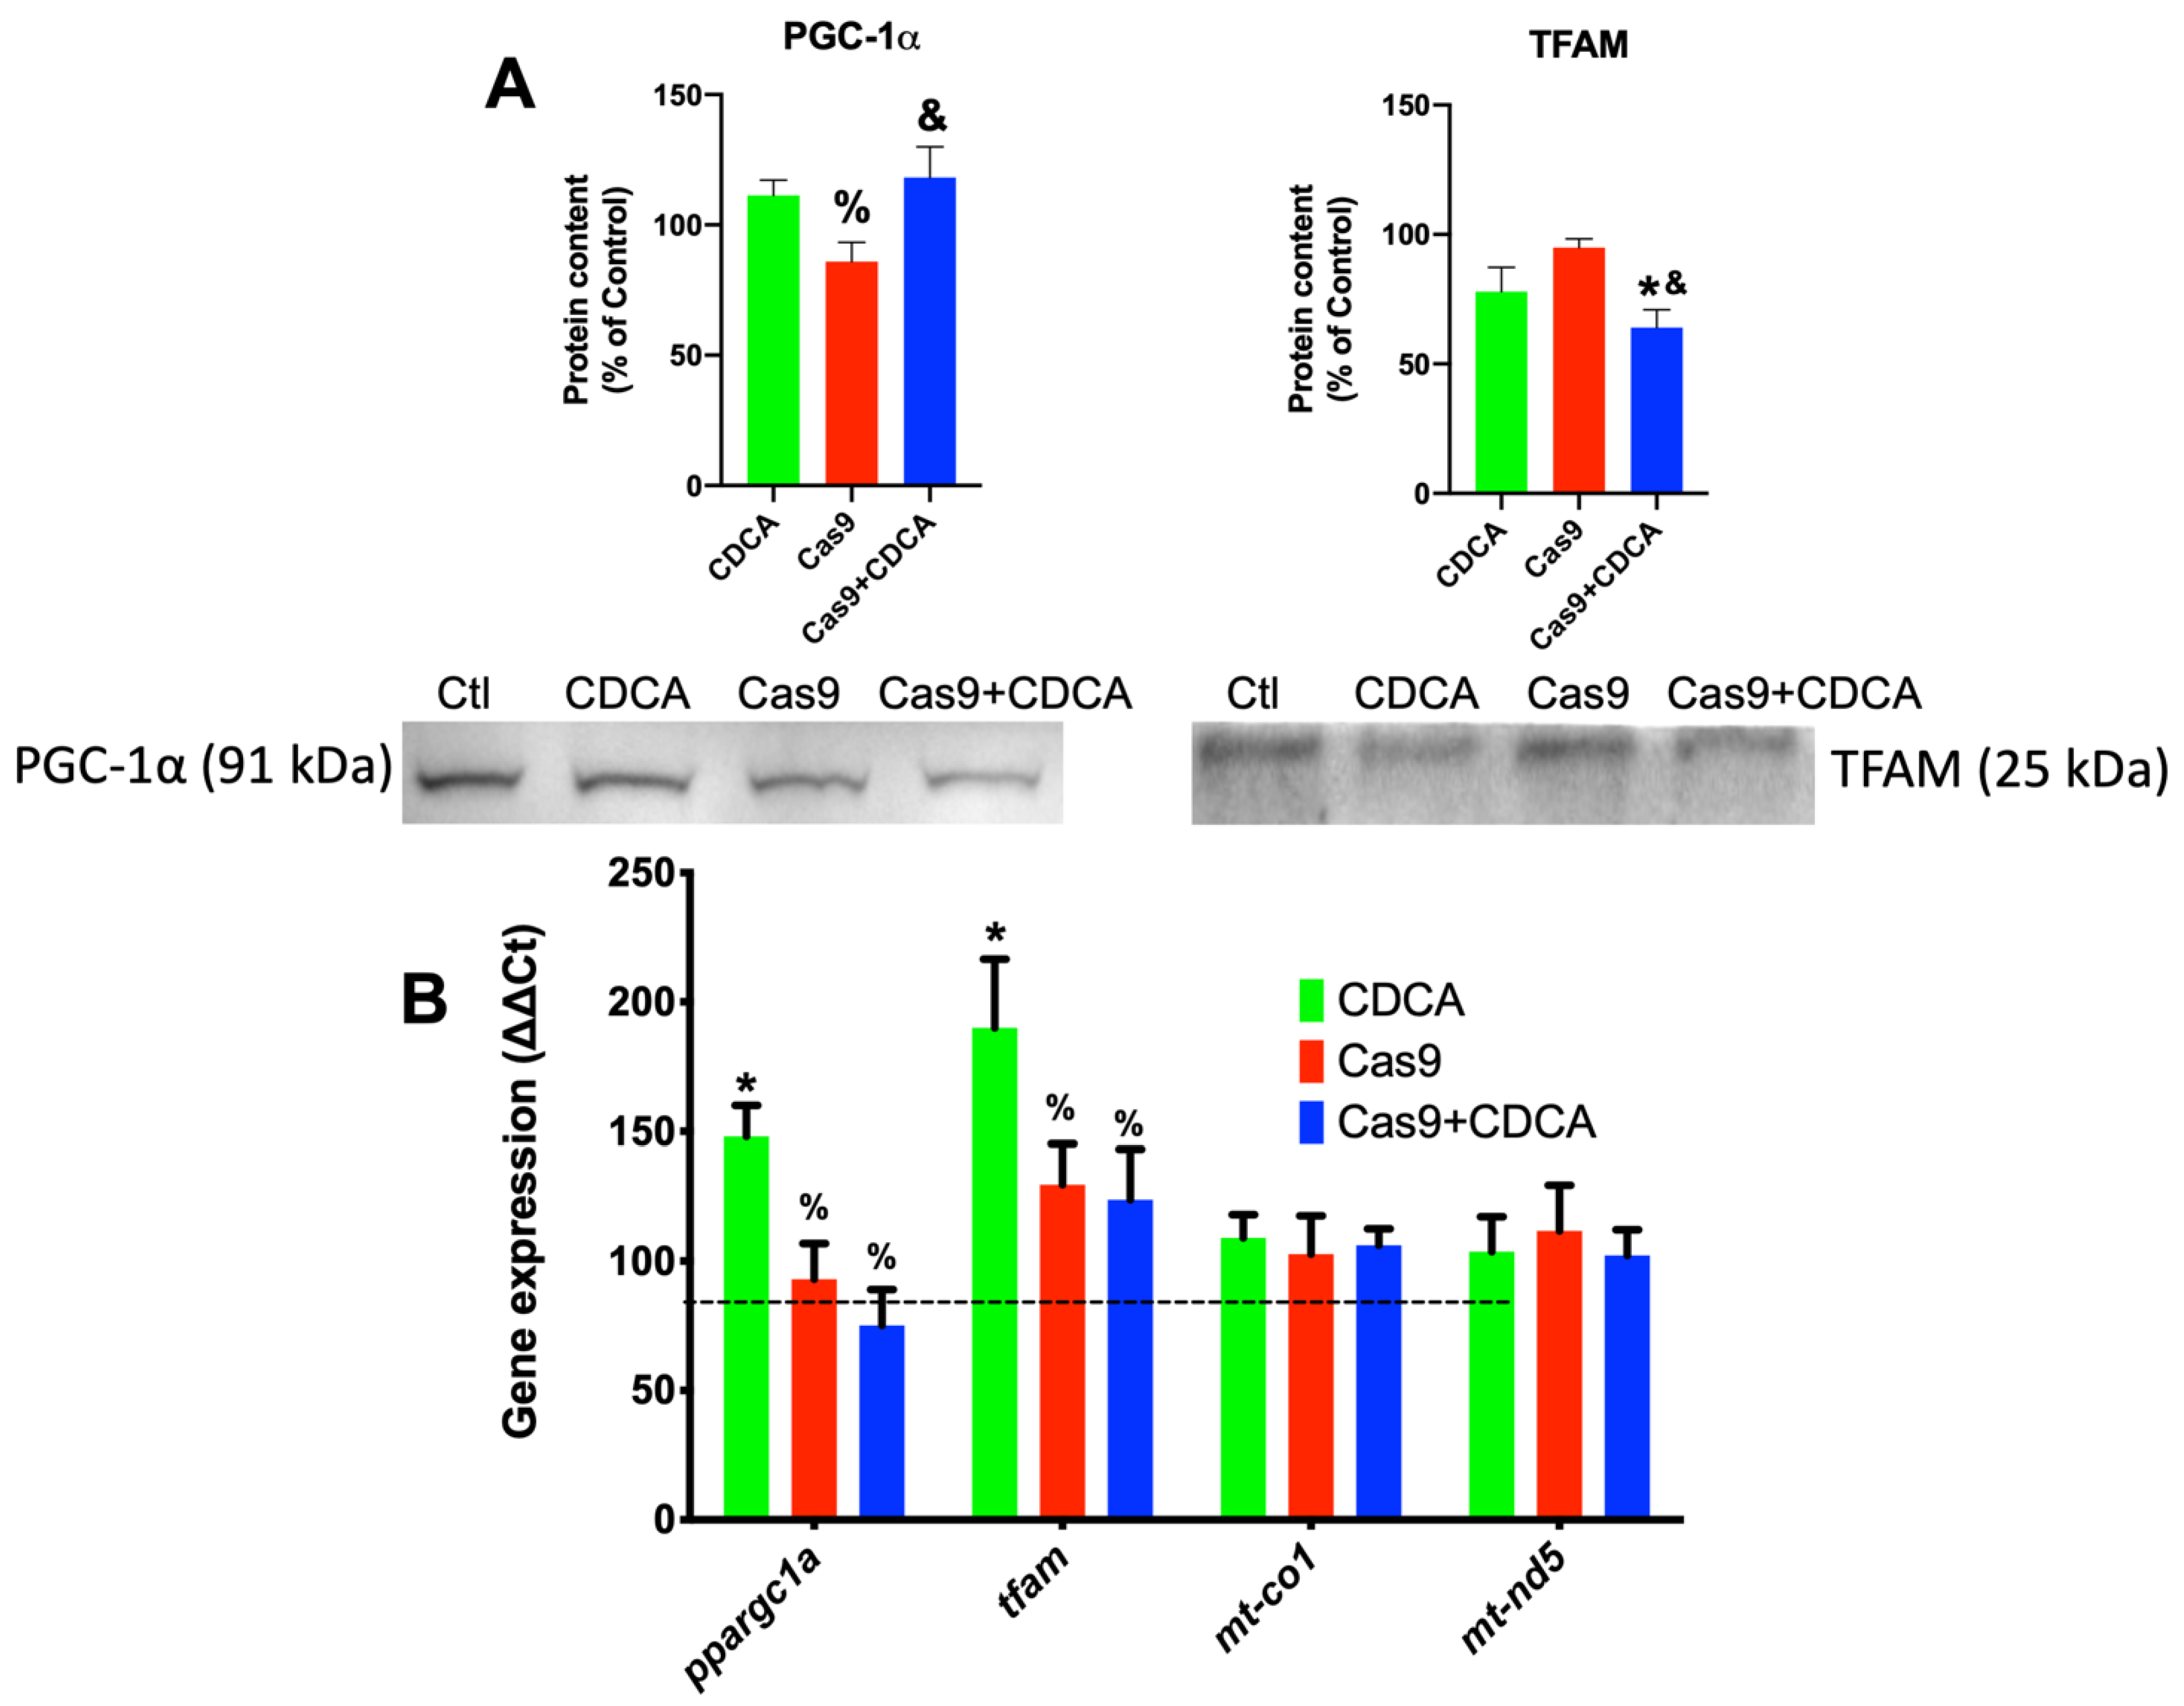
Surprisingly, TGR5 ablation did have some effects on the mitochondrial biogenetic pathway, for CDCA was competent to induce the expression of both key players of mitochondrial biogenesis,
tfam and
ppargc1a (
Figure 4), an effect that was lost in the Cas9 + CDCA cells. This indicates that TGR5 is intimately associated with mitochondrial biogenesis in BA-exposed cells, an effect that was virtually unknown until very recently [
19]. Concomitantly, the expression of some metabolically-relevant genes was also affected by the reduction in TGR5 content, namely
lep and
fabp4, effects that were to be somewhat expected given the literature (respectively, [
20,
21]). Regardless, the expression of other genes relevant to metabolic function of adipocytes (
lpl and
pparg) were not affected by TGR5 reduction (
Figure S3). Counter-intuitively, the expression of mitochondrial OXPHOS elements
mt-co1 and
mt-nd5 was also unaffected, either by CDCA or the reduction in TGR5, despite the increase in the expression of
tfam and
ppargc1a (
Figure 4), which might indicate that the mitochondrial biogenetic protocol is not activated in these conditions, which makes some sense, since the activation of the oxidative phosphorylation illustrated in
Figure S1, Figure S2 and
Figure 2 is probably not sufficient to drive ATP levels down towards dangerous levels. Regardless of this finding, there are clear effects on the mitochondrial membrane integrity (illustrated by the reduction in membrane potential, ROS generation, and increased protonic leak) and, as such, it was thought that this might drive mitophagy up.
The mitophagic process is a series of subcellular events that lead to the labelling of damaged/inefficient/unnecessary mitochondrial units for degradation by autophagic means [
22]. The mitodynamics involved revolve upon the decrease in mitochondrial fusion processes and elevated mitochondrial fission ones, with the unwanted fissioned fragment marked for degradation, typically by means of activation of the Parkin pathway [
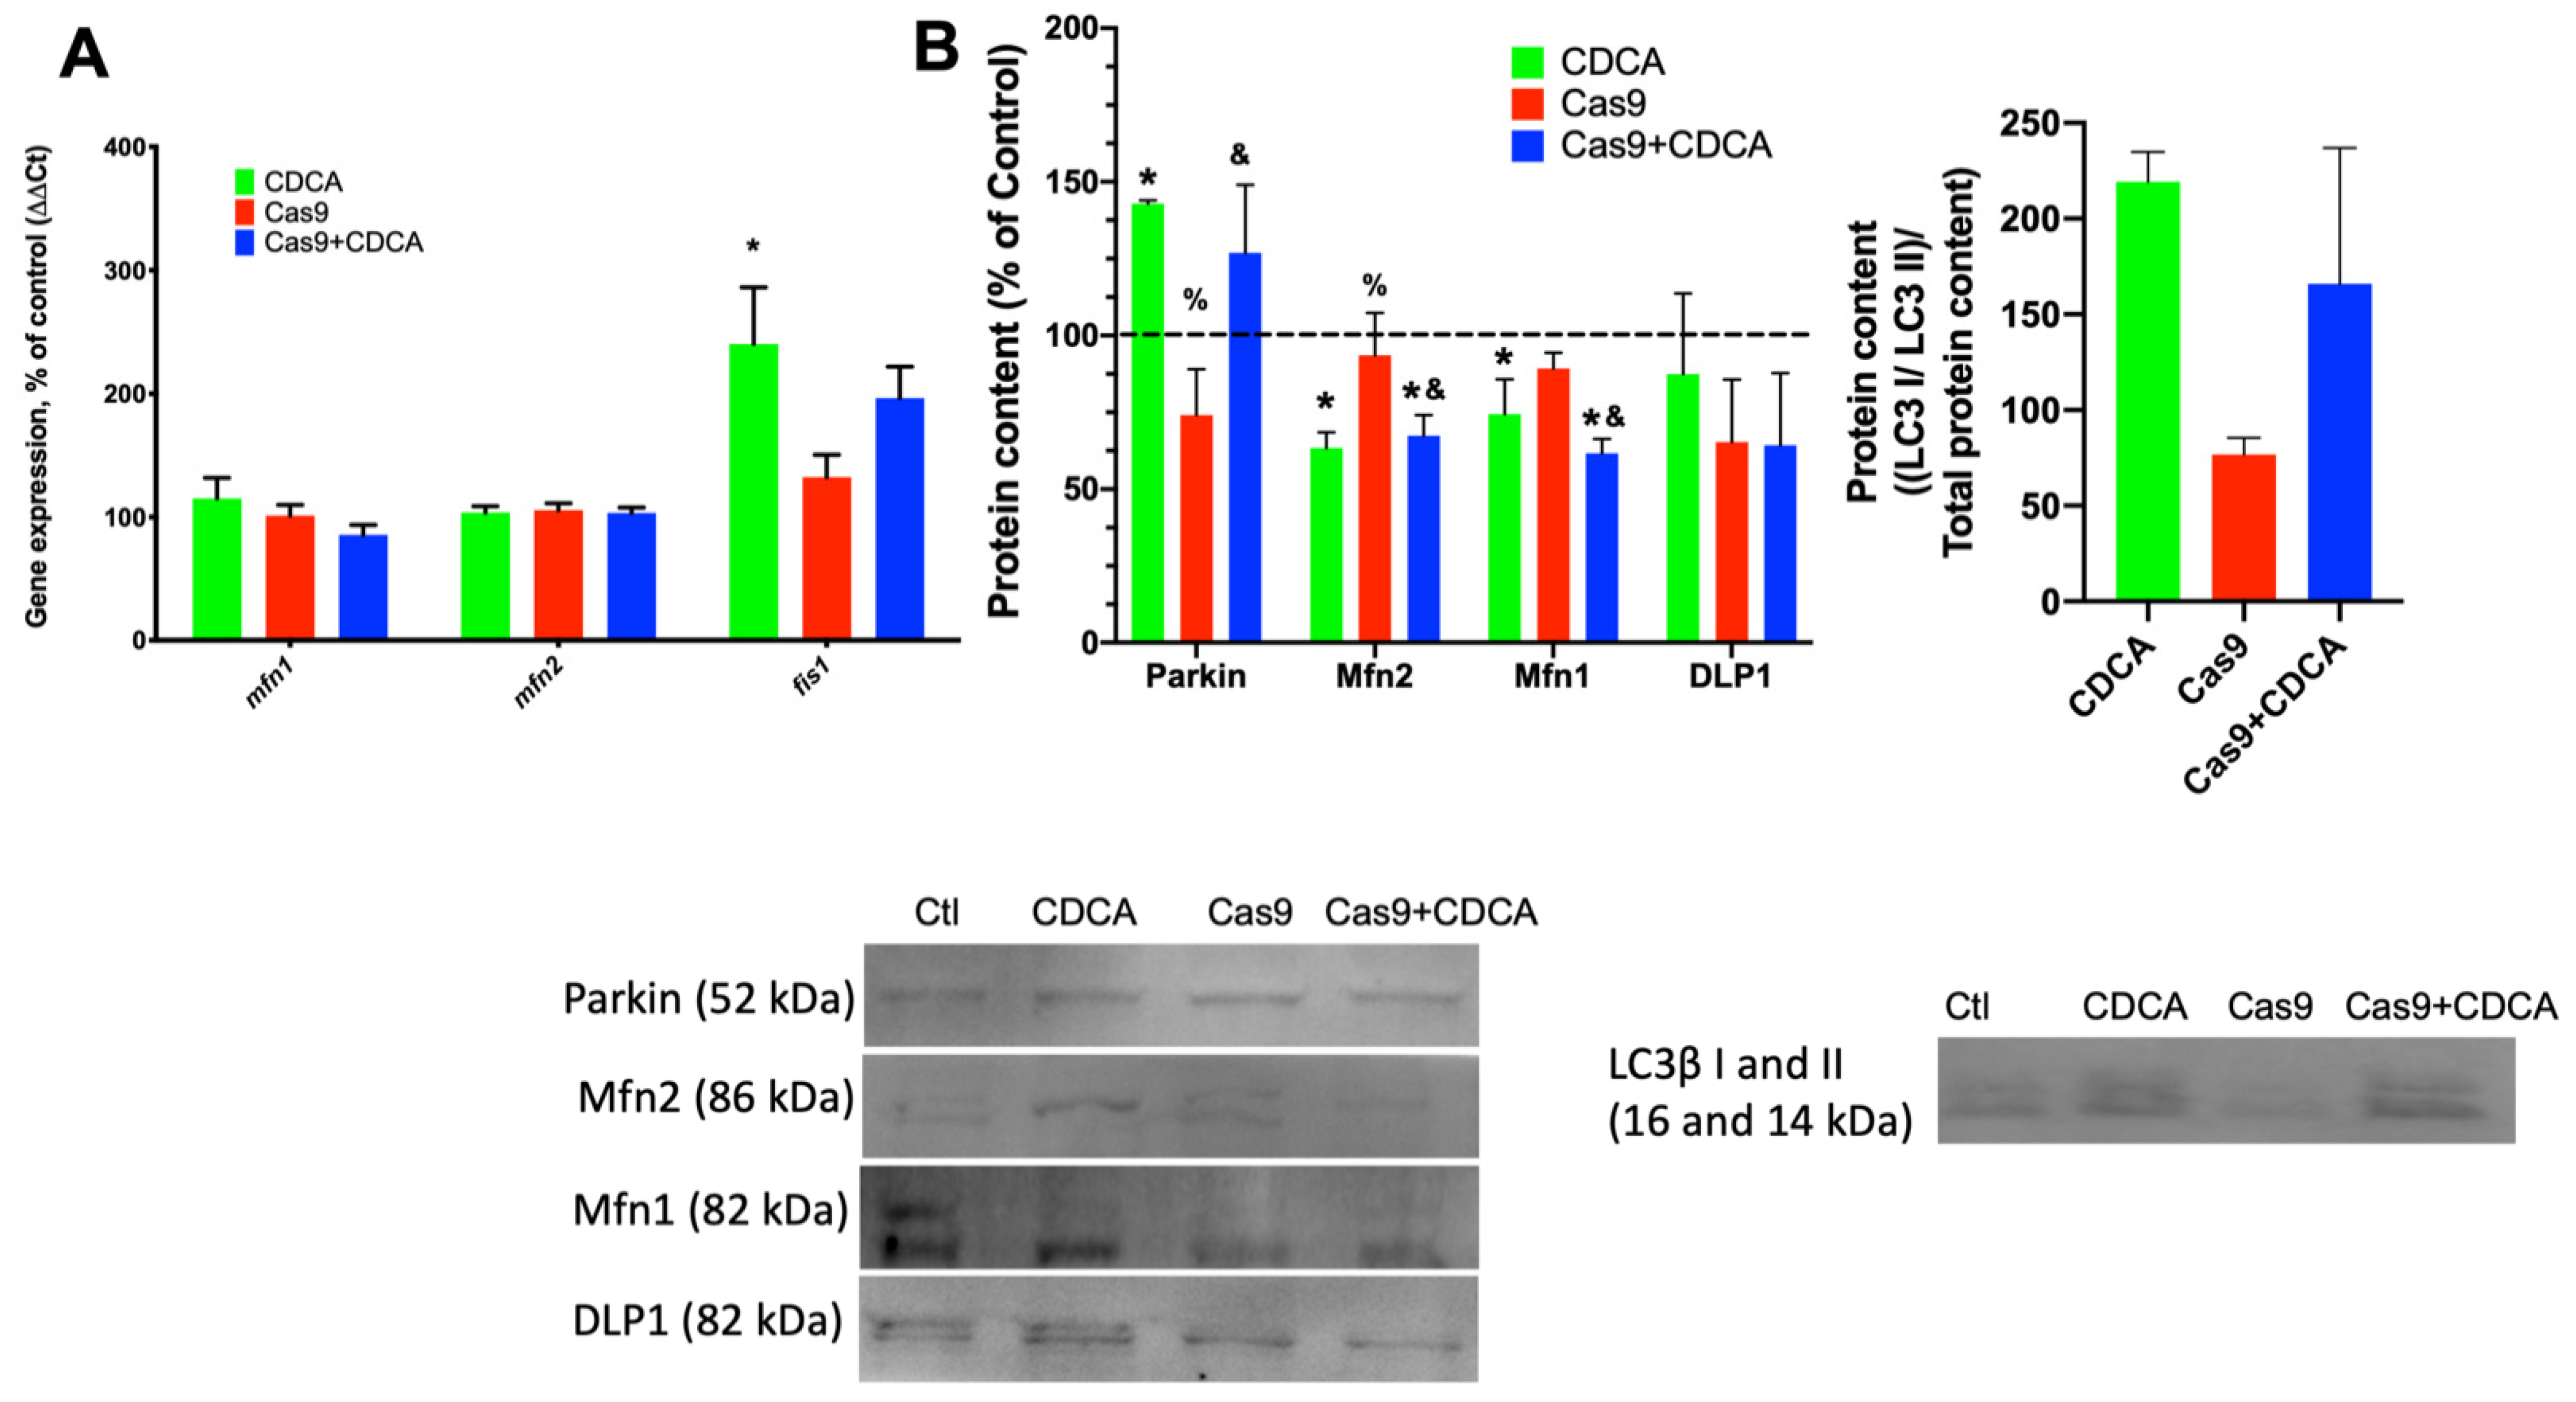
23]. As such, if indeed CDCA is causing a mild damage to mitochondria, this will certainly lead to an increase in mitophagic fluxes. We first investigated the gene expression and protein content of common players in mitodynamics and mitophagy (
Figure 5A,B). Mitochondrial fusion proteins 1 and 2 gene expression was unaltered in all experimental conditions, while the gene for fission protein 1 (
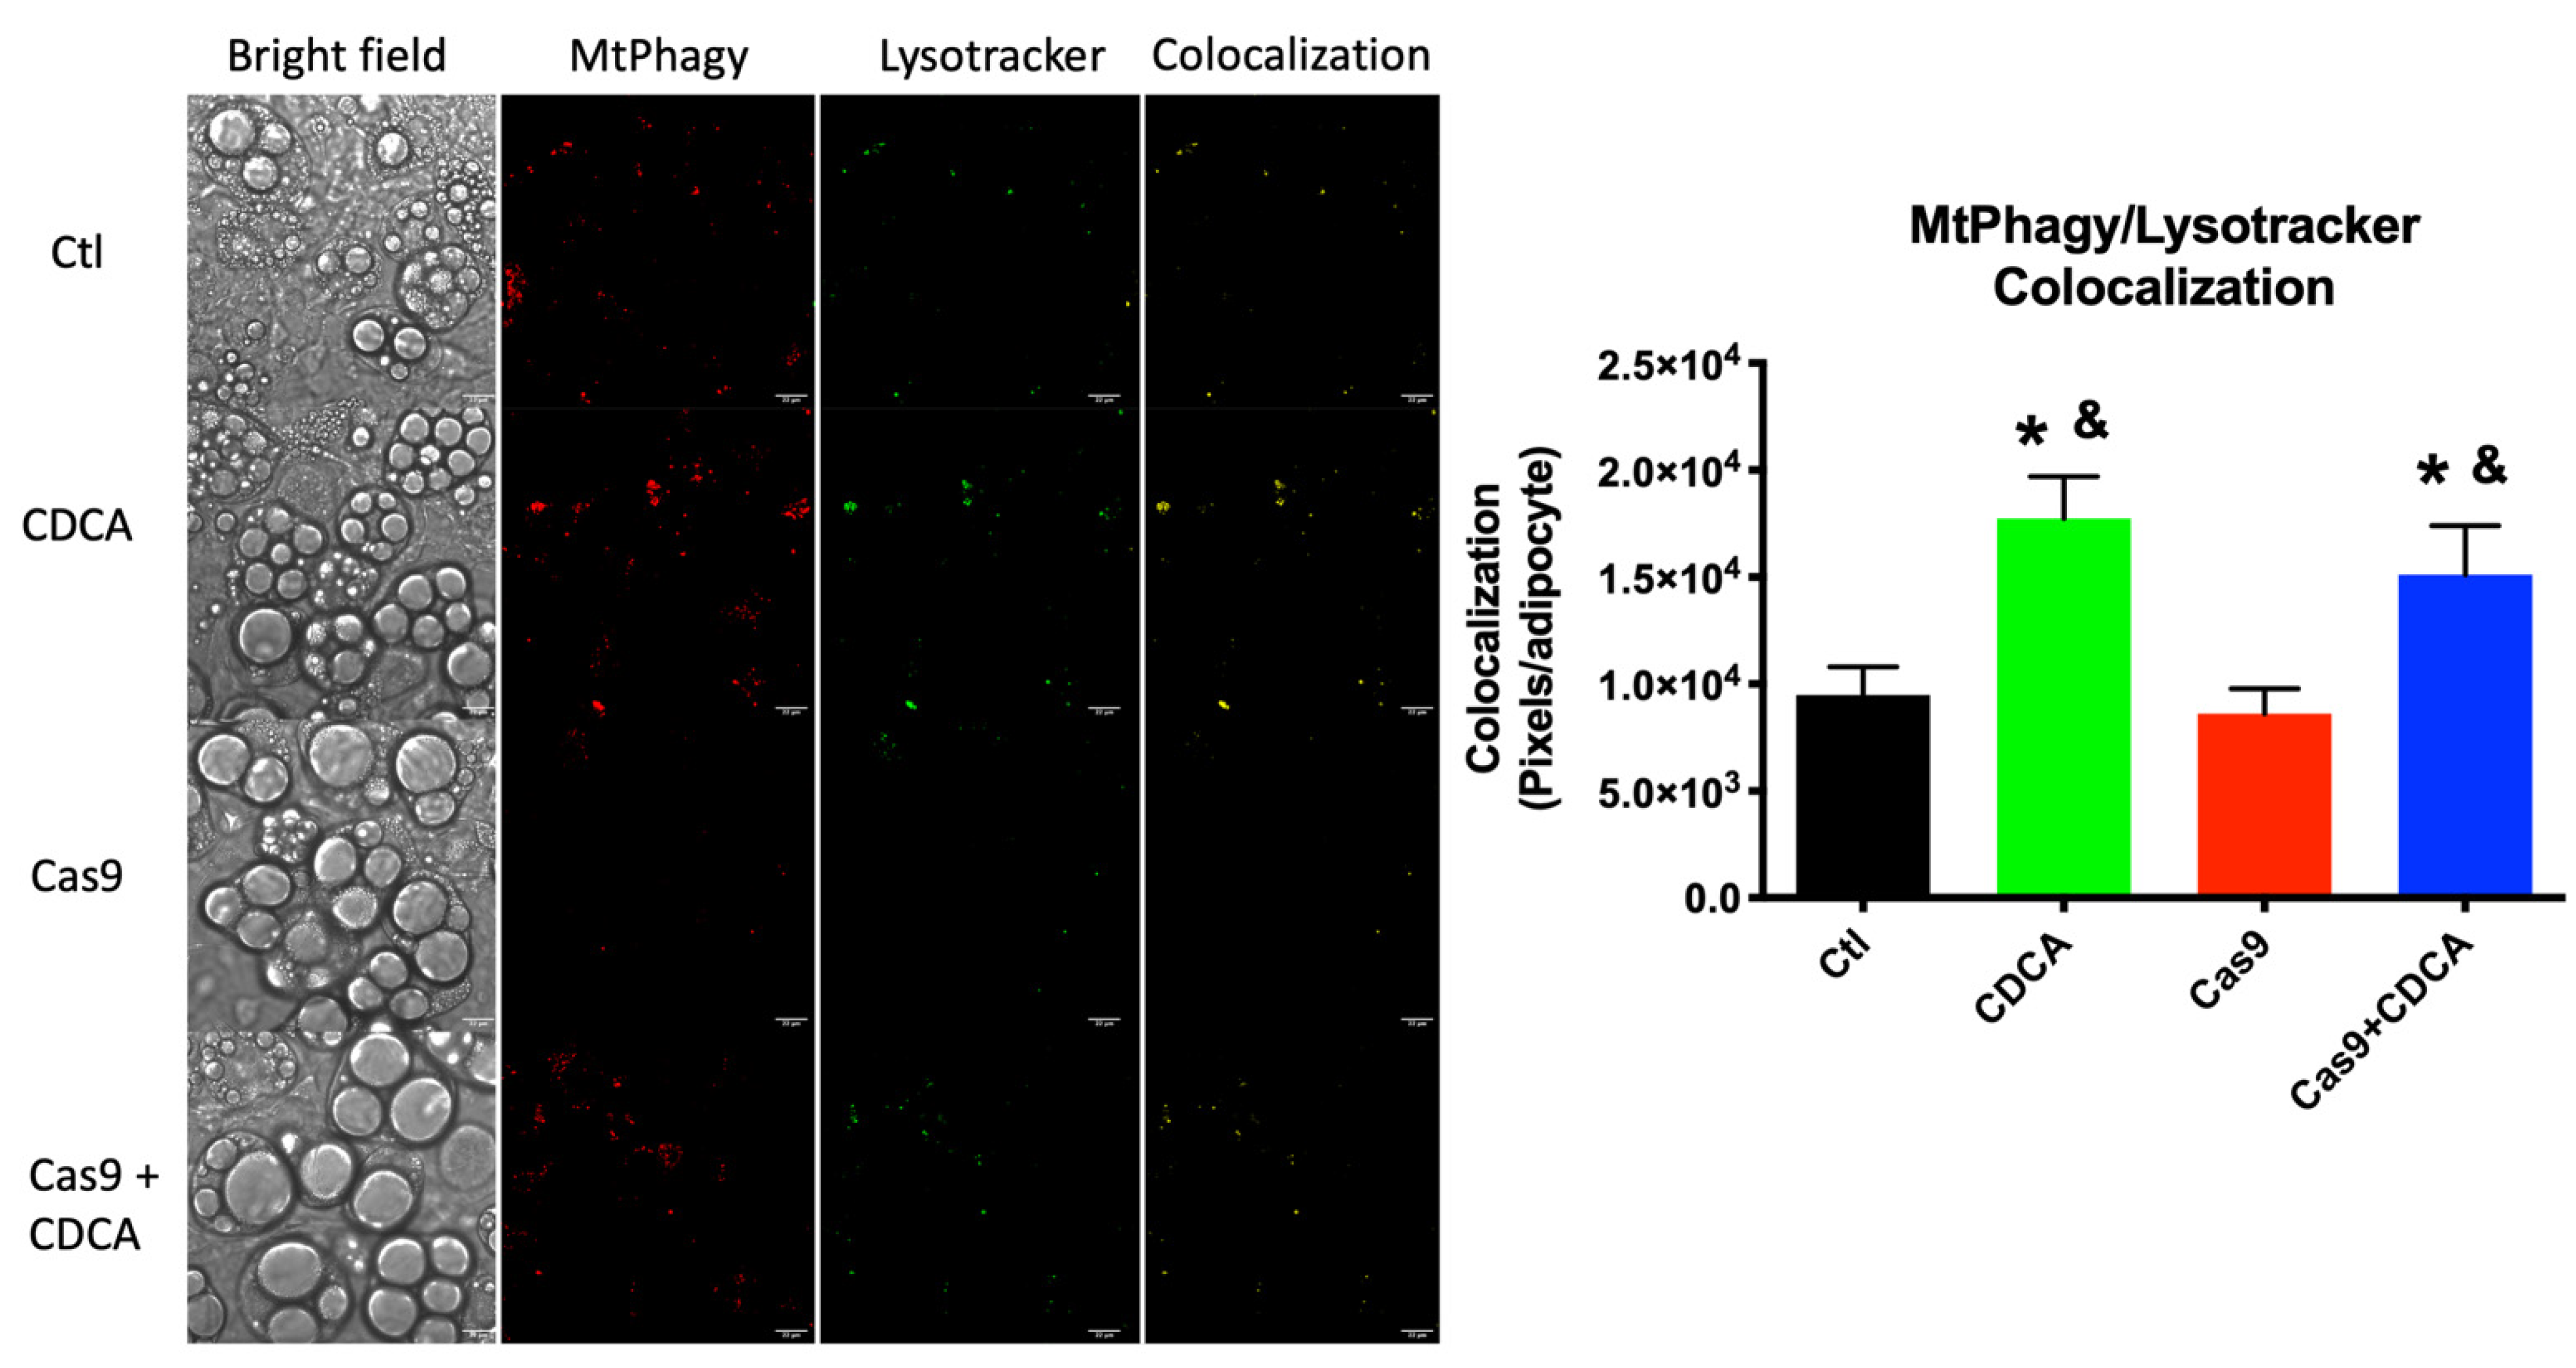
fis1) was elevated by CDCA. Concomitantly, the protein levels of Parkin were also found to be elevated by CDCA, independently of TGR5 levels. As such, the data highly suggests that CDCA is indeed causing an increase in mitophagy, which was confirmed by confocal microscopy analysis of data supplied by the use of a novel mitophagy fluorescent reporter [
24]. The data unquestionably show that there is a virtual doubling of colocalization signal from the mitophagy and lysosome dyes within individual adipocytes, an effect that is independent of TGR5 levels (
Figure 6). Since it has been known for some time that higher doses of BA lead to mitochondrial membrane potential dissipation and mitochondrial dysfunction [
15], this work proposes that the explanation for the metabolic improvement seen in this model hinges not on thermogenic dissipation through the induction of UCP1 activity, but rather a very mild, survivable, dissipation of mitochondrial membrane potential that leads to a quasi mitohormetic effect, contributing to the improvement of the mitochondrial population efficiency and capacity [
16], while, at the same time, removing excess nutrients in the form of elevated membrane potential, which has been known to be a major driver of obesity-related metabolic impairment [
25]. While it is true that CDCA is not the most potent natural TGR5 agonist, the fact that FXR specific agonism has been shown to be harmful in an obesity setting explains this apparent limitation and justifies its use to, once and for all, try to explain these effects. In fact, by utilizing CDCA, this work highlights the fact that some very important effects of CDCA are not receptor dependent, as demonstrated by the data.
As for the strengths and weaknesses of this work, they mostly revolve around the experimental model. The fact that rodents, the commonly used experimental model in biomedical research, have such a potent and elevated dependency in BAT thermogenesis, any effect of BA that do not hinge on BAT activation by TGR5 agonism become incredibly difficult to correctly evaluate. As such, by using an in vitro model, molecular mechanisms and pathways that were overshadowed by BAT activation can thus be brought up for evaluation and measurement. Obviously, this work should be replicated in less BAT activation-prone models, as it would most interestingly be to evaluate bile acids effects in obese humans. Furthermore, it is tempting to assume that this phenomenon reported here is independent of target tissue, but given the intricate particularities of mitochondrial function and dynamics in the various tissues throughout the body, this question should be addressed in other cellular lines or, even more interestingly, in TGR5-KO animals. Finally, it would be important to also analyze if inhibition of mitophagy/autophagy with resource to chemical/pharmacological agents (for example, using Wortmannin) would indeed prevent the beneficial effects of BA.
In conclusion, this work proposes that BA have a yet unrecognized effect on mitochondria, achieving similar results to the current model of TGR5 activation, but mechanistically very different. This is extremely interesting for human applications, since BAT presence and activity in adult humans is still a matter of heated debate. The data suggests that CDCA might be a potent metabolic regulator in adult humans as it undoubtedly is in rodents.
4. Materials and Methods
Except when noted, all chemical reagents were purchased from Sigma-Aldrich (St. Louis, MO, USA) and were of the highest degree of purity commercially available.
4.1. Experimental Design for Cell Culture and TGR5 Silencing by CRISPR/Cas9
3T3-L1 fibroblasts (mycoplasm-free as evaluated by DAPI staining) were purchased from the American Type Culture Collection (ATCC, Manassas, VA, USA), and culturing and differentiation protocols were performed as before [
3]. Briefly, cells were grown in 75-cm
2 flasks (Sarstedt, Nümbrecht, Germany) with 15 mL Dulbecco’s modified eagle’s medium, DMEM (Sigma-Aldrich) 25 mM glucose, supplemented with 10% new-born calf serum, NCS (Thermo-Fisher, Waltham, MA, USA) and 1% penicillin–streptomycin mix (Thermo-Fisher) to sub-confluence, with routine medium changes every 48 h. Cells were subpassaged by trypsin-ethylenediaminetetraacetic acid, EDTA (Thermo-Fisher) detachment when confluence approached 80–90%.
Given the known resilience of mature 3T3-L1 adipocytes to manipulation and modification, which was confirmed by achieving very low silencing rates with silencing RNA (siRNA) delivered by both lipofectamine 2000, lipofectamine 3000, lipofectamine iMax, and electroporation with a Neon electroporator (all from Thermo-Fisher), it was decided to use an elegant protocol using Dharmacon’s Edit-R inducible CRISPR/Cas9 lentivirus (Horizon Discovery, Waterbeach, UK). These viruses contain a plasmid that codes for an inducible Cas9 endonuclease, which is transduced in the presence of doxycycline. Furthermore, the plasmid containing the Cas9 confers resistance to puromycin as a selection feature.
Fifty thousand cells were plated in 6-well multiwell plates (Sarstedt) in the same medium as above and, after 24 h, were exposed to the lentivirus containing the Cas9, with a multiplicity of infection (MOI) of 2. After 48 h, the medium was exchanged and 1 µM puromycin was added to each well, which resulted in the death of all non- or inefficiently-transfected cells. After 48 h, the medium was removed and normal DMEM + NCS were plated until the cell population had recovered. At this point, a second infection was performed (once more with a MOI of 2) with a sgRNA-coding plasmid contained in lentivirus (also from Dhamacon, Lafayette, CO, USA) that would guide the Cas9 towards the TGR5 gene (source clone ID: VSGMMM_27032603; Genomic location: mm10|-chr1:74279345–7429367; DNA target sequence: TAG TGG TGG GCG ACG CTC AT). This second lentiviral plasmid also conferred resistance to an antibiotic, in this case blasticidin; 1 µM blasticidin was thus used for a second cell selection. After the cell population had recovered its numbers, cells were ready for differentiation.
Subsequently, 50,000 cells were plated into each well of a 12-well multiwell plate in the same medium as above (DMEM + NCS). Upon achieving confluence, 48 h were then counted to achieve day 0 of differentiation, when the medium was exchanged for DMEM, as above, but with 10% fetal bovine serum instead of NCS, and also supplemented with 1 µg/mL insulin, 0.5 mM 3-isobutylmethyl-1-xantine (IBMX), 0.25 µM dexamethasone (DEX) and 2 µM rosiglitazone (ROSI). This medium was kept in the well for 48 h and then exchanged by the same medium, but without IBMX, DEX, and ROSI. Medium with FBS and Insulin was kept for the duration of the differentiation protocol, exchanged every 48 h until the differentiation was fully achieved (typically, over 70–80% of the cells achieve the morphology of adipocytes).
At this time point, Cas9 activity was induced by 1 µM doxycycline exposure for 96 h, after which the cells were exposed to 50 µM CDCA (or vehicle, DMSO), as before [
3], still in the presence/absence of doxycycline. A full schematic of this protocol can be found in the
supplementary materials (Figure S4). All assays were performed with cells at this point in differentiation and eventual Cas9 activation.
4.2. Intracellular Triglyceride Quantification
Adipocytical intracellular triglyceride deposition was quantified by Oil-Red O staining, as before [
3]. Briefly, after treatments, cells were washed twice with warm phosphate-buffered saline buffer (PBS) and fixed by 30 min exposure to 4% paraformaldehyde in PBS, in an orbital shaking table. Cells were then washed twice more with PBS and once with distilled water, after which an overnight drying phase occurred. Plates were then incubated with Oil-Red O stain (6:4 Oil Red O stain 0.6% in isopropanol) for 1 h in the same orbital shaking table and washed three times with distilled water. Incorporated dye was dissolved in isopropanol, transferred into new multiwell plates and absorbance was recorded at 490 nm in a Victor 3 plate reader (Perkin-Elmer, Waltham, MA, USA).
4.3. Mitochondrial Membrane Potential (ΔΨ) and Reactive Oxygen Species (ROS) Evaluation
Mitochondrial membrane potential (ΔΨ) was measured by the use of a fluorescent dye, tetramethylrhodamine methyl ester (TMRM). TMRM is a cell-permeant cationic dye that is rapidly sequestered by living, respiring mitochondria due to the intramitochondrial negative charge accumulation. By working with a quenching concentration of TMRM of 6.6 µM, the mitochondrial matrix becomes overloaded with dye molecules, which effectively inhibit their own fluorescence by proximity quenching [
26]. TMRM fluorescence was recorded at 590 nm after 485 nm excitation in the same plate reader as above, after a 15 min incubation with the probe and two washes with warm PBS to remove unloaded dye. After 10 min of basal recording of fluorescence, cells were exposed to a powerful mitochondrial uncoupler, 2 µM dinitrophenol (DNP). DNP destroys the ΔΨ and this leads to the release of trapped TMRM, thus removing the quenching block of fluorescence. Since TMRM molecules accumulate as a direct function of ΔΨ, the higher the fluorescence increase from basal to uncoupled is a direct indicator of how much ΔΨ the cell’s mitochondria possessed.
For reactive oxygen species generation (ROS) quantification, cells were loaded with 2′,7′-dichlorodihydrofluorescein diacetate (DCF-DA). DCF-DA is a cell-permeant dye that is quickly processed by intracellular enzymes, trapping and activating the probe within the cell, where it can contact hydrogen peroxide (H
2O
2) and thus become fluorescent [
27]. Cells were loaded with 50 µM DCF-DA and incubated for 30 min, after which cells were washed twice with warm PBS and fluorescence was recorded in the same plate reader as above, with an excitation and emission wavelengths of 485 and 535 nm, respectively. Fluorescence was recorded for 10 min to establish a rate of ROS generation.
4.4. Mitochondrial Respiration Measurement
Mitochondrial respiration was evaluated by Seahorse XFe24 extracellular flux analysis (Agilent Technologies, Santa Clara, CA, USA). Briefly, at the start of the differentiation protocol, cells were plated in a Seahorse XFe24 plate instead of a 12-well multiwell plate, at 10,000 cells per well. All other differentiation and Cas9 induction steps were performed as above for the 12-well plates. On the day of the assay, cells were washed twice and incubated for 1 h with serum-free DMEM, as indicated by the manufacturer. The contents of the cell mito stress kit (Oligomycin, FCCP, Antimycin A/Rotenone mix, 1, 2, 0.5 µM final concentration respectively) were diluted in serum-free DMEM and loaded in a previously hydrated Seahorse sensor cartridge. After incubation, the cartridge and cell plate were loaded into the analyzer and a standard cell mito stress test protocol was run. Results were normalized by sulforhodamine B (SRB) quantification of cellular protein present in each well [
3] and were analyzed using the Wave software (version 2.4.2) associated with the Seahorse equipment, also from Agilent.
4.5. Real-Time PCR
Gene expression analysis was performed by qPCR. RNA was extracted and purified by the Trizol method [
28]. RNA was quantified with a Nanodrop One (Thermo-Fisher) and 500 ng of RNA were, according to manufacturer’s instructions, reverse transcribed with recourse to the iScript cDNA Synthesis kit (Bio-Rad, Hercules, CA, USA) in a Bio-Rad MyCycler. cDNA was diluted 1:10 and used for qPCR (performed in a Bio-Rad Mini-Opticon real-time PCR) with the use of the SsoAdvanced Universal SYBR Green Supermix (Bio-Rad). Primers used are listed in the
supplementary methods section (Table S1). Data were normalized by the 2
-ΔΔCt method [
29].
4.6. Western Blotting
The protein content in the cells was quantified by Western Blotting [
30]. Briefly, after treatments, cells were washed twice with PBS and scrapped in Trizol [
31]. Purified protein extracts were quantified by the bicinchoninic acid method and 50 µg of protein in Laemmli buffer were electrophoresed in lab-made sodium dodecyl sulphate-polyacrylamide gel electrophoresis (SDS-PAGE) gels, of the Criterion TGX type (Bio-Rad). This polyacrylamide has trihalo compounds embedded which bind to tryptophan residues in proteins, allowing the visualization of the protein in gel or after transfer. Gels were imaged using a GelDoc EZ (Bio-Rad). Separated proteins were then transferred to polyvinylidene difluoride (PVDF) membranes (Bio-Rad) via the use of a TransBlot Turbo apparatus (Bio-Rad). Membranes were blocked for 2 h in 5% bovine serum albumin (BSA) blocking buffer (Thermo-Fisher) and incubated overnight, at 4 °C with agitation, with primary antibodies (list of used antibodies can be found in the
supplementary methods section, Table S2). The following morning, membranes were washed for 20 min twice in Tris-Buffered Saline Tween-20 0.1% (TBS-T) and incubated at room temperature with secondary antibodies for 1 h. After two more cycles of 20-min washes with TBS-T, membranes were protected from the light and incubated for 30 min with QDot 625 Streptavidin conjugate (Thermo-Fisher). Finally, membranes were imaged in a GelDoc EZ (Bio-Rad). Blots were normalized against total protein quantification of respective lanes from the same gel, as evaluated by imaging the gels, as previously mentioned, and following standard procedures [
32,
33]. Supplementary representative TGX gel images are supplied.
4.7. NMR Spectroscopy
Exposures and reagents used for NMR spectroscopy were as before [
3].
1H and
13C NMR spectra of aqueous extracts were acquired on a 14.1 Tesla Agilent VNMRS (Santa Clara, CA, USA) spectrometer using, respectively, a 3-mm indirect detection and a 3-mm broadband NMR probe.
1H NMR spectra consisted of 21 k points defining a spectral width of 7.2 kHz. A total of 64 scans was averaged to ensure adequate signal-to-noise ratios. In order to perform fully quantitative analysis typical acquisition parameters included a 30° radiofrequency observe pulse and an interpulse delay of 10 s to ensure full
1H relaxation.
13C NMR spectra consisted of 91 k points defining a spectral width of 37 kHz. Between 10k and 20k scans were averaged to ensure suitable signal-to-noise ratios for
13C multiplet quantification. Typical acquisition parameters included a 45° radiofrequency observe pulse and an interpulse delay of 3 s, to ensure full relaxation of aliphatic carbons. Before Fourier transformation,
1H free induction decays (FIDs) were zero filled and multiplied by a 0.2 Hz Lorentzian while for
13C FIDs, a 1 Hz Lorentzian was chosen. Spectral processing and deconvolution for quantitative analysis were performed using the NUTSpro™ NMR software (Acorn NMR Inc., Livermore, CA, USA).
4.8. Multivariate Analysis
Processed
1H NMR spectra were bucketed using all intensity values after excluding the water area and areas without any peaks (Amix Viewer, version 4.0.1, BrukerBiospin, Rheinstetten, Germany). Spectra were aligned using ico-shift algorithm [
34] and normalized by total spectral area. Obtained matrix was subjected to multivariate analysis (MVA) including principal component analysis (PCA) and partial-least square discriminant analysis (PLS-DA) using SIMCA 14.1 (Umetrics, Sweden) [
3]. PLS-DA models were validated by a 7-fold internal cross-validation and permutation test (
n = 200). The PLS-DA loading plots were obtained by multiplying loading weights with responding standard deviations and were colour coded according to variable importance to the projection (VIP) using statistical software R (R Core Team). The quantitative assessment of group differences was performed by individual peak integration (Amix-Viewer, version 4.0.1, BrukerBiospin, Rheinstetten, Germany). Metabolite peaks contributing to the group separation (PLS-DA VIP > 1) were integrated, normalized, and the statistical difference was assessed by ANOVA followed by Sidak’s multiple comparison test.
4.9. Mitochondrial Mitophagy Evaluation
Mitophagic activity was evaluated with a kit and following the manufacturer’s recommendations (Mtphagy kit, Dojindo Molecular Technologies, Kumamoto, Japan). Briefly, 10,000 cells were plated in µ-slide 8-well plates (Ibidi GmbH, Gräfelfing, Germany) and differentiation and treatments occurred as described above, after which cells were washed twice with warm HEPES-buffered Hanks’s solution and incubated in this medium with 50 nM Mtphagy dye for 30 min. After this period, cells were once more washed twice with warm HEPES-buffered Hanks and incubated with 10 nM Lysotracker Green dye, for 30 min. Finally, cells were washed twice with HEPES-buffered Hanks and imaged by confocal fluorescence microscopy (Maker and model: Carl Zeiss LSM 710; Type, magnification and numerical aperture of the objective lens: Plan Apochromat 63x/1.4; Temperature: controlled room temperature of 20 °C; Medium: Hanks Balanced Salt Solution, (Sigma-Aldrich); Fluorochromes: Lysotracker Green and Mtphagy dye, both from Dojindo EU, Munich, Germany; Camera maker and model: Not applicable; Acquisition software: Zen Black, Carl Zeiss, Jena, Germany). Images were stacked in Image J software (NIH, Bethesda, MD, USA) and a built-in script that looked for overlapping of signal of both channels was run using the Pearson’s correlation coefficient [
35]. Briefly, this method converts the images from both channels to B&W, where the fluorescent signal is marked as a white pixel. Thus, where white pixels overlap between the two figures, the software counts them as positive events. This is performed for each individual adipocyte in the photograph by hand-drawn limitation of the area of interest to the software. In total, for each experimental group, a
n of 4 different experiments, each with 6 repeats, was counted, which amassed to at least 185 individual adipocytes analyzed per treatment.
4.10. Statistical Analysis
Statistical analysis was performed using Graphpad Prism 6 for Mac OS (San Diego, CA, USA). One-way ANOVA with Fisher LSD post-hoc tests were performed, and a p value of < 0.05 was deemed statistically significant. The sample size was not calculated by statistical methods, but was determined based on previous experience. Experimenters were not blinded to the group assignment, but were for the outcome assessment.


 ,
, 


