Biomarker Discovery for Immunotherapy of Pituitary Adenomas: Enhanced Robustness and Prediction Ability by Modern Computational Tools

 and
and
Abstract
:1. Introduction
2. Results and Discussion
2.1. The Level of PA-Relevance of the DEGs Identified by Different Analytical Strategies
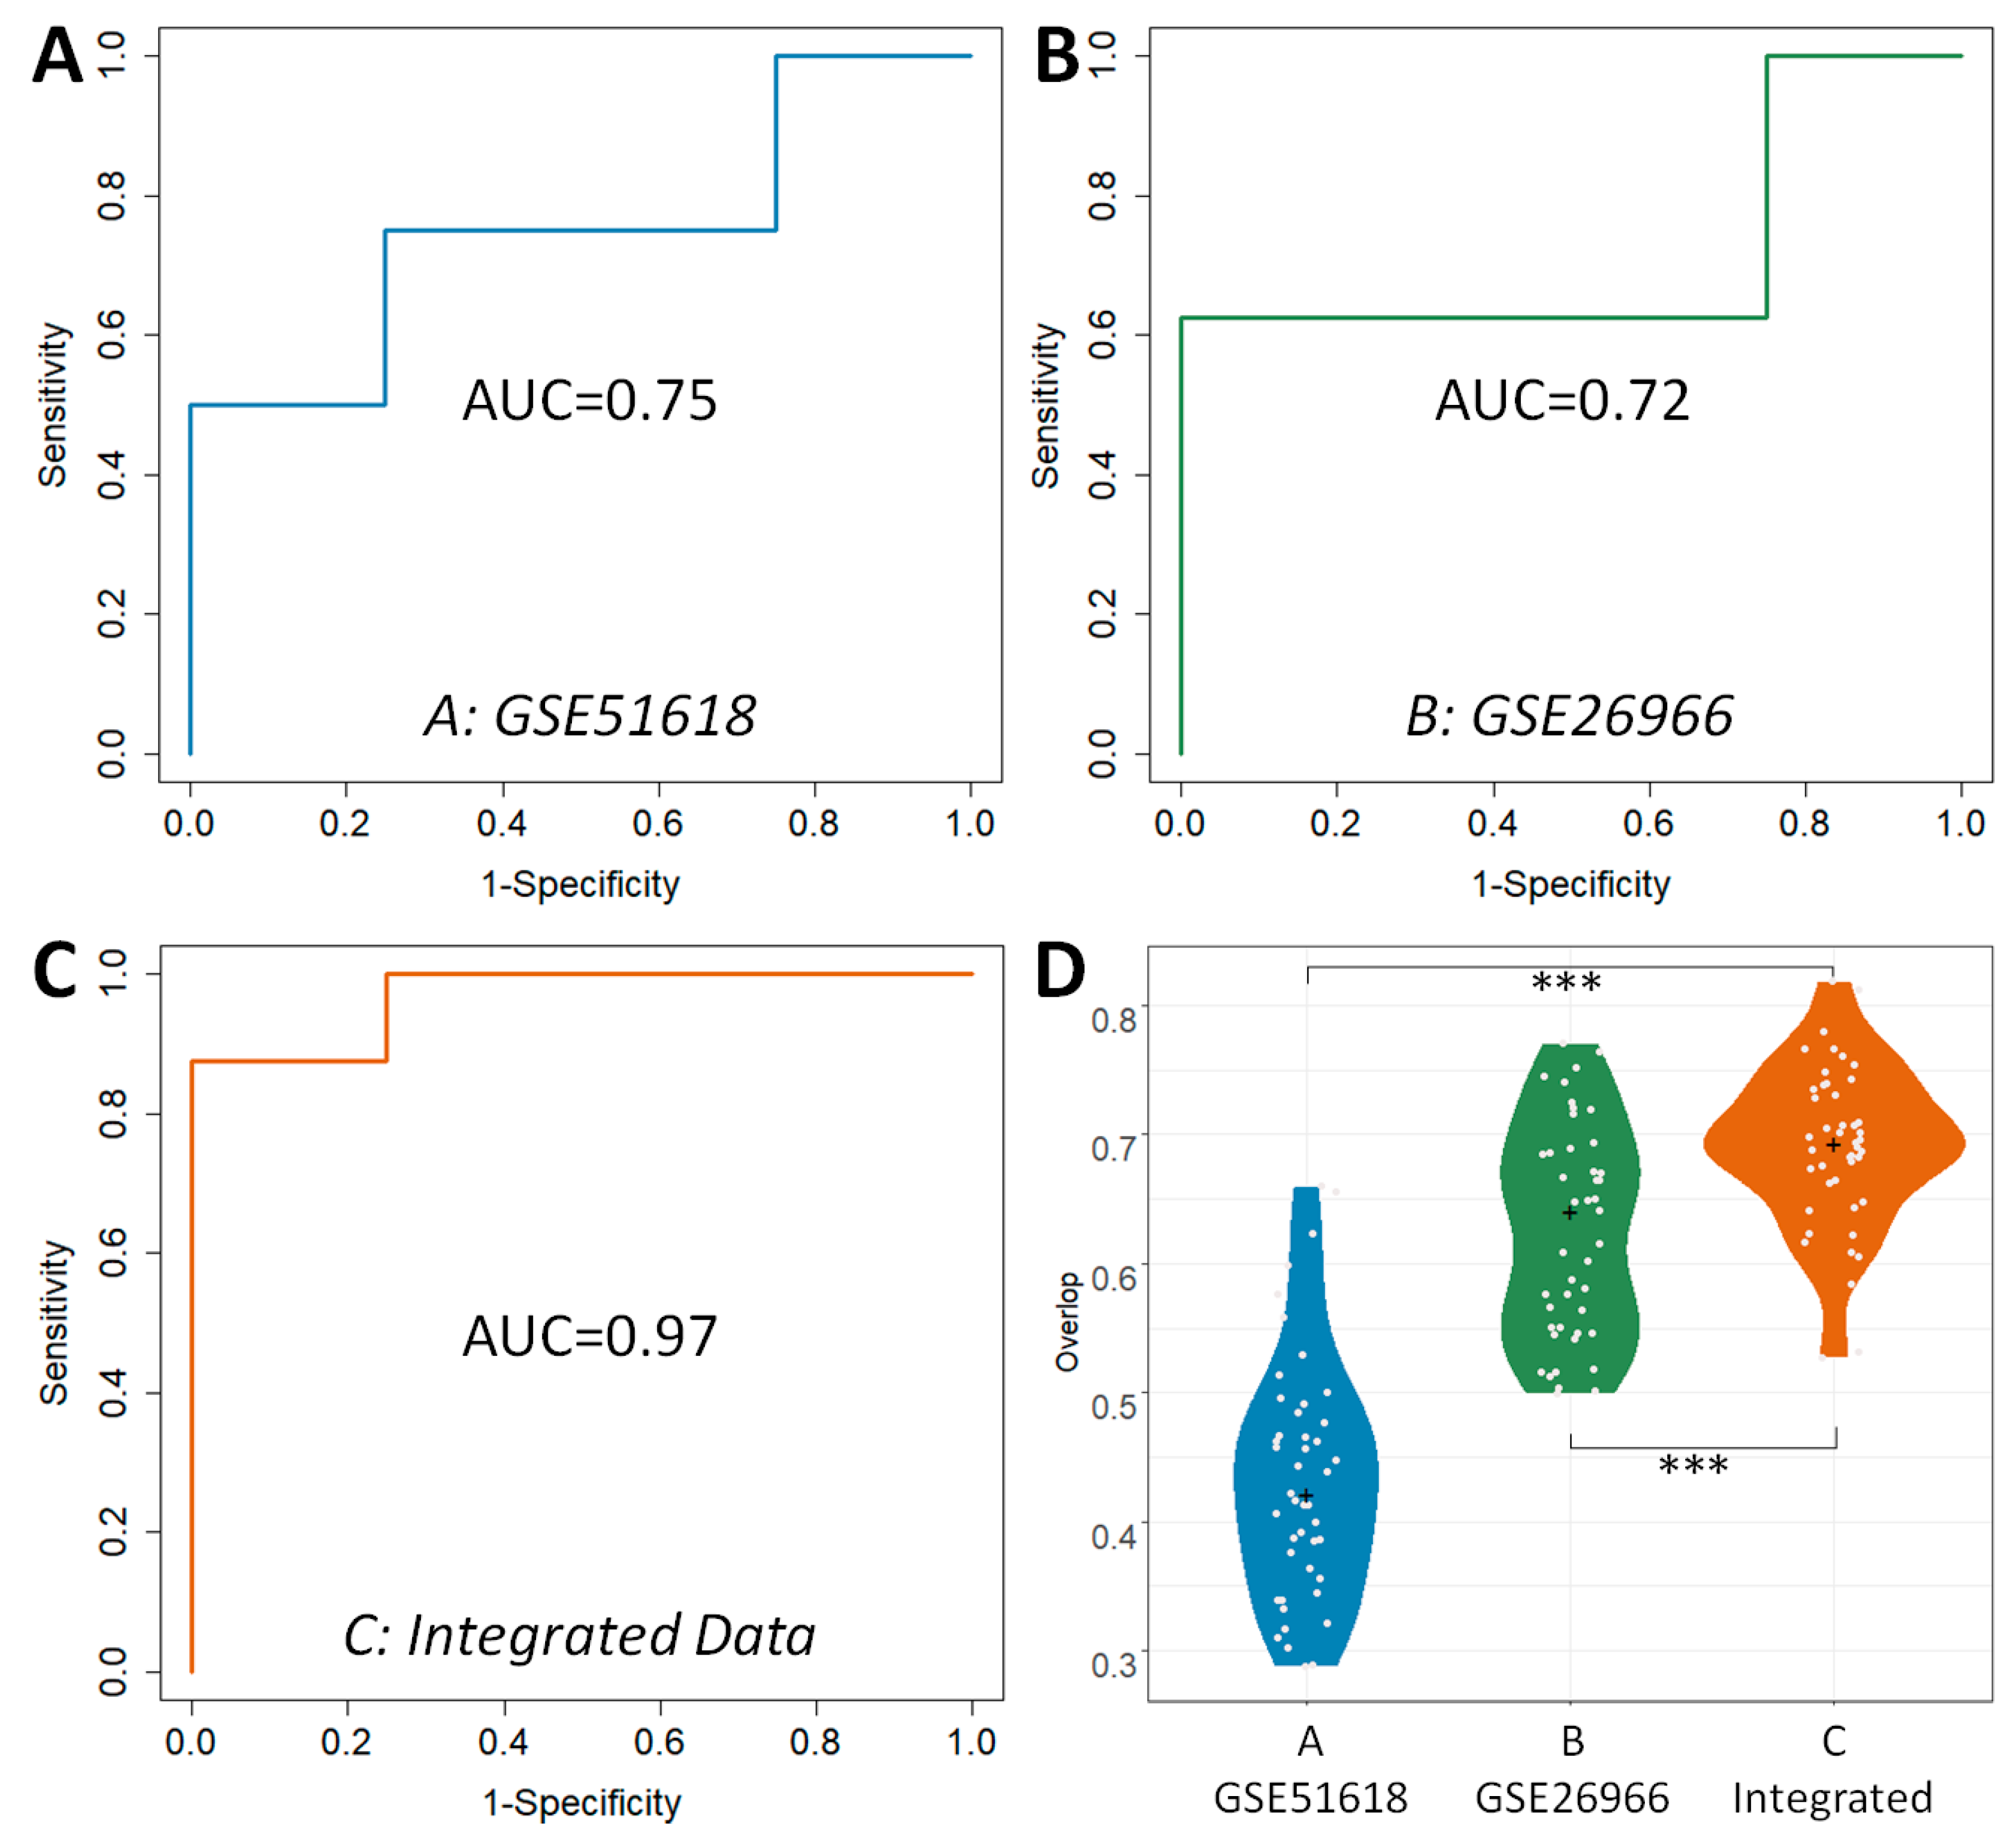
2.2. Evaluating the Classification Abilities of the DEGs Identified by Different Analytical Strategies
2.3. Comparative Analysis on the Robustness of the DEGs Identified by Different Analytical Strategies
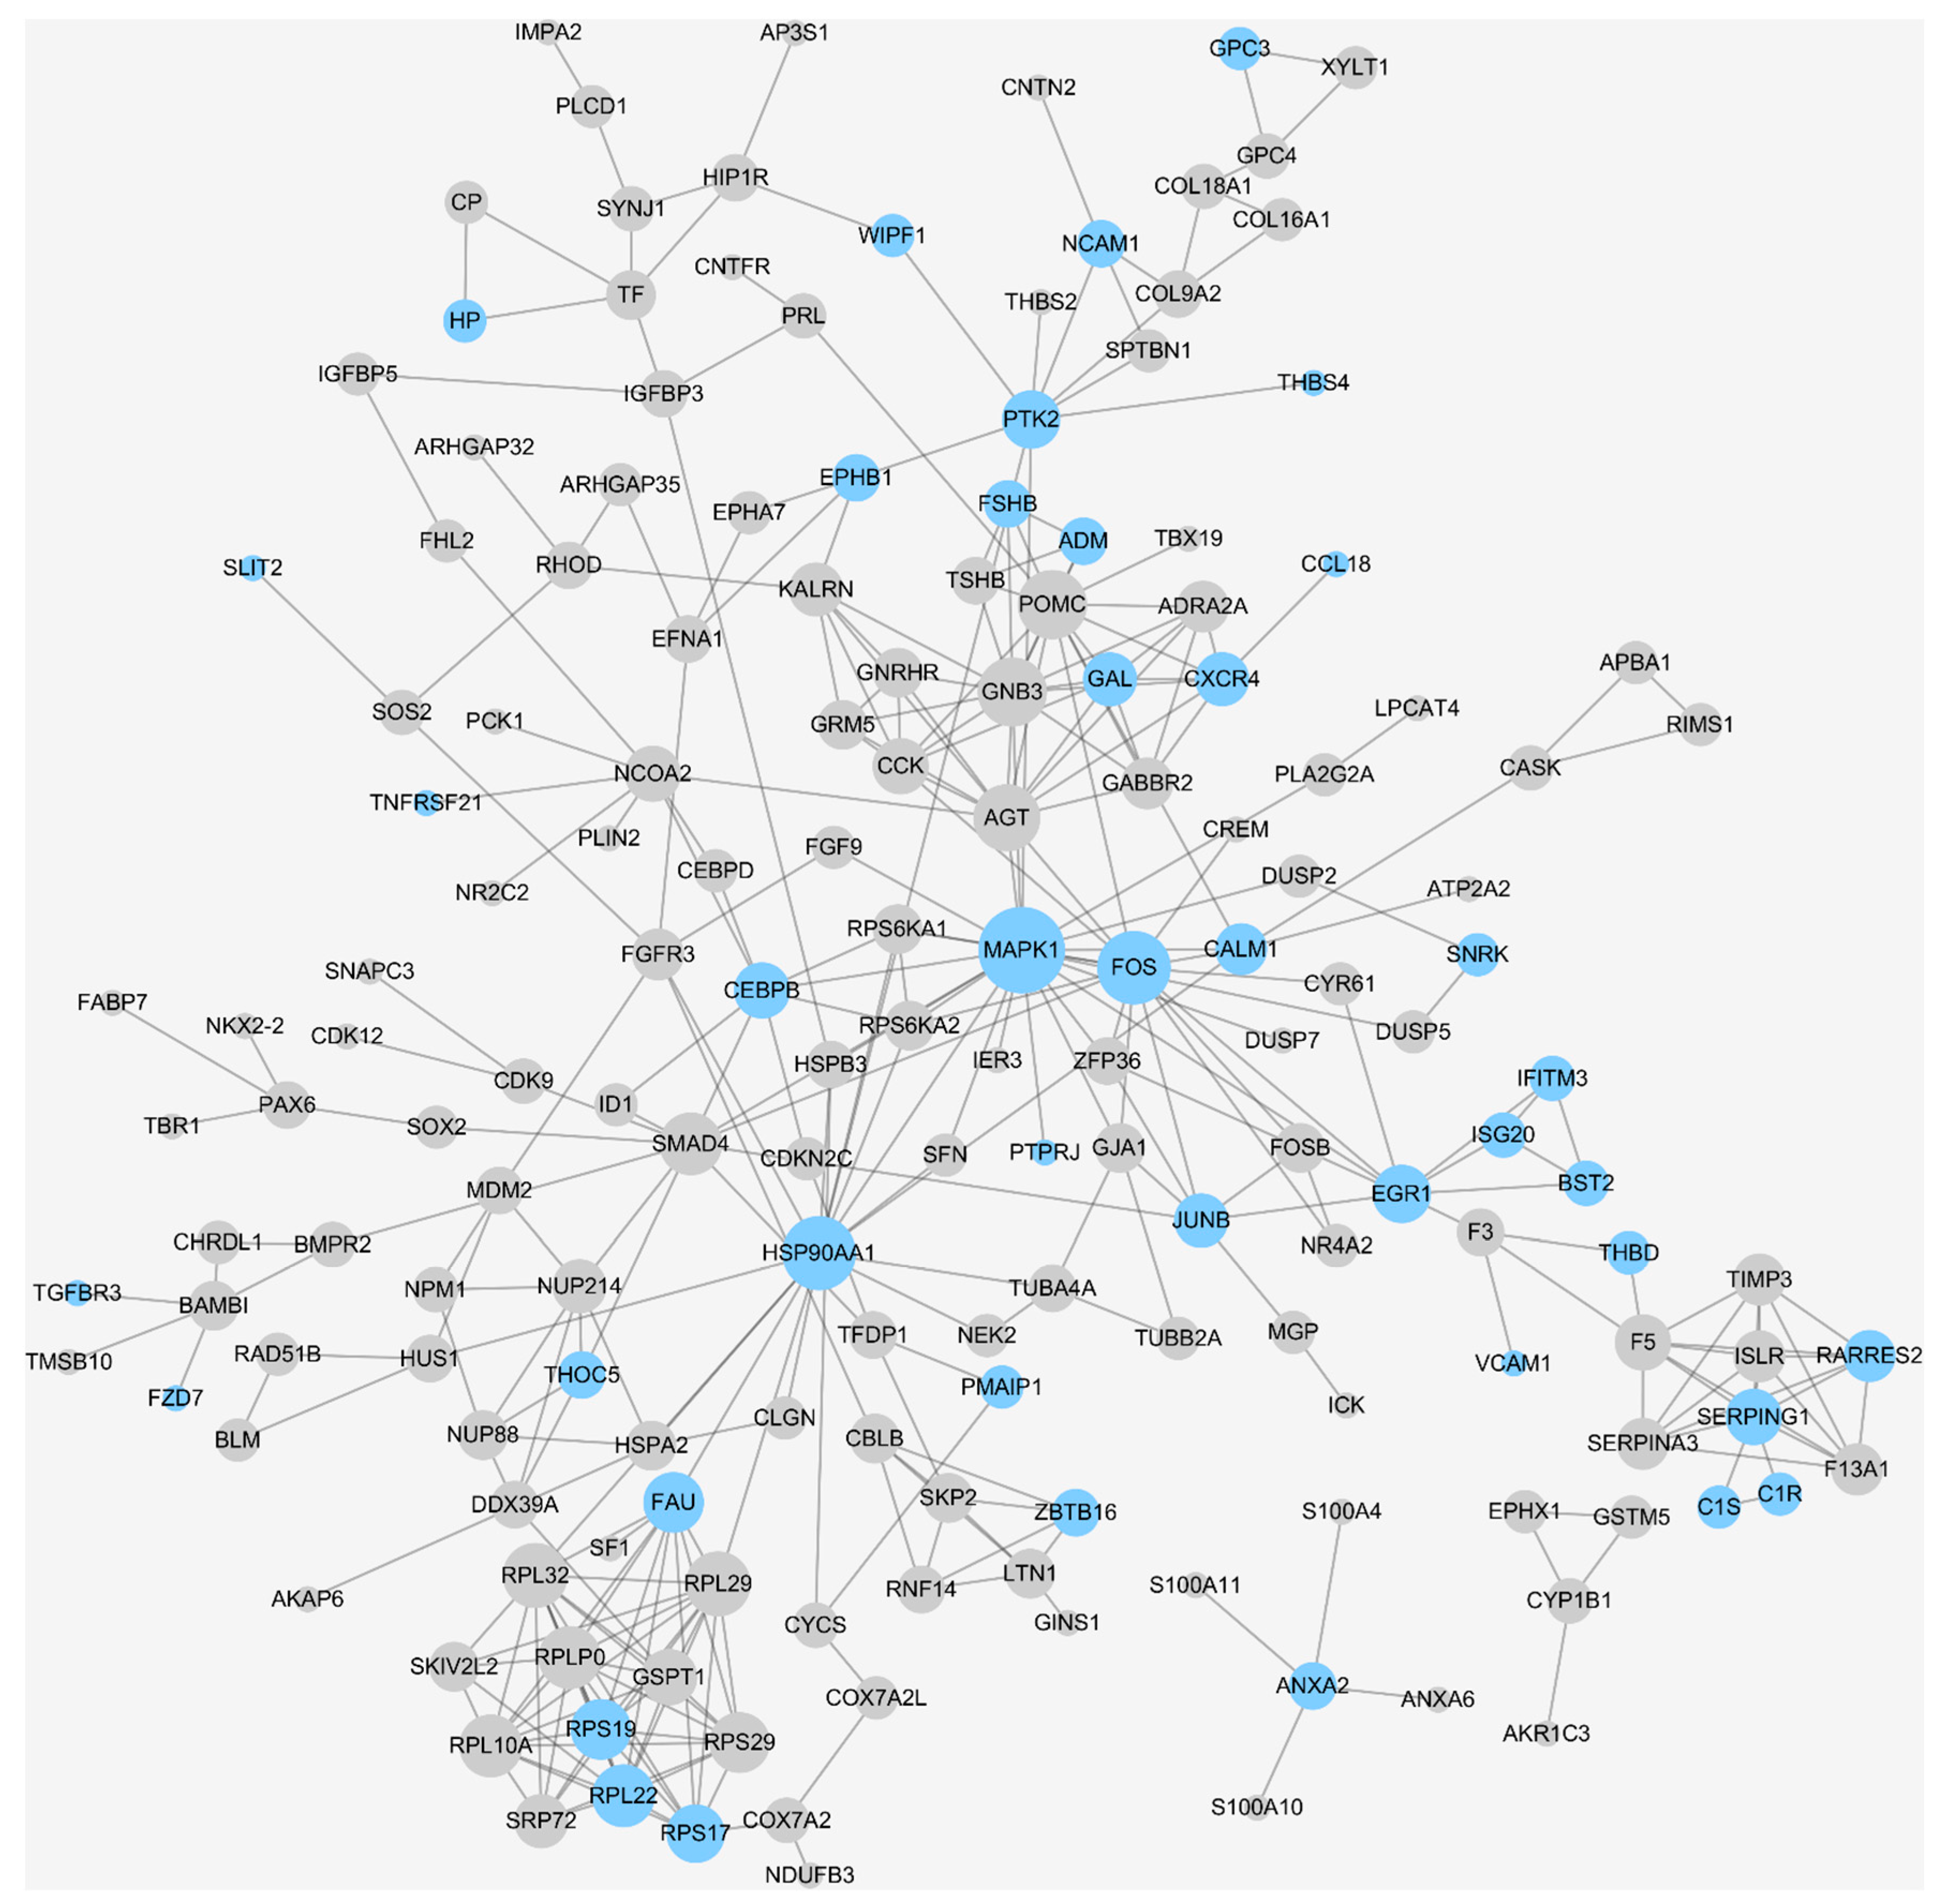
2.4. Annotating the Immune-Related DEGs and Candidate Target Discovery for PA Immunotherapy
3. Materials and Methods
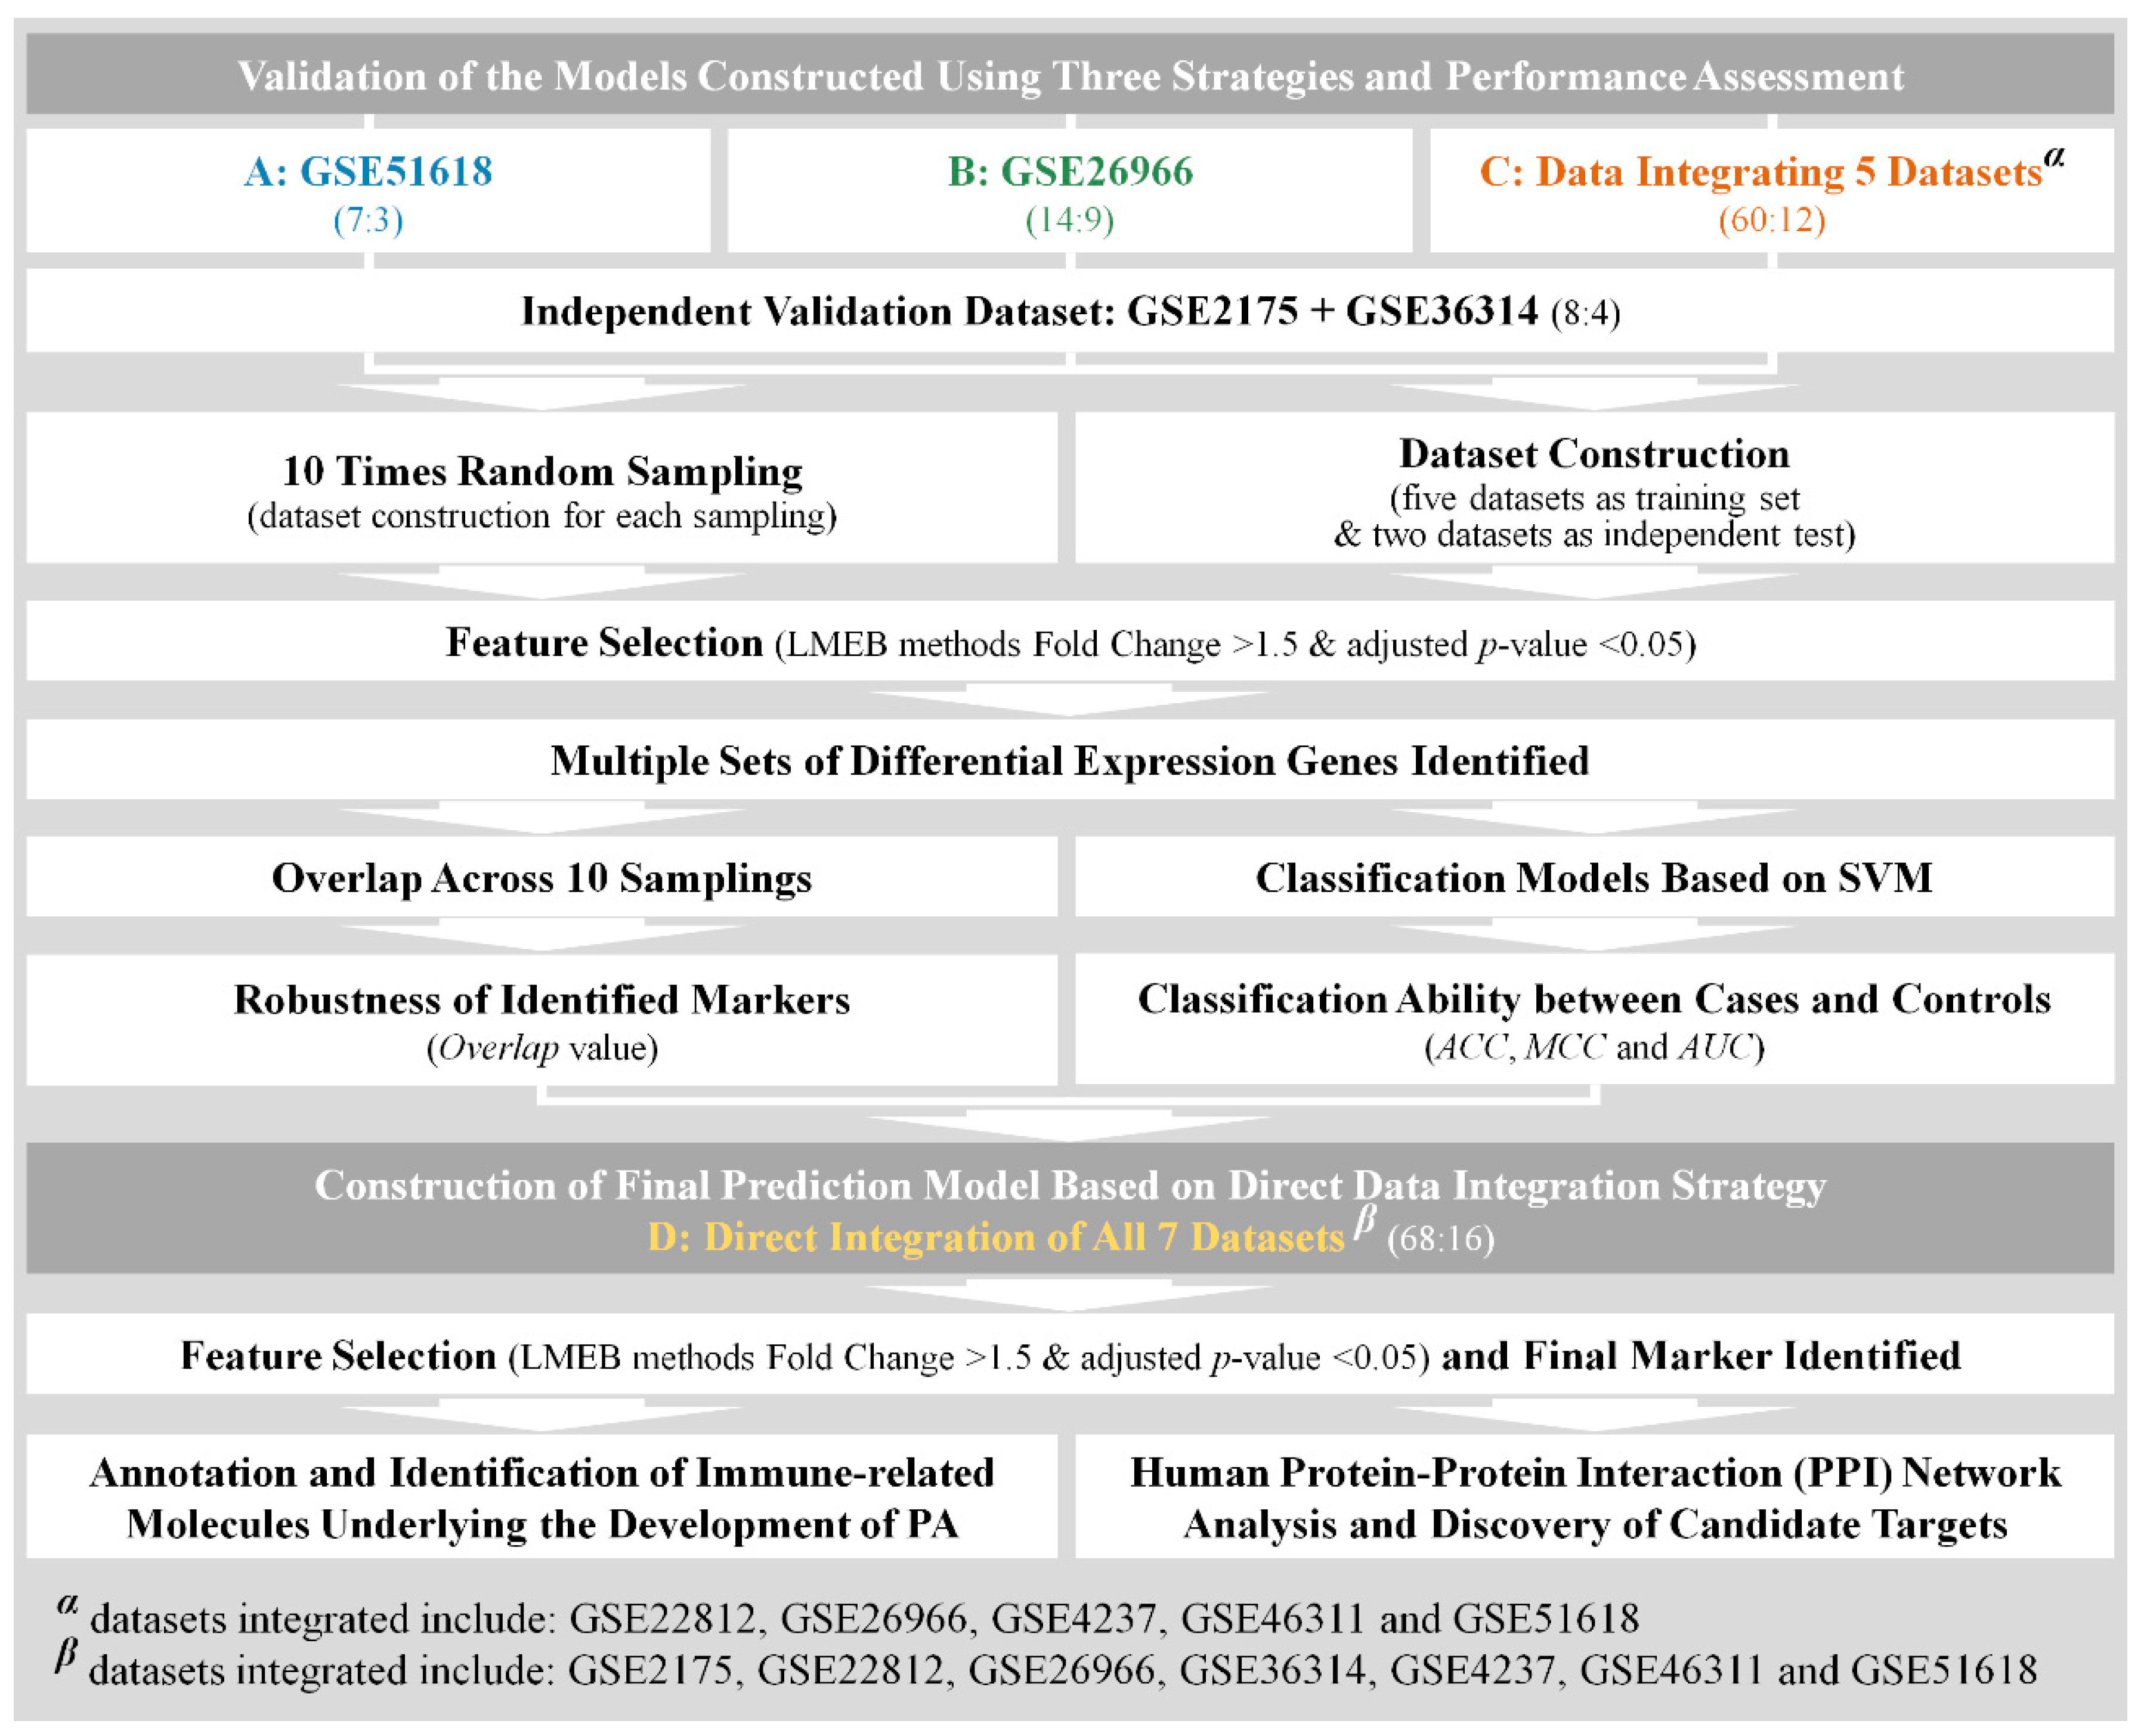
3.1. Construction of Analytical Datasets and Discovery of Differentially Expressed Genes
3.2. Validation of the Constructed Prediction Models Based on Different Analytical Datasets
3.2.1. The Level of Relevance of the Identified DEGs to Pituitary Adenoma
3.2.2. The Classification Capacity of the Identified DEGs Assessed by the Independent Validation Dataset
3.2.3. The Robustness of the Identified DEGs among Different Sampling Groups
3.3. Annotating the Immune-Related DEGs and Candidate Target Discovery for PA Immunotherapy
4. Conclusions
Supplementary Materials
Author Contributions
Acknowledgments
Conflicts of Interest
References
- Salomon, M.P.; Wang, X.; Marzese, D.M.; Hsu, S.C.; Nelson, N.; Zhang, X.; Matsuba, C.; Takasumi, Y.; Ballesteros-Merino, C.; Fox, B.A.; et al. The epigenomic landscape of pituitary adenomas reveals specific alterations and differentiates among acromegaly, cushing’s disease and endocrine-inactive subtypes. Clin. Cancer Res. 2018, 24, 4126–4136. [Google Scholar] [CrossRef] [PubMed]
- Zhu, H.; Guo, J.; Shen, Y.; Dong, W.; Gao, H.; Miao, Y.; Li, C.; Zhang, Y. Functions and mechanisms of tumor necrosis factor-alpha and noncoding rnas in bone-invasive pituitary adenomas. Clin. Cancer Res. 2018, 24, 5757–5766. [Google Scholar] [CrossRef] [PubMed]
- Tu, G.; Fu, T.; Yang, F.; Yao, L.; Xue, W.; Zhu, F. Prediction of glun2b-ct1290-1310/dapk1 interaction by protein(-)peptide docking and molecular dynamics simulation. Molecules 2018, 23, 3018. [Google Scholar] [CrossRef]
- Nota, N.M.; Wiepjes, C.M.; de Blok, C.J.M.; Gooren, L.J.G.; Peerdeman, S.M.; Kreukels, B.P.C.; den Heijer, M. The occurrence of benign brain tumours in transgender individuals during cross-sex hormone treatment. Brain 2018, 141, 2047–2054. [Google Scholar] [CrossRef] [PubMed]
- Han, Z.J.; Xue, W.W.; Tao, L.; Zhu, F. Identification of novel immune-relevant drug target genes for alzheimer’s disease by combining ontology inference with network analysis. CNS Neurosci. Ther. 2018, 24, 1253–1263. [Google Scholar] [CrossRef] [PubMed]
- Fu, T.; Zheng, G.; Tu, G.; Yang, F.; Chen, Y.; Yao, X.; Li, X.; Xue, W.; Zhu, F. Exploring the binding mechanism of metabotropic glutamate receptor 5 negative allosteric modulators in clinical trials by molecular dynamics simulations. ACS Chem. Neurosci. 2018, 9, 1492–1502. [Google Scholar] [CrossRef] [PubMed]
- Mehta, G.U.; Lonser, R.R. Management of hormone-secreting pituitary adenomas. Neuro. Oncol. 2017, 19, 762–773. [Google Scholar] [CrossRef]
- Xue, W.; Yang, F.; Wang, P.; Zheng, G.; Chen, Y.; Yao, X.; Zhu, F. What contributes to serotonin-norepinephrine reuptake inhibitors’ dual-targeting mechanism? The key role of transmembrane domain 6 in human serotonin and norepinephrine transporters revealed by molecular dynamics simulation. ACS Chem. Neurosci. 2018, 9, 1128–1140. [Google Scholar] [CrossRef]
- Wang, P.; Fu, T.; Zhang, X.; Yang, F.; Zheng, G.; Xue, W.; Chen, Y.; Yao, X.; Zhu, F. Differentiating physicochemical properties between ndris and snris clinically important for the treatment of adhd. Biochim. Biophys. Acta Gen. Subj. 2017, 1861, 2766–2777. [Google Scholar] [CrossRef]
- Molitch, M.E. Diagnosis and treatment of pituitary adenomas: A review. JAMA 2017, 317, 516–524. [Google Scholar] [CrossRef]
- Castinetti, F.; Regis, J.; Dufour, H.; Brue, T. Role of stereotactic radiosurgery in the management of pituitary adenomas. Nat. Rev. Endocrinol. 2010, 6, 214–223. [Google Scholar] [CrossRef] [PubMed]
- Wang, P.; Zhang, X.; Fu, T.; Li, S.; Li, B.; Xue, W.; Yao, X.; Chen, Y.; Zhu, F. Differentiating physicochemical properties between addictive and nonaddictive adhd drugs revealed by molecular dynamics simulation studies. ACS Chem. Neurosci. 2017, 8, 1416–1428. [Google Scholar] [CrossRef] [PubMed]
- Yang, F.Y.; Fu, T.T.; Zhang, X.Y.; Hu, J.; Xue, W.W.; Zheng, G.X.; Li, B.; Li, Y.H.; Yao, X.J.; Zhu, F. Comparison of computational model and X-ray crystal structure of human serotonin transporter: Potential application for the pharmacology of human monoamine transporters. Mol. Simul. 2017, 43, 1089–1098. [Google Scholar] [CrossRef]
- Li, Y.H.; Yu, C.Y.; Li, X.X.; Zhang, P.; Tang, J.; Yang, Q.; Fu, T.; Zhang, X.; Cui, X.; Tu, G.; et al. Therapeutic target database update 2018: Enriched resource for facilitating bench-to-clinic research of targeted therapeutics. Nucleic Acids Res. 2018, 46, D1121–D1127. [Google Scholar] [PubMed]
- Zhu, F.; Li, X.X.; Yang, S.Y.; Chen, Y.Z. Clinical success of drug targets prospectively predicted by in silico study. Trends Pharmacol. Sci. 2018, 39, 229–231. [Google Scholar] [CrossRef] [PubMed]
- Tang, J.; Zhang, Y.; Fu, J.; Wang, Y.; Li, Y.; Yang, Q.; Yao, L.; Xue, W.; Zhu, F. Computational advances in the label-free quantification of cancer proteomics data. Curr. Pharm. Des. 2018. [Google Scholar] [CrossRef] [PubMed]
- Frara, S.; Maffezzoni, F.; Mazziotti, G.; Giustina, A. Current and emerging aspects of diabetes mellitus in acromegaly. Trends Endocrinol. Metab. 2016, 27, 470–483. [Google Scholar] [CrossRef] [PubMed]
- Zhu, F.; Han, B.; Kumar, P.; Liu, X.; Ma, X.; Wei, X.; Huang, L.; Guo, Y.; Han, L.; Zheng, C.; et al. Update of ttd: Therapeutic target database. Nucleic Acids Res. 2010, 38, D787–D791. [Google Scholar] [CrossRef]
- Zheng, G.; Yang, F.; Fu, T.; Tu, G.; Chen, Y.; Yao, X.; Xue, W.; Zhu, F. Computational characterization of the selective inhibition of human norepinephrine and serotonin transporters by an escitalopram scaffold. Phys. Chem. Chem. Phys. 2018, 20, 29513–29527. [Google Scholar] [CrossRef]
- Li, X.X.; Yin, J.; Tang, J.; Li, Y.; Yang, Q.; Xiao, Z.; Zhang, R.; Wang, Y.; Hong, J.; Tao, L.; et al. Determining the balance between drug efficacy and safety by the network and biological system profile of its therapeutic target. Front. Pharmacol. 2018, 9, 1245. [Google Scholar] [CrossRef]
- Losa, M.; Bogazzi, F.; Cannavo, S.; Ceccato, F.; Curto, L.; De Marinis, L.; Iacovazzo, D.; Lombardi, G.; Mantovani, G.; Mazza, E.; et al. Temozolomide therapy in patients with aggressive pituitary adenomas or carcinomas. J. Neurooncol. 2016, 126, 519–525. [Google Scholar] [CrossRef] [PubMed]
- Yang, H.; Qin, C.; Li, Y.H.; Tao, L.; Zhou, J.; Yu, C.Y.; Xu, F.; Chen, Z.; Zhu, F.; Chen, Y.Z. Therapeutic target database update 2016: Enriched resource for bench to clinical drug target and targeted pathway information. Nucleic Acids Res. 2016, 44, D1069–D1074. [Google Scholar] [CrossRef] [PubMed]
- Zhu, F.; Shi, Z.; Qin, C.; Tao, L.; Liu, X.; Xu, F.; Zhang, L.; Song, Y.; Liu, X.; Zhang, J.; et al. Therapeutic target database update 2012: A resource for facilitating target-oriented drug discovery. Nucleic Acids Res. 2012, 40, D1128–D1136. [Google Scholar] [CrossRef] [PubMed]
- McCormack, A.I.; Wass, J.A.; Grossman, A.B. Aggressive pituitary tumours: The role of temozolomide and the assessment of mgmt status. Eur. J. Clin. Investig. 2011, 41, 1133–1148. [Google Scholar] [CrossRef] [PubMed]
- Riebold, M.; Kozany, C.; Freiburger, L.; Sattler, M.; Buchfelder, M.; Hausch, F.; Stalla, G.K.; Paez-Pereda, M. A c-terminal hsp90 inhibitor restores glucocorticoid sensitivity and relieves a mouse allograft model of cushing disease. Nat. Med. 2015, 21, 276–280. [Google Scholar] [CrossRef] [PubMed]
- Ben-Shlomo, A.; Cooper, O. Role of tyrosine kinase inhibitors in the treatment of pituitary tumours: From bench to bedside. Curr. Opin. Endocrinol. Diabetes Obes. 2017, 24, 301–305. [Google Scholar] [CrossRef] [PubMed]
- Xu, J.; Wang, P.; Yang, H.; Zhou, J.; Li, Y.; Li, X.; Xue, W.; Yu, C.; Tian, Y.; Zhu, F. Comparison of fda approved kinase targets to clinical trial ones: Insights from their system profiles and drug-target interaction networks. Biomed. Res. Int. 2016, 2016, 2509385. [Google Scholar] [CrossRef] [PubMed]
- Zhu, F.; Ma, X.H.; Qin, C.; Tao, L.; Liu, X.; Shi, Z.; Zhang, C.L.; Tan, C.Y.; Chen, Y.Z.; Jiang, Y.Y. Drug discovery prospect from untapped species: Indications from approved natural product drugs. PLoS ONE 2012, 7, e39782. [Google Scholar] [CrossRef] [PubMed]
- Li, Y.H.; Wang, P.P.; Li, X.X.; Yu, C.Y.; Yang, H.; Zhou, J.; Xue, W.W.; Tan, J.; Zhu, F. The human kinome targeted by fda approved multi-target drugs and combination products: A comparative study from the drug-target interaction network perspective. PLoS ONE 2016, 11, e0165737. [Google Scholar] [CrossRef]
- Lin, A.L.; Jonsson, P.; Tabar, V.; Yang, T.J.; Cuaron, J.; Beal, K.; Cohen, M.; Postow, M.; Rosenblum, M.; Shia, J.; et al. Marked Response of a Hypermutated ACTH-Secreting Pituitary Carcinoma to Ipilimumab and Nivolumab. J. Clin. Endocrinol. Metab. 2018, 103, 3925–3930. [Google Scholar] [CrossRef]
- Zhu, F.; Zheng, C.J.; Han, L.Y.; Xie, B.; Jia, J.; Liu, X.; Tammi, M.T.; Yang, S.Y.; Wei, Y.Q.; Chen, Y.Z. Trends in the exploration of anticancer targets and strategies in enhancing the efficacy of drug targeting. Curr. Mol. Pharmacol. 2008, 1, 213–232. [Google Scholar] [CrossRef] [PubMed]
- Tao, L.; Zhu, F.; Xu, F.; Chen, Z.; Jiang, Y.Y.; Chen, Y.Z. Co-targeting cancer drug escape pathways confers clinical advantage for multi-target anticancer drugs. Pharmacol. Res. 2015, 102, 123–131. [Google Scholar] [CrossRef] [PubMed]
- Li, Y.H.; Li, X.; Hong, J.; Wang, Y.; Fu, J.; Yang, H.; Yu, C.; Li, F.; Hu, J.; Xue, W.W.; et al. Clinical trials, progression-speed differentiating features, and swiftness rule of the innovative targets of first-in-class drugs. Brief. Bioinform. 2019. [Google Scholar] [CrossRef]
- Kourelis, T.V.; Buckner, J.C.; Gangat, N.; Patnaik, M.M. Temozolomide induced bone marrow suppression—A single institution outcome analysis and review of the literature. Am. J. Hematol. 2015, 90, E183–E184. [Google Scholar] [CrossRef] [PubMed]
- Li, X.F.; Li, X.X.; Li, Y.H.; Yu, C.Y.; Xue, W.W.; Hu, J.; Li, B.; Wang, P.P.; Zhu, F. What makes species productive of anti-cancer drugs? Clues from drugs’ species origin, druglikeness, target and pathway. Anticancer Agents Med. Chem. 2018. [Google Scholar] [CrossRef] [PubMed]
- Xue, W.; Wang, P.; Tu, G.; Yang, F.; Zheng, G.; Li, X.; Li, X.; Chen, Y.; Yao, X.; Zhu, F. Computational identification of the binding mechanism of a triple reuptake inhibitor amitifadine for the treatment of major depressive disorder. Phys. Chem. Chem. Phys. 2018, 20, 6606–6616. [Google Scholar] [CrossRef] [PubMed]
- Yagnik, G.; Jahangiri, A.; Chen, R.; Wagner, J.R.; Aghi, M.K. Role of a p53 polymorphism in the development of nonfunctional pituitary adenomas. Mol. Cell Endocrinol. 2017, 446, 81–90. [Google Scholar] [CrossRef] [Green Version]
- Zhu, F.; Han, L.; Zheng, C.; Xie, B.; Tammi, M.T.; Yang, S.; Wei, Y.; Chen, Y. What are next generation innovative therapeutic targets? Clues from genetic, structural, physicochemical, and systems profiles of successful targets. J. Pharmacol. Exp. Ther. 2009, 330, 304–315. [Google Scholar] [CrossRef] [PubMed]
- Xue, W.; Fu, T.; Zheng, G.; Tu, G.; Zhang, Y.; Yang, F.; Tao, L.; Yao, L.; Zhu, F. Recent advances and challenges of the drugs acting on monoamine transporters. Curr. Med. Chem. 2018. [Google Scholar] [CrossRef] [PubMed]
- Couzin-Frankel, J. Breakthrough of the year 2013. Cancer immunotherapy. Science 2013, 342, 1432–1433. [Google Scholar] [CrossRef] [PubMed]
- Zheng, G.; Xue, W.; Yang, F.; Zhang, Y.; Chen, Y.; Yao, X.; Zhu, F. Revealing vilazodone’s binding mechanism underlying its partial agonism to the 5-ht1a receptor in the treatment of major depressive disorder. Phys. Chem. Chem. Phys. 2017, 19, 28885–28896. [Google Scholar] [CrossRef] [PubMed]
- Smyth, E.C.; Cervantes, A. Immunotherapy is not for all comers in chemotherapy-refractory advanced gastric cancer. Better predictive biomarkers are needed. Ann. Oncol. 2018, 29, 2027–2028. [Google Scholar] [CrossRef] [PubMed]
- Wang, P.; Wang, T.; Yang, Y.; Yu, C.; Liu, N.; Yan, C. Detection of programmed death ligand 1 protein and cd8+ lymphocyte infiltration in plurihormonal pituitary adenomas: A case report and review of the literatures. Medicine 2017, 96, e9056. [Google Scholar] [CrossRef]
- Kaliszczak, M.; van Hechanova, E.; Li, Y.; Alsadah, H.; Parzych, K.; Auner, H.W.; Aboagye, E.O. The hdac6 inhibitor c1a modulates autophagy substrates in diverse cancer cells and induces cell death. Br. J. Cancer 2018, 119, 1278–1287. [Google Scholar] [CrossRef] [PubMed]
- Xue, W.; Wang, P.; Li, B.; Li, Y.; Xu, X.; Yang, F.; Yao, X.; Chen, Y.Z.; Xu, F.; Zhu, F. Identification of the inhibitory mechanism of fda approved selective serotonin reuptake inhibitors: An insight from molecular dynamics simulation study. Phys. Chem. Chem. Phys. 2016, 18, 3260–3271. [Google Scholar] [CrossRef]
- Zheng, G.; Xue, W.; Wang, P.; Yang, F.; Li, B.; Li, X.; Li, Y.; Yao, X.; Zhu, F. Exploring the inhibitory mechanism of approved selective norepinephrine reuptake inhibitors and reboxetine enantiomers by molecular dynamics study. Sci. Rep. 2016, 6, 26883. [Google Scholar] [CrossRef] [PubMed]
- Lang, R.; Gundlach, A.L.; Holmes, F.E.; Hobson, S.A.; Wynick, D.; Hokfelt, T.; Kofler, B. Physiology, signaling, and pharmacology of galanin peptides and receptors: Three decades of emerging diversity. Pharmacol. Rev. 2015, 67, 118–175. [Google Scholar] [CrossRef] [PubMed]
- Alsaab, H.O.; Sau, S.; Alzhrani, R.; Tatiparti, K.; Bhise, K.; Kashaw, S.K.; Iyer, A.K. Pd-1 and pd-l1 checkpoint signaling inhibition for cancer immunotherapy: Mechanism, combinations, and clinical outcome. Front. Pharmacol. 2017, 8, 561. [Google Scholar] [CrossRef]
- Camilletti, M.A.; Ferraris, J.; Abeledo-Machado, A.; Converse, A.; Faraoni, E.Y.; Pisera, D.; Gutierrez, S.; Thomas, P.; Diaz-Torga, G. Participation of membrane progesterone receptor alpha in the inhibitory effect of progesterone on prolactin secretion. J. Neuroendocrinol. 2018, 30, e12614. [Google Scholar] [CrossRef]
- Vinay, D.S.; Ryan, E.P.; Pawelec, G.; Talib, W.H.; Stagg, J.; Elkord, E.; Lichtor, T.; Decker, W.K.; Whelan, R.L.; Kumara, H.; et al. Immune evasion in cancer: Mechanistic basis and therapeutic strategies. Semin. Cancer Biol. 2015, 35, S185–S198. [Google Scholar] [CrossRef] [Green Version]
- Lekva, T.; Berg, J.P.; Fougner, S.L.; Olstad, O.K.; Ueland, T.; Bollerslev, J. Gene expression profiling identifies esrp1 as a potential regulator of epithelial mesenchymal transition in somatotroph adenomas from a large cohort of patients with acromegaly. J. Clin. Endocrinol. Metab. 2012, 97, E1506–E1514. [Google Scholar] [CrossRef] [PubMed]
- Hussaini, I.M.; Trotter, C.; Zhao, Y.; Abdel-Fattah, R.; Amos, S.; Xiao, A.; Agi, C.U.; Redpath, G.T.; Fang, Z.; Leung, G.K.; et al. Matrix metalloproteinase-9 is differentially expressed in nonfunctioning invasive and noninvasive pituitary adenomas and increases invasion in human pituitary adenoma cell line. Am. J. Pathol. 2007, 170, 356–365. [Google Scholar] [CrossRef] [PubMed]
- Wierinckx, A.; Roche, M.; Raverot, G.; Legras-Lachuer, C.; Croze, S.; Nazaret, N.; Rey, C.; Auger, C.; Jouanneau, E.; Chanson, P.; et al. Integrated genomic profiling identifies loss of chromosome 11p impacting transcriptomic activity in aggressive pituitary prl tumors. Brain Pathol. 2011, 21, 533–543. [Google Scholar] [CrossRef] [PubMed]
- Yang, F.; Zheng, G.; Fu, T.; Li, X.; Tu, G.; Li, Y.H.; Yao, X.; Xue, W.; Zhu, F. Prediction of the binding mode and resistance profile for a dual-target pyrrolyl diketo acid scaffold against hiv-1 integrase and reverse-transcriptase-associated ribonuclease h. Phys. Chem. Chem. Phys. 2018, 20, 23873–23884. [Google Scholar] [CrossRef] [PubMed]
- Sav, A.; Rotondo, F.; Syro, L.V.; Scheithauer, B.W.; Kovacs, K. Biomarkers of pituitary neoplasms. Anticancer Res. 2012, 32, 4639–4654. [Google Scholar] [PubMed]
- Suhardja, A.; Kovacs, K.; Greenberg, O.; Scheithauer, B.W.; Lloyd, R.V. Prognostic indicators in pituitary tumors. Endocr. Pathol. 2005, 16, 1–9. [Google Scholar] [CrossRef]
- Di Ieva, A.; Rotondo, F.; Syro, L.V.; Cusimano, M.D.; Kovacs, K. Aggressive pituitary adenomas--diagnosis and emerging treatments. Nat. Rev. Endocrinol. 2014, 10, 423–435. [Google Scholar] [CrossRef] [PubMed]
- Raverot, G.; Castinetti, F.; Jouanneau, E.; Morange, I.; Figarella-Branger, D.; Dufour, H.; Trouillas, J.; Brue, T. Pituitary carcinomas and aggressive pituitary tumours: Merits and pitfalls of temozolomide treatment. Clin. Endocrinol. 2012, 76, 769–775. [Google Scholar] [CrossRef]
- Snyder, A.; Makarov, V.; Merghoub, T.; Yuan, J.; Zaretsky, J.M.; Desrichard, A.; Walsh, L.A.; Postow, M.A.; Wong, P.; Ho, T.S.; et al. Genetic basis for clinical response to ctla-4 blockade in melanoma. N. Engl. J. Med. 2014, 371, 2189–2199. [Google Scholar] [CrossRef]
- Mistry, M.; Gillis, J.; Pavlidis, P. Genome-wide expression profiling of schizophrenia using a large combined cohort. Mol. Psychiatry 2013, 18, 215–225. [Google Scholar] [CrossRef]
- Morris, D.G.; Musat, M.; Czirjak, S.; Hanzely, Z.; Lillington, D.M.; Korbonits, M.; Grossman, A.B. Differential gene expression in pituitary adenomas by oligonucleotide array analysis. Eur. J. Endocrinol. 2005, 153, 143–151. [Google Scholar] [CrossRef] [PubMed] [Green Version]
- Michaelis, K.A.; Knox, A.J.; Xu, M.; Kiseljak-Vassiliades, K.; Edwards, M.G.; Geraci, M.; Kleinschmidt-DeMasters, B.K.; Lillehei, K.O.; Wierman, M.E. Identification of growth arrest and DNA-damage-inducible gene beta (GADD45beta) as a novel tumor suppressor in pituitary gonadotrope tumors. Endocrinology 2011, 152, 3603–3613. [Google Scholar] [CrossRef] [PubMed]
- Tong, Y.; Zheng, Y.; Zhou, J.; Oyesiku, N.M.; Koeffler, H.P.; Melmed, S. Genomic characterization of human and rat prolactinomas. Endocrinology 2012, 153, 3679–3691. [Google Scholar] [CrossRef] [PubMed]
- Yu, S.Y.; Hong, L.C.; Feng, J.; Wu, Y.T.; Zhang, Y.Z. Integrative proteomics and transcriptomics identify novel invasive-related biomarkers of non-functioning pituitary adenomas. Tumour Biol. 2016, 37, 8923–8930. [Google Scholar] [CrossRef]
- Maudsley, S.; Devanarayan, V.; Martin, B.; Geerts, H.; Brain Health Modeling, I. Intelligent and effective informatic deconvolution of “big data” and its future impact on the quantitative nature of neurodegenerative disease therapy. Alzheimers Dement. 2018, 14, 961–975. [Google Scholar] [CrossRef]
- Date, Y.; Kikuchi, J. Application of a deep neural network to metabolomics studies and its performance in determining important variables. Anal. Chem. 2018, 90, 1805–1810. [Google Scholar] [CrossRef] [PubMed]
- Song, L.; Zhuang, P.; Lin, M.; Kang, M.; Liu, H.; Zhang, Y.; Yang, Z.; Chen, Y.; Zhang, Y. Urine metabonomics reveals early biomarkers in diabetic cognitive dysfunction. J. Proteome Res. 2017, 16, 3180–3189. [Google Scholar] [CrossRef]
- Zhou, Z.; Shen, X.; Tu, J.; Zhu, Z.J. Large-scale prediction of collision cross-section values for metabolites in ion mobility-mass spectrometry. Anal. Chem. 2016, 88, 11084–11091. [Google Scholar] [CrossRef]
- Hart, C.D.; Vignoli, A.; Tenori, L.; Uy, G.L.; Van To, T.; Adebamowo, C.; Hossain, S.M.; Biganzoli, L.; Risi, E.; Love, R.R.; et al. Serum metabolomic profiles identify er-positive early breast cancer patients at increased risk of disease recurrence in a multicenter population. Clin. Cancer Res. 2017, 23, 1422–1431. [Google Scholar] [CrossRef]
- Yu, C.Y.; Li, X.X.; Yang, H.; Li, Y.H.; Xue, W.W.; Chen, Y.Z.; Tao, L.; Zhu, F. Assessing the performances of protein function prediction algorithms from the perspectives of identification accuracy and false discovery rate. Int. J. Mol. Sci. 2018, 19, 183. [Google Scholar] [CrossRef]
- Hou, W.; Meng, X.; Zhao, A.; Zhao, W.; Pan, J.; Tang, J.; Huang, Y.; Li, H.; Jia, W.; Liu, F.; et al. Development of multimarker diagnostic models from metabolomics analysis for gestational diabetes mellitus (gdm). Mol. Cell. Proteom. 2018, 17, 431–441. [Google Scholar] [CrossRef] [PubMed]
- Alonso, A.; Julia, A.; Vinaixa, M.; Domenech, E.; Fernandez-Nebro, A.; Canete, J.D.; Ferrandiz, C.; Tornero, J.; Gisbert, J.P.; Nos, P.; et al. Urine metabolome profiling of immune-mediated inflammatory diseases. BMC Med. 2016, 14, 133. [Google Scholar] [CrossRef] [PubMed]
- Wu, F.; Chi, L.; Ru, H.; Parvez, F.; Slavkovich, V.; Eunus, M.; Ahmed, A.; Islam, T.; Rakibuz-Zaman, M.; Hasan, R.; et al. Arsenic exposure from drinking water and urinary metabolomics: Associations and long-term reproducibility in bangladesh adults. Environ. Health Perspect. 2018, 126, 017005. [Google Scholar] [CrossRef] [PubMed]
- Valikangas, T.; Suomi, T.; Elo, L.L. A systematic evaluation of normalization methods in quantitative label-free proteomics. Brief. Bioinform. 2018, 19, 1–11. [Google Scholar] [CrossRef] [PubMed]
- Wang, C.; Gong, B.; Bushel, P.R.; Thierry-Mieg, J.; Thierry-Mieg, D.; Xu, J.; Fang, H.; Hong, H.; Shen, J.; Su, Z.; et al. The concordance between rna-seq and microarray data depends on chemical treatment and transcript abundance. Nat. Biotechnol. 2014, 32, 926–932. [Google Scholar] [CrossRef] [PubMed]
- Jameson, J.L.; Klibanski, A.; Black, P.M.; Zervas, N.T.; Lindell, C.M.; Hsu, D.W.; Ridgway, E.C.; Habener, J.F. Glycoprotein hormone genes are expressed in clinically nonfunctioning pituitary adenomas. J. Clin. Investig. 1987, 80, 1472–1478. [Google Scholar] [CrossRef] [PubMed]
- Leung, B.; Iisma, T.P.; Leung, K.C.; Hort, Y.J.; Turner, J.; Sheehy, J.P.; Ho, K.K. Galanin in human pituitary adenomas: Frequency and clinical significance. Clin. Endocrinol. 2002, 56, 397–403. [Google Scholar] [CrossRef]
- La Rosa, S.; Vigetti, D.; Placidi, C.; Finzi, G.; Uccella, S.; Clerici, M.; Bartolini, B.; Carnevali, I.; Losa, M.; Capella, C. Localization of carboxyl ester lipase in human pituitary gland and pituitary adenomas. J. Histochem. Cytochem. 2010, 58, 881–889. [Google Scholar] [CrossRef]
- Zebracka-Gala, J.; Rudnik, A.; Hasse-Lazar, K.; Larysz, D.; Jarzab, M.; Krajewska, J.; Bazowski, P.; Jarzab, B. Molecular classification of pituitary adenomas: In search for criteria useful for high-throughput studies. Endokrynol. Pol. 2016, 67, 148–156. [Google Scholar]
- Woloschak, M.; Roberts, J.L.; Post, K. C-myc, c-fos, and c-myb gene expression in human pituitary adenomas. J. Clin. Endocrinol. Metab. 1994, 79, 253–257. [Google Scholar]
- Jiang, Z.; Gui, S.; Zhang, Y. Analysis of differential gene expression by bead-based fiber-optic array in nonfunctioning pituitary adenomas. Horm. Metab. Res. 2011, 43, 325–330. [Google Scholar] [CrossRef] [PubMed]
- Tohti, M.; Li, J.; Tang, C.; Wen, G.; Abdujilil, A.; Yizim, P.; Ma, C. Serum agr2 as a useful biomarker for pituitary adenomas. Clin. Neurol. Neurosurg. 2017, 154, 19–22. [Google Scholar] [CrossRef] [PubMed]
- Zhou, X.; Gomez-Smith, M.; Qin, Z.; Duquette, P.M.; Cardenas-Blanco, A.; Rai, P.S.; Harper, M.E.; Tsai, E.C.; Anisman, H.; Chen, H.H. Ablation of lmo4 in glutamatergic neurons impairs leptin control of fat metabolism. Cell. Mol. Life Sci. 2012, 69, 819–828. [Google Scholar] [CrossRef] [PubMed]
- Marzec, M.; Zhang, Q.; Goradia, A.; Raghunath, P.N.; Liu, X.; Paessler, M.; Wang, H.Y.; Wysocka, M.; Cheng, M.; Ruggeri, B.A.; et al. Oncogenic kinase npm/alk induces through stat3 expression of immunosuppressive protein cd274 (pd-l1, b7-h1). Proc. Natl. Acad. Sci. USA 2008, 105, 20852–20857. [Google Scholar] [CrossRef] [PubMed]
- Barrett, T.; Wilhite, S.E.; Ledoux, P.; Evangelista, C.; Kim, I.F.; Tomashevsky, M.; Marshall, K.A.; Phillippy, K.H.; Sherman, P.M.; Holko, M.; et al. Ncbi geo: Archive for functional genomics data sets—Update. Nucleic Acids Res. 2013, 41, D991–D995. [Google Scholar] [CrossRef] [PubMed]
- Tippmann, S. Programming tools: Adventures with r. Nature 2015, 517, 109–110. [Google Scholar] [CrossRef] [PubMed]
- Lazar, C.; Meganck, S.; Taminau, J.; Steenhoff, D.; Coletta, A.; Molter, C.; Weiss-Solis, D.Y.; Duque, R.; Bersini, H.; Nowe, A. Batch effect removal methods for microarray gene expression data integration: A survey. Brief. Bioinform. 2013, 14, 469–490. [Google Scholar] [CrossRef] [PubMed]
- Fu, J.; Tang, J.; Wang, Y.; Cui, X.; Yang, Q.; Hong, J.; Li, X.; Li, S.; Chen, Y.; Xue, W.; et al. Discovery of the consistently well-performed analysis chain for swath-ms based pharmacoproteomic quantification. Front. Pharmacol. 2018, 9, 681. [Google Scholar] [CrossRef]
- Tang, J.; Fu, J.; Wang, Y.; Li, B.; Li, Y.H.; Yang, Q.; Cui, X.; Hong, J.; Li, X.; Chen, Y.Z.; et al. Anpela: Analysis and performance-assessment of the label-free quantification workflow for metaproteomic studies. Brief. Bioinform. 2019. [Google Scholar] [CrossRef]
- Smyth, G.K. Linear models and empirical bayes methods for assessing differential expression in microarray experiments. Stat. Appl. Genet. Mol. Biol. 2004, 3, 3. [Google Scholar] [CrossRef]
- Ritchie, M.E.; Phipson, B.; Wu, D.; Hu, Y.; Law, C.W.; Shi, W.; Smyth, G.K. Limma powers differential expression analyses for rna-sequencing and microarray studies. Nucleic Acids Res. 2015, 43, e47. [Google Scholar] [CrossRef]
- Grames, M.S.; Dayton, R.D.; Jackson, K.L.; Richard, A.D.; Lu, X.; Klein, R.L. Cre-dependent aav vectors for highly targeted expression of disease-related proteins and neurodegeneration in the substantia nigra. FASEB J. 2018, 32, 4420–4427. [Google Scholar] [CrossRef] [PubMed]
- Subramanian, A.; Tamayo, P.; Mootha, V.K.; Mukherjee, S.; Ebert, B.L.; Gillette, M.A.; Paulovich, A.; Pomeroy, S.L.; Golub, T.R.; Lander, E.S.; et al. Gene set enrichment analysis: A knowledge-based approach for interpreting genome-wide expression profiles. Proc. Natl. Acad. Sci. USA 2005, 102, 15545–15550. [Google Scholar] [CrossRef] [PubMed] [Green Version]
- Pochet, N.; De Smet, F.; Suykens, J.A.; De Moor, B.L. Systematic benchmarking of microarray data classification: Assessing the role of non-linearity and dimensionality reduction. Bioinformatics 2004, 20, 3185–3195. [Google Scholar] [CrossRef] [PubMed]
- Li, B.; Tang, J.; Yang, Q.; Cui, X.; Li, S.; Chen, S.; Cao, Q.; Xue, W.; Chen, N.; Zhu, F. Performance evaluation and online realization of data-driven normalization methods used in lc/ms based untargeted metabolomics analysis. Sci. Rep. 2016, 6, 38881. [Google Scholar] [CrossRef]
- Murakami, Y.; Spriggs, R.V.; Nakamura, H.; Jones, S. Piranha: A server for the computational prediction of rna-binding residues in protein sequences. Nucleic Acids Res. 2010, 38, W412–W416. [Google Scholar] [CrossRef]
- Simurina, M.; de Haan, N.; Vuckovic, F.; Kennedy, N.A.; Stambuk, J.; Falck, D.; Trbojevic-Akmacic, I.; Clerc, F.; Razdorov, G.; Khon, A.; et al. Glycosylation of immunoglobulin g associates with clinical features of inflammatory bowel diseases. Gastroenterology 2018, 154, 1320–1333. [Google Scholar] [CrossRef]
- Li, B.; Tang, J.; Yang, Q.; Li, S.; Cui, X.; Li, Y.; Chen, Y.; Xue, W.; Li, X.; Zhu, F. Noreva: Normalization and evaluation of ms-based metabolomics data. Nucleic Acids Res. 2017, 45, W162–W170. [Google Scholar] [CrossRef]
- Brindisi, M.; Senger, J.; Cavella, C.; Grillo, A.; Chemi, G.; Gemma, S.; Cucinella, D.M.; Lamponi, S.; Sarno, F.; Iside, C.; et al. Novel spiroindoline hdac inhibitors: Synthesis, molecular modelling and biological studies. Eur. J. Med. Chem. 2018, 157, 127–138. [Google Scholar] [CrossRef]
- Szklarczyk, D.; Morris, J.H.; Cook, H.; Kuhn, M.; Wyder, S.; Simonovic, M.; Santos, A.; Doncheva, N.T.; Roth, A.; Bork, P.; et al. The string database in 2017: Quality-controlled protein-protein association networks, made broadly accessible. Nucleic Acids Res. 2017, 45, D362–D368. [Google Scholar] [CrossRef]
- Shannon, P.; Markiel, A.; Ozier, O.; Baliga, N.S.; Wang, J.T.; Ramage, D.; Amin, N.; Schwikowski, B.; Ideker, T. Cytoscape: A software environment for integrated models of biomolecular interaction networks. Genome Res. 2003, 13, 2498–2504. [Google Scholar] [CrossRef] [PubMed]


| GEO ID | Samples PA:NP a | Description of the Collected Datasets for Studying on | Microarray Platform | Reference of the Studied Datasets |
|---|---|---|---|---|
| GSE2175 | 4:1 | GeneChip arrays of 1 healthy and 4 pituitary adenoma samples | HG-U133A | [61] |
| GSE22812 | 13:0 | Genomic hybridization arrays of 13 pituitary adenoma samples | GE Healthcare | [53] |
| GSE26966 | 14:9 | GeneChip arrays of 9 healthy and 14 pituitary adenoma samples | HG-U133_Plus_2 | [62] |
| GSE36314 | 4:3 | Genome arrays of 3 healthy and 4 pituitary adenoma samples | HG_U95Av2 | [63] |
| GSE4237 | 10:0 | Affymetrix oligo arrays of 10 pituitary adenoma samples | HG-U133_Plus_2 | [52] |
| GSE46311 | 16:0 | Affymetrix Human Gene arrays of 16 pituitary adenoma samples | HuGene-1_0-st | [51] |
| GSE51618 | 7:3 | Agilent arrays of 3 healthy and 7 pituitary adenoma samples | Agilent-hgug4112a | [64] |
| Datasets | TP a | FN a | TN a | FP a | ACC b | SEN b | SPE b | MCC b | AUC c |
|---|---|---|---|---|---|---|---|---|---|
| A: GSE51618 | 4 | 4 | 4 | 0 | 0.67 | 0.50 | 1.00 | 0.50 | 0.75 |
| B: GSE26966 | 5 | 3 | 3 | 1 | 0.67 | 0.63 | 0.75 | 0.35 | 0.72 |
| C: DDI Strategy | 7 | 1 | 4 | 0 | 0.92 | 0.88 | 1.00 | 0.84 | 0.97 |
| Dataset | A: GSE51618 | B: GSE26966 | C: DDI Strategy | |
|---|---|---|---|---|
| Overlap Median across 10 Samplings | 0.42 | 0.64 | 0.69 | |
| No. of DEGs Identified by the nth Sampling Dataset (n=) | 1 | 230 | 244 | 175 |
| 2 | 149 | 312 | 147 | |
| 3 | 179 | 332 | 140 | |
| 4 | 319 | 262 | 134 | |
| 5 | 284 | 328 | 132 | |
| 6 | 633 | 349 | 282 | |
| 7 | 361 | 278 | 171 | |
| 8 | 283 | 295 | 172 | |
| 9 | 377 | 243 | 223 | |
| 10 | 585 | 295 | 192 | |
| No. of DEGs Identified | 1310 | 370 | 410 | |
| No. (Percent) of DEGs Co-discovered by N Sampling Datasets | 10 | 56 (0.04) | 52 (0.14) | 71 (0.17) |
| ≥9 | 73 (0.06) | 63 (0.17) | 90 (0.22) | |
| ≥8 | 87 (0.07) | 75 (0.20) | 107 (0.26) | |
| ≥7 | 103 (0.08) | 87 (0.24) | 119 (0.29) | |
| ≥6 | 129 (0.10) | 104 (0.28) | 133 (0.32) | |
| No. | Entrez | Symbol | LogFC | p-Value | GES62966 | GSE51618 |
|---|---|---|---|---|---|---|
| 1 | 5443 | POMC | −3.85 | 2.79 × 10⁻¹⁸ | −8.00 | −7.09 |
| 2 | 7252 | TSHB | −3.26 | 6.65 × 10⁻¹⁶ | −5.96 | −8.07 |
| 3 | 51,083 | GAL | −2.69 | 4.22 × 10⁻²¹ | −5.10 | −8.03 |
| 4 | 1056 | CEL | −2.22 | 9.21× 10⁻¹⁰ | −5.73 | −2.23 |
| 5 | 3240 | HP | −2.21 | 1.06 × 10⁻⁹ | −4.10 | - |
| 6 | 3397 | ID1 | −2.08 | 3.85 × 10⁻¹⁶ | −3.10 | −3.84 |
| 7 | 5446 | PON3 | −2.00 | 2.01 × 10⁻⁷ | −3.46 | - |
| 8 | 5617 | PRL | −1.93 | 6.41 × 10⁻³ | −7.33 | - |
| 9 | 1410 | CRYAB | −1.88 | 1.31 × 10⁻¹² | −2.57 | - |
| 10 | 4885 | NPTX2 | −1.87 | 8.75 × 10⁻⁹ | −4.18 | - |
| 11 | 6161 | RPL32 | −1.83 | 1.05 × 10⁻² | - | - |
| 12 | 4821 | NKX2-2 | −1.82 | 3.36 × 10⁻⁷ | −6.26 | −0.83 |
| 13 | 2697 | GJA1 | −1.64 | 5.94 × 10⁻⁸ | −3.73 | - |
| 14 | 5105 | PCK1 | −1.61 | 1.74 × 10⁻⁵ | −6.43 | −2.38 |
| 15 | 6235 | RPS29 | −1.54 | 1.18 × 10⁻² | - | - |
| 16 | 12 | SERPINA3 | −1.48 | 4.62 × 10⁻⁴ | −4.15 | - |
| 17 | 2353 | FOS | −1.45 | 2.85 × 10⁻⁷ | −3.80 | - |
| 18 | 5366 | PMAIP1 | −1.44 | 4.11 × 10⁻⁷ | −3.85 | −2.39 |
| 19 | 6146 | RPL22 | −1.42 | 2.91 × 10⁻² | - | - |
| 20 | 10,551 | AGR2 | −1.41 | 5.24 × 10⁻⁵ | −2.47 | −3.75 |
| 21 | 22,999 | RIMS1 | 0.78 | 3.05 × 10⁻² | - | - |
| 22 | 8573 | CASK | 0.78 | 5.10 × 10⁻⁶ | 0.85 | 1.48 |
| 23 | 5795 | PTPRJ | 0.78 | 1.01 × 10⁻² | - | - |
| 24 | 1272 | CNTN1 | 0.80 | 7.88 × 10⁻⁵ | 1.70 | - |
| 25 | 22,858 | ICK | 0.81 | 1.53 × 10⁻² | - | - |
| 26 | 23,390 | ZDHHC17 | 0.81 | 4.94 × 10⁻³ | - | - |
| 27 | 51,755 | CDK12 | 0.81 | 3.45 × 10⁻² | - | - |
| 28 | 4684 | NCAM1 | 0.81 | 5.74 × 10⁻³ | 0.74 | - |
| 29 | 4863 | NPAT | 0.81 | 1.07 × 10⁻² | - | - |
| 30 | 57,125 | PLXDC1 | 0.82 | 6.76 × 10⁻⁴ | 0.76 | - |
| 31 | 9472 | AKAP6 | 0.83 | 1.75 × 10⁻³ | 0.86 | - |
| 32 | 23,101 | MCF2L2 | 0.83 | 2.02 × 10⁻² | - | - |
| 33 | 868 | CBLB | 0.84 | 3.45 × 10⁻² | - | - |
| 34 | 8490 | RGS5 | 0.84 | 3.25 × 10⁻⁴ | 1.41 | - |
| 35 | 1006 | CDH8 | 0.85 | 2.18 × 10⁻³ | 2.94 | - |
| 36 | 55,752 | SEPT11 | 0.87 | 1.13 × 10⁻² | - | - |
| 37 | 5149 | PDE6H | 0.89 | 1.67 × 10⁻² | 1.36 | - |
| 38 | 1641 | DCX | 0.91 | 6.76 × 10⁻⁴ | 3.14 | - |
| 39 | 29,899 | GPSM2 | 0.91 | 1.73 × 10⁻² | 1.04 | - |
| 40 | 23,305 | ACSL6 | 0.91 | 3.51 × 10⁻³ | 0.90 | - |
| Entrez ID | Gene Symbol | LogFC | p-Value | Representative GO Biological Processes and Molecular Functions |
|---|---|---|---|---|
| 51,083 | GAL | −2.69 | 4.22 × 10⁻²¹ | negative regulation of immune system process; regulation of immune process |
| 3240 | HP | −2.21 | 1.06 × 10⁻⁹ | immune system process |
| 2353 | FOS | −1.45 | 2.85 × 10⁻⁷ | positive regulation of immune system process; regulation of immune response |
| 5366 | PMAIP1 | −1.44 | 4.11 × 10⁻⁷ | immune effector process; immune system process |
| 6146 | RPL22 | −1.42 | 2.91 × 10⁻² | immune system development; immune system process |
| 7060 | THBS4 | −1.33 | 7.19 × 10⁻⁶ | positive regulation of immune system process; regulation of immune process |
| 10,410 | IFITM3 | −1.28 | 8.39 × 10⁻⁶ | innate immune response; immune effector process; immune system process |
| 2488 | FSHB | −1.28 | 5.95 × 10⁻³ | regulation of immune system process |
| 133 | ADM | −1.28 | 4.34 × 10⁻⁷ | humoral immune response; immune response; immune system process |
| 2719 | GPC3 | −1.22 | 3.09 × 10⁻⁹ | immune system development; immune system process |
| 7852 | CXCR4 | −1.22 | 3.24 × 10⁻⁹ | immune system process |
| 347 | APOD | −1.21 | 2.78 × 10⁻⁵ | negative regulation of immune system process; regulation of immune process |
| 9353 | SLIT2 | −1.21 | 6.81 × 10⁻¹⁰ | negative regulation of immune system process; regulation of immune process |
| 8324 | FZD7 | −1.21 | 1.74 × 10⁻⁸ | immune system development; immune system process |
| 2197 | FAU | −1.19 | 1.35 × 10⁻² | humoral immune response; innate immune response in mucosa |
| 4783 | NFIL3 | −1.14 | 8.44 × 10⁻⁵ | immune response; immune system process |
| 6218 | RPS17 | −1.13 | 2.70 × 10⁻² | immune system process |
| 5950 | RBP4 | −1.08 | 1.79 × 10⁻² | positive regulation of production of molecular mediator of immune response |
| 5919 | RARRES2 | −1.06 | 4.34 × 10⁻⁷ | positive regulation of immune system process; regulation of immune process |
| 3669 | ISG20 | −1.03 | 8.23 × 10⁻⁸ | innate immune response; immune effector process; immune system process |
| 3059 | HCLS1 | −1.02 | 6.70 × 10⁻⁵ | positive regulation of immune system process; regulation of immune process |
| 6279 | S100A8 | −1.01 | 1.99 × 10⁻³ | innate immune response; immune response; immune system process |
| 710 | SERPING1 | −1.00 | 6.70 × 10⁻⁶ | adaptive immune response; b cell mediated immunity; humoral immune response |
| 716 | C1S | −1.00 | 5.90 × 10⁻⁴ | adaptive/innate immune response; Leukocyte mediated immunity |
| 7056 | THBD | −1.00 | 2.52 × 10⁻⁶ | immune system process |
| 715 | C1R | −0.98 | 3.31 × 10⁻⁶ | adaptive/innate immune response; positive regulation of immune system process |
| 1672 | DEFB1 | −0.92 | 1.44 × 10⁻⁴ | humoral immune response; innate immune response in mucosa |
| 2669 | GEM | −0.89 | 2.22 × 10⁻⁴ | immune response; immune system process |
| 1958 | EGR1 | −0.86 | 2.45 × 10⁻³ | innate immune response; immune response; immune system development |
| 6662 | SOX9 | −0.86 | 3.43 × 10⁻⁴ | negative regulation of immune system process; regulation of immune process |
| 3426 | CFI | −0.84 | 6.05 × 10⁻¹⁰ | adaptive immune response; leukocyte/lymphocyte mediated immunity |
| 7412 | VCAM1 | −0.84 | 6.87 × 10⁻⁷ | innate immune response; positive regulation of immune system process |
| 1366 | CLDN7 | −0.84 | 4.27 × 10⁻³ | regulation of immune effector process; regulation of immune system process |
| 3726 | JUNB | −0.84 | 2.43 × 10⁻⁵ | immune system development; immune system process |
| 9796 | PHYHIP | −0.82 | 2.78 × 10⁻³ | regulation of immune effector process; regulation of immune system process |
| 7049 | TGFBR3 | −0.81 | 3.58 × 10⁻³ | immune response; immune system development; immune system process |
| 3958 | LGALS3 | −0.80 | 4.63 × 10⁻² | innate immune response; negative regulation of immune effector process |
| 3485 | IGFBP2 | −0.78 | 1.23 × 10⁻³ | positive regulation of immune system process; regulation of immune process |
| 1051 | CEBPB | −0.75 | 2.38 × 10⁻³ | negative regulation of immune system process; regulation of immune process |
| 302 | ANXA2 | −0.72 | 1.55 × 10⁻² | immune system development; immune system process |
| 5806 | PTX3 | −0.72 | 2.46 × 10⁻³ | innate immune response; immune effector process; immune system process |
| 3320 | HSP90AA1 | −0.71 | 1.90 × 10⁻² | positive regulation of immune system process; activation of immune response |
| 7704 | ZBTB16 | −0.69 | 3.81 × 10⁻² | negative/positive regulation of immune system process |
| 8543 | LMO4 | −0.69 | 1.35 × 10⁻² | immune system development; immune system process |
| 6223 | RPS19 | −0.69 | 1.25 × 10⁻² | regulation of innate immune response; immune system development |
| 4057 | LTF | −0.68 | 3.41 × 10⁻² | humoral immune response; innate immune response in mucosa |
| 100,133,941 | CD24 | −0.65 | 5.68 × 10⁻³ | positive regulation of immune system process; immune system process |
| 684 | BST2 | −0.64 | 8.65 × 10⁻³ | humoral/innate immune response; negative regulation of immune response |
| 23,543 | RBFOX2 | 0.59 | 5.42 × 10⁻³ | regulation of immune system process |
| 5747 | PTK2 | 0.59 | 1.12 × 10⁻² | activation of immune response; positive regulation of immune response |
| 2047 | EPHB1 | 0.60 | 8.01 × 10⁻³ | immune system process; immunological synapse formation |
| 27,242 | TNFRSF21 | 0.60 | 4.66 × 10⁻³ | adaptive/humoral immune response; negative regulation of immune process |
| 8754 | ADAM9 | 0.61 | 1.68 × 10⁻² | immune system process |
| 3175 | ONECUT1 | 0.64 | 1.36 × 10⁻³ | immune system development; immune system process |
| 54,861 | SNRK | 0.64 | 1.61 × 10⁻² | immune system development; immune system process |
| 801 | CALM1 | 0.64 | 6.76 × 10⁻⁴ | immune response regulating cell surface receptor signaling pathway |
| 51,752 | ERAP1 | 0.65 | 2.84 × 10⁻² | regulation of innate immune response; regulation of immune system process |
| 7456 | WIPF1 | 0.65 | 1.59 × 10⁻³ | activation of immune response; immune system process |
| 4982 | TNFRSF11B | 0.66 | 3.67 × 10⁻² | immune response; immune system process |
| 6362 | CCL18 | 0.67 | 3.72 × 10⁻² | innate immune response; immune response; immune system process |
| 30,849 | PIK3R4 | 0.67 | 2.02 × 10⁻² | activation/positive regulation of innate immune response |
| 5594 | MAPK1 | 0.71 | 2.18 × 10⁻³ | regulation of immune system process; immune system development |
| 8563 | THOC5 | 0.71 | 7.07 × 10⁻³ | immune system development; immune system process |
| 8473 | OGT | 0.72 | 1.16 × 10⁻² | positive regulation of immune system process |
| 5795 | PTPRJ | 0.78 | 1.01 × 10⁻² | negative/positive regulation of immune system process |
| 4684 | NCAM1 | 0.81 | 5.74 × 10⁻³ | innate immune response; immune response; immune system process |
© 2019 by the authors. Licensee MDPI, Basel, Switzerland. This article is an open access article distributed under the terms and conditions of the Creative Commons Attribution (CC BY) license (http://creativecommons.org/licenses/by/4.0/).
Share and Cite
Yang, Q.; Wang, Y.; Zhang, S.; Tang, J.; Li, F.; Yin, J.; Li, Y.; Fu, J.; Li, B.; Luo, Y.; et al. Biomarker Discovery for Immunotherapy of Pituitary Adenomas: Enhanced Robustness and Prediction Ability by Modern Computational Tools. Int. J. Mol. Sci. 2019, 20, 151. https://doi.org/10.3390/ijms20010151
Yang Q, Wang Y, Zhang S, Tang J, Li F, Yin J, Li Y, Fu J, Li B, Luo Y, et al. Biomarker Discovery for Immunotherapy of Pituitary Adenomas: Enhanced Robustness and Prediction Ability by Modern Computational Tools. International Journal of Molecular Sciences. 2019; 20(1):151. https://doi.org/10.3390/ijms20010151
Chicago/Turabian StyleYang, Qingxia, Yunxia Wang, Song Zhang, Jing Tang, Fengcheng Li, Jiayi Yin, Yi Li, Jianbo Fu, Bo Li, Yongchao Luo, and et al. 2019. "Biomarker Discovery for Immunotherapy of Pituitary Adenomas: Enhanced Robustness and Prediction Ability by Modern Computational Tools" International Journal of Molecular Sciences 20, no. 1: 151. https://doi.org/10.3390/ijms20010151