2.1. Characterization of the Substrate Surfaces
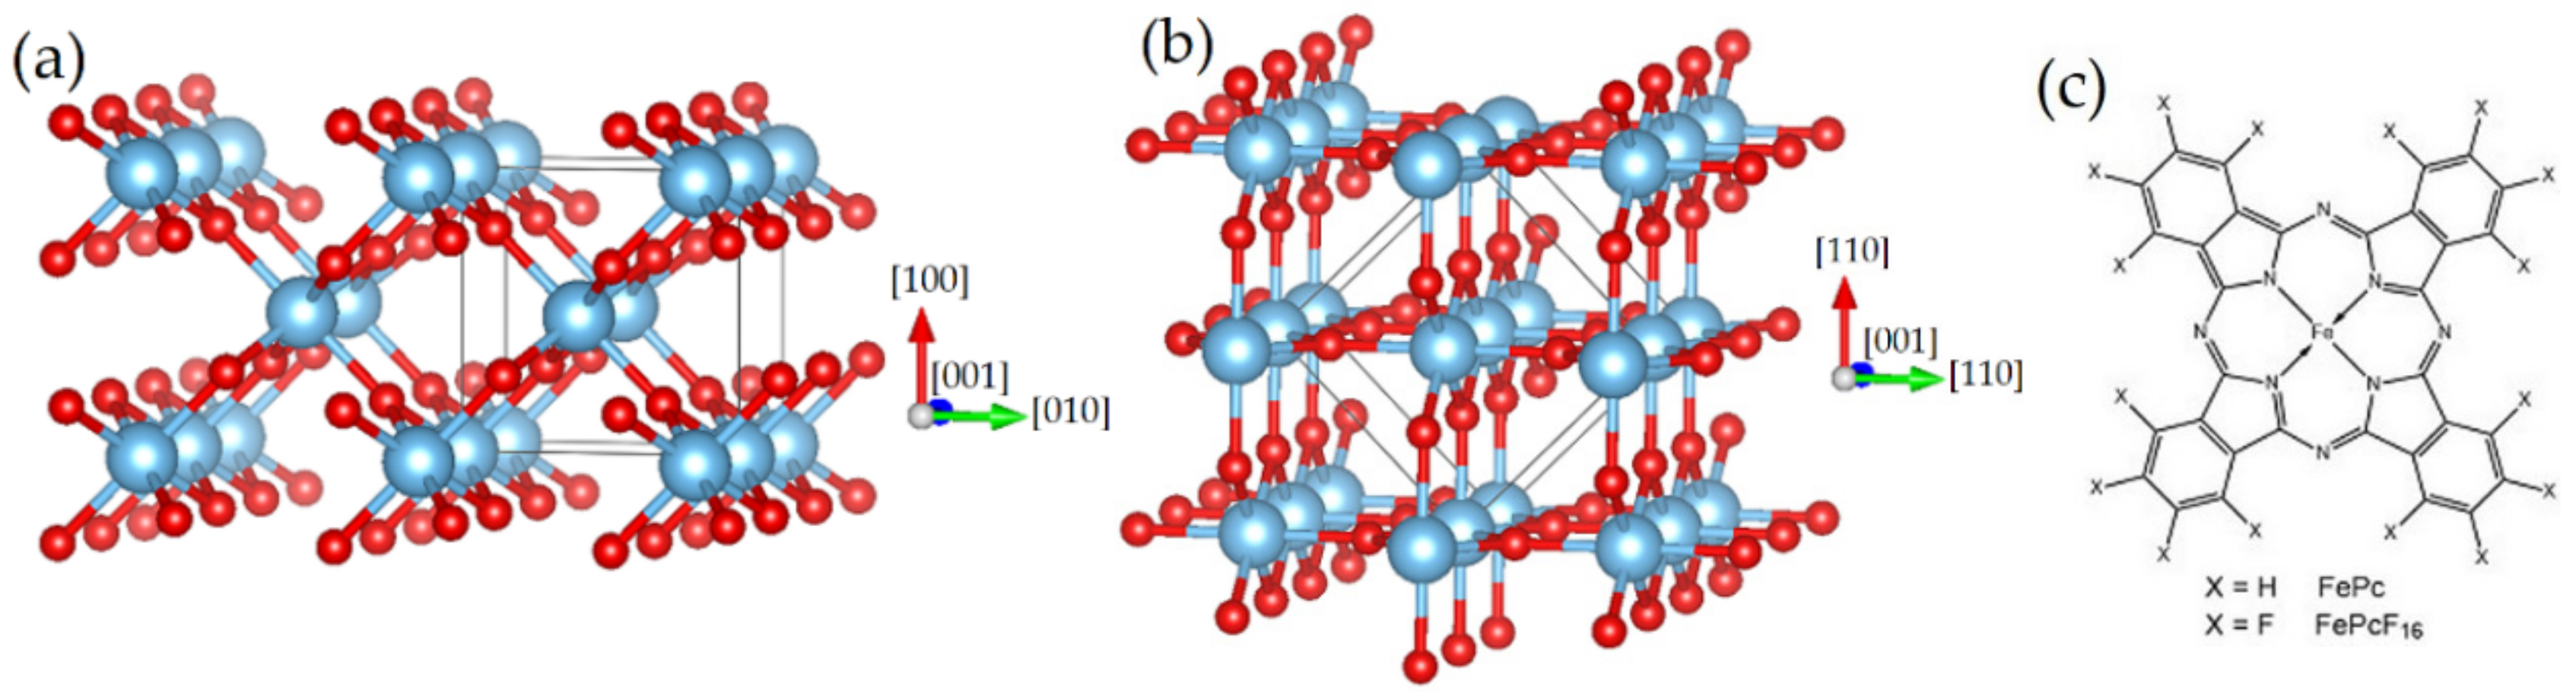
The detailed atomic composition and arrangement of the substrate surface may affect the reactivity significantly, and thus, differences between rutile TiO2(100) and rutile TiO2(110) might be expected. On the other hand, the crystal preparation may influence the number of defects, and thus the reactivity of the substrate surface. Thus, the surface structure has to be accounted for, including surface roughness and reconstructions. Further, distinguishing between the number of defects present on the surface and in the bulk of the crystal is important.
After checking the cleanliness of the rutile crystal following the sputtering/annealing cycles, we quantified the number of total defects via Ti 2p photoemission spectra. The defect chemistry of TiO
2 is very complex, among other induced defects include oxygen vacancies and (metal) ions in the interstitial sites [
18]. Reduced titanium ion species, such as Ti
3+, are visible in Ti 2p photoemission spectra as an additional peak or shoulder at the low binding energy side.
In
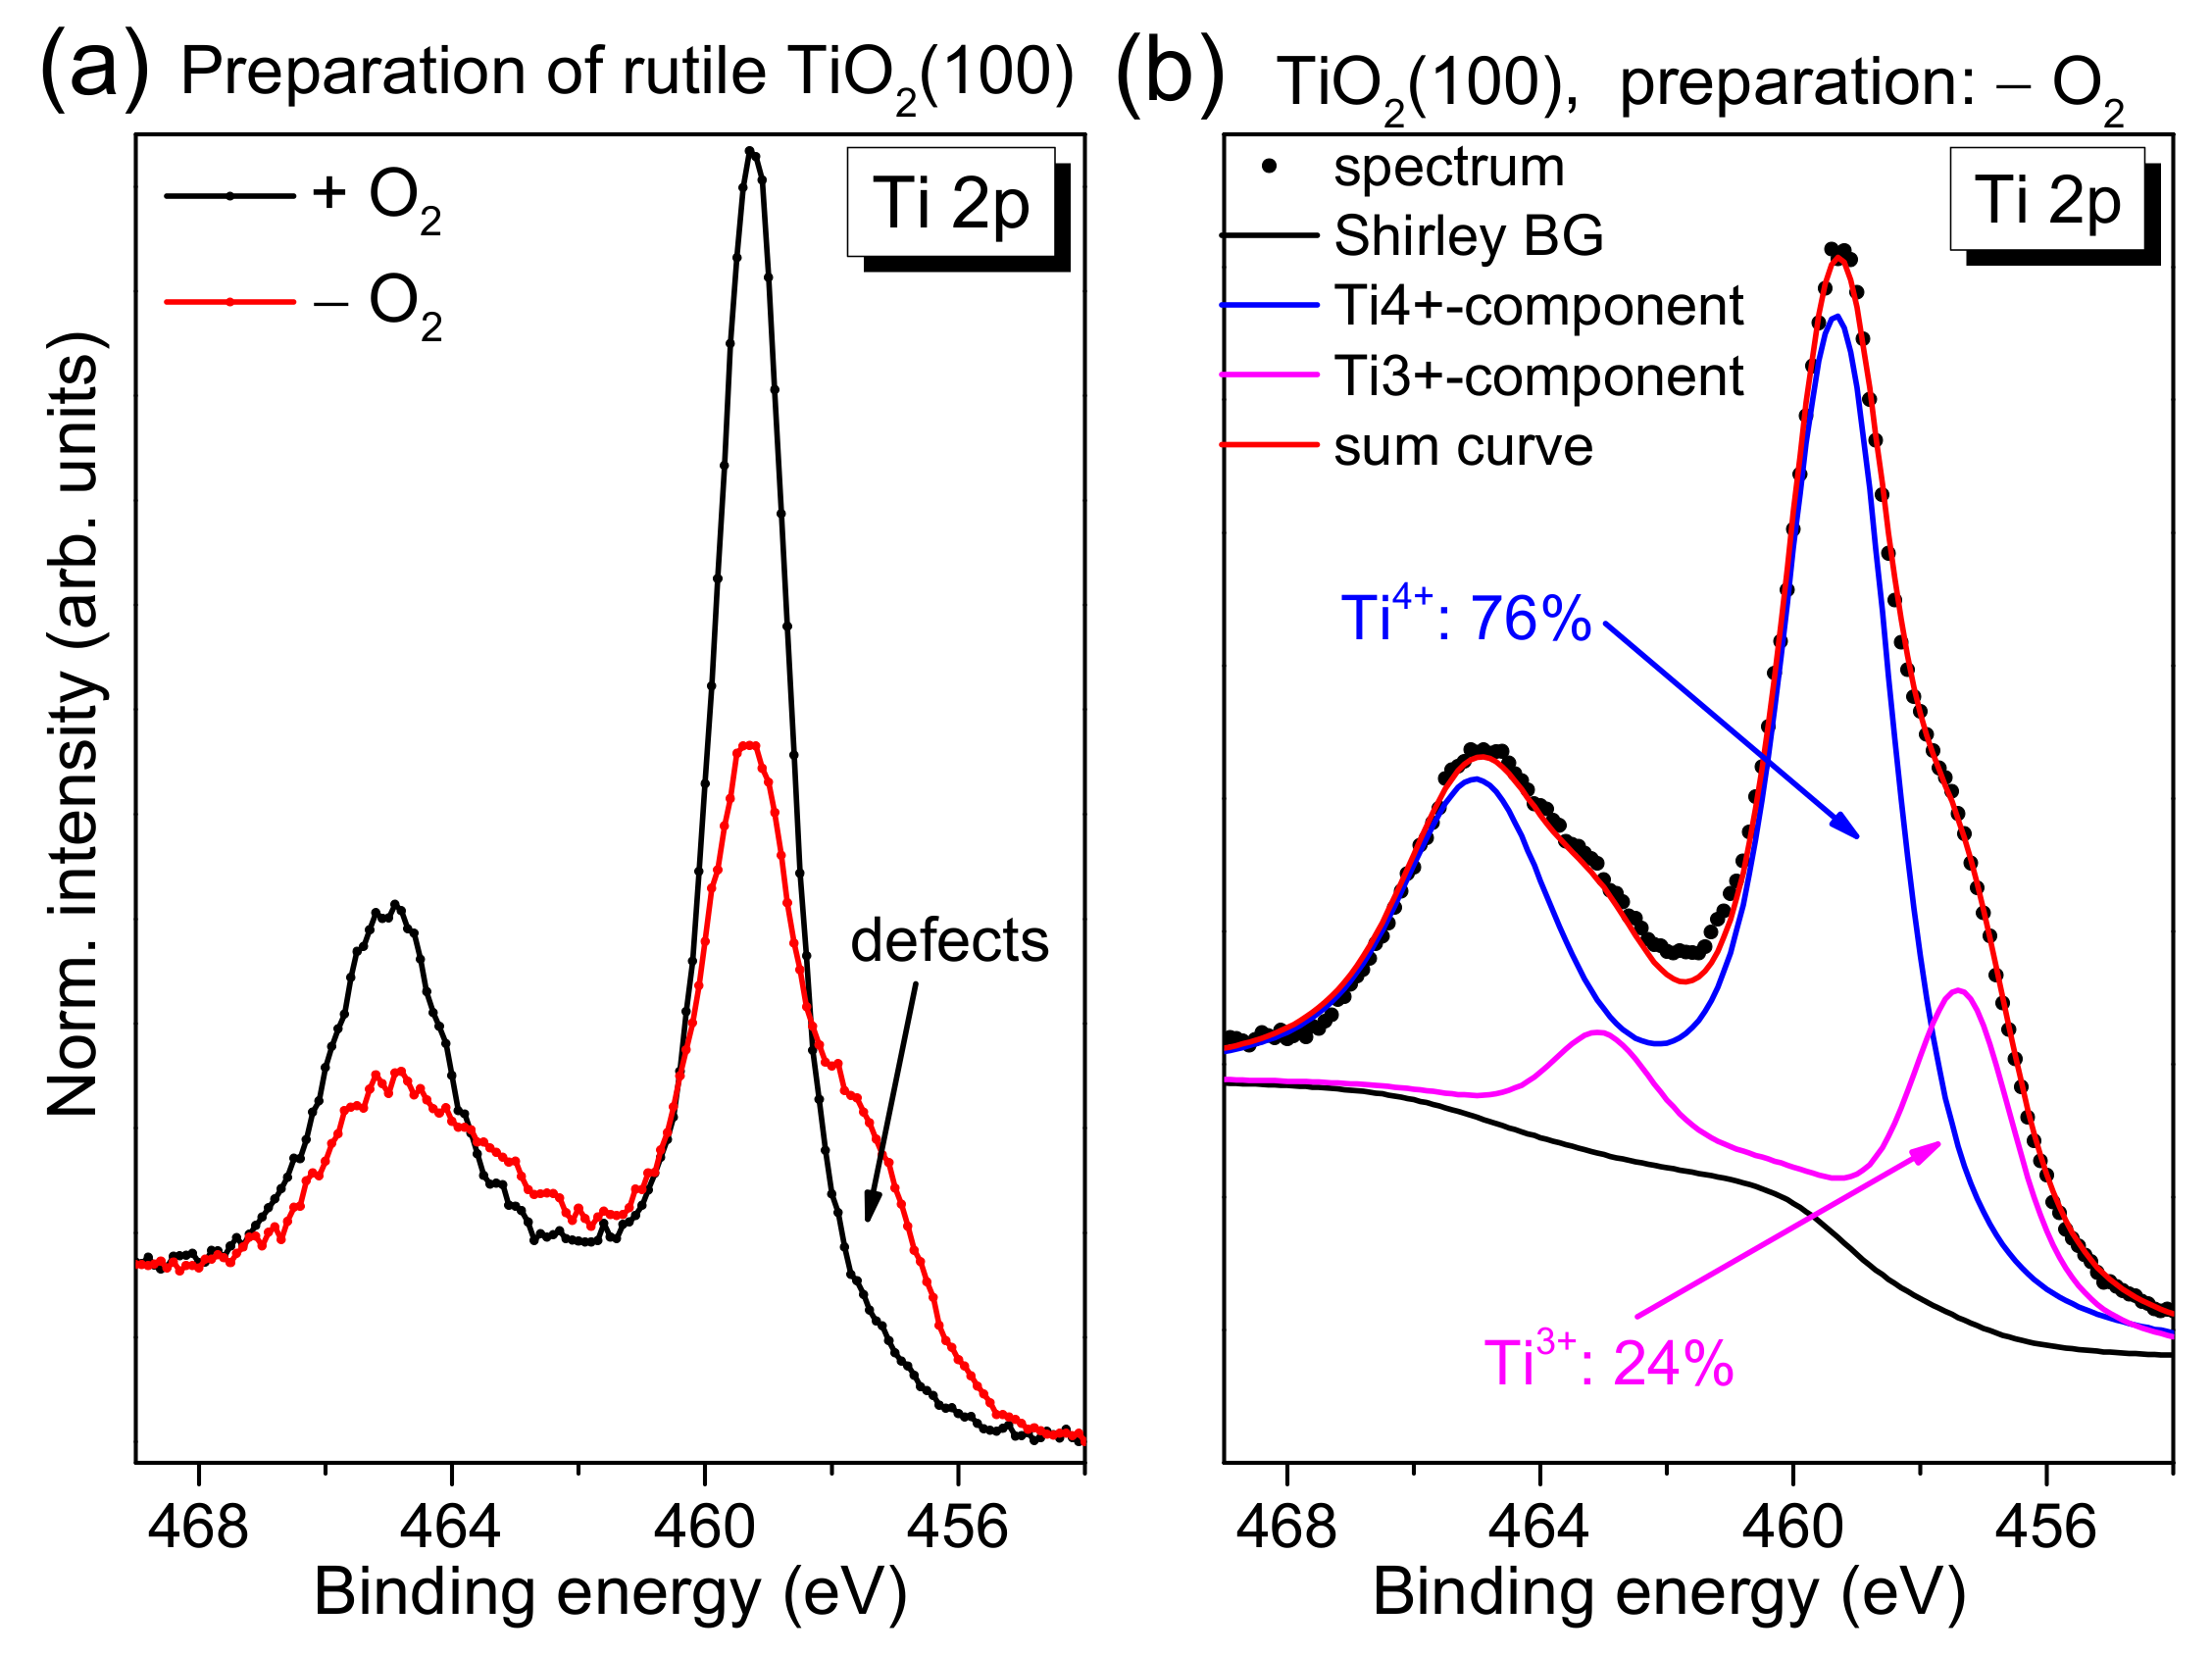
Figure 2a, we compare typical Ti 2p spectra of rutile TiO
2(100) for two different preparation methods. Conventional Al Kα radiation (hν = 1486.6 eV) was used for excitation. The preparation was performed in the presence and absence of an oxygen partial pressure during the last annealing step, denoted “+O
2” and “−O
2”, respectively. Clearly visible, the shoulder at the low binding energy side is significantly increased for the preparation in UHV, indicating a higher number of defects. Generally, due to a preferred removal of oxygen during the sputtering process, defects are created. Diffusion of oxygen from the bulk to the surface of the substrate during the annealing steps can—to some extent—compensate surface defects, while leaving defects in the bulk. As a consequence, non-stoichiometric surfaces are obtained (TiO
x, x < 2). The presence of such point defects can be formally assigned to the presence of a Ti
3+ oxidation state in the Ti 2p photoemission spectrum [
1]. The nature of such defect states is explained by the removal of negative oxygen ions from the lattice as neutral oxygen atoms, leaving electrons in the conduction band [
1]. Apparently, the annealing in oxygen partial pressure during all preparation steps supports the filling of oxygen vacancies by adsorption and diffusion, enabling the preparation of an almost defect-free substrate (cf.
Figure 2a, black curve). We note that the longer the substrate is exposed to sputtering/annealing cycles, the more defects are created in the bulk of the material, which cannot be removed completely by exposure to an oxygen partial pressure during the annealing steps due to the limited oxygen diffusion to the surface. In this case, also the exposure to oxygen during the last annealing step is not sufficient to remove all defects. This results in a remaining intensity in Ti 2p spectra at the position of defects, although the quality of the substrate surface is almost independent of the previous treatment of the crystals, as indicated by complementary methods (see below).
In order to estimate the number of total defects, peak fits to the Ti 2p spectra were performed as exemplarily, shown for defect-rich rutile TiO
2(100) in
Figure 2b. The spectrum can be essentially described by two doublets. The main Ti 2p
3/2 component is found at 459.4 ± 0.1 eV and can be ascribed to Ti
4+ species, in good agreement with the literature [
1,
19,
20]. The second doublet at about 1.9 ± 0.1 eV lower binding energy arises essentially from a Ti
3+ species [
1,
19,
20,
21,
22]. Contributions from Ti
2+, expected at 3.0–3.4 eV lower binding energy with respect to the main line [
19,
21,
22], are generally weak and were neglected in the description of the Ti 2p spectra (except for defect-rich, hexagonal rutile TiO
2(100), discussed in
Section 2.5). Detailed fitting parameters can be found as a
Supporting Information (Table S1). As clearly visible from
Figure 2b, the absence of O
2 during the last annealing step can result in a high number of defects, visible as a high Ti
3+ intensity (24% in
Figure 2). Such defects may act as reactive sites on the crystal surface. However, for the reactivity of the substrate surface, it is essential whether the defects are preferably located in the bulk of the material or at the surface. Energy-dependent photoemission studies (i.e., changing the surface sensitivity) for substrates with a higher Ti
3+ intensity in Ti 2p spectra indicate that the majority of the defects is found in the bulk of the rutile substrate (
Figure S1 and Tables S2 and S3).
Additionally, LEED was performed routinely to characterize the substrate surfaces, giving further hints for the presence of defects in the topmost layer(s); examples are shown in
Figure S2. The rutile TiO
2(100) and TiO
2(110) surfaces prepared under oxygen show typical 1 × 1 LEED patterns. Samples prepared without oxygen in the last annealing step exhibit a brighter background and additional streaks, indicating the presence of smaller well-ordered domains at the surface and/or the presence of additional ordered structures on the substrate surface.
Complementary, a detailed analysis of Ti-L edge XAS spectra is useful for the characterization of the substrate surface. The method allows, in particular, the determination of polymorphs and the degree of order of the investigated substrates within the information depth of about 10 nm [
23,
24]. In
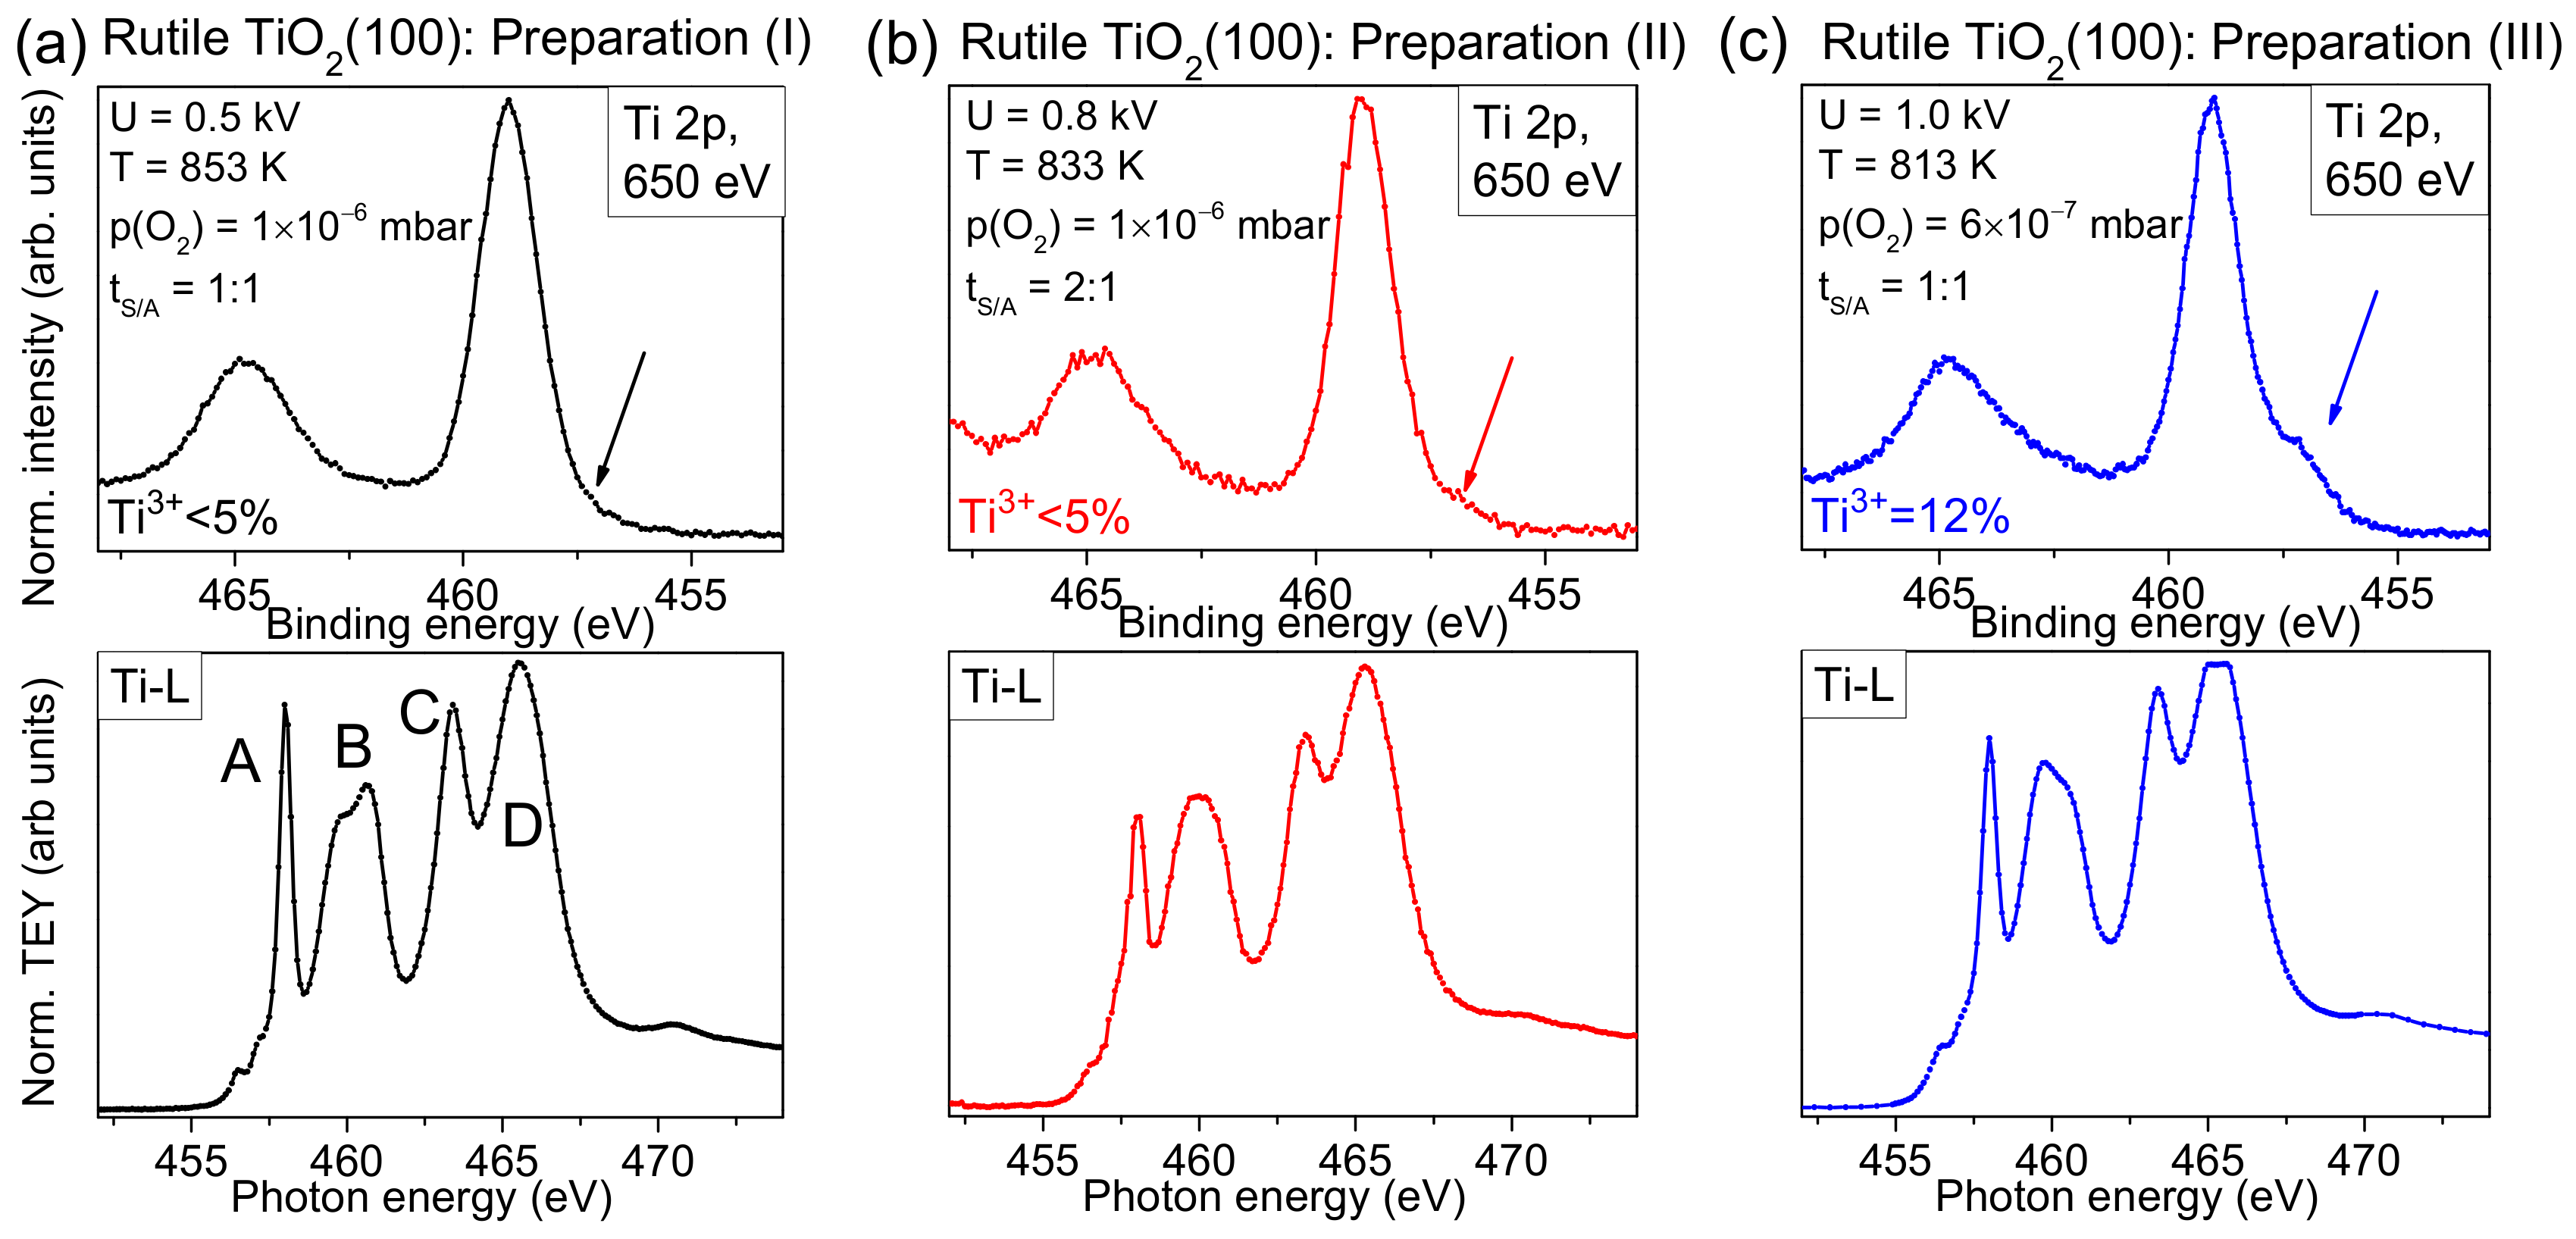
Figure 3, we compare Ti-L edge XAS spectra with surface sensitive Ti 2p XPS spectra (hυ = 650 eV) for three different preparations, marked with roman numerals (I), (II), and (III). The parameters for preparation (I) were used for experiments described in
Section 2.2,
Section 2.3 and
Section 2.4. For preparations (II) and (III), the sputtering voltage was successively increased and the annealing temperature decreased. Thus, a larger structural damage by ion bombardment and a lower ability to recover the crystal structure due to the lower oxygen partial pressure, and a reduced thermal diffusion of oxygen ions in the crystal might be expected. Detailed preparation parameters are given in
Figure 3.
The XPS spectrum in
Figure 3a exhibits only weak intensity in the energy region of Ti
3+ (see arrow), and the corresponding XAS spectrum reproduces well the expected features of a rutile single crystal: Features A–D are clearly resolved. The nature of transitions and the shape of different Ti-L XAS spectra is described in detail in [
23,
24]. Although for preparation (II) only very weak intensity in the Ti
3+ region of the XPS spectrum is detected in
Figure 3b, the Ti-L edge XAS spectrum seems to be more sensitive and indicates imperfections in the crystal: The relative intensity of feature A is decreased and the fine structure of feature B is lost. In addition, all features are broadened. Finally, for preparation (III), prepared using the highest sputter voltage and lowest annealing temperature, a noticeable intensity in the energy range of Ti
3+ is already visible in the surface sensitive Ti2p spectrum (see arrow in
Figure 3c). This indicates that the preparation conditions are not sufficient to saturate the defects at the surface, although the shape of some XAS features appear more similar to preparation (I) (
Figure 3a) than to preparation (II) (
Figure 3b). Thus, the examples in
Figure 3 indicate that minor changes of preparation conditions may result in very different surface structures, which might explain different interface properties between organic molecules and rutile reported in the literature (see below).
2.2. FePc on Rutile TiO2(100)
In the following, we discuss how the different preparations of substrate surfaces affect the interaction with organic molecules at the interface. First, we discuss FePc on rutile TiO
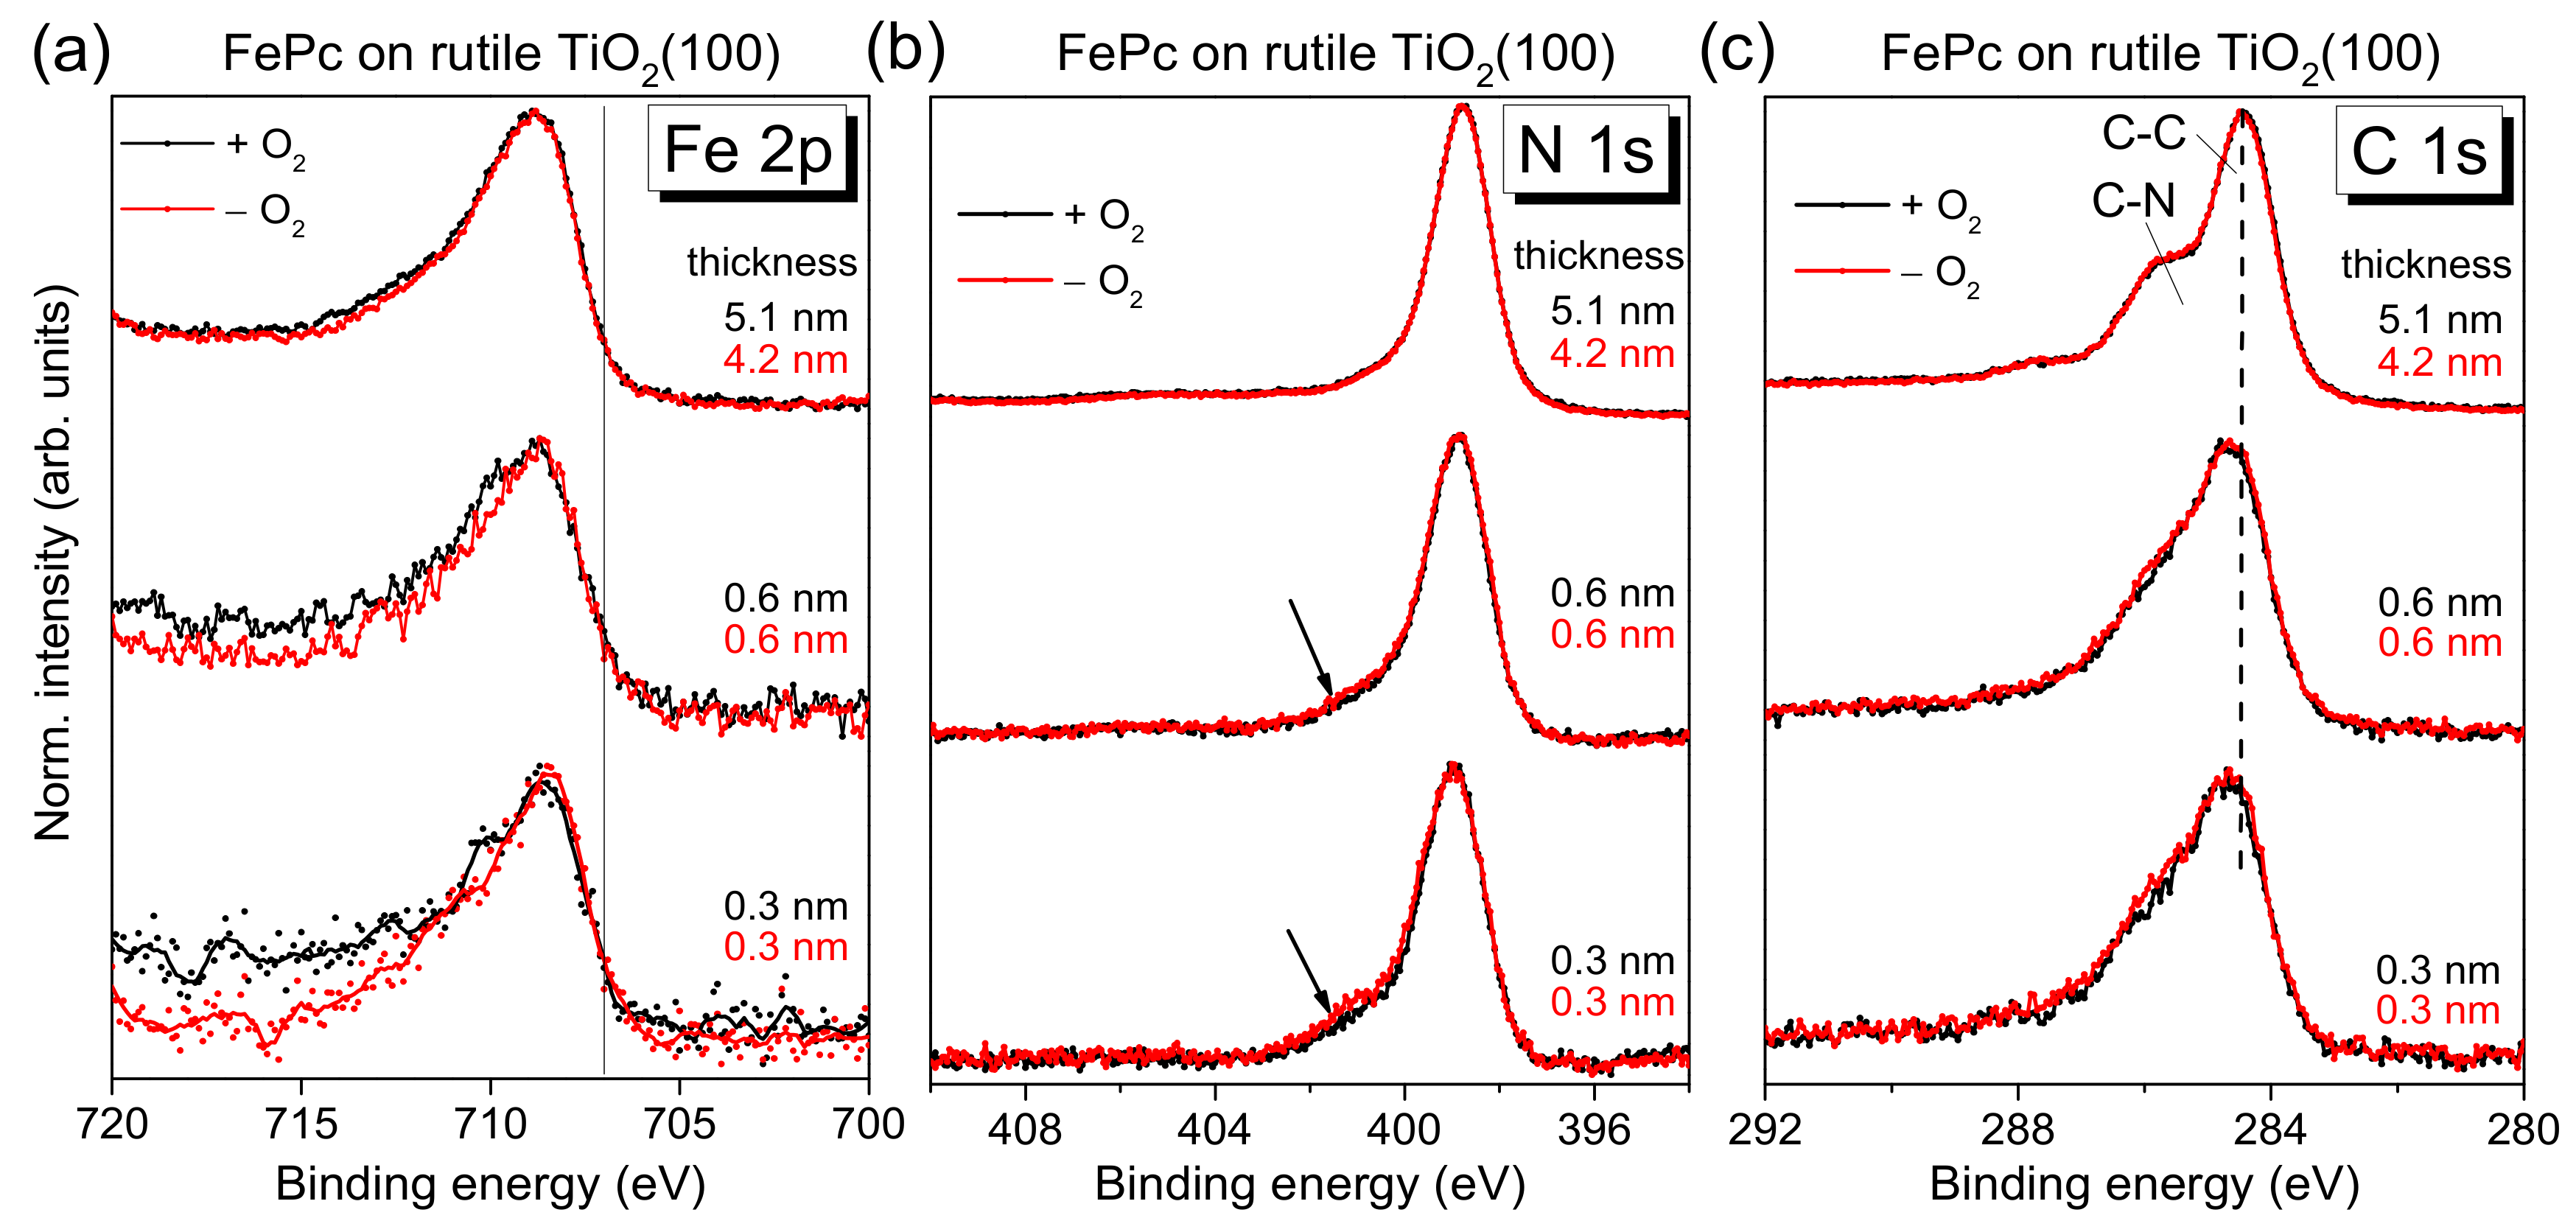
2(100). The corresponding XPS core-level spectra of the organic molecule are shown in
Figure 4 as a function of the film thickness. No significant change of both the peak position and the peak shape of substrate-related core-level peaks (O 1s and Ti 2p, not shown) was visible upon FePc deposition. Black and red curves in
Figure 4 correspond to FePc deposited on rutile TiO
2(100) prepared in the presence and absence of O
2 partial pressure during the last annealing step. The shapes of the spectra for the thickest films are typical for (iron) phthalocyanines and in excellent agreement to the literature [
25,
26,
27,
28,
29,
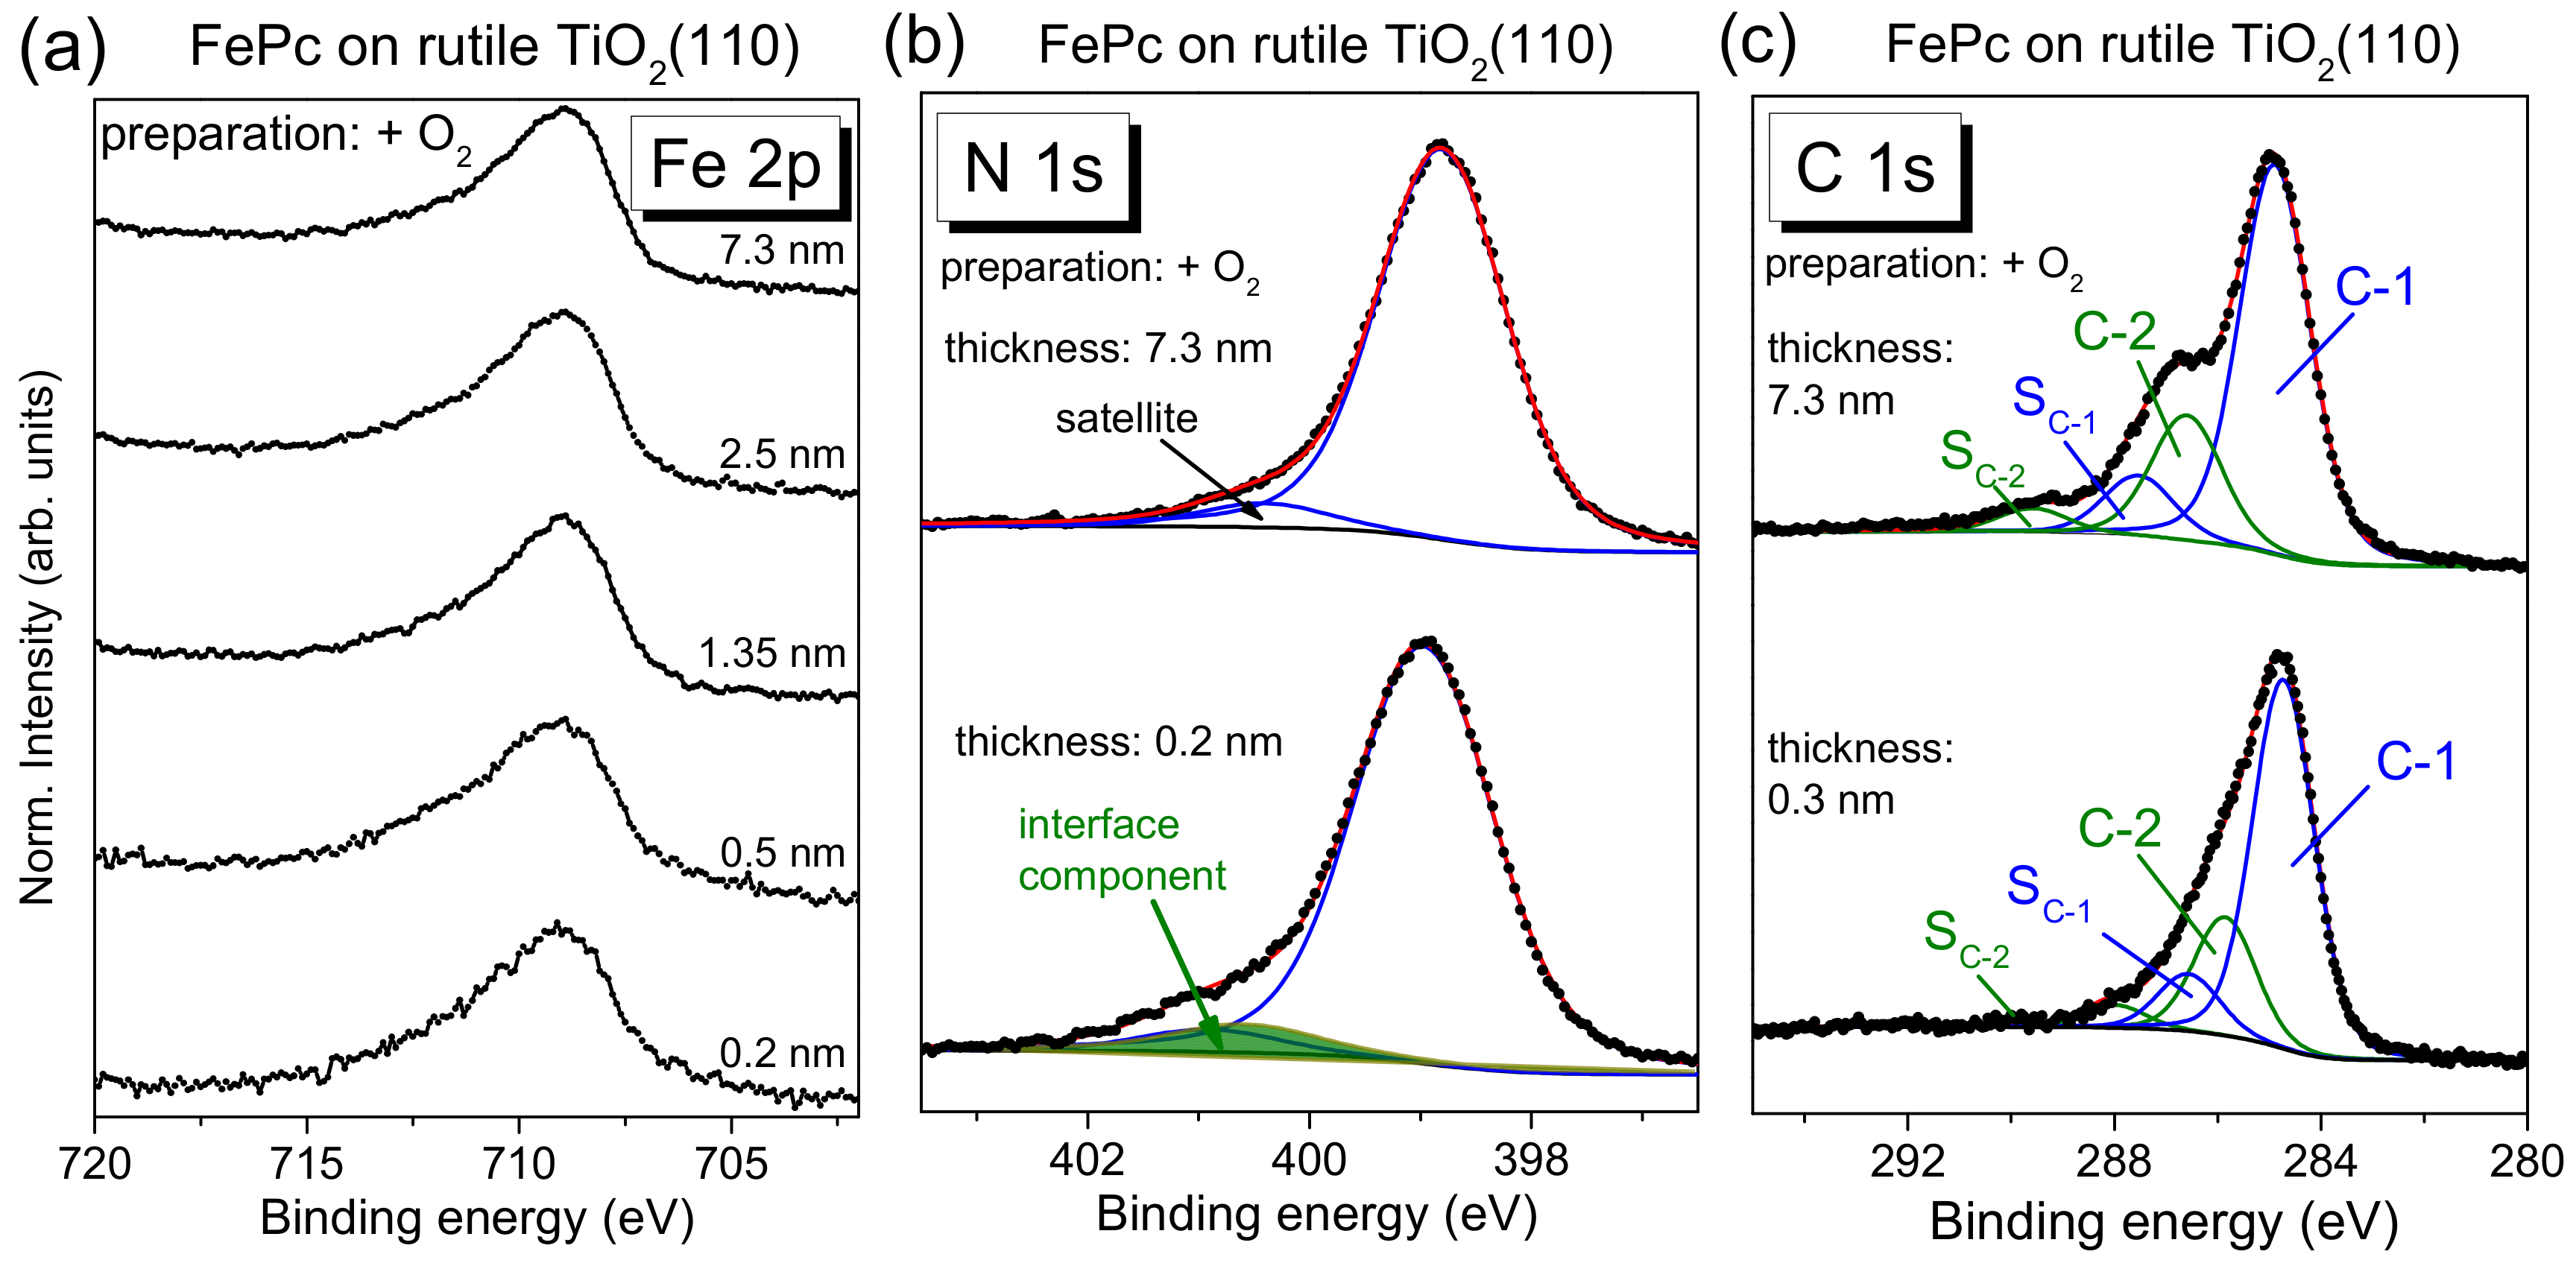
30]. The Fe 2p spectra show an intensity maximum at a binding energy (BE) of 708.8 eV and exhibit the typical multiplet structure for Fe in FePc (e.g., [
25,
26,
27]). The detailed shape of N 1s and C 1s spectra is described below more in detail based on the respective peak fits. Most important, the black and red curves in
Figure 4 are very similar for all core levels, implying that the presence of oxygen during the last annealing step does not affect distinctly the number of reactive defects at the substrate surface. In other words, the absence of oxygen in the last annealing step and the possible formation of surface defects can be obviously compensated, to a large extent, by diffusion of oxygen from deeper layers of the substrate.
On the other hand, the core-level spectra of
Figure 4 exhibit some thickness-dependent changes, which we discuss in turn below. First, the Fe 2p spectra appear slightly broadened for low coverages, but the complex multiplet structure complicates a more detailed analysis by a peak fitting routine. Therefore, we discuss the thickness dependence of the Fe 2p spectra in
Figure 4a later, together with the corresponding XAS data.
The N 1s core-level spectra for low coverages in
Figure 4b show clearly additional intensity at higher binding energies (see arrows) compared to the bulk-like references (the 4–5 nm thick films). In order to quantify this additional intensity, we performed peak fits to the data, shown in
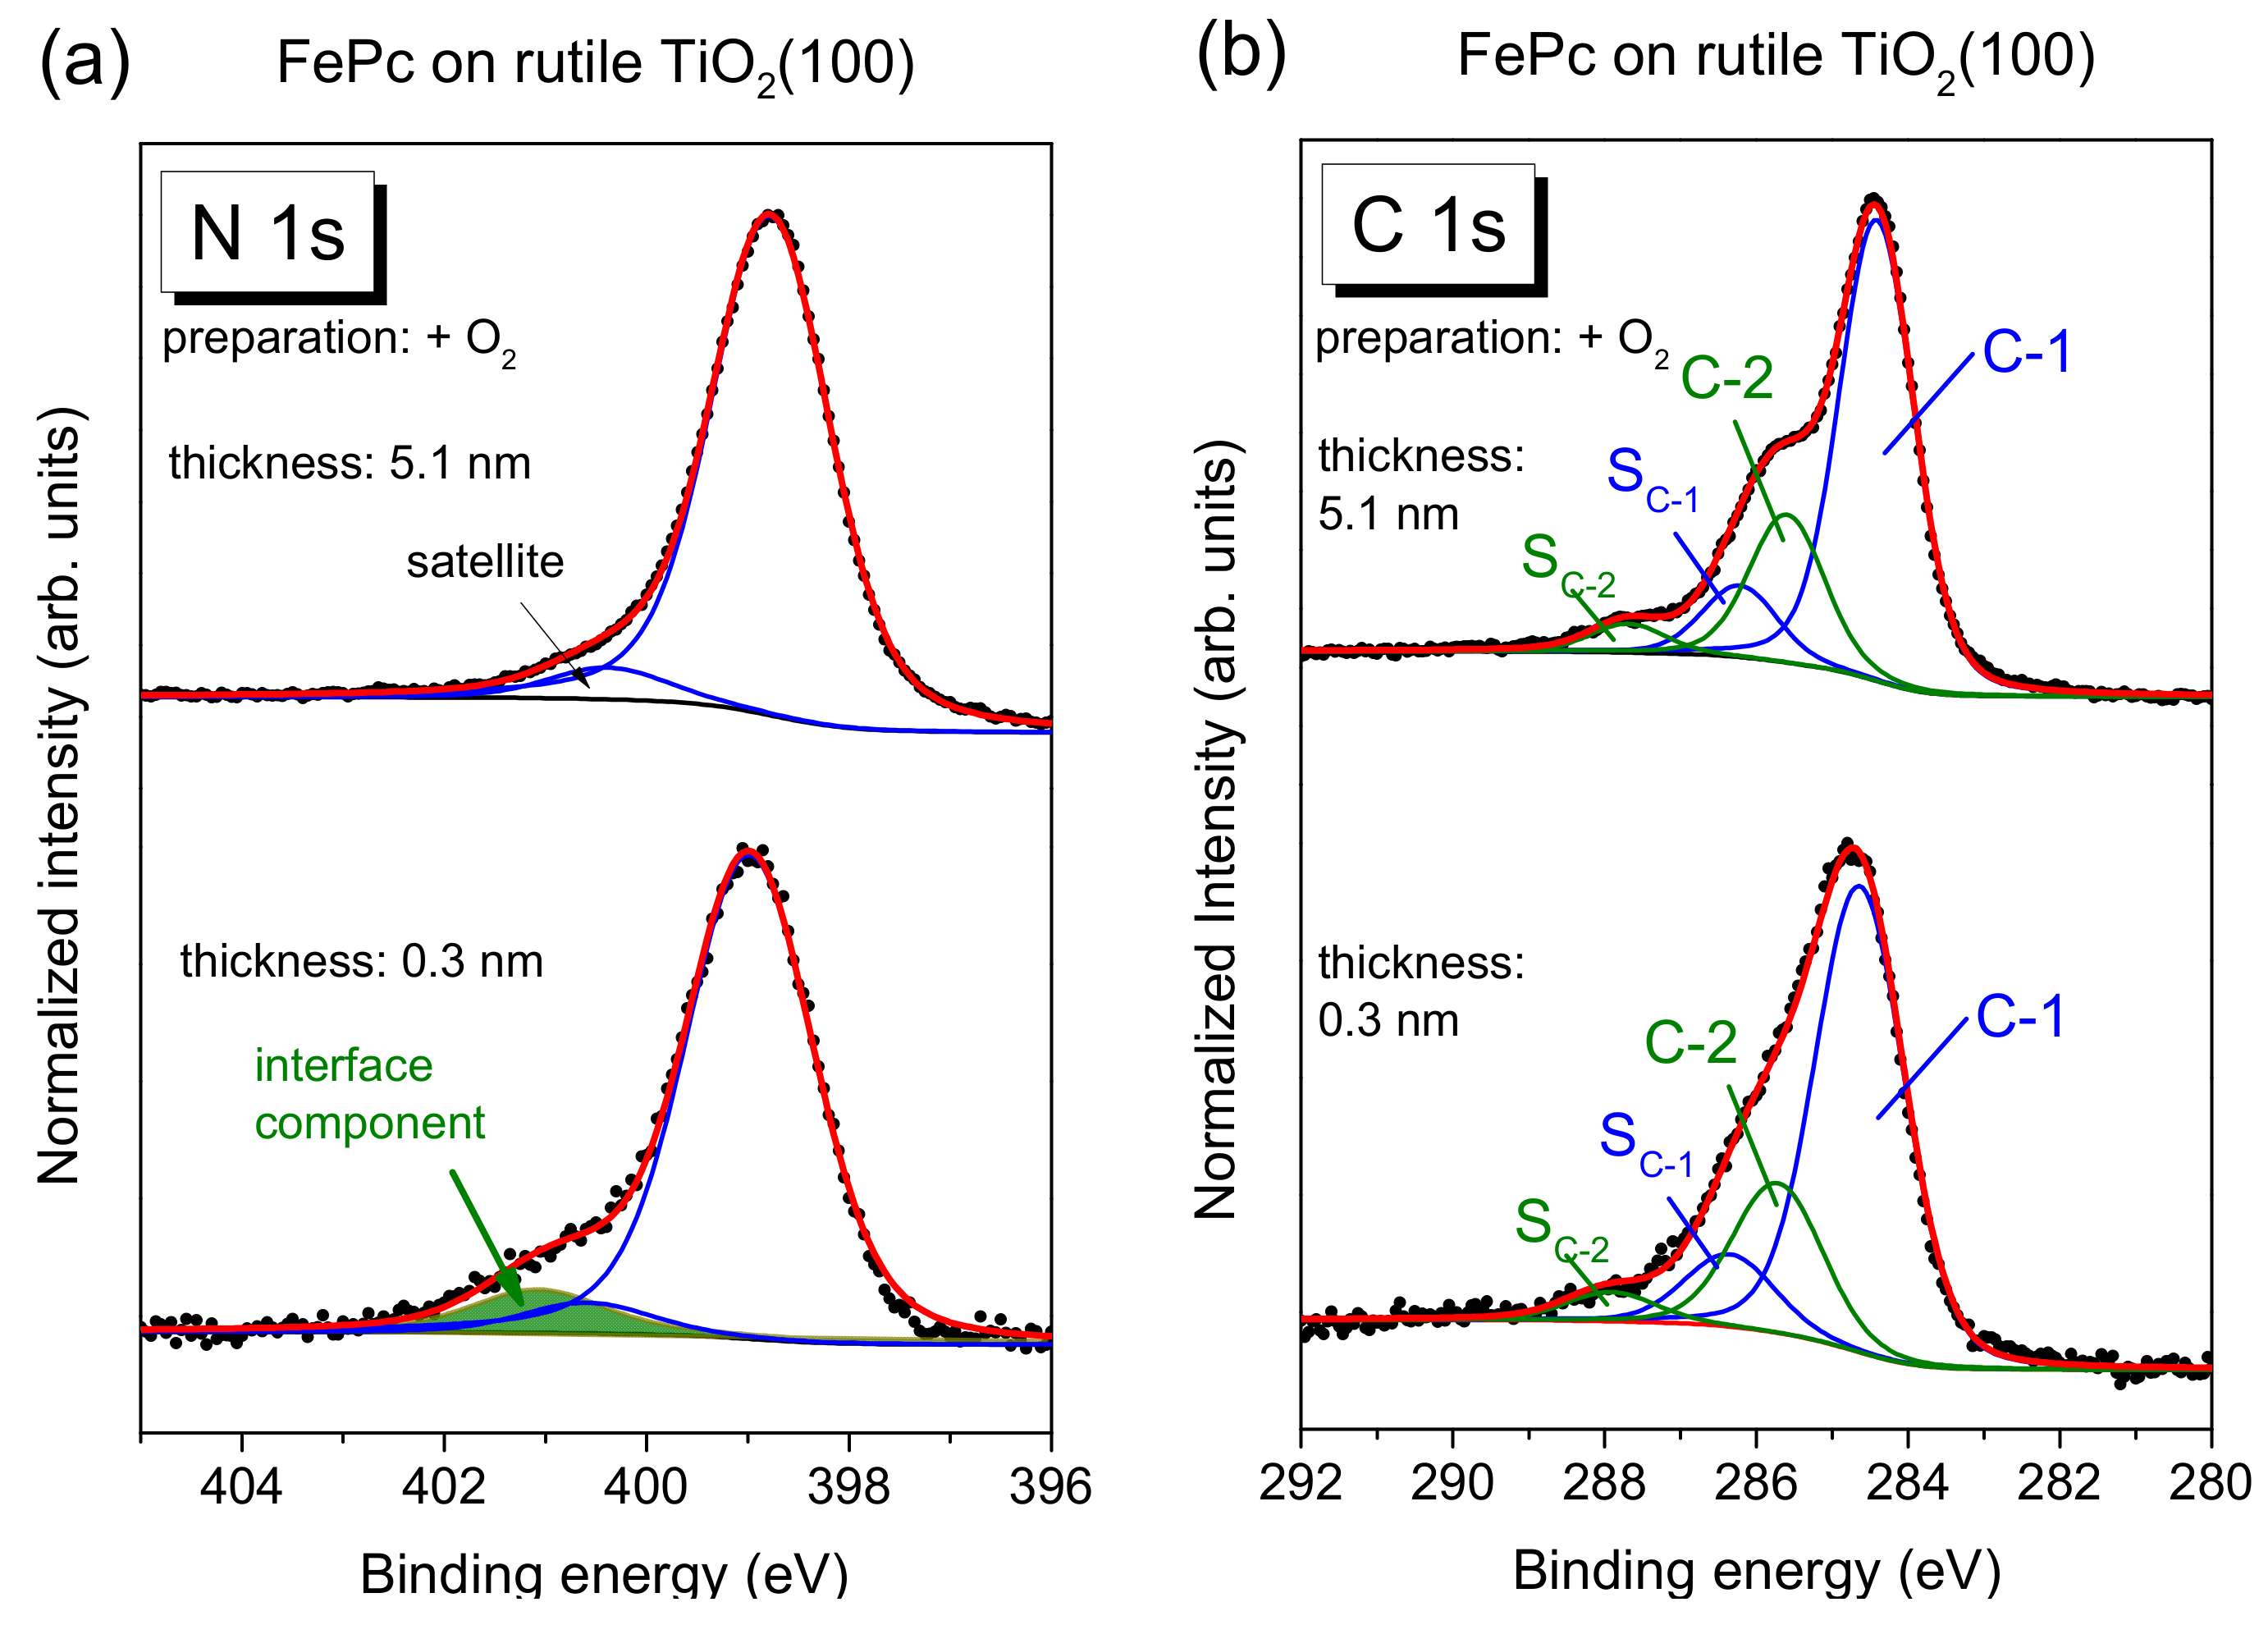
Figure 5a, exemplary for the rutile preparation in presence of oxygen during the last annealing step.
The main line of the N 1s spectrum contains contributions from two types of chemically inequivalent nitrogen atoms in the FePc molecule (cf.
Figure 1c), which cannot be resolved experimentally due to their small separation of about 0.3 eV [
26]. The main line is accompanied by weaker shake-up satellite features, the most intense satellite appears at about 1.7 eV higher binding energy (e.g., [
26,
28]). For the bulk-like, 5.1 nm thick FePc film on rutile TiO
2(100) prepared in the presence of oxygen during the last annealing step, we find the peak maximum of the main component at 398.8 eV and the satellite at BE = 400.4 eV. At the interface, the N 1s spectrum is shifted slightly by 0.2 eV towards higher binding energies, and the additional intensity can be described by a single peak at 2.05 eV higher binding energy with respect to the main peak. The relative intensity of the interface component is about 7%. In this fitting model, a change of the satellite intensity at the interface is neglected; a distinct suppression is, in particular, observed for organic molecules on metal surfaces [
11,
31,
32,
33]. This low relative intensity of the interface component may indicate that only few molecules at the interface become affected by an interaction involving the nitrogen atoms (e.g., molecules adsorbed at defect sites), and/or that a local interaction occurs involving particular nitrogen atoms of FePc.
The C 1s spectra of phthalocyanines can be described by components attributed to the aromatic carbon of the benzene rings (C-1), pyrrole carbon linked to nitrogen (C-2) and corresponding satellites (S
C-1 and S
C-2) [
29,
30]. For the FePc film of 5.1 nm in
Figure 5b, we obtained binding energies of 284.4 and 285.6 eV for C-1 and C-2, respectively. Detailed fitting parameters can be found in the
Supporting Material (Table S4). For the low coverage, the main peak is shifted to 0.2 eV higher binding energy, similar to N 1s. Many reasons might cause such small, rigid shifts of all core levels, among other band bending like effects due to induced density of interface states or a different screening of the photohole in the films of different thickness [
34,
35,
36]. Most important, for the description of the C 1s spectra, no additional component is needed at the interface. The spectrum can be described by a Gaussian broadening of all components (from 1.02 to 1.26 eV) and a decrease of the C-1 to C-2 distance from 1.2 to 1.1 eV. The distinct broadening of all spectra at lower film thickness may indicate different environments of the FePc molecules, such as different adsorption sites, whereas the decrease of the C-1 to C-2 distance might be caused by site-dependent screening [
37] or a different charge distribution within the FePc molecule. The detailed peak fit parameters are in the
Supplementary Materials (Table S4). In addition, we show as
Supplementary Materials peak fits for the rutile preparation in the absence of oxygen during the last annealing step (
Figure S3 and Table S5), indicating a similar behavior of FePc on both surfaces.
We note that stronger interactions between FePc and TiO
2 were reported in the literature [
11]. For a differently prepared FePc/rutile TiO
2(110) interface, the description of the 1–2 monolayer C 1s spectrum was only possible if separate contributions from the first and second layer were considered [
11]. In addition, a very strong interface peak at 400.4 eV was observed in the N 1s spectra, which even dominates the N 1s spectrum of the (sub-)monolayer [
11]. The shift of the C 1s spectrum of the first layer to 1.2 eV higher binding energy was interpreted as oxidation of the FePc at the interface as a consequence of a surface bond [
11]. Since such additional intensity at higher binding energy is not observed in the C 1s spectra of
Figure 4 and
Figure 5, the nature of the interaction of FePc on the studied rutile TiO
2(100) interface seems to be different in our case. The question arises if the surface orientation and/or the substrate preparation may be responsible for such differences—this is discussed in
Section 2.3 and
Section 2.4.
First, we look at the electronic structure of the nitrogen atoms in FePc at the interface to rutile TiO
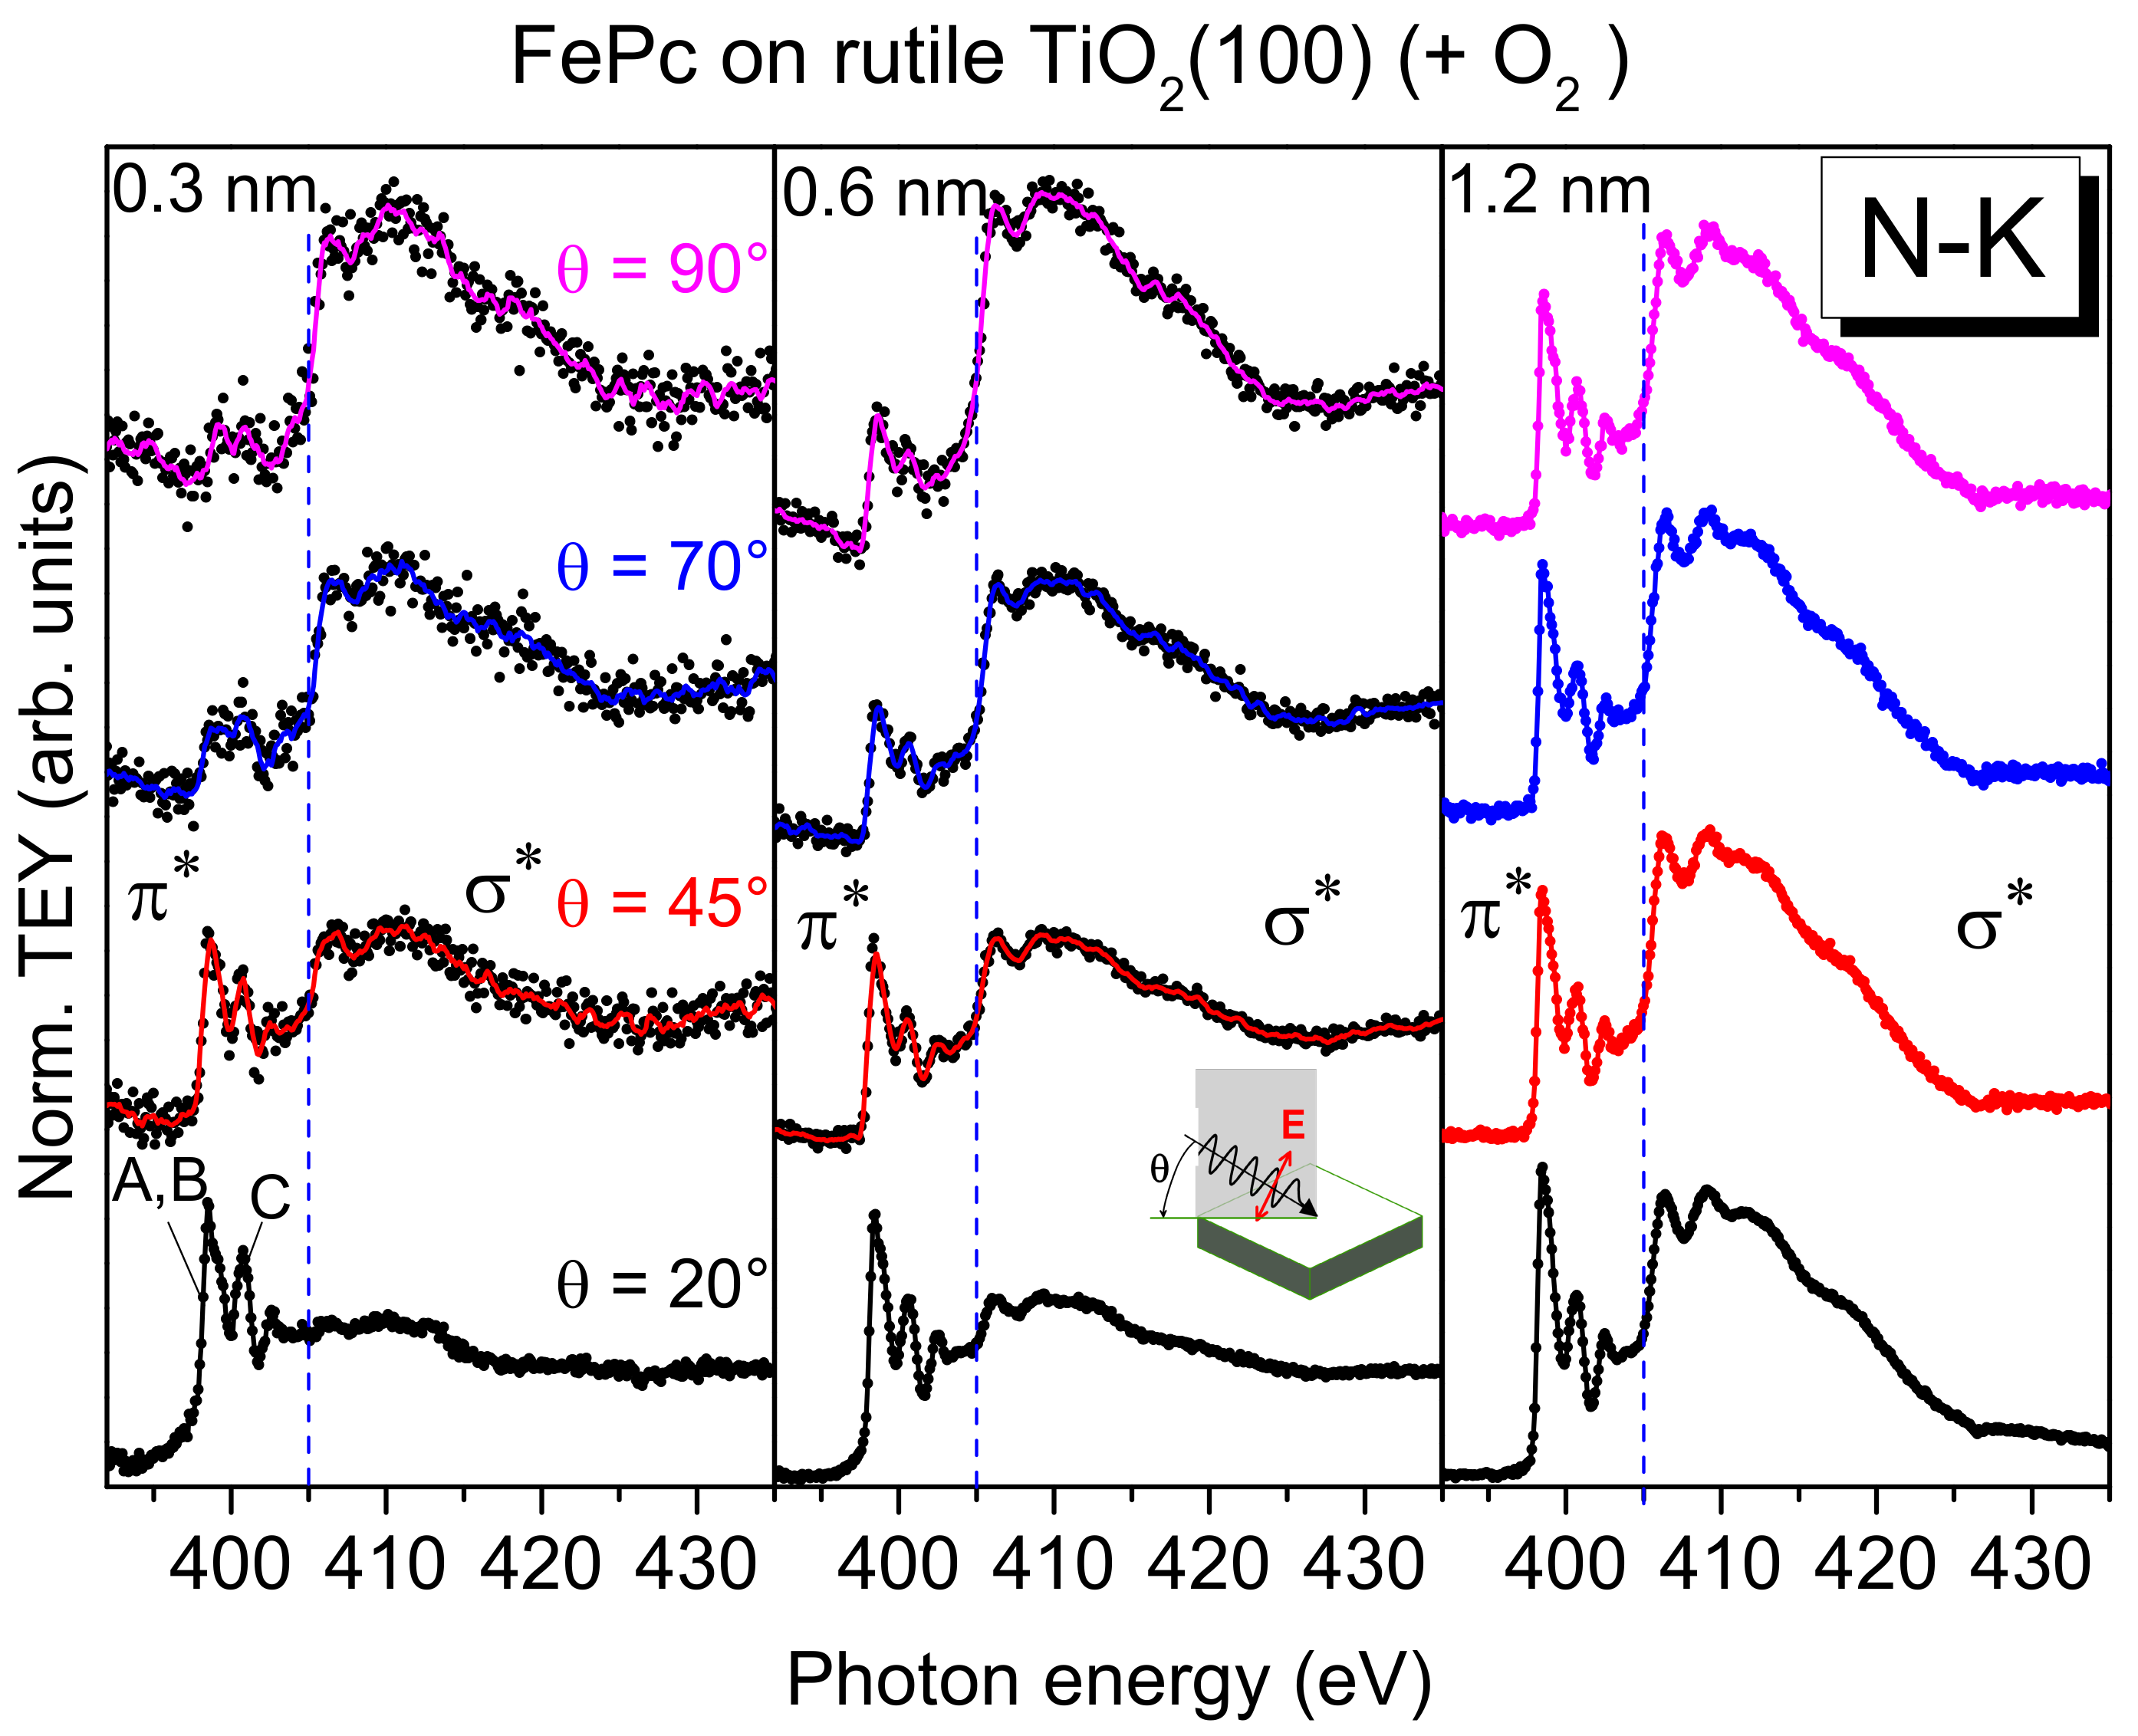
2(100) in more detail. Additional information about the involvement of particular atoms in an interaction at interfaces can be gained from XAS. Since XAS provides information about both the (unoccupied) electronic structure and the molecular orientation, we discuss first effects of the molecular orientation on the spectral shape. Polarization dependent N-K edge XAS spectra of FePc films of different thickness on rutile TiO
2(100) are shown in
Figure 6.
The excitation probability for a transition from the N 1s (or C 1s) orbital into either a π*-orbital or a σ*-orbital is angular-dependent for planar π-conjugated molecules, since the transition dipole moment for excitations into π*-orbitals is oriented perpendicular to the molecular plane, while those for σ*-orbitals are in the molecular plane (parallel to chemical bonds). Thus, for flat lying (face-on), planar molecules, the strongest excitations into π*-orbitals are expected at grazing incidence of the p-polarized synchrotron light (i.e., for the electric field vector of the synchrotron light parallel to the transition dipole moment). In order to gain information on the molecular orientation, the sample was measured at several different incidence angles of the p-polarized light with respect to the substrate surface. The angle was varied between 20° (grazing incidence) and 90° (normal incidence).
At low coverages (0.3 and 0.6 nm), the spectra at normal emission in
Figure 6 are dominated by excitations into σ
*-orbitals (photon energies >405 eV), whereas at grazing incidence, the strongest transitions are observed into π
*-orbitals (photon energies <405 eV). This indicates a preferred flat lying orientation of the FePc molecules, enabling a maximal interaction of the π-conjugated system with the substrate surface. Such growth modes were observed for low coverages in the monolayer range, if the molecule–substrate interaction is stronger than the molecule–molecule interaction [
38]. In contrast, the N-K edge spectra of the 1.2 nm thick FePc film are almost independent of the angle of incidence of the synchrotron light: Both excitations into σ
*- and π
*-orbitals are visible. This indicates a change of the molecular orientation with increasing thickness. We note, that N-K XAS spectra of thicker FePc films on rutile TiO
2(110) show even an anisotropy, where spectra at grazing incidence are dominated by σ
*-excitations, while the spectra at normal incidence are dominated by π
*-excitations, pointing to a change of the molecular orientation from preferred flat lying to preferred standing (
Figure S4). Such a change of the molecular orientation as a consequence of the interplay between molecule–substrate and molecule–molecule interactions was observed for related phthalocyanines on substrates where atomically flat terraces are small or on oxidic substrates (with supposed smaller surface energies), including TiO
2 [
38,
39].
However, not only the (relative) intensity of transitions into π
*- and σ
*-orbitals change in the N-K XAS spectra of
Figure 6. The N-K XAS spectra for the bulk-like 1.2 nm thick FePc film exhibit the typical shape observed for many phthalocyanines. The most intense π
* resonances at the lowest photon energies can be assigned to transitions from N 1s to LUMO e
g orbitals [
40] (denoted A, B in
Figure 6). The hybridization with the central metal, most evident for transition metals with not fully occupied lower d-levels (e
g), causes a distinct splitting into two features A and B (cf.
Figure 7), involving excitations from the two inequivalent nitrogen atoms [
13,
40,
41]. Also, the feature C at higher photon energies in
Figure 6 can be essentially assigned to transitions into π
* states [
40]. Since all features, A, B, and C in
Figure 6, are related to transitions into the LUMO orbital, only minor changes of the relative intensities are expected as a function of the angle of the incoming synchrotron light and/or the film thickness. However, as clearly visible in
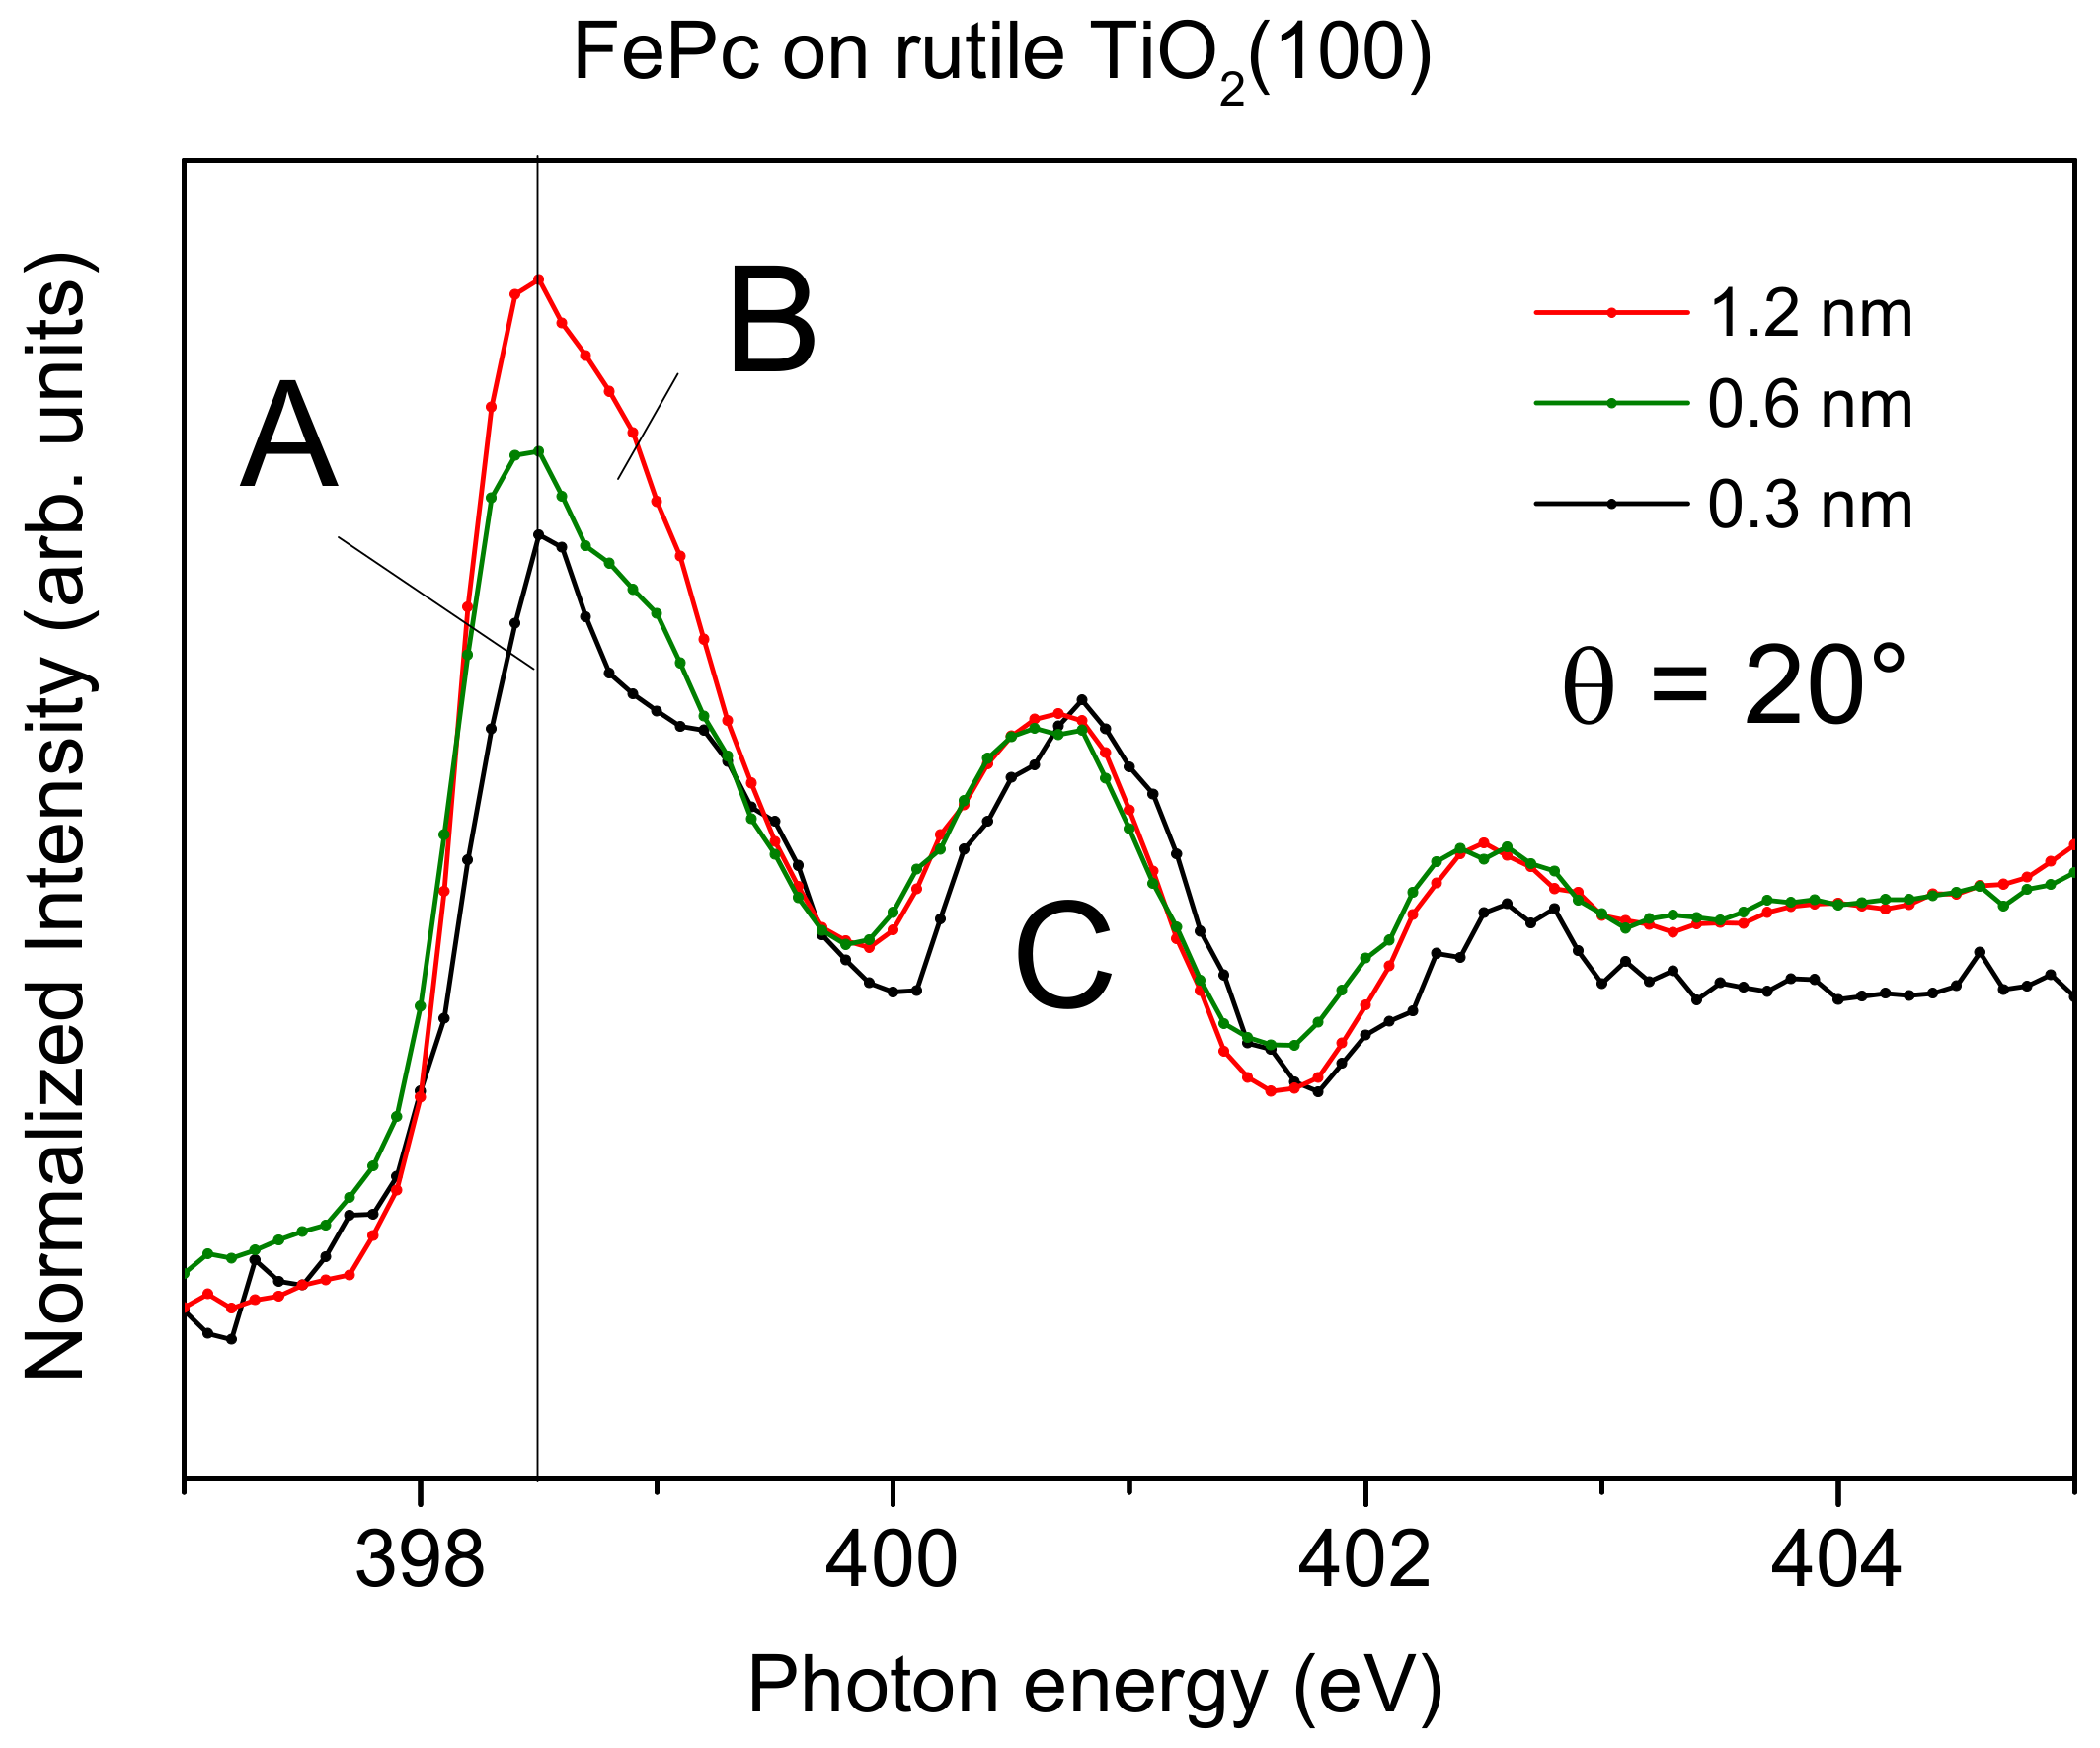
Figure 6, the relative intensity of feature A appears to be decreased for low coverages compared to the 1.2 nm thick film. This becomes more evident in
Figure 7, where we zoom into the region of LUMO transitions (A, B, C) for films of different thicknesses measured at grazing incidence (with strongest π
* resonances for flat lying molecules). Normalizing the data to the same intensity of feature C, one can clearly see the decreased relative intensity of A and B with respect to C for decreasing coverages.
Such a behavior is not unique for FePc on TiO
2(100); it was also observed for CuPcF
16 on TiO
2 and ascribed to a deformation of the molecules at the interface [
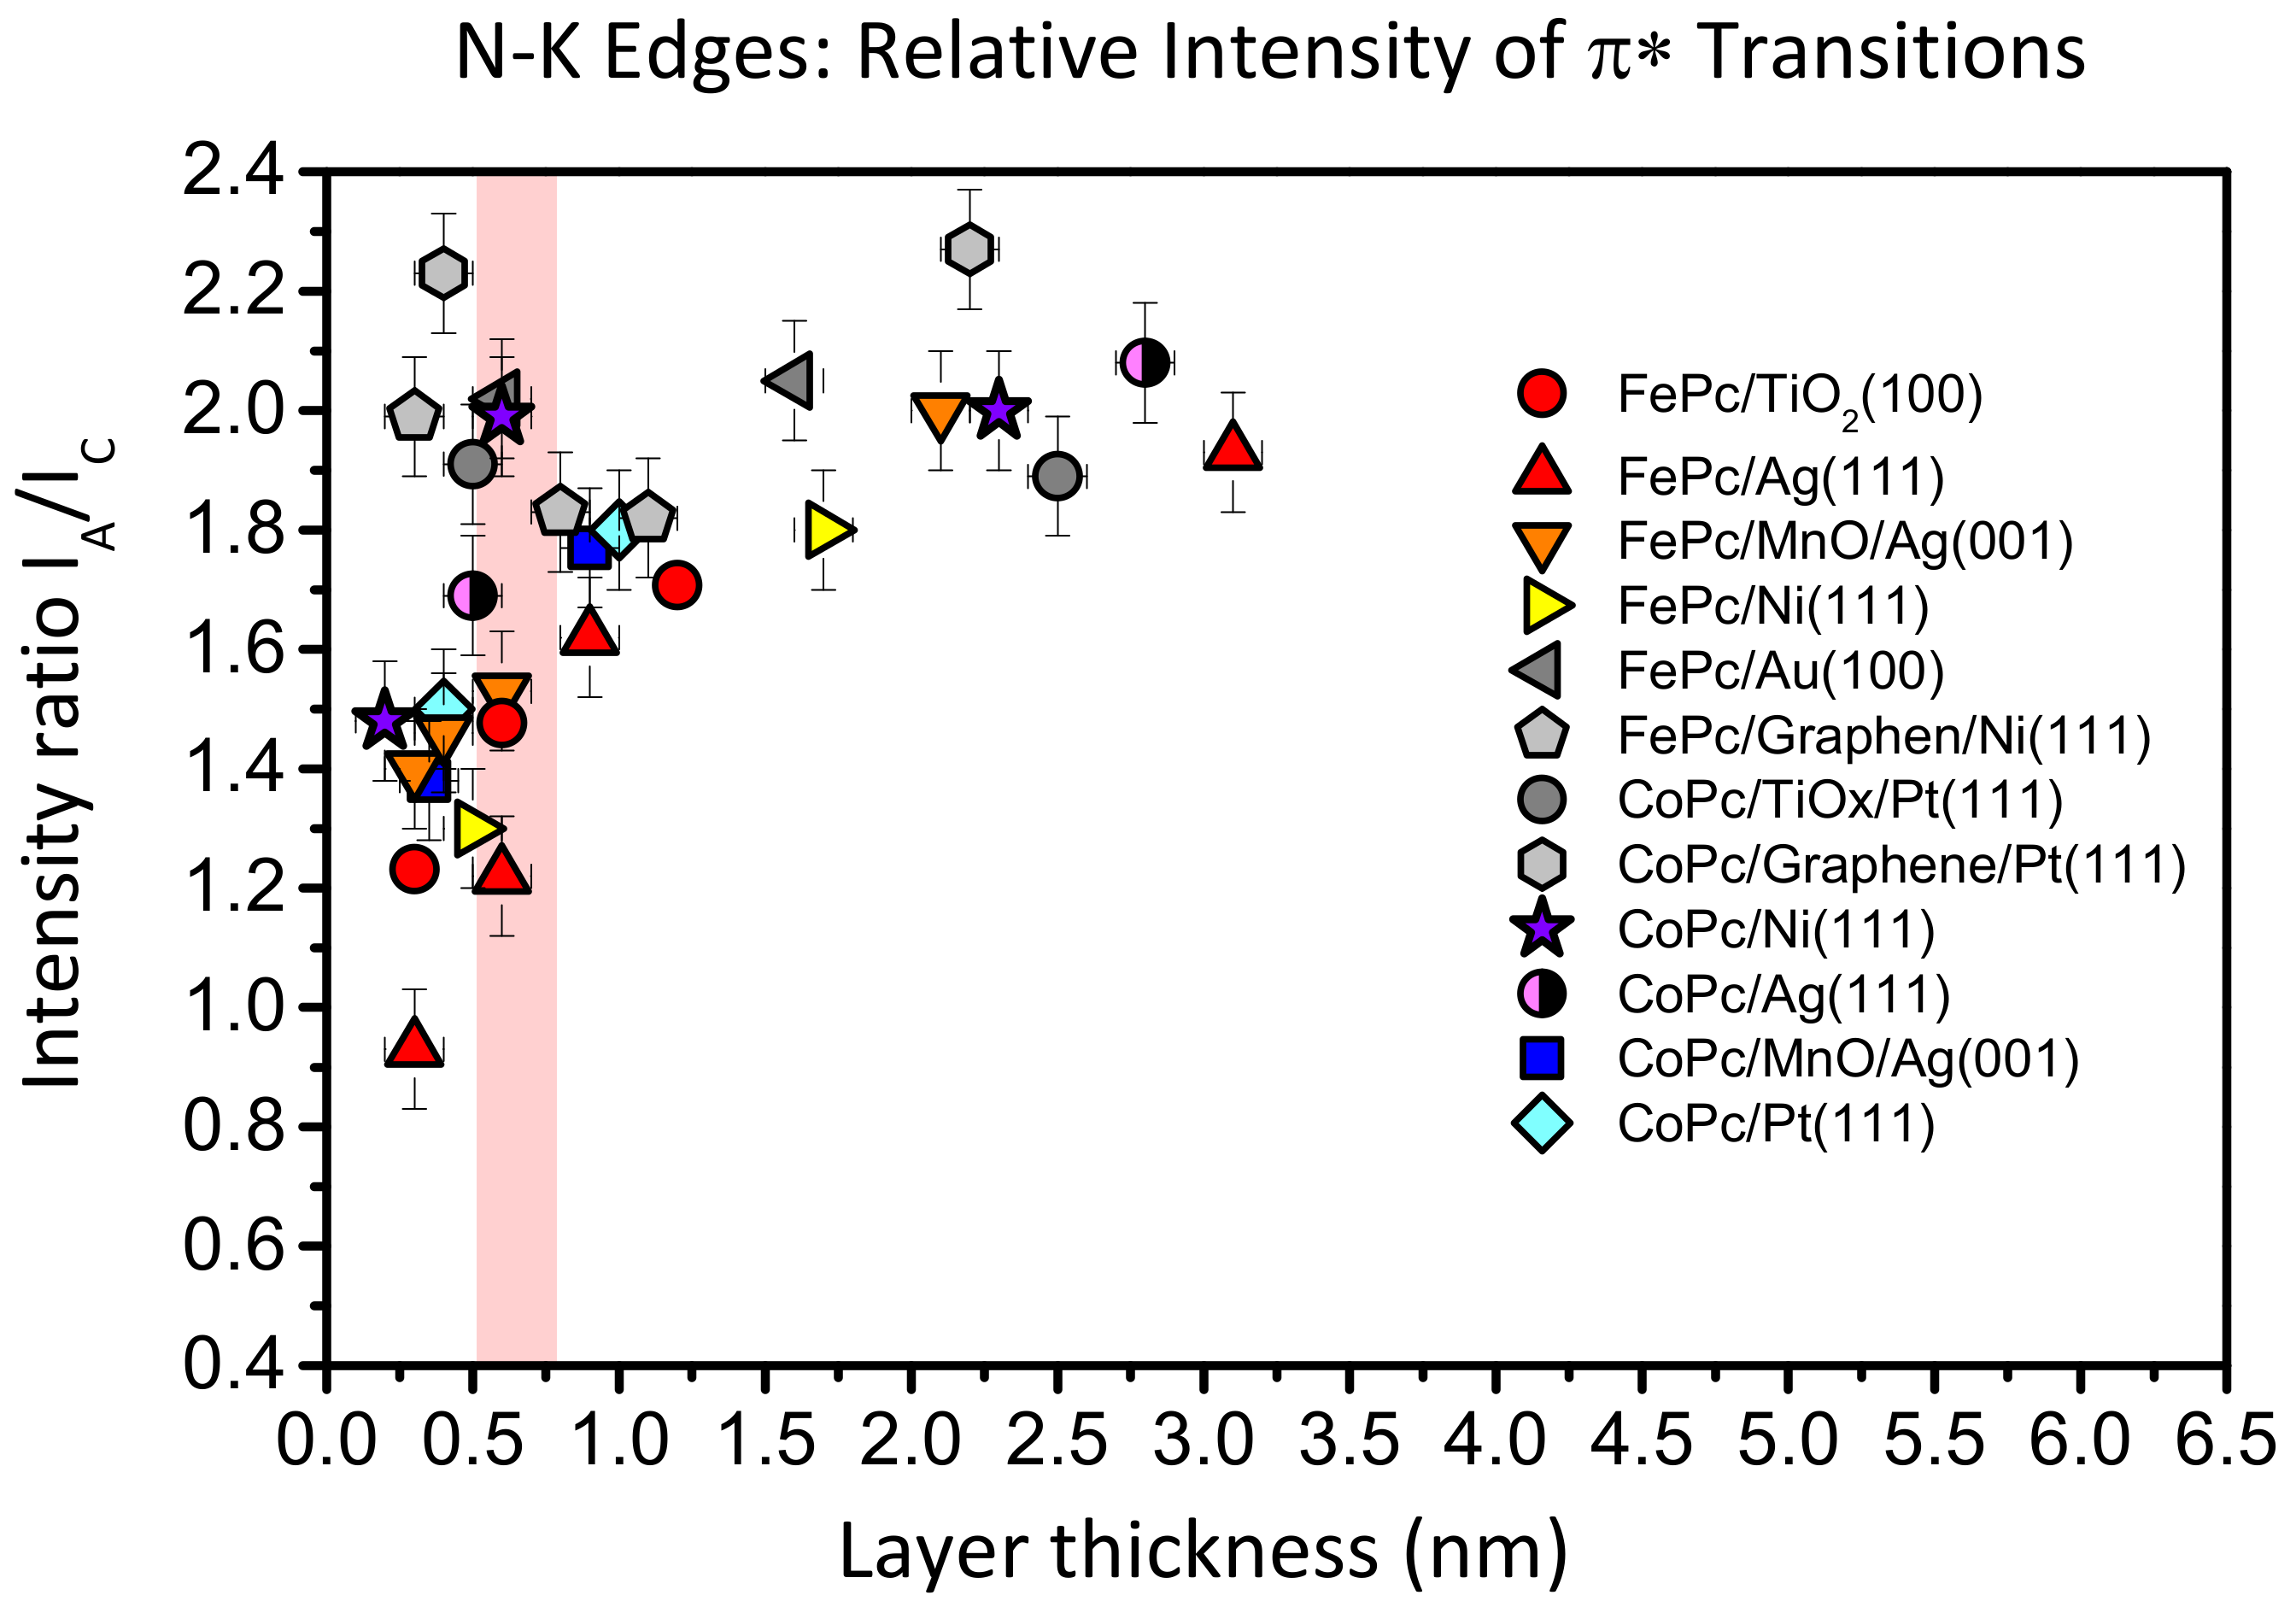
12]. In
Figure 8, we compare the intensity ratio between features A and C of the N-K absorption spectra of FePc and CoPc on several substrates as a function of the film thickness. The data were taken from [
13,
25,
27,
42,
43]. Like in
Figure 7, we analyzed spectra recorded at grazing incidence, since for most systems at this geometry, the N 1s–π
* transitions are strongest due to the preferred flat lying molecular orientation on the substrate surfaces. For bulk-like, more than 1.5 nm thick films, the intensity ratio A:C (peak height) is close to 2:1 and the general shape of the spectra is always similar [
13,
26,
41]. We note that the absolute values of the A:C ratio in the bulk is not necessarily exactly the same for different metal phthalocyanines and different orientations, e.g., due to a different A–B splitting as a result of the hybridization with orbitals from the central metal atom [
13] or the presence of a weak, in-plane polarized transitions in the same energy range as the π
* resonances [
44,
45]. However, for many systems shown in
Figure 8, the intensity ratio A:C in N-K XAS spectra decreases with decreasing film thickness. The strongest variation is visible for FePc/Ag (111) (red triangles), an interface which exhibits very strong interactions, including a hybridization of Fe and substrate-derived states at the interface [
25]. The data for FePc on TiO
2(100) also follow this trend (red circles in
Figure 8): The A:C intensity ratio for the lowest coverage (0.3 nm) is as low as 1.2:1. On the other hand, there are interfaces where the A:C intensity ratio is almost non-dependent on the film thickness (grey data points in
Figure 8), pointing to relatively inert interfaces.
Thus, a decreased relative intensity of the feature A seems to be an indication for an enhanced interaction at the interface. For such interfaces discussed in
Figure 8, a (partial) charge transfer to the molecule was reported. Therefore, it seems likely that the decrease of the relative intensity of A can be explained by a partial filling of the related orbitals, which reduces the possibility of excitations into these orbitals. We note that such a behavior was also observed for potassium intercalated FePc, where an electron transfer from K to FePc is evident [
41]. However, such charge transfer processes are not necessarily to be regarded as a simple filling of the LUMO orbital; rather, they are complex and bidirectional in many cases [
46,
47,
48]. Also, local interactions between nitrogen atoms of FePc and the substrate may cause a change of the peak shape of N-K edge XAS spectra.
Further, the question arises whether or not the (neighbored) central metal atom is involved in the interaction at the interface. In Fe 2p XPS spectra (
Figure 4a), we do not observe additional interface peaks, which would point to a chemical reaction or charge transfer to the Fe ion of the FePc molecule. Such interface peaks were found for reactive substrates like silver at about 1.5 eV lower BE compared to the multiplet signal of the bulklike multilayer film [
25,
49]. Also, an additional component at 707.0 eV (solid line in
Figure 4a), as observed on the weaker interacting gold surfaces [
50], seems to be absent. Therefore, Fe 2p photoemission spectra do not hint to an interaction between FePc and rutile TiO
2(100) involving the Fe ion. The result reminds to FePc on TiO
x epitaxially grown on platinum(111) [
27], although the detailed structure of substrate surfaces in both cases is different.
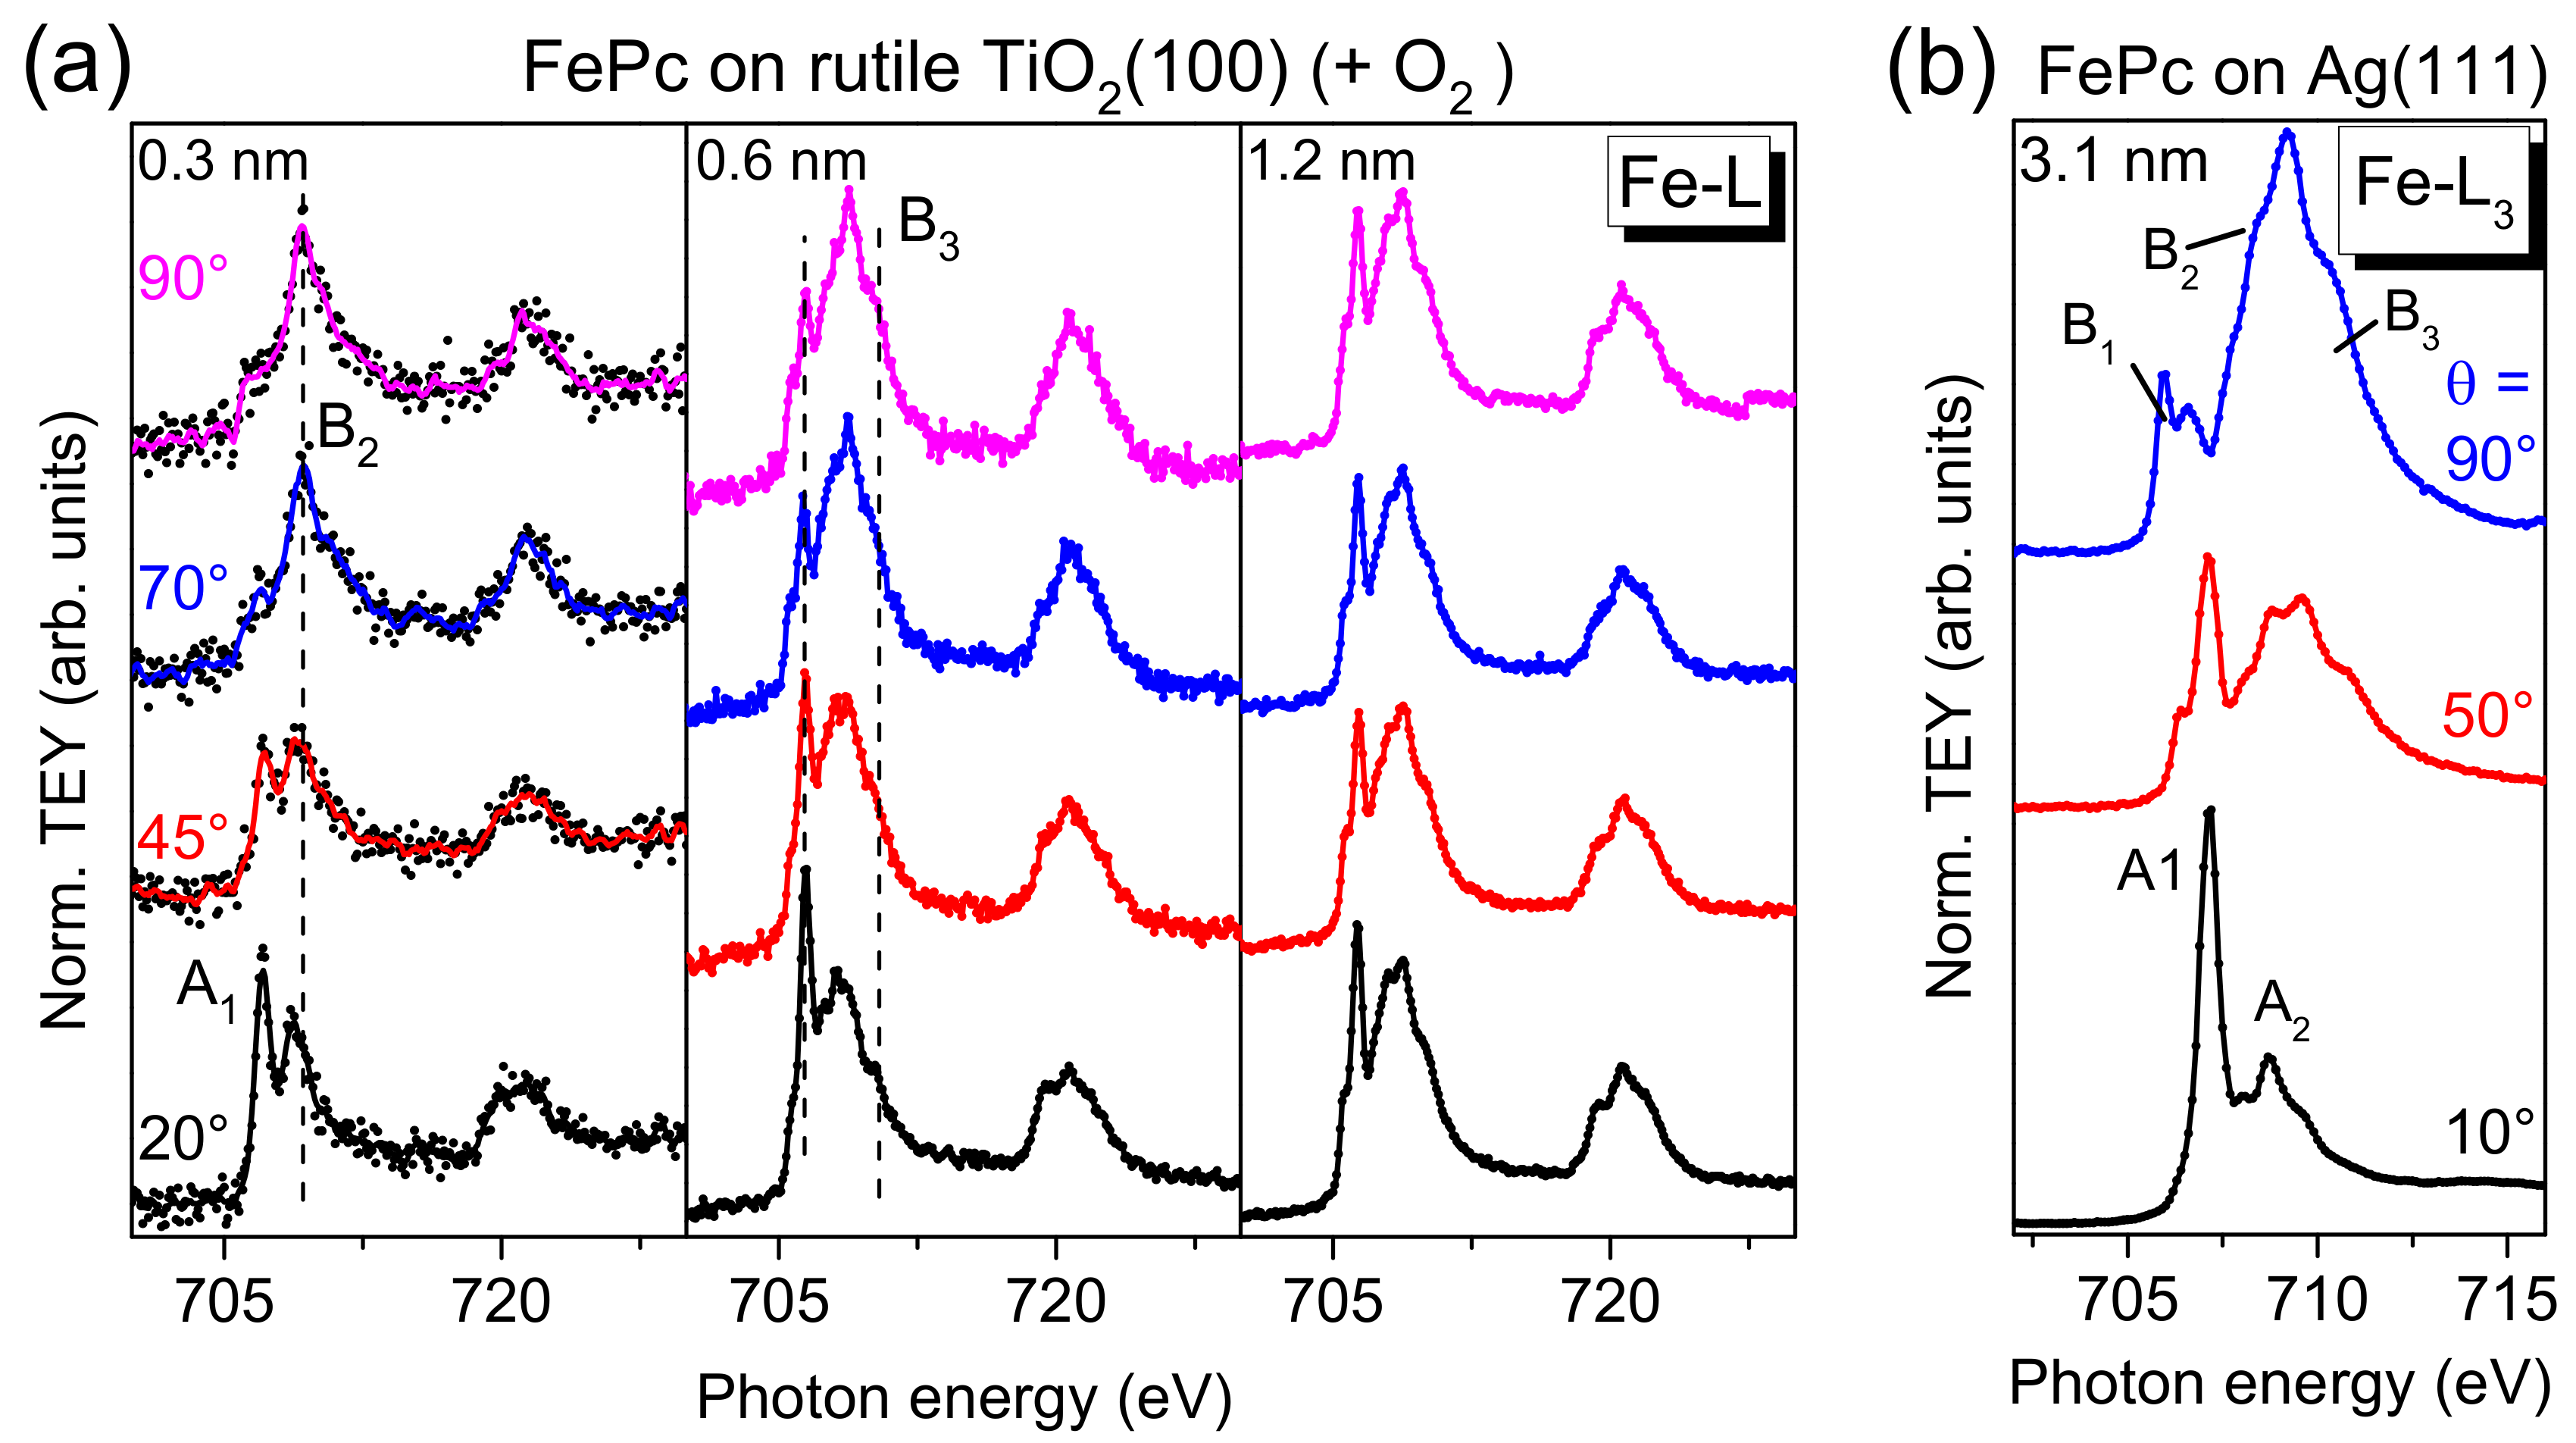
On the other hand, for TMPcs, the metal L-edge XAS spectra are very sensitive to the electronic structure, and thus to changes of the electronic configuration at the interface, in particular if the molecular orientation is known [
13]. Angle-dependent Fe L
3,2-edge XAS spectra for different FePc coverages on rutile TiO
2(100) are shown in
Figure 9a. We focus the discussion on the L
3-edge at photon energies < 715 eV. For comparison, Fe L
3-edge spectra of highly ordered, flat lying FePc molecules are shown in
Figure 9b (3.1 nm FePc on Ag(111), data taken from [
13]). Due to the flat lying adsorption geometry of FePc on Ag(111), at θ = 90° (normal incidence), transitions in the molecular plane are probed (denoted B1-B3), e.g., into d
xy and
orbitals. In contrast, at θ = 10° transitions into orbitals with out-of-plane (
z) contributions are observed (denoted A
1 and A
2).
In
Figure 9a, a clear angular dependence of the spectral shape is visible in the spectra for low FePc coverages (0.3 and 0.6 nm) on rutile TiO
2(100). The missing anisotropy of the spectra for the 1.2 nm film is due to an absence of a preferred molecular orientation at this film thickness (cf. discussion of N-K XAS spectra). In agreement with the degree of orientation obtained from N-K XAS spectra, the anisotropy is stronger for 0.3 nm compared to 0.6 nm. Most important, the monolayer spectra does not exhibit additional or shifted features as observed for strongly interacting systems, such as FePc on Ag(111) [
25] or FePc on MnO [
27], in good agreement with the discussion of Fe 2p PES spectra above. Such strong interactions can include a hybridization of Fe and substrate-related states and a redistribution of electrons at the Fe atom [
13,
25,
27]. However, the feature denoted “A
1” for the 0.3 nm spectrum at grazing incidence seems to exhibit a distinctly lower relative intensity compared to the reference spectra (FePc on Ag(111)), which cannot be understood alone by a slightly different molecular orientation (obtained from N-K XAS spectra) or by the different grazing incidence angle (20° and 10° with respect to the substrate surface in
Figure 9a,b, respectively). This may point to a partial filling of the orbitals involved into these transitions due to weak interaction with the substrate or to a minor change of the electronic configuration of the Fe ion at the interface.
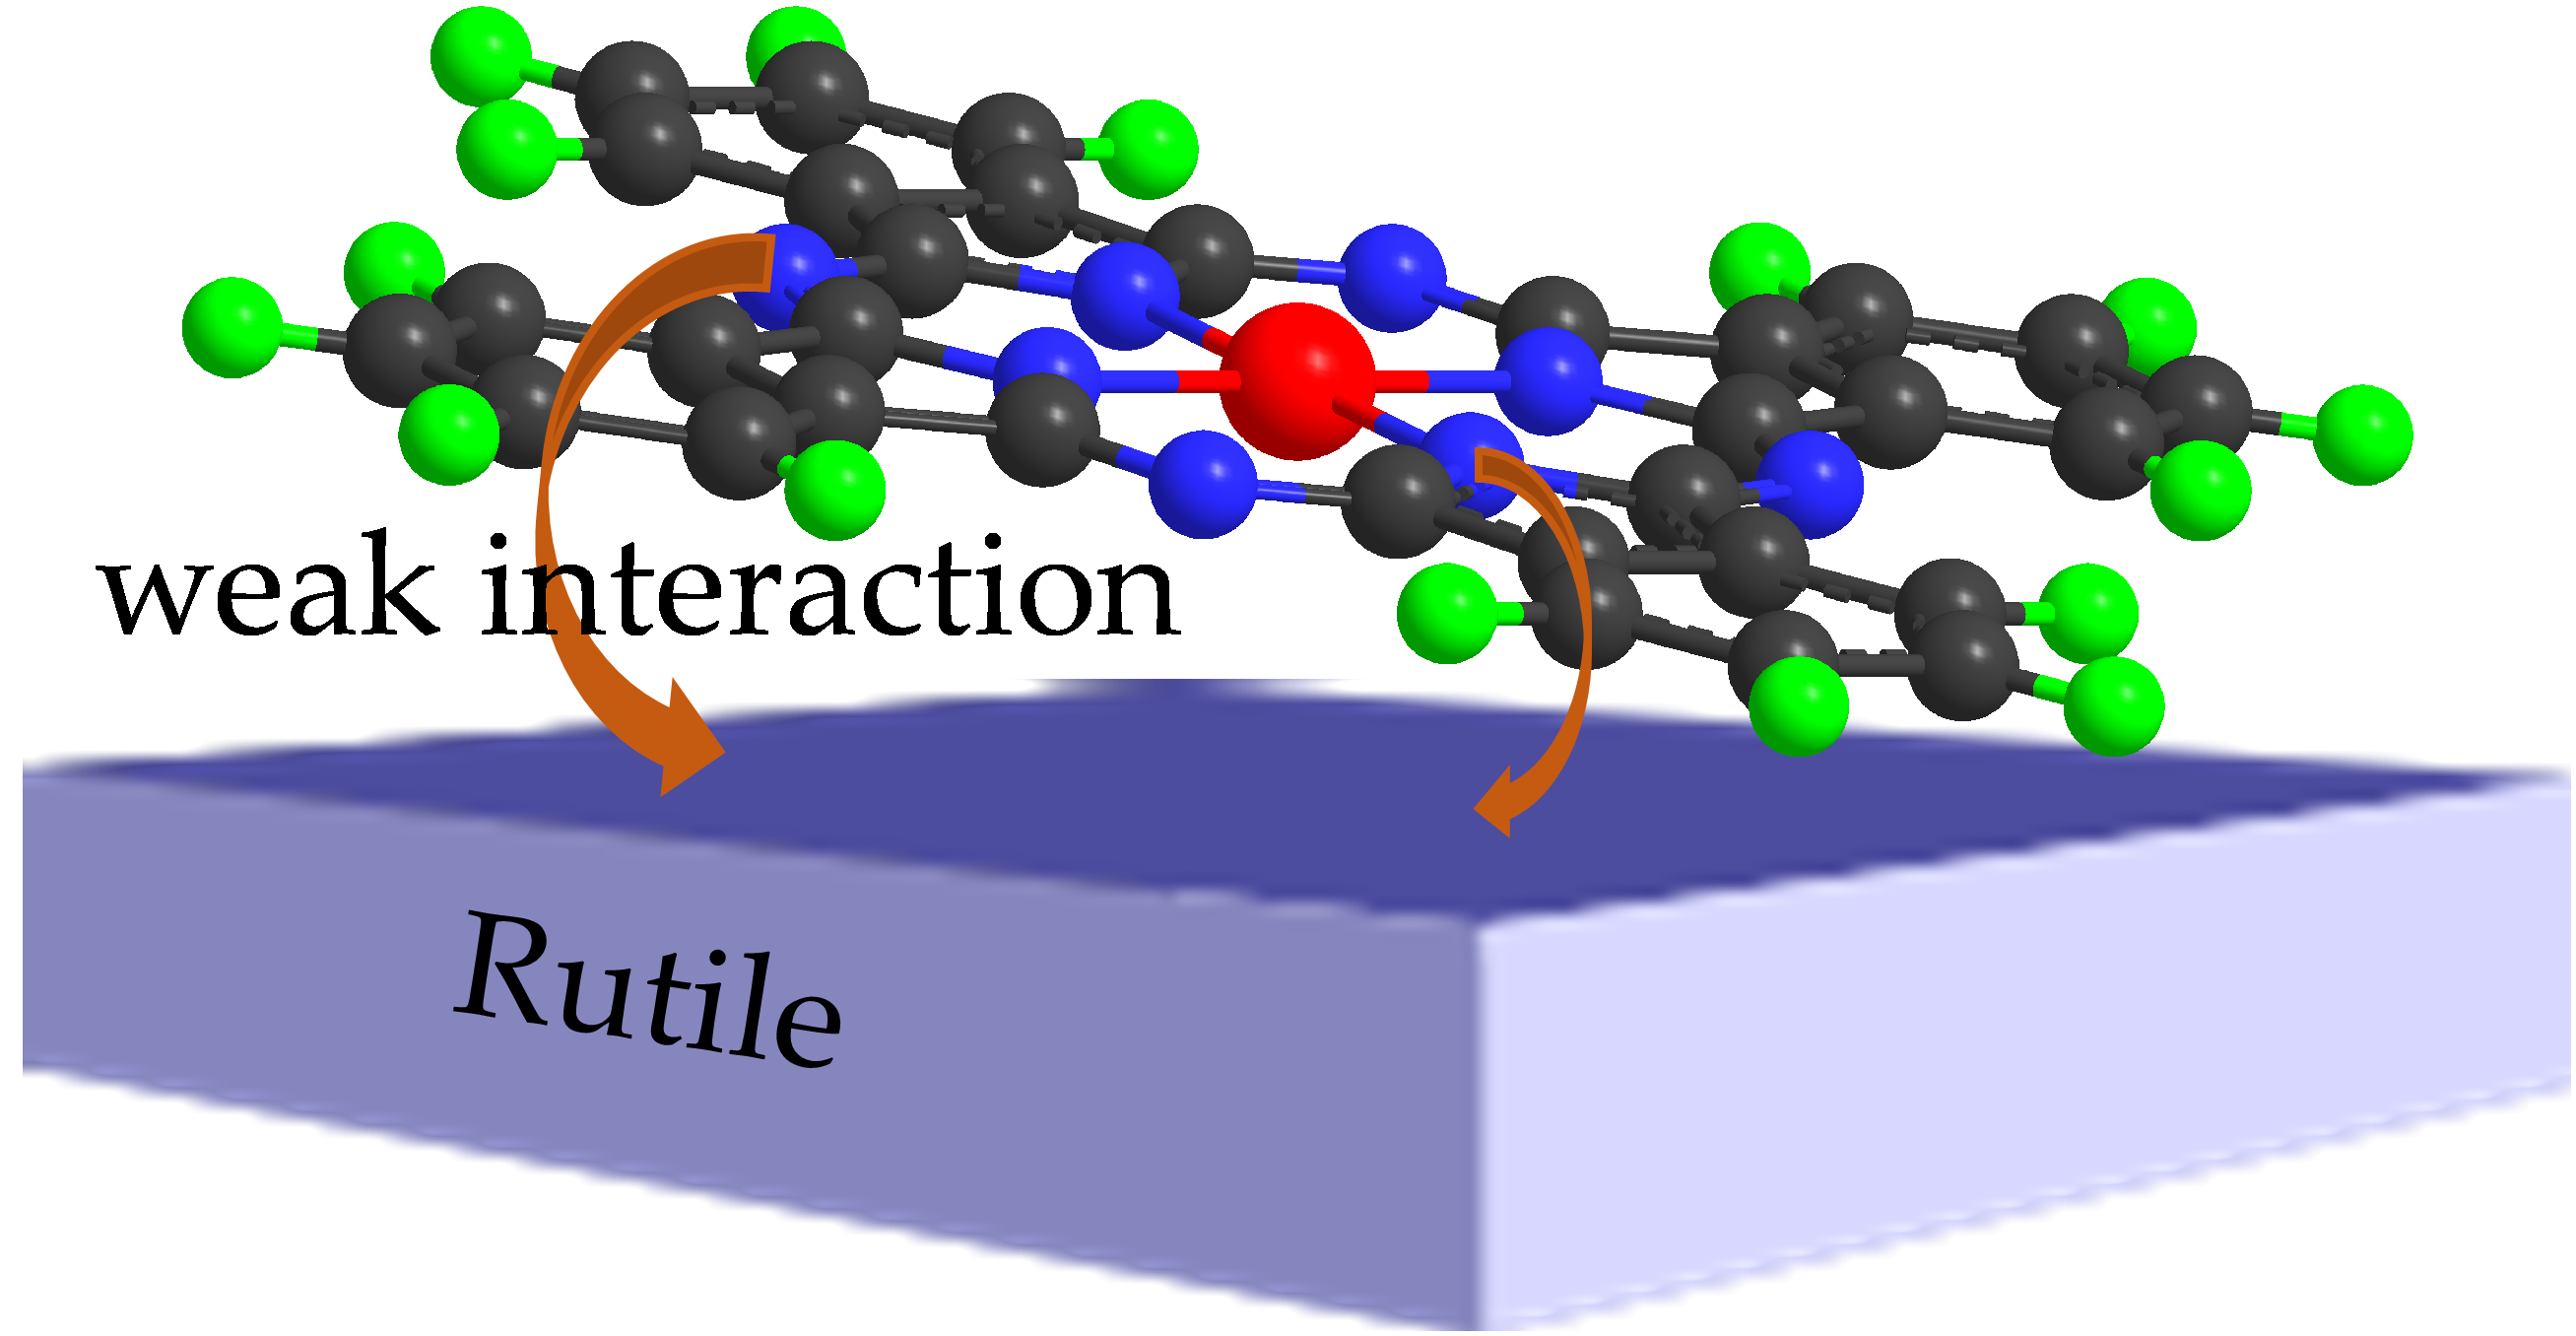
In summary, the absence of interface peaks in both XAS and XPS spectra points to a weak interaction at the studied FePc/rutile TiO2(100) interface; there is no evidence supporting a decomposition or oxidation of the molecule at the interface. The description of core-level spectra is essentially possible with the same model for coverages in the monolayer range and for thin films. The broadening of core-level spectra for low coverages can be understood by the adsorption at inhomogeneous adsorption sites, most likely accompanied by a complex partial charge transfer at the interface. A possible charge transfer involving N and Fe is further supported by changes of the shape of XAS spectra as a function of thickness. However, the weak interface peak in N 1s core-level spectra cannot be understood by such partial charge transfer processes into molecular orbitals. We assume that for few FePc molecules in the first monolayer, an additional, local interaction between nitrogen atoms and the rutile TiO2(100) substrate occurs.
2.4. FePcF16 on Rutile TiO2(100)
The fluorination of phthalocyanines mainly increases the ionization potential, whereas other electronic properties, such as the optical gap, are less affected, as previously shown, e.g., for CuPc and CoPc [
47,
51]. From UPS, we determine an ionization potential of 6.3 eV and 5.2 eV for perfluorinated FePcF
16 and FePc, respectively. On the other hand, the optical band gap is very similar: From the onset of UV-vis spectra, we determine 1.58 (FePcF
16) and 1.60 eV (FePc). Data are shown as
Supplementary Materials (Figure S6). The increased ionization potential of fluorinated phthalocyanines may support an electron transfer to the molecule at interfaces, as shown for CoPc and CoPcF
16 on Cu-intercalated graphene/Ni(111) [
17]. Therefore, we studied interface properties at the example of FePcF
16/rutile TiO
2(100). The rutile was annealed in the presence of oxygen during all preparation steps.
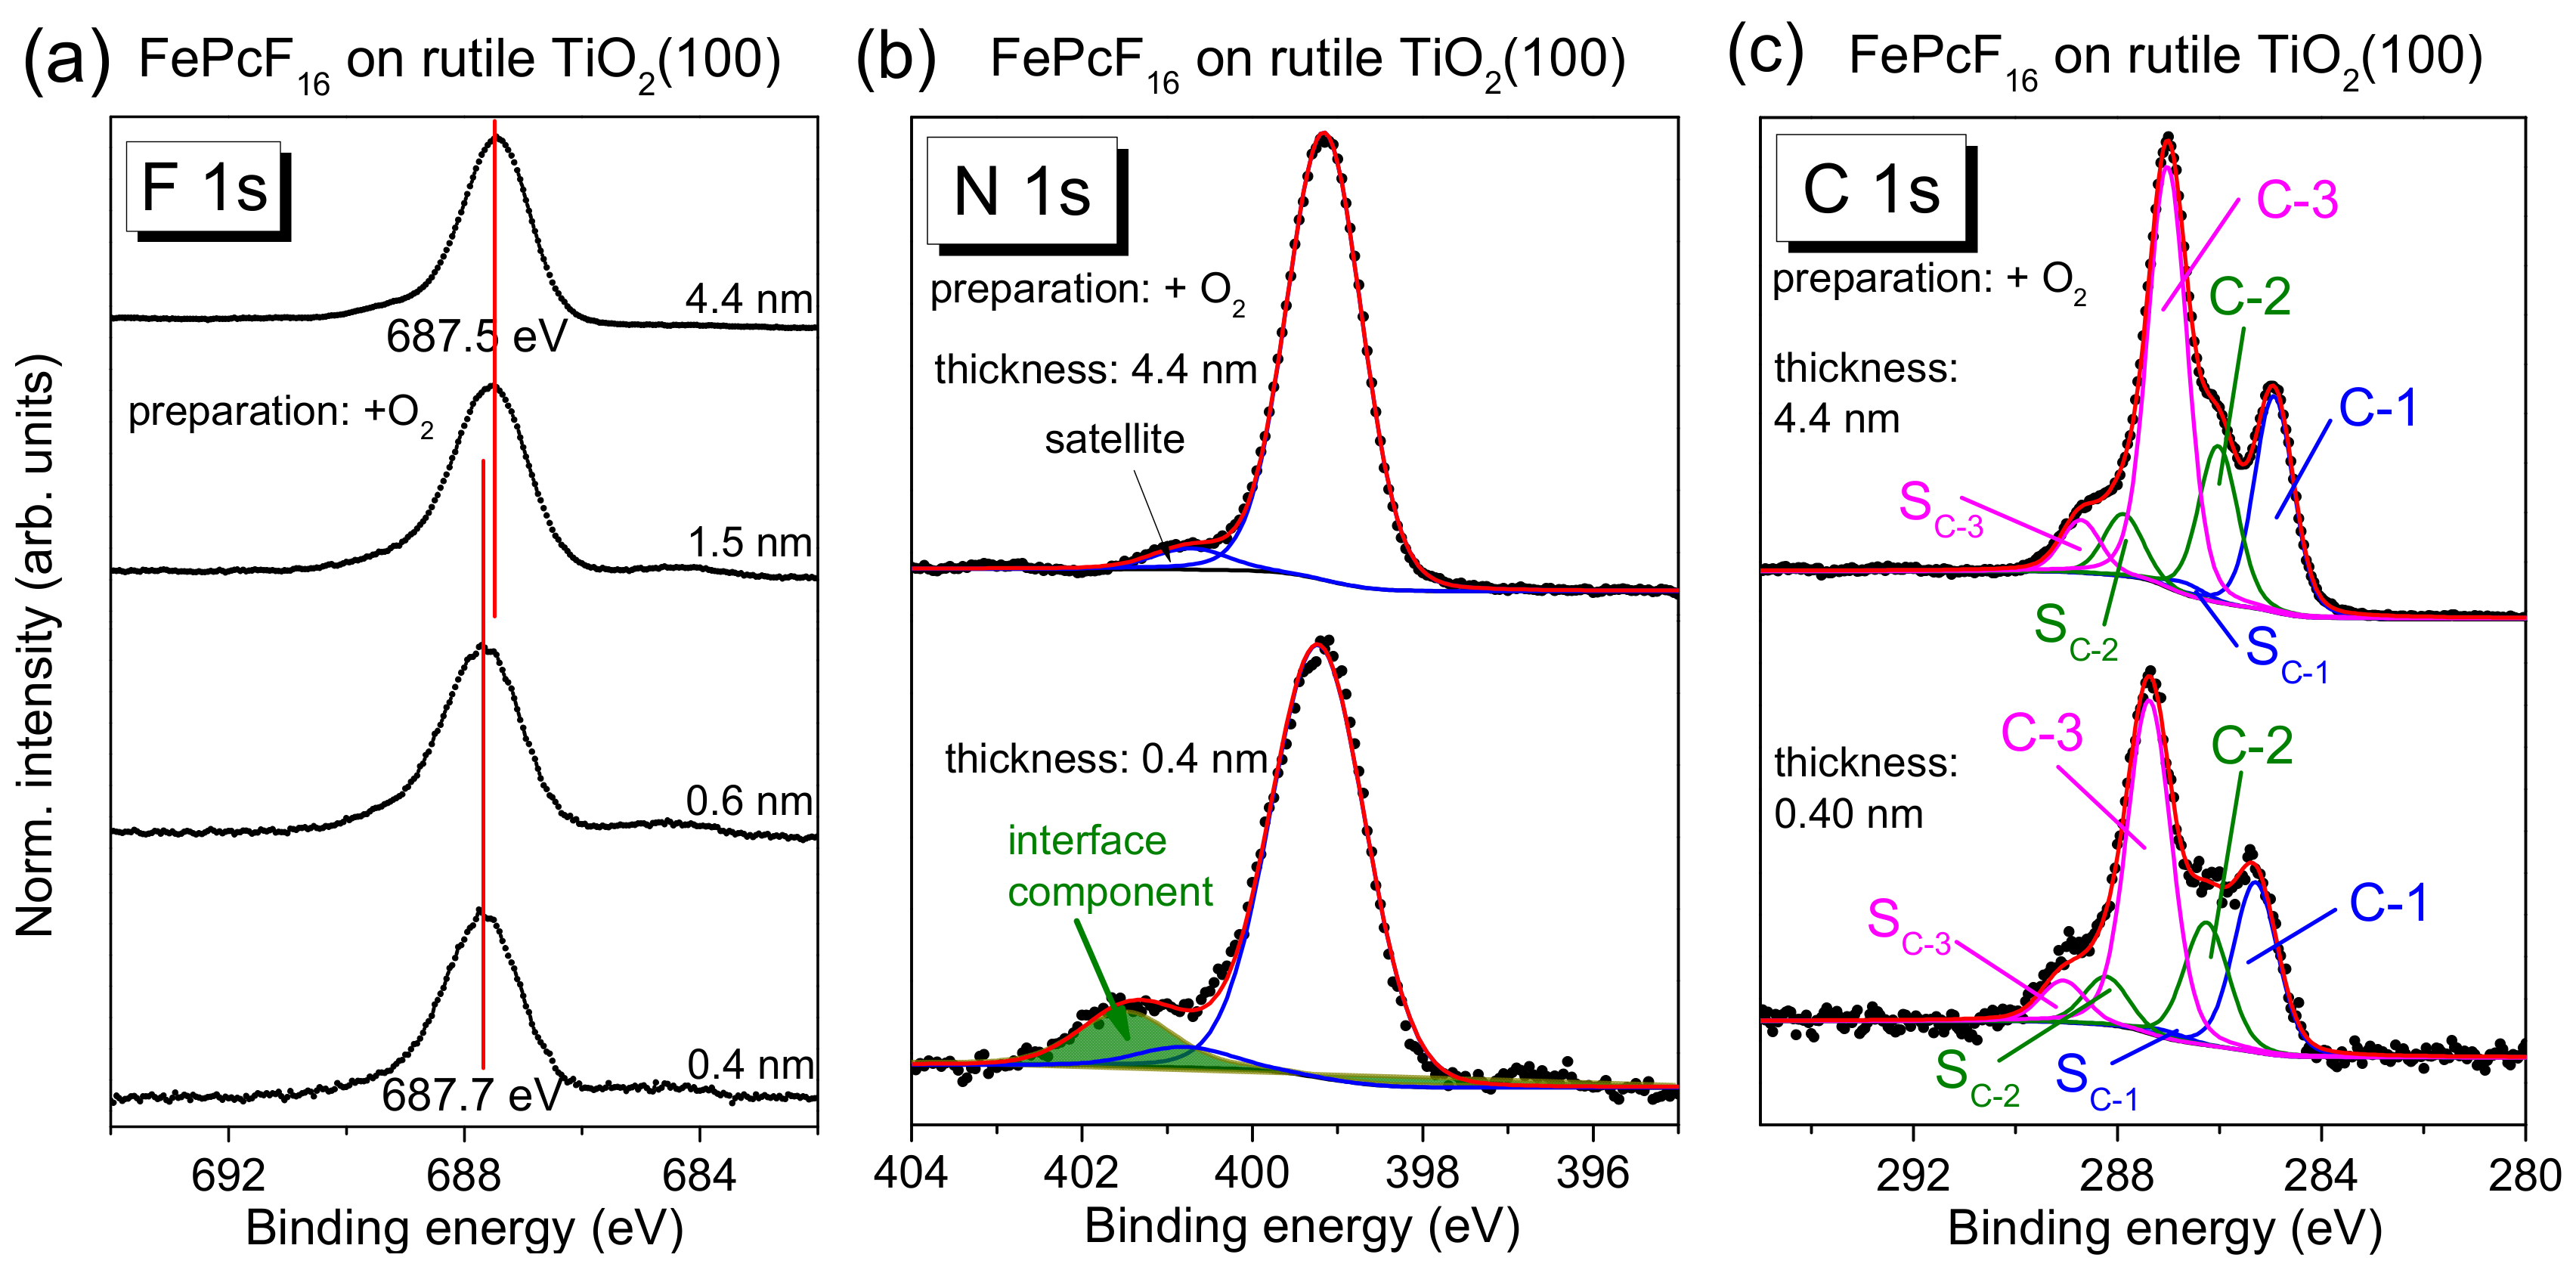
FePcF
16-related F 1s, N 1s, and C 1s core-level spectra are shown in
Figure 11, and the corresponding Fe 2p spectra are given in
Figure S7. The F 1s spectra in
Figure 11a exhibit one single peak, as expected from the chemical structure (
Figure 1c). The spectral shape of the C 1s core-level spectra differs from C 1s of FePc due to the additional C–F bonds, visible as components at higher BE and a corresponding satellite, denoted C-3 and S
C-3 in
Figure 11c. The peak fit is in good agreement to C 1s spectra of related fluorinated phthalocyanines [
17,
52].
Most important, analogously to FePc on rutile TiO
2(100), the spectral shape of all core-level spectra is almost independent of the film thickness. Small energetic shifts of 0.1–0.2 eV towards lower BE can be detected for all core levels with increasing film thickness (for Fe 2p,
Figure S7). Many reasons can provoke such small energetic shifts. For the related fluorinated CuPcF
16 on Au (a metal with a work function comparable to rutile), a pinning of the Fermi level at the interface close to the LUMO position for the “n-type” organic semiconductor was discussed, accompanied by band-bending like effects (the potential gradient in the organic film) [
52].
The detailed analysis of N 1s and C 1s core-level spectra of FePcF
16 by a peak fitting routine confirms that the same model can be applied for each film thickness, allowing a larger broadening for all components at lower film thickness (fitting parameters:
Table S8). In the F 1s spectra, for low coverages, very weak intensity can be detected at lower binding energies (685 eV), which might indicate the breaking of some C–F bonds (cf.
Section 2.5). In general, the development of the core-level spectra is very similar to the discussed FePc/rutile interfaces. Analogously to these interfaces, additional intensity is visible in the N 1s spectra at higher BE for low coverages (see green component and arrow in
Figure 11b), discussed as a possible local interaction. We note that the interface component in N1s spectra is found at higher binding energy compared to FePc, and also the binding energy relative to the main component ΔBE is increased (ΔBE(FePcF
16) = +2.3 eV, ΔBE(FePc) = +2.0 eV). The dependence of the binding energy on the kind of the molecule confirms that the molecules themselves are involved in the local interaction, rather than a scenario where a new nitrogen-containing compound is formed on the rutile surface.
In summary, the interaction of FePcF16 and rutile TiO2(100) is weak and very similar to the discussed FePc/rutile interfaces. Apparently, the fluorination of FePc does not affect significantly the interface properties to rutile TiO2(100).
2.5. FePcF16 on Defect-Rich, Hexagonal Rutile TiO2(100)
Finally, we investigate if a significantly higher number of defects on the TiO2 surface affects the interface properties distinctly. We have already shown that the exposure to oxygen during the last annealing step in the preparation of the rutile single crystal have only minor effects on interface properties of the deposited organic molecules.
However, if rutile TiO
2(100) is prepared without (or with significantly less) exposure to oxygen during all annealing steps, a more defect-rich substrate can be prepared. For TiO
2(110), rosette-like network patches are observed; they can be understood by an incomplete 1 × 1 structure [
53,
54]. The annealing of the rutile TiO
2(100) single crystal in the absence of oxygen (3-4 annealing steps) results in a hexagonal surface structure similar to the reported structures on TiO
2(110) [
53,
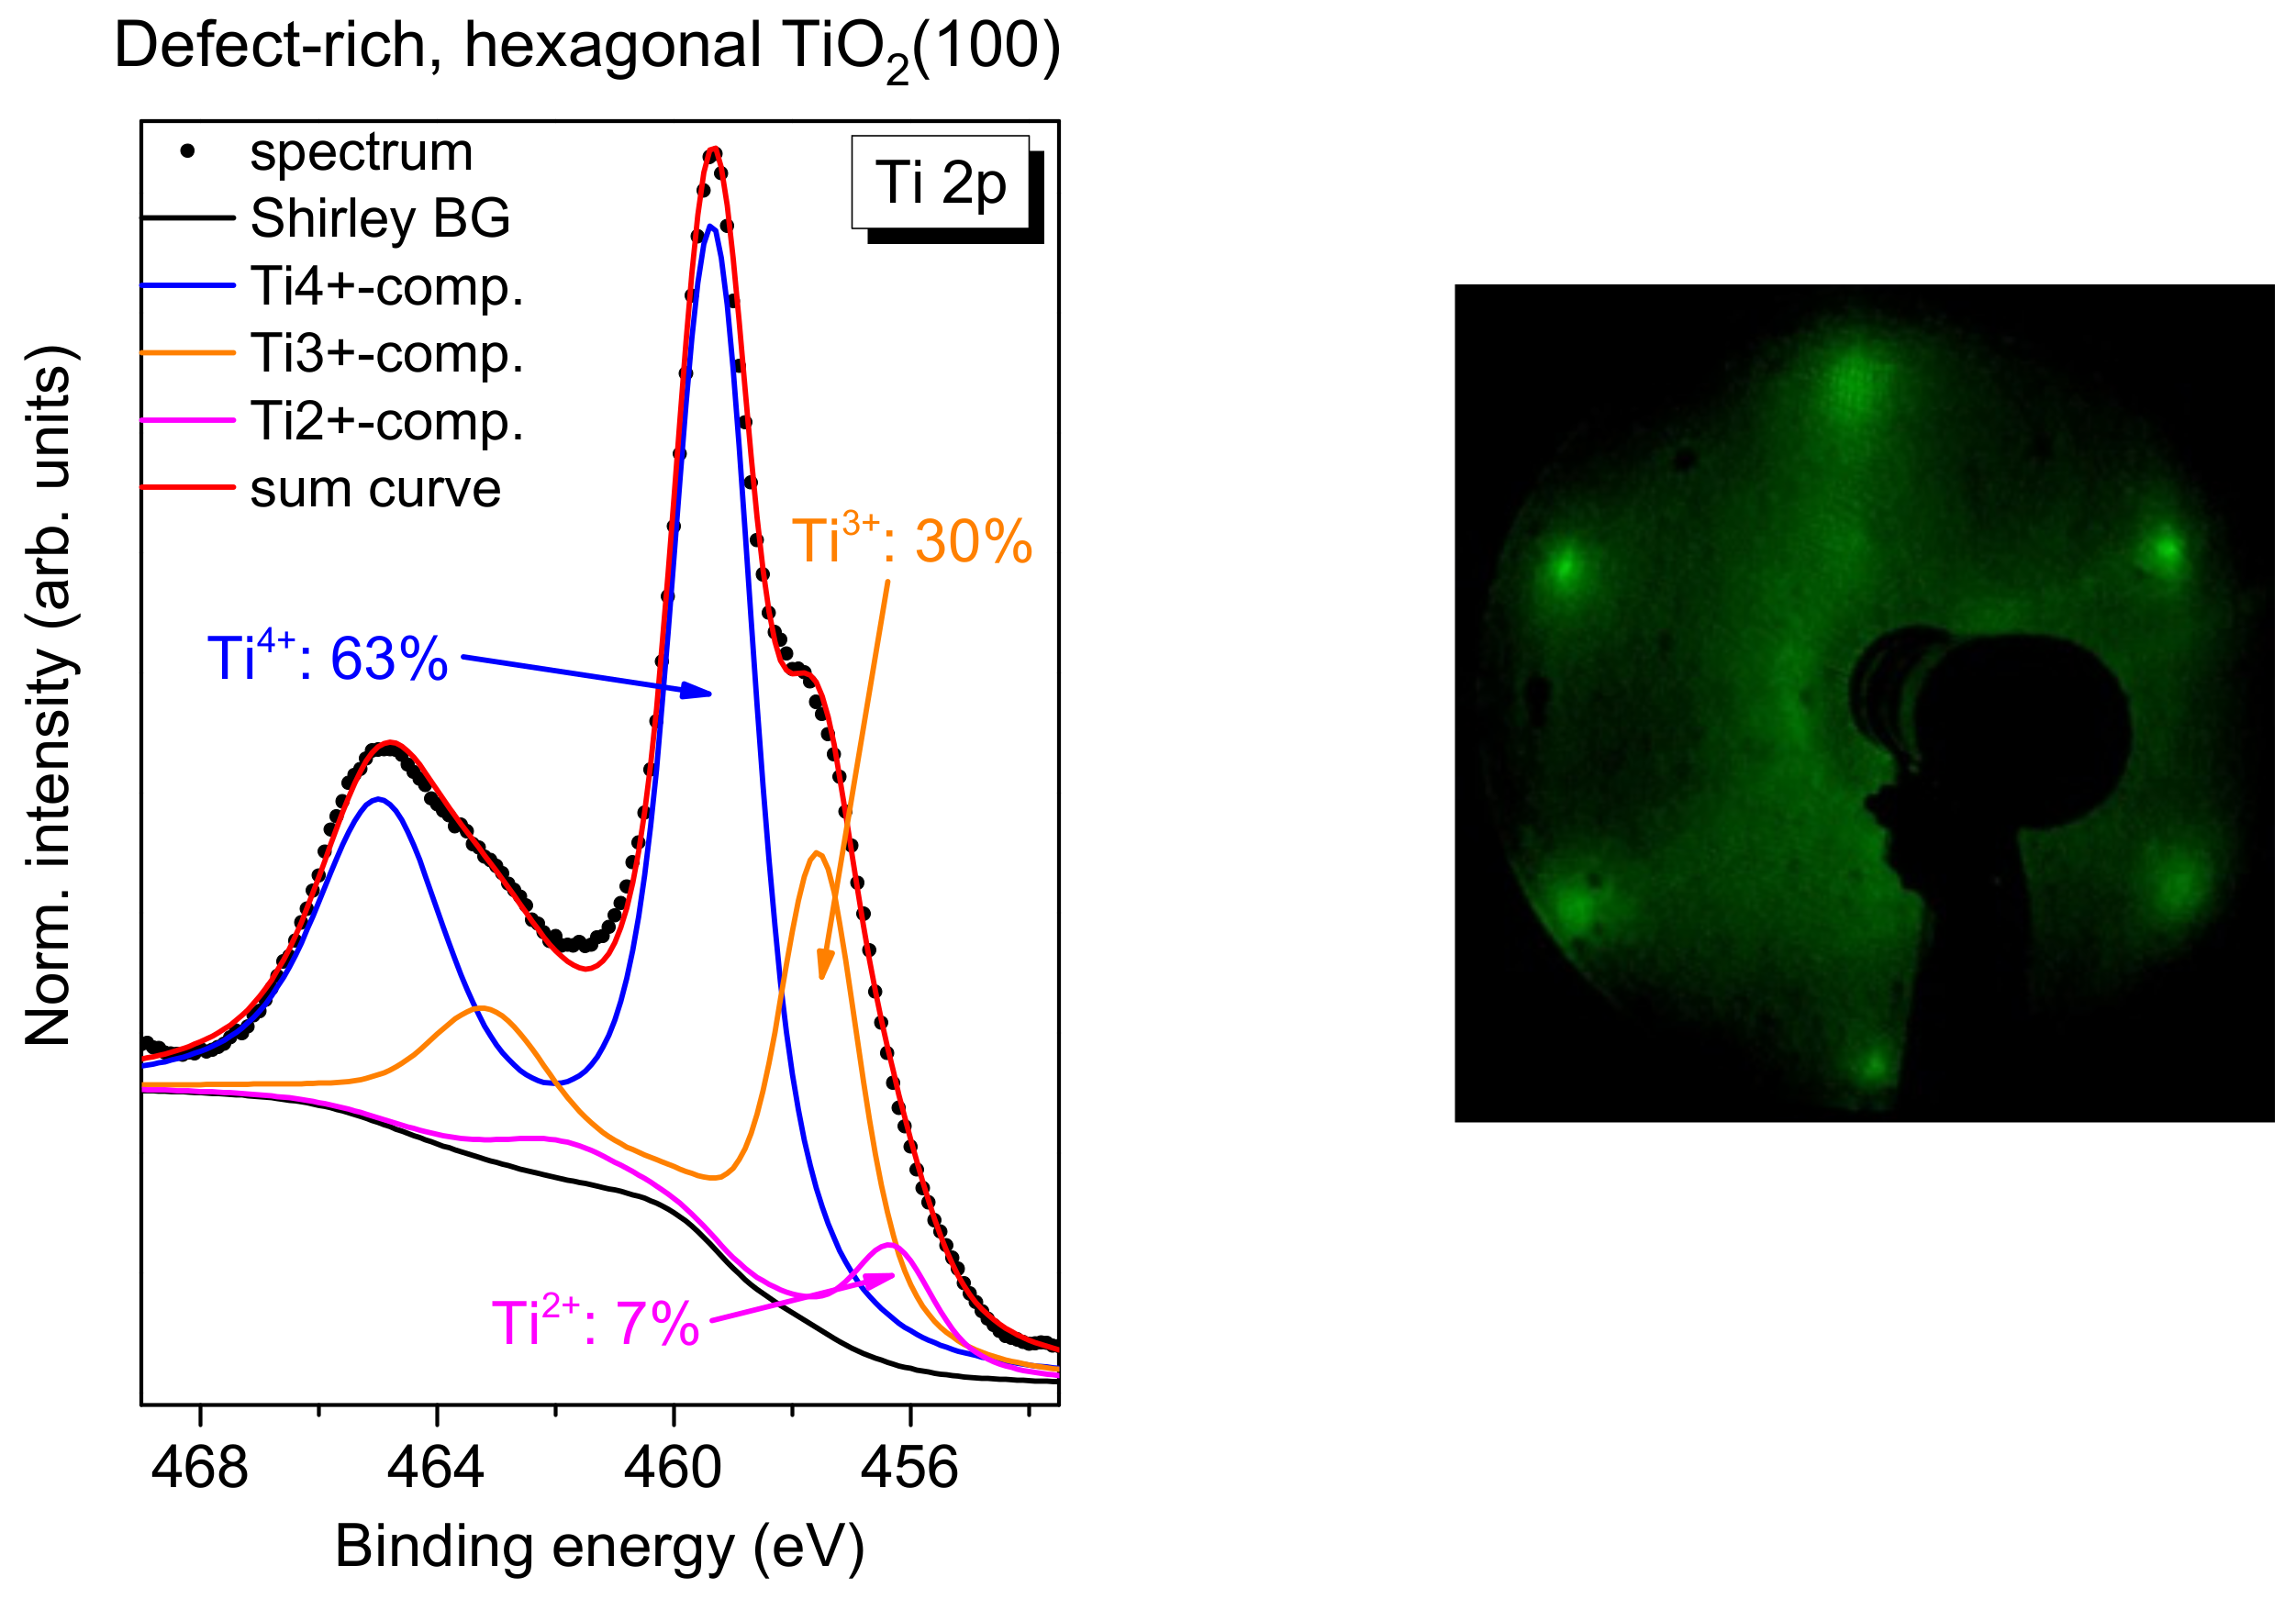
54]. A typical Ti 2p spectrum, together with an LEED image, is shown in
Figure 12. In contrast to the systems discussed before, the Ti 2p spectrum cannot be explained on the sole basis of a high number of Ti
3+ defects, but rather an additional component for Ti
2+ has to be introduced (fitting parameters:
Table S9).
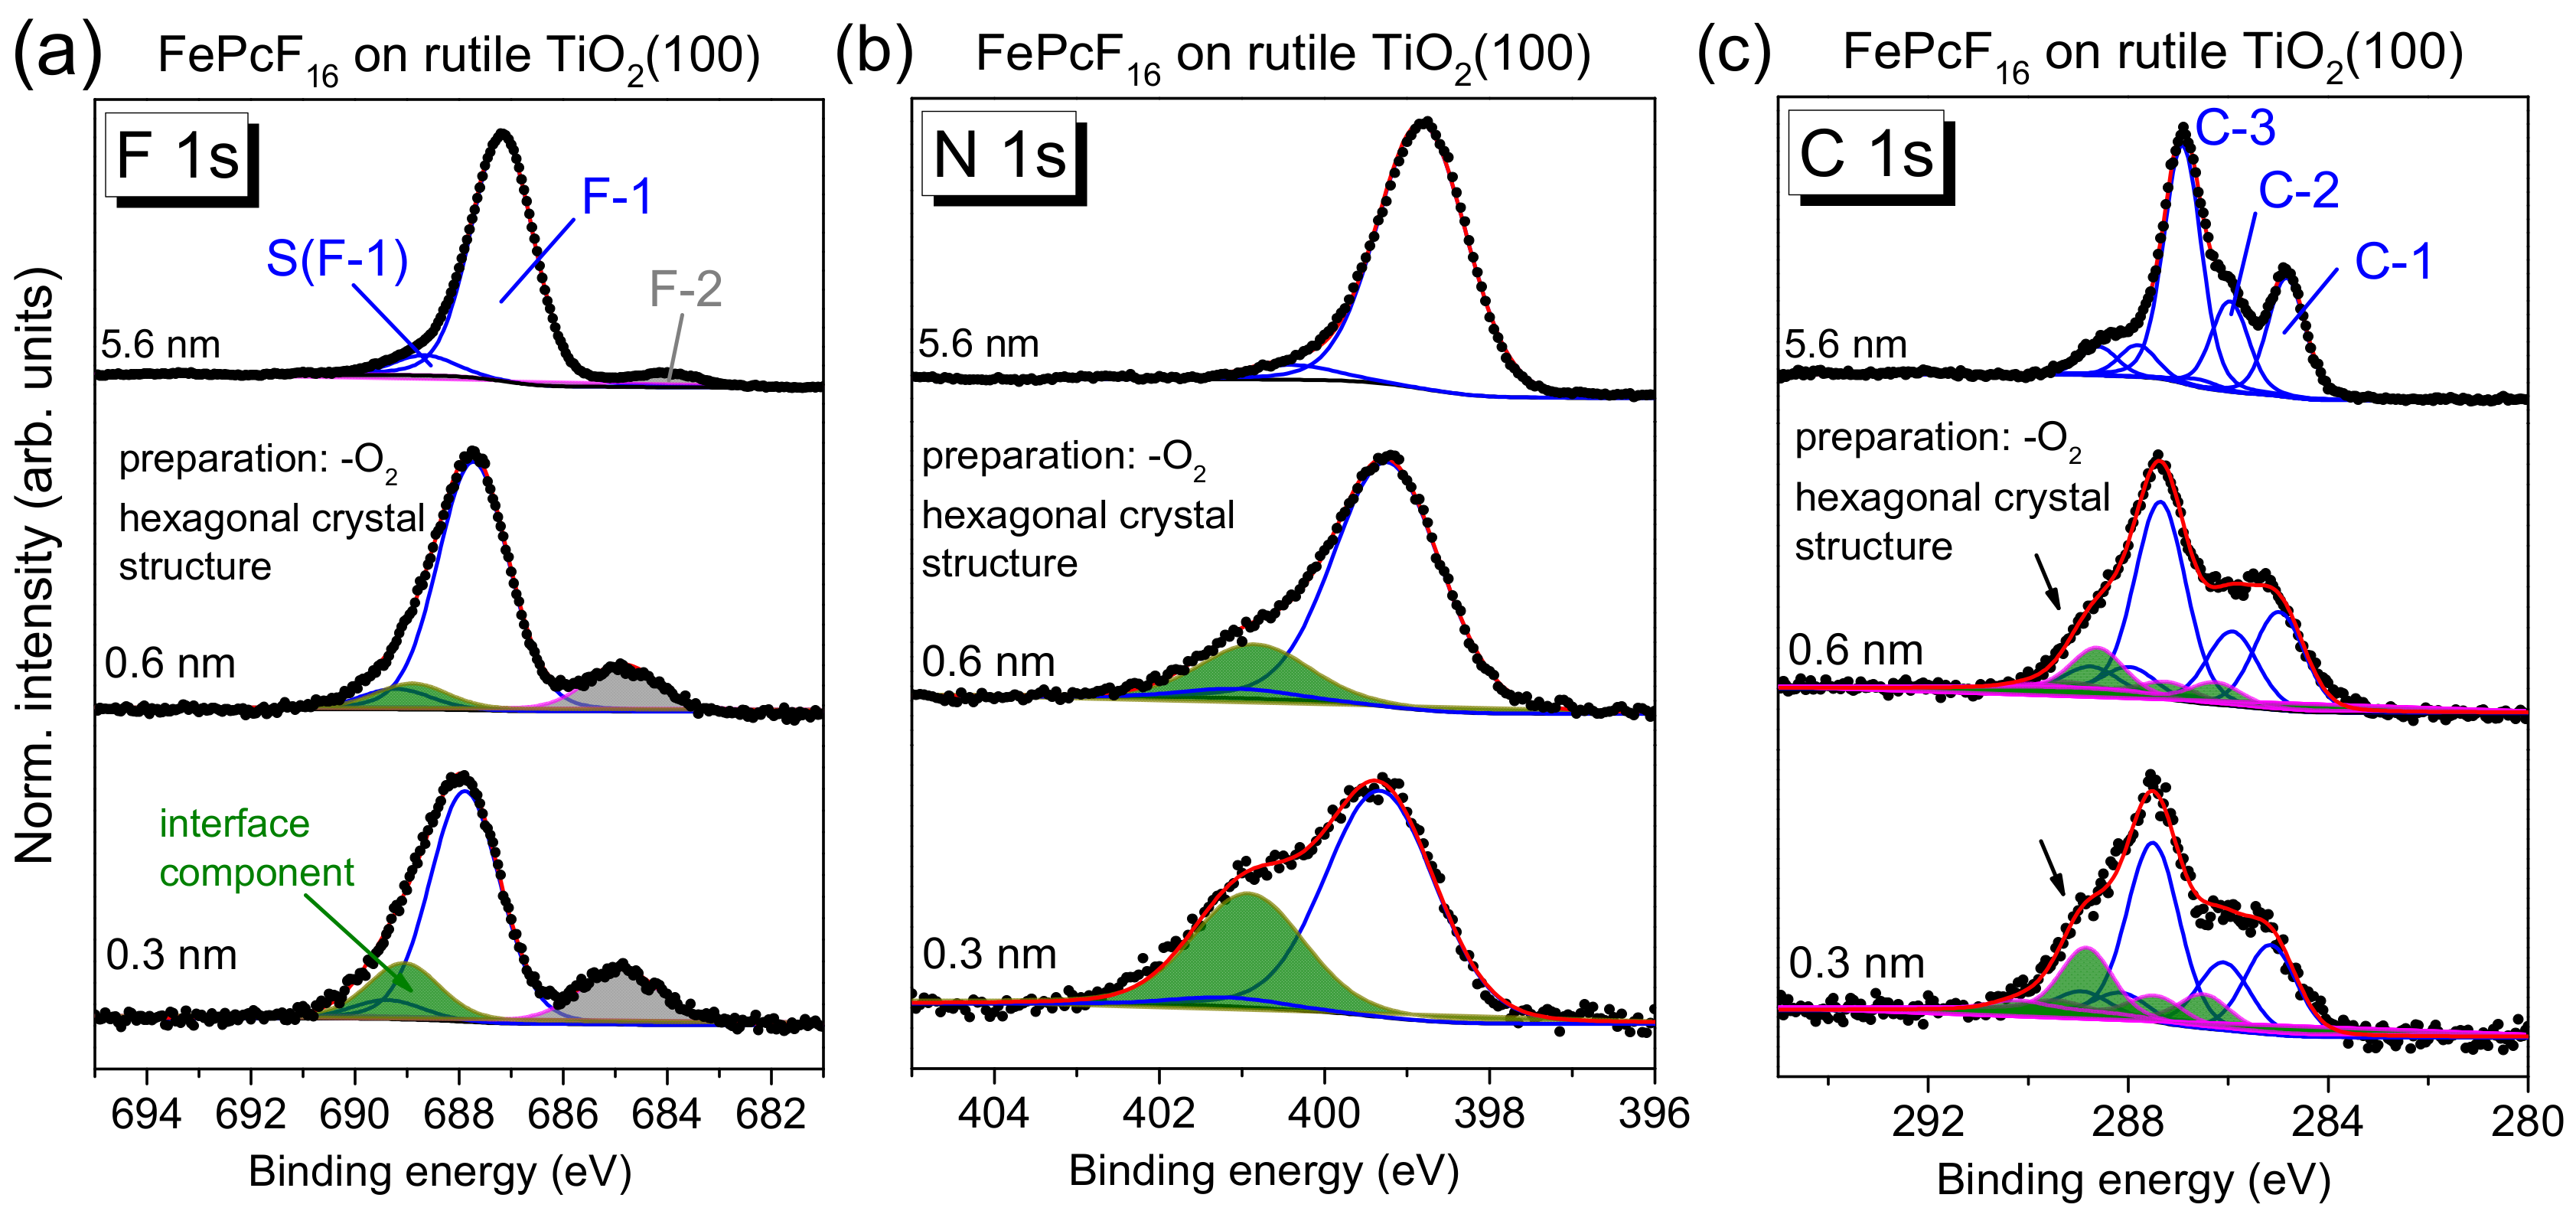
The core-level spectra of FePcF
16 in
Figure 13 (F 1s (a), N 1s (b), and C 1s (c)) show distinct changes with film thickness—in contrast to FePcF
16 on rutile TiO
2(100) prepared in the presence of oxygen (
Figure 11). The corresponding Fe 2p spectra are shown in
Figure S8. The broad multiplet structures of the Fe 2p spectra, which may depend also on the (thickness-dependent) arrangement of the FePcF
16 molecules in thin films [
55,
56], hamper, however, a more detailed analysis of these spectra.
Compared to FePcF
16 on rutile TiO
2(100) prepared in the presence of oxygen (
Figure 11), the N 1s spectra in
Figure 13 show distinctly more intense interface components (green peaks in
Figure 13b) for low coverages at a binding energy of 401.0 eV, indicating that more molecules undergo a strong interaction at this interface. The relative intensity is 16.0% and of 31.4% for 0.6 and 0.3 nm thick films, respectively. For the N 1s peak fit, a thickness independent of N 1s satellite intensity was assumed. All fit parameters of spectra shown in
Figure 13 are summarized in
Tables S10–S14.
Analogously to N 1s, the peak fit of F 1s spectra reveals an interface component at higher binding energy with respect to the main peak (green component in
Figure 13a). In addition, an interface component is visible at about 685 eV in
Figure 13a (gray). The binding energy of this component in the range of Ti-F surface fluorides [
57,
58]. Therefore, the presence of this component may indicate the breaking of some C–F bonds of FePcF
16 at the interface and the formation of new bonds with the TiO
2 substrate. As a consequence, a covalent bond between the phthalocyanine and the substrate or a new C–H bond might be formed.
Also, changes of the shape of C 1s spectra with decreasing film thickness are clearly visible in
Figure 13. Whereas in the thicker film (5.6 nm), the three components (labeled C-1, C-2, and C-3) and the corresponding satellites (cf.
Figure 11) are well resolved, at lower coverages, additional intensity appears at higher BE (see arrows in
Figure 13c). However, in contrast to N 1s spectra, the introduction of a single interface component accompanied by a broadening of all components is not sufficient to describe the spectra. Therefore, we applied a similar model, as reported for FePc on (reactive) TiO
2(110) [
11]. In this model, the C 1s signal has contributions from two types of FePc, assigned to first- and second-layer molecules [
11]. In a similar manner, we describe the C 1s spectra of the 0.3 and 0.6 nm coverages in
Figure 13c by two sets of spectra, the first with a binding energy similar to the 5.6 nm thick film and the second with a binding energy shifted to higher values (green peaks). Both the binding energy of all components relative to the main component and their relative intensities were kept constant for both sets of spectra (fitting parameters summarized in
Tables S11–S13). Compared to the spectra of thicker films in
Figure 11c and
Figure 13c, the relative energies of the components are slightly different, which might be due to a different charge distribution for molecules directly at the interface. The total relative intensity of the green (energetically shifted) components in
Figure 13c is 25% and 17% for the coverages of 0.3 and 0.6 nm, respectively. The energy shift is 1.2–1.3 eV with respect to the main spectrum (blue curves in
Figure 13c). Thus, the C 1s signal for lower coverages can be described by contributions from two types of FePcF
16 molecules: Type I is almost unaffected at the interface, whereas the spectrum of type II is shifted towards higher binding energies.
The origin of such energetic shifts in C 1s spectra to higher binding energy could be (1) a chemical shift due to oxidation of the corresponding atom(s) or (2) a shift of the energy levels of the organic semiconductor relative to the reference (Fermi) level of the spectrometer due to a different energy level alignment at the interface to the substrate. Since a chemical shift to more than 1 eV higher binding energy would imply an oxidation of the corresponding species by about one oxidation number, scenario (1) seems to be unlikely. Also, the binding energies of all carbon species of type II FePcF
16 molecules are shifted by similar values, pointing to a shift of the reference level (scenario (2)). The different energy level alignment for type II FePcF
16 molecules might be caused by a distinct (integer) charge transfer from the substrate to the molecules, accompanied by the occupation of formerly unoccupied orbitals (i.e., the LUMO) of the molecule. This might also explain the presence of the intense interface component in N 1s and F 1s spectra (green components in
Figure 13a,b) at 1.6 eV and 1.15 eV higher binding energy with respect to the main components, respectively. These interface peaks might contain contributions of type II FePcF
16 molecules, shifted to higher binding energy. The fact that the green components in
Figure 13a–c do not dominate the spectra demonstrates that not all molecules are involved in the stronger interaction. Further, the essentially similar C 1s peak shape of type I and type II FePcF
16 molecules indicates that the chemical structure of the molecule at the reactive sites is almost the same as on non-reactive sites, even if some of the C–F bonds are broken (cf.
Figure 13a).


 and
and 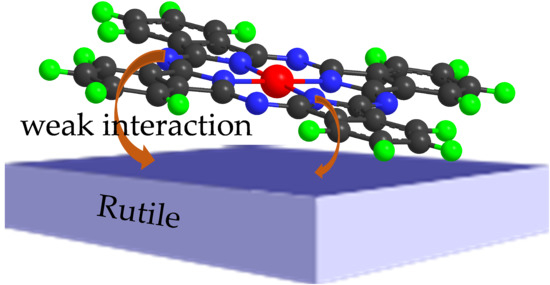