1. Introduction
Avocado represents a billion-dollar industry, the projection of the apparent
per capita consumption of avocado sets the top six world importers of avocado to be US, Netherlands, France, United Kingdom, Spain, and Canada with 3.64, 1.62, 2.10, 2.21, 2.30, and 2.55 kg in a given year, respectively [
1]. Avocado exports have made some countries like Mexico, Dominican Republic, Peru, Chile, Colombia, and Costa Rica increase their cultivated area [
1].
The topmost exporter countries have directed their offer to destinations such as the US, Europe, and Asia, especially China [
2], where import growth is in the order of 250%, from 154 tons in 2012, to 25,000 tons in 2016 [
3,
4]. For example, Costa Rican avocado harvested area was estimated at 1 888 ha in 2014 and increased to 3092 ha in 2017, which represents 845 tons of Costa Rican avocado (or 448900 USD) [
5].
As a complex matrix, performing chemical analysis on the avocado flesh presents an additional difficulty. The ripe avocado fruit has a firm, oily, and yellow to light green colored mesocarp that contains both fat-soluble vitamins and carotenoids associated with other lipids [
6]. Usually, both types of analysis have to be performed separately using different chromatographic conditions altogether, which represents an additional expense, both economic and in terms of labor. Analyzing both types of fat-soluble compounds is relevant, especially in fruits such as avocado in which there is evidence that carotenoid absorption might be improved by the addition of avocado and avocado oil [
7,
8,
9].
Interestingly, the Association of Official Analytical Chemists (AOAC) Official Methods of Analysis (OMA
SM) does not have any method established for neither fat-soluble vitamins nor carotenoids in fruits. Several papers have already annotated the relevance of including avocado in the diet as it has been related to health benefits [
10,
11,
12,
13,
14,
15,
16,
17,
18,
19]. Previously, another report analyzed carotenoid content in avocado using spectrophotometry [
20]. A later report has used a similar approach to measure total carotenoid content [
21]. On another hand, a research group has analyzed avocado pigments in oil [
22] and tissue [
22,
23] using HPLC coupled with a photodiode array detector using a triphasic organic solvent gradient. Carotenoids in avocado seed have also been described [
24,
25].
The application of chromatography and mass spectrometry to carotenoid analysis in fruits is not new [
23,
26,
27]. However, few papers have been dedicated solely to the study of both fat-soluble and carotenoid content in avocado fruits. For example, research assayed both types of compounds (i.e., carotenoids and tocopherol) using two independent chromatographic techniques [
28].
Among the papers dedicated to assessing specifically carotenoids or vitamins in avocado, the most relevant include advantages such as that most researchers use acetone (a versatile and low boiling point solvent) during primary extraction [
22,
23,
28,
29] and ethyl ether or hexane after saponification [
22,
23,
29]. For saponification at room temperature, the use of 2,6-di-
tert-butyl-4-methylphenol, and nitrogen flushing seems to be a norm [
28,
29], thus protecting the target analytes. Diversity of carotenoids studies is ample (including epoxides [
28], isomers of carotene [
20], chlorophylls [
22], phytoene [
23]). Mobile phases are usually simple and environmentally friendly [
22,
23,
29], which include methanol, water, methyl
tert-butyl ether, and ethyl acetate. Yano and coworkers were able to apply their method to 75 and 15 different fresh and processed fruits, respectively [
23]. Solid-phase extraction has been used to reduce interferences [
22]. Mass spectrometry has been used to recognize unidentified compounds [
20,
28].
Disadvantages of these methods include the presence of water in the mobile phase (which increases mobile phase polarity), several approaches exhibit some issues with chromatographic resolution for some of the signals [
28,
29] and in some cases saponification time [
29], base concentration [
29], and chromatographic run [
23] are excessive or the identification of compounds is based on light absorption [
20,
22,
29]. Finally, vitamin analysis of the fruit is scarce at best [
11,
28].
Lastly, very little information has been gathered regarding varieties of Costa Rican avocados, proximate analysis, mineral content, and some vitamins have been explored [
30]. Some papers have also focused on standing out differences between avocado varieties [
21,
28], including varieties of Guatemalan race (e.g., Hass [
11] and Nabal [
20]), as avocadoes originated from New Zealand [
22], California [
28], and Mexico [
29] and those commercially available from Israel [
20] and Japan [
23].
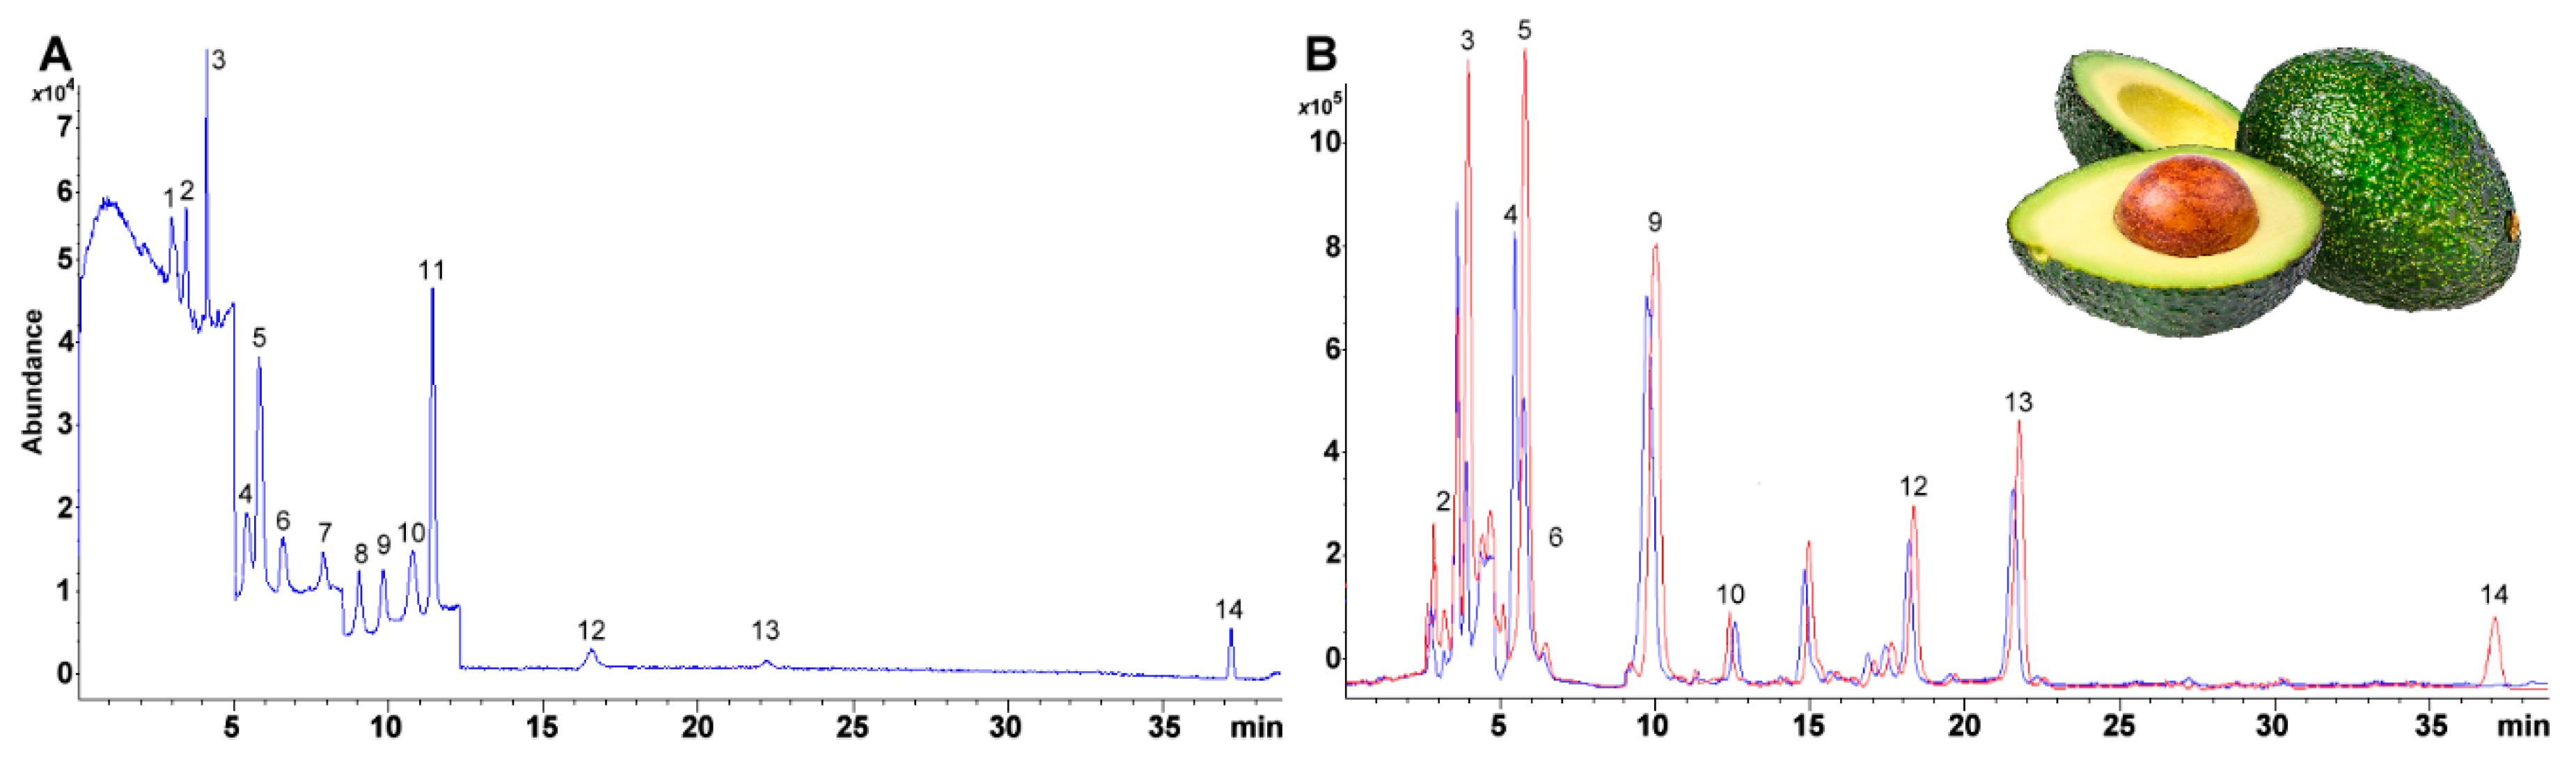
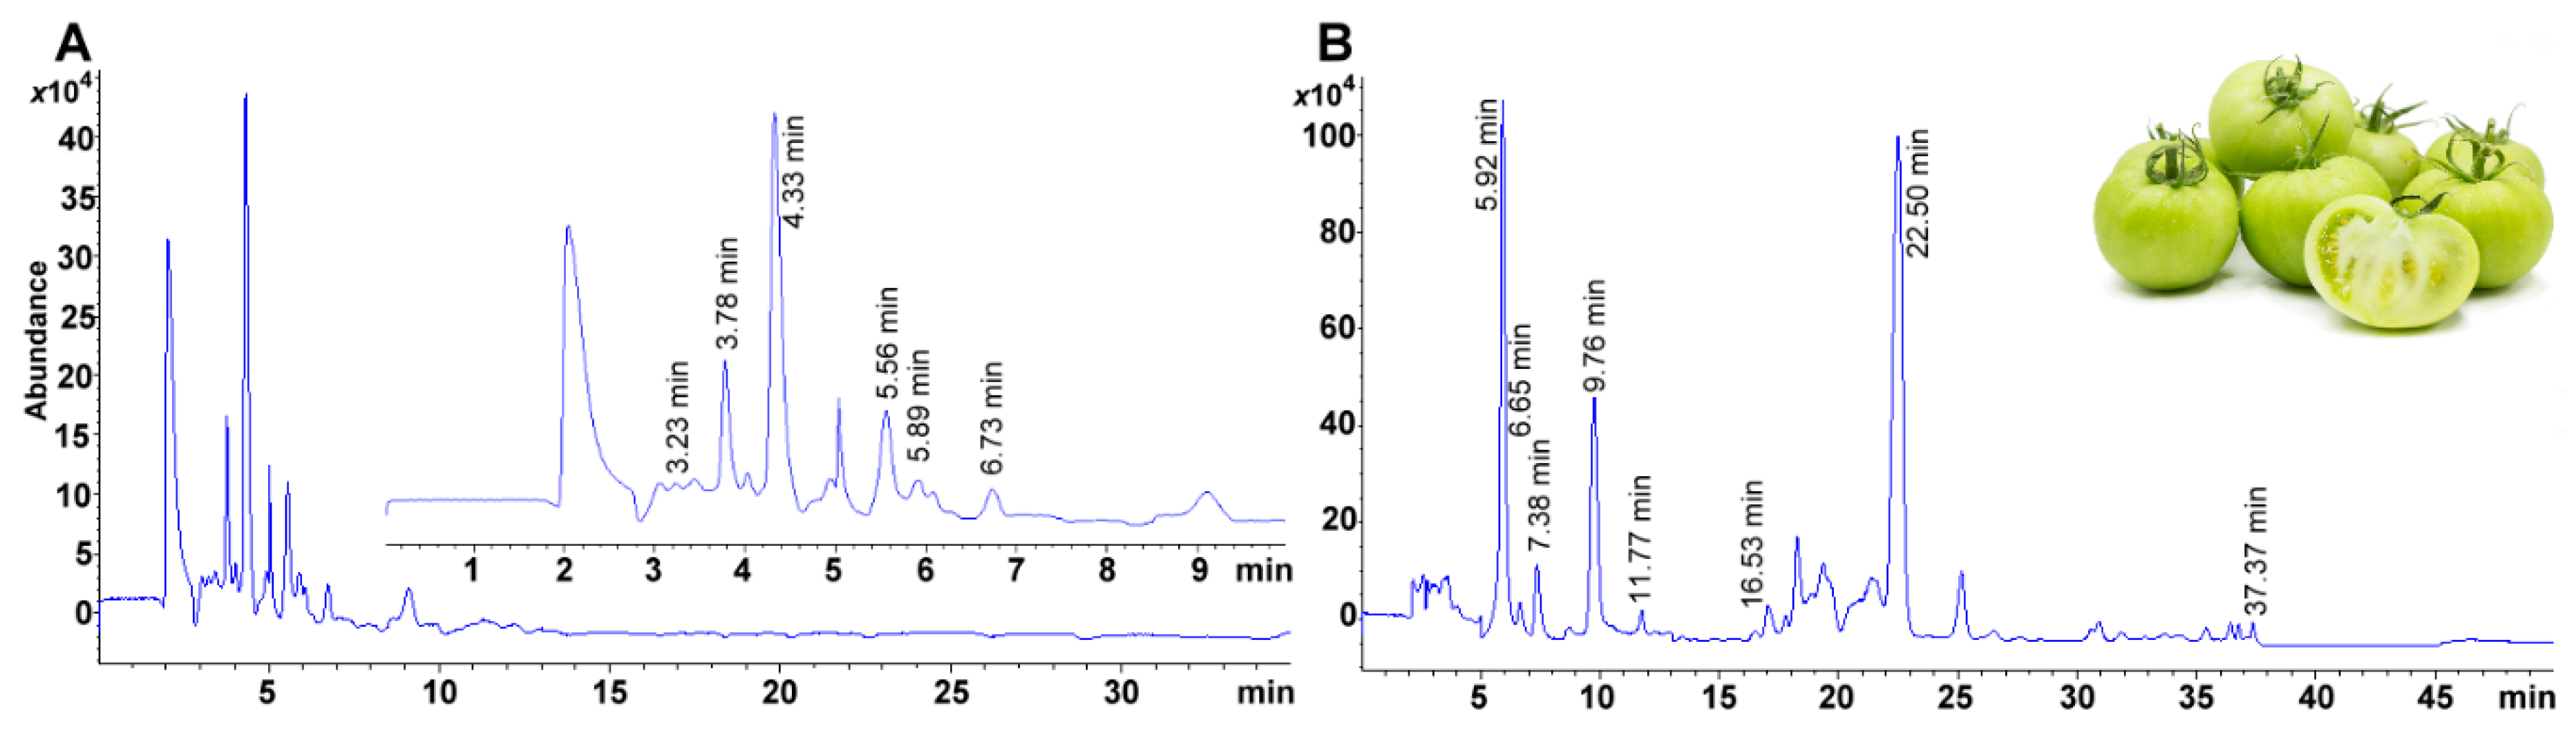
Herein, we report a liquid chromatography and single quadrupole mass detection (LC/MS) based method using a C30 column and methanol and methyl tert-butyl ether to assay and quantitatively separate both fat-soluble vitamins (vitamin A acetate and palmitate, Vitamin D2 and D3, vitamin K1, α-, δ-, and γ-vitamin E isomers) and carotenoids (β-cryptoxanthin, zeaxanthin, lutein, β-carotene, and lycopene) simultaneously in avocado fruit.
3. Materials and Methods
3.1. Reagents
tert-Butyl methyl ether (99%, catalog 34875, MTBE, chromatographic grade), methanol (≥99.9%, catalog 646377, MeOH, chromatographic grade) and potassium hydroxide (ACS reagent, catalog 1050210250) were acquired from Merck Millipore (Burlington, MA, USA). Retinyl acetate (catalog 46958), retinyl palmitate (catalog 46959-U), cholecalciferol (catalog C9774), ergocalciferol (catalog 47768), 3-phytylmenadione catalog (95271), α-tocopherol (catalog 47783), δ-tocopherol (catalog 47784), γ-tocopherol (catalog T1782), tocopherols (mixed, W530066), lutein (catalog 071068), β-carotene (catalog C4582), β-cryptoxanthin (≥97%, catalog C6368), zeaxanthin (catalog 14681), all-trans-astaxanthin (catalog 41659), and lycopene (catalog 75051) from Sigma-Aldrich (unless stated otherwise, all standards were of analytical grade, St. Louis, MO, USA). Chloroform (ACS reagent, catalog 366919), ethanol (200 proof, ACS reagent, ≥99.5%, 459844), 2-propanol (HPLC Plus, 650447), pyrogallol (ACS reagent, ≥99%, catalog 16040), and sodium sulfate (anhydrous, granular, free-flowing, Redi-Dri™, ACS reagent, ≥99%, catalog 798592) were also acquired from Sigma-Aldrich.
3.2. Sample Treatment and Preparation
Three different varieties of avocado collected from Costa Rica farms, two varietals from low and one highland, i.e., Simmonds (from 0 to 1000 m amsl), Guatemala (from 600 to 1500 m amsl), and Hass (from 1000 to 2000 m amsl), respectively [
30,
56]. Three batches of each variety were analyzed, each with eight days of maturation. A previously homogenized subsample (2 g) of freeze-dried material was weighed, and chloroform (20 mL, ACS reagent, Sigma-Aldrich 366919) was added. After that, the mixture was stirred continuously (30 min) using an Ultraturrax
® (T25, at 7500 rpm, IKA Works Staufen, Germany). The remnant suspension was centrifuged, and the supernatant liquid recollected. The extraction procedure was repeated twice. The solvent was evaporated using a rotary evaporator (Multivapor™ P-6, Büchi, Flawil, Switzerland) until the lipid fraction was attained, which was then processed immediately for saponification.
3.3. Optimization of Saponification Conditions
An additional experiment was performed to enhance the recovery of the analytes of interest during the saponification reaction. The experimental design consisted of maintaining constant reaction time (1 h), the concentration of radical protection agent (0.1 g/100 mL), and the extraction solvent (hexane). Base concentration was contrasted (1 vs. 2 mol KOH L ethanol
−1 [
43] for each temperature), and the temperature was progressively increased (60, 80, and 95 °C). The conditions that rendered the most recoveries were selected to process the samples.
3.4. Sample Saponification
A small portion of the fat fraction (0.3 g) was weighed and quantitatively transferred to a conical centrifuge tube (50 mL, CLS430829, polypropylene, Corning®, New York, USA). Afterward, KOH in ethanol (1 mmol mL−1) and containing pyrogallol (0.1 g/100 g) was added (10 mL). The mixture was let to saponify (during 1 h at 80 °C) in a heat bath (1229U55, Boekel Scientific, Feasterville, PA, USA). The resulting mixture was let to cool to room temperature and transferred to a Squibb separatory funnel (PYREX®, 250 mL, Corning® 6402). The above ethanol/aqueous layer was subjected to a liquid-liquid extraction using hexane. The extraction procedure was repeated twice. The totality of the organic solvent layer was then collected and filtered through sodium sulfate (used as a desiccant). The resulting solution was evaporated to dryness under a nitrogen flow (Ultra-High Pure Nitrogen was purchased from Praxair Technology Inc., Danbury, Connecticut, USA) and then reconstituted with MTBE (1 mL) and 2-propanol (1 mL) used at the start of the chromatographic separation and transferred to an HPLC vial (Agilent technologies, Santa Clara, CA, USA).
3.5. Stationary Phase and Selection of Chromatographic Conditions
The major obstacle in vitamin separation is the segregation of isomers. With this in mind, as a starter setup, we used a mobile phase based on MeOH and water using an eight carbon-based alkyl stationary phase (0.75 mL min
−1, Eclipse Plus C
8, 4.6 mm ID × 150 mm, 3 μm, Agilent Technologies). As the resolution was insufficient, a C
18 column was selected, and only flow was modified (1 mL min
−1, Eclipse Plus C
18, 4.6 mm ID × 150 mm, 3 μm, Agilent Technologies). Then we substituted the column for a C
30, removed water, and used a less polar solvent in acetonitrile and 2-propanol, reducing yet again the solvent flow (0.5 mL min
−1) (
Table 1). Finally, retaining a similar proportion of MeOH, we substituted acetonitrile and isopropanol for MTBE. The C
30 column was kept as it already had excellent capabilities reported for highly lipophilic compounds (e.g., carotenoids) [
39].
3.6. Chromatographic Conditions
All assays performed using an Agilent Technologies LC/MS system equipped with 1260 infinity quaternary pump (61311C), column compartment (G1316A), automatic liquid sampler modules (ALS, G7129A) and a 6120-single quadrupole mass spectrometer with electrospray ionization ion source (Agilent Technologies, Santa Clara, CA, USA). Gradient elution was used to separate all the compounds. The solvent gradient was optimized using MeOH (solvent A) and MTBE (solvent B), both acidified with formic acid (0.1 mL/100 mL). Solvent proportions were set as follows: at 0 min 80% A, at 5 min 80% A, at 7 min 73% A, at 15 min 62.5% A, at 20 min 62.5% A, at 30 min 45% A, at 35 min 10% A, at 40 min 10% A, at 45 min 80% A and 50 min 80% A. Flow rate was kept constant at 0.6 mL min−1. Injection volume was held at 10 μL. The column compartment was held at a temperature of 10.0 ± 0.8 °C. Considering the need for the separation of structurally similar compounds, a 30-carbon alkyl chain based chromatographic column was used to achieve the analytical separation (YMC Carotenoid, 4.6 mm ID × 150 mm, S-3 μm, YMC Co., Ltd., Kyoto, Japan).
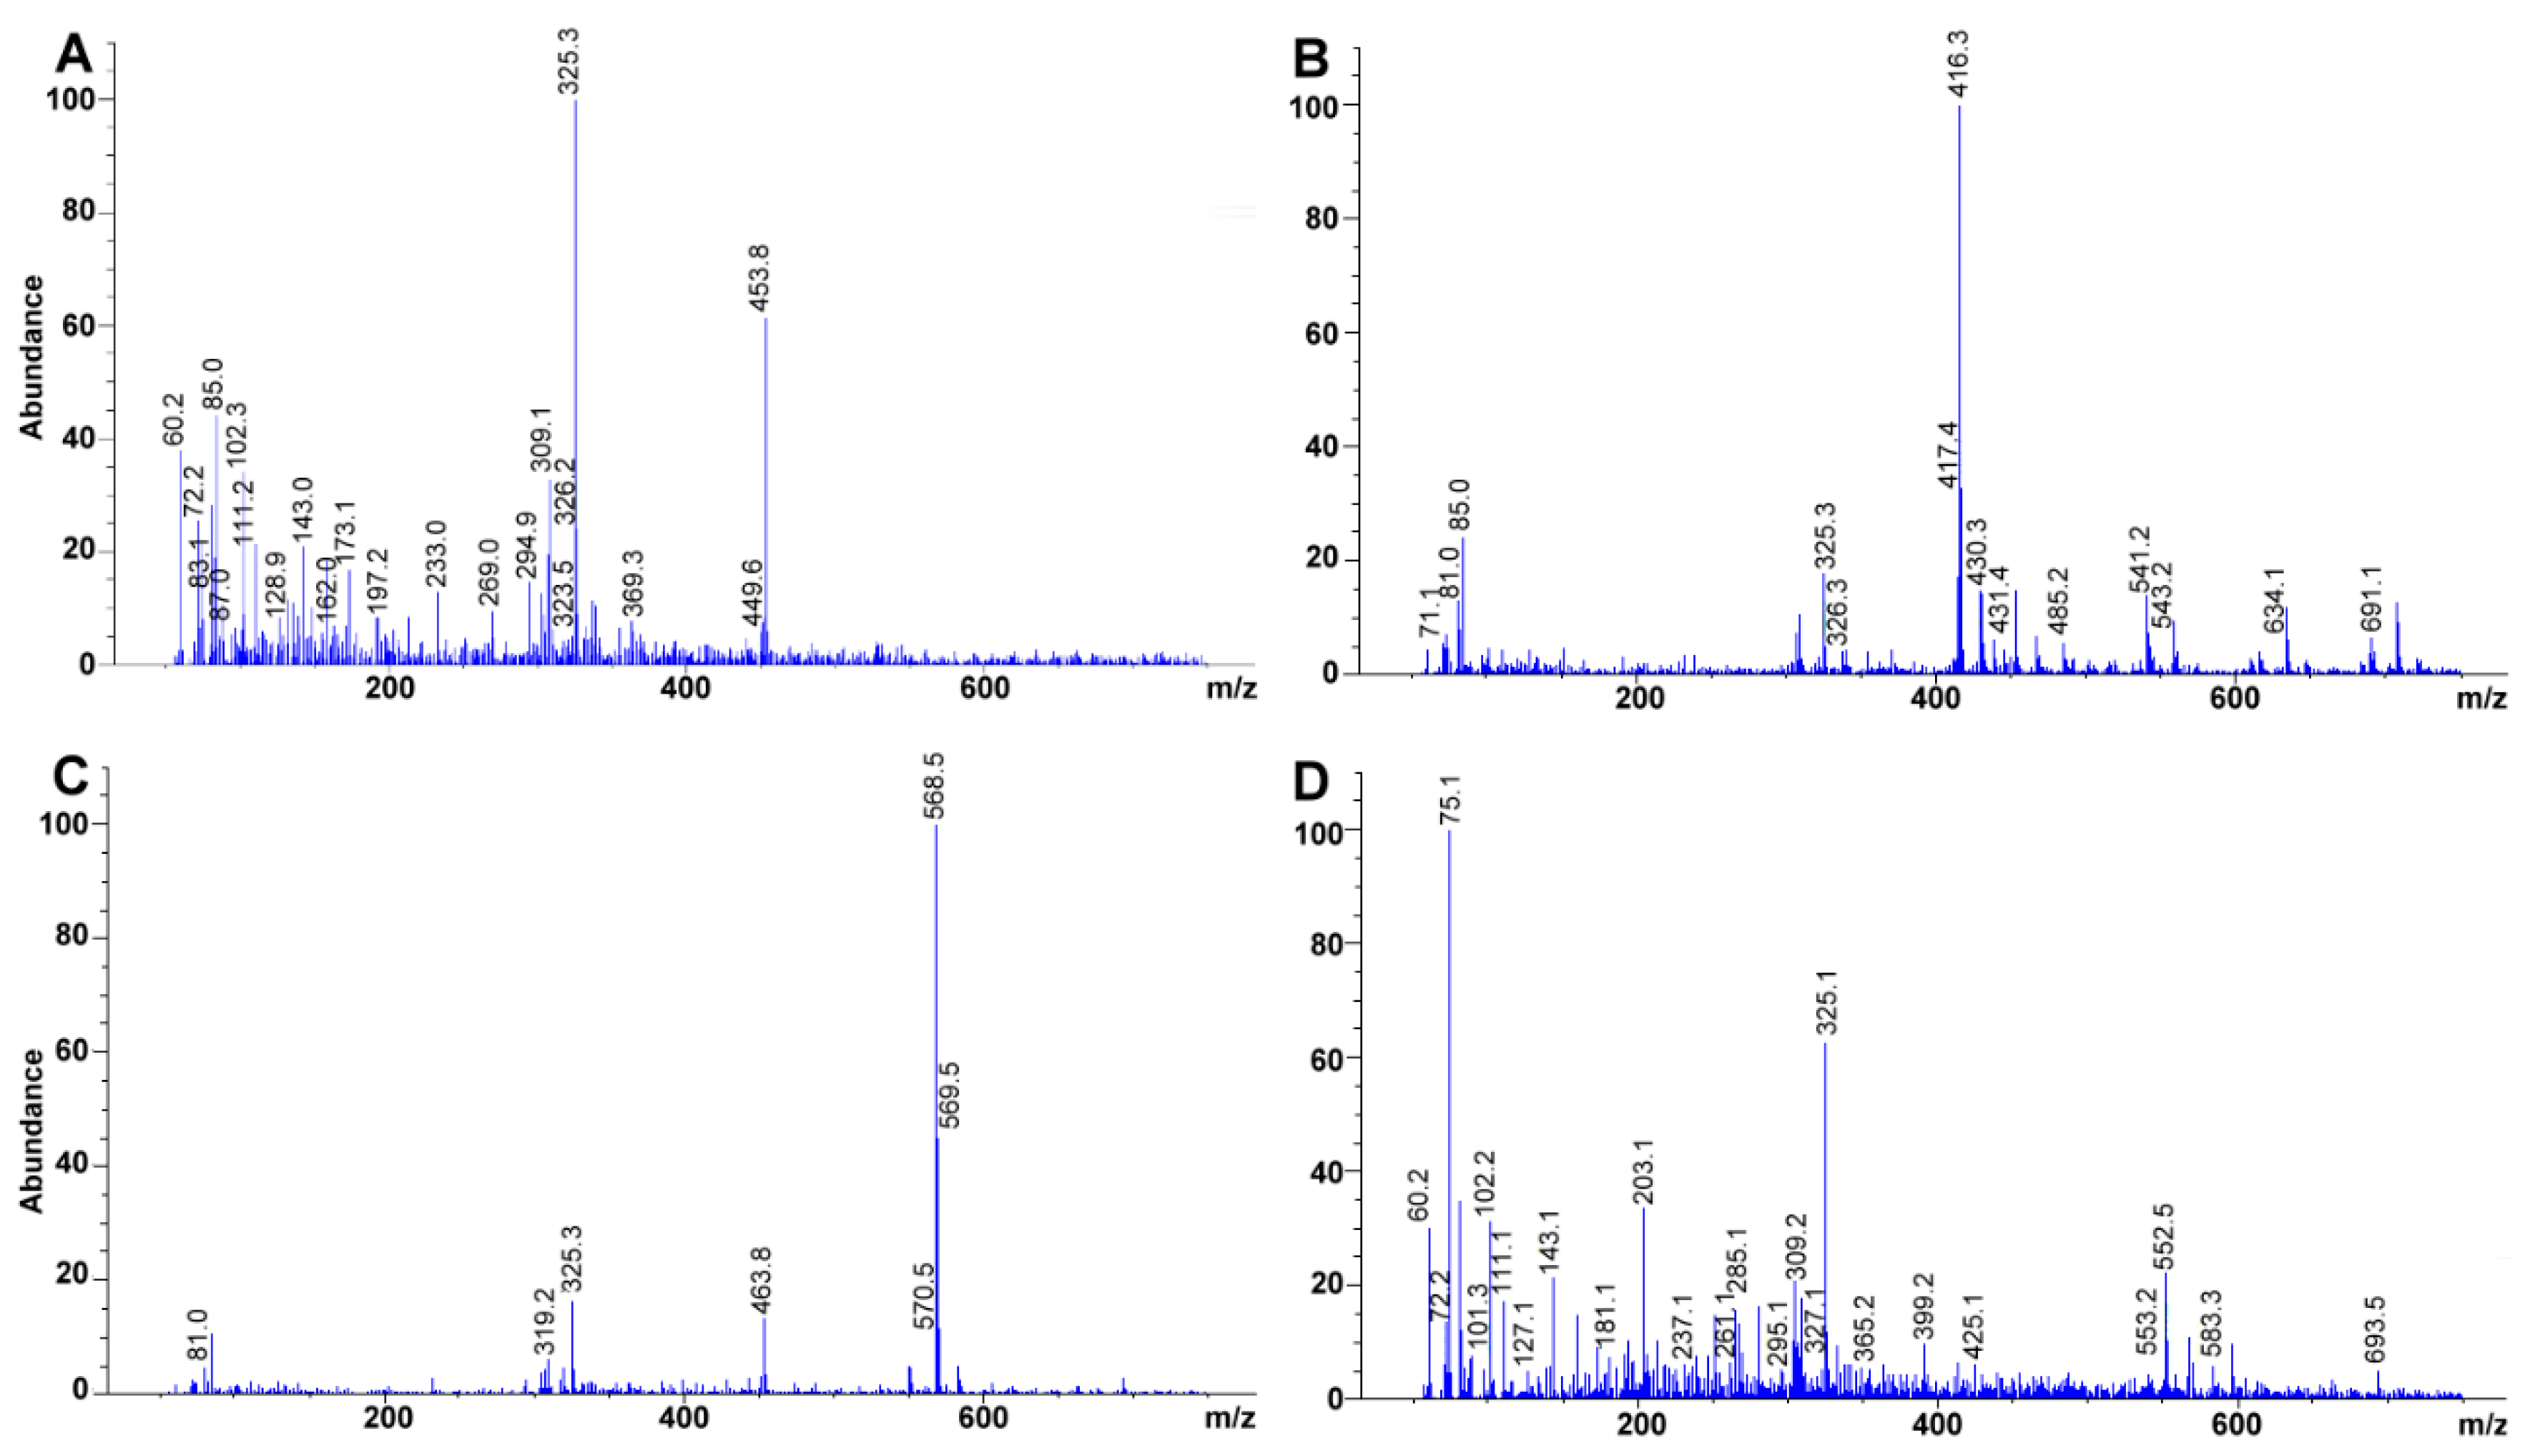
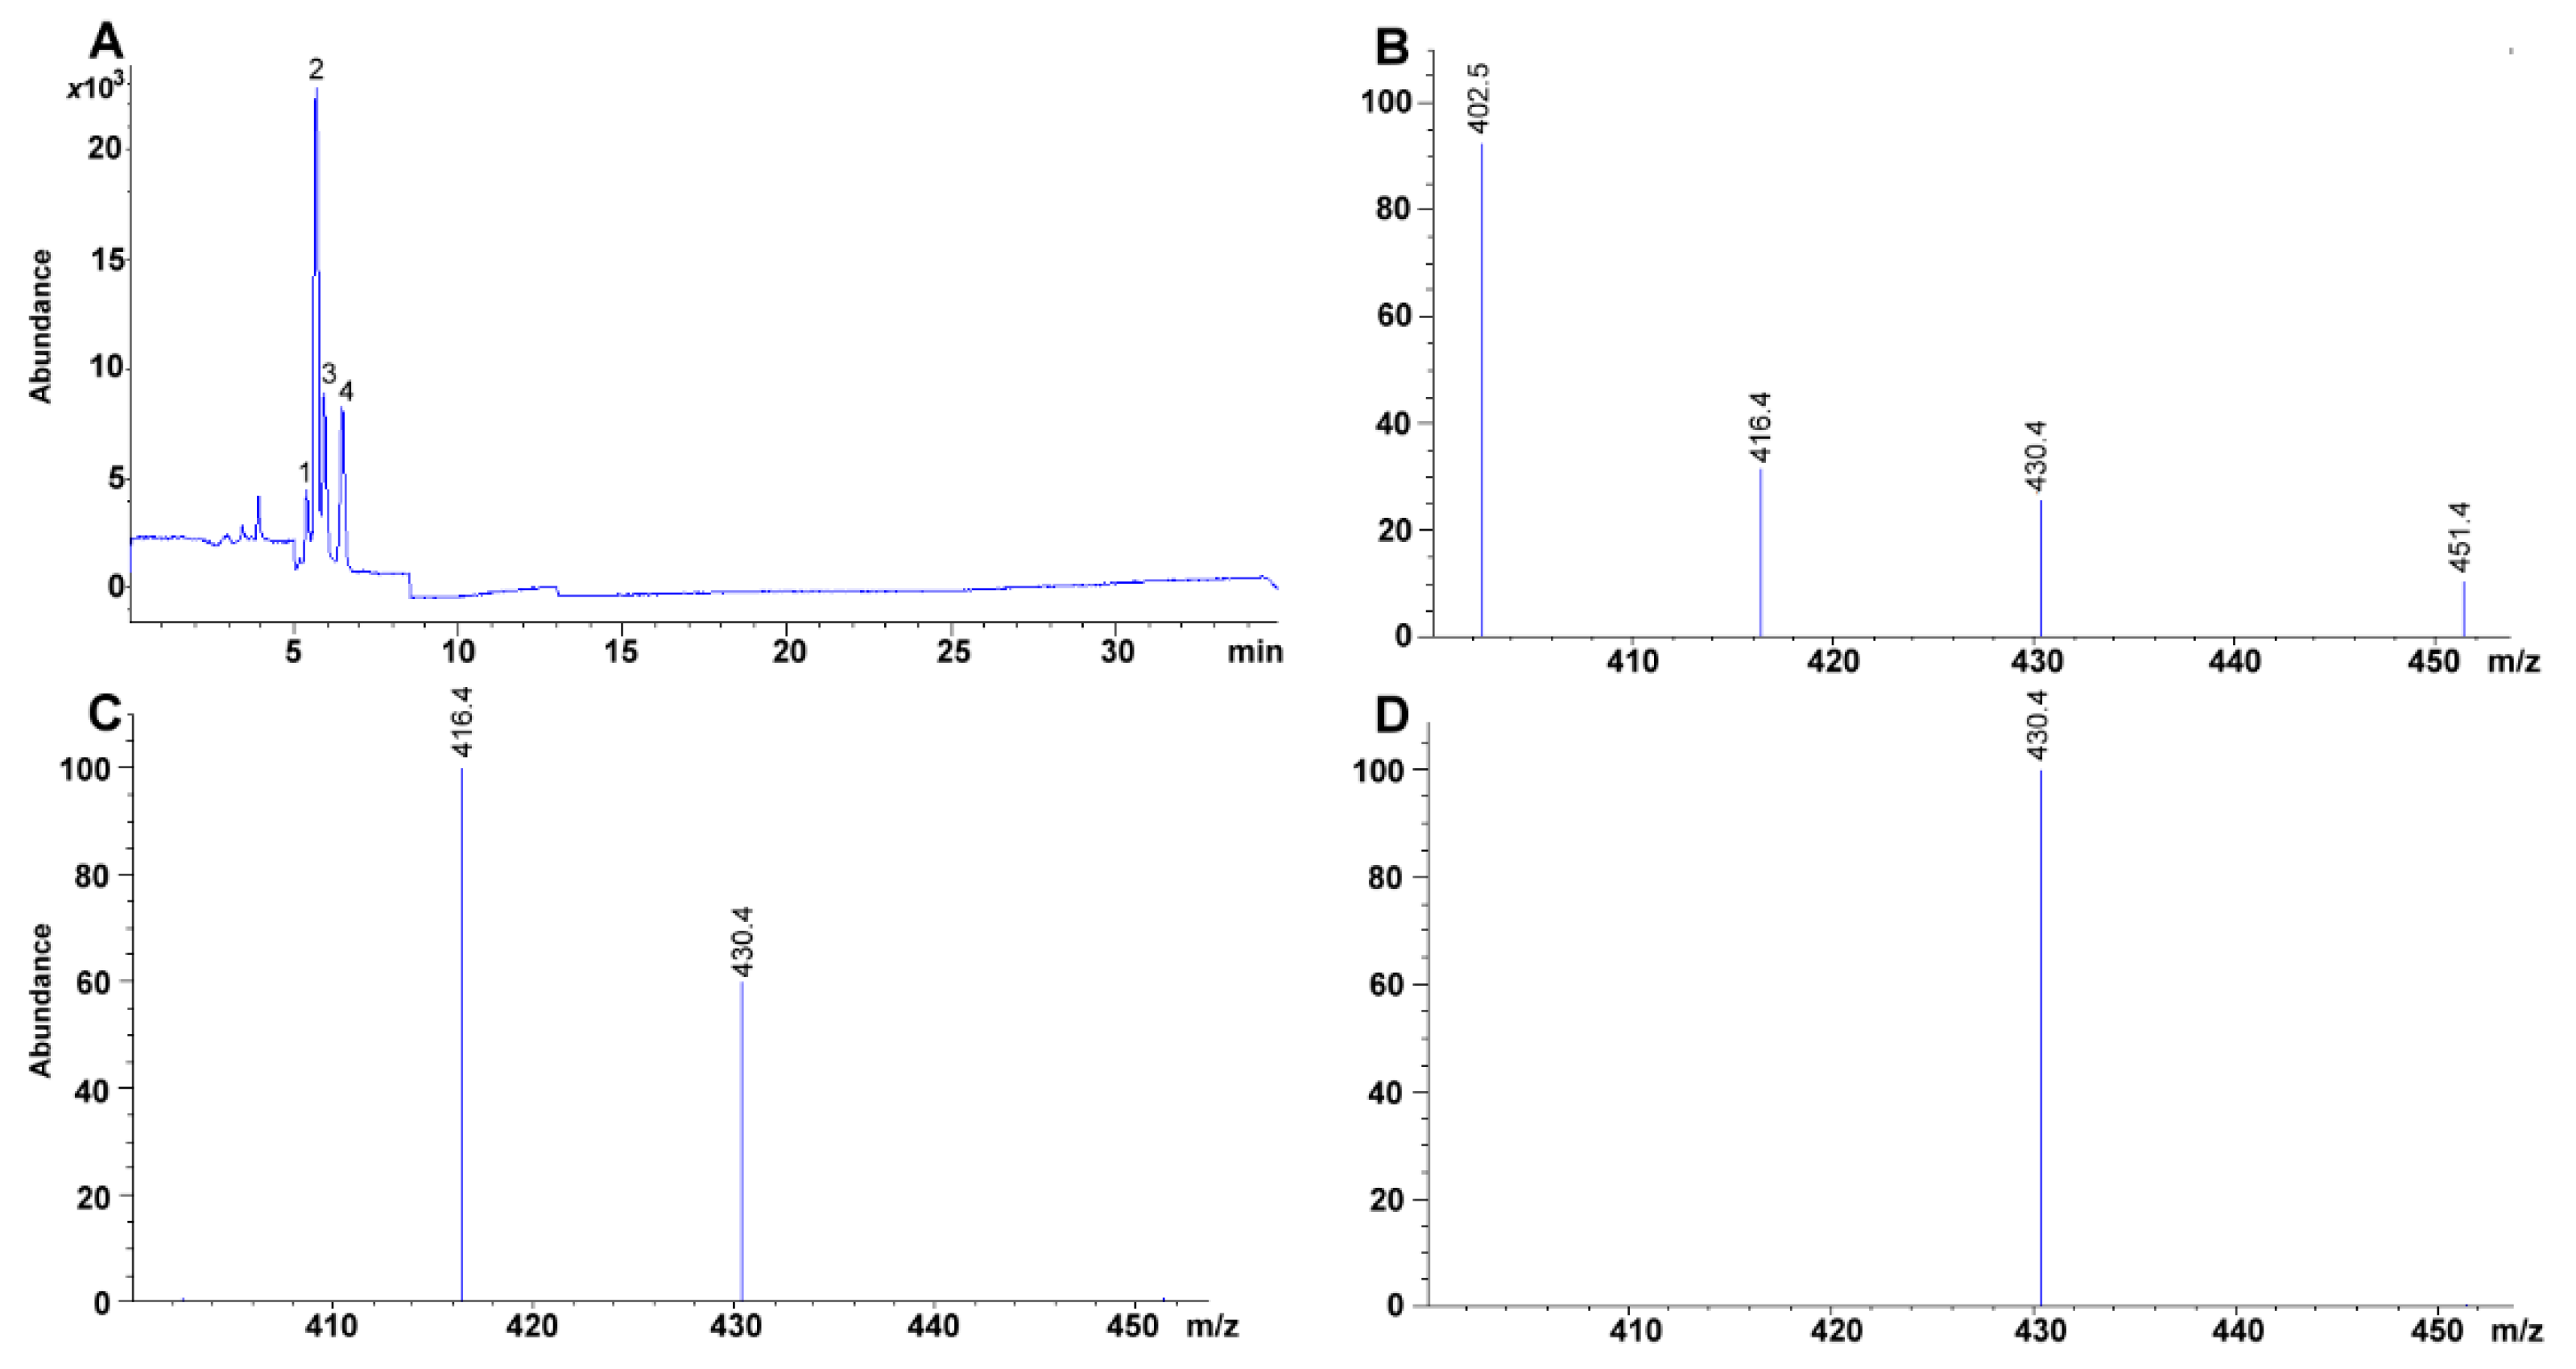
3.7. MS Detection System Conditions
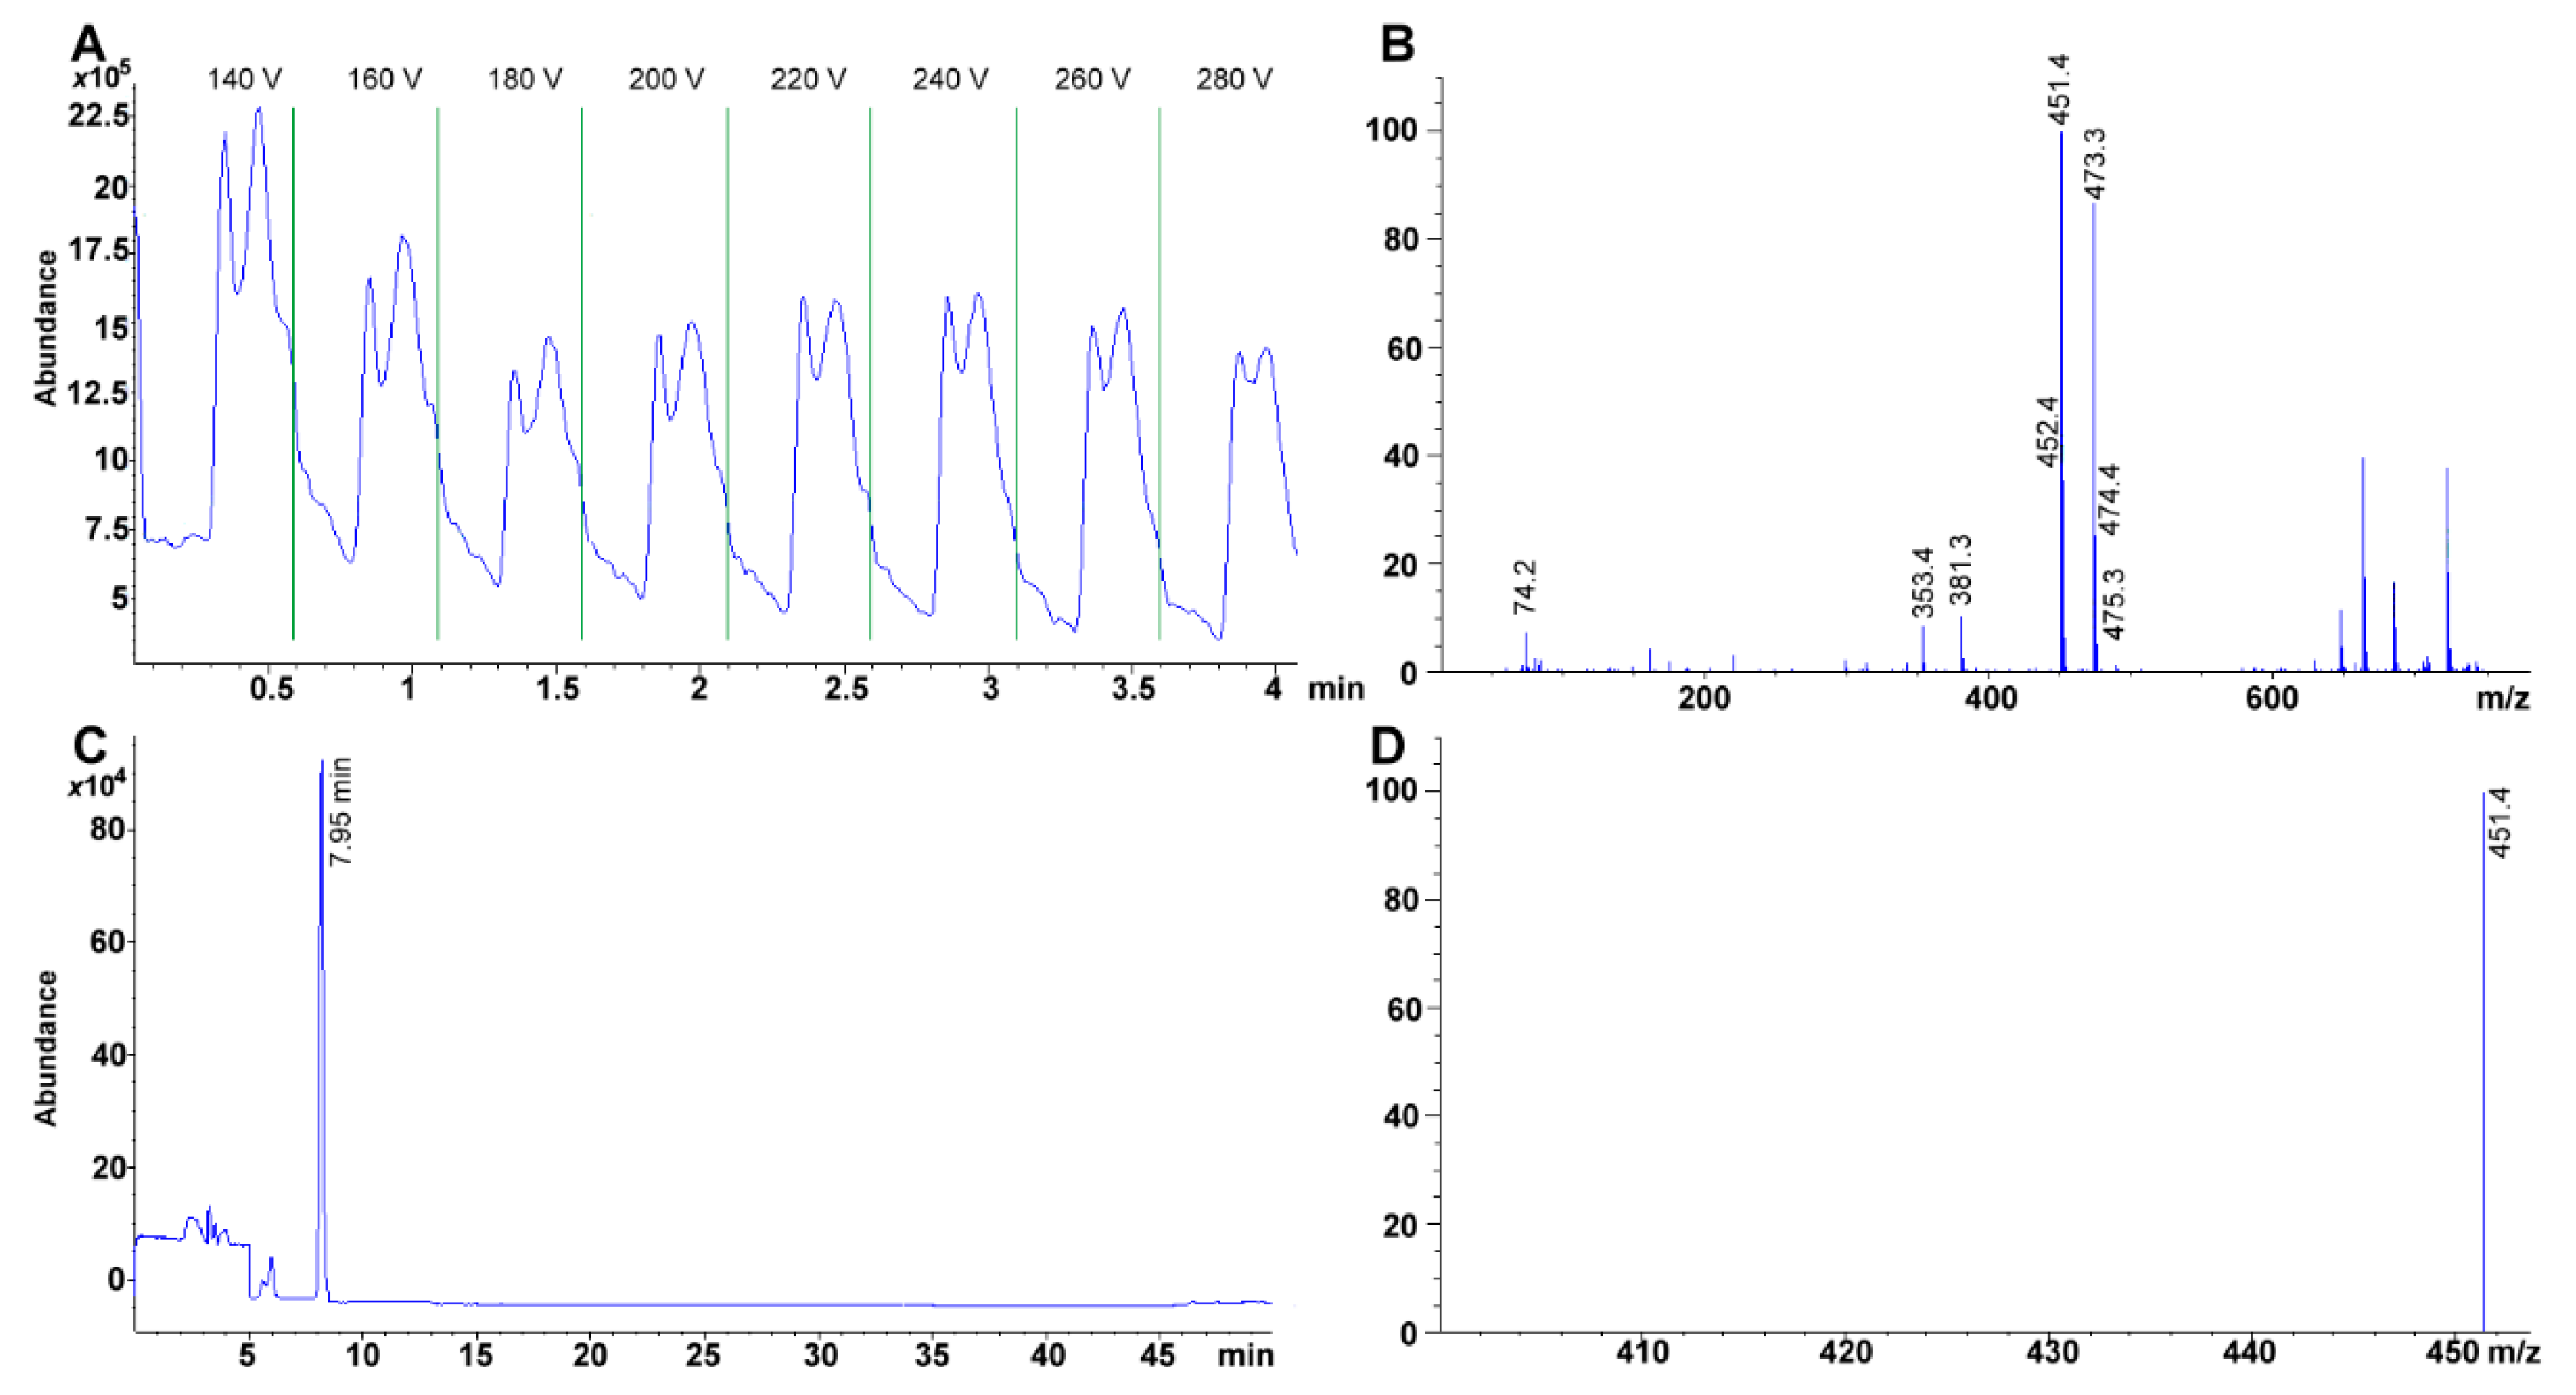
The fragmentor was initially cycled to assess the voltage (from 20 to 300 V) that rendered the highest sensitivity for the compounds; omitting column interaction (
Figure 6A). Afterward, total ion chromatographs (TIC) allowed us to obtain the MS spectra for each of the compounds (scan mode using a mass range and detector gain set to 50–750
m/z, and 10.00, respectively) (
Figure 6B,C). Each TIC was used to identify the molecular ion signal. Drying gas, nebulizer pressure, drying gas temperature, and capillary voltage was set, respectively, to 12.0 L min
−1, 50 psi, 350 °C, 4000 V for positive ion mode electrospray ionization (ESI
+). Selected ion monitoring was used to corroborate each compound identity, remove interferences and improve sensitivity (SIM mode with peak width and cycle time set to 0.05 min, and 0.30 s cycle
−1, respectively) (
Table 2,
Figure 6D).
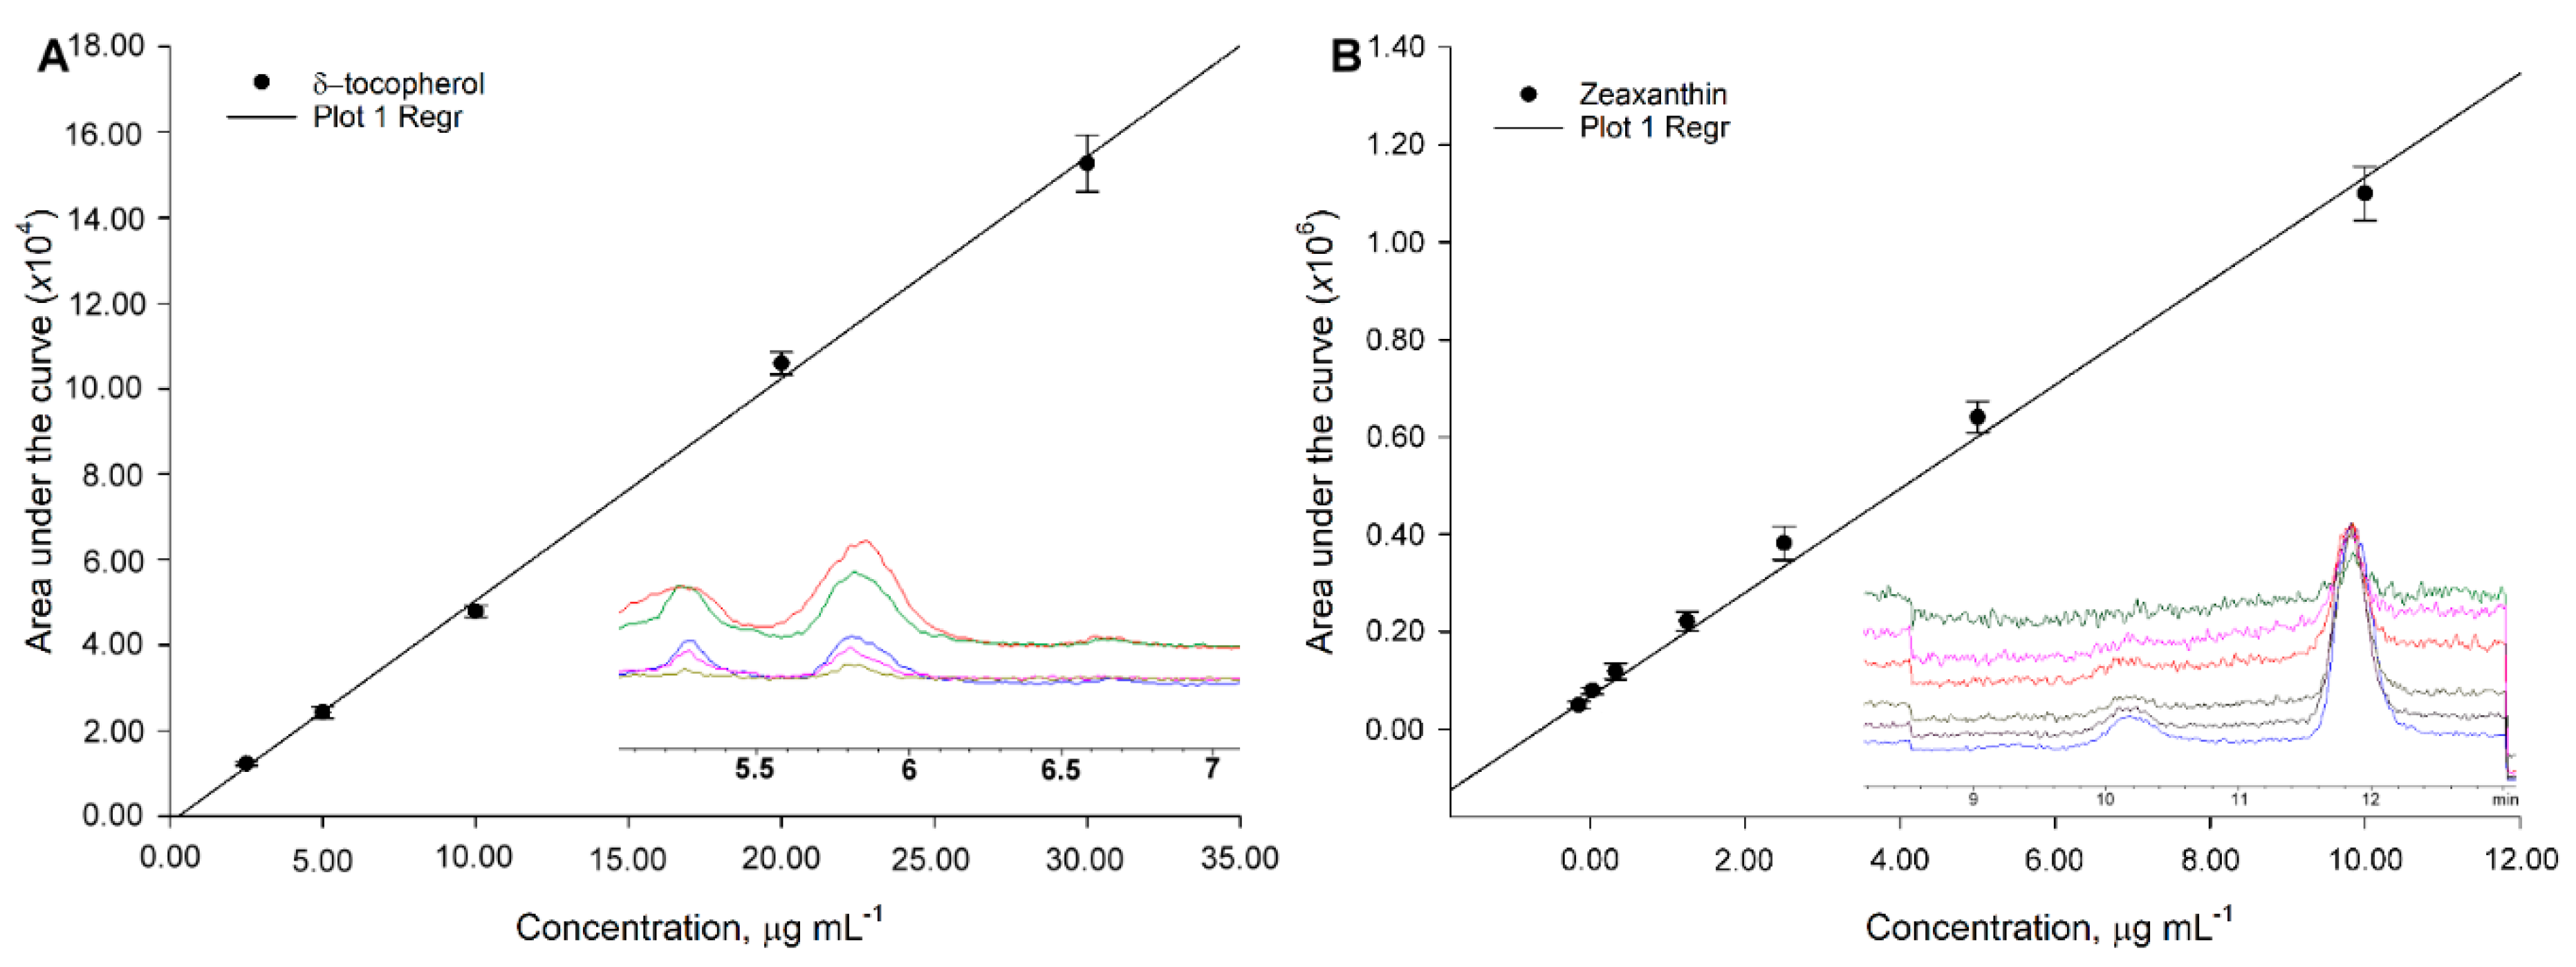
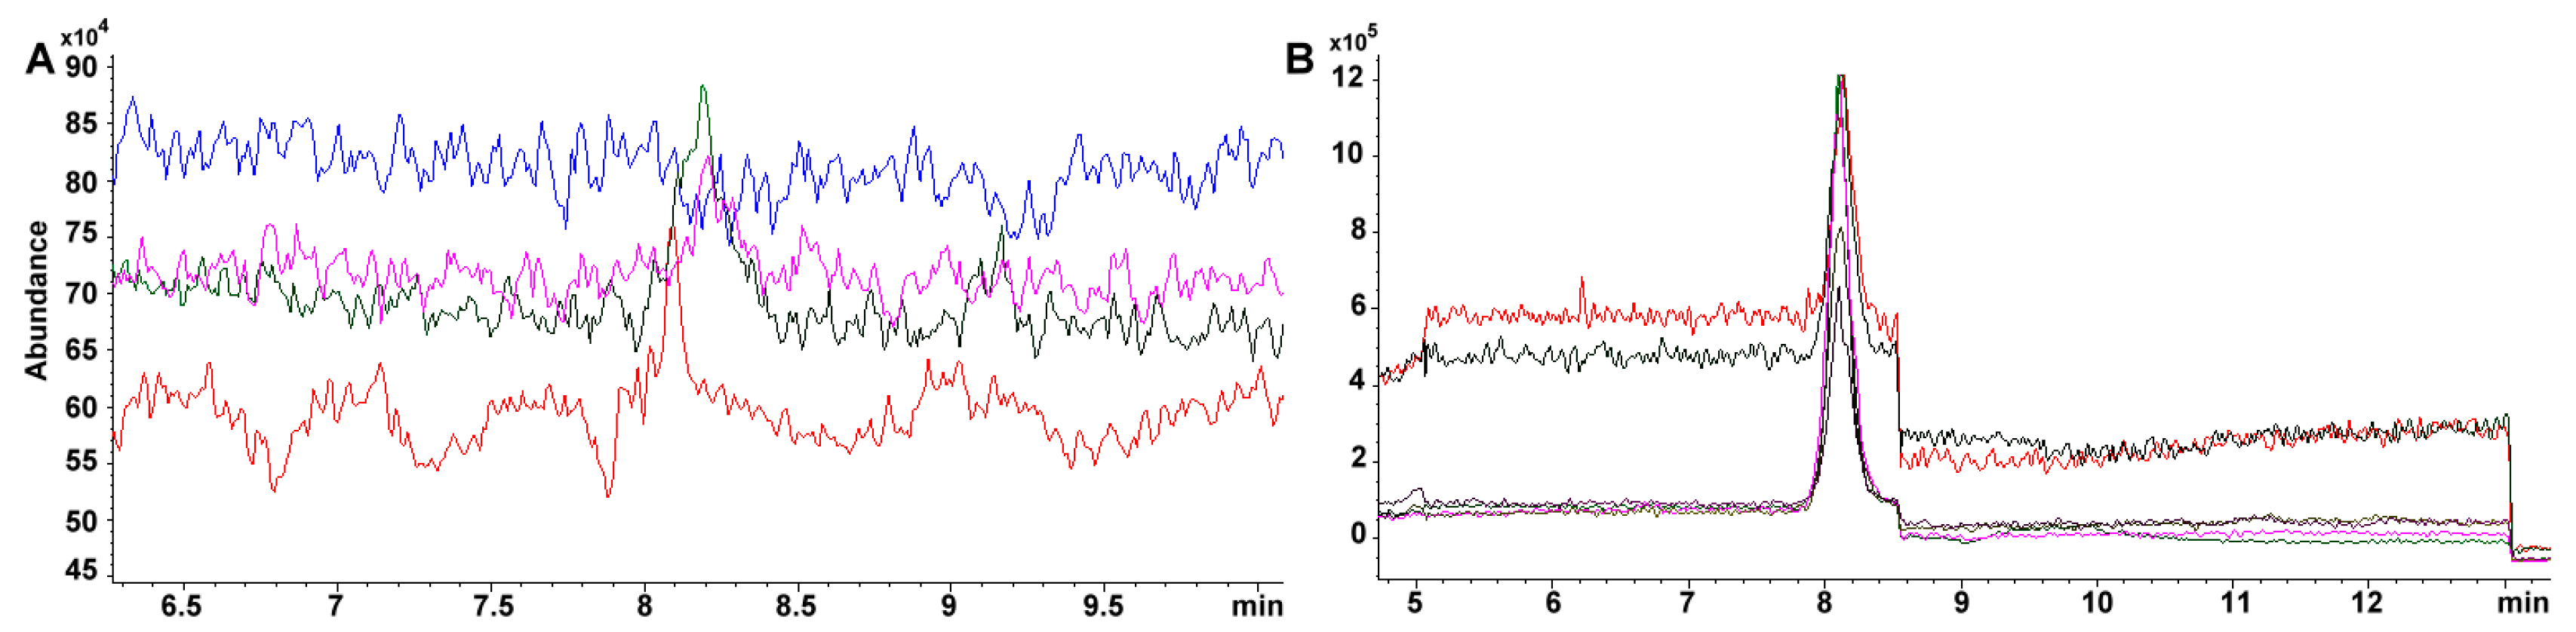
Sensitivity is greatly improved using a SIM targeted scan. For example, the same standard 34.4 mg phylloquinone L
-1 in TIC throws 37870 vs. 457785 area under the curve in SIM. Furthermore, within curve sensitivity reaches only 24.1 mg L
−1 for TIC while the signal for 4.31 mg L
−1, in SIM, is still appreciable (i.e., 80471 area under the curve, 0.54 mg L
−1 within curve sensitivity) (
Figure 7A,B). Absolute sensitivity to vitamin K increases almost 50 fold (24.1/0.54). For carotenoids, the change is more dramatic as 100 mg L
−1 standard has to be prepared in TIC for a detectable signal while 0.136 mg L
−1 is still noticeable (
Figure 2B), which represents ca. 750-fold in increased sensitivity.
Retention times and mass spectra were collected by the centroid of the chromatographic peak. Quantitation was carried out by comparing the peak areas found in the samples with those of standard solutions. The identification and quantification of targeted compounds analyzed by LC-ESI
+-MS were performed using OpenLab Chemstation C.01.07 (Agilent Technologies) for the processing of MS data sets. Confirmation of target analytes was based on the retention time (± 0.2 min as accepted time deviation), measurement of the molecular ion in a specific timeframe (
Table 2).
3.8. Statistical Analysis
Calibration curves parameters (i.e., slopes and intercepts), coefficients of determination, limits of detection, and standard errors were computed as a linear fit model using SAS JMP 13 (Marlow, Buckinghamshire, England). An ANOVA with a post-hoc Dunnet test was used to assess differences among treatments during the optimization of the conditions during saponification. Concentrations obtained using the conditions 1 h and 1 mmol KOH mL ethanol−1 at 80 °C, were used as the control parameters; the test considered if the data was below the control, with α = 0.05 significance level. The statistical analysis was performed using IBM SPSS®® Statistics 23 (Armonk, NY, USA).


