The authors wish to make the following correction to this paper [
1]. Due to mislabeling, the following figures:
Figure 4.
Quantitative real-time RT-PCR was used to analyze of ROS-scavenging enzyme genes expression during drought stress and normalized to β-actin. White clover leaves were sampled after 0, 3, 6, 12, 24, 48 and 72 h treatment. Data represent means of three replicates. Error bars representing standard errors and the different letters above the bars represent significant difference (p < 0.05).
Figure 6.
Quantitative real-time RT-PCR was used to analysis of ROS-scavenging enzyme genes expression during heavy metal stress and normalized to β-actin. White clover leaves were sampled after 0, 3, 6, 12, 24, 48 and 72 h treatment. Data represent means of three replicates. Error bars representing standard errors and the different letters above the bars represent significant difference (p < 0.05).
Figure 7.
Quantitative real-time RT-PCR was used to analyze of ROS-scavenging enzyme genes expression treatment with ABA and normalized to β-actin. White clover leaves were sampled after 0, 3, 6, 12, 24, 48 and 72 h treatment. Data represent means of three replicates. Error bars representing standard errors and the different letters above the bars represent significant difference (p < 0.05).
Figure 8.
Quantitative real-time RT-PCR was used to analyze of ROS-scavenging enzyme genes expression treatment with Spd and normalized to β-actin. White clover leaves were sampled after 0, 3, 6, 12, 24, 48 and 72 h treatment. Data represent means of three replicates. Error bars representing standard errors and the different letters above the bars represent significant difference (p < 0.05).
should be replaced by:
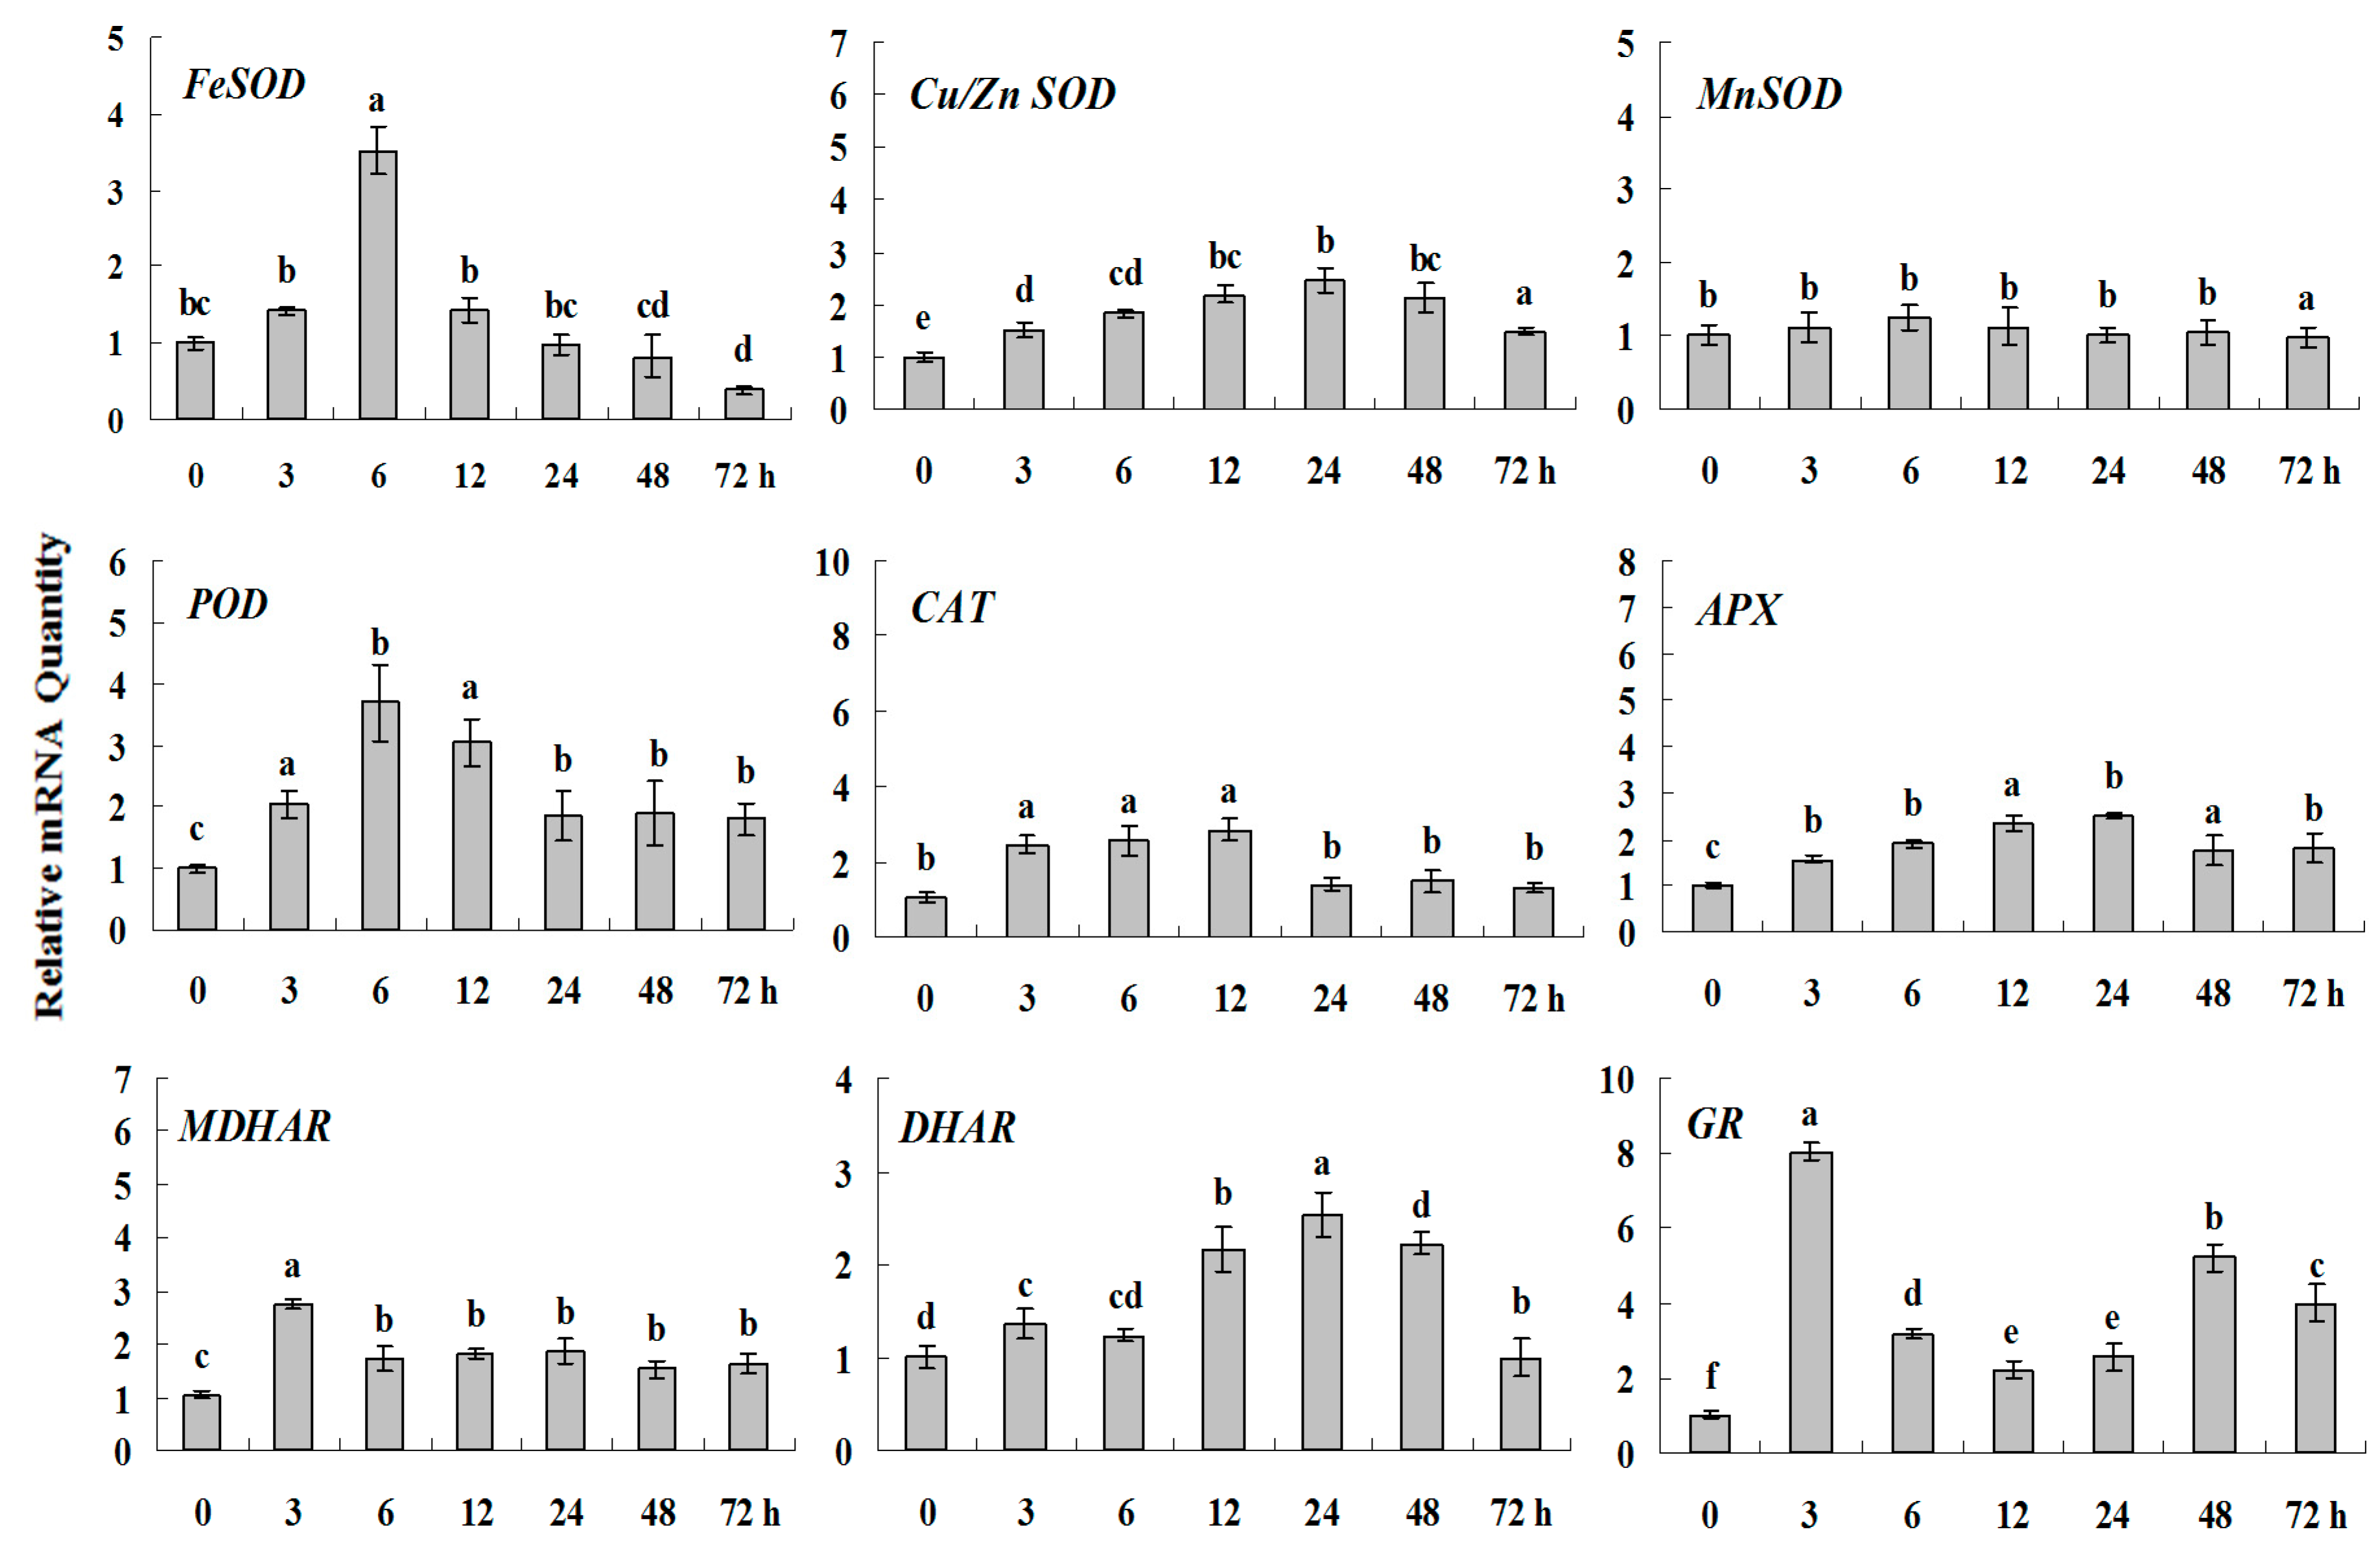
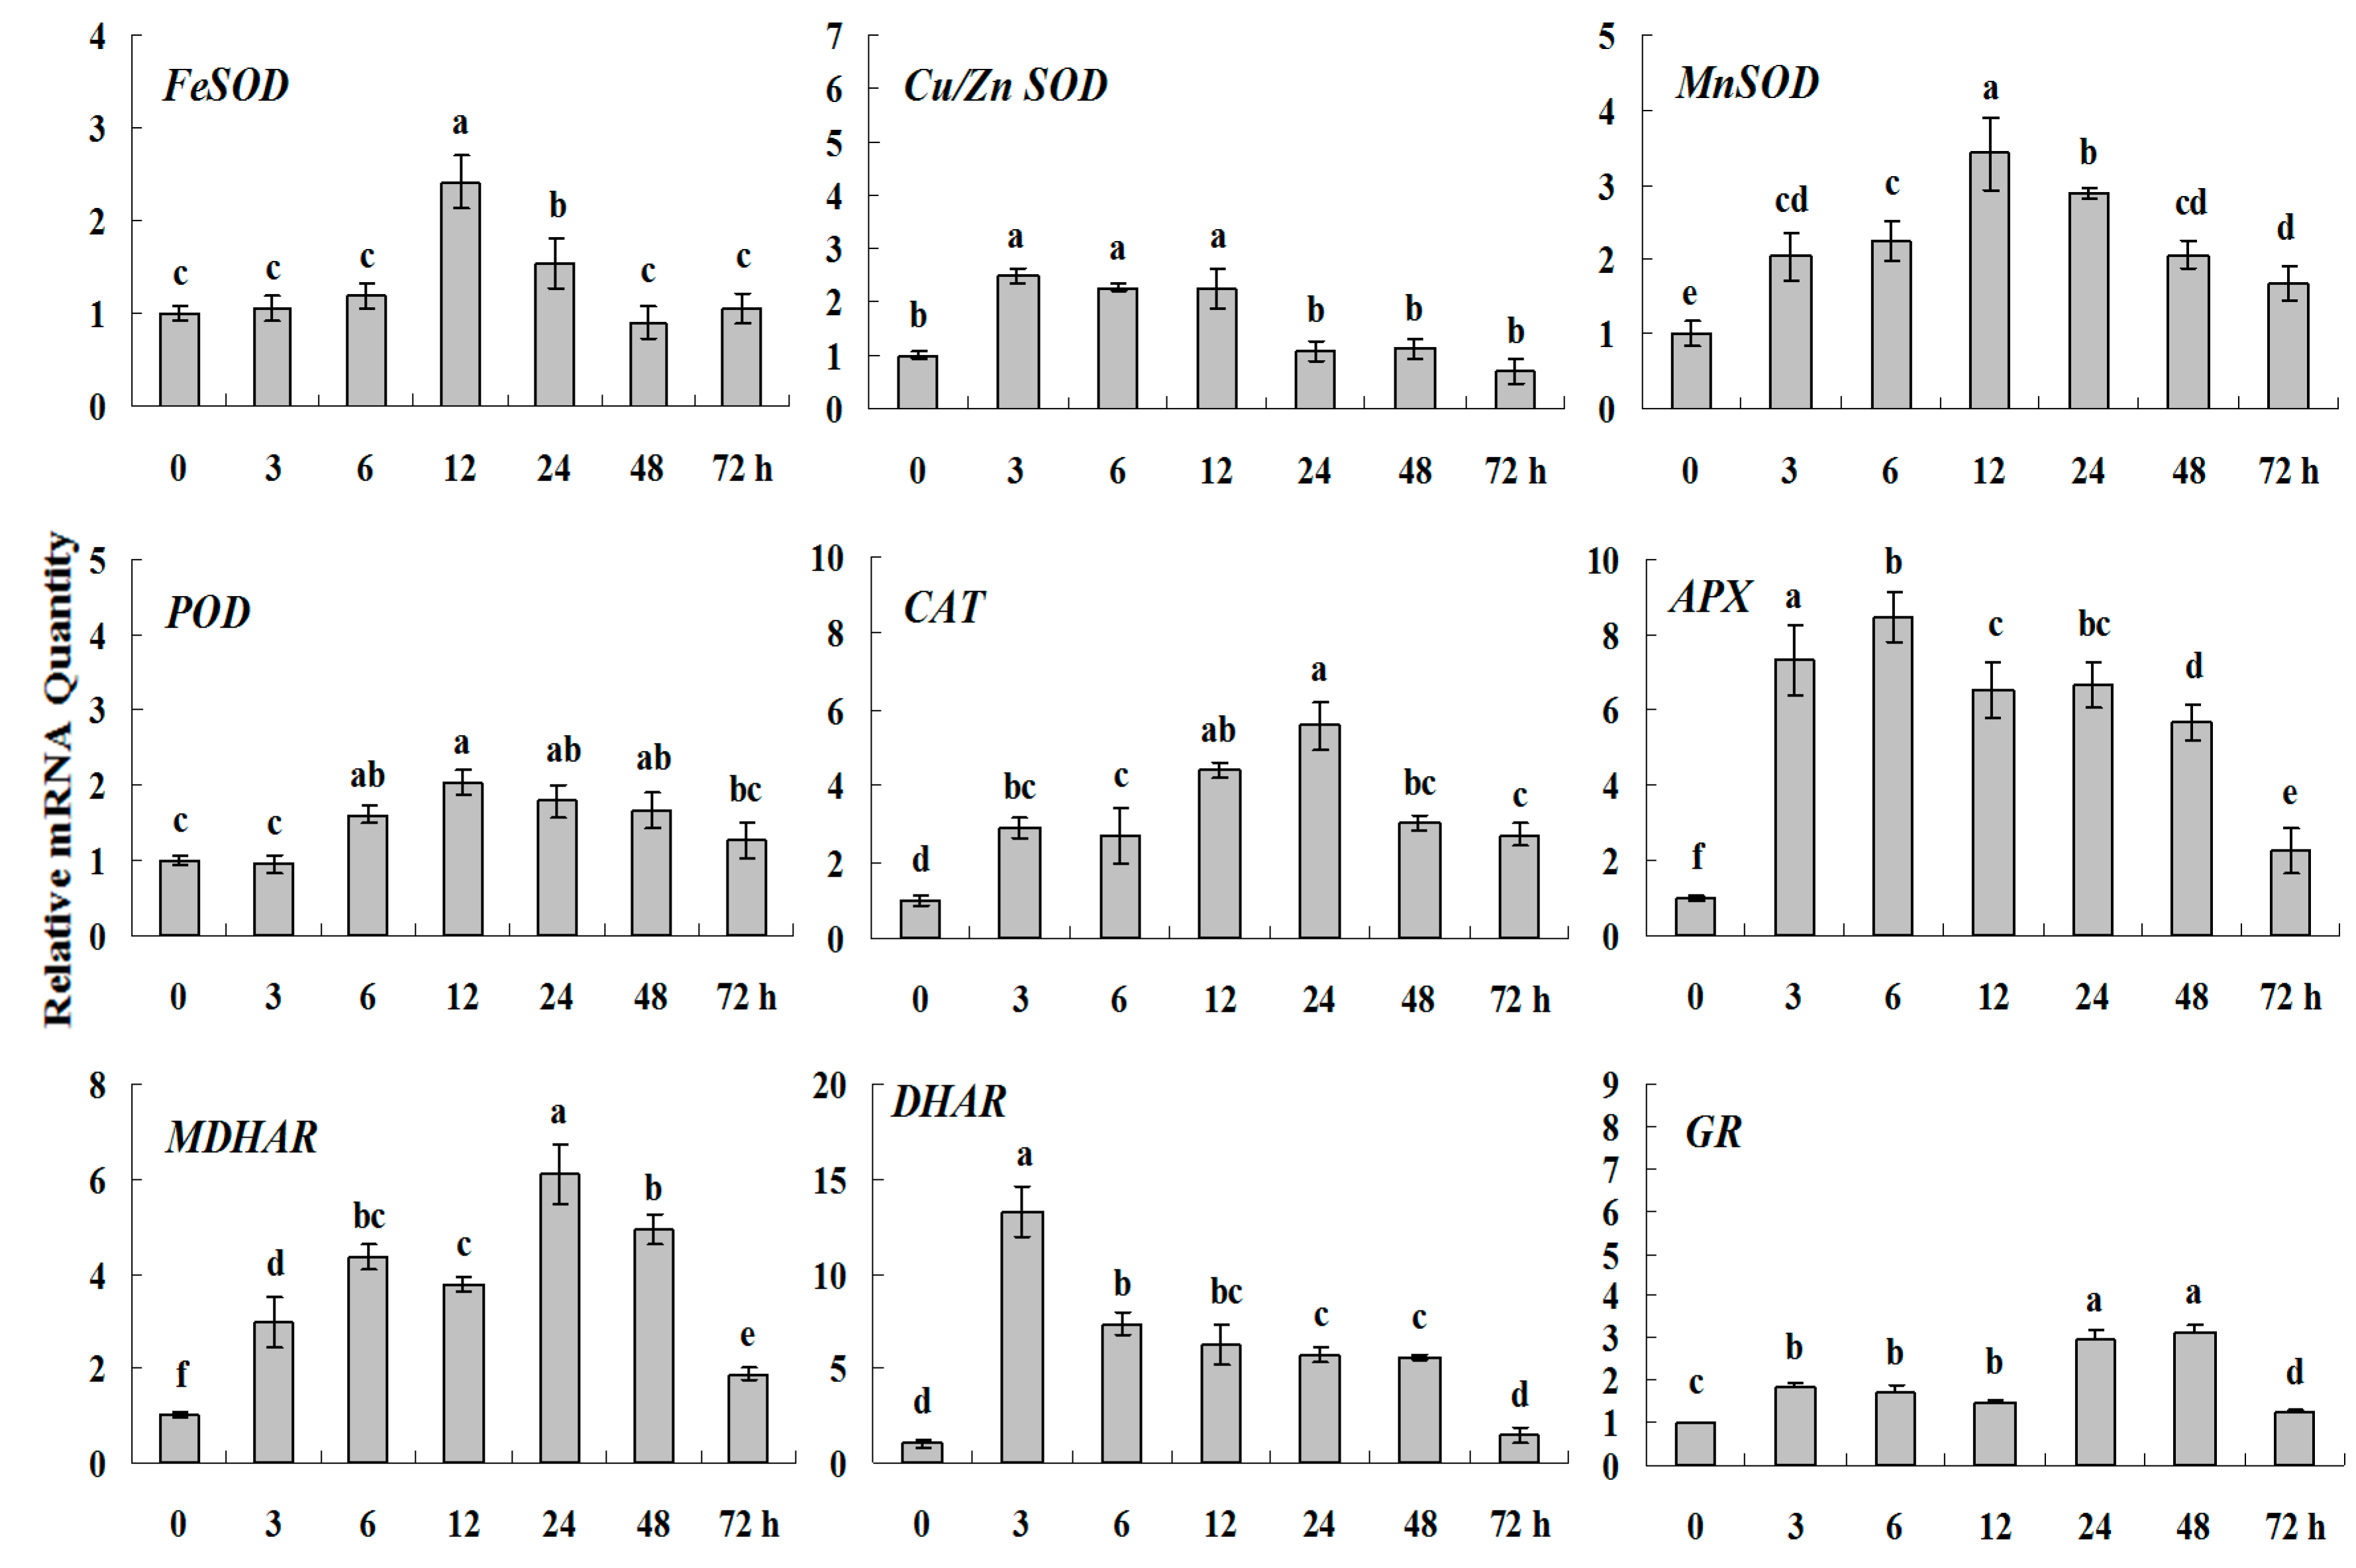
Figure 4.
Quantitative real-time RT-PCR was used to analyze of ROS-scavenging enzyme genes expression during drought stress and normalized to β-actin. White clover leaves were sampled after 0, 3, 6, 12, 24, 48 and 72 h treatment. Data represent means of three replicates. Error bars representing standard errors and the different letters above the bars represent significant difference (p < 0.05).
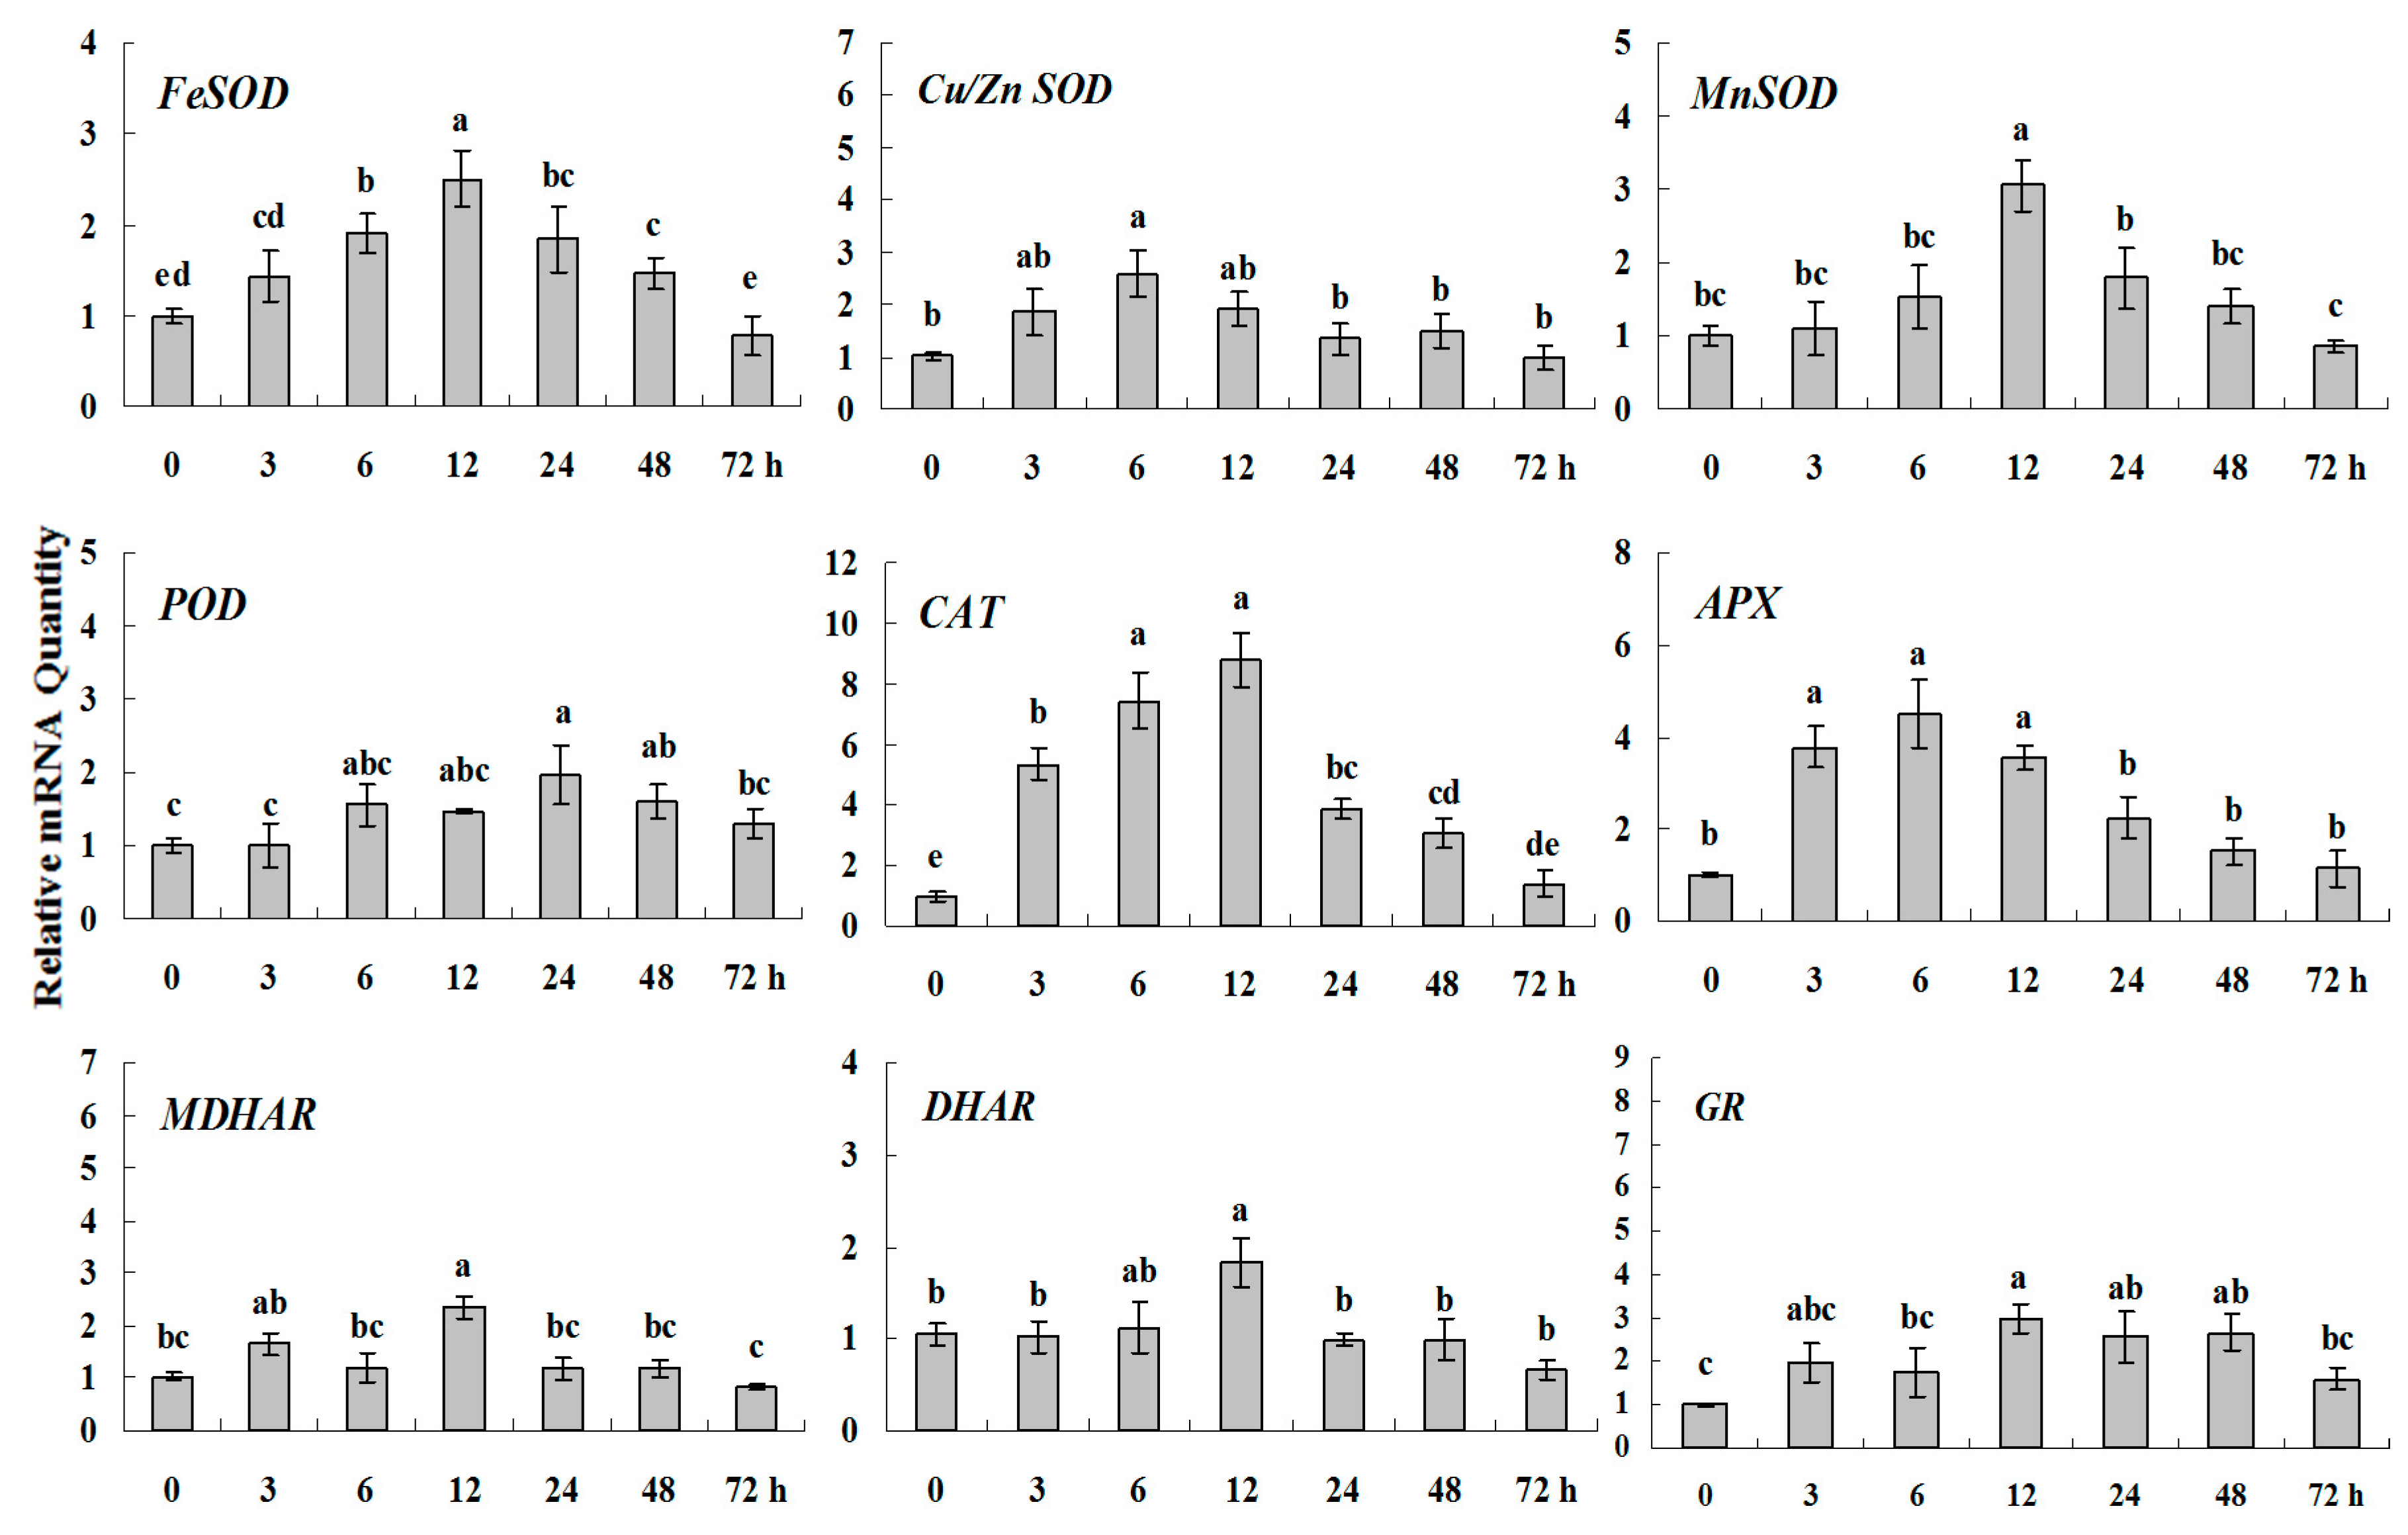
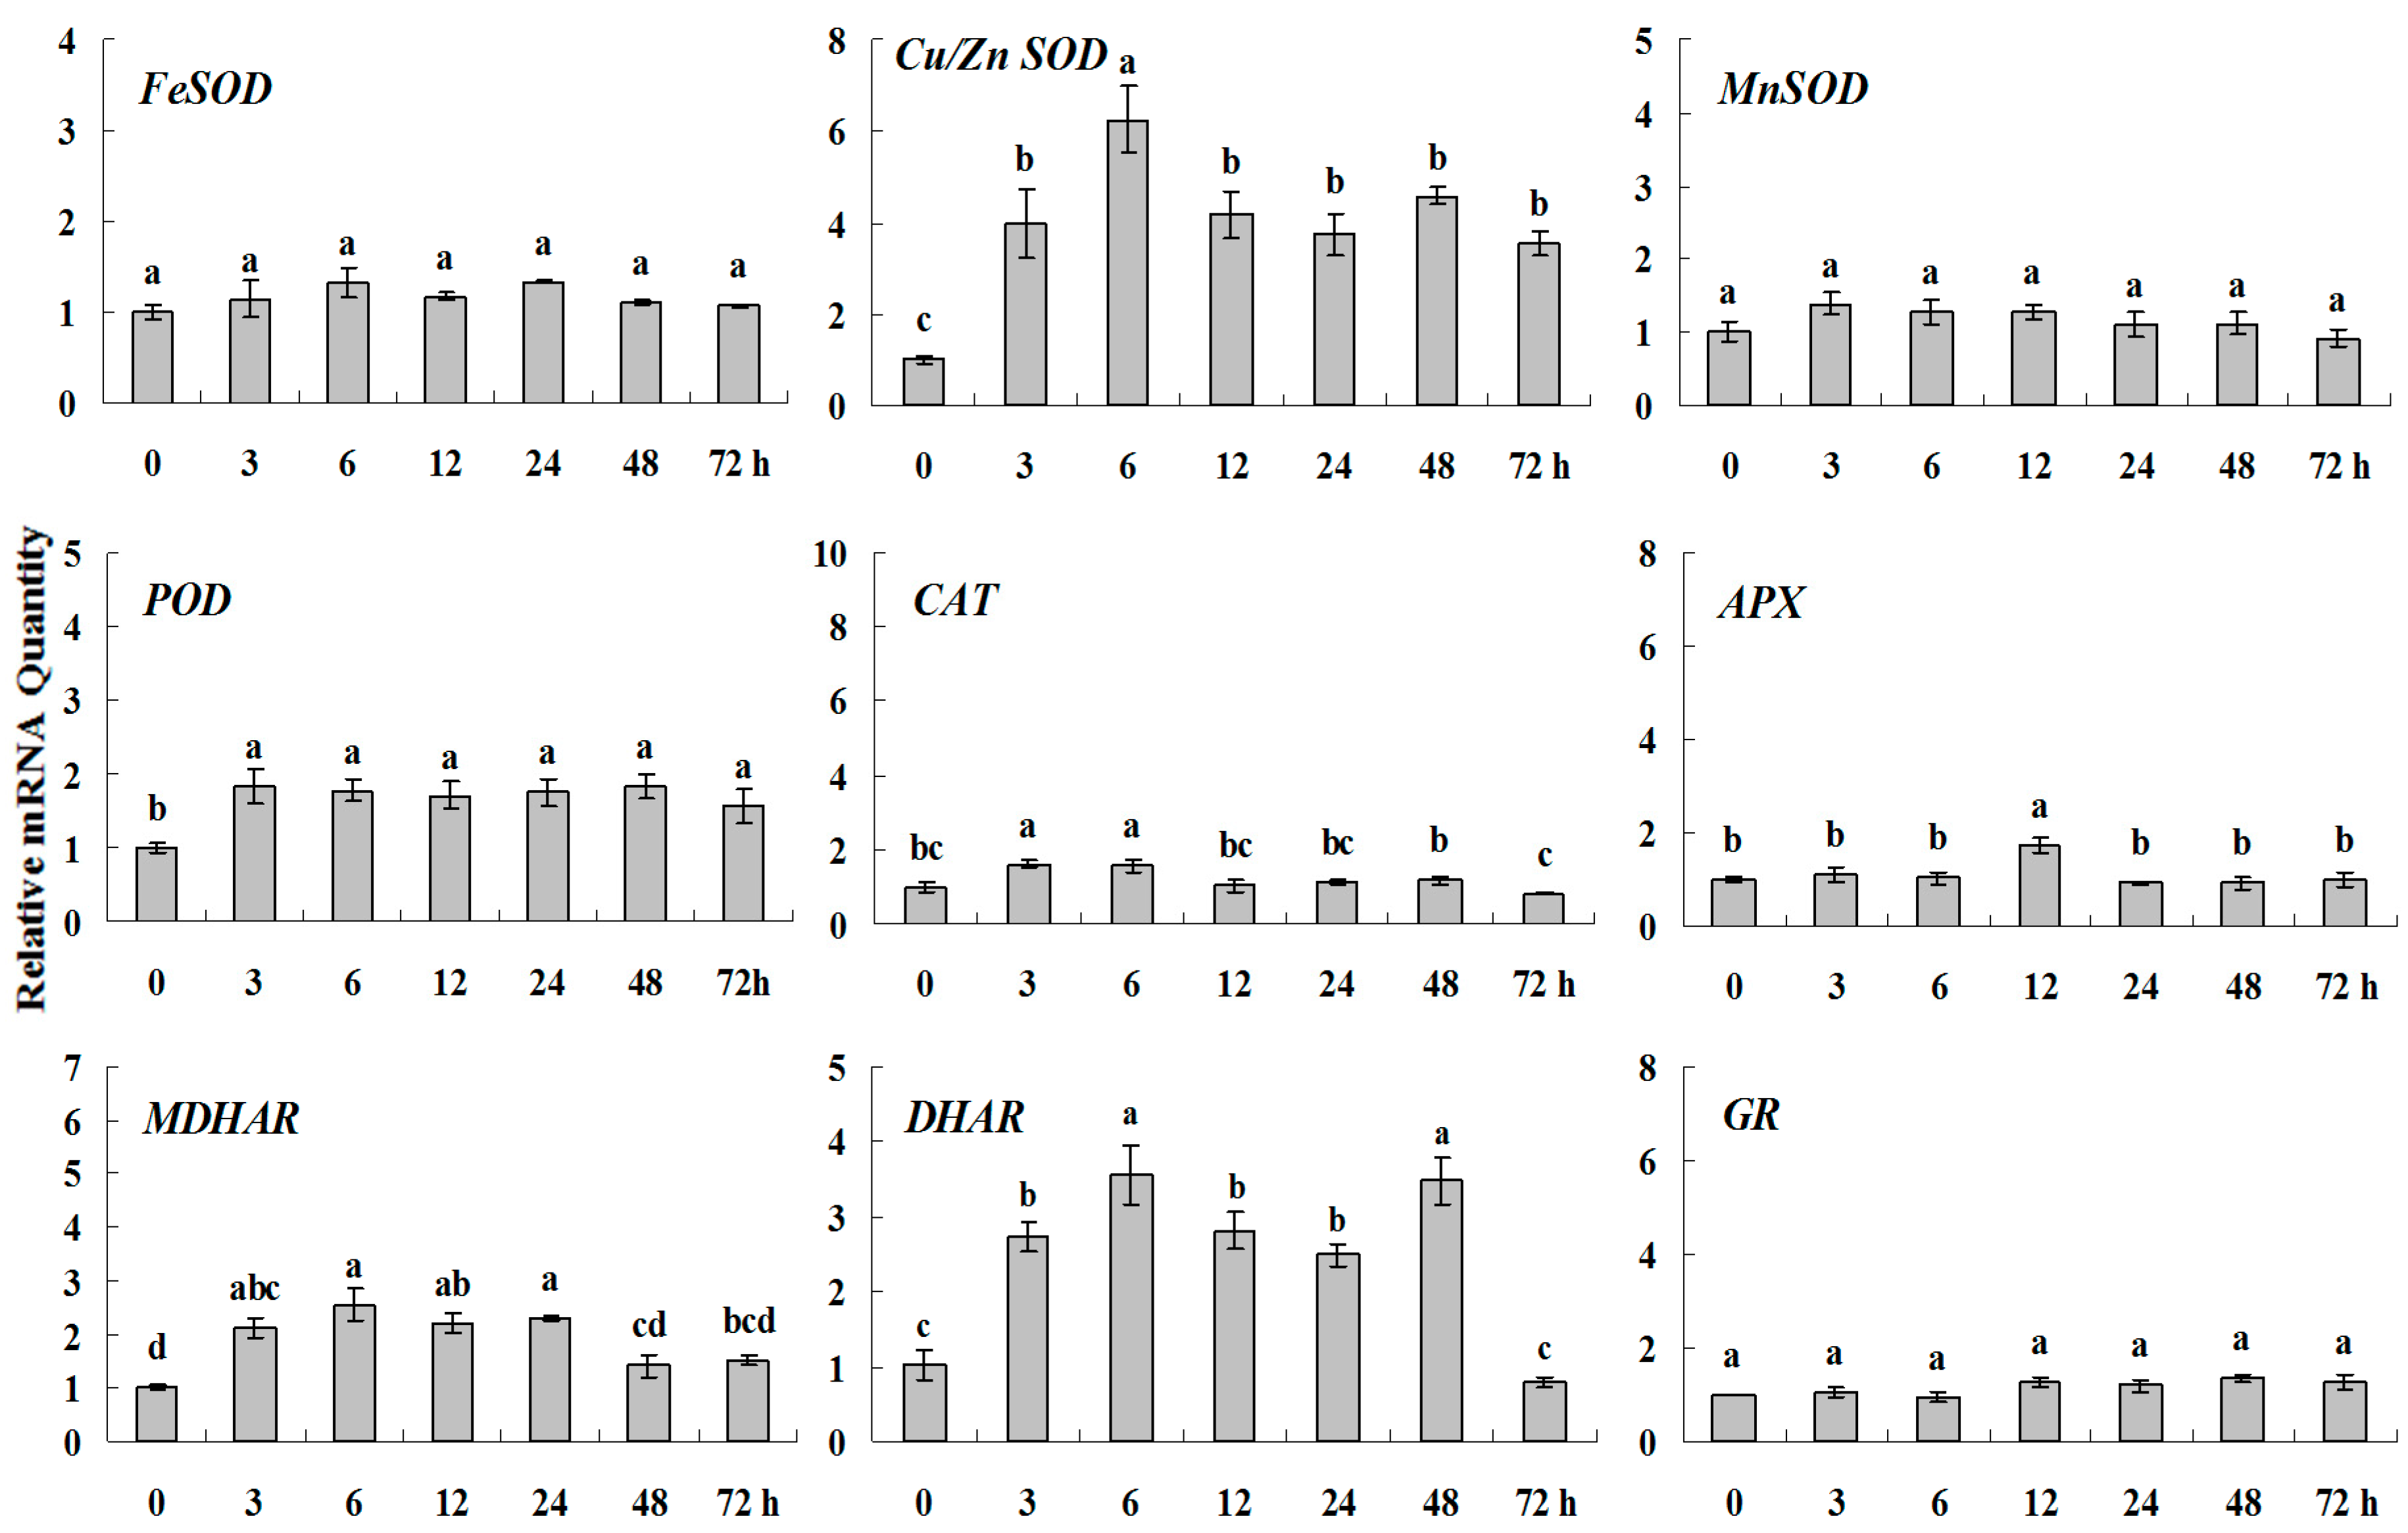
Figure 6.
Quantitative real-time RT-PCR was used to analysis of ROS-scavenging enzyme genes expression during heavy metal stress and normalized to β-actin. White clover leaves were sampled after 0, 3, 6, 12, 24, 48 and 72 h treatment. Data represent means of three replicates. Error bars representing standard errors and the different letters above the bars represent significant difference (p < 0.05).
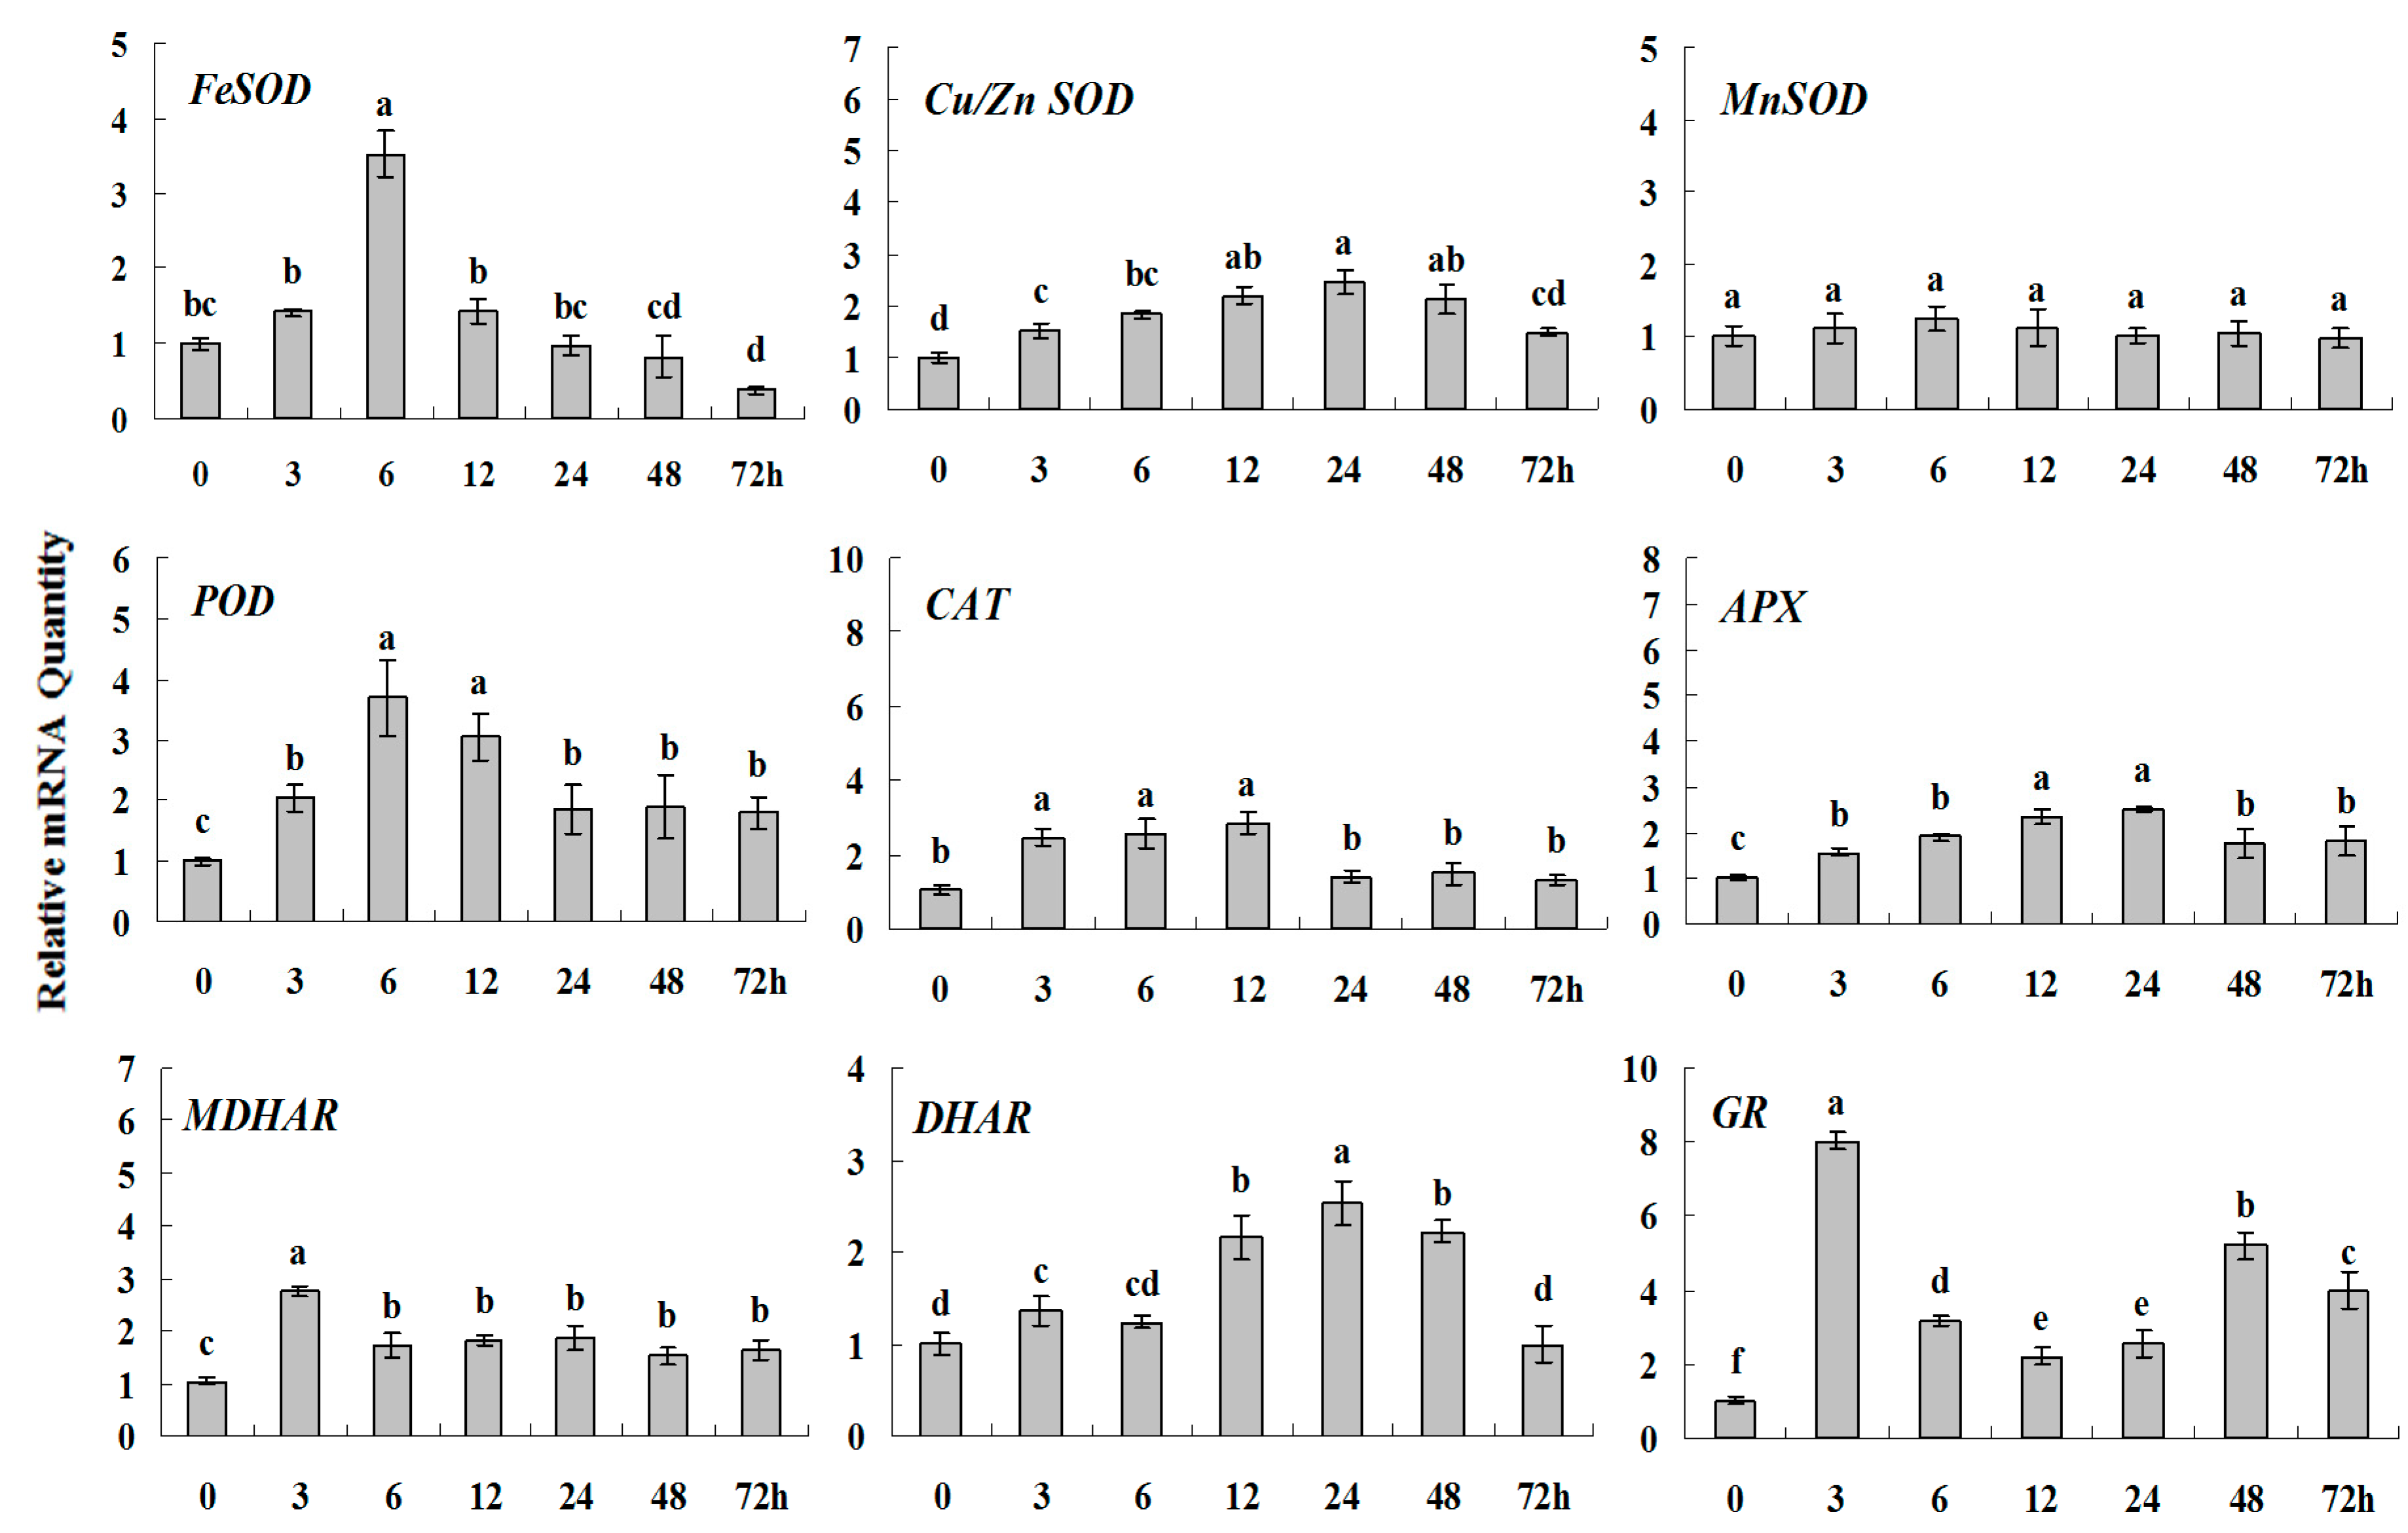
Figure 7.
Quantitative real-time RT-PCR was used to analyze of ROS-scavenging enzyme genes expression treatment with ABA and normalized to β-actin. White clover leaves were sampled after 0, 3, 6, 12, 24, 48 and 72 h treatment. Data represent means of three replicates. Error bars representing standard errors and the different letters above the bars represent significant difference (p < 0.05).
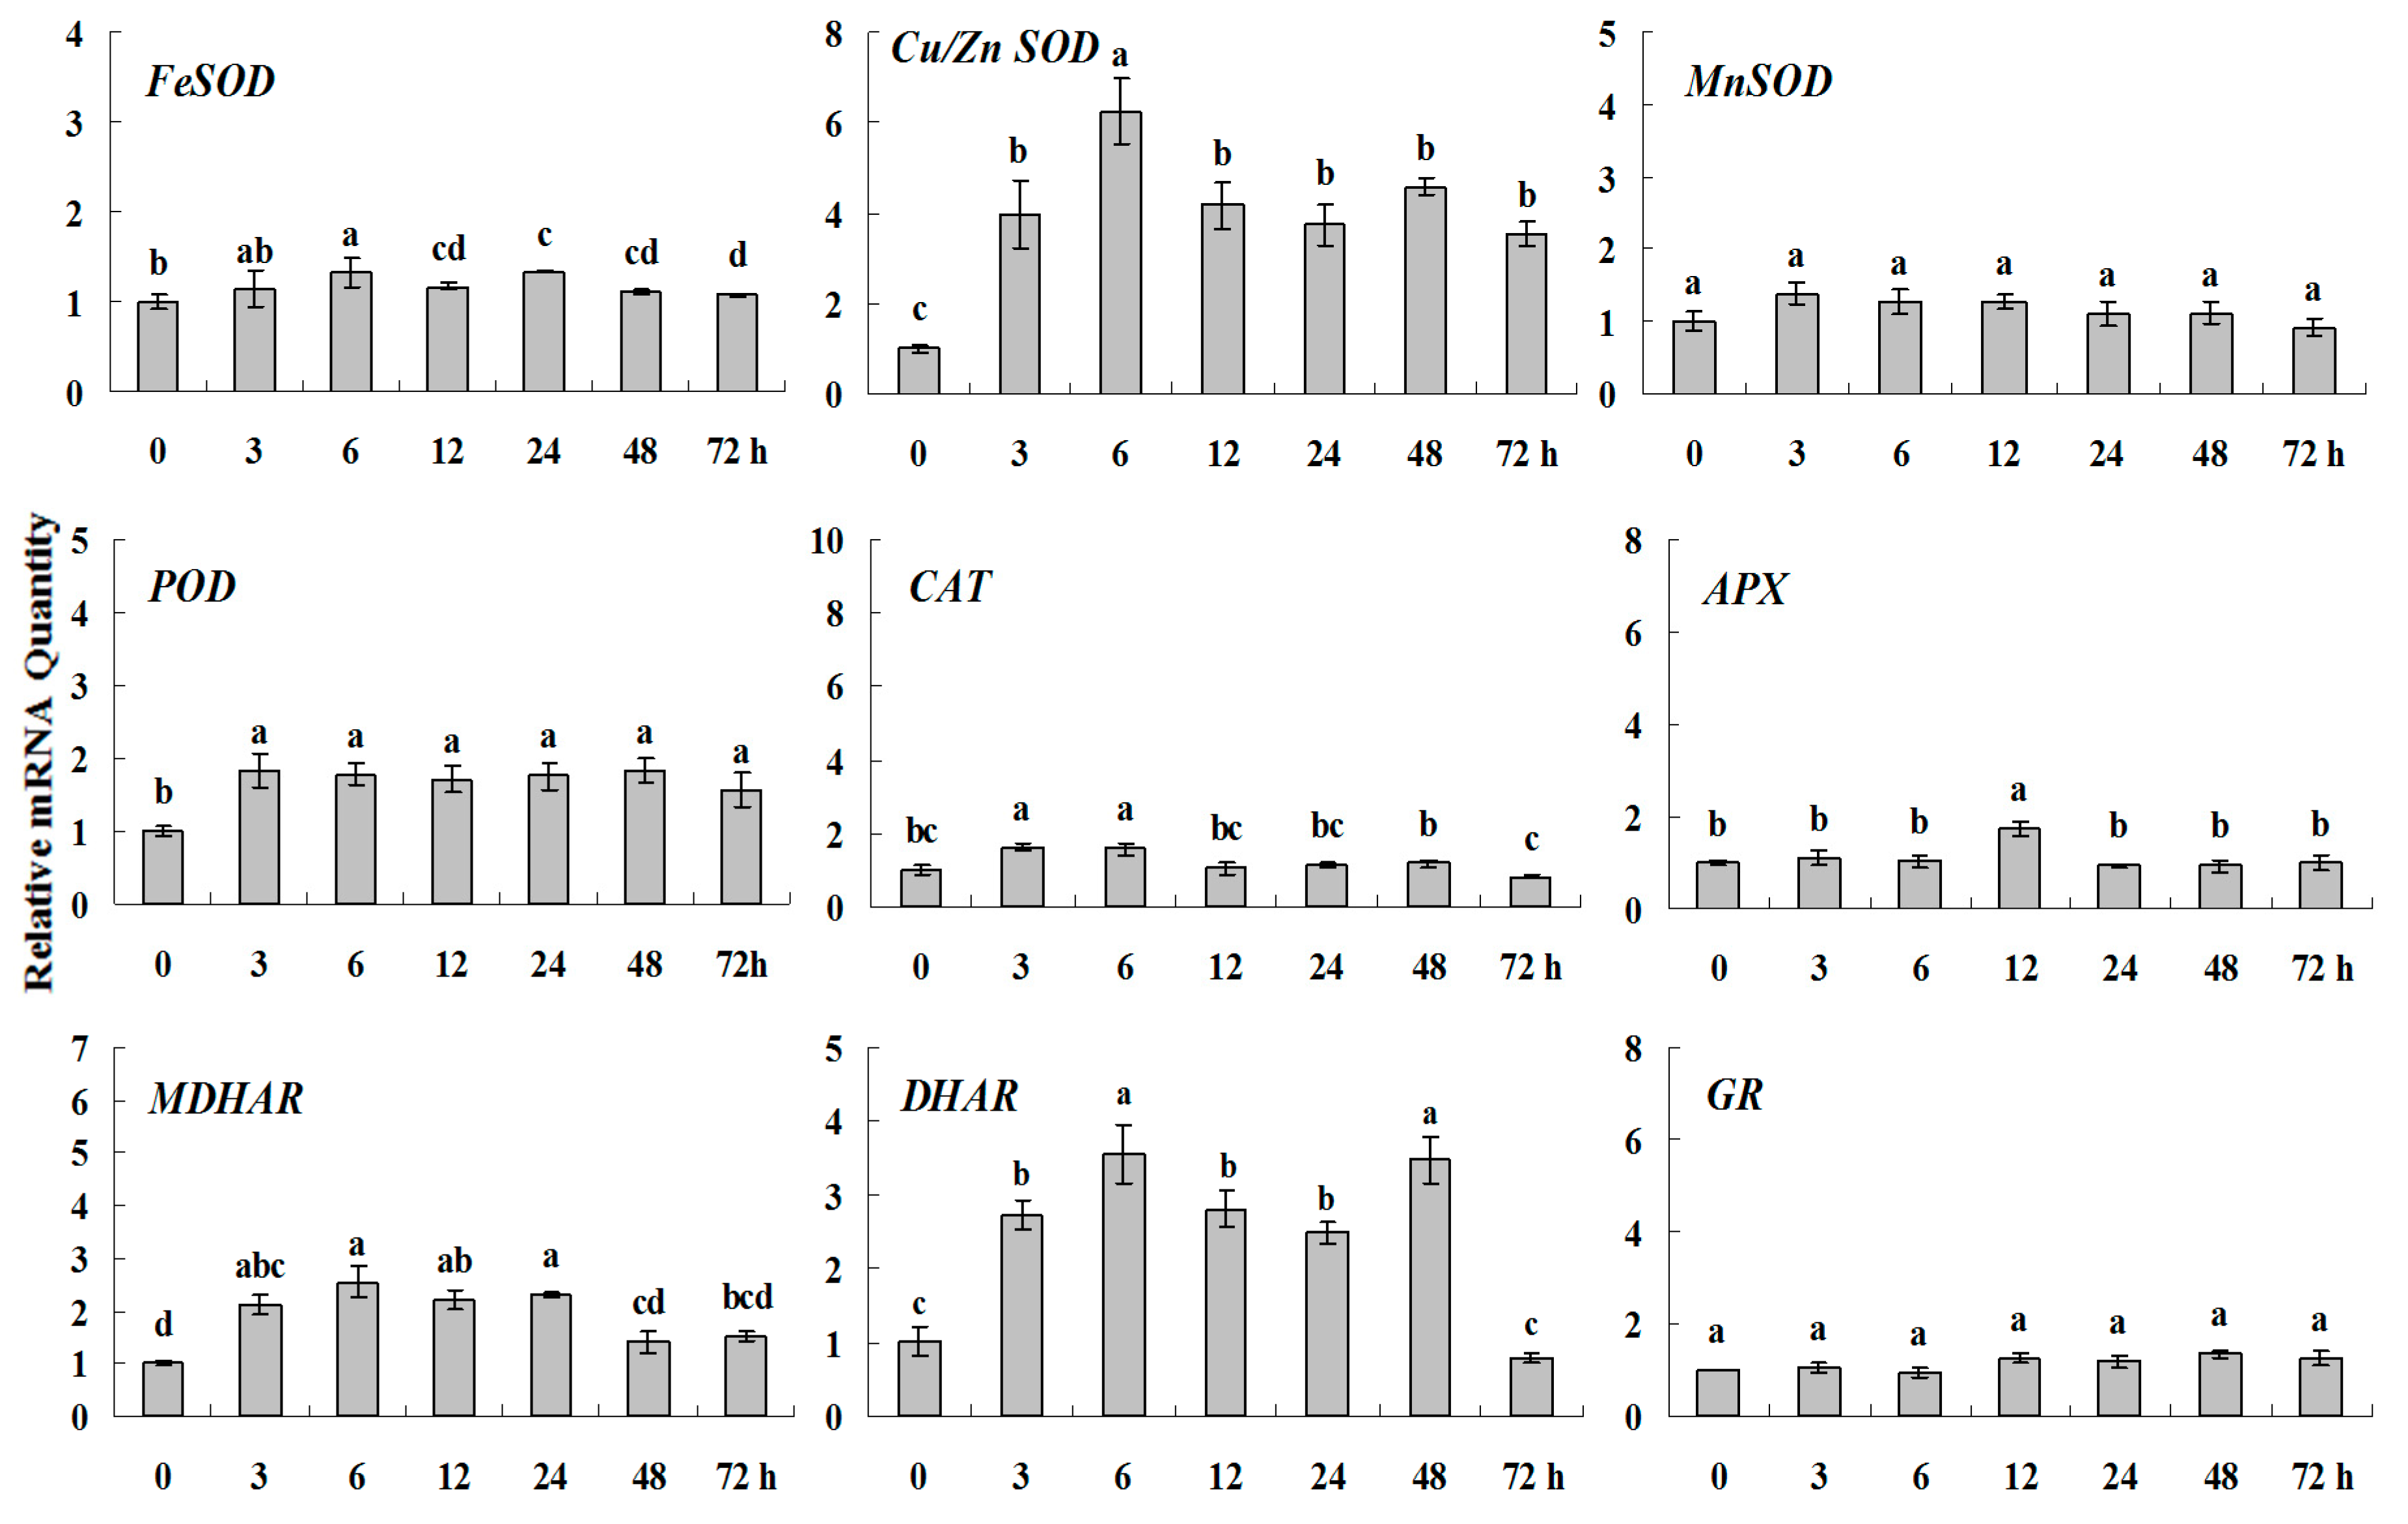
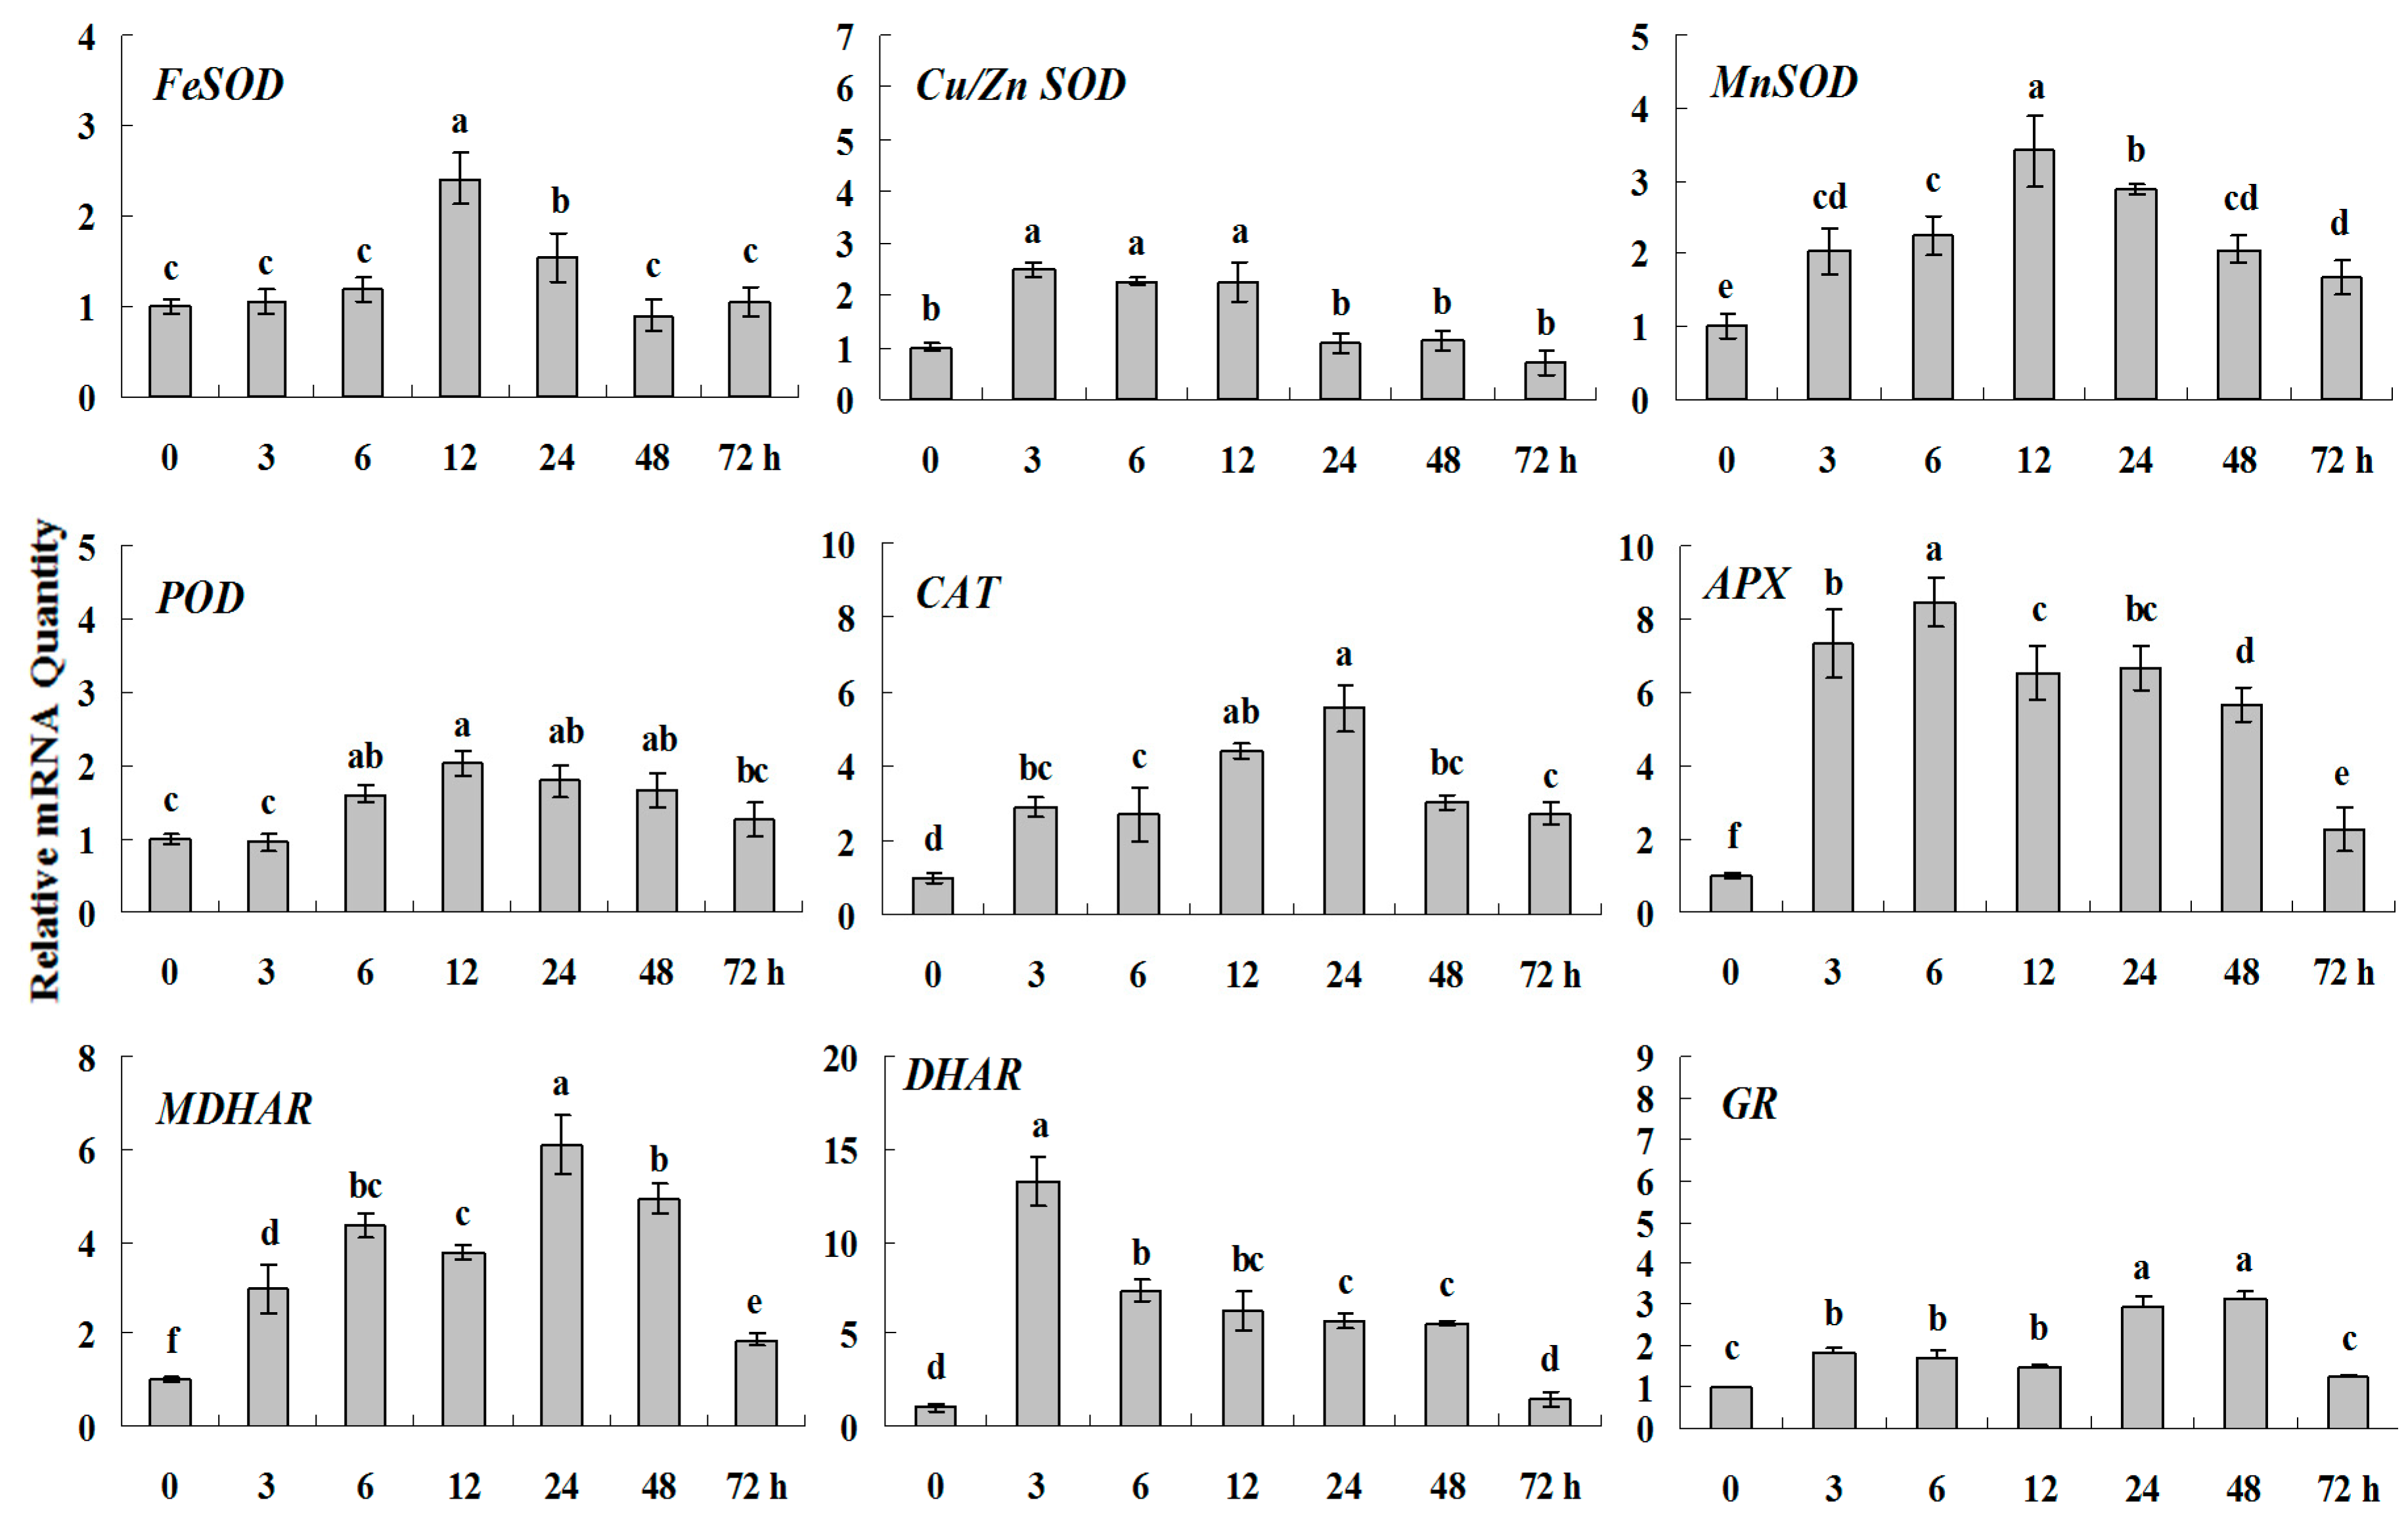
Figure 8.
Quantitative real-time RT-PCR was used to analyze of ROS-scavenging enzyme genes expression treatment with Spd and normalized to β-actin. White clover leaves were sampled after 0, 3, 6, 12, 24, 48 and 72 h treatment. Data represent means of three replicates. Error bars representing standard errors and the different letters above the bars represent significant difference (p < 0.05).
Some of the letters which represented significance were not correct, and accordingly the changes in the figures are as follows: In Figure 4 FeSOD, the letters at 6 and 12 h should be changed to b and a, in Cu/Zn SOD, the letters at 3 and 6 h should be changed to ab and a. In Figure 6 FeSOD, the letters of all treatments except for 6 h should be changed to a. In Figure 7 Cu/Zn SOD, the letters of all treatments should be changed to d, c, bc, ab, a, ab and cd, respectively, in MnSOD, the letters of all treatments except for 72 h should be changed to a, in POD, the letters at 3 and 6 h should be changed to b and a, in APX, the letters at 24 and 48 h should be changed to a and b, in DHAR, the letters at 48 and 72 h should be changed to b and d. In Figure 8 APX, the letters at 3 and 6 h should be changed to b and a, in GR, the letters at 72 h should be changed to c. The authors would like to apologize for any inconvenience caused to the readers by these changes.


 and
and 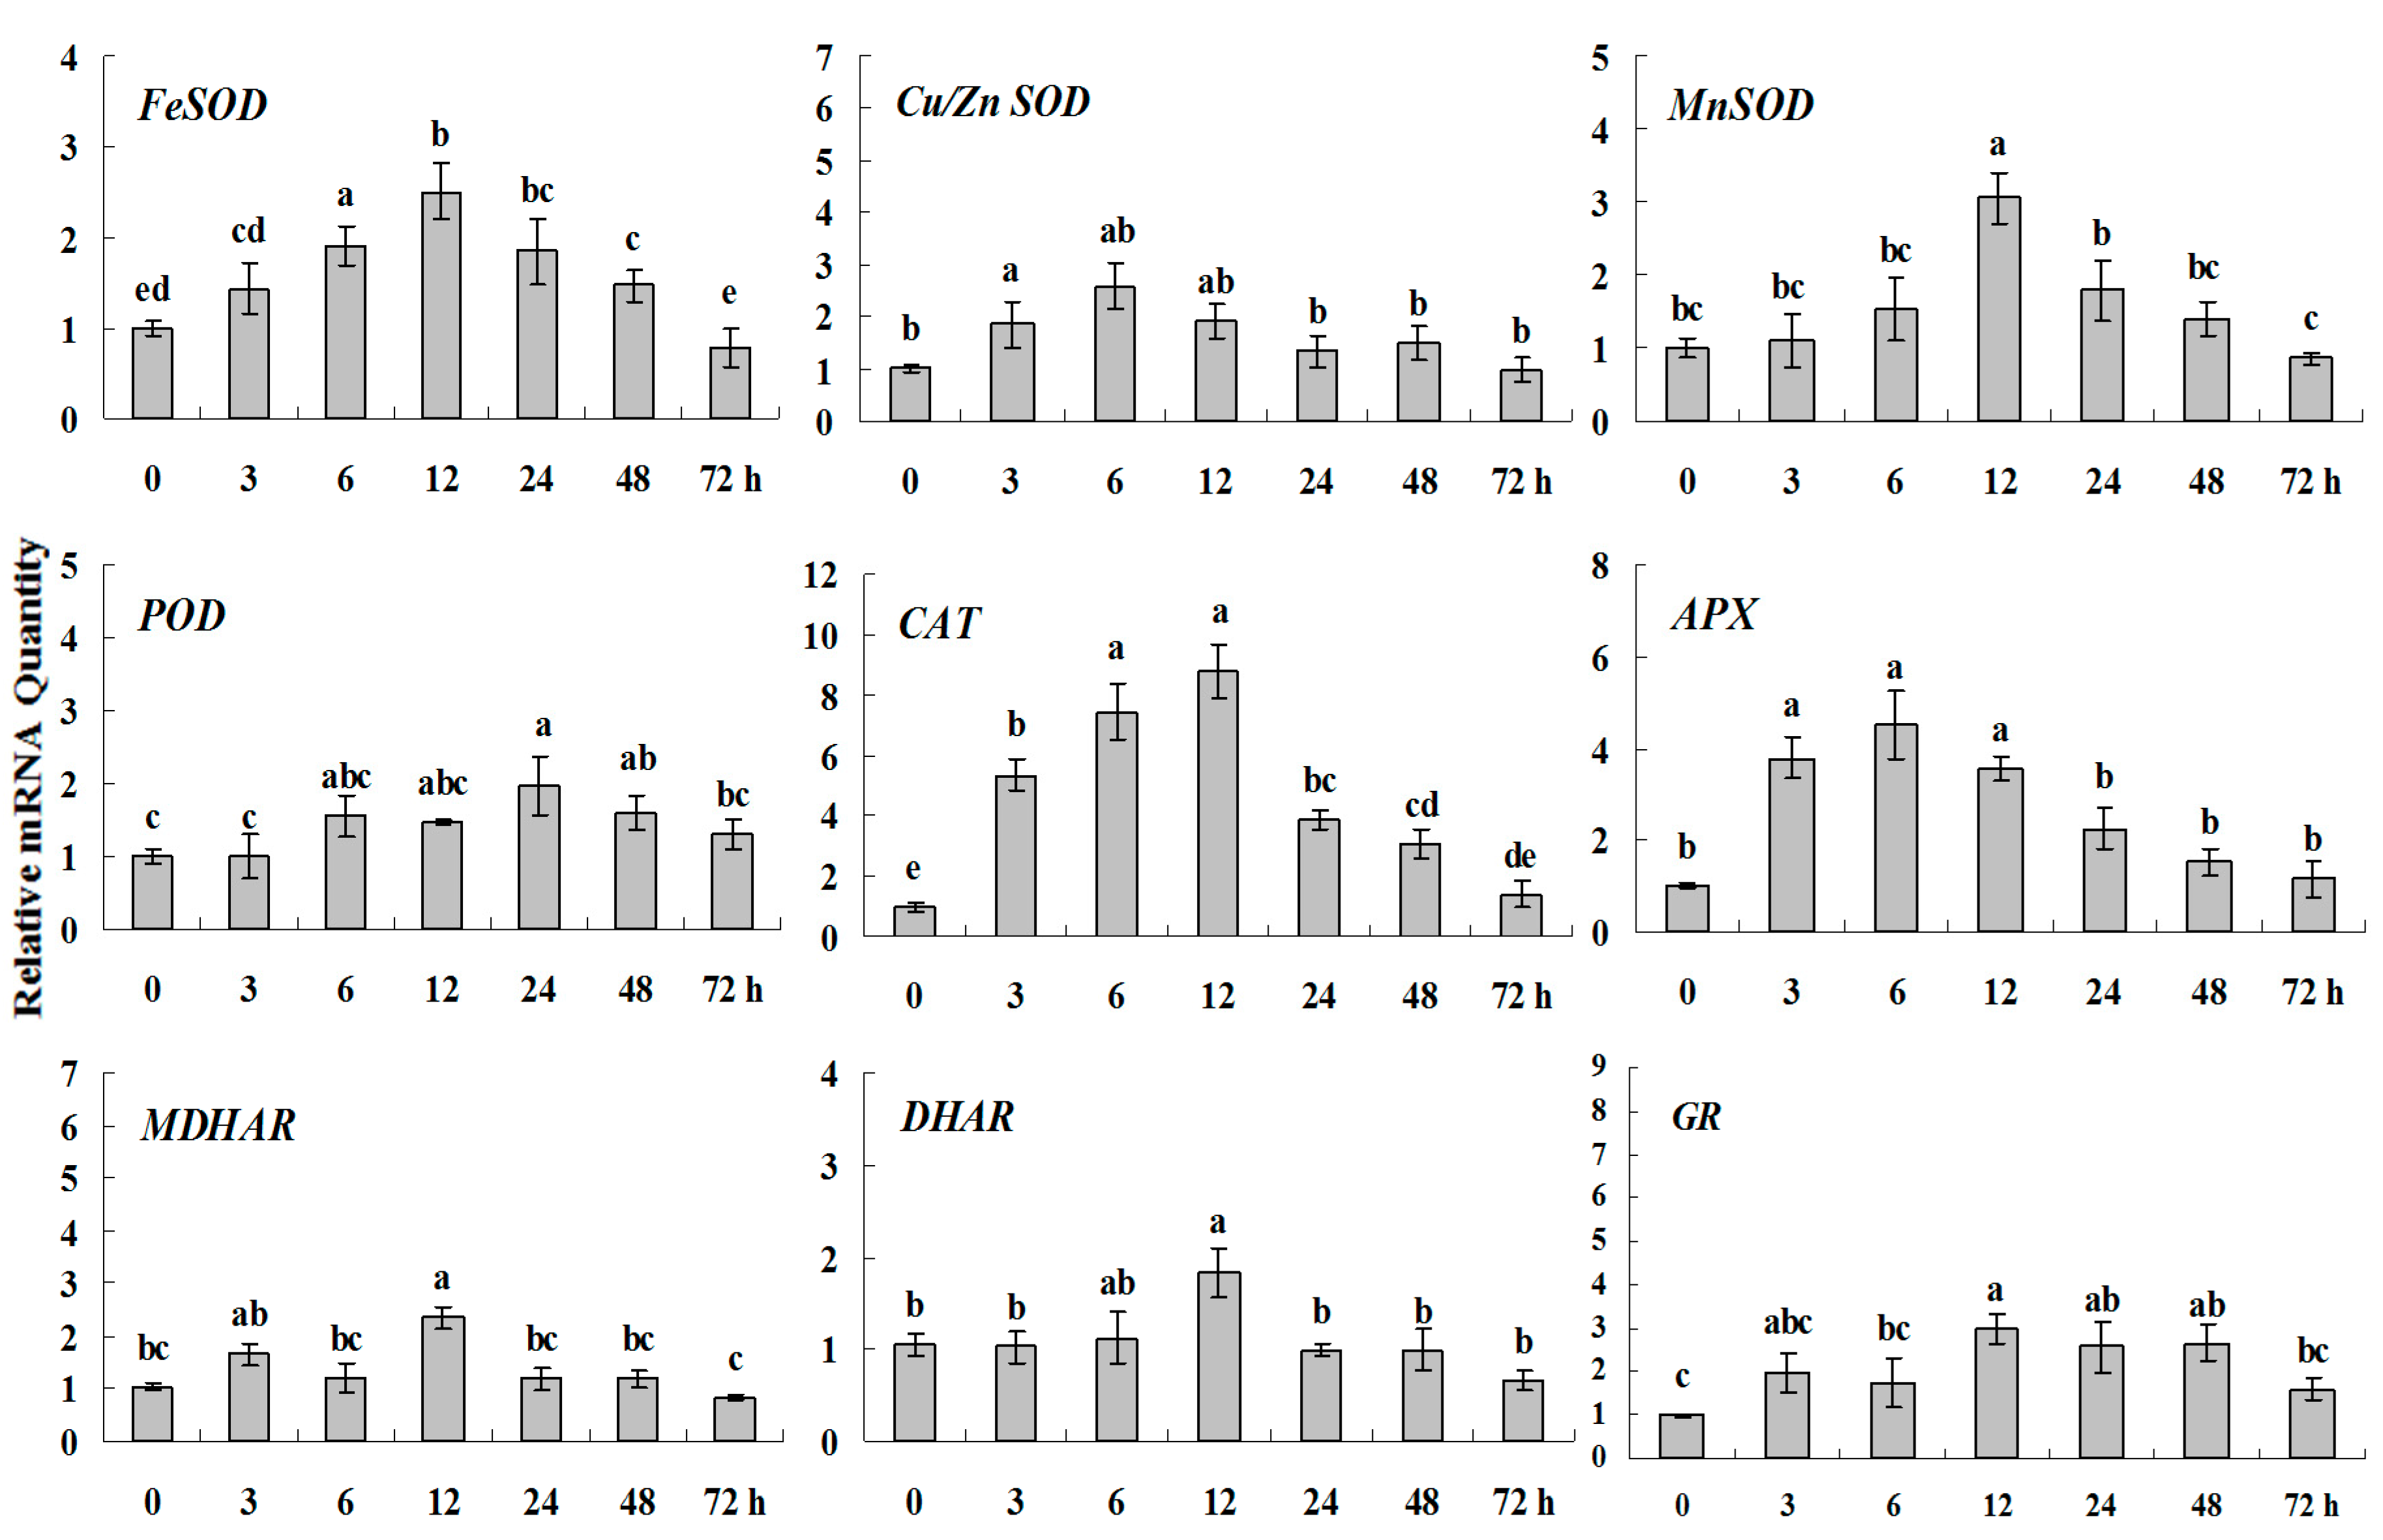