
Differential Expression of BARD1 Isoforms in Melanoma

 , , , , , ,
Abstract
:1. Introduction
2. Materials and Methods
2.1. NZM and Melanocyte Cell Lines
2.2. Archival Formalin-Fixed Paraffin-Embedded (FFPE) Tissue Blocks
2.3. Nanopore and Sanger Sequencing
2.4. RT-qPCR Data
2.5. RNA-seq Data
2.6. Sequencing Data Availability
3. Results
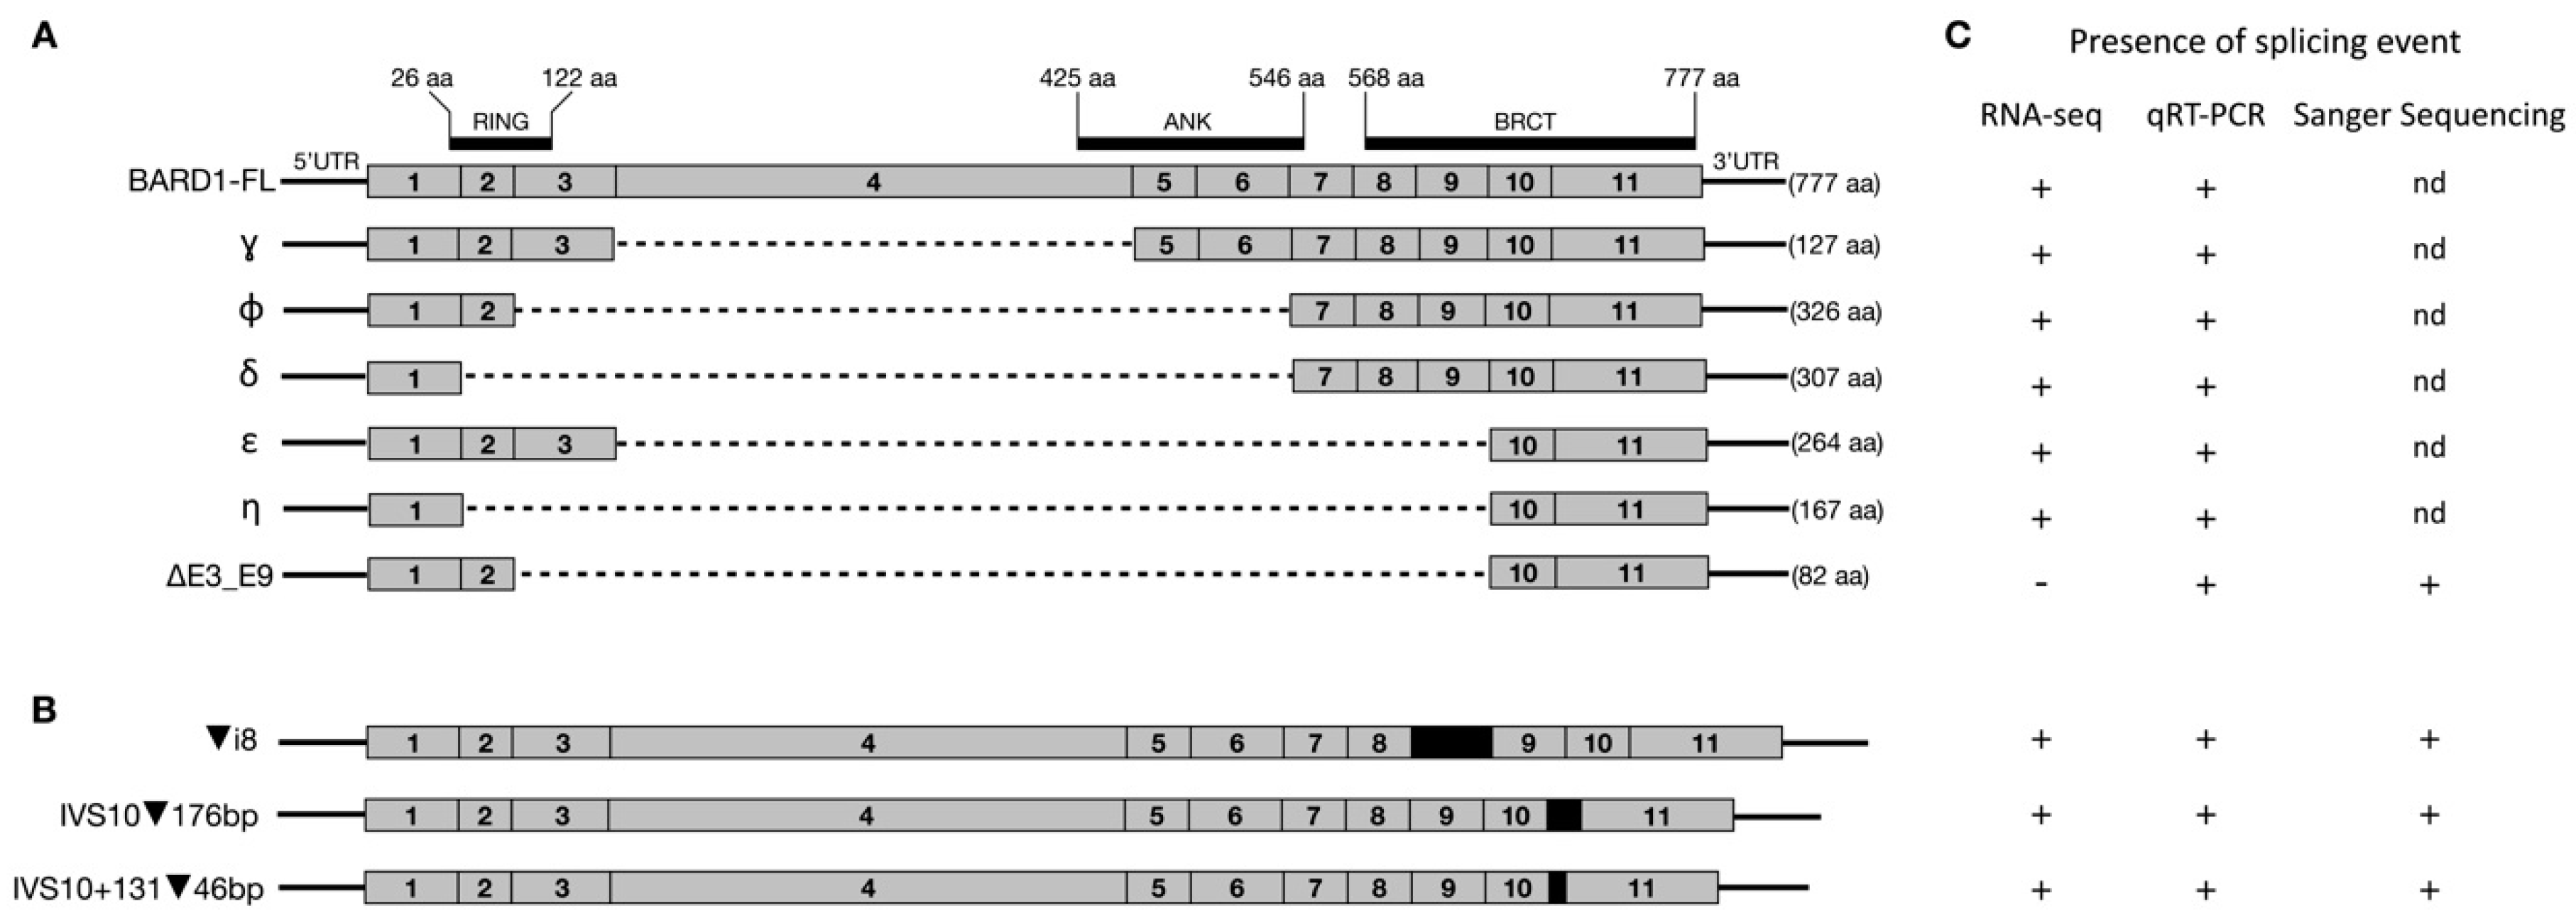
3.1. Long-Range Nanopore Sequencing
3.2. RT-qPCR
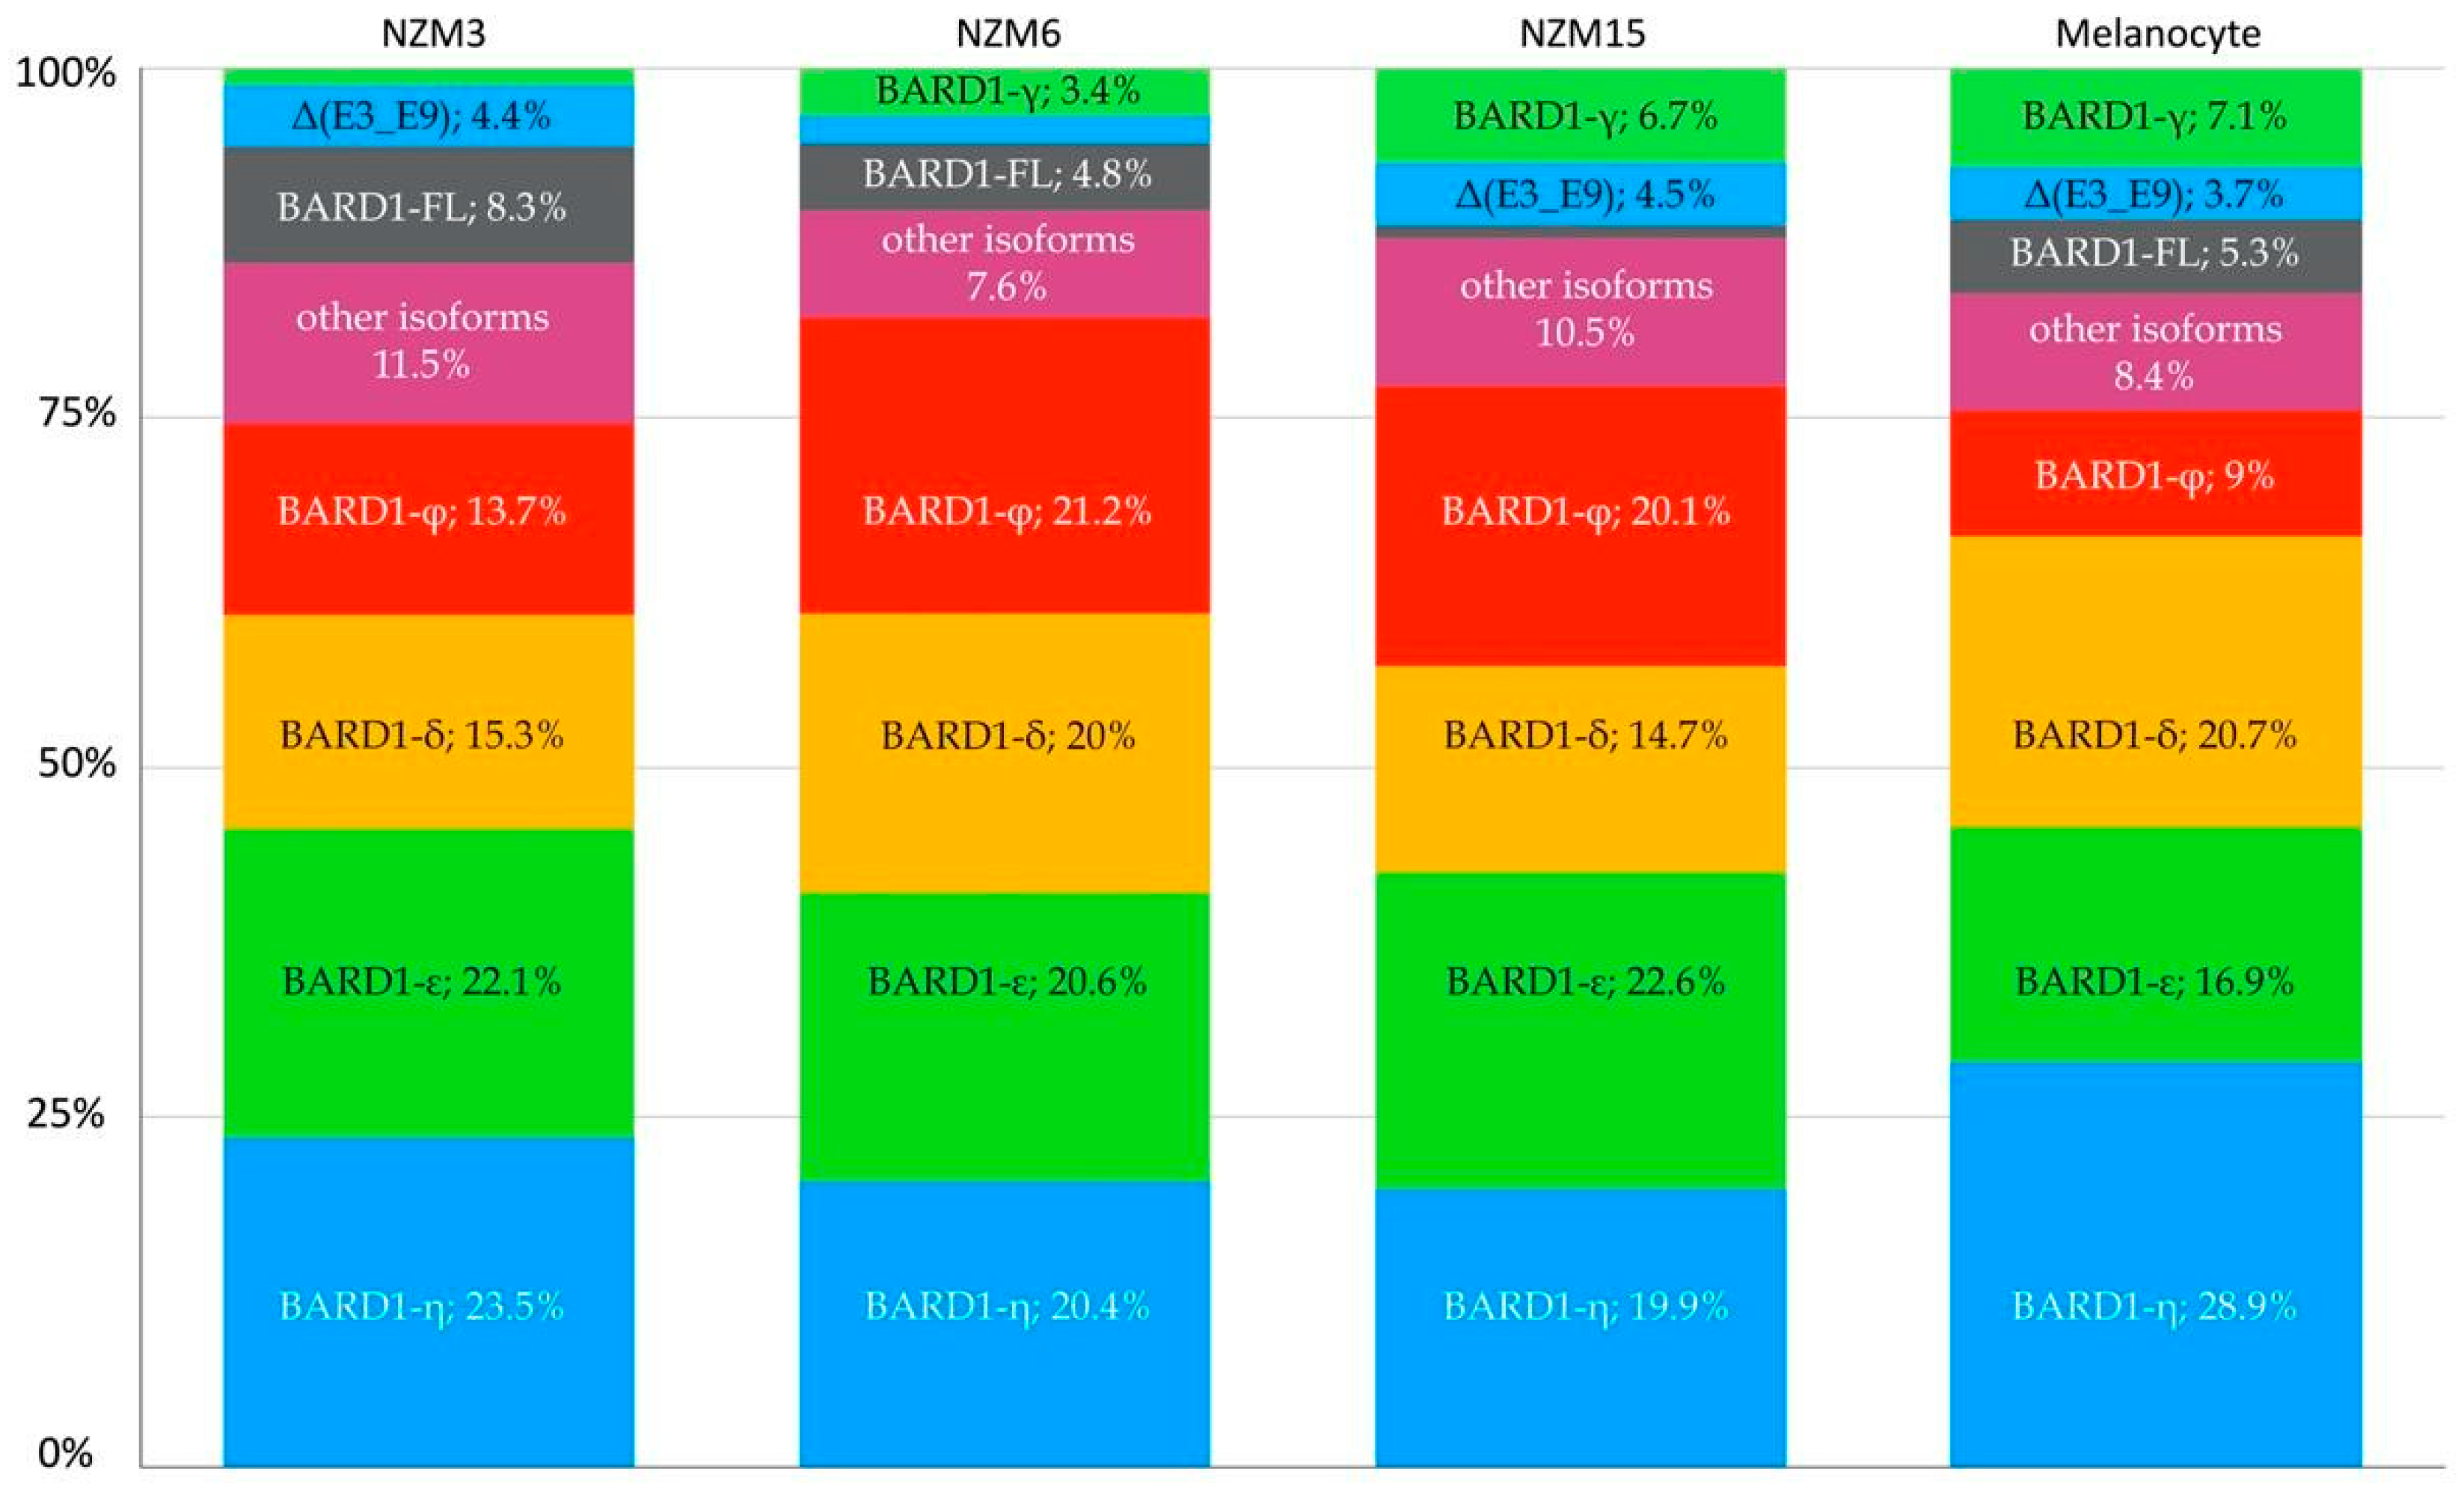
3.3. RNA-Seq
4. Discussion
5. Conclusions
Supplementary Materials
Author Contributions
Funding
Institutional Review Board Statement
Informed Consent Statement
Data Availability Statement
Acknowledgments
Conflicts of Interest
References
- Jenkins, R.W.; Fisher, D.E. Treatment of Advanced Melanoma in 2020 and Beyond. J. Investig. Dermatol. 2020, 1–9. [Google Scholar] [CrossRef]
- Bolick, N.L.; Geller, A.C. Epidemiology of Melanoma. Hematol. Oncol. Clin. N. Am. 2021, 35, 57–72. [Google Scholar] [CrossRef]
- Godar, D.E. Worldwide Increasing Incidences of Cutaneous Malignant Melanoma. J. Skin Cancer 2011, 2011, 858425. [Google Scholar] [CrossRef] [PubMed]
- Wu, L.C.; Wang, Z.W.; Tsan, J.T.; Spillman, M.A.; Phung, A.; Xu, X.L.; Yang, M.C.W.; Hwang, L.Y.; Bowcock, A.M.; Baer, R. Identification of a RING protein that can interact in vivo with the BRCA1 gene product. Nat. Genet. 1996, 14, 430–440. [Google Scholar] [CrossRef]
- Hashizume, R.; Fukuda, M.; Maeda, I.; Nishikawa, H.; Oyake, D.; Yabuki, Y.; Ogata, H.; Ohta, T. The RING Heterodimer BRCA1-BARD1 Is a Ubiquitin Ligase Inactivated by a Breast Cancer-derived Mutation. J. Biol. Chem. 2001, 276, 14537–14540. [Google Scholar] [CrossRef] [Green Version]
- Chen, A.; Kleiman, F.E.; Manley, J.L.; Ouchi, T. Autoubiquitination of the BRCA1·BARD1 RING ubiquitin ligase. J. Biol. Chem. 2002, 277, 22085–22092. [Google Scholar] [CrossRef] [Green Version]
- Starita, L.M.; Machida, Y.; Sankaran, S.; Elias, J.E.; Griffin, K.; Schlegel, B.P.; Gygi, S.P.; Parvin, J.D. BRCA1-Dependent Ubiquitination of γ-Tubulin Regulates Centrosome Number. Mol. Cell. Biol. 2004, 24, 8457–8466. [Google Scholar] [CrossRef] [Green Version]
- Starita, L.M.; Horwitz, A.A.; Keogh, M.C.; Ishioka, C.; Parvin, J.D.; Chiba, N. BRCA1/BARD1 ubiquitinate phosphorylated RNA polymerase II. J. Biol. Chem. 2005, 280, 24498–24505. [Google Scholar] [CrossRef] [Green Version]
- Morris, J.R.; Solomon, E. BRCA1: BARD1 induces the formation of conjugated ubiquitin structures, dependent on K6 of ubiquitin, in cells during DNA replication and repair. Hum. Mol. Genet. 2004, 13, 807–817. [Google Scholar] [CrossRef] [Green Version]
- Irminger-Finger, I.; Leung, W.C.; Li, J.; Dubois-Dauphin, M.; Harb, J.; Feki, A.; Jefford, C.E.; Soriano, J.V.; Jaconi, M.; Montesano, R.; et al. Identification of BARD1 as mediator between proapoptotic stress and p53-dependent apoptosis. Mol. Cell 2001, 8, 1255–1266. [Google Scholar] [CrossRef]
- Cimmino, F.; Avitabile, M.; Diskin, S.J.; Vaksman, Z.; Pignataro, P.; Formicola, D.; Cardinale, A.; Testori, A.; Koster, J.; de Torres, C.; et al. Fine mapping of 2q35 high-risk neuroblastoma locus reveals independent functional risk variants and suggests full-length BARD1 as tumor-suppressor. Int. J. Cancer 2018, 143, 2828–2837. [Google Scholar] [CrossRef] [Green Version]
- Capasso, M.; Diskin, S.J.; Totaro, F.; Longo, L.; de Mariano, M.; Russo, R.; Cimmino, F.; Hakonarson, H.; Tonini, G.P.; Devoto, M.; et al. Replication of GWAS-identified neuroblastoma risk loci strengthens the role of BARD1 and affirms the cumulative effect of genetic variations on disease susceptibility. Carcinogenesis 2013, 34, 605–611. [Google Scholar] [CrossRef] [Green Version]
- Chen, J.; Weiss, W.A. Alternative splicing in cancer: Implications for biology and therapy. Oncogene 2015, 34, 1–14. [Google Scholar] [CrossRef]
- Li, H.D.; Menon, R.; Omenn, G.S.; Guan, Y. The emerging era of genomic data integration for analyzing splice isoform function. Trends Genet. 2014, 30, 340–347. [Google Scholar] [CrossRef] [PubMed] [Green Version]
- Watters, A.K.; Seltzer, E.S.; Mackenzie, D.J.; Young, M.; Muratori, J.; Hussein, R.; Sodoma, A.M.; To, J.; Singh, M. The Effects of Genetic and Epigenetic Alterations of Non-Gynecological Cancers. Genes (Basel) 2020, 11, 829. [Google Scholar] [CrossRef] [PubMed]
- Irminger-Finger, I.; Ratajska, M.; Pilyugin, M. New concepts on BARD1: Regulator of BRCA pathways and beyond. Int. J. Biochem. Cell Biol. 2016, 72, 1–17. [Google Scholar] [CrossRef] [Green Version]
- Li, L.; Cohen, M.; Wu, J.Y.; Sow, M.H.; Nikolic, B.; Bischof, P.; Irminger-Finger, I. Identification of BARD1 splice-isoforms involved in human trophoblast invasion. Int. J. Biochem. Cell Biol. 2007, 39, 1659–1672. [Google Scholar] [CrossRef]
- Bosse, K.R.; Diskin, S.J.; Cole, K.A.; Wood, A.C.; Schnepp, R.W.; Norris, G.; Nguyen, L.B.; Jagannathan, J.; Laquaglia, M.; Winter, C.; et al. Common variation at BARD1 results in the expression of an oncogenic isoform that influences neuroblastoma susceptibility and oncogenicity. Cancer Res. 2012, 72, 2068–2078. [Google Scholar] [CrossRef] [Green Version]
- Ozden, O.; Bishehsari, F.; Bauer, J.; Park, S.H.; Jana, A.; Baik, S.H.; Sporn, J.C.; Staudacher, J.J.; Yazici, C.; Krett, N.; et al. Expression of an Oncogenic BARD1 Splice Variant Impairs Homologous Recombination and Predicts Response to PARP-1 Inhibitor Therapy in Colon Cancer. Sci. Rep. 2016, 6, 26273. [Google Scholar] [CrossRef]
- Cimmino, F.; Formicola, D.; Capasso, M. Dualistic role of BARD1 in cancer. Genes (Basel) 2017, 8, 375. [Google Scholar] [CrossRef] [Green Version]
- Baer, R.; Ludwig, T. The BRCA1/BARD1 heterodimer, a tumor suppressor complex with ubiquitin E3 ligase activity. Curr. Opin. Genet. Dev. 2002, 12, 86–91. [Google Scholar] [CrossRef]
- Densham, R.M.; Garvin, A.J.; Stone, H.R.; Strachan, J.; Baldock, R.A.; Daza-Martin, M.; Fletcher, A.; Blair-Reid, S.; Beesley, J.; Johal, B.; et al. Human BRCA1-BARD1 ubiquitin ligase activity counteracts chromatin barriers to DNA resection. Nat. Struct. Mol. Biol. 2016, 23, 647–655. [Google Scholar] [CrossRef] [Green Version]
- Tarsounas, M.; Sung, P. The antitumorigenic roles of BRCA1–BARD1 in DNA repair and replication. Nat. Rev. Mol. Cell Biol. 2020, 21, 284–299. [Google Scholar] [CrossRef]
- Laufer, M.; Nandula, S.V.; Modi, A.P.; Wang, S.; Jasin, M.; Murty, V.V.V.S.; Ludwig, T.; Baer, R. Structural requirements for the BARD1 tumor suppressor in chromosomal stability and homology-directed DNA repair. J. Biol. Chem. 2007, 282, 34325–34333. [Google Scholar] [CrossRef] [Green Version]
- Knijnenburg, T.A.; Wang, L.; Zimmermann, M.T.; Chambwe, N.; Gao, G.F.; Cherniack, A.D.; Fan, H.; Shen, H.; Way, G.P.; Greene, C.S.; et al. Genomic and Molecular Landscape of DNA Damage Repair Deficiency across The Cancer Genome Atlas. Cell Rep. 2018, 23, 239–254.e6. [Google Scholar] [CrossRef] [PubMed] [Green Version]
- Kabbarah, O.; Chin, L. Revealing the genomic heterogeneity of melanoma. Cancer Cell 2005, 8, 439–441. [Google Scholar] [CrossRef] [PubMed] [Green Version]
- Kono, N.; Arakawa, K. Nanopore sequencing: Review of potential applications in functional genomics. Dev. Growth Differ. 2019, 61, 316–326. [Google Scholar] [CrossRef] [Green Version]
- Fleige, S.; Pfaffl, M.W. RNA integrity and the effect on the real-time qRT-PCR performance. Mol. Aspects Med. 2006, 27, 126–139. [Google Scholar] [CrossRef]
- Hrdlickova, R.; Toloue, M.; Tian, B. RNA-Seq methods for transcriptome analysis. Wiley Interdiscip. Rev. RNA 2017, 8. [Google Scholar] [CrossRef] [Green Version]
- Kim, J.E.; Stones, C.; Joseph, W.R.; Leung, E.; Finlay, G.J.; Shelling, A.N.; Phillips, W.A.; Shepherd, P.R.; Baguley, B.C. Comparison of growth factor signalling pathway utilisation in cultured normal melanocytes and melanoma cell lines. BMC Cancer 2012, 12, 141. [Google Scholar] [CrossRef] [PubMed] [Green Version]
- Walker, L.C.; Lattimore, V.L.; Kvist, A.; Kleiblova, P.; Zemankova, P.; de Jong, L.; Wiggins, G.A.R.; Hakkaart, C.; Cree, S.L.; Behar, R.; et al. Comprehensive Assessment of BARD1 Messenger Ribonucleic Acid Splicing With Implications for Variant Classification. Front. Genet. 2019, 10, 1139. [Google Scholar] [CrossRef] [PubMed]
- Tang, A.D.; Soulette, C.M.; van Baren, M.J.; Hart, K.; Hrabeta-Robinson, E.; Wu, C.J.; Brooks, A.N. Full-length transcript characterization of SF3B1 mutation in chronic lymphocytic leukemia reveals downregulation of retained introns. Nat. Commun. 2020, 11, 1438. [Google Scholar] [CrossRef] [Green Version]
- Dobin, A.; Davis, C.A.; Schlesinger, F.; Drenkow, J.; Zaleski, C.; Jha, S.; Batut, P.; Chaisson, M.; Gingeras, T.R. STAR: Ultrafast universal RNA-seq aligner. Bioinformatics 2013, 29, 15–21. [Google Scholar] [CrossRef]
- Pertea, M.; Pertea, G.M.; Antonescu, C.M.; Chang, T.C.; Mendell, J.T.; Salzberg, S.L. StringTie enables improved reconstruction of a transcriptome from RNA-seq reads. Nat. Biotechnol. 2015, 33, 290–295. [Google Scholar] [CrossRef] [Green Version]
- Tembe, V.; Henderson, B.R. BARD1 translocation to mitochondria correlates with bax oligomerization, loss of mitochondrial membrane potential, and apoptosis. J. Biol. Chem. 2007, 282, 20513–20522. [Google Scholar] [CrossRef] [Green Version]
- Feki, A.; Jefford, C.E.; Berardi, P.; Wu, J.Y.; Cartier, L.; Krause, K.H.; Irminger-Finger, I. BARD1 induces apoptosis by catalysing phosphorylation of p53 by DNA-damage response kinase. Oncogene 2005, 24, 3726–3736. [Google Scholar] [CrossRef] [Green Version]
- Kleiman, F.E.; Manley, J.L. Functional interaction of BRCA1-associated BARD1 with polyadenylation factor CstF-50. Science (80-. ) 1999, 285, 1576–1579. [Google Scholar] [CrossRef]
- Kleiman, F.E.; Manley, J.L. The BARD1-CstF-50 interaction links mRNA 3′ end formation to DNA damage and tumor suppression. Cell 2001, 104, 743–753. [Google Scholar] [CrossRef]
- Tembe, V.; Martino-Echarri, E.; Marzec, K.A.; Mok, M.T.S.; Brodie, K.M.; Mills, K.; Lei, Y.; DeFazio, A.; Rizos, H.; Kettle, E.; et al. The BARD1 BRCT domain contributes to p53 binding, cytoplasmic and mitochondrial localization, and apoptotic function. Cell. Signal. 2015, 27, 1763–1771. [Google Scholar] [CrossRef]
- Irminger-Finger, I.; Soriano, J.V.; Vaudan, G.; Montesano, R.; Sappino, A.P. In vitro repression of Brca1-associated RING domain gene, Bard1, induces phenotypic changes in mammary epithelial cells. J. Cell Biol. 1998, 143, 1329–1339. [Google Scholar] [CrossRef] [PubMed]
- Brzovic, P.S.; Rajagopal, P.; Hoyt, D.W.; King, M.; Klevit, R.E. Structure of a BRCA1 – BARD1 heterodimeric RING – RING complex. Nat. Struct. Biol. 2001, 8, 833–837. [Google Scholar] [CrossRef] [PubMed]
- Rodriguez, J.A.; Schüchner, S.; Au, W.W.Y.; Fabbro, M.; Henderson, B.R. Nuclear-cytoplasmic shuttling of BARD1 contributes to its proapoptotic activity and is regulated by dimerization with BRCA1. Oncogene 2004, 23, 1809–1820. [Google Scholar] [CrossRef] [Green Version]
- Li, L.; Ryser, S.; Dizin, E.; Pils, D.; Krainer, M.; Jefford, C.E.; Bertoni, F.; Zeillinger, R.; Irminger-Finger, I. Oncogenic BARD1 isoforms expressed in gynecological cancers. Cancer Res. 2007, 67, 11876–11885. [Google Scholar] [CrossRef] [PubMed] [Green Version]
- Lalonde, S.; Stone, O.A.; Lessard, S.; Lavertu, A.; Desjardins, J.; Beaudoin, M.; Rivas, M.; Stainier, D.Y.R.; Lettre, G. Frameshift indels introduced by genome editing can lead to in-frame exon skipping. PLoS ONE 2017, 12, e0178700. [Google Scholar] [CrossRef] [PubMed]

Publisher’s Note: MDPI stays neutral with regard to jurisdictional claims in published maps and institutional affiliations. |
© 2021 by the authors. Licensee MDPI, Basel, Switzerland. This article is an open access article distributed under the terms and conditions of the Creative Commons Attribution (CC BY) license (http://creativecommons.org/licenses/by/4.0/).
Share and Cite
McDougall, L.I.; Powell, R.M.; Ratajska, M.; Lynch-Sutherland, C.F.; Hossain, S.M.; Wiggins, G.A.R.; Harazin-Lechowska, A.; Cybulska-Stopa, B.; Motwani, J.; Macaulay, E.C.; et al. Differential Expression of BARD1 Isoforms in Melanoma. Genes 2021, 12, 320. https://doi.org/10.3390/genes12020320
McDougall LI, Powell RM, Ratajska M, Lynch-Sutherland CF, Hossain SM, Wiggins GAR, Harazin-Lechowska A, Cybulska-Stopa B, Motwani J, Macaulay EC, et al. Differential Expression of BARD1 Isoforms in Melanoma. Genes. 2021; 12(2):320. https://doi.org/10.3390/genes12020320
Chicago/Turabian StyleMcDougall, Lorissa I., Ryan M. Powell, Magdalena Ratajska, Chi F. Lynch-Sutherland, Sultana Mehbuba Hossain, George A. R. Wiggins, Agnieszka Harazin-Lechowska, Bożena Cybulska-Stopa, Jyoti Motwani, Erin C. Macaulay, and et al. 2021. "Differential Expression of BARD1 Isoforms in Melanoma" Genes 12, no. 2: 320. https://doi.org/10.3390/genes12020320