
The Influence of a Brand’s Visual Content on Consumer Trust in Social Media Community Groups


Abstract
:1. Introduction
2. Literature Review
2.1. The Link between a Brand’s Visual Information and the Trust and Brand Trust in Social Media Community Groups
2.2. The Attributes Affecting Confidence in a Brand within Social Media Community Groups
3. Materials and Methods
3.1. Context of the Study and the Justification of the Assumptions
3.2. Survey
- –
- The assessment of the characteristics of the video content through the drivers of consumer confidence in the brand;
- –
- The assessment of engagement with the video content through the drivers of consumer confidence in the brand;
- –
- The assessment of confidence in the brand through the engagement with the video content created by the brand on the SMCG.
- Assessment in terms of the four triggers of trust in a brand: video content quality and informativeness, fun of the video content, attractiveness of the video content and identity of the video content;
- Assessment of the consumer’s desire to be engaged in the brand-created video content on the SMCG, which reflects the triggers of confidence in the brand through three engagement variables: cognitive engagement, emotional engagement and engagement by behavior;
- Provided statements designed to clarify whether or not the variables of engagement in the brand-created content in the social media community groups actually reflect confidence in the brand.
3.3. Survey Sample and Data Analysis Methods
4. Results
Hypotheses Testing Results
5. Discussion and Conclusions
Author Contributions
Funding
Institutional Review Board Statement
Informed Consent Statement
Conflicts of Interest
References
- Wang, T. Social identity dimensions and consumer behavior in social media. Asia Pac. Manag. Rev. 2017, 22, 45–51. [Google Scholar] [CrossRef]
- Voramontri, D.; Klieb, L. Impact of social media on consumer behaviour. Int. J. Inf. Decis. Sci. 2019, 11, 209–233. [Google Scholar]
- Pi, S.M.; Chou, C.H.; Liao, H.L. A study of Facebook Groups members’ knowledge sharing. Comput. Hum. Behav. 2013, 29, 1971–1979. [Google Scholar] [CrossRef]
- Shareef, M.A.; Mukerji, B.; Dwivedi, Y.K.; Rana, N.P.; Islam, R. Social media marketing: Comparative effect of advertisement sources. J. Retail. Consum. Serv. 2019, 46, 58–69. [Google Scholar] [CrossRef] [Green Version]
- Ancillai, C.; Terho, H.; Cardinali, S.; Pascucci, F. Advancing social media driven sales research: Establishing conceptual foundations for B-to-B social selling. Ind. Mark. Manag. 2019, 82, 293–308. [Google Scholar] [CrossRef]
- Siudikienė, D. Vartotojų įsitraukimas į prekės ženklo bendruomenę. Inf. Moksl. 2016, 74, 50–69. [Google Scholar] [CrossRef] [Green Version]
- Euromonitor Economies and Consumers Annual Data. 2020. Available online: https://portal.euromonitor.com/portal/statisticsevolution/index (accessed on 10 March 2021).
- Chu, S.C. Viral advertising in social media: Participation in Facebook groups and responses among college-aged users. J. Interact. Advert. 2011, 12, 30–43. [Google Scholar] [CrossRef]
- Lou, C.; Yuan, S. Influencer marketing: How message value and credibility affect consumer trust of branded content on social media. J. Interact. Advert. 2019, 19, 58–73. [Google Scholar] [CrossRef]
- Han, S.L.; Sung, H.S. Industrial brand value and relationship performance in business markets–A general structural equation model. Ind. Mark. Manag. 2008, 37, 807–818. [Google Scholar] [CrossRef]
- Li, H.; Lo, H.Y. Do you recognize its brand? The effectiveness of online in-stream video advertisements. J. Advert. 2015, 44, 208–218. [Google Scholar] [CrossRef]
- Anderson, B. B2B Marketers Leverage Interactive Content for Relevant Buyer Experiences. Demand Gen Report. 2015. Available online: https://www.demandgenreport.com/features/industry-insights/b2b-marketers-leverage-interactive-content-for-relevant-buyer-experiences (accessed on 14 December 2020).
- Kim, D.H.; Spiller, L.; Hettche, M. Analyzing media types and content orientations in Facebook for global brands. J. Res. Interact. Mark. 2015, 9, 4–30. [Google Scholar] [CrossRef]
- Holzner, S. Facebook Marketing: Leverage Social Media to Grow Your Business; Pearson Education: London, UK, 2008. [Google Scholar]
- Hollebeek, L.D.; Macky, K. Digital content marketing′s role in fostering consumer engagement, trust, and value: Framework, fundamental propositions, and implications. J. Interact. Market. 2019, 45, 27–41. [Google Scholar] [CrossRef]
- Davis, R.; Piven, I.; Breazeale, M. Conceptualizing the brand in social media community: The five sources model. J. Retail. Consum. Serv. 2014, 21, 468–481. [Google Scholar] [CrossRef]
- Myrick, J.G.; Holton, A.E.; Himelboim, I.; Love, B. #Stupidcancer: Exploring a typology of social support and the role of emotional expression in a social media community. Health Commun. 2016, 31, 596–605. [Google Scholar]
- Sirola, A.; Kaakinen, M.; Savolainen, I.; Oksanen, A. Loneliness and online gambling-community participation of young social media users. Comput. Hum. Behav. 2019, 95, 136–145. [Google Scholar] [CrossRef]
- Wongkitrungrueng, A.; Assarut, N. The role of live streaming in building consumer trust and engagement with social commerce sellers. J. Bus. Res. 2020, 117, 543–556. [Google Scholar] [CrossRef]
- Liu, L.; Lee, M.K.; Liu, R.; Chen, J. Trust transfer in social media brand communities: The role of consumer engagement. Int. J. Inf. Manag. 2018, 41, 1–13. [Google Scholar] [CrossRef]
- Harridge-March, S. Can the building of trust overcome consumer perceived risk online? Mark. Intell. Plann. 2006, 24, 746–761. [Google Scholar] [CrossRef]
- Koh, J.; Kim, Y.G.; Kim, Y.G. Sense of virtual community: A conceptual framework and empirical validation. Int. J. Electron. Commer. 2003, 8, 75–94. [Google Scholar] [CrossRef]
- Okoli, D.C. Visual Content, Social Commerce and Consumer; Northumbria University: Newcastle upon Tyne, UK, 2016. [Google Scholar]
- Hajli, M.N. A Study of the Impact of Social Media on Consumers. Int. J. Mark. Res. 2014, 56, 387–404. [Google Scholar] [CrossRef] [Green Version]
- Pathak, B.; Garfinkel, R.; Gopal, R.D.; Venkatesan, R.; Yin, F. Empirical analysis of the impact of recommender systems on sales. J. Manag. Inf. Syst. 2010, 27, 159–188. [Google Scholar] [CrossRef]
- Kim, Y.A.; Ahmad, M.A. Trust, distrust and lack of confidence of users in online social media-sharing communities. Knowl.-Based Syst. 2013, 37, 438–450. [Google Scholar] [CrossRef]
- Kang, J. Social Media Marketing in the Hospitality Industry: The Role of Benefits in Increasing Brand Community Participation and the Impact of Participation on Consumer Trust and Commitment toward Hotel and Restaurant Brands. Ph.D. Thesis, Iowa State University, Ames, IA, USA, 2011. Available online: https://lib.dr.iastate.edu/etd/10447 (accessed on 3 December 2020).
- Laroche, M.; Habibi, M.R.; Richard, M.O. To be or not to be in social media: How brand loyalty is affected by social media? Int. J. Inf. Manag. 2013, 33, 76–82. [Google Scholar] [CrossRef]
- Habibi, M.R.; Laroche, M.; Richard, M.O. The roles of brand community and community engagement in building brand trust on social media. Comput. Hum. Behav. 2014, 37, 152–161. [Google Scholar] [CrossRef]
- Jibril, A.B.; Kwarteng, M.A.; Chovancova, M.; Pilik, M. The impact of social media on consumer-brand loyalty: A mediating role of online based-brand community. Cogent Bus. Manag. 2019, 6, 1673640. [Google Scholar] [CrossRef]
- Santos, Z.R.; Coelho, P.S.; Rita, P. Fostering Consumer–Brand Relationships through social media brand communities. J. Mark. Commun. 2021. [Google Scholar] [CrossRef]
- Wang, X.; Wang, Y.; Lin, X.; Abdullat, A. The dual concept of consumer value in social media brand community: A trust transfer perspective. Int. J. Inf. Manag. 2021, 59, 102319. [Google Scholar] [CrossRef]
- Zhang, Z.; Gu, C. Effects of consumer social interaction on trust in online group-buying contexts: An empirical study in China. J. Electron. Commer. Res. 2015, 16, 1. [Google Scholar]
- Zailskaitė-Jakštė, L. Consumer Engagement Behaviour in Social Media Communication Impact on Brand Equity. Ph.D. Thesis, Kauno Technologijos Universitetas, Kaunas, Lithuania, 2018. [Google Scholar]
- Danaitis, K.S.; Usovaitė, A. Vizualinė Komunikacija: Kompiuterinės Grafikos Įrankių Taikymas, Kuriant Logotipą. Coactivity/Santalka 2012, 20, 78–90. [Google Scholar] [CrossRef]
- Dunay, P.; Krueger, R. Facebook Marketing for Dummies; John Wiley and Sons: Hoboken, NJ, USA, 2009. [Google Scholar]
- Jakic, A.; Wagner, M.O.; Meyer, A. The impact of language style accommodation during social media interactions on brand trust. J. Serv. Manag. 2017, 28, 418–441. [Google Scholar] [CrossRef]
- Sharma, R.; Alavi, S.; Ahuja, V. Generating trust using Facebook-A study of 5 online apparel brands. Procedia Comput. Sci. 2017, 122, 42–49. [Google Scholar] [CrossRef]
- Busser, J.A.; Shulga, L.V. Involvement in consumer-generated advertising. Int. J. Contemp. Hosp. Manag. 2019, 31, 1763–1784. [Google Scholar] [CrossRef]
- Hinson, R.; Boateng, H.; Renner, A.; Kosiba, J.P.B. Antecedents and consequences of customer engagement on Facebook. J. Res. Interact. Mark. 2019, 13, 204–226. [Google Scholar] [CrossRef]
- Statista-The Statistics Portal for Market Data, Market Research and Market Studies. Available online: https://www.utu.fi/en/news/news/statista-the-statistics-portal-for-market-data-market-research-and-market-studies (accessed on 21 March 2019).
- Soni, N.; Verghese, M. Analyzing the Impact of Online Brand Trust on Sales Promotion and Online Buying Decision. IUP J. Mark. Manag. 2018, 11, 234–254. [Google Scholar]
- Engage and Support Customers on Social Media–NapoleonCat. Available online: https://napoleoncat.com (accessed on 4 January 2020).

| Author, Year | Context of the Study |
|---|---|
| Kim, Spiller and Hettche [13] | The survey was conducted on the social network Facebook, involved studying the content of the brand social networks, its formats: textual, pictures and video clips. |
| Okoli [23] | The survey was focused on social networks in the most general sense and analysed video clips as a video content form. |
| Danaitis and Usovaitė [35] | Analysis of the graphic and creative aspects of video content. |
| Lou and Yuan [9] | The survey focused upon the impact of social media influencers upon consumers; the aspects examined content informativeness, credibility, attractiveness, identity, brand awareness and purchase intentions. |
| Harridge-March [21] | The survey focused on consumers in electronic commerce while studying consumer confidence and the perceived risks. |
| Liu et al. [20] | The survey mainly focused on confidence in the brand; possibilities to transpose the confidence in brands to the social media brand communities. |
| Koh et al. [22] | The study focused on the behaviour of members of virtual communities; community spirit, virtual community leaders, live member meetings, satisfaction with community content. |
| Hypothesis | Summary and Justification |
|---|---|
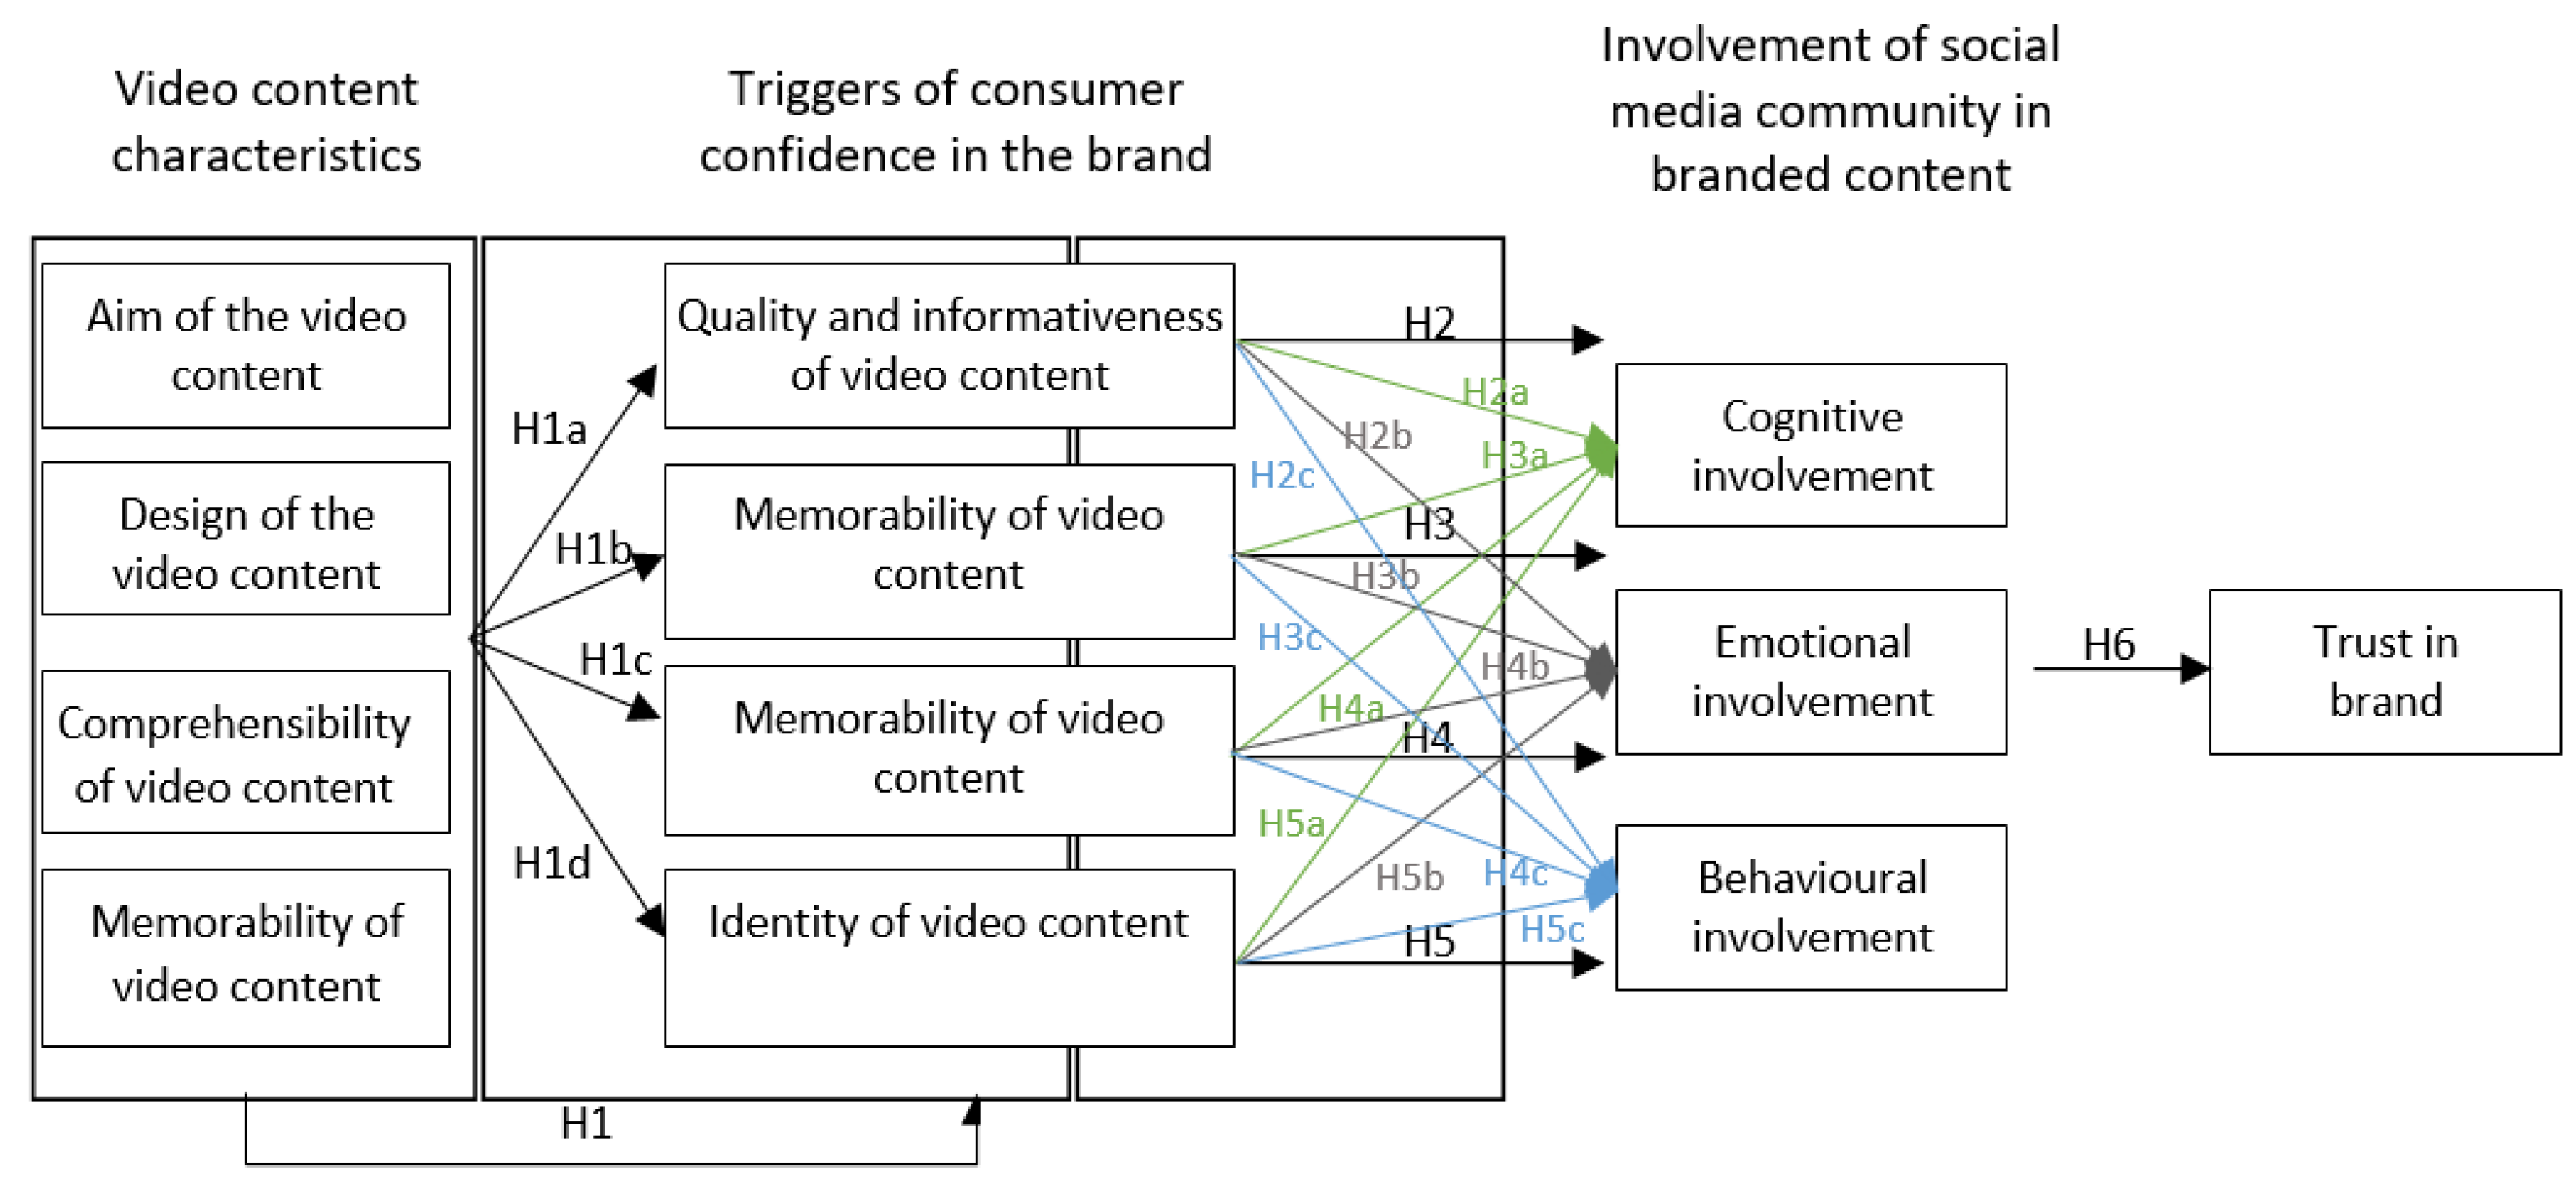
| (H1) The characteristics of video content affect the drivers of consumer confidence in the brand | Hypothesis H1 seeks to identify the confidence drivers that can be reflected by the video image created by a brand within social media community groups. Since there are total four confidence drivers, hypothesis H1 distinguished four additional partial hypotheses (a, b, c, and d) that specifically define the boundaries of the study of the possible influence of video content characteristics on each confidence driver. Seeking to mitigate the complexity of the task, the video content characteristics were assessed as a single variable that due to its entirety that encompasses the purpose of the content, its design, comprehensibility, and memorability, could affect the consumer confidence drivers and the overall trust in a brand. This hypothesis arises from the sources in research literature |
| (H1a) The characteristics of video content affect the quality and the informativeness of the video content | |
| (H1b) The characteristics of video content affect its entertainment qualities | |
| (H1c) The characteristics of video content affect its attractiveness | |
| (H1d) The characteristics of video content affect its identity | |
| (H2) The quality and the informativeness of the video content affect the involvement of the content created by a brand within the social network community groups. | The H2–H5 hypotheses were identified to clarify whether the confidence drivers can affect the consumer involvement that is otherwise considered to be a manifestation of consumer confidence. Since engagement consists of three variables (cognitive, emotional and behavioral), the H2–H5 hypotheses have also some partial hypotheses (a, b, and c) that helps identifying the effect of each confidence triggers upon a specific engagement. The H2–H5 hypotheses arise from the sources in research literature. The H6 hypothesis encompasses an overall assessment whether or not involvement in the video content created by a brand within social media community groups affect the confidence in the brand The hypothesis arises from the assumption of the importance of confidence in the consumer procurement process in the span between the communication and the procurement, that was addressed in the model designed and the studies carried out by Soni and Verghese [42]. |
| (H2a) The quality and the informativeness of the video content affect the cognitive involvement | |
| (H2b) The quality and the informativeness of the video content affect the emotional involvement | |
| (H2c) The quality and the informativeness of the video content affect the behavioural involvement | |
| (H3) The fun of the video content affects the involvement in the content created by a brand within the social network community groups. | |
| (H3a) The fun of the video content affects the cognitive involvement | |
| (H3b) The fun of video content affects the emotional involvement | |
| (H3c) The fun of the video content affects the behavioural involvement | |
| (H4) The attractiveness of the video content affects the involvement in the content created by a brand within the social network community groups. | |
| (H4a) The attractiveness of the video content affects the cognitive involvement | |
| (H4b) The attractiveness of the video content affects the emotional involvement | |
| (H4c) The fun of the video content affects the behavioural involvement | |
| (H5) The identity of the video content affects the involvement in the content created by a brand within the social network community groups. | |
| (H5a) The identity of the video content affects the cognitive involvement | |
| (H5b) The identity of the video content affects the emotional involvement | |
| (H5c) The identity of the video content affects the behavioural involvement | |
| (H6) Involvement in the video content created by a brand within social media community groups affect the confidence in the brand |
| Example 1 | Example 2 | |
|---|---|---|
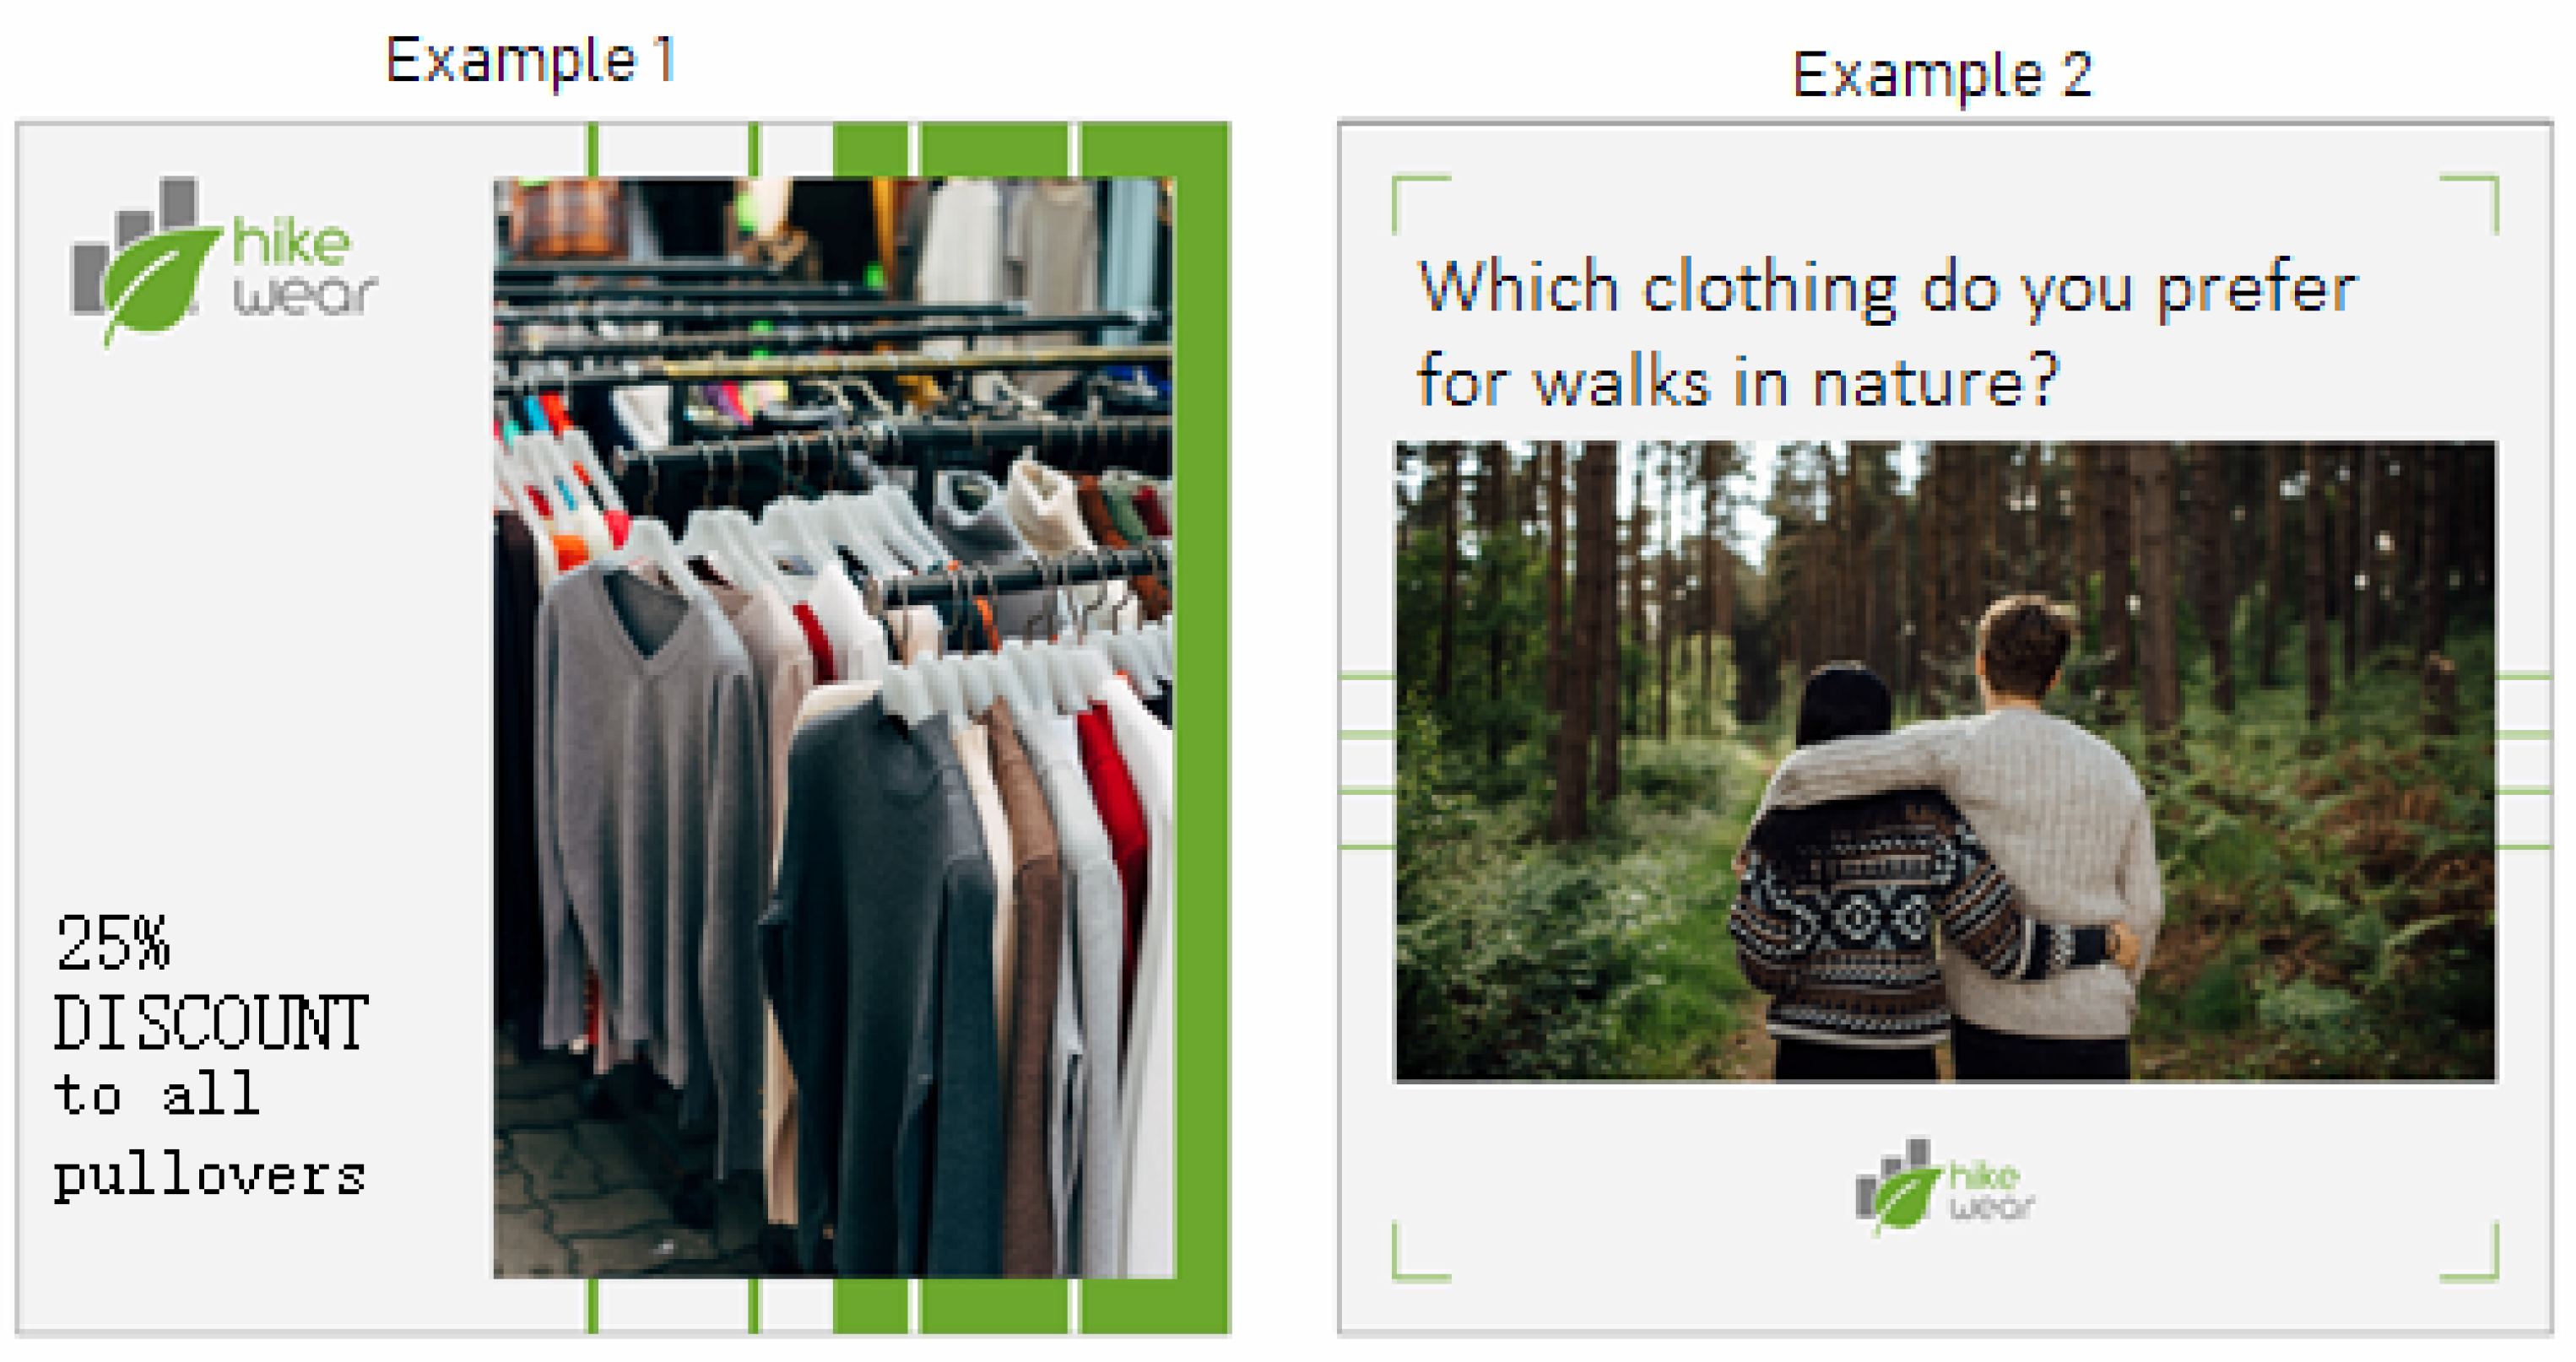
| Objective | Task-focused Discount for sweaters | Engagement-focused Question to SMCG members |
| Format | Picture | Picture |
| Dominant colors |  |  |
| Graphic elements | Font—lean Graphic pictures—vertical lines, vertical rectangle Vertical picture of the apparel Brand logo | Font—lean Graphic pictures—horizontal lines angles Horizontal picture with people Brand logo |
| Composition | Square layout Asymmetrical alignment—text and graphic pictures on the left, and the picture on the right | Square layout Symmetrical alignment—horizontally centered |
| Easy to share | Square form—optimal to all devices, size: 1080 × 1080 pixels | Square form—optimal to all devices, size: 1080 × 1080 pixels |
| Visual story telling | Conveyed image from the display in the store | People walking dressed in branded pullovers |
| Comprehensibility | The picture complements the provided information | The picture complements the question by illustrating it |
| Construct Scale | Cronbach’s Alpha Value |
|---|---|
| Video content characteristics | 0.940 |
| Confidence Triggers through the Video Content (Video Content Example 1) | |
| Quality and informativeness | 0.886 |
| Fun | 0.894 |
| Attractiveness | 0.924 |
| Identity | 0.921 |
| Confidence Triggers through the Video Content (Video Content Example 2) | |
| Quality and informativeness | 0.879 |
| Fun | 0.881 |
| Attractiveness | 0.927 |
| Identity | 0.888 |
| Confidence Triggers through the Video Content (Both Video Content Examples) | |
| Quality and informativeness | 0.925 |
| Fun | 0.910 |
| Attractiveness | 0.932 |
| Identity | 0.899 |
| Engagement with Confidence Triggers | |
| Cognitive engagement | 0.936 |
| Emotional engagement | 0.932 |
| Engagement by behavior | 0.936 |
| Significance of the engagement on the confidence | 0.855 |
| Total Cronbach’s alpha of all statements | 0.921 |
| Factors and Variables | Factor Loadings |
|---|---|
| Video Content Characteristics | |
| The video content seems engaging (video content example 1) | 0.744 |
| The information video content seems relevant (video content example 1) | 0.819 |
| I like the font used in the video content (video content example 1) | 0.791 |
| I like the colors used in the video content (video content example 1) | 0.749 |
| I like the picture used in the video content (video content example 1) | 0.723 |
| I like that the video content uses the logo (video content example 1) | 0.524 |
| The information contained in the video content is clear (video content example 1) | 0.665 |
| The video content seems engaging (video content example 2) | 0.819 |
| The information video content seems relevant (video content example 2) | 0.770 |
| I like the font used in the video content (video content example 2) | 0.831 |
| I like the colors used in the video content (video content example 2) | 0.796 |
| I like the picture used in the video content (video content example 1) | 0.782 |
| I like that the video content uses the logo (video content example 2) | 0.800 |
| The information contained in the video content is clear (video content example 2) | 0.710 |
| KMO:0.870; Bartlett: 0.000 | |
| Overall Quality and Informativeness of the Video Content | Overall Fun of the Video Content | Attractiveness of the Video Content | Overall Identity of the Video Content | |||
|---|---|---|---|---|---|---|
| Spearman’s rho | Purpose of the video content | Correlation Coefficient | 0.868 | 0.930 | 0.854 | 0.884 |
| Sig. (two-tailed) | 0.000 | 0.000 | 0.000 | 0.000 | ||
| Eil. | 387 | 387 | 387 | 387 | ||
| Design of the video content | Correlation Coefficient | 0.799 | 0.799 | 0.916 | 0.779 | |
| Sig. (two-tailed) | 0.000 | 0.000 | 0.000 | 0.000 | ||
| Eil. | 387 | 387 | 387 | 387 | ||
| Understandability of the video content | Correlation Coefficient | 0.484 | 0.583 | 0.660 | 0.635 | |
| Sig. (two-tailed) | 0.000 | 0.000 | 0.000 | 0.000 | ||
| No. | 387 | 387 | 387 | 387 | ||
| Memorability of the video content | Correlation Coefficient | 0.830 | 0.679 | 0.710 | 0.649 | |
| Sig. (two-tailed) | 0.000 | 0.000 | 0.000 | 0.000 | ||
| Eil. | 387 | 387 | 387 | 387 | ||
| Dependent Variable | R² | ANOVA | Independent Variable | Non-Standardized Coefficients | Standardized Coefficient | p-Value | ||
|---|---|---|---|---|---|---|---|---|
| F | p-Value | B | Standard Deviation | Beta | ||||
| Overall quality and informativeness of the video content | 0.869 | 632.373 | 0.000 | Purpose of the video content | 0.495 | 0.045 | 0.445 | 0.000 |
| Design of the video content | 0.198 | 0.039 | 0.192 | 0.000 | ||||
| Understandability of the video content | −0.070 | 0.036 | −0.057 | 0.053 | ||||
| Memorability of the video content | 0.468 | 0.033 | 0.415 | 0.000 | ||||
| Overall fun of the video content | 0.869 | 633.158 | 0.000 | Purpose of the video content | 0.977 | 0.043 | 0.907 | 0.000 |
| Design of the video content | 0.097 | 0.038 | 0.097 | 0.011 | ||||
| Understandability of the video content | −0.127 | 0.035 | −0.108 | 0.000 | ||||
| Memorability of the video content | 0.030 | 0.032 | 0.027 | 0.354 | ||||
| Attractiveness of the video content | 0.882 | 714.559 | 0.000 | Purpose of the video content | 0.292 | 0.043 | 0.257 | 0.000 |
| Design of the video content | 0.547 | 0.038 | 0.521 | 0.000 | ||||
| Understandability of the video content | 0.209 | 0.035 | 0.169 | 0.000 | ||||
| Memorability of the video content | 0.075 | 0.032 | 0.065 | 0.021 | ||||
| Overall identity of the video content | 0.776 | 330.795 | 0.000 | Purpose of the video content | 0.685 | 0.053 | 0.674 | 0.000 |
| Design of the video content | 0.061 | 0.046 | 0.065 | 0.186 | ||||
| Understandability of the video content | 0.116 | 0.043 | 0.104 | 0.007 | ||||
| Memorability of the video content | 0.090 | 0.040 | 0.087 | 0.025 | ||||
| Dependent Variable | R² | ANOVA | Independent Variable | Non-Standardized Coefficients | Standardized Coefficient | p-Value | ||
|---|---|---|---|---|---|---|---|---|
| F | p-Value | B | Standard Deviation | Beta | ||||
| Cognitive engagement | 0.559 | 120.864 | 0.000 | Overall quality and informativeness of the video content | 0.246 | 0.062 | 0.305 | 0.000 |
| Overall fun of the video content | −0.388 | 0.070 | −0.466 | 0.000 | ||||
| Attractiveness of the video content | 0.319 | 0.060 | 0.403 | 0.000 | ||||
| Overall identity of the video content | 0.457 | 0.063 | 0.519 | 0.000 | ||||
| Emotional engagement | 0.528 | 106.878 | 0.000 | Overall quality and informativeness of the video content | 0.167 | 0.065 | 0.205 | 0.000 |
| Overall fun of the video content | −0.457 | 0.073 | −0.546 | 0.000 | ||||
| Attractiveness of the video content | 0.435 | 0.062 | 0.546 | 0.000 | ||||
| Overall identity of the video content | 0.457 | 0.066 | 0.516 | 0.000 | ||||
| Engagement by behavior | 0.549 | 116.047 | 0.000 | Overall quality and informativeness of the video content | 0.188 | 0.077 | 0.190 | 0.015 |
| Overall fun of the video content | 0.122 | 0.087 | 0.120 | 0.163 | ||||
| Attractiveness of the video content | 0.092 | 0.074 | 0.095 | 0.217 | ||||
| Overall identity of the video content | 0.414 | 0.079 | 0.383 | 0.000 | ||||
| Dependent Variable | R² | ANOVA | Independent Variable | Non-Standardized Coefficients | Standardized Coefficient | p-Value | ||
|---|---|---|---|---|---|---|---|---|
| F | p-Value | B | Standard Deviation | Beta | ||||
| Engagement as confidence | 0.836 | 651.405 | 0.000 | Cognitive engagement | 0.213 | 0.083 | 0.193 | 0.011 |
| Emotional engagement | 0.215 | 0.078 | 0.196 | 0.006 | ||||
| Engagement by behavior | 0.549 | 0.026 | 0.611 | 0.000 | ||||
| Hypothesis Summary | Hypothesis | Results |
|---|---|---|
| H1 | The characteristics of video content affect the drivers of consumer confidence in the brand | Partly confirmed |
| H1a | The characteristics of video content affect the quality and the informativeness of the video content | Rejected |
| H1b | The characteristics of video content affect its entertainment qualities | Rejected |
| H1c | The characteristics of video content affect its attractiveness | Confirmed |
| H1d | The characteristics of video content affect its identity | Rejected |
| H2 | The quality and the informativeness of the video content affect the involvement of the content created by a brand within the social network community groups | Confirmed |
| H2a | The quality and the informativeness of the video content affect the cognitive involvement | Confirmed |
| H2b | The quality and the informativeness of the video content affect the emotional involvement | Confirmed |
| H2c | The quality and the informativeness of the video content affect the behavioral involvement | Confirmed |
| H3 | The fun of the video content affects the involvement in the content created by a brand within the social network community groups | Partly confirmed |
| H3a | The fun of the video content affects the cognitive involvement | Confirmed |
| H3b | The fun of video content affects the emotional involvement | Confirmed |
| H3c | The fun of the video content affects the behavioral involvement | Rejected |
| H4 | The attractiveness of the video content affects the involvement in the content created by a brand within the social network community groups | Partly confirmed |
| H4a | The attractiveness of the video content affects the cognitive involvement | Confirmed |
| H4b | The attractiveness of the video content affects the emotional involvement | Confirmed |
| H4c | The fun of the video content affects the behavioral involvement | Rejected |
| H5 | The identity of the video content affects the involvement in the content created by a brand within the social network community groups | Confirmed |
| H5a | The identity of the video content affects the cognitive involvement | Confirmed |
| H5b | The identity of the video content affects the emotional involvement | Confirmed |
| H5c | The identity of the video content affects the behavioral involvement | Confirmed |
| H6 | Engagement with the video content created by a brand within social media community groups affect the confidence in the brand | Confirmed |
Publisher’s Note: MDPI stays neutral with regard to jurisdictional claims in published maps and institutional affiliations. |
© 2021 by the authors. Licensee MDPI, Basel, Switzerland. This article is an open access article distributed under the terms and conditions of the Creative Commons Attribution (CC BY) license (https://creativecommons.org/licenses/by/4.0/).
Share and Cite
Karpenka, L.; Rudienė, E.; Morkunas, M.; Volkov, A. The Influence of a Brand’s Visual Content on Consumer Trust in Social Media Community Groups. J. Theor. Appl. Electron. Commer. Res. 2021, 16, 2424-2441. https://doi.org/10.3390/jtaer16060133
Karpenka L, Rudienė E, Morkunas M, Volkov A. The Influence of a Brand’s Visual Content on Consumer Trust in Social Media Community Groups. Journal of Theoretical and Applied Electronic Commerce Research. 2021; 16(6):2424-2441. https://doi.org/10.3390/jtaer16060133
Chicago/Turabian StyleKarpenka, Lukas, Elzė Rudienė, Mangirdas Morkunas, and Artiom Volkov. 2021. "The Influence of a Brand’s Visual Content on Consumer Trust in Social Media Community Groups" Journal of Theoretical and Applied Electronic Commerce Research 16, no. 6: 2424-2441. https://doi.org/10.3390/jtaer16060133
APA StyleKarpenka, L., Rudienė, E., Morkunas, M., & Volkov, A. (2021). The Influence of a Brand’s Visual Content on Consumer Trust in Social Media Community Groups. Journal of Theoretical and Applied Electronic Commerce Research, 16(6), 2424-2441. https://doi.org/10.3390/jtaer16060133