Article

Evaluation and Optimization of Tour Method for Synthesis of Graphite Oxide with High Specific Surface Area

by
Hanna Bukovska
1,*,
Fernando García-Perez
1,
Natalia Brea Núñez
2,
Laura J. Bonales
3,
Andrés Velasco
4,5,
M. Ángeles Clavero
1,
Javier Martínez
4,6,
Alberto J. Quejido
1,
Isabel Rucandio
1 and
M. Belén Gómez-Mancebo
1,*
1
Technology Department, CIEMAT (Centro de Investigaciones Energéticas, Medioambientales y Tecnológicas), 28040 Madrid, Spain
2
Environmental Department, CIEMAT (Centro de Investigaciones Energéticas, Medioambientales y Tecnológicas), 28040 Madrid, Spain
3
Energy Department, CIEMAT (Centro de Investigaciones Energéticas, Medioambientales y Tecnológicas), 28040 Madrid, Spain
4
Institute of Optoelectronic Systems and Microtechnology, Polytechnic University of Madrid, 28040 Madrid, Spain
5
Department of Electronic Engineering, E.T.S.I de Telecommunicación, Polytechnic University of Madrid, 28040 Madrid, Spain
6
Department of de Materials Science, E.T.S.I de Caminos, Canales y Puertos, Polytechnic University of Madrid, 28040 Madrid, Spain
*
Authors to whom correspondence should be addressed.
Submission received: 31 May 2023 / Revised: 23 June 2023 / Accepted: 26 June 2023 / Published: 5 July 2023
(This article belongs to the Special Issue Adsorption on Carbon-Based Materials)

Abstract

:
Many of the graphene-based structures exhibit an adsorption capacity due to their high specific surface area (SSA) and micropore volume. This capacity makes them competent materials for applications in energy and environmental sectors where efficiency is highly dependent on these properties for applications, such as water decontamination, solar cells or energy storage. The aim of this work is to study graphene-related materials (GRM) for applications where a high SSA is a requirement, considering the ideal SSA of graphene ≅ 2600 m2g−1. For the synthesis of most of the GRMs, some oxidation method such as the Tour method is used to oxidize graphite to graphite oxide (GrO) as an initial step. Our work studies the optimization of this initial step to evaluate the best conditions to obtain GrO with the maximum possible SSA. The different parameters influencing the process have been evaluated and optimized by applying an experimental design (ED). The resulting materials have been characterized by Brunauer–Emmett–Teller (BET), elemental analysis (EA), X-ray diffraction (XRD) and Raman and scanning electron microscopy (SEM). The evaluation of the results shows a maximum SSA of GrO of 67.04 m2g−1 for a temperature of 60 °C, a time of 12 h, a H2O2 volume of 50 mL and 4 g of KMnO4.

Graphical Abstract

1. Introduction

Many of the latest energy and environmental needs require the use of materials with very specific properties, such as low thermal resistance, high electrical conductivity, high specific surface area, porosity or light weight, to meet their goals. Materials with high specific surface area (SSA) are particularly requested, as the efficiency of many industrial applications of importance, such as solar panels manufacturing, batteries or supercapacitors, depends on this very property. Over the last decades, the use of advanced high-SSA materials has highly increased: e.g., metal–organic frameworks [1,2,3], graphitic carbon nitrides [4,5], graphene oxide-based nanomaterials [6,7], zeolites [8,9,10] or porous metal oxides [11,12], use in catalysis due to their adsorption capacity [13,14,15,16], hydrogen storage [17,18], water decontamination [19,20,21,22] or removal of radioactive elements [23,24]. For all these applications, graphene stands out as a material with an exceptionally high SSA, 2600 m2g−1 [25]. Graphene is defined as a two-dimensional one-atom-thick material, consisting of a hexagonal lattice of carbon atoms [26]. Since it was first obtained in 2004 [27], it has increasingly attracted the interest of many researchers for bringing together a number of properties that are difficult to combine in a single material, such as transparency [28], strength [29], electrical conductivity [30], flexibility [31] and biocompatibility [30,32,33]. Those properties make graphene a highly versatile material for a wide range of applications: sensors [34], drug delivery [35], anti-corrosion coatings [36], solar panels [37] or electronics [28,31,38]. However, production issues, such as high energy consumption, pollution or the requirement for expensive equipment, direct band gas or the need for functionalization, mean that for most applications of graphene, its use as a pure material is not feasible. For this reason, work is usually carried out with materials derived from graphene, which are able to maintain most or some of the properties of interest of graphene, depending on the specific goals and applications pursued. GRM can be obtained in the form of fibers [39,40,41], films [42,43,44] or three-dimensional structures [16,45,46,47]. They also have the advantage that they can be doped or functionalized with different elements or compounds to improve them and therefore make them more suitable for each application [48,49,50,51,52,53]. One graphene material that stands out for its high SSA is the graphene aerogel (GA), which also has a low density and high porosity.
In most GA synthesis methods, graphene oxide (GO) is used as the starting material [54,55,56,57]. It is also the starting material for other graphene-related materials such as reduced graphene oxide (rGO), which is also able to reach high values of SSA [58]. In addition, GO in its initial form can be used in a multitude of applications, e.g., for microwave absorption [59,60]. The presence of oxygenated functional groups on the surface of graphene sheets gives them great versatility to carry out different chemical syntheses, i.e., joining them to form aerogel [54,55,61,62,63], reducing them into rGO [64,65,66] or functionalizing them with different organic and inorganic compounds [67,68]. Additionally, GO has a soluble structure in polar media like water, which is used as a solvent for many syntheses methods of this type [69,70,71].
In order to obtain GO, graphite is initially oxidized to graphite oxide (GrO), thus increasing the initial distance between the graphite sheets by introducing oxygenated functional groups that eliminate some of the double bonds of the graphene layers. This decreases the pi interactions between graphite sheets. Therefore, the process of oxidation of graphite to GrO is the initial step in most GRM synthesis methods and will determine both the degree of oxidation and the SSA of the GrO obtained. The first study on the oxidation of graphite was described by Brodie in 1859 [72], where KClO3 and nitric acid were used to treat a suspension of graphite for 4 days at 60 °C. Subsequent studies focused on improving the efficiency of the process and decreasing the risk of explosion due to KClO3. Staudenmaier replaced HNO3 by a mixture of HNO3 and H2SO4, improving the efficiency of the process [73], which could thus be carried out in a single step. However, this method did not avoid the risk of explosion because it still used KClO3 and high temperatures. In 1958, Hummers and Offeman developed a new, faster, more efficient and safer method [74], in which the graphite was treated with NaNO3, H2SO4 and KMnO4. Although it is currently one of the most widely used and modified methods, one of the disadvantages is the generation of toxic gases (NO2 and N2O4) from NaNO3. This problem is avoided with the Marcano–Tour method [75,76], in which the use of NaNO3 is eliminated and the oxidation process is carried out with a mixture of H2SO4 and H3PO4 (9:1) and larger amounts of KMnO4.
The aim of this work is to optimize the process of graphite oxidation. A thorough study of this step is necessary to be able to control and evaluate the SSA, degree of oxidation and porosity of the starting GrO obtained for the synthesis of different GRM. Obtaining a GrO with a high SSA is conclusive for subsequently obtaining GRM materials with a high SSA, which has a direct influence on many applications. For this purpose, the Tour method has been employed, since this method achieves higher degrees of oxidation and does not produce toxic gases [77] (compared to the Hummers method [78]). An experimental design (ED) has been developed with the main parameters that affect the synthesis of the method. These parameters are temperature, time and certain quantities of reagents. The SSA, percentage of carbon (% C) and t-Plot micropore volume (MV) have been chosen as responses of ED since they are the characteristics that have a conclusive role in most adsorption-related applications. In general, studies of the influence of the different process variables are carried out individually, leaving the rest of the variables fixed. This methodology has the disadvantage that the interactions between variables cannot be taken into account, therefore losing part of this information. In our work, a study of all the major variables that can influence the GrO synthesis process is addressed simultaneously, giving rise to a thorough analysis of both the effect of each individual variable and the interactions that appear among them, as well as the properties of the materials obtained under different experimental conditions. With good knowledge of how the different parameters affect the material obtained, a starting point is set for the regulation of its properties and structure according to the needs of future studies and applications.
The extensive characterization carried out on all the GrO samples has provided additional information on the most influential variables in the synthesis, as well as allowing us to verify the method used in the ED.

2. Materials and Methods

2.1. Materials

Graphite powder (<200 µm, synthetic) was purchased from Sigma Aldrich (Riedstr. Steinheim, Switzerland). Phosphoric acid (H3PO4, 85% w/w), concentrated sulfuric acid (H2SO4, 98% w/w), potassium permanganate (KMnO4) and hydrogen peroxide (H2O2, 33% v/v) were of analytical grade from Merck (Darmstadt, Germany); hydrochloric acid (HCl, 37% w/w) was from GlobalChem (Cosela S.L., Seville, Spain); and ultrapure water (Resistivity ≤18.2 MΩ cm1) was from Milli-Q system (Millipore Bedford, Bedford, MA, USA).

2.2. Synthesis of Graphite Oxide Based on the Tour Method

For the synthesis of graphite oxide, the Tour method [75,76,79,80] has been employed. For this purpose, 100 mL of a mixture of H2SO4 and H3PO4 (9:1 v/v) was prepared to which 0.5 g of graphite was added with stirring. Then, KMnO4 (3 or 4 g) was added slowly, at a time range of 30 min. The mixture was left stirring (for 12 or 16 h) at a certain temperature (45 or 60 °C). After this time, 250 mL of distilled water cooled in ice is added drop by drop. This process lasts about 30 min. Finally, H2O2 (10 or 50 mL) was added, generating a light-yellow mixture. The reaction mixture was allowed to settle overnight. The next day the supernatant liquid was removed with a pipette and the solid was washed twice with 150 mL of a 10% HCl solution. The obtained graphite oxide was centrifuged for 1 h at 8000 rpm, diluting it in water up to 350 mL. This process was repeated until the centrifugation liquid reached a pH of 5–6. Then, the product was placed in Petri dishes, frozen for 48 h and freeze-dried for 5 days. Figure 1a shows an example of a Petri dish with GrO after freeze-drying, while Figure 1b shows the lamellar structure formed in the material after this process. Finally, the material obtained is ground with a ball mill (Retsch (Haan, Germany), MM400) at 7 Hz for 6 min.

2.3. Experimental Design

A screening ED (factorial design with two levels and four factors, 24) was carried out using STATGRAPHICS Centurion XVII. SSA, percentage carbon (% C) and t-Plot MV were chosen as study responses. The experimental factors used were temperature, time, weight of KMnO4 and volume of H2O2. For each experimental factor, two values have been defined—for temperature, 45 and 60 °C; for time, 12 and 16 h; for KMnO4, 3 and 4 g; and for H2O2, 10 and 50 mL—thus establishing the 16 experiments shown in Table 1.

2.4. Characterization

To evaluate structural parameters and how they influence adsorption process—in particular, the interaction potential between the pore surface and gas—N2 adsorption/desorption processes were applied at 77 K temperature, employing ASAP 2020 (Micromeritics, Norcross, GA, USA) equipment. The Brunauer–Emmett–Teller (BET) method was applied to determine the SSA. At the same time, the morphology of the pores plays an important role, so the micropore volume was evaluated using the t-Plot method.
The total carbon content was determined by combustion using a TruSpec CHN elemental analyzer (LECO, Benton Harbor, MI, USA). This method determines the carbon content by heating to a temperature of at least 900 °C in the presence of oxygen gas. Then, graphene was oxidized and/or volatilized to carbon dioxide (CO2). The amount of carbon dioxide was measured using an infrared detection method.
Structural studies were performed employing X-ray diffraction (XRD) equipment, X’Pert Pro diffractometer (Malvern PANalytical, Malvern, UK), with Cu K_ radiation (λ = 1.54 Å) with an operating at 45 kV and 40 mA. XRD data were collected in θ–θ configuration in the angular range of 5 < 2 < 80 with a 0.017 step size.
Raman spectra were acquired using a B&WTek i-RamanTM, ExemplarPro model, with an operation power of 100 mW. A green HeNe laser with a wavelength of 532 nm was focused onto the sample. The scattered radiation was then collected obtaining a resolution of 2.99 cm−1/pixel.
The morphology of the samples was observed using scanning electron microscopy (SEM), using a FEI InspectTM F50 (FEI Company, Columbia, MD, USA) at 5 kV of accelerating voltage. Some images were taking of each sample to the same different magnifications in order to compare the images.

3. Results and Discussion

3.1. Experimental Design Analysis

The experimental design has been completed with the introduction of the results obtained for % C, SSA and t-Plot MV as responses in the software: STATGRAPHICS Centurion XVII. The importance and influence of the different variables of the synthesis process on these responses has been analyzed. For this purpose, standardized Pareto diagrams and main effects plots have been represented for each response (Figure 2, Figure 3 and Figure 4). The Pareto diagrams (Figure 2a, Figure 3a and Figure 4a) show horizontal bars representing the value of the T-Statistic of the effects of each variable and interaction of variables on the studied responses. These bars are ordered from highest to lowest according to the level of significance. Grey bars indicate that the effect of the variable on the studied response is positive, while blue bars indicate a negative effect. Bars above the vertical blue line are considered statistically significant at a 5% confidence level. On the other hand, the main effects plots (Figure 2b, Figure 3b and Figure 4b) represent the estimated variation for the responses as a function of the different process variables. This estimation is plotted when each variable moves from its lowest value to its highest value with the rest of the variables set at an intermediate value between the two levels.
Figure 2 and Figure 3 show the standardized Pareto diagrams and main effects plots for SSA and t-Plot MV, respectively. The Pareto diagrams (Figure 2a and Figure 3a) show that the variable with the strongest influence on both responses is temperature, which is statistically significant, especially in the case of t-Plot MV. In the main effect plots (Figure 2b and Figure 3b), a similar variation can be seen for both SSA and t-Plot MV with respect to the different variables. Both responses increase with increasing temperature and increasing amounts of KMnO4 and H2O2 and decrease with time.
During the graphite oxidation process, CO2 bubbles are generated at around 45 °C and above, as described in the literature [81]. As the temperature increases, both the oxidation process and the CO2 generation rate or extension can be higher, leading to a greater separation of the GO sheets with an exfoliation effect. In addition, at 55 °C and above, thermal decomposition of the intermediate species Mn2O7 occurs [82], producing O2 bubbles, which contributes to the exfoliation process. Residual KMnO4 causes the same effect by introducing oxygenated groups in the basal planes that separate the graphite sheets from each other [83,84]. H2O2 contributes to increasing the degree of exfoliation generating O22− that intercalates between the graphite sheets [80,85]. Time has a negative effect on both responses due to the effect of over-oxidation [86,87,88], since greater amounts of oxygenated functional groups are formed at longer times. This results in the fragmentation and degradation of the GrO structure.
Figure 4 shows the Pareto diagram and main effects plot for % C. The Pareto diagram (Figure 4a) shows that the factor that most influences this response is the interaction between H2O2 volume and temperature. This interaction has a positive effect on % C, although it is not statistically significant. This interaction has the most positive influence on the SSA and t-Plot MV graphs also, although in both cases, it is not statistically significant. It could be assumed from the data collected that the most influential variables are temperature and time.
The main effects plot (Figure 4b) shows that the % C decreases with increasing temperature, time and amount of H2O2 and increases with increasing amount of KMnO4. As the temperature increases, the oxidation rate of the graphite increases [75], resulting in a more oxidized GrO product with a lower carbon content. With increasing time, more oxygenated groups are incorporated [84], generating the same effect. It is likely that the addition of more H2O2 produces the exfoliation effect mentioned above, opening and exposing intact areas of GrO sheet to the oxidant. This effect could cause a larger surface area of GrO to be oxidized, consequently decreasing the carbon ratio. KMnO4 contributes to increasing the percentage of C due to the effect of over-oxidation [88].
Figure 2. SSA analysis: (a) normalized Pareto diagram; (b) main effect plot.
Carbon 09 00065 g002
Figure 3. Micropore volume analysis: (a) normalized Pareto diagram; (b) main effect plot.
Carbon 09 00065 g003
Figure 4. % C analysis: (a) normalized Pareto diagram; (b) main effect plot.
Carbon 09 00065 g004
Finally, according to the ED performed, the synthesis conditions with the best conditions for the oxidation of graphite to GrO are shown in Table 2.
The best experimental conditions correspond to GrO_Exp01 of the ED, where an SSA of 67.04 m2g−1, a t-Plot MV of 0.018 cm3/g and a % C of 38.9 are obtained. After examining the results obtained in the ED, a clear difference between the GrO samples obtained at 45 °C and those at 60 °C is observed. The latter seem to be more affected by the processes of CO2 release and Mn2O7 decomposition, which generate an additional exfoliation in the materials. According to the Pareto diagrams obtained in the ED, temperature is the most influential factor in the graphite oxidation process.

3.2. Sample Characterization

In addition to the Standard Deviation (SD), all samples have been characterized chemically, structurally and morphologically. The relevant parameters have been calculated for each of the applied techniques and the influence of each of the process variables has been evaluated individually by calculating the T-Student (5% confidence, reference value: 1.89) for each response. In this way, the influence of the variables on the parameters calculated for each technique can be established.

3.2.1. BET Analysis

The different GrO samples obtained were analyzed by BET, using the N2 adsorption and desorption method to determine the SSA and t-Plot MV. Table 3 shows the range, average, SD and T-Student of the results corresponding to SSA and t-Plot MV. The full results can be found in Table A1, in Appendix A.
The SSA data show an overall range of 23.4–67.0 (m2g−1). The maximum value obtained is higher than those obtained by other authors using the same synthesis [89]. It is remarkable that the maximum value comes out at the shortest time.
The highest SSA average values have been obtained in the samples synthesized at 60 °C, 12 h, 50 mL H2O2 and 4 g KMnO4. Considering the calculation of the T-Student, it can be seen that the results obtained in the temperature variation are statistically discrepant. However, variations in the amounts of H2O2 and KMnO4 do not produce significant changes in the SSA of the obtained GrO.
In the case of t-Plot MV data, the overall range is between 0.0009–0.0181 (cm3g−1). The difference in the obtained results is of two orders of magnitude.
The average values of t-Plot MV show a similar variation to those obtained for SSA, the samples synthesized at 60 °C, 12 h, 50 mL H2O2 and 4 g KMnO4 being the ones with the highest t-Plot MV. According to the results obtained from T-Student, a significant discrepancy between the results obtained with the maximum and minimum temperature values is observed, as in the case of SSA, while variations in time and amounts of H2O2 and KMnO4 do not produce significant changes.
These results are in agreement with those obtained by ED, where the Pareto diagrams show that the variable that most affects SSA and t-Plot MV is temperature, and in this case, the results are also statistically discrepant.
Considering that most environmental and energy applications based on adsorption require high SSA and porosity, the best synthesis conditions would be at higher temperatures and reagent quantities and short times.

3.2.2. Elemental Analysis

All the samples obtained were analyzed to determine their total C content. Table 4 shows the range, average, SD and T-Student of the results corresponding to carbon percentage.
The carbon percentage data show an overall range of 34.6–43.1 (%). The samples synthesized at a temperature of 45 °C present a slightly higher C content (average carbon content of 39.1%) than those synthesized at 60 °C (average: 37.8%). The highest % C average values were obtained in samples synthesized at 45 °C, 12 h, 10 mL H2O2 and 4 g KMnO4. It is observed that none of the values obtained for T-Student exceed the critical value, indicating that variations in temperature, time and amounts of H2O2 and KMnO4 do not produce significant changes in the % C of the GrO obtained.
These results are in agreement with those obtained by ED, where the Pareto diagrams (Figure 4a) show that none of the experimental variables are statistically significant with respect to the % C values. The full results can be found in Table A2 in Appendix A.
In this case, the optimum % C depends on the intended application. GrO with lower % C could subsequently undergo different reduction treatments to recover the initial graphitic structure of the sheets and be used in applications requiring electrical conductivity, while more oxidized GrO are very versatile; thus, they can be chemically functionalized to improve their properties for selective adsorption applications.

3.2.3. XRD Analysis

The different GrO samples obtained after carrying out the 16 experiments of the ED have been analyzed by XRD to determine structural parameters. The XRD pattern of pure graphite presents a peak at 2θ = 26.58° (2Ɵ) corresponding to the [002] diffraction plane and an interplanar distance, d = 0.335 nm [90]. In the oxidation process, the [002] diffraction plane broadens and decreases in intensity, while the [001] diffraction plane of GrO, appears at 2θ = 11° [91]. This variation is due to the introduction of oxygenated groups, mainly hydroxy and epoxy on the surface of the individual graphene sheets, and carboxyl groups on the edges that break the crystalline structure. The presence of oxygenated groups increases the interplanar distance, distorting the initial structure of the stacked sheets. Figure 5 shows the [001] diffraction plane corresponding to the GrO materials synthesized in the 16 experiments. The diffraction maxima of all GrO come out in the range of 9.83° < 2θ < 11.77°, corroborating that oxidation of graphite to GrO has occurred.
It can be seen that there is a clear difference between the samples synthesized at the two temperatures (the vertical black line marks an arbitrary division between the diffractograms of GrO synthesized at 45 °C and at 60 °C). The diffraction peaks corresponding to GrO synthetized at 45 °C (GrO_Exp02-06, GrO_08, GrO_12 and GrO_15) are narrower and more intense, while those synthesized at 60 °C (GrO_01, GrO_07, GrO_09-11, GrO_13, GrO_14, GrO_16) are less intense and wider. This could be due to the fact that at 45 °C, in this type of materials, gaseous CO2 can start to be produced [81], which could be adsorbed between the GrO films, and it can be desorbed and leave the material if there is high enough energy [92], producing a certain degree of exfoliation and defects in the films, as mentioned previously in Section 3.1. On the other hand, according to the literature, Mn2O7 decomposes at 55 °C and above [82], generating bubbles and facilitating the separation of the GrO sheets. GrO samples synthesized at 60 °C are more affected by these phenomena, which produce distortion in the stacked structure, generate defects in the films, decrease crystallinity and cause exfoliation, giving rise to wider diffraction peaks of lower intensity. Additionally, the samples obtained at 45 °C show narrower and more intense diffraction peaks as they retain a greater proportion of stacked structure; therefore, the crystallinity of GrO is higher. This can be due to the fact that during their synthesis processes, they have been kept at the temperature at which CO2 bubbles start to form, and most of them do not have enough energy to leave the material. These results are in agreement with those obtained in the ED, where the temperature is the most relevant parameter and statistically significant for SSA and t-Plot MV.
The average, SD and T-Student of the results corresponding to the 2θ positions, interplanar spacing (d), number of stacked layers (n) and crystal size (L) of the GrO obtained have been summarized in Table 5 (the full results can be found in Table A3 in Appendix A). The number of stacked layers in the graphite oxide (n) was obtained by Equation (1), where “L” is the crystal size and “d” is the interplanar spacing:
n = L d
Furthermore, L has been calculated using the Scherrer Equation (2) [93]:
L = (0.94 × λ)/(β × cosθ),
where λ is the X-ray wavelength, β is the line broadening at half the maximum and θ is the Bragg angle.
In Table 5a, the average position and d data show an overall range of 9.8–11.2 (2Ɵ) and 0.79–0.90 (nm), respectively. It can be observed that the average values for position only show variations in the case of temperature changes, being statistically significant according to the obtained T-Student value (7.7). The same trend can be seen for d, for which a T-Student value of 7.5 has been calculated, exceeding the critical value only in the case of variations in the synthesis temperature.
On the other hand, Table 5b shows the calculated values of n and L according to the formulae mentioned above (Equations (1) and (2)). The ranges of total average values for n and L are 27.7–166.1 (nm) and 33.7–197.7, respectively. For both cases, the T-Student exceeds the critical value only in the case of temperature variations, reaching a value of 4.5 in the case of L and 4.3 for n.
The general goal is to obtain more porous structures with higher SSA and GrO with smaller crystal sizes and a lower number of stacked layers. In this case, the best conditions are reached working at higher temperatures, since at 60 °C, an average L and n of 38.5 and 47.3 nm, respectively, are obtained, compared to 109.3 and 125.4 nm obtained at 45 °C.
According to Table 5a,b, the GrO synthesized at 60 °C has a smaller average interplanar distance (0.81 nm) and a smaller average number of stacked layers [47] compared to those synthesized at 45 °C (0.87 nm and 125), although the interplanar distance differences are slight.
This could be due, in part, to a slight accumulation of CO2 bubbles, which starts to form at 45 °C, as described in previous sections. At this temperature, the gas bubbles do not yet have enough energy to leave the GrO structure, so they could be adsorbed between the sheets, generating pressure and increasing the interplanar spacing. On the other hand, at 60 °C, the CO2 generation is higher, together with a higher oxidation of the graphite. At this temperature (60 °C), the CO2 bubbles formed have enough energy to leave the GrO structure, which could result in smaller interplanar spacings than in the samples synthesized at 45 °C. However, the interplanar spacing in GrO depends on multiple factors in addition to this, such as the water content [94,95] and the number of stacked layers [96], among others. Moreover, most of these factors are influenced by each other, such as CO2 adsorption, which depends on the degree of hydration [97], which, in turn, depends on the number of stacked layers [96].
The increased production of CO2 bubbles at higher temperatures also generates a higher degree of exfoliation and fragmentation in the materials synthesized at 60 °C. These effects result in fewer stacked layers and smaller crystal size (38.5 nm) in GrO synthesized at 60 °C compared to those obtained at 45 °C (109.3 nm), which is in agreement with the SEM images described below in Section 3.2.5. This means that at higher temperatures, more graphitic surface area is exposed to the oxidant and oxidation occurs over a larger area. The higher degree of oxidation due to the exposure of more surface is corroborated by the results obtained by E.A, where lower % C are obtained for samples synthesized at 60 °C. 
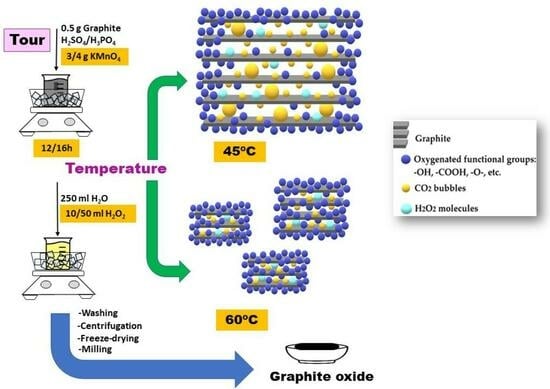
Figure 6 shows the possible GrO structure synthesized at 45 and 60 °C, taking into account all the results obtained.

3.2.4. Raman Analysis

In Raman spectroscopy, a typical spectrum corresponding to pure graphite presents three characteristic bands: G-band at ~1580 cm−1, D-band at ~354 cm−1 and 2D-band at ~2700 cm−1 [98]. The G band is the most intense and is associated with the graphite mode [99]. It appears due to the first order dispersion of the E2g2 mode and is related to the number of sp2 carbons. The D band is less intense and corresponds to the diamond mode. This band is attributed to disorder in the graphite, which may be due to amorphous carbon species, vacancies, defects in the structure, etc. [100]. The ratio of intensities of the D and G bands (ID/IG) is used to estimate the density of defects present in the material studied and has a value of approximately 0.23 in pure graphite. In the case of GrO, defects appear mainly after the oxidation process, which incorporates oxygenated groups, generating sp3 carbons and distorting the graphitic structure. Therefore, by the graphite oxidation, the D band increases in intensity due to the creation of defects, the incorporation of heteroatoms in the interplanar space and the increase of domains with sp3 carbons. On the other hand, the intensity of the G band decreases because the domains of sp2 carbons become smaller, until it becomes comparable to the D band. In the case of GrO, the ID/IG ratio grows to ~1.0 due to the incorporation of defects and sp3 carbons after the oxidation process. The 2D band is related to the number of stacked graphene layers within the graphitic structure. The I2D/IG ratio, which is inversely proportional to the number of stacked layers, is often used to evaluate it. Values in the range 2–3 correspond to monolayers, values <1 correspond to multilayers, while intermediate values are considered as bilayers [101].
The analysis of the 16 samples has provided the ID/IG ratios shown in Figure 7 in order from highest to lowest ID/IG ratio, read from the bottom to the top of the graph. Data were generated by measuring each sample at three different points and obtaining their average value. It is observed that all values are in the range 0.896 < ID/IG < 1.033, indicating that defects and disorder have been generated in the structure during the oxidation process. There are no appreciable differences between the results of the samples synthesized at 45 °C and those obtained at 60 °C, but some influence of the amount of H2O2 is observed. Samples synthesized with 50 mL H2O2, such as GrO_Exp08, GrO_Exp05, GrO_Exp02, GrO_Exp11 and GrO_Exp14, show larger ID/IG values compared to others synthesized with 10 mL H2O2, such as GrO_Exp07, GrO_Exp04, GrO_Exp12, GrO_Exp03 and GrO_Exp16. This may be due to the exfoliation effect of H2O mentioned above, which generates disorder in the GrO structure and thus exposes larger graphitic surfaces to oxidation, leading to higher amounts of defects.
Table 6 shows range, average, SD and T-Student of the results corresponding to the ID/IG and I2D/IG of the GrO obtained in the ED (the full results can be found in Table A4 in Appendix A). For ID/IG, a total range of average values of 0.90–1.03 can be observed. The highest T-Student is obtained for the case of temperature variations, with an ID/IG of 1.3; however, it does not exceed the critical value. On the other hand, the total range of average values for I2D/IG is between 0.13 and 0.18. According to the T-Student results, the variations of none of the studied variables are statistically significant for the ID/IG and I2D/IG ratios. The I2D/IG values obtained for both temperatures are very similar, indicating multilayer stacking in the GrO structure. This is in line with the XRD results discussed in the previous section (Section 3.2.3), where the number of stacked layers are evaluated more accurately.

3.2.5. SEM Analysis

SEM analyses were also carried out to evaluate the morphology of the obtained GrO samples.
From the previous analysis, it can be reasoned that temperature is the most influential variable. Therefore, two samples have been selected (GrO_01 and GrO_05), in which the two different temperatures have been applied (45 and 60 °C), keeping the rest of the variables fixed (12 h, 50 mL H2O2 and 4 g KMnO4) (Figure 8). It is in these two cases where the greatest morphological differences can be seen.
In both samples, separate layers are observed, indicating partial exfoliation due to both the oxidation process and the freeze-drying process. The sample obtained at 60 °C (GrO_Exp01) shows a more disorganized structure and greater exfoliation, while in the sample obtained at 45 °C (GrO_Exp05), there are stacked layers with a certain degree of alignment, which is in agreement with the results obtained in XRD, where broader peaks were obtained at 60 °C. The most noticeable differences can be seen in Figure 8d,h corresponding to the two syntheses. In these cases, Figure 8d corresponding to the GrO_Exp01 synthesis, shows that the GrO sheets are smaller and more exfoliated and fragmented than in the GrO_Exp05 synthesis (Figure 8h), partly due to the formation of CO2 bubbles which, in this case, are released and produce these effects. This observation corroborates the scheme made in Figure 6, which represents the possible structure of GrO obtained at the two temperatures studied thanks to the structural and morphological data provided by XRD, Raman and SEM techniques.

4. Conclusions

The results of SSA, micropore volume and % C have been used as responses in the experimental design as variables of interest for specific applications. According to the Pareto diagrams, the variable that most influences the three responses is temperature, being statistically significant in the case of SSA and micropore volume. In the main effect plots, SSA and micropore volume vary similarly with changing experimental conditions. For both responses, an increase in temperature and the amounts of KMnO4 and H2O2 positively influences the degree of exfoliation, which contributes to an increase in SSA and micropore volume, whereas syntheses at longer times result in GrO of lower SSA and micropores. On the other hand, % C decreases with increasing temperature, time, and amount of H2O2 and increases with increasing amount of KMnO4. The optimal experiment, according to the experimental design, to maximize the three studied responses is the one corresponding to the following experimental conditions: temperature of 60 °C, H2O2 volume of 50 mL, KMnO4 weight of 4 g and time of 12 h. These experimental conditions correspond to the GrO_Exp01 of the ED. However, it should be noted that the optimal conditions obtained depend on both the initial mass and the exact type of graphite used. Therefore, future work could consider extending the research by adding a study of the optimization with different graphite particle size distributions. However, we can conclude that temperature is the most relevant parameter in the Tour process.
The results of the T-Student values corroborate that temperature is the parameter that most statistically influences the SSA and t-Plot MV obtained. Furthermore, the calculation of this parameter has allowed us to determine that temperature is a parameter that also has a significant influence on the parameters calculated in XRD (2Ɵ, d, L and n). Temperature is therefore the main parameter which influences most of the responses studied and whose control is the most decisive in regulating the properties of the materials obtained.
According to the XRD, Raman and SEM results, the structure of the GrO synthesized at 60 °C is less crystalline with more defects and shows a higher structural disorder than that of the GrO obtained at 45 °C. This may be due to a slight thermal exfoliation produced by the generation of CO2 from 45 °C or the instability of Mn2O7 from 55 °C onwards. The generation of gaseous species that occur in both processes acts by separating and exfoliating the graphite layers. This is also corroborated by the results obtained in BET, according to which the SSA and micropore volumes are higher in samples obtained at 60 °C. In the elemental analysis results, it is observed that GrO samples synthesized at 45 °C have a higher % C compared to those synthesized at 60 °C, indicating lower oxygen content. This may be due to the higher exfoliation of GrO synthesized at 60 °C, which gives access to more graphitic surface area to be oxidized.
This study has provided a broad and deep analysis of the influence of the different variables pertaining to the GrO synthesis process on the properties that most influence some of the applications sought for these materials. Applications such as hydrogen storage, water decontamination or supercapacitors require materials with high SSA and porosity, with the % C requirement varying in each specific case. In this paper, an investigation of the relationship between the different variables of the synthesis process and the properties of the GrO obtained by the Tour method has been presented. In addition to this, the optimal conditions for the synthesis of GrO with maximum SSA and porosity have been highlighted, providing a starting point for generating high-SSA graphene aerogels in future studies for use in the aforementioned applications.

Author Contributions

Conceptualization, H.B. and M.B.G.-M.; methodology, H.B.; software, H.B.; formal analysis H.B., F.G.-P., N.B.N., L.J.B., M.Á.C. and A.V.; investigation, H.B., I.R. and M.B.G.-M.; resources, J.M., I.R. and A.J.Q.; writing—original draft preparation, H.B..; writing—review and editing, H.B., M.B.G.-M. and I.R.; supervision, M.B.G.-M. and I.R.; project administration, M.B.G.-M., J.M. and I.R. All authors have read and agreed to the published version of the manuscript.

Funding

Grants PID2020-114234RB-C21 and -C22 funded by MCIN/AEI/10.13039/501100011033; ERDF is also gratefully acknowledged for the partial funding of the XRD equipment employed in this study (Project FEDER 2004 CIEM05-34-031). A. Velasco is in receipt of an FPU grant from the Spanish Government (FPU18/03235), funded by MCIN/AEI/10.13039/501100011033 “ESF Investing in your future”.

Data Availability Statement

Data are contained in Appendix A.

Conflicts of Interest

The authors declare no conflict of interest.

Appendix A

Table A1. The complete results of SSA and t-Plot-(Micropore Volume) obtained by BET from all ED experiments.
ExperimentSSAt-Plot-(Micropore Volume)
(m2g−1)(cm3g−1)
GrO_Exp0167.00.0181
GrO_Exp0234.80.0009
GrO_Exp0357.40.0059
GrO_Exp0441.00.0041
GrO_Exp0525.10.0022
GrO_Exp0625.50.0021
GrO_Exp0740.60.0073
GrO_Exp0823.40.0022
GrO_Exp0942.80.0076
GrO_Exp1053.80.0078
GrO_Exp1143.50.0075
GrO_Exp1225.30.0022
GrO_Exp1342.20.0070
GrO_Exp1451.20.0082
GrO_Exp1532.80.0024
GrO_Exp1645.60.0080
Table A2. The complete results of C obtained by EA from all ED experiments.
ExperimentC
(%)
GrO_Exp0138.9
GrO_Exp0234.6
GrO_Exp0338.4
GrO_Exp0442.4
GrO_Exp0540.5
GrO_Exp0643.1
GrO_Exp0738.1
GrO_Exp0836.5
GrO_Exp0935.4
GrO_Exp1037.6
GrO_Exp1139.0
GrO_Exp1239.3
GrO_Exp1338.0
GrO_Exp1438.0
GrO_Exp1538.3
GrO_Exp1637.7
Table A3. The complete results of 2Ɵ, d-spacing, Crystal size and n obtained by XRD from all ED experiments.
Experimentd-SpacingCrystal Sizen
(deg)(nm)(nm)
GrO_Exp0111.20.7935.644.9
GrO_Exp0210.10.8758.667.0
GrO_Exp0310.30.8658.668.4
GrO_Exp0410.50.84166.1197.7
GrO_Exp0510.10.8799.6114.2
GrO_Exp069.90.8976.686.0
GrO_Exp0710.80.8245.355.5
GrO_Exp0810.10.88124.6141.7
GrO_Exp0910.90.8149.861.6
GrO_Exp1010.90.8133.240.8
GrO_Exp1110.90.8135.643.8
GrO_Exp1210.10.87166.0189.9
GrO_Exp1310.60.8335.642.8
GrO_Exp1410.80.8227.733.7
GrO_Exp159.80.90124.5138.4
GrO_Exp1610.80.8245.355.1
Table A4. The complete results of ID/IG and I2D/IG obtained by Raman from all ED experiments.
ExperimentRaman ID/IGRaman I2D/IG
GrO_Exp011.000.16
GrO_Exp021.020.17
GrO_Exp030.990.16
GrO_Exp040.980.14
GrO_Exp051.020.16
GrO_Exp061.000.18
GrO_Exp070.920.17
GrO_Exp081.030.14
GrO_Exp091.000.14
GrO_Exp100.900.13
GrO_Exp111.020.15
GrO_Exp120.980.15
GrO_Exp131.000.15
GrO_Exp141.010.16
GrO_Exp150.990.15
GrO_Exp160.990.16

References

  1. Wang, C.; Kim, J.; Tang, J.; Na, J.; Kang, Y.M.; Kim, M.; Lim, H.; Bando, Y.; Li, J.; Yamauchi, Y. Large-Scale Synthesis of MOF-Derived Superporous Carbon Aerogels with Extraordinary Adsorption Capacity for Organic Solvents. Angew. Chem. Int. Ed. Engl. 2020, 59, 2066–2070. [Google Scholar] [CrossRef]
  2. Czaja, A.U.; Trukhan, N.; Muller, U. Industrial applications of metal-organic frameworks. Chem. Soc. Rev. 2009, 38, 1284–1293. [Google Scholar] [CrossRef]
  3. Liu, X.; Zhang, L.; Wang, J. Design strategies for MOF-derived porous functional materials: Preserving surfaces and nurturing pores. J. Mater. 2021, 7, 440–459. [Google Scholar] [CrossRef]
  4. Chen, Z.; Mitchell, S.; Vorobyeva, E.; Leary, R.K.; Hauert, R.; Furnival, T.; Ramasse, Q.M.; Thomas, J.M.; Midgley, P.A.; Dontsova, D.; et al. Stabilization of Single Metal Atoms on Graphitic Carbon Nitride. Adv. Funct. Mater. 2017, 27, 1605785. [Google Scholar] [CrossRef] [Green Version]
  5. Wang, Y.; Meng, D.; Zhao, X. Visible-light-driven H2O2 production from O2 reduction with nitrogen vacancy-rich and porous graphitic carbon nitride. Appl. Catal. B Environ. 2020, 273, 119064. [Google Scholar] [CrossRef]
  6. Liu, X.; Ma, R.; Wang, X.; Ma, Y.; Yang, Y.; Zhuang, L.; Zhang, S.; Jehan, R.; Chen, J.; Wang, X. Graphene oxide-based materials for efficient removal of heavy metal ions from aqueous solution: A review. Environ. Pollut. 2019, 252, 62–73. [Google Scholar] [CrossRef] [PubMed]
  7. Alazmi, A.; El Tall, O.; Rasul, S.; Hedhili, M.N.; Patole, S.P.; Costa, P.M. A process to enhance the specific surface area and capacitance of hydrothermally reduced graphene oxide. Nanoscale 2016, 8, 17782–17787. [Google Scholar] [CrossRef]
  8. Englert, A.H.; Rubio, J. Characterization and environmental application of a Chilean natural zeolite. Int. J. Miner. Process. 2005, 75, 21–29. [Google Scholar] [CrossRef]
  9. Galarneau, A.; Mehlhorn, D.; Guenneau, F.; Coasne, B.; Villemot, F.; Minoux, D.; Aquino, C.; Dath, J.P. Specific Surface Area Determination for Microporous/Mesoporous Materials: The Case of Mesoporous FAU-Y Zeolites. Langmuir 2018, 34, 14134–14142. [Google Scholar] [CrossRef]
  10. Sakthivel, T.; Reid, D.L.; Goldstein, I.; Hench, L.; Seal, S. Hydrophobic high surface area zeolites derived from fly ash for oil spill remediation. Environ. Sci. Technol. 2013, 47, 5843–5850. [Google Scholar] [CrossRef]
  11. Lu, Y.; Zhan, W.; He, Y.; Wang, Y.; Kong, X.; Kuang, Q.; Xie, Z.; Zheng, L. MOF-templated synthesis of porous Co(3)O(4) concave nanocubes with high specific surface area and their gas sensing properties. ACS Appl. Mater. Interfaces 2014, 6, 4186–4195. [Google Scholar] [CrossRef]
  12. Wang, B.J.; Ma, S.Y.; Pei, S.T.; Xu, X.L.; Cao, P.F.; Zhang, J.L.; Zhang, R.; Xu, X.H.; Han, T. High specific surface area SnO2 prepared by calcining Sn-MOFs and their formaldehyde-sensing characteristics. Sens. Actuators B Chem. 2020, 321, 128560. [Google Scholar] [CrossRef]
  13. Konnerth, H.; Matsagar, B.M.; Chen, S.S.; Prechtl, M.H.G.; Shieh, F.-K.; Wu, K.C.W. Metal-organic framework (MOF)-derived catalysts for fine chemical production. Coord. Chem. Rev. 2020, 416, 213319. [Google Scholar] [CrossRef]
  14. Kang, Y.-S.; Lu, Y.; Chen, K.; Zhao, Y.; Wang, P.; Sun, W.-Y. Metal–organic frameworks with catalytic centers: From synthesis to catalytic application. Coord. Chem. Rev. 2019, 378, 262–280. [Google Scholar] [CrossRef]
  15. Ali Maryum, P.E.; Tayyaba, N.; Osama, R.; Rubab, Z.; Yang, M. Recent advancements in MOF-based catalysts for applications in electrochemical and photoelectrochemical water splitting: A review. Int. J. Energy Res. 2020, 45, 1190–1226. [Google Scholar] [CrossRef]
  16. Qiu, B.; Xing, M.; Zhang, J. Recent advances in three-dimensional graphene based materials for catalysis applications. Chem. Soc. Rev. 2018, 47, 2165–2216. [Google Scholar] [CrossRef]
  17. Pandey, A.P.; Bhatnagar, A.; Shukla, V.; Soni, P.K.; Singh, S.; Verma, S.K.; Shaneeth, M.; Sekkar, V.; Srivastava, O.N. Hydrogen storage properties of carbon aerogel synthesized by ambient pressure drying using new catalyst triethylamine. Int. J. Hydrog. Energy 2020, 45, 30818–30827. [Google Scholar] [CrossRef]
  18. Gasnier, A.; Amica, G.; Juan, J.; Troiani, H.; Gennari, F.C. N-Doped Graphene-Rich Aerogels Decorated with Nickel and Cobalt Nanoparticles: Effect on Hydrogen Storage Properties of Nanoconfined LiBH4. J. Phys. Chem. C 2019, 124, 115–125. [Google Scholar] [CrossRef]
  19. Ferreira-Neto, E.P.; Ullah, S.; da Silva, T.C.A.; Domeneguetti, R.R.; Perissinotto, A.P.; de Vicente, F.S.; Rodrigues-Filho, U.P.; Ribeiro, S.J.L. Bacterial Nanocellulose/MoS(2) Hybrid Aerogels as Bifunctional Adsorbent/Photocatalyst Membranes for in-Flow Water Decontamination. ACS Appl. Mater. Interfaces 2020, 12, 41627–41643. [Google Scholar] [CrossRef]
  20. Paraskevopoulou, P.; Raptopoulos, G.; Leontaridou, F.; Papastergiou, M.; Sakellari, A.; Karavoltsos, S. Evaluation of Polyurea-Crosslinked Alginate Aerogels for Seawater Decontamination. Gels 2021, 7, 27. [Google Scholar] [CrossRef]
  21. Somjit, V.; Thinsoongnoen, P.; Sriphumrat, K.; Pimu, S.; Arayachukiat, S.; Kongpatpanich, K. Metal-Organic Framework Aerogel for Full pH Range Operation and Trace Adsorption of Arsenic in Water. ACS Appl. Mater. Interfaces 2022, 14, 40005–40013. [Google Scholar] [CrossRef] [PubMed]
  22. Lv, Z.; Fan, Q.; Xie, Y.; Chen, Z.; Alsaedi, A.; Hayat, T.; Wang, X.; Chen, C. MOFs-derived magnetic chestnut shell-like hollow sphere NiO/Ni@C composites and their removal performance for arsenic (V). Chem. Eng. J. 2019, 362, 413–421. [Google Scholar] [CrossRef]
  23. Tang, X.; Wang, S.; Zhang, Z.; Li, Z.; Wang, L.; Yuan, L.; Wang, B.; Sun, J.; Zheng, L.; Wang, H.; et al. Graphene oxide/chitosan/potassium copper hexacyanoferrate(II) composite aerogel for efficient removal of cesium. Chem. Eng. J. 2022, 444, 136397. [Google Scholar] [CrossRef]
  24. Chen, L.; Feng, S.; Zhao, D.; Chen, S.; Li, F.; Chen, C. Efficient sorption and reduction of U(VI) on zero-valent iron-polyaniline-graphene aerogel ternary composite. J. Colloid. Interface Sci. 2017, 490, 197–206. [Google Scholar] [CrossRef]
  25. Stoller, M.D.; Park, S.; Zhu, Y.; An, J.; Ruoff, R.S. Graphene-Based Ultracapacitors. Nano Lett. 2008, 8, 3498–3502. [Google Scholar] [CrossRef] [PubMed]
  26. Soldano, C.; Mahmood, A.; Dujardin, E. Production, properties and potential of graphene. Carbon 2010, 48, 2127–2150. [Google Scholar] [CrossRef] [Green Version]
  27. Novoselov, K.S.; Geim, A.K.; Morozov, S.V.; Jiang, D.; Zhang, Y.; Dubonos, S.V.; Grigorieva, I.V.; Firsov, A.A. Electric Field Effect in Atomically Thin Carbon Films. Science 2004, 306, 666–669. [Google Scholar] [CrossRef] [Green Version]
  28. Wassei, J.K.; Kaner, R.B. Graphene, a promising transparent conductor. Mater. Today 2010, 13, 52–59. [Google Scholar] [CrossRef]
  29. Lee, C.; Wei, X.; Kysar, J.W.; Hone, J. Measurement of the Elastic Properties and Intrinsic Strength of Monolayer Graphene. Science 2008, 321, 385–388. [Google Scholar] [CrossRef]
  30. Chen, H.; Müller, M.B.; Gilmore, K.J.; Wallace, G.G.; Li, D. Mechanically Strong, Electrically Conductive, and Biocompatible Graphene Paper. Adv. Mater. 2008, 20, 3557–3561. [Google Scholar] [CrossRef]
  31. Han, T.-H.; Kim, H.; Kwon, S.-J.; Lee, T.-W. Graphene-based flexible electronic devices. Mater. Sci. Eng. R Rep. 2017, 118, 1–43. [Google Scholar] [CrossRef]
  32. Pinto, A.M.; Goncalves, I.C.; Magalhaes, F.D. Graphene-based materials biocompatibility: A review. Colloids Surf. B Biointerfaces 2013, 111, 188–202. [Google Scholar] [CrossRef] [PubMed]
  33. Gurunathan, S.; Kim, J.H. Synthesis, toxicity, biocompatibility, and biomedical applications of graphene and graphene-related materials. Int. J. Nanomed. 2016, 11, 1927–1945. [Google Scholar] [CrossRef] [Green Version]
  34. Hill, E.W.; Vijayaragahvan, A.; Novoselov, K. Graphene Sensors. IEEE Sens. J. 2011, 11, 3161–3170. [Google Scholar] [CrossRef]
  35. Liu, J.; Cui, L.; Losic, D. Graphene and graphene oxide as new nanocarriers for drug delivery applications. Acta Biomater. 2013, 9, 9243–9257. [Google Scholar] [CrossRef]
  36. Cui, G.; Bi, Z.; Zhang, R.; Liu, J.; Yu, X.; Li, Z. A comprehensive review on graphene-based anti-corrosive coatings. Chem. Eng. J. 2019, 373, 104–121. [Google Scholar] [CrossRef]
  37. Peetam Mandal, J.D.; Mitali, S. A Review on the Emergence of Graphene in Photovoltaics Industry. Biointerface Res. Appl. Chem. 2021, 11, 15009–15036. [Google Scholar] [CrossRef]
  38. Liao, L.; Duan, X. Graphene for radio frequency electronics. Mater. Today 2012, 15, 328–338. [Google Scholar] [CrossRef]
  39. Cheng, Y.; Wang, K.; Qi, Y.; Liu, Z. Chemical Vapor Deposition Method for Graphene Fiber Materials. Acta Phys. Chim. Sin. 2020, 38, 2006046. [Google Scholar] [CrossRef]
  40. Fang, B.; Chang, D.; Xu, Z.; Gao, C. A Review on Graphene Fibers: Expectations, Advances, and Prospects. Adv. Mater. 2020, 32, e1902664. [Google Scholar] [CrossRef]
  41. Xu, Z.; Gao, C. Graphene fiber: A new trend in carbon fibers. Mater. Today 2015, 18, 480–492. [Google Scholar] [CrossRef]
  42. Pei, S.; Zhao, J.; Du, J.; Ren, W.; Cheng, H.-M. Direct reduction of graphene oxide films into highly conductive and flexible graphene films by hydrohalic acids. Carbon 2010, 48, 4466–4474. [Google Scholar] [CrossRef]
  43. Kumar, P.; Shahzad, F.; Yu, S.; Hong, S.M.; Kim, Y.-H.; Koo, C.M. Large-area reduced graphene oxide thin film with excellent thermal conductivity and electromagnetic interference shielding effectiveness. Carbon 2015, 94, 494–500. [Google Scholar] [CrossRef]
  44. Paliotta, L.; De Bellis, G.; Tamburrano, A.; Marra, F.; Rinaldi, A.; Balijepalli, S.K.; Kaciulis, S.; Sarto, M.S. Highly conductive multilayer-graphene paper as a flexible lightweight electromagnetic shield. Carbon 2015, 89, 260–271. [Google Scholar] [CrossRef]
  45. Cao, J.; Wang, Y.; Xiao, P.; Chen, Y.; Zhou, Y.; Ouyang, J.-H.; Jia, D. Hollow graphene spheres self-assembled from graphene oxide sheets by a one-step hydrothermal process. Carbon 2013, 56, 389–391. [Google Scholar] [CrossRef]
  46. Xiao, W.; Zhang, Y.; Tian, L.; Liu, H.; Liu, B.; Pu, Y. Facile synthesis of reduced graphene oxide/titania composite hollow microspheres based on sonication-assisted interfacial self-assembly of tiny graphene oxide sheets and the photocatalytic property. J. Alloys Compd. 2016, 665, 21–30. [Google Scholar] [CrossRef]
  47. Huang, X.; Yu, G.; Zhang, Y.; Zhang, M.; Shao, G. Design of cellular structure of graphene aerogels for electromagnetic wave absorption. Chem. Eng. J. 2021, 426, 131894. [Google Scholar] [CrossRef]
  48. Wei, L.; Mao, Y. Enhanced hydrogen storage performance of reduced graphene oxide hybrids with nickel or its metallic mixtures based on spillover mechanism. Int. J. Hydrog. Energy 2016, 41, 11692–11699. [Google Scholar] [CrossRef] [Green Version]
  49. Du, J.; Liu, L.; Yu, Y.; Zhang, L.; Zhang, Y.; Chen, A. Synthesis of nitrogen doped graphene aerogels using solid supported strategy for supercapacitor. Mater. Chem. Phys. 2019, 223, 145–151. [Google Scholar] [CrossRef]
  50. Nandanapalli, K.R.; Mudusu, D.; Lee, S. Functionalization of graphene layers and advancements in device applications. Carbon 2019, 152, 954–985. [Google Scholar] [CrossRef]
  51. Zhang, Y.; Wan, Q.; Yang, N. Recent Advances of Porous Graphene: Synthesis, Functionalization, and Electrochemical Applications. Small 2019, 15, e1903780. [Google Scholar] [CrossRef]
  52. Lee, S.J.; Theerthagiri, J.; Nithyadharseni, P.; Arunachalam, P.; Balaji, D.; Madan Kumar, A.; Madhavan, J.; Mittal, V.; Choi, M.Y. Heteroatom-doped graphene-based materials for sustainable energy applications: A review. Renew. Sustain. Energy Rev. 2021, 143, 110849. [Google Scholar] [CrossRef]
  53. Fang, Q.; Shen, Y.; Chen, B. Synthesis, decoration and properties of three-dimensional graphene-based macrostructures: A review. Chem. Eng. J. 2015, 264, 753–771. [Google Scholar] [CrossRef]
  54. Zhu, C.; Han, T.Y.; Duoss, E.B.; Golobic, A.M.; Kuntz, J.D.; Spadaccini, C.M.; Worsley, M.A. Highly compressible 3D periodic graphene aerogel microlattices. Nat. Commun. 2015, 6, 6962. [Google Scholar] [CrossRef] [Green Version]
  55. Xu, Y.; Sheng, K.; Li, C.; Shi, G. Self-Assembled Graphene Hydrogel via a One-Step Hydrothermal Process. ASC Nano 2010, 4, 4324–4330. [Google Scholar] [CrossRef] [PubMed]
  56. Garcia-Bordejé, E.; Benito, A.M.; Maser, W.K. Graphene aerogels via hydrothermal gelation of graphene oxide colloids: Fine-tuning of its porous and chemical properties and catalytic applications. Adv. Colloid. Interface Sci. 2021, 292, 102420. [Google Scholar] [CrossRef] [PubMed]
  57. Rodríguez-Mata, V.; González-Domínguez, J.M.; Benito, A.M.; Maser, W.K.; García-Bordejé, E. Reduced Graphene Oxide Aerogels with Controlled Continuous Microchannels for Environmental Remediation. ACS Appl. Nano Mater. 2019, 2, 1210–1222. [Google Scholar] [CrossRef]
  58. Gómez-Mancebo, M.B.; Fernández-Martínez, R.; Ruiz-Perona, A.; Rubio, V.; Bastante, P.; García-Pérez, F.; Borlaf, F.; Sánchez, M.; Hamada, A.; Velasco, A.; et al. Comparison of Thermal and Laser-Reduced Graphene Oxide Production for Energy Storage Applications. Nanomaterials 2023, 13, 1391. [Google Scholar] [CrossRef]
  59. Wang, C.; Han, X.; Xu, P.; Zhang, X.; Du, Y.; Hu, S.; Wang, J.; Wang, X. The electromagnetic property of chemically reduced graphene oxide and its application as microwave absorbing material. Appl. Phys. Lett. 2011, 98, 072906. [Google Scholar] [CrossRef]
  60. Zhang, H.; Luo, N.; Liu, T.; Chen, F.; Fu, Q. Light-weight, low-loading and large-sheet reduced graphene oxide for high-efficiency microwave absorber. Carbon 2022, 196, 1024–1034. [Google Scholar] [CrossRef]
  61. Wang, S.; Zhao, Y.; Gao, M.; Xue, H.; Xu, Y.; Feng, C.; Shi, D.; Liu, K.; Jiao, Q. Green Synthesis of Porous Cocoon-like rGO for Enhanced Microwave-Absorbing Performances. ACS Appl. Mater. Interfaces 2018, 10, 42865–42874. [Google Scholar] [CrossRef]
  62. Ye, S.; Liu, Y.; Feng, J. Low-Density, Mechanical Compressible, Water-Induced Self-Recoverable Graphene Aerogels for Water Treatment. ACS Appl. Mater. Interfaces 2017, 9, 22456–22464. [Google Scholar] [CrossRef]
  63. Wang, C.; Chen, X.; Wang, B.; Huang, M.; Wang, B.; Jiang, Y.; Ruoff, R.S. Freeze-Casting Produces a Graphene Oxide Aerogel with a Radial and Centrosymmetric Structure. ACS Nano 2018, 12, 5816–5825. [Google Scholar] [CrossRef] [PubMed]
  64. Agarwal, V.; Zetterlund, P.B. Strategies for reduction of graphene oxide—A comprehensive review. Chem. Eng. J. 2021, 405, 127018. [Google Scholar] [CrossRef]
  65. De Silva, K.K.H.; Huang, H.-H.; Joshi, R.; Yoshimura, M. Restoration of the graphitic structure by defect repair during the thermal reduction of graphene oxide. Carbon 2020, 166, 74–90. [Google Scholar] [CrossRef]
  66. De Silva, K.K.H.; Huang, H.H.; Joshi, R.K.; Yoshimura, M. Chemical reduction of graphene oxide using green reductants. Carbon 2017, 119, 190–199. [Google Scholar] [CrossRef]
  67. McGrail, B.T.; Rodier, B.J.; Pentzer, E. Rapid Functionalization of Graphene Oxide in Water. Chem. Mater. 2014, 26, 5806–5811. [Google Scholar] [CrossRef]
  68. Zhang, D.-D.; Zu, S.-Z.; Han, B.-H. Inorganic–organic hybrid porous materials based on graphite oxide sheets. Carbon 2009, 47, 2993–3000. [Google Scholar] [CrossRef]
  69. Stankovich, S.; Dikin, D.A.; Piner, R.D.; Kohlhaas, K.A.; Kleinhammes, A.; Jia, Y.; Wu, Y.; Nguyen, S.T.; Ruoff, R.S. Synthesis of graphene-based nanosheets via chemical reduction of exfoliated graphite oxide. Carbon 2007, 45, 1558–1565. [Google Scholar] [CrossRef]
  70. Zhu, W.; Lin, Y.; Kang, W.; Quan, H.; Zhang, Y.; Chang, M.; Wang, K.; Zhang, M.; Zhang, W.; Li, Z.; et al. An aerogel adsorbent with bio-inspired interfacial adhesion between graphene and MoS2 sheets for water treatment. Appl. Surf. Sci. 2020, 512, 145717. [Google Scholar] [CrossRef]
  71. Xu, J.; Du, P.; Bi, W.; Yao, G.; Li, S.; Liu, H. Graphene oxide aerogels co-functionalized with polydopamine and polyethylenimine for the adsorption of anionic dyes and organic solvents. Chem. Eng. Res. Des. 2020, 154, 192–202. [Google Scholar] [CrossRef]
  72. Brodie, B.C. On the Atomic Weight of Graphite. Philos. Trans. R. Soc. Lond. 1859, 149, 249–259. [Google Scholar] [CrossRef] [Green Version]
  73. Staudenmaier, L. Verfahren zur Darstellung der Graphitsäure. Ber. Der Dtsch. Chem. Ges. 1898, 31, 1481–1487. [Google Scholar] [CrossRef] [Green Version]
  74. William, S.; Hummers, J.; Richard, E. Offeman. Preparation of Graphitic Oxide. J. Am. Chem. Soc. 1958, 80, 1339. [Google Scholar] [CrossRef] [Green Version]
  75. Habte, A.T.; Ayele, D.W. Synthesis and Characterization of Reduced Graphene Oxide (rGO) Started from Graphene Oxide (GO) Using the Tour Method with Different Parameters. Adv. Mater. Sci. Eng. 2019, 2019, 5058163. [Google Scholar] [CrossRef] [Green Version]
  76. Deemer, E.M.; Paul, P.K.; Manciu, F.S.; Botez, C.E.; Hodges, D.R.; Landis, Z.; Akter, T.; Castro, E.; Chianelli, R.R. Consequence of oxidation method on graphene oxide produced with different size graphite precursors. Mater. Sci. Eng. B. 2017, 224, 150–157. [Google Scholar] [CrossRef]
  77. Marcano, D.C.; Kosynkin, D.V.; Berlin, J.M.; Sinitskii, A.; Sun, Z.; Slesarev, A.; Alemany, L.B.; Lu, W.; Tour, J.M. Improved Synthesis of Graphene Oxide. ACS Nano 2010, 4, 4806–4814. [Google Scholar] [CrossRef]
  78. Hou, Y.; Lv, S.; Liu, L.; Liu, X. High-quality preparation of graphene oxide via the Hummers’ method: Understanding the roles of the intercalator, oxidant, and graphite particle size. Ceram. Int. 2020, 46, 2392–2402. [Google Scholar] [CrossRef]
  79. Peng, S.; Fan, X.; Li, S.; Zhang, J. Green Synthesis and Characterization of Graphite Oxide by Orthogonal Experiment. J. Chil. Chem. Soc. 2013, 58, 2213–2217. [Google Scholar] [CrossRef] [Green Version]
  80. Kumar, S.; Baruah, B.; Kumar, A. Tunable degree of oxidation through variation of H2O2 concentration and its effect on structural, optical and supercapacitive properties of graphene oxide powders synthesized using improved method. Mater. Today Commun. 2017, 13, 26–35. [Google Scholar] [CrossRef]
  81. Charpy, G. Lur Sar Formation de L’oxyde Graphitique et la Définition du Graphite. Comptes Rendus Hebd. Des. Seances De. L Acad. Des. Sci. 1909, 148, 920–923. [Google Scholar]
  82. Koch, K.R. Oxidation by Mn207: An impressive demonstration of the powerful oxidizing property of dimanganeseheptoxide. J. Chem. Educ. 1982, 59, 973. [Google Scholar] [CrossRef]
  83. Fatmawati, D.A.; Triyono, T.; Trisunaryanti, W.; Oktaviano, H.S.; Chasanah, U. The Influence of Permanganate Enhancement to Graphite on Chemical Structure and Properties of Graphene Oxide Material Generated by Improved Tour Method. Indones. J. Chem. 2021, 21, 1086. [Google Scholar] [CrossRef]
  84. Emiru, T.F.; Ayele, D.W. Controlled synthesis, characterization and reduction of graphene oxide: A convenient method for large scale production. Egypt. J. Basic. Appl. Sci. 2019, 4, 74–79. [Google Scholar] [CrossRef] [Green Version]
  85. Rao, K.S.; Senthilnathan, J.; Liu, Y.F.; Yoshimura, M. Role of peroxide ions in formation of graphene nanosheets by electrochemical exfoliation of graphite. Sci. Rep. 2014, 4, 4237. [Google Scholar] [CrossRef]
  86. Eigler, S.; Grimm, S.; Hof, F.; Hirsch, A. Graphene oxide: A stable carbon framework for functionalization. J. Mater. Chem. A 2013, 1, 11559. [Google Scholar] [CrossRef] [Green Version]
  87. Morimoto, N.; Suzuki, H.; Takeuchi, Y.; Kawaguchi, S.; Kunisu, M.; Bielawski, C.W.; Nishina, Y. Real-Time, in Situ Monitoring of the Oxidation of Graphite: Lessons Learned. Chem. Mater. 2017, 29, 2150–2156. [Google Scholar] [CrossRef] [Green Version]
  88. Eigler, S.; Hirsch, A. Chemistry with graphene and graphene oxide-challenges for synthetic chemists. Angew. Chem. Int. Ed. Engl. 2014, 53, 7720–7738. [Google Scholar] [CrossRef] [Green Version]
  89. Lavin-Lopez, M.D.; Romero, A.; Garrido, J.; Sanchez-Silva, L.; Valverde, J.L. Influence of Different Improved Hummers Method Modifications on the Characteristics of Graphite Oxide in Order to Make a More Easily Scalable Method. Ind. Eng. Chem. Res. 2016, 55, 12836–12847. [Google Scholar] [CrossRef]
  90. Velasco-Hernández, A.; Esparza-Muñoz, R.A.; de Moure-Flores, F.J.; Santos-Cruz, J.; Mayén-Hernández, S.A. Synthesis and characterization of graphene oxide—TiO2 thin films by sol-gel for photocatalytic applications. Mater. Sci. Semicond. Process. 2020, 114, 105082. [Google Scholar] [CrossRef]
  91. Krishnamoorthy, K.; Veerapandian, M.; Yun, K.; Kim, S.J. The chemical and structural analysis of graphene oxide with different degrees of oxidation. Carbon 2013, 53, 38–49. [Google Scholar] [CrossRef]
  92. Eigler, S.; Dotzer, C.; Hirsch, A.; Enzelberger, M.; Müller, P. Formation and Decomposition of CO2 Intercalated Graphene Oxide. Chem. Mater. 2012, 24, 1276–1282. [Google Scholar] [CrossRef]
  93. Patterson, A.L. The Scherrer Formula for X-Ray Particle Size Determination. Phys. Rev. 1939, 56, 978–982. [Google Scholar] [CrossRef]
  94. Lerf, A.; Buchsteiner, A.; Pieper, J.; Schöttl, S.; Dekany, I.; Szabo, T.; Boehm, H.P. Hydration behavior and dynamics of water molecules in graphite oxide. J. Phys. Chem. Solids 2006, 67, 1106–1110. [Google Scholar] [CrossRef]
  95. Rezania, B.; Severin, N.; Talyzin, A.V.; Rabe, J.P. Hydration of Bilayered Graphene Oxide. Nano Lett. 2014, 14, 3993–3998. [Google Scholar] [CrossRef]
  96. Liu, L.; Zhang, R.; Liu, Y.; Tan, W.; Zhu, G. Insight into hydrogen bonds and characterization of interlayer spacing of hydrated graphene oxide. J. Mol. Model. 2018, 24, 137. [Google Scholar] [CrossRef]
  97. Kim, D.; Kim, D.W.; Lim, H.-K.; Jeon, J.; Kim, H.; Jung, H.-T.; Lee, H. Intercalation of Gas Molecules in Graphene Oxide Interlayer: The Role of Water. J. Phys. Chem. C 2014, 118, 11142–11148. [Google Scholar] [CrossRef]
  98. Kaniyoor, A.; Ramaprabhu, S. A Raman spectroscopic investigation of graphite oxide derived graphene. AIP Adv. 2012, 2, 032183. [Google Scholar] [CrossRef] [Green Version]
  99. Tojo, T.; Shinohara, M.; Fujisawa, K.; Muramatsu, H.; Hayashi, T.; Kim, Y.A.; Endo, M. Highly Conductive One-Dimensional Manganese Oxide Wires by Coating with Graphene Oxides. Appl. Phys. Express 2012, 5, 105001. [Google Scholar] [CrossRef]
  100. Sharma, M.; Rani, S.; Pathak, D.K.; Bhatia, R.; Kumar, R.; Sameera, I. Temperature dependent Raman modes of reduced graphene oxide: Effect of anharmonicity, crystallite size and defects. Carbon. 2021, 184, 437–444. [Google Scholar] [CrossRef]
  101. Nguyen, V.T.; Le, H.D.; Nguyen, V.C.; Tam Ngo, T.T.; Le, D.Q.; Nguyen, X.N.; Phan, N.M. Synthesis of multi-layer graphene films on copper tape by atmospheric pressure chemical vapor deposition method. Adv. Nat. Sci. Nanosci. Nanotechnol. 2013, 4, 035012. [Google Scholar] [CrossRef]
Figure 1. (a) GrO after freeze-drying; (b) lamellar structure formed in GrO after freeze drying.
Carbon 09 00065 g001
Figure 5. Graph of [001] diffraction peak for the 16 GrO samples obtained in ED.
Carbon 09 00065 g005
Figure 6. Schematic representation of GrO structures formed at: (a) 45 °C and (b) 60 °C.
Carbon 09 00065 g006
Figure 7. Raman spectra of the 16 GrO samples obtained in the ED, ordered from highest to lowest ID/IG ratio (from the bottom up).
Carbon 09 00065 g007
Figure 8. SEM images for GrO_Exp01 and GrO_05 obtained at: (a,e) 15× magnifications; (b,f) 20× magnifications; (c,g) 100× magnifications; (d,h) 200× magnifications.
Carbon 09 00065 g008
Table 1. Experimental conditions of the 16 experiments obtained with the ED.
ExperimentTemperature (°C)Time (h)H2O2 (mL)KMnO4 (g)
GrO_Exp016012504
GrO_Exp024516503
GrO_Exp034512104
GrO_Exp044512103
GrO_Exp054512504
GrO_Exp064516104
GrO_Exp076016104
GrO_Exp084516504
GrO_Exp096016103
GrO_Exp106012503
GrO_Exp116016504
GrO_Exp124516103
GrO_Exp136012103
GrO_Exp146016503
GrO_Exp154512503
GrO_Exp166012104
Table 2. Optimum synthesis conditions obtained by applying ED.
Variable (units)Optimum Value
Temperature (°C)60
Time (h)12
H2O2 (mL)50
KMnO4 (g)4
Table 3. Range, average, SD and T-Student of the results corresponding to SSA and t-Plot MV of the 16 GrO samples obtained in the ED.
VariableValueSSA (m2g−1)
RangeAverageSDT-Student
T (°C)4523.4–57.433.211.63.0
6040.6–67.048.38.9
t (h)1225.1–67.045.613.61.6
1623.4–51.235.910.3
H2O2 (mL)1025.3–57.440.010.50.22
5023.4–67.041.515.2
KMnO4 (g)325.3–51.240.59.40.05
423.4–67.041.015.9
VariableValuet-Plot-(Micropore Volume, cm3g−1)
RangeAverageSDT-Student
T (°C)450.0009–0.00590.00280.00154.4
600.0070–0.01810.00890.0037
t (h)120.0022–0.01810.00690.00501.0
160.0009–0.00820.00480.0031
H2O2 (mL)100.0021–0.00800.00550.00240.31
500.0009–0.01810.00620.0057
KMnO4 (g)30.0009–0.00820.00500.00300.01
40.0021–0.01810.00670.0052
Table 4. Range, average, SD and T-Student of the results corresponding to C content of the 16 GrO samples obtained in the ED.
VariableValueC (%)
RangeAverageSDT-Student
T (°C)4534.6–43.139.12.81.2
6035.4–39.037.81.1
t (h)1237.6–42.439.01.70.88
1634.6–43.138.02.7
H2O2 (mL)1035.4–43.139.12.51.0
5034.6–40.537.91.8
KMnO4 (g)334.6–42.438.02.40.12
436.5–43.139.02.0
Table 5. Range, average, SD and T-Student of the results of the 16 GrO samples obtained in the ED corresponding to (a) position (2Ɵ) and d (nm); (b) L (nm) and n.
(a)
VariableValuePosition (2Ɵ)
RangeAverageSDT-Student
T (°C)459.8–10.510.10.227.7
6010.6–11.210.90.15
t (h)129.8–11.210.50.420.34
169.9–10.910.50.44
H2O2 (mL)109.9–10.910.50.360.14
509.8–11.210.50.49
KMnO4 (g)39.8–10.910.50.400.0082
49.9–11.210.50.46
VariableValued (nm)
RangeAverageSDT-Student
T (°C)450.84–0.900.870.0197.5
600.79–0.830.810.011
t (h)120.79–0.900.840.0340.34
160.81–0.890.850.035
H2O2 (mL)100.81–0.890.840.0290.18
500.79–0.900.850.040
KMnO4 (g)30.81–0.900.850.0330.16
40.79–0.890.840.036
(b)
VariableValueL (nm)
RangeAverageSDT-Student
T (°C)4558.6–166.1109.343.44.5
6027.7–49.838.57.5
t (h)1233.2–166.174.849.80.073
1627.7–166.173.048.2
H2O2 (mL)1035.6–166.180.454.20.54
5027.7–124.667.442.1
KMnO4 (g)327.7–166.182.759.81.8
435.6–124.665.232.6
VariableValuen
RangeAverageSDT-Student
T (°C)4567.0–197.7125.450.94.3
6033.7–61.647.39.2
t (h)1240.8–197.787.857.10.10
1633.7–189.984.953.8
H2O2 (mL)1042.8–197.794.662.50.60
5033.7–141.778.145.9
KMnO4 (g)333.7–197.796.568.41.8
443.8–141.776.235.4
Table 6. Range, average, SD and T-Student of the results corresponding to ID/IG and I2D/IG content of the 16 GrO samples obtained in the ED.
VariableValueID/IG
RangeAverageSDT-Student
T (°C)450.98–1.031.000.0201.3
600.90–1.020.980.044
t (h)120.90–1.020.980.0370.80
160.92–1.031.000.034
H2O2 (mL)100.92–1.000.980.0260.86
500.90–1.031.000.043
KMnO4 (g)30.90–1.020.980.0380.007
40.92–1.031.000.034
VariableValueI2D/IG
RangeAverageSDT-Student
T (°C)450.14–0.180.160.0130.41
600.13–0.170.150.012
t (h)120.13–0.160.150.0110.66
160.14–0.180.160.014
H2O2 (mL)100.14–0.180.160.0120.70
500.13–0.170.150.013
KMnO4 (g)30.13–0.170.150.0120.015
40.14–0.180.160.012
Disclaimer/Publisher’s Note: The statements, opinions and data contained in all publications are solely those of the individual author(s) and contributor(s) and not of MDPI and/or the editor(s). MDPI and/or the editor(s) disclaim responsibility for any injury to people or property resulting from any ideas, methods, instructions or products referred to in the content.

