
Automatic Eligibility of Sellers in an Online Marketplace: A Case Study of Amazon Algorithm


1
Joint Research Centre, European Commission, 41092 Seville, Spain
2
Department of Statistics and Operations Research, University of Seville, 41092 Seville, Spain
3
Data Science & Big Data Lab, Universidad Pablo de Olavide, 41013 Seville, Spain
*
Author to whom correspondence should be addressed.
Information 2022, 13(2), 44; https://doi.org/10.3390/info13020044
Submission received: 6 December 2021
/
Revised: 7 January 2022
/
Accepted: 8 January 2022
/
Published: 19 January 2022
(This article belongs to the Special Issue Predictive Analytics and Data Science)
Abstract
:Purchase processes on Amazon Marketplace begin at the Buy Box, which represents the buy click process through which numerous sellers compete. This study aimed to estimate empirically the relevant seller characteristics that Amazon could consider featuring in the Buy Box. To that end, 22 product categories from Italy’s Amazon web page were studied over a ten-month period, and the sellers were analyzed through their products featured in the Buy Box. Two different experiments were proposed and the results were analyzed using four classification algorithms (a neural network, random forest, support vector machine, and C5.0 decision trees) and a rule-based classification. The first experiment aimed to characterize sellers unspecifically by predicting their change at the Buy Box. The second one aimed to predict which seller would be featured in it. Both experiments revealed that the customer experience and the dynamics of the sellers’ prices were important features of the Buy Box. Additionally, we proposed a set of default features that Amazon could consider when no information about sellers was available. We also proposed the possible existence of a relationship or composition among important features that could be used for sellers to be featured in the Buy Box.
1. Introduction
The number of algorithms that automate services once requiring manual operations is expected to grow in the coming years. Knowledge about the behaviour of such algorithms is gaining interest in the scientific community despite the current lack of tools and methodologies to measure the effects of these algorithms on people. Algorithms implemented for personalization on Google Search, the review of gig economy workers by customers (e.g., a job for a specified period of time), or gender discrimination in hiring are some of the subjects of this research [1,2,3]. In e-commerce and online marketplaces, the impact of algorithms is also of interest due to the current popular demand of web-based shopping platforms.
Amazon Marketplace is one of the leaders in online retail [4], controlling 45% of the e-commerce market share in the United States and surpassing Walmart in this regard in 2020 [5]. Amazon competes with some of the largest corporations around the world for market share, accounting for 13% of the global e-commerce sector’s gross merchandise volume in 2020, while the Alibaba group (Taobao, Alibaba, and Tmall), Jingdong (JD.com), Pinduoduo, and eBay had 25%, 9%, 6%, and 2% of the market, respectively. The combined share of Suning.com, Rakuten, Apple, Walmart, Vip.com, and Shopee was 6% [6].
Amazon Marketplace represents a structured and managed e-commerce website that accommodates two groups of participants: sellers presenting new, refurbished, or used products to a large group of potential buyers and customers who benefit from a coordinated system of purchasing that includes the search for products, payment, shipment, and order tracking. The number of products each seller can offer on Amazon is unlimited, as is the number of sellers that can operate. This platform allows the same products to be sold by many retailers, including Amazon, who also acts as a retail competitor.
Amazon Marketplace provides a set of services and programs that are attractive to sellers and customers. Sellers may benefit from inventory tools, activity reports, segmented advertisement of products, or the Fulfilment by Amazon (FBA) program. The latter allows Amazon to regulate warehouse management and shipping and the return of sold products with an additional cost. Customers are offered a product recommendation system based on their purchase history or an Amazon Prime membership, which has the advantage of faster delivery at a lower cost.
Amazon Marketplace products are presented on detailed product pages and, as on other e-commerce websites [7,8,9], are arranged in a taxonomy of categories to favor consistent navigation structures, thereby enhancing the user experience and the website’s usability. Each detailed product page provides a proper description of the product, which includes its characteristics, consumer reviews, stock availability, the price or product rating, and the Buy Box. The Buy Box is the top right section on a product page where a customer can directly add a product to his or her shopping cart. This box shows a summary of the product information and, more importantly for this study, the default seller selected by Amazon for the product of interest. When customers decide not to choose the seller proposed by Amazon, an offer listing page is provided, on which other sellers offering the product of interest are displayed. Here, their prices and shipping costs can be examined. The Buy Box has received great attention as it is where purchases on Amazon occur, as well as because 80% of Amazon’s sales go through it. Additionally, the Buy Box represents the single most important revenue driver for Amazon Marketplace sellers today. It is estimated that a seller whose product is positioned in the Buy Box will sell four-times more than those displayed on the offer listing page [10].
The process by which Amazon’s algorithms select the seller to be displayed in the Buy Box is still not fully understood and represents the main motivation for this study. To address this challenge, observational data of products and sellers occupying the Buy Box from one of Amazon’s European marketplaces were analyzed over a 10-month period. Most of the categories of products presented in this marketplace were analyzed by conducting two different but complementary experiments. The first experiment aimed to predict when a seller currently occupying the Buy Box would be replaced by a competitor. The second one asked which seller among a group of competitors would be most likely to occupy the Buy Box. The importance of the features used in these predictive problems was estimated, and a rule-based classification was performed, both of which represent the results of this work.
1.1. Literature Review
Potential applications of machine learning in the e-commerce sector have been researched extensively from different perspectives (e.g., chatbots [11], recommendation engines [12,13,14], applications for intelligent logistics [15,16] and pricing [17,18,19,20,21]). The application of machine learning, as in other sales business models, extends to almost every area of e-commerce (e.g., security [22], fraud detection [23,24], profit maximisation [25], sales prediction [26,27], inventory management [28,29], product categorisation [30], and portfolio management [31]). Literature reviews exploring machine learning applications in different e-commerce scenarios can mainly be found in [32,33,34,35,36,37,38].
1.2. Related Work
To the best of the authors’ knowledge, the only study that has investigated the algorithm by which Amazon selects sellers to occupy the Buy Box was by Chen et al. [39], who analyzed the algorithmic pricing strategies on the Amazon Marketplace. These authors also simplified the modeling through a predictive problem, and after analyzing the importance of the selected features from the sellers’ offers, they concluded that the more important ones related to a seller earning the position in the Buy Box are price difference and the ratio of the price to the lowest price for the product. Other analyzed features included positive seller feedback whether or not the product was fulfilled by Amazon, and the average product rating. The main difference between the predictive problem used in that study and that used in the current one is the type of sellers considered. While those authors collected information from seller offers displayed on the offer listing page and that of the seller who won the Buy Box, in the present study only the characteristics of the sellers occupying the Buy Box were considered. This is because we wanted to focus on sellers who were truly eligible and probably more professional. Additionally, according to Amazon documentation, features that condition a seller to be eligible to occupy the Buy Box are their sales volume, response time to customer enquiries, rate of returns and refunds, and shipping times [39]. Therefore, one plausible way to circumvent the lack of this latter information from sellers was to consider only those ones who actually earned the Buy Box.
2. Materials and Methods
This section describes the predictive problems for an empirical analysis of Amazon’s criteria for a seller being selected to occupy the Buy Box and then once selected, continuing in it. Thus, two classification experiments using selected features and the same four classifiers on each were performed on 22 different product category datasets. Then, for each experiment, once the more accurate classifier had been selected, the importance of features in the predictive problems was estimated. Complementary to this estimation, a rule-based classification was also performed. The datasets used in this study and the analyzed features are explained in the next section.
2.1. Datasets and Features
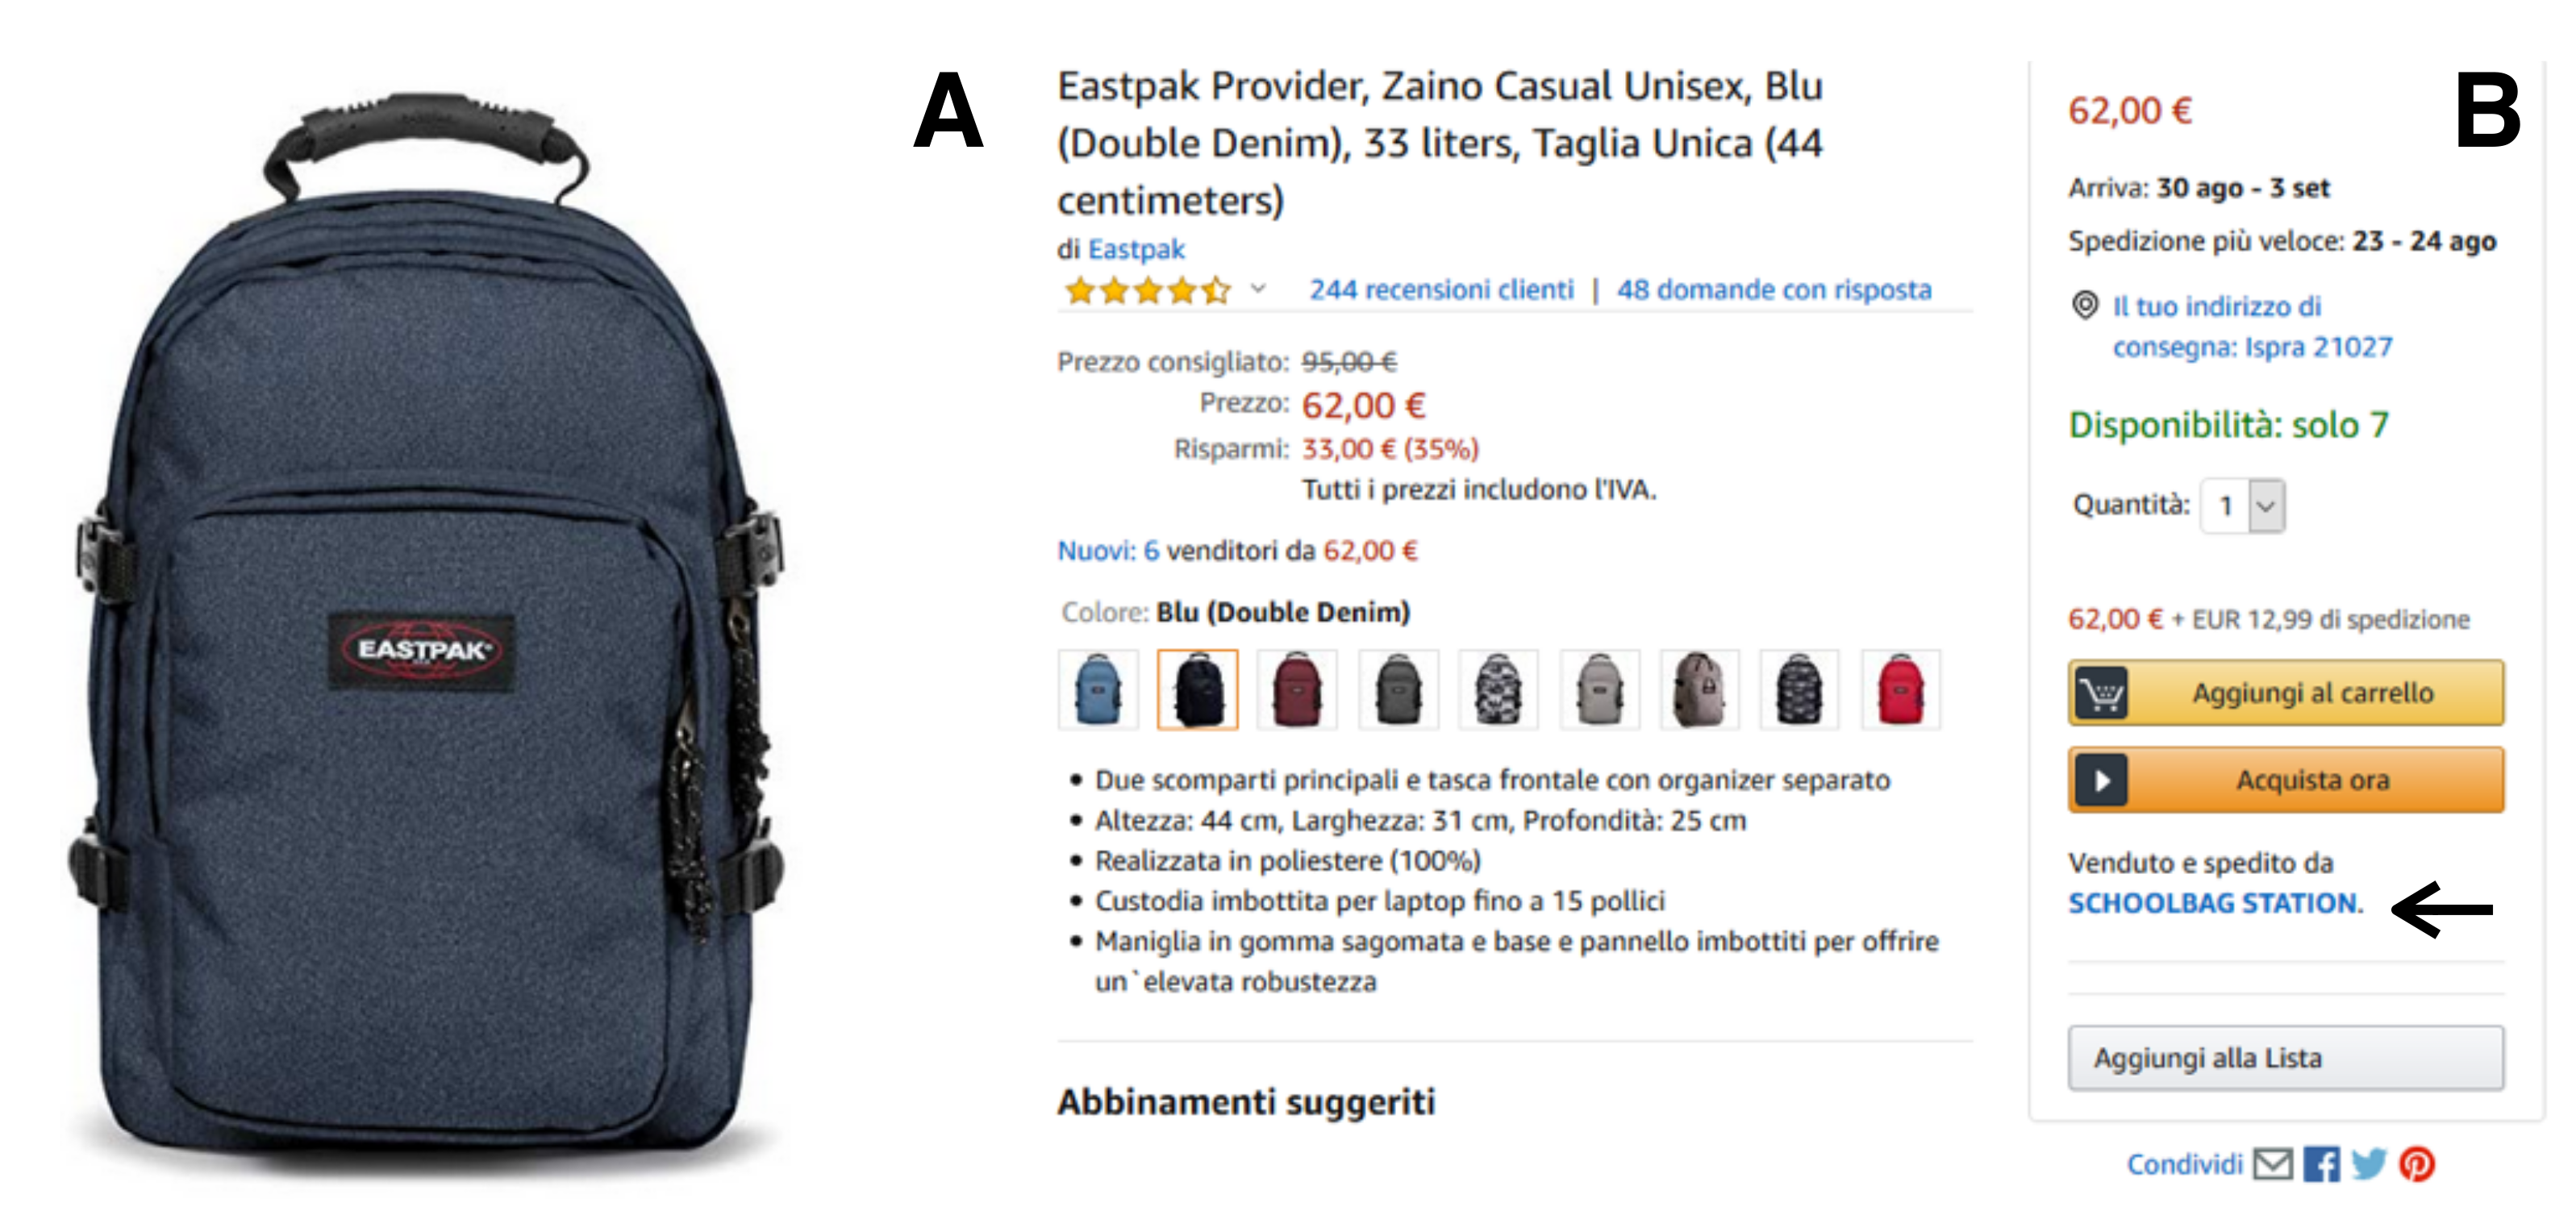
Product page information from 530 best-seller products belonging to 22 different product categories was obtained from Italy’s Amazon Marketplace web page from 5 April to 14 December 2018. Preliminary crawling exercises were accomplished for Amazon Marketplaces in Germany, the United Kingdom, Spain, and France. The best communication performance results in server stability and response time were found for Italy’s Marketplace. A typical product page is shown in Figure 1.
For each category, the best-seller products were analyzed over time, and a longitudinal dataset describing the dynamic of features was created and shown in Table 1. These features were obtained directly from the product pages, except the last three, which were derived from the prices of the products at each analyzed point of time. A crawling experiment was carried out previously to detect the most dynamic categories in changes to the sellers occupying the Buy Box. Categories with a low rate of change among such sellers or those for which Amazon was the only seller (e.g., Amazon device accessories, Kindle, Alexa) were excluded. Analogously, products sold by fewer than five sellers in a category were not considered due to low sales relevance. The crawling process was carried out sequentially from the first best-seller product listed in each category to the last. Due to Amazon’s strategic commercial reasons, the number of best-seller products displayed in each category was altered over time (e.g., 20, 50 or 100 products); therefore, the frequency of visits to each product page to collect product information changed during the experiment, ranging from ∼1 h to ∼4 h. The numbers of instances, products, and sellers in each analyzed dataset are indicated in Table 2. Datasets built for each product category were used as input data in the supervised and rule-based experiments performed and were studied independently. Next, the proposed classification problems are explained.
2.2. Proposed Classification Problems
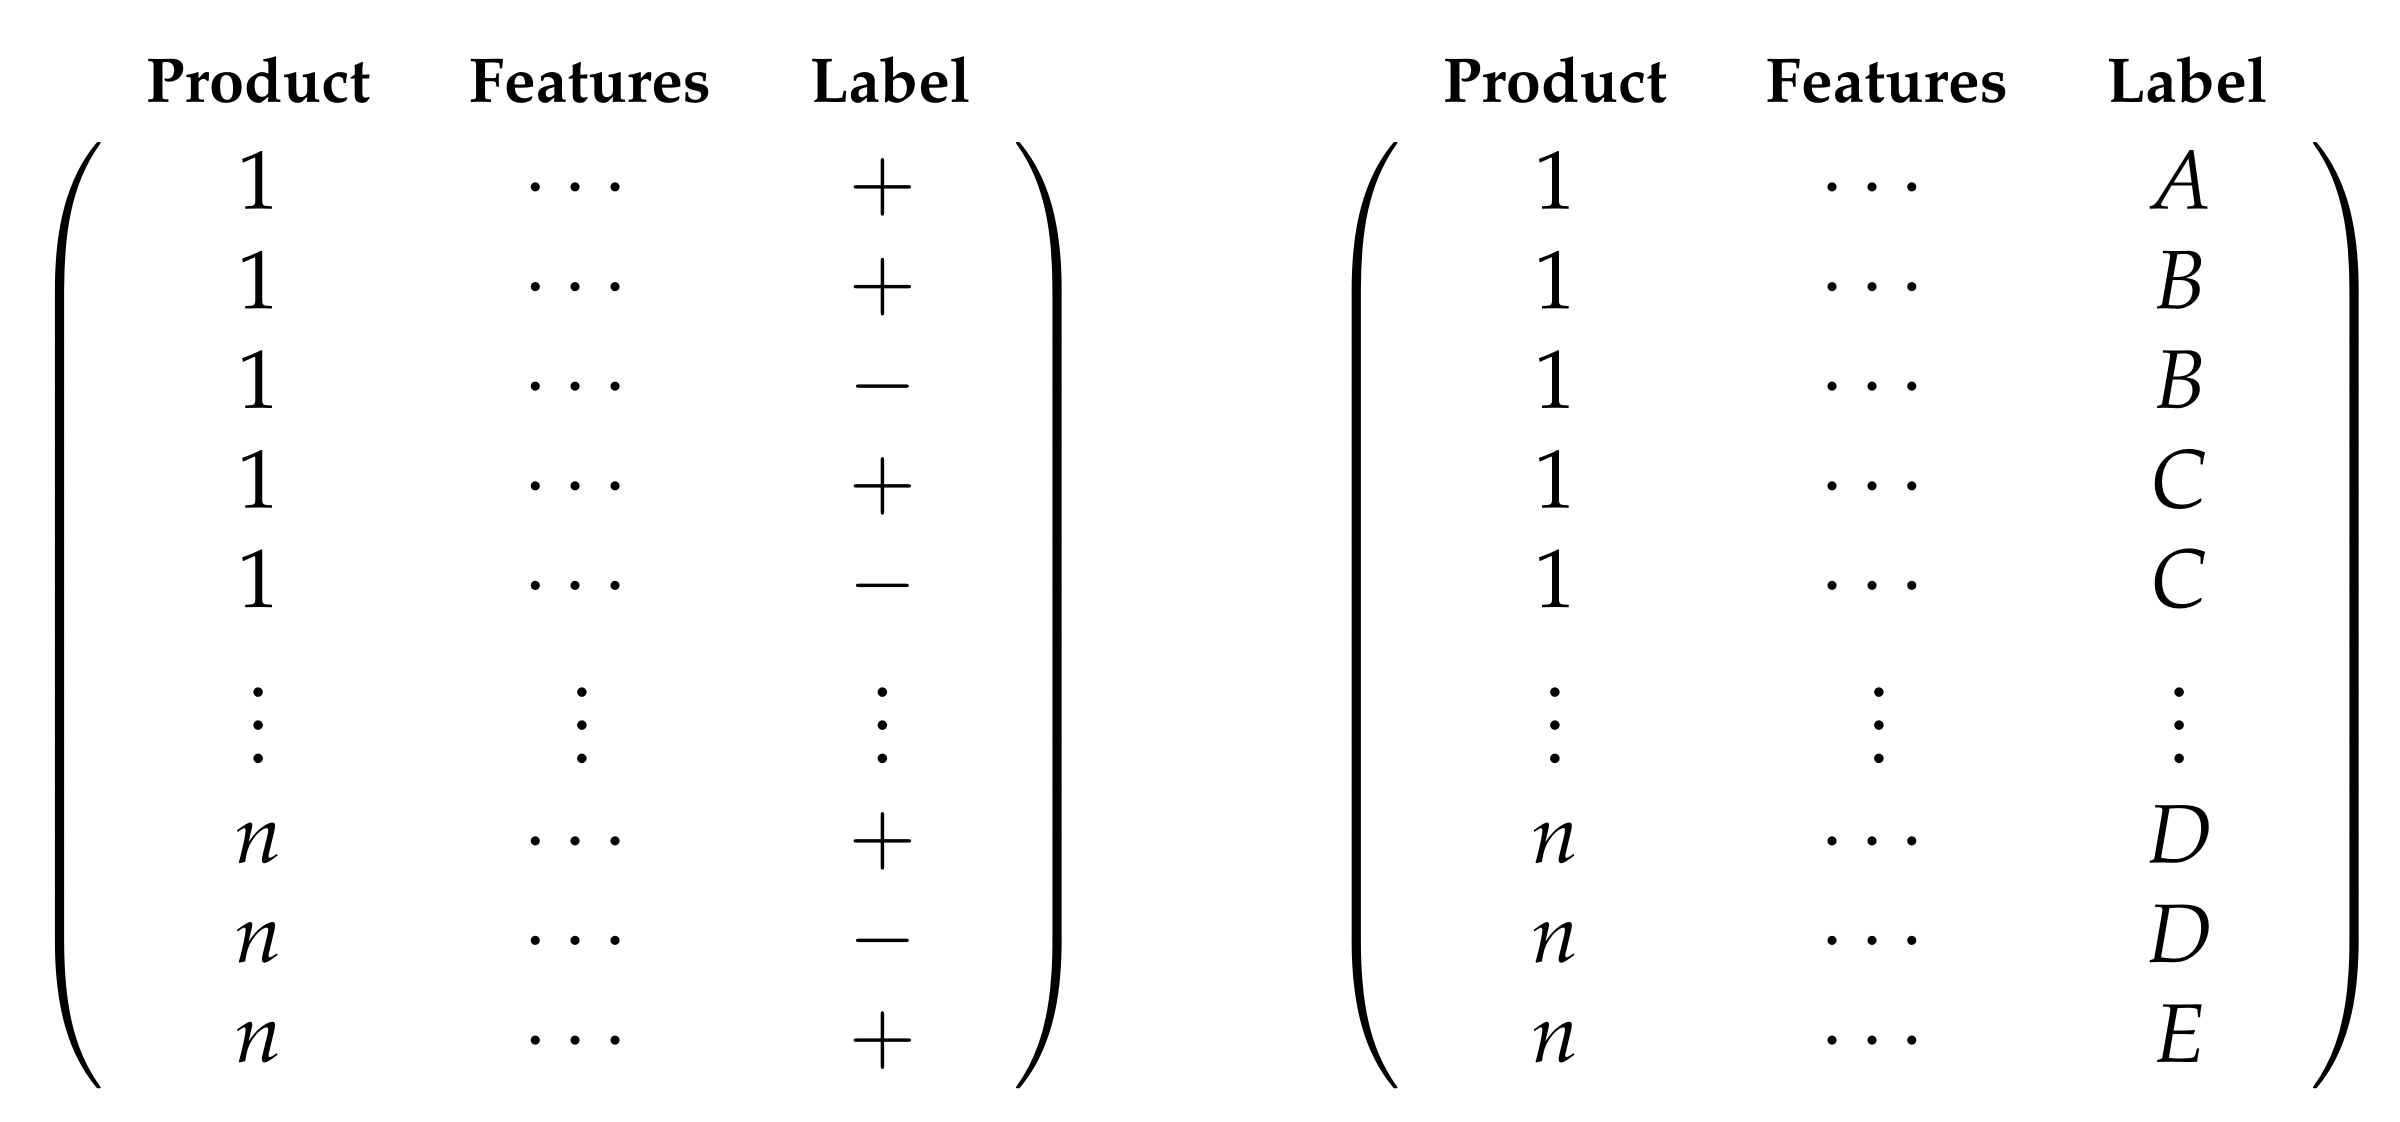
The estimation of the importance of predictors shown in Table 1 was addressed through two supervised experiments. They were performed independently on each of the 22 longitudinal datasets from the product categories. The experiments differed in the treatment received by the response feature. In the first one (predicting the change of a seller at the Buy Box), the levels of the response feature were represented by a binary output in which the positive class (“1”) indicated if a change of seller had been observed at the Buy Box (two-class classification), and the negative class indicated otherwise (“0”). In the second one (predicting the seller to occupy the Buy Box), the levels of the response feature indicated the sellers displayed in the Buy Box (multi-class classification). Thus, the first experiment can be considered unspecific regarding the target seller occupying the Buy Box since it was focused on detecting simply the changes. On the other hand, the second experiment aimed to predict the specific seller occupying the Buy Box. Figure 2 illustrates the labeling process for a given product category.
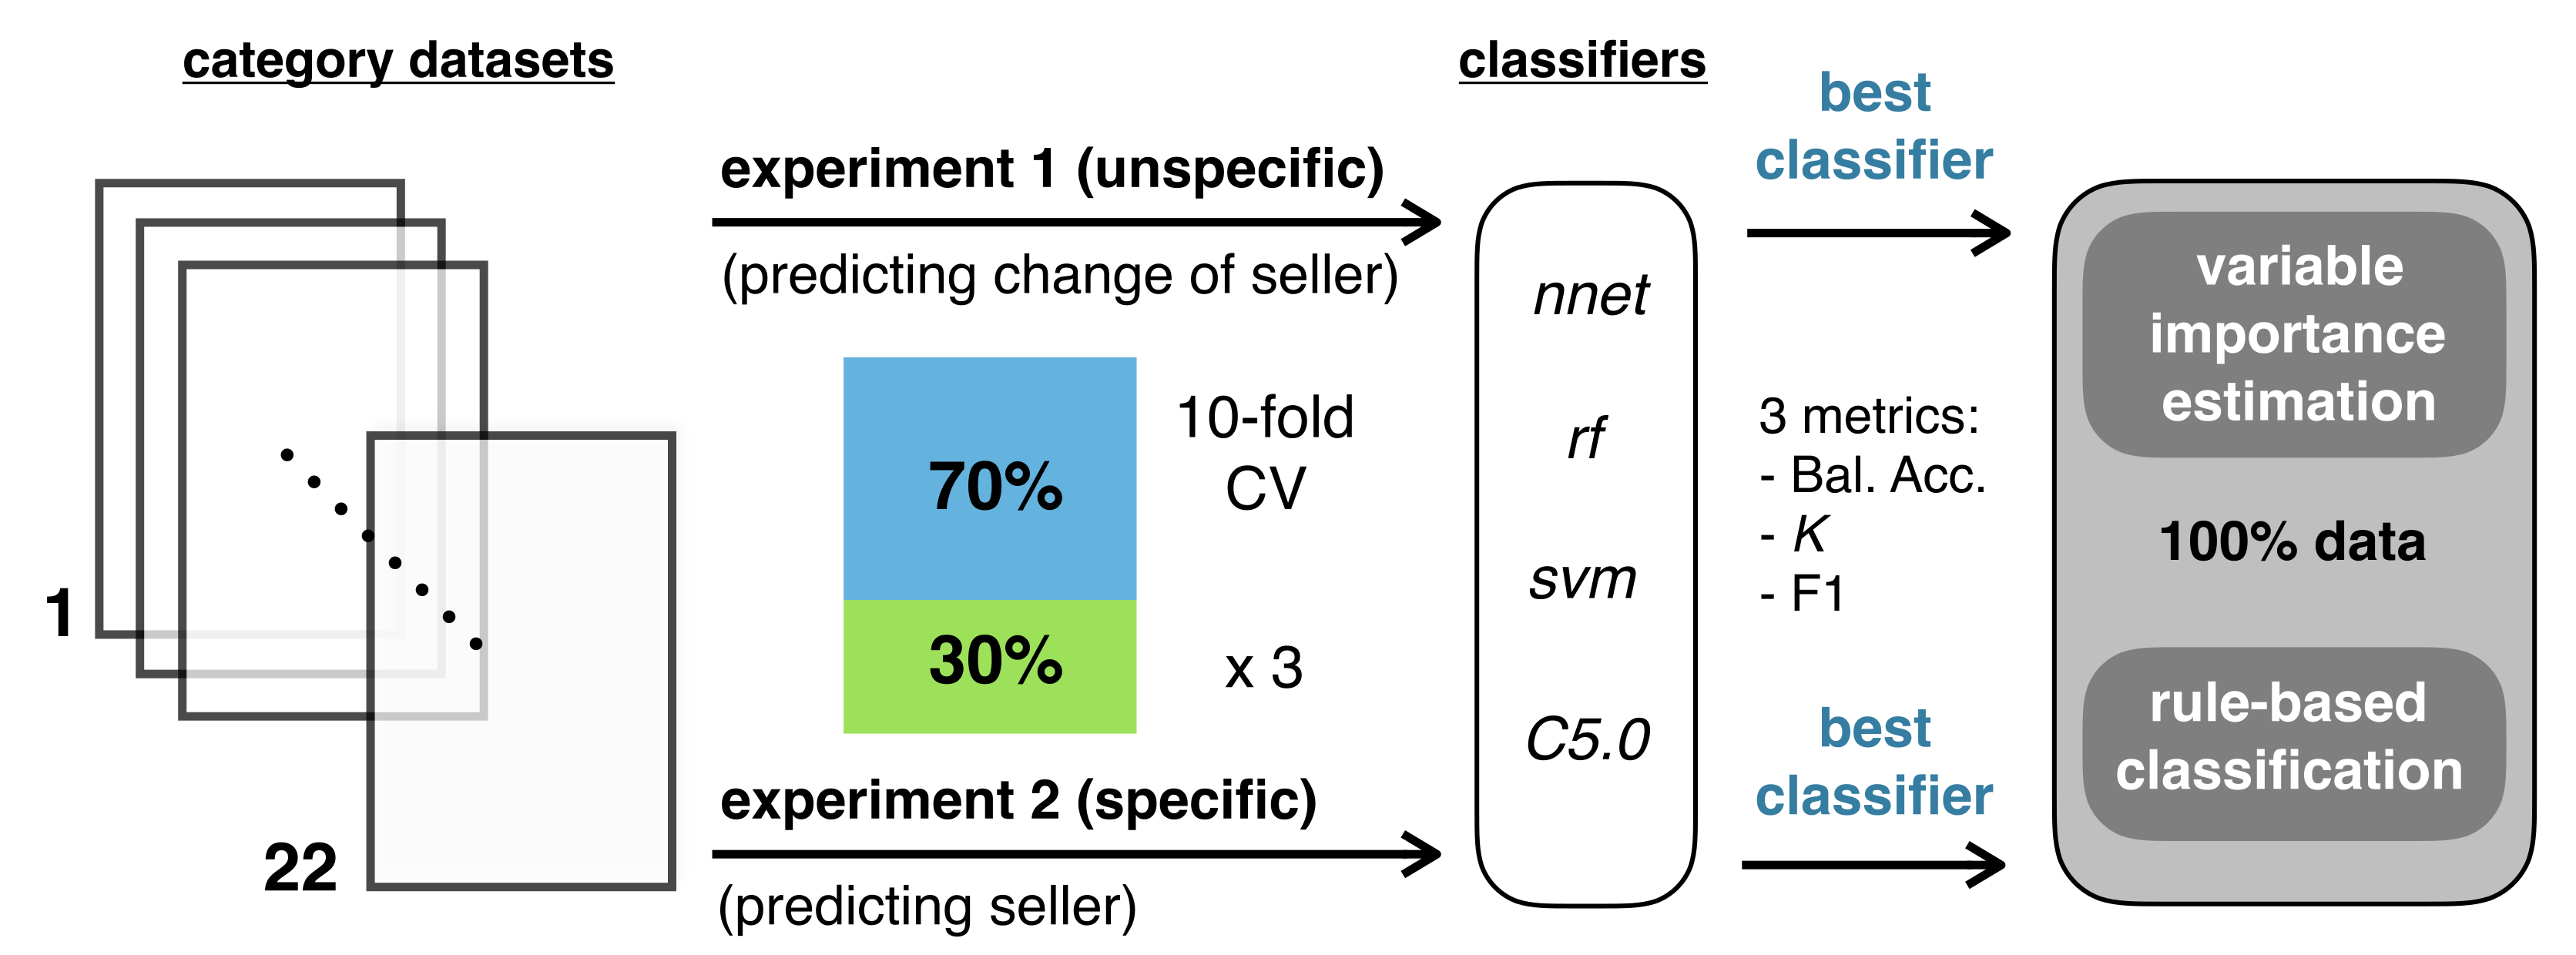
Four classifiers were used in each supervised experiment, namely, neural networks (nnet), random forests (rf), support vector machines (svm), and C5.0 decision trees (C5.0). Descriptions of these classifiers are provided in Section 2.2.1. The idea behind this approach was to identify the most accurate classifier in each experiment and then use it to estimate the importance of the features and perform rule-based classification. A general overview of the complete experimental design is illustrated in Figure 3. To evaluate the accuracy of the classifiers, a dataset from the different categorieswas divided into training and test sets, consisting of 70% and 30% of the data, respectively. The caret package [40] from R language was used to build classification models for the training data using a 10-fold cross-validation scheme that was repeated three times to tune the hyperparameters of each classifier. Due to the different magnitudes of the values of the involved predictors, all were centred and scaled.
2.2.1. Classification Algorithms
A decision tree gives a set of rules that can be used to divide data into different groups to make a decision about them [41]. An rf classifier is an ensemble of decision trees that uses a randomly selected subset of training samples and features to yield reliable classifications.The trees are created by drawing a subset of training samples through replacement, meaning that the same sample can be selected several times, while others may not be selected. About two-thirds of the samples are used to train the trees, with the remaining one-third being used for an internal cross-validation to estimate how well the resulting rf model performed [42]. C5.0 decision trees are a more advanced version of Quinlan’s C4.5 classification model [43]. C4.5 builds decision trees from a set of training data using the concept of information entropy. C5.0 has additional features, such as boosting and unequal costs for different types of errors, but is also likely to generate smaller trees. The algorithm combines non-occurring conditions for splits with several categories and conducts a final global pruning procedure that attempts to remove sub-trees with a cost-complexity approach [44].
nnet are computational models inspired by biological neural networks capable of approximating nonlinear functional relationships between inputs and outputs features. A collection of neurons is referred to as a layer, and the collection of interconnected layers forms the neural networks [45]. In a neuron, the output is calculated by a nonlinear function of the sum of its inputs. The connections between different neurons from adjacent layers are represented by the weights in a model. The weights adjust as learning proceeds, and they represent the strength of the signal at a connection. The nonlinear function is also called the activation function [46].
svm are based on the statistical learning theory concept of decision planes that define decision boundaries. A decision plane ideally separates objects with different class memberships. The most commonly known svm is the linear classifier, which predicts each input’s member class from two possible classifications. A more accurate definition is that a svm builds a hyperplane or set of hyperplanes to classify all inputs in a high-dimensional or even infinite space. The values closest to the classification margin are known as support vectors. The svm’s goal is to maximize the margin between the hyperplane and the support vectors [47,48]. The metrics used to evaluate the accuracy of classifiers is explained next.
2.2.2. Performance Evaluation
The classes use in the experiments described above are not equally distributed because the occurrence of sellers in the Buy Box is not homogeneous and the ratio of change for sellers in the Buy Box is low (the positive class is under-represented). Since it is not appropriate to use only a single metric to evaluate the performance of a classifier [49], three metrics suited to dealing with class imbalance were selected: balanced accuracy, Kappa statistic [50], and -score (F1). The first experiment was analyzed as a binary classification problem; however, the evaluation of the multi-class problem (second experiment) was treated as a set of binary problems (‘one-versus-all’ transformation). Metrics are explained next using a binary confusion matrix in the context of both experiments (Table 3). For a given product, the positive class (+) in the first experiment was represented by a change in seller, and the negative class (−) was represented by the continuity of the seller at the Buy Box. In the second experiment, the positive class (A) was some seller of interest selling a given product, and the negative class (≠A) was by any other seller.
- TP: which corresponds to the number of instances correctly classified as +/A.
- FN: which corresponds to the number of instances +/A misclassified as −/≠A.
- FP: which corresponds to the number of instances −/≠A misclassified as +/A.
- TN: which corresponds to the number of instances correctly classified as −/≠A.
The metrics used were based on the following statistics and concise explanations follows:
- Recall = , the proportion of correctly classified +/A instances from the total number of actual +/A instances, aka Sensitivity.
- Precision = , relates to the ability of the classifiers to identify +/A instances.
- Specificity = , proportion of correctly classified −/≠A instances from the total number of actual −/≠A instances.
Balanced accuracy (BAcc), F1 and Kappa (K) statistics are calculated as follows:
where O is the observed accuracy, and E is the expected accuracy based on the marginal totals of the confusion matrix. BAcc and F1 metrics range from 0 to 1, and high values indicate high classification performances. The K statistic takes values between −1 and 1; a value of 0 means there is no agreement between the observed and predicted classes, while a value of 1 indicates perfect concordance between the model prediction and the observed classes [44].
2.3. Predictor Importance and Rule-Based Classification
The importance of predictors was estimated to identify the most relevant features involved in both predictive problems. For that purpose, for each product category, the most accurate classifier was used to train a model with full datasets (no train-test split), and the importance of predictors was estimated using the varImp function from the caret package. This function measured the aggregate effect of the predictors on the model and returned a score for each of the features in model.
As a complementary exercise, rule-based classification was accomplished to discern relations within the set of features (predictors and response) analyzed in this study. A rule-based classifier uses a set of IF–THEN rules for class prediction. An IF–THEN rule is an expression of the form IF condition THEN conclusion. The “IF” part (or left-hand side) of a rule is known as the rule antecedent or precondition. The “THEN” part (or right-hand side) is the rule consequent. In the rule antecedent, the condition consists of one or more features that are logically added by AND clauses. These features are the predictors defined in Table 1. The classes predicted in the rule in this study were represented by the seller’s identification or by its change labeled as a binary feature, depending on the experiment, as explained above (Section 2.2). The function C5.0 (C5.0 package [51]) from R was used, and all rules obtained from both experiments were analyzed. Totals of 488 and 4009 rules were obtained in the experiments to predict the change in seller and to predict the seller, respectively. These rules included 1616 and 16,368 conditions, respectively. Since the same conditions may appear for different rules, an analysis of the frequency of conditions appearing in rules was performed.
The accuracy of each rule was estimated using the Laplace ratio , where n is the number of cases covered by the rule (support of the rule) and m is the number of cases that do not belong to the class predicted by the rule. Additionally, the lift estimate was calculated by dividing the rule’s estimated accuracy by the relative frequency of the class predicted in the data set. This estimate is a measure of the interest of the rule (predictive ability), and is in the range . Values far from one imply the co-occurrence of conditions defining the rule and the predicted class.
3. Results and Discussion
The accuracy of classifiers for each experiment was estimated for each of the 22 product category datasets. Results are shown in Table 4 and Table 5, together with the average values across categories. It is remarkable that for the prediction of the seller change experiment, the kappa value for some categories was 0 when evaluated with two accuracy metrics (e.g., Bby and Lgh), but that the svm classifier showed an accuracy value of zero or close to zero for this statistic in 13 categories. Greater accuracy for all categories was obtained by rf and C5.0 decision tree classifiers. In the prediction of seller experiments, no accuracy level was close to zero. The C5.0 classifier was selected as the most accurate as it obtained the highest accuracy level for the three quality metrics when both experiments were considered.
3.1. Predictor Importance
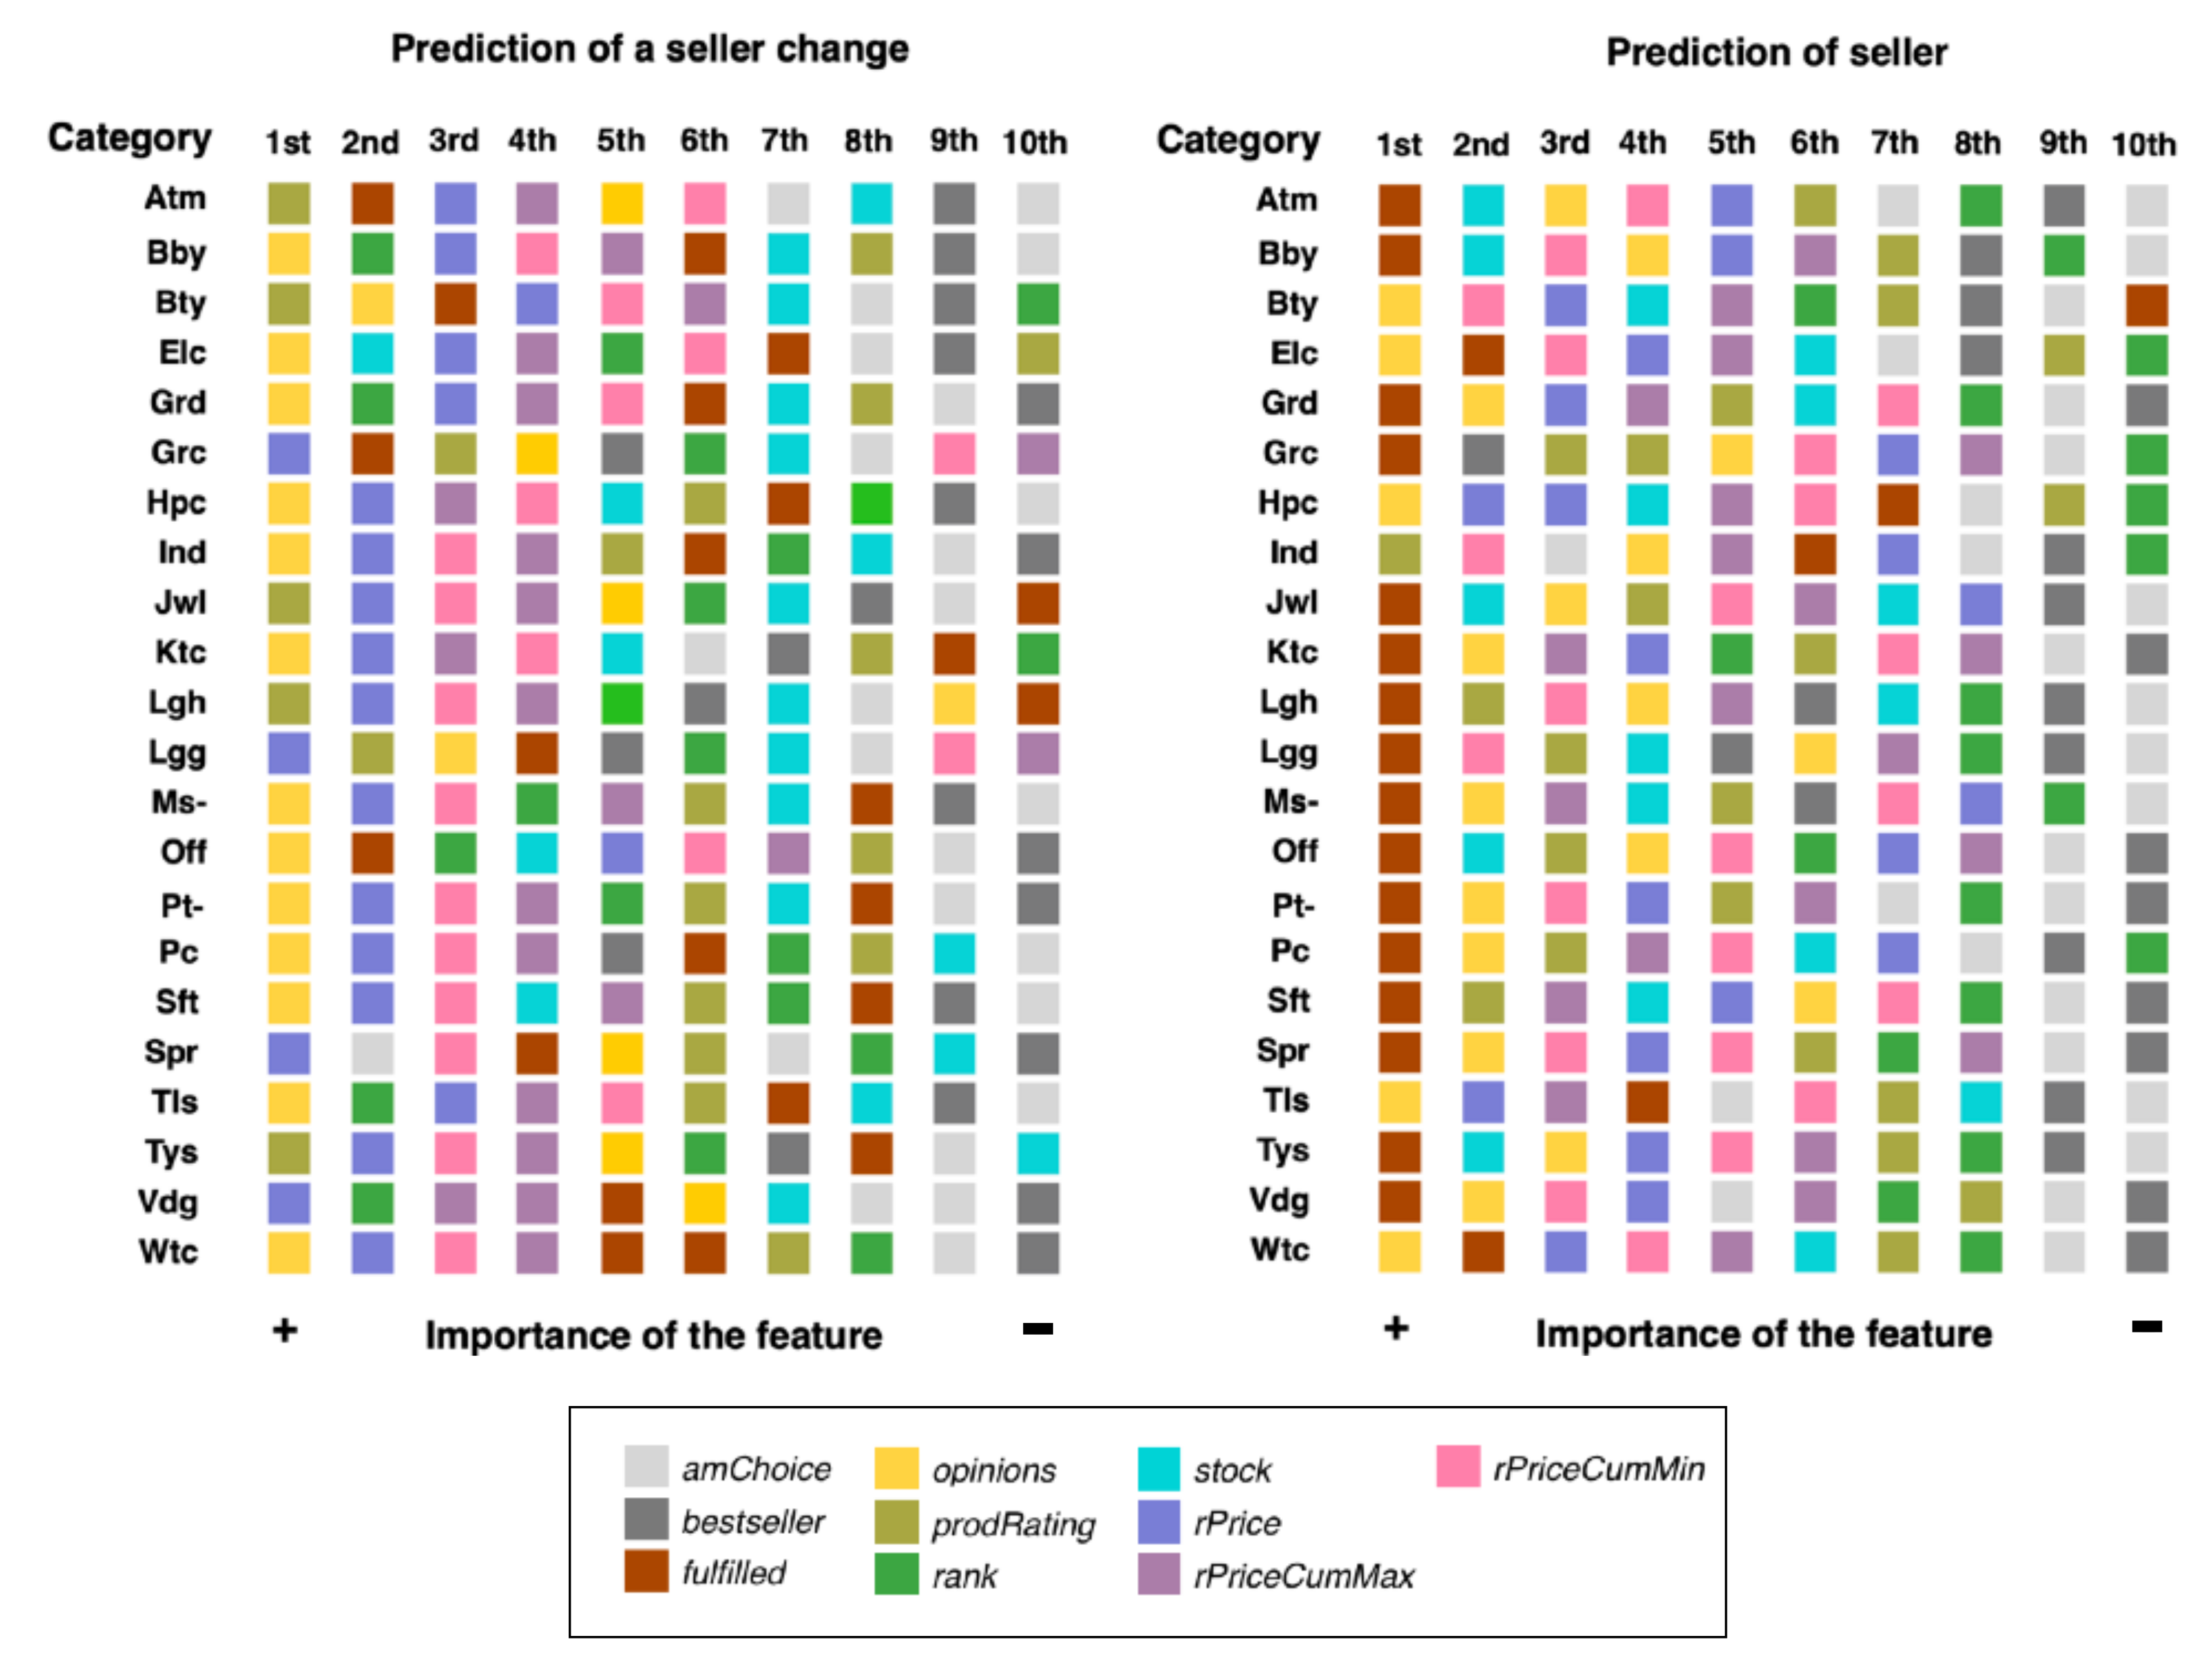
The importance in both predictive experiments that used the C5.0 decision trees is shown in Figure 4. A summary of the most and least relevant features based on occurrences is shown in Table 6, considering the 1st–2nd and 9th–10th positions in these rankings, respectively. The remaining positions (3rd to 8th) were considered intermediate and their analysis remains open for further investigation.
prodRatings and opinions features were found to be the most important features in both experiments (Table 6) although they had different representations across categories. In particular, the user experience (opinions) represented the most relevant feature in the Elc, Hpc, Tls, and Wtc categories. The product fulfilment by Amazon (fulfilled) feature appeared to be decisive only for the prediction of seller experiment, as the variation of prices (rPrice) is relevant to the prediction of a change in seller. This latter predictor was estimated to be the most relevant in four categories and in 11 categories it was the second-most important feature.
Another aspect of interest is the least important features. The importance of features indicates that sellers of those products are Amazon’s choices (amChoice) or best-sellers (best-seller) but are not specifically being considered for selection into the Buy Box. Given that the fulfilled feature was included in the group of important and dispensable features for both experiments, the decisive role of this feature is likely to be category-dependent. This was also observed for prodRating, although only for the prediction of seller experiment.
The experimental design used in the Buy Box study conducted by Chen et al. [39] to detect algorithmic pricing in Amazon Marketplace also included the prediction of the seller occupying the Buy Box, which coincides with the second experiment presented in this study (specific experiment). For that purpose, those authors used the random forest algorithm and a set of features related to prices, average rating, positive feedback and feedback count, whether or not sellers used FBA, and whether or not the seller was Amazon. They observed that Amazon used non-trivial strategies to evaluate sellers (i.e., additional features beyond price to select the seller to occupy the Buy Box). They detected that the seller’s positive feedback and feedback count (prodRatings and opinions in our study, respectively), were also important features related to “winning” or occupying the Buy Box, which coincided with the results obtained here (Table 6). Interestingly, these authors considered the fulfilled feature (FBA program) to have low relevance, which also coincided with our results.
3.2. Rule-Based Classification
The main characteristics of the rule-based classification analysis are shown in Table 7. A detailed list of the most relevant rules for both experiments can be found in the Supplementary Material. The average number of conditions present in the rules was greater for the seller prediction experiment (4.1 conditions/rule) than for the seller change prediction experiment (3.3 conditions/rule), and the average accuracy of rules was similar in both experiments (0.81 and 0.85, respectively). These latter results were in line with the average accuracy level obtained for the C.50 algorithm when evaluated using the train–test split (Table 4 and Table 5). Remarkably, the lift estimate yielded results for rules that were one order of magnitude higher for the seller prediction experiment, suggesting a higher efficiency of rules for predicting sellers than for predicting their change.
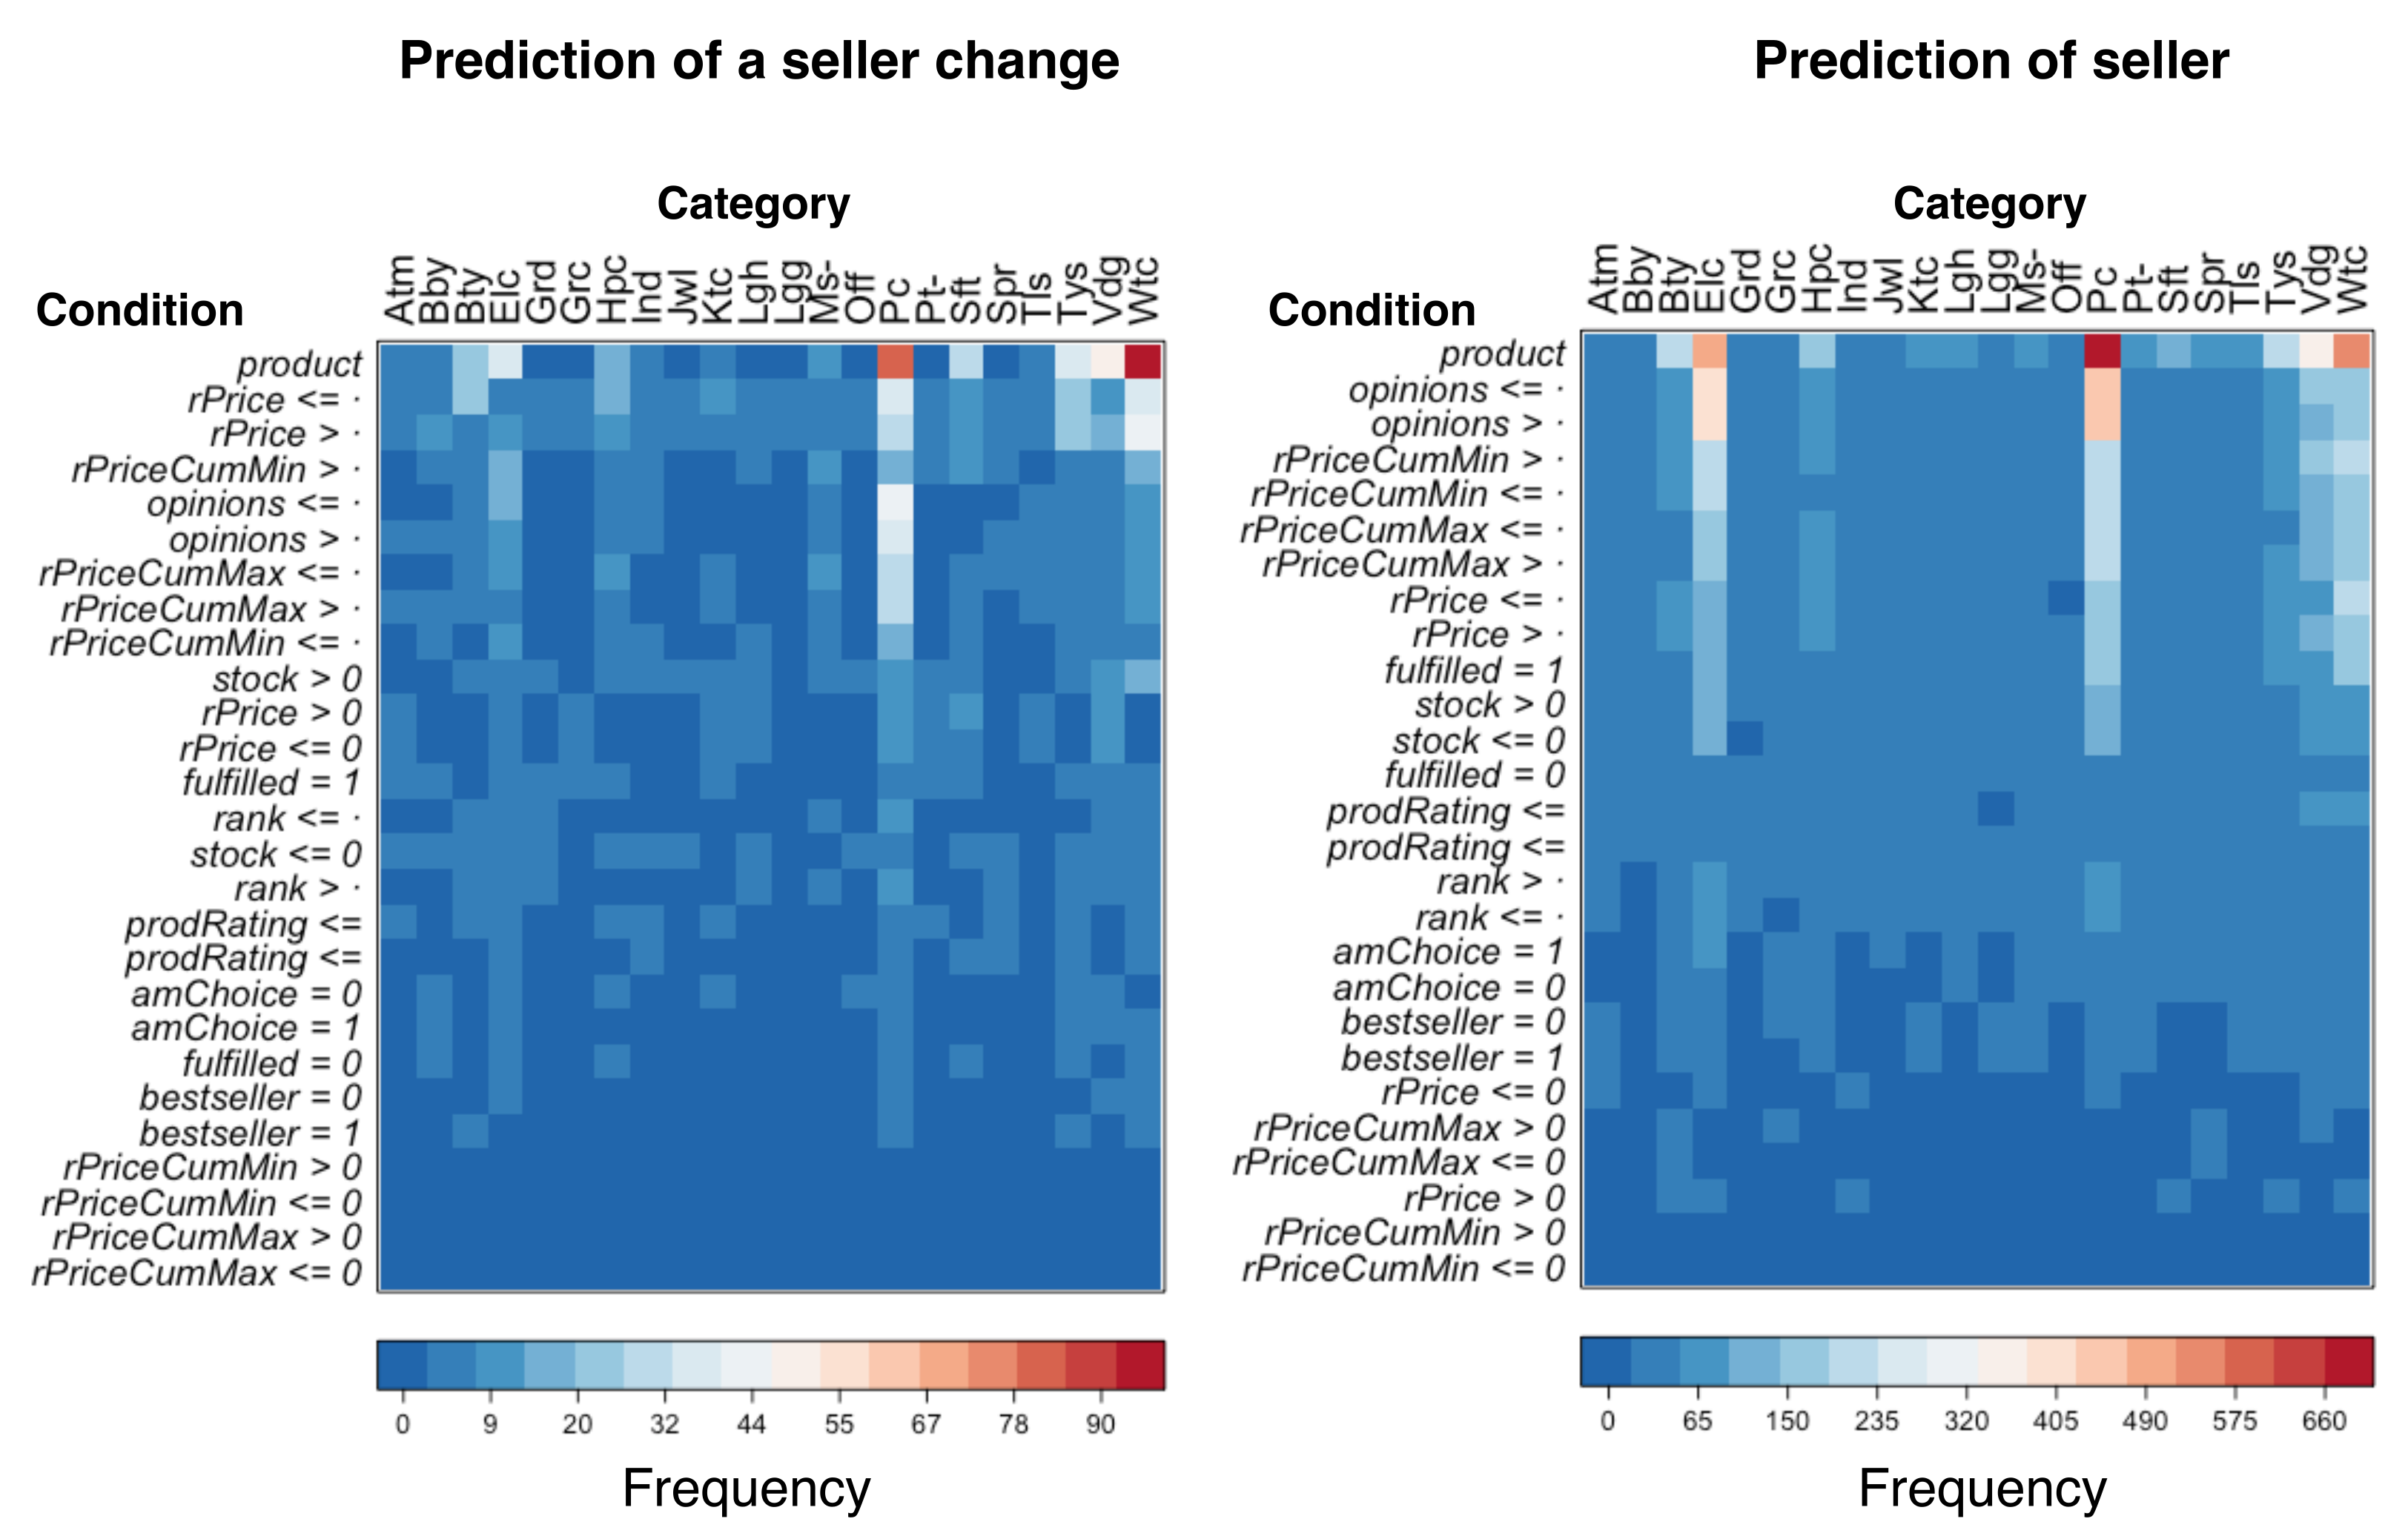
Complementing the previous analysis, Figure 5 shows an analysis of the frequency of appearance of conditions in rules as a heat map, and Table 8 shows the absolute and relative frequencies represented by a percentage of features. In this study, we interpreted such frequencies as playing the role of weights (in %) to combine sellers’ features by Amazon to select sellers to occupy the Buy Box. In Figure 5, conditions involving the product were the most frequent in both experiments, since Amazon’s algorithm is primarily oriented toward fulfilling product demand by customers among the huge catalog of available products. Additionally, the specificity of rules for products could be based on its differentiation, as reflected in categories like Pc, Elc, and Vdg, and on the opposite side, to those products with little differentiation and low values in the Spr, Grc, and Lgh categories. This can also be seen for the experiment on the prediction of sellers’ lift rankings (Table 7). As shown, the number and types of conditions seem to be highly category-dependent.
However, a more interesting outcome can be found in Table 8. Different features are used by Amazon’s algorithm to select sellers to occupy the Buy Box, although their use (%) was found to be quantitatively different depending on the experiment (prediction of a seller change—unspecific experiment and prediction of seller—specific experiment). Apart from product, which was not found to add any qualitative distinction to the analyses beyond its availability from a given seller, in both experiments, opinions and attributes related to the price dynamic (rPrice, rPriceCumMax and rPriceCumMin) were identified as more frequently applied by the Amazon algorithm. This could be indicative of their being primary attributes considered by Amazon to select a seller to occupy the Buy Box.
As discussed previously in this section, the different use (%) of features between experiments could suggest a sort of weighted relationship among them, as well as showing that such relationships from one or both experiments could be selected by Amazon according to the information held by this platform regarding the seller. This interpretation coincides with that given by Chen et al. (2016) [39]. However, those authors associated the importance of features obtained from the random forest classifier with the features’ weights. Weights for features associated with prices were the highest, followed by positive feedback and whether Amazon was the seller. In our work, these weights coincided for the same features, since opinions and rPrice obtained the highest weights among the studied features (in bold, Table 8).
For recent sellers, with low selling activity or few available products, the relationship of attributes in the unspecific experiment is considered, and rPrice was shown to have the highest weight. On the contrary, when Amazon has enough information about the sellers, this attribute is replaced by opinions. This hypothesis could also be extended to the classification problem in Section 3.1. However, it should be noted that the percentage values shown in Table 8 refer to all categories of products, and these results could present variations according to the types of products analyzed. Attributes such as best-seller, amChoice, rank or prodRating seem to be irrelevant in selecting a seller to occupy the Buy Box. The relevance of these attributes is in accordance with the predictor importance results shown in Figure 4 (Section 3.1) for the unspecific experiment (opinions and rPrice predictors) and, to some less extent, to those obtained in the specific experiment (opinions predictor).
4. Conclusions
This study aimed to analyze empirically the most important features in determining how Amazon chooses sellers to occupy the Buy Box. To that end, Italy’s Amazon web page was analyzed over a period of 10 months, and best-seller products from most of the categories of products were analyzed. From each category, sellers’ characteristics were analyzed by studying the behavior of products featured in the Buy Box. Such behavior was analyzed according to the price dynamic of the products, their availability and ranking, customer experience, and whether the product was fulfilled by Amazon.
This study considered two different but complementary experiments. The first, which had an unspecific nature, was designed to predict seller change in the Buy Box. The second, a more specific experiment, focused on predicted which seller would occupy the Buy Box. Both experiments were analyzed using supervised and rule-based classification.
The classification results for the first (unspecific) experiment showed that customer experience (opinions and prodRating features) and product price dynamics (rprice) were the most important features in determining whether a seller would be selected to occupy the Buy Box. With regard to the second (specific) experiment, Amazon’s fulfillment of products (fulfilled) was identified as the most important feature along with customer experience. However, the analysis also revealed that the results were category-dependent.
The rule-based classification indicated that opinions on products (opinions) received by customers and attributes related to the price dynamic (rPrice, rPriceCumMax and rPriceCumMin) were the most relevant to Amazon’s algorithm for selecting sellers to occupy the Buy Box. This was found in both experiments (unspecific and specific). These results were mostly coincident with the classification results. It is hypothesized that there was a composition or relationship among such features that was used to decide which seller should occupy the Buy Box, given their different frequencies of use in the experiments. A composition could be selected by Amazon according to the sellers’ available history. In the case of new or low-activity sellers, rPrice could be the leading feature, while opinions could be used for active sellers with a record of activity on Amazon Marketplace. Results obtained through this empirical study revealed a dependency within categories of analyzed products.
The main limitation of this study was that it analyzed only one Amazon Marketplace (Italy), which means that the conclusions could not be extended over other European Amazon Marketplaces. Additionally, lacking product price information from the replaced sellers at the Buy Box represented a considerable setback to better understanding Amazon’s algorithm for selecting the seller. Editor:
Future work will include broadening the analysis presented in this study to Amazon’s other marketplaces in Europe as well as analyzing sellers’ strategies to sell the same specific best-selling products on such Amazon platforms. Additionally, the extension of this analysis to the mobile shopping market (m-commerce) is of interest.
5. Disclaimer
The views expressed are purely those of the authors and may not be regarded, in any circumstances, as stating the official position of the European Commission.
Supplementary Materials
The following supporting information can be downloaded at: https://www.mdpi.com/article/10.3390/info13020044/s1.
Author Contributions
Conceptualization, Á.G.-L., G.A.-C. and N.D.-B.; methodology, Á.G.-L. and G.A.-C.; software, Á.G.-L.; validation, Á.G.-L., G.A.-C.; formal analysis, N.D.-B.; investigation, N.D.-B.; data curation, Á.G.-L.; writing—original draft preparation, Á.G.-L.; writing—review and editing, Á.G.-L., G.A.-C. and N.D.-B.; visualization, Á.G.-L.; supervision, G.A.-C. and N.D.-B. All authors have read and agreed to the published version of the manuscript.
Funding
This research received no external funding.
Institutional Review Board Statement
Not applicable.
Informed Consent Statement
Not applicable.
Data Availability Statement
Not applicable.
Conflicts of Interest
The authors declare no conflict of interest.
References
- Hannák, A.; Sapiezynski, P.; Molavi-Kakhki, A.; Krishnamurthy, B.; Lazer, D.; Mislove, A.; Wilson, C. Measuring personalization of web search. In Proceedings of the WWW ’13: 22nd International Conference on World Wide Web, Rio de Janeiro, Brazil, 13–17 May 2013; pp. 527–538. [Google Scholar]
- Hannák, A.; Wagner, C.; Garcia, D.; Mislove, A.; Strohmaier, M.; Wilson, C. Bias in online freelance marketplaces: Evidence from TaskRabbit and Fiverr. In Proceedings of the CSCW ’17: 2017 ACM Conference on Computer Supported Cooperative Work and Social Computing, Portland, OR, USA, 25 February–1 March 2017; pp. 1914–1933. [Google Scholar]
- Chen, L.; Ma, R.; Hannák, A.; Wilson, C. Investigating the impact of gender on rank in resume search engines. In Proceedings of the CHI ’18: 2018 CHI Conference on Human Factors in Computing Systems, Montreal, QC, Canada, 21–26 April 2018. Paper No. 651. [Google Scholar]
- Duch-Brown, N. The Competitive Landscape of Online Platforms; JRC Digital Economy Working Paper 2017-04 (JRC106299); Publications Office of the European Union: Luxembourg, 2017. [Google Scholar]
- Inci, D. Competing with Amazon: How Amazon’s Top e-Commerce Competitors Survive and Thrive. Available online: https://www.bigcommerce.com/blog/Amazon-competitors/ (accessed on 4 December 2021).
- Statista. E-Commerce Market Share of Leading e-Retailers Worldwide in 2020, Based on GMV. Available online: https://www.statista.com/statistics/664814/global-e-commerce-market-share/ (accessed on 4 December 2021).
- Lin, Y.-C.; Das, P.; Trotman, A.; Kallumadi, S. A dataset and baselines for e-commerce product categorization. In Proceedings of the ICTIR’19: 2019 ACM SIGIR International Conference on the Theory of Information Retrieval, Santa Clara, CA, USA, 2–9 October 2019. [Google Scholar]
- Ding, Y.; Fensel, D.; Klein, M.; Omelayenko, B.; Schulten, E. The role of ontologies in e-commerce. Handbook on Ontologies. In International Handbooks on Information Systems; Springer: Berlin, Germany, 2004; pp. 593–615. [Google Scholar]
- Alaa, R.; Gawish, M.; Fernández-Veiga, M. Improving recommendations for online retail markets based on ontology evolution. Electronics 2021, 10, 1650. [Google Scholar] [CrossRef]
- Amazon Buy Box, Feedvisor. Available online: https://feedvisor.com/university/Amazon-buy-box (accessed on 4 December 2021).
- Adamopoulou, E.; Moussiades, L. Chatbots: History, technology, and applications. Mach. Learn. Appl. 2020, 2, 100006. [Google Scholar] [CrossRef]
- Ahmed, A.; Saleem, K.; Khalid, O.; Rashid, U. On deep neural network for trust aware cross domain recommendations in E-commerce. Expert Syst. Appl. 2021, 174, 114757. [Google Scholar] [CrossRef]
- Poirson, E.; Da Cunha, C. A recommender approach based on customer emotions. Expert Syst. Appl. 2019, 122, 281–288. [Google Scholar]
- Portugal, I.; Alencar, P.; Cowan, D. The use of machine learning algorithms in recommender systems: A systematic review. Expert Syst. Appl. 2018, 97, 205–227. [Google Scholar] [CrossRef] [Green Version]
- Boysen, N.; de Koster, R.; Weidinger, F. Warehousing in the e-commerce era: A survey. Eur. J. Oper. Res. 2019, 277, 396–411. [Google Scholar] [CrossRef]
- Zhang, D.; Pee, L.G.; Cui, L. Artificial intelligence in E-commerce fulfilment: A case study of resource orchestration at Alibaba’s Smart Warehouse. Int. J. Inf. Manag. 2021, 57, 102304. [Google Scholar] [CrossRef]
- Gupta, R.; Pathak, C. A Machine learning framework for predicting purchase by online customers based on dynamic pricing. Procedia Comput. Sci. 2014, 36, 599–605. [Google Scholar] [CrossRef] [Green Version]
- Bauer, J.; Jannach, D. Optimal pricing in e-commerce based on sparse and noisy data. Decis. Support Syst. 2018, 106, 53–63. [Google Scholar] [CrossRef]
- Gonçalves de Souza, E.A.; Nagano, M.S.; Alencar Rolim, G. Dynamic Programming algorithms and their applications in machine scheduling: A review. Expert Syst. Appl. 2022, 190, 116180. [Google Scholar] [CrossRef]
- Hannák, A.; Soeller, G.; Lazer, D.; Mislove, A.; Wilson, C. Measuring price discrimination and steering on e-commerce web sites. In Proceedings of the MC ’14: 2014 Conference on Internet Measurement Conference, Vancouver, BC, Canada, 5–7 November 2014; pp. 305–318. [Google Scholar]
- Chen, L.; Mislove, A.; Wilson, C. Peeking beneath the hood of Uber. In Proceedings of the IMC ’15: 2015 Internet Measurement, Tokyo, Japan, 28–30 October 2015; pp. 495–508. [Google Scholar]
- Kolotylo-Kulkarni, M.; Xia, W.; Dhillon, G. Information disclosure in e-commerce: A systematic review and agenda for future research. J. Bus. Res. 2021, 126, 221–238. [Google Scholar] [CrossRef]
- Abdallah, A.; Maarof, M.A.; Zainal, A. Fraud detection system: A survey. J. Netw. Comput. Appl. 2016, 68, 90–113. [Google Scholar] [CrossRef]
- Tax, N.; Jan de Vries, K.; de Jong, M.; Dosoula, N.; van den Akker, B.; Smith, J.; Thuong, O.; Bernardi, L. Machine learning for fraud detection in e-Commerce: A research agenda. In Deployable Machine Learning for Security Defense. MLHat 2021. Communications in Computer and Information Science; Wang, G., Ciptadi, A., Ahmadzadeh, A., Eds.; Springer: Cham, Switzerland, 2021; Volume 1482. [Google Scholar]
- Pallathadka, M.; Ramirez-Asis, E.-H.; Loli-Poma, T.-P.; Kaliyaperumal, K.; Magno Ventayen, R.J.; Naved, M. Applications of artificial intelligence in business management, e-commerce and finance. Mater. Today Proc. 2021, in press. [Google Scholar] [CrossRef]
- Liu, C.-J.; Huang, T.-S.; Ho, P.-T.; Huang, J.-C.; Hsieh, C.-T. Machine learning-based e-commerce platform repurchase customer prediction model. PLoS ONE 2020, 15, e0243105. [Google Scholar] [CrossRef]
- Wang, P.; Xu, Z. A novel consumer purchase behavior recognition method using ensemble learning algorithm. Math. Probl. Eng. 2020, 2020, 6673535. [Google Scholar] [CrossRef]
- Boute, R.N.; Gijsbrechts, J.; van Jaarsveld, W.; Vanvuchelen, N. Deep reinforcement learning for inventory control: A roadmap. Eur. J. Oper. Res. 2021, 298, 401–412. [Google Scholar] [CrossRef]
- Goltsos, T.E.; Syntetos, A.A.; Glock, C.H.; Ioannou, G. Inventory–forecasting: Mind the gap. Eur. J. Oper. Res. 2021, in press. [Google Scholar] [CrossRef]
- Shen, D.; Ruvini, J.D.; Mukherjee, R.; Sundaresan, N. A study of smoothing algorithms for item categorization on e-commerce sites. Neurocomputing 2012, 92, 54–60. [Google Scholar] [CrossRef]
- Liesiö, J.; Salo, A.; Keisler, J.M.; Morton, A. Portfolio decision analysis: Recent developments and future prospects. Eur. J. Oper. Res. 2021, 293, 811–825. [Google Scholar] [CrossRef]
- Policarpo, L.M.; da Silveira, D.E.; da Rosa Righi, R.; Antunes Stoffel, R.; André da Costa, C.; Victória Barbosa, J.L.; Scorsatto, R.; Arcot, T. Machine learning through the lens of e-commerce initiatives: An up-to-date systematic literature review. J. Comput. Sci. Rev. 2021, 41, 100414. [Google Scholar] [CrossRef]
- Song, X.; Yang, S.; Huang, Z.; Huang, T. The Application of artificial intelligence in electronic commerce. J. Phys. Conf. Ser. 2019, 1302, 032030. [Google Scholar] [CrossRef]
- Sarker, I.H. Machine learning: Algorithms, real-world applications and research directions. SN Comput. Sci. 2021, 2, 160. [Google Scholar] [CrossRef] [PubMed]
- Mice, A.; Geru, M.; Capatina, A.; Avram, C.; Rusu, R.; Panait, A.A. Leveraging e-Commerce performance through machine learning algorithms. Ann. Dunarea Jos Univ. Galati 2019, 2, 162–171. [Google Scholar]
- Änäkkälä, T. Exploring Value in e-Commerce. Artificial Intelligence and Recommendation Systems; University of Jyväskylä: Jyväskylä, Finland, 2021. [Google Scholar]
- Bertolini, M.; Mezzogori, D.; Neroni, M.; Zammori, F. Machine Learning for industrial applications: A comprehensive literature review. Expert Syst. Appl. 2021, 175, 114820. [Google Scholar] [CrossRef]
- Moorthi, K.; Dhiman, G.; Arulprakash, P.; Suresh, C.; Srihari, K. A survey on impact of data analytics techniques in e-commerce. Mater. Today Proc. 2021, in press. [Google Scholar] [CrossRef]
- Chen, L.; Mislove, A.; Wilson, C. An empirical analysis of algorithmic pricing on Amazon Marketplace. In Proceedings of the WWW ’16: 25th International Conference on World Wide Web, Montréal, QC, Canada, 11–15 April 2016; pp. 1339–1349. [Google Scholar]
- Kunh, M.; Wing, J.; Weston, S.; Williams, A.; Keefer, C.; Engelhardt, A.; Cooper, T.; Mayer, Z.; Kenkel, B.; Benesty, M.; et al. Caret: Classification and Regression Training. R Package Version 6.0-84. 2019. Available online: https://CRAN.R-project.org/package=caret (accessed on 12 October 2021).
- Muhammad, A. Decision tree algorithms C4.5 and C5.0 in data mining: A review. Int. J. Database Theory Appl. 2018, 11, 1–8. [Google Scholar]
- Breiman, L. Random forest. Mach. Learn. 2001, 45, 5–32. [Google Scholar] [CrossRef] [Green Version]
- Quinlan, J.R. C4.5: Programs for Machine Learning; Morgan Kaufmann Publishers: Burlington, VT, USA, 1993. [Google Scholar]
- Kuhn, M.; Johnson, K. Applied Predictive Modelling; Springer: New York, NY, USA, 2013. [Google Scholar]
- Kim, K.-K.K.; Patrón, E.R.; Braatz, R.D. Standard representation and unified stability analysis for dynamic artificial neural network models. Neural Netw. 2018, 98, 251–262. [Google Scholar] [CrossRef] [PubMed]
- Li, F.F.; Karpathy, A.; Johnson, J. CS231n: Convolutional Neural Networks for Visual Recognition; Standford University: Standford, CA, USA, 2021. [Google Scholar]
- Gove, R.; Faytong, J. Machine learning and event-based software testing: Classifiers for identifying infeasible GUI event sequences. Adv. Comput. 2012, 86, 109–135. [Google Scholar]
- Nisbet, R.; Miner, G.; Yale, K. Chapter 8-Advanced algorithms for data mining. In Handbook of Statistical Analysis and Data Mining Applications; Nisbet, R., Elder, J., Miner, G., Eds.; Academic Press: Boston, MA, USA, 2009; pp. 151–172. [Google Scholar]
- Dietterich, T.G. Approximate statistical tests for comparing supervised classification learning algorithms. Neural Comput. 1998, 7, 1895–1923. [Google Scholar] [CrossRef] [Green Version]
- Cohen, J. A coefficient of agreement for nominal scales. Educ. Psychol. Meas. 1960, 20, 37–46. [Google Scholar] [CrossRef]
- Kuhn, M.; Weston, S.; Culp, M.; Coulter, N.; Quinlan, R. RuleQuest Research; C5.0 Decision Trees and Rule-Based Models. R Package Version 0.1.5; Rulequest Research Pty Ltd.: Sydney, Australia, 2019; Available online: https://topepo.github.io/C5.0/ (accessed on 4 October 2021).
Figure 1.
Product page for a given product: (A) The main characteristics of the product are shown, including customer experience, price, and the number of opinions received. (B) The seller selected by Amazon appears featured in the Buy Box in blue capital letters (arrow).
Figure 1.
Product page for a given product: (A) The main characteristics of the product are shown, including customer experience, price, and the number of opinions received. (B) The seller selected by Amazon appears featured in the Buy Box in blue capital letters (arrow).

Figure 2.
Two different sets of labels for the same dataset used in the classification experiments. (Left). Predicting the change of the seller: the positive class (+) represents a change in seller. (Right). Predicting the seller: in each instance, the label indicates the seller featured in the Buy Box. n: number of products in the category of the product’s dataset; A to E: hypothetical sellers.

Figure 3.
Experimental design used in this study. CV: cross-validation, nnet: neural networks, rf: random forests, svm: support vector machines, C5.0: C5.0 decision trees, Bal. Acc: Balanced accuracy, K: Kappa statistic, F1: F1-score.
Figure 3.
Experimental design used in this study. CV: cross-validation, nnet: neural networks, rf: random forests, svm: support vector machines, C5.0: C5.0 decision trees, Bal. Acc: Balanced accuracy, K: Kappa statistic, F1: F1-score.

Figure 4.
Importance of features (highest 1st, to lowest 10th) in the experimental designs from the C5.0 decision trees.
Figure 4.
Importance of features (highest 1st, to lowest 10th) in the experimental designs from the C5.0 decision trees.

Figure 5.
Frequency of appearance of conditions for rules in both experiments and by product categories. Dots indicate conditions with positive or negative values, except for conditions involving opinions and rank, which were always positive.
Figure 5.
Frequency of appearance of conditions for rules in both experiments and by product categories. Dots indicate conditions with positive or negative values, except for conditions involving opinions and rank, which were always positive.


Table 1.
Analyzed features from a product page, possible values, and their roles in predictive experiments. min, max: minimum and maximum values of the feature, respectively.
Table 1.
Analyzed features from a product page, possible values, and their roles in predictive experiments. min, max: minimum and maximum values of the feature, respectively.
| Feature | Definition | Values (min, max) | Role |
|---|---|---|---|
| seller | Retailer featured in the Buy Box | Seller Id-Experiment 1 | Response |
| (0—no, 1—yes)-Experiment 2 | |||
| amChoice | Product featured by Amazon as recommendable | (0—no, 1—yes) | Predictor |
| best-seller | Product with highest position in sales | (0—no, 1—yes) | Predictor |
| fulfilled | Product is fulfilled by Amazon | (0—no, 1—yes) | Predictor |
| opinions | Number of opinions received from customers | (1, 7003) | Predictor |
| product | Product featured in the Buy Box | Product Id | Predictor |
| prodRating | Customer satisfaction after purchasing the product | (0, 5) | Predictor |
| rank | Position of the product in the best-seller page | (1, 100) | Predictor |
| stock | Availability of the product | (0—no, 1—yes) | Predictor |
| rPrice | Variation rate of the price at time t with respect to time t − 1 | (−95.9, 402) % | Predictor |
| rPriceCumMax | Variation rate of price at time t with respect to | (−96.8, 0) % | Predictor |
| the accumulated maximum price | |||
| rPriceCumMin | Variation rate of price at time t with respect to | (0, 3111.3) % | Predictor |
| the accumulated minimum price |
Table 2.
Characteristics of the datasets built from the selected product categories. The number of instances in each dataset is indicated as well as the relations of sellers to products (Sellers/Products). Abbr.: abbreviation.
Table 2.
Characteristics of the datasets built from the selected product categories. The number of instances in each dataset is indicated as well as the relations of sellers to products (Sellers/Products). Abbr.: abbreviation.
| Category | Abbr. | Instances | Sellers/Products |
|---|---|---|---|
| Automotive | Atm | 3245 | 32/14 |
| Baby | Bby | 1747 | 20/7 |
| Beauty | Bty | 5066 | 101/24 |
| Electronics | Elc | 14,060 | 179/33 |
| Garden | Grd | 1286 | 31/11 |
| Grocery | Grc | 1205 | 14/7 |
| Health & personal care | Hpc | 5229 | 69/20 |
| Industrial | Ind | 1526 | 25/8 |
| Jewellery | Jwl | 1933 | 33/15 |
| Kitchen | Ktc | 2646 | 51/15 |
| Lightning | Lgh | 2355 | 36/19 |
| Luggage | Lgg | 2082 | 42/21 |
| Musical instruments | Ms- | 2857 | 40/22 |
| Office | Off | 1708 | 17/6 |
| Pc | Pc | 22,149 | 153/38 |
| Pet-supplies | Pt- | 5334 | 59/24 |
| Software | Sft | 5548 | 61/41 |
| Sports | Spr | 1392 | 46/11 |
| Tools | Tls | 2461 | 66/17 |
| Toys | Tys | 6308 | 92/41 |
| Video games | Vdg | 11,697 | 93/58 |
| Watches | Wtc | 11,678 | 82/78 |
Table 3.
Confusion matrix for the binary classification (+, −: positive and negative classes, respectively).
Table 3.
Confusion matrix for the binary classification (+, −: positive and negative classes, respectively).
| Actual Class | Predicted Class | |
|---|---|---|
| + | − | |
| + | True Positive (TP) | False Negative (FN) |
| − | False Positive (FP) | True Negative (TN) |
Table 4.
Accuracy results for the seller change prediction experiment using different classifiers (nnet: neural networks; rf: random forests; svm: support vector machines; C5.0: C5.0 decision trees) and quality measures (Bal. Acc.: balanced accuracy; K: Kappa statistic; F1: F1-score). In bold highest values.
| nnet | rf | svm | C5.0 | |||||||||
|---|---|---|---|---|---|---|---|---|---|---|---|---|
| Category | Bal. Acc. | K | F1 | Bal. Acc. | K | F1 | Bal. Acc. | K | F1 | Bal. Acc. | K | F1 |
| Atm | 0.77 | 0.63 | 0.97 | 0.82 | 0.66 | 0.97 | 0.50 | 0.00 | 0.91 | 0.81 | 0.69 | 0.98 |
| Bby | 0.50 | 0.00 | 0.98 | 0.77 | 0.61 | 0.99 | 0.50 | 0.00 | 0.97 | 0.75 | 0.61 | 0.99 |
| Bty | 0.72 | 0.51 | 0.95 | 0.82 | 0.67 | 0.96 | 0.50 | 0.01 | 0.93 | 0.80 | 0.65 | 0.96 |
| Elc | 0.69 | 0.41 | 0.85 | 0.80 | 0.60 | 0.88 | 0.55 | 0.12 | 0.81 | 0.80 | 0.59 | 0.87 |
| Grd | 0.77 | 0.62 | 0.97 | 0.75 | 0.56 | 0.96 | 0.50 | 0.00 | 0.94 | 0.77 | 0.60 | 0.96 |
| Grc | 0.62 | 0.37 | 0.98 | 0.75 | 0.58 | 0.98 | 0.53 | 0.11 | 0.98 | 0.81 | 0.70 | 0.99 |
| Hpc | 0.84 | 0.69 | 0.94 | 0.87 | 0.71 | 0.95 | 0.51 | 0.04 | 0.90 | 0.88 | 0.73 | 0.95 |
| Ind | 0.77 | 0.58 | 0.93 | 0.75 | 0.56 | 0.93 | 0.52 | 0.05 | 0.90 | 0.71 | 0.48 | 0.92 |
| Jwl | 0.50 | 0.00 | 0.96 | 0.62 | 0.31 | 0.96 | 0.55 | 0.15 | 0.96 | 0.64 | 0.36 | 0.97 |
| Ktc | 0.76 | 0.62 | 0.97 | 0.84 | 0.70 | 0.97 | 0.50 | 0.00 | 0.95 | 0.83 | 0.68 | 0.97 |
| Lgh | 0.50 | 0.00 | 0.94 | 0.70 | 0.47 | 0.95 | 0.50 | 0.00 | 0.94 | 0.62 | 0.35 | 0.95 |
| Lgg | 0.72 | 0.55 | 0.97 | 0.72 | 0.56 | 0.98 | 0.50 | 0.00 | 0.96 | 0.71 | 0.55 | 0.98 |
| Ms- | 0.80 | 0.60 | 0.89 | 0.83 | 0.65 | 0.91 | 0.75 | 0.46 | 0.84 | 0.80 | 0.61 | 0.90 |
| Off | 0.62 | 0.34 | 0.98 | 0.79 | 0.72 | 0.99 | 0.50 | 0.46 | 0.84 | 0.76 | 0.68 | 0.99 |
| Pt- | 0.77 | 0.64 | 0.98 | 0.86 | 0.77 | 0.98 | 0.52 | 0.06 | 0.96 | 0.85 | 0.77 | 0.98 |
| Pc | 0.68 | 0.40 | 0.89 | 0.81 | 0.63 | 0.92 | 0.55 | 0.14 | 0.88 | 0.78 | 0.61 | 0.92 |
| Sft | 0.71 | 0.50 | 0.95 | 0.80 | 0.64 | 0.96 | 0.66 | 0.44 | 0.95 | 0.79 | 0.63 | 0.96 |
| Spr | 0.74 | 0.55 | 0.91 | 0.81 | 0.61 | 0.90 | 0.50 | 0.00 | 0.86 | 0.81 | 0.64 | 0.91 |
| Tls | 0.71 | 0.48 | 0.93 | 0.80 | 0.62 | 0.94 | 0.52 | 0.08 | 0.91 | 0.79 | 0.62 | 0.94 |
| Tys | 0.72 | 0.51 | 0.94 | 0.79 | 0.60 | 0.94 | 0.50 | 0.01 | 0.91 | 0.75 | 0.54 | 0.93 |
| Vdg | 0.77 | 0.61 | 0.96 | 0.85 | 0.71 | 0.96 | 0.50 | 0.00 | 0.93 | 0.70 | 0.64 | 0.96 |
| Wtc | 0.70 | 0.47 | 0.91 | 0.81 | 0.64 | 0.93 | 0.53 | 0.10 | 0.88 | 0.60 | 0.52 | 0.92 |
| Average | 0.70 | 0.46 | 0.94 | 0.78 | 0.62 | 0.95 | 0.53 | 0.08 | 0.92 | 0.79 | 0.62 | 0.95 |
Table 5.
Accuracy results for the seller prediction experiment using different classifiers. Abbreviations are as in Table 4. In bold highest values.
Table 5.
Accuracy results for the seller prediction experiment using different classifiers. Abbreviations are as in Table 4. In bold highest values.
| nnet | rf | svm | C5.0 | |||||||||
|---|---|---|---|---|---|---|---|---|---|---|---|---|
| Category | Bal. Acc. | K | F1 | Bal. Acc. | K | F1 | Bal. Acc. | K | F1 | Bal. Acc. | K | F1 |
| Atm | 0.86 | 0.89 | 0.78 | 0.94 | 0.96 | 0.91 | 0.88 | 0.88 | 0.82 | 0.95 | 0.96 | 0.90 |
| Bby | 0.91 | 0.96 | 0.86 | 0.93 | 0.97 | 0.87 | 0.79 | 0.82 | 0.71 | 0.94 | 0.97 | 0.88 |
| Bty | 0.71 | 0.73 | 0.53 | 0.87 | 0.86 | 0.77 | 0.79 | 0.74 | 0.67 | 0.88 | 0.87 | 0.78 |
| Elc | 0.53 | 0.35 | 0.10 | 0.80 | 0.66 | 0.63 | 0.70 | 0.55 | 0.49 | 0.80 | 0.87 | 0.78 |
| Grd | 0.71 | 0.77 | 0.55 | 0.95 | 0.96 | 0.95 | 0.94 | 0.89 | 0.88 | 0.98 | 0.95 | 0.96 |
| Grc | 0.92 | 0.94 | 0.90 | 0.98 | 0.97 | 0.97 | 0.95 | 0.93 | 0.94 | 0.98 | 0.97 | 0.98 |
| Hpc | 0.66 | 0.69 | 0.40 | 0.87 | 0.83 | 0.78 | 0.79 | 0.71 | 0.66 | 0.86 | 0.84 | 0.76 |
| Ind | 0.81 | 0.75 | 0.68 | 0.87 | 0.77 | 0.78 | 0.87 | 0.78 | 0.79 | 0.87 | 0.78 | 0.78 |
| Jwl | 0.83 | 0.91 | 0.75 | 0.92 | 0.95 | 0.86 | 0.80 | 0.92 | 0.72 | 0.91 | 0.94 | 0.85 |
| Ktc | 0.74 | 0.87 | 0.61 | 0.93 | 0.95 | 0.89 | 0.90 | 0.91 | 0.86 | 0.90 | 0.94 | 0.84 |
| Lgh | 0.84 | 0.83 | 0.77 | 0.93 | 0.86 | 0.85 | 0.86 | 0.80 | 0.79 | 0.93 | 0.87 | 0.89 |
| Lgg | 0.88 | 0.96 | 0.85 | 0.96 | 0.98 | 0.94 | 0.95 | 0.98 | 0.93 | 0.95 | 0.98 | 0.92 |
| Ms- | 0.74 | 0.72 | 0.59 | 0.79 | 0.74 | 0.62 | 0.75 | 0.73 | 0.59 | 0.76 | 0.75 | 0.61 |
| Off | 0.73 | 0.50 | 0.60 | 0.89 | 0.74 | 0.84 | 0.79 | 0.49 | 0.72 | 0.87 | 0.82 | 0.83 |
| Pt- | 0.69 | 0.83 | 0.51 | 0.93 | 0.96 | 0.88 | 0.85 | 0.89 | 0.79 | 0.94 | 0.96 | 0.90 |
| Pc | 0.54 | 0.44 | 0.14 | 0.85 | 0.79 | 0.73 | 0.71 | 0.58 | 0.53 | 0.86 | 0.80 | 0.72 |
| Sft | 0.81 | 0.79 | 0.70 | 0.94 | 0.89 | 0.87 | 0.90 | 0.85 | 0.84 | 0.94 | 0.90 | 0.89 |
| Spr | 0.82 | 0.71 | 0.69 | 0.88 | 0.76 | 0.78 | 0.85 | 0.73 | 0.78 | 0.86 | 0.75 | 0.74 |
| Tls | 0.84 | 0.78 | 0.76 | 0.90 | 0.87 | 0.84 | 0.87 | 0.77 | 0.81 | 0.91 | 0.88 | 0.86 |
| Tys | 0.58 | 0.62 | 0.26 | 0.85 | 0.82 | 0.73 | 0.77 | 0.74 | 0.64 | 0.85 | 0.82 | 0.72 |
| Vdg | 0.57 | 0.56 | 0.22 | 0.89 | 0.86 | 0.81 | 0.79 | 0.68 | 0.65 | 0.90 | 0.86 | 0.80 |
| Wtc | 0.58 | 0.51 | 0.22 | 0.84 | 0.81 | 0.71 | 0.77 | 0.61 | 0.63 | 0.84 | 0.80 | 0.69 |
| Average | 0.74 | 0.73 | 0.57 | 0.90 | 0.86 | 0.82 | 0.83 | 0.77 | 0.74 | 0.90 | 0.87 | 0.82 |
Table 6.
Summary of feature importance for both predictive experiments. In brackets, the number of categories in which features were the most or least important in 22 studied categories is present. Bold represents the most and least important features.
Table 6.
Summary of feature importance for both predictive experiments. In brackets, the number of categories in which features were the most or least important in 22 studied categories is present. Bold represents the most and least important features.
| Importance | Order | Prediction of Seller Change | Prediction of Seller | |
|---|---|---|---|---|
| Most relevant features | 1st | 1 | opinions (13) | fulfilled (16) |
| 2 | prodRating (5) | opinions (5) | ||
| 3 | rPrice (4) | prodRating (1) | ||
| 2nd | 1 | rPrice (11) | opinions (7) | |
| 2 | rank (4) | stock (5) | ||
| 3 | fulfilled (3) | rPriceCumMin, fulfilled (3) | ||
| Least relevant features | 9th | 1 | amChoice (8) | amChoice (10) |
| 2 | best-seller (8) | best-seller (8) | ||
| 3 | stock (2) | prodRating, rank (2) | ||
| 10th | 1 | amChoice, best-seller (7) | amChoice, best-seller (8) | |
| 2 | fulfilled, rank, rPriceCumMax (2) | rank (5) | ||
| 3 | fulfilled, stock (1) | fulfilled (1) |
Table 7.
Numbers of rules and conditions for each product category, accuracy, average lift, and ranking according to lift for both experiments. and are the number of rules and conditions, respectively. is the rounded average value of conditions by rule.
Table 7.
Numbers of rules and conditions for each product category, accuracy, average lift, and ranking according to lift for both experiments. and are the number of rules and conditions, respectively. is the rounded average value of conditions by rule.
| Prediction of a Seller Change | Prediction of Seller | |||||||||||
|---|---|---|---|---|---|---|---|---|---|---|---|---|
| Category | Rules | Conditions | Accuracy | Lift | Lift | Rules | Conditions | Accuracy | Lift | Lift | ||
| () | () | Ranking | () | () | Ranking | |||||||
| Atm | 9 | 18 | 2.0 | 0.86 | 7.4 | 6 | 52 | 162 | 3.1 | 0.86 | 163.6 | 10 |
| Bby | 12 | 29 | 2.4 | 0.89 | 14 | 1 | 26 | 83 | 3.2 | 0.84 | 130.9 | 17 |
| Bty | 28 | 75 | 2.7 | 0.85 | 4.2 | 13 | 214 | 846 | 4.0 | 0.79 | 244.2 | 5 |
| Elc | 39 | 155 | 4.0 | 0.80 | 2.4 | 21 | 717 | 3050 | 4.3 | 0.72 | 368.9 | 2 |
| Grd | 7 | 17 | 2.4 | 0.89 | 5.0 | 11 | 39 | 119 | 3.1 | 0.84 | 98.3 | 18 |
| Grc | 7 | 11 | 1.6 | 0.82 | 12.0 | 3 | 20 | 55 | 2.8 | 0.82 | 75.4 | 21 |
| Hpc | 19 | 74 | 3.9 | 0.89 | 2.7 | 19 | 178 | 735 | 4.1 | 0.80 | 196.9 | 7 |
| Ind | 8 | 21 | 2.6 | 0.85 | 2.7 | 20 | 42 | 152 | 3.6 | 0.82 | 94.8 | 19 |
| Jwl | 5 | 9 | 1.8 | 0.88 | 7.5 | 5 | 42 | 126 | 3.0 | 0.80 | 134.3 | 15 |
| Ktc | 14 | 37 | 2.6 | 0.85 | 7.3 | 7 | 78 | 267 | 3.4 | 0.83 | 190.5 | 8 |
| Lgh | 8 | 14 | 1.8 | 0.86 | 5.8 | 8 | 75 | 234 | 3.1 | 0.82 | 92.1 | 20 |
| Lgg | 3 | 4 | 1.3 | 0.86 | 7.9 | 4 | 39 | 94 | 2.4 | 0.85 | 153.1 | 11 |
| Ms- | 15 | 47 | 3.1 | 0.77 | 2.2 | 22 | 61 | 200 | 3.3 | 0.72 | 131.5 | 16 |
| Off | 6 | 11 | 1.8 | 0.83 | 12.4 | 2 | 22 | 73 | 3.3 | 0.81 | 136.5 | 4 |
| Pc | 100 | 398 | 4.0 | 0.84 | 3.2 | 16 | 781 | 3428 | 4.4 | 0.77 | 386.6 | 1 |
| Pt- | 6 | 13 | 2.2 | 0.87 | 5.5 | 9 | 93 | 361 | 3.9 | 0.87 | 216.7 | 6 |
| Sft | 32 | 99 | 3.1 | 0.87 | 5.1 | 10 | 131 | 443 | 3.4 | 0.84 | 185.5 | 9 |
| Spr | 8 | 16 | 2.0 | 0.86 | 2.9 | 18 | 90 | 326 | 3.6 | 0.76 | 68.9 | 22 |
| Tls | 6 | 17 | 2.8 | 0.79 | 3.2 | 17 | 99 | 320 | 3.2 | 0.82 | 138.4 | 13 |
| Tys | 40 | 125 | 3.1 | 0.83 | 4.7 | 12 | 228 | 966 | 4.2 | 0.81 | 309.1 | 4 |
| Vdg | 34 | 138 | 4.1 | 0.88 | 3.9 | 14 | 412 | 1813 | 4.4 | 0.82 | 312.0 | 3 |
| Wtc | 82 | 288 | 3.5 | 0.82 | 3.5 | 15 | 570 | 2515 | 4.4 | 0.79 | 148.7 | 12 |
Table 8.
Absolute frequencies of features for rules and percentages across all product categories. In bold, the highest percentage values other than product feature are shown.
Table 8.
Absolute frequencies of features for rules and percentages across all product categories. In bold, the highest percentage values other than product feature are shown.
| Feature | Prediction of a Seller Change | Prediction of Seller | ||
|---|---|---|---|---|
| Absolute Frequency | % | Absolute Frequency | % | |
| amChoice | 35 | 2.2 | 280 | 1.7 |
| best-seller | 15 | 0.9 | 136 | 0.8 |
| fulfilled | 48 | 3.0 | 1109 | 6.8 |
| opinions | 167 | 10.3 | 3094 | 18.9 |
| product | 398 | 24.6 | 3338 | 20.4 |
| prodRating | 45 | 2.8 | 622 | 3.8 |
| rank | 58 | 3.6 | 541 | 3.3 |
| stock | 86 | 5.3 | 1245 | 7.6 |
| rPrice | 461 | 28.5 | 1847 | 11.3 |
| rPriceCumMax | 147 | 9.1 | 1923 | 11.7 |
| rpriceCumMin | 156 | 9.7 | 2233 | 13.6 |
| Sum | 1616 | 100 | 16,368 | 100 |
Publisher’s Note: MDPI stays neutral with regard to jurisdictional claims in published maps and institutional affiliations. |
© 2022 by the authors. Licensee MDPI, Basel, Switzerland. This article is an open access article distributed under the terms and conditions of the Creative Commons Attribution (CC BY) license (https://creativecommons.org/licenses/by/4.0/).
Share and Cite
MDPI and ACS Style
Gómez-Losada, Á.; Asencio-Cortés, G.; Duch-Brown, N. Automatic Eligibility of Sellers in an Online Marketplace: A Case Study of Amazon Algorithm. Information 2022, 13, 44. https://doi.org/10.3390/info13020044
AMA Style
Gómez-Losada Á, Asencio-Cortés G, Duch-Brown N. Automatic Eligibility of Sellers in an Online Marketplace: A Case Study of Amazon Algorithm. Information. 2022; 13(2):44. https://doi.org/10.3390/info13020044
Chicago/Turabian StyleGómez-Losada, Álvaro, Gualberto Asencio-Cortés, and Néstor Duch-Brown. 2022. "Automatic Eligibility of Sellers in an Online Marketplace: A Case Study of Amazon Algorithm" Information 13, no. 2: 44. https://doi.org/10.3390/info13020044
Note that from the first issue of 2016, this journal uses article numbers instead of page numbers. See further details here.