
Extraction Kinetics of Rare Earth Elements from Ion-Adsorbed Underclays
1
Oak Ridge Institute for Science and Education, 100 ORAU Way, Oak Ridge, TN 37830, USA
2
Department of Chemical and Petroleum Engineering, University of Pittsburgh, 4200 Fifth Ave, Pittsburgh, PA 15260, USA
3
National Energy Technology Laboratory, US Department of Energy, 626 Cochran Mill Rd., Pittsburgh, PA 15236, USA
4
NETL Support Contractor, 626 Cochran Mill Rd., Pittsburgh, PA 15236, USA
5
NETL Support Contractor, 1450 Queen Ave SW, Albany, OR 97321, USA
6
National Energy Technology Laboratory, US Department of Energy, 1450 Queen Ave SW, Albany, OR 97321, USA
*
Author to whom correspondence should be addressed.
Minerals 2023, 13(12), 1503; https://doi.org/10.3390/min13121503
Submission received: 2 October 2023
/
Revised: 13 November 2023
/
Accepted: 28 November 2023
/
Published: 30 November 2023
(This article belongs to the Topic Analysis and Separations of Trace Elements in the Environment)
Abstract
:Citric acid has been identified as an environmentally sustainable organic acid capable of leaching up to ~30% of easily accessible REEs from underclay material. An analysis of the leaching profiles was performed to discern the reaction rates, extraction efficiencies, and potential leaching mechanisms of REEs and cations of interest from ion-adsorbed underclays. The initial leaching stage follows a slow intraparticle diffusion mechanism followed by a second stage controlled by a mixed diffusion regime. The leaching profiles of Ca and P were similar to those of REEs, suggesting that REEs are most likely derived from mineral surfaces such as hydroxyapatite or crandallite rather than predominately from underclays. Fitting to a modified diffusion control model found diffusion-controlled leaching to be the primary mechanism whereas non-diffusive mechanisms made up about 22% of the extracted REEs. Gangue cations associated with underclays had less non-diffusive leaching than REE species, indicating that their leaching kinetics may be dominated by diffusion from within the material or potentially from product layer formation. Fitting to Boyd plots further indicated that REEs were leached following intraparticle diffusion control. These results have important implications for the development of more efficient and sustainable methods for extracting REEs or critical minerals from alternative feedstocks.
1. Introduction
Rare earth elements (REEs, including the 14 naturally occurring lanthanide elements plus yttrium and scandium) are used in a variety of advanced technology applications such as magnets, catalysts, and other electronic devices. REEs are especially useful for the fabrication of renewable energy technologies and are therefore essential for advancement towards carbon neutrality and sustainable energy [1]. However, the U.S. does not produce enough domestic REEs to support renewable energy generation, let alone enough for all other domestic applications [2]. To satisfy demand, the United States imports approximately 80% of its rare earth compounds and metals from China [3], but the growing need for REE resources highlights the need to find and utilize new domestic sources.
The U.S. controls just 1% of primary REE reserves globally. In fact, REEs extracted from REE-bearing clay deposits are estimated to account for ~35% of China’s total REE production despite making up just a small fraction of REE reserves and containing just 0.05–0.2 wt.% rare earth oxides (REOs) [4,5]. This is because the lower amounts of available REEs are offset by their ease of extraction and processing from ion-adsorbed clays (IACs) [6]. IACs are a potential alternative source of REEs and can be found in mineral deposits adjacent to coal seams and within coal utilization byproducts. The negatively charged surfaces of clays attract positively charged REE cations with the ratio of complexation depending on the pH [7]. Due to their weak ionic interactions, these surface-bound REEs are much easier to procure than the REOs embedded within carbonate and phosphate minerals. Other sources of REEs are carbonatite (source of light REEs), bastnasite deposits, and phosphate-bearing minerals like monazite and xenotime that contain the largest amounts of REOs [5].
Extraction of REEs from carbonate and phosphate minerals often requires the use of aggressive, corrosive mineral acids to dissolve the ore, but these methods require waste management and have numerous environmental concerns for usage [6]. On the other hand, the primary method of REE extraction from IACs utilizes electrolyte solutions such as ammonium sulfate to leach ion-exchangeable REEs bound to the clay surface with 80%–90% extraction efficiencies at moderate temperatures [8]. Chemically, the monovalent ammonium cations exchange with REE cations bound to the surface of IACs in order to release them into the leachate solution. However, even this method risks introducing toxic ammonium and sulfate ions into ground waters during in situ leaching processes [9]. A more environmentally friendly process is to use low molecular weight organic acids capable of complexing directly with REE cations while avoiding both ammonium and sulfate. Citric acid has been previously identified as an effective organic acid to suppress REE adsorption to soils by complexing to the REEs in solution [10]. The chelating properties of the citrate are the result of negatively charged oxygen atoms of the carboxylic groups which complex to REE cations. This increases the solubility of the metals, thereby enabling extraction while offering environmental benefits over mineral acids [11,12]. This process works similarly to glycine lixiviants which have been shown to selectively recover copper from copper smelting slag under basic pH conditions [13].
Yang et al. (2020) characterized various Appalachian underclays and found that the REE-bearing phases consisted of apatite, monazite, xenotime, rhabdophane, and churchite embedded within the clay matrix that were clastic or detrital in origin with alteration products such as crandallite limited to a few feedstocks [14]. Benchtop leaching experiments performed by Montross et al. (2020) successfully leached up to ~30% of exchangeable total REEs (TREEs) from unconventional underclay sediments using a 0.1 M citric acid solution [15]. The current study models the kinetics of data acquired from upscaled experiments performed by Yang et al. (2022) for which the operating conditions were obtained in previous benchtop studies to determine the highest REE extraction efficiencies using citrate-based solutions [16]. However, the REE extraction efficiencies of the upscaled experiments were significantly lower than those of the benchtop leaching experiments performed by Montross et al. (2020) and inspired the current study to determine the kinetics and potential leaching mechanisms in the upscaled experiments. The probable cause for this discrepancy in extraction efficiencies is likely due to the different feedstock compositions and experimental parameters that differ between the benchtop and large-scale experiments. One such concern is the impact of capillary forces which are harder to overcome in upscaled experiments due to restrictions in mixing at large scale. Recent studies aimed at overcoming low extraction efficiencies in acid leaching experiments showed that coupling chemical leaching with metallurgical techniques such as disintegration liberates REE-bearing minerals in clay materials and improves their contact with the solution [17]. Factors influencing the extraction efficiencies between benchtop and upscaled experiments may be better revealed with a deeper understanding of the leaching kinetics and mechanisms.
To better understand these lower extraction efficiencies in the upscaled embodiments, the kinetic profiles can provide insight into the rate determining mechanisms that control the REE leaching process. Examination of the rate determining mechanisms throughout the leaching process is useful for optimizing REE leachability. Once the leaching mechanisms of REEs and relevant cations are determined, correlations to specific phases can be postulated and experimental parameters can be adjusted to selectively leach REE-rich phases over those primarily consisting of unwanted gangue elements such as Al, Si, and Fe. Therefore, REE-rich phases can be selectively targeted for extraction if they exhibit leaching behaviors that can be distinguished from other phases primarily containing other critical minerals (CMs) or gangue elements. This study aims to fit REE and other major cation (e.g., Al, Ca, Fe, P, Si, Co, Ni, Cu) concentration data to commonly used kinetic models to determine whether the rate limiting mechanism is a diffusion or chemically controlled process. Depending on the mechanism, the resulting kinetic parameters can be defined to describe the leaching behavior of different phases.
2. Materials and Methods
2.1. Sample Preparation and Analysis
The experimental data used in this study were derived from Yang et al. (2022) [16]. In summary, bulk underclay samples obtained from the Middle Kittanning coal formation (MKT) in West Virginia were crushed and sieved to produce underclay fractions with an average particle size (diameter) of 1.858 mm (r = 0.0929 cm). To simulate batch leaching, 8.0 kg MKT underclay material was placed in a 55 gal mixing barrel equipped with an axial flow impeller to ensure complete vertical mixing. The mixing barrel was filled with 0.1 M citric acid lixiviant containing both citric acid (HOC(COOH)(CH2COOH)2) and sodium citrate dihydrate (HOC(COONa)(CH2COONa)2•2H2O) for a final water-to-rock ratio of 10:1 at pH 2.8 over the course of 18 days at ambient conditions. At the conclusion of the experiment, the solids were rinsed with tap water, collected, and dried. The REE and major cation concentrations in the leachate were collected at several time points and those datasets were used for the modeling described in the next sections; detailed bulk geochemistry is noted in Bauer et al. (2022) and Yang et al. (2022) [16,18].
2.2. Kinetic Modeling Methods
Due to the complexity of the heterogenous underclay material, we took multiple approaches to determine the rate limiting mechanism of the leaching process. The rate controlling mechanism was determined by first fitting extraction data to non-linear kinetic equations for geometric contraction models commonly used to describe the extraction of REEs from mineral sources [19,20,21]. Table 1 describes several models including the shrinking core model (SCM), Jander equation (JE), and Ginstling–Brounshtein model (GBM). In each of the geometric contraction models, X represents the mass fraction of the species leached from the IAC sample as determined by the initial mass of the species within the ore (Mi) and the mass leached at time t (Mt). Mt was determined by measuring the concentration of REEs and other cations extracted into the leachate, multiplying by the liquid volume, and dividing by the original mass of solid loaded into the reactor. Regression analysis and data fitting to the selected models were performed using GraphPad Prism 9 software and the goodness of fit was evaluated using the R-squared values.
The leaching of REEs from IACs occurs via the following general steps for adsorption processes: (1) diffusion of lixiviant molecules through the liquid film layer, (2) diffusion of lixiviant through the particle or product layer, (3) adsorption of the lixiviant to the particle surface, (4) surface reaction between the metal and lixiviant to form product, (5) desorption of the product from the particle surface, (6) diffusion of the product from within the particle or through the product layer, and (7) diffusion of product back through the liquid boundary layer. It is also possible for REEs to directly react with lixiviant at the outer surface of the particle without diffusion through the particle or product layer, thus omitting steps 2 and 6. In the SCM, metals embedded within solid particles react with lixiviant to form a product layer on the particle surface through which diffusion occurs (Figure 1) [22]. In a well-mixed system, the rate limiting mechanism is controlled by film diffusion (steps 1 and 7), product layer diffusion (steps 2 and 6), or the chemical reaction (step 4) [23]. Each type of mechanism corresponds to an equation that produces a straight line when plotted versus time (Table 1). The model that gives the best fit line represents the rate limiting step.
After determining that the leaching mechanism was potentially a diffusion-limited process, the data were then fit to JE and the GBM to validate this claim [24,25]. JE is the simplest one-dimensional diffusion control model for a spherical particle. It is a valid approximation of diffusion behavior at low conversions because it assumes the reacting particles maintain a constant volume and interfacial area so that two- and three-dimensional diffusions are treated as one-dimensional [26]. The GBM, on the other hand, can apply to systems where the solid maintains a relatively constant volume, but where interfacial reaction area changes over time. Like the SCM, the overall volume of the particle remains the same because the resulting product layer replaces the reacted volume. The GBM is similar to the product layer diffusion equation where kt is multiplied by a factor of 3.
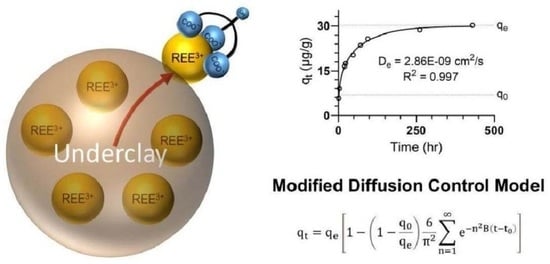
To overcome potential underestimations in mass of the leached species, the rate limiting mechanism was determined by evaluating the leaching process in terms of the heterogeneous sorption between REEs and citrate rather than the mass leached from the underclay. To do this, the leachate data were fitted to a modified diffusion control model (MDCM) based on the intraparticle diffusion model introduced by Crank (1975), which describes the sorption process in terms of Fick’s law for non-stationary spherical particles in a homogeneous solvent (Equation (1)) [27]. The Crank model uses the fraction of species leached into the solution (F), which is determined by measuring the concentration of the species in the leachate at time t (qt) and at equilibrium (qe), to determine the diffusion rate constant (B). Once B is determined, the apparent intraparticle diffusion coefficient (De) is calculated (Equation (2)). For this study, MDCM was applied to estimate qe as well as the amount of REE leaching by non-diffusive behavior (q0) by fitting the measured qt versus time (Equation (3)) [28]. For both models, n represents the number of iterations used to obtain the best fit line. In this case, summation from n = 1 to n = 6 yielded the best fit, with all R-squared values greater than 0.99.
The kinetic models in eqns. 1 and 3 are used to describe diffusion-controlled processes, but they do not distinguish between the types of diffusion which limit the rate of reaction. To determine the type of diffusion control, Boyd plots were used to determine if the rate is limited by intraparticle or film diffusion [29,30]. This was carried out by plotting the Bt term vs. t; where Bt is calculated by one of two equations depending on whether F is >0.85 or ≤0.85 (Equations (4)–(6)) [31,32]. If the results of the Boyd plot pass through the origin, the mechanism is considered to be intraparticle diffusion controlled, otherwise film diffusion is the dominant mechanism. For this study, y-intercept values < |0.1| are considered to pass through the origin.
After the rate limiting mechanism is determined, an empirical kinetic model can be applied to calculate the rate constant and rate of change. The two kinetic equations chosen to fit to the leaching data are the Weber–Morris intraparticle diffusion model (IPD) (Equation (7)) and the general power law equation (Equation (8)), both of which are used to describe sorption kinetics [33,34]. To fit these models, only data for the first 96 hr were used to capture the leaching kinetics prior to reaching an equilibrium state. IPD provides a good representation of Fickian diffusion, but it is based on the geometry of a plate [35]. Therefore, it is likely not an appropriate model considering the spherical geometry of the particles. Instead, the power law can be applied as an empirical model to provide a more accurate fit to the particulate dataset. Similar to IPD, the power law is a hyperbolic function but with a variable exponent that describes the release rate of the species into solution (Equation (8)). When n < 1, the rate of release decreases over time whereas n > 1 signifies an increase in release rate. Additionally, a value of n = 1 means that the rate is constant over the course of the experiment and yields a straight-line slope. The farther n is from 1 signifies a faster decrease (n < 1) or faster increase (n > 1). Small changes in rate occur at values near 1. In both models, k represents the rate constant for each respective model and C is a constant that quantifies the amount of deviation from the model.
3. Results and Discussion
3.1. Extraction Efficiencies
Montross et al. (2020) demonstrated extraction efficiencies of 30% total REE underclay using 0.1 M citric acid–sodium citrate buffer solution amended with 0.5 M NaCl at pH 5.8. In comparison, the leaching of REEs by 0.1 M citric acid–sodium citrate in scaled-up experiments only reached a TREE extraction efficiency of 11% over 18 days as reported in Table 2. There are several factors that may contribute to the lower extraction efficiencies achieved in these samples, including the pH, concentration of exchangeable cations, and the leaching method. Citric acid is a polyprotic organic acid with pKa values of 3.13, 4.76, and 6.40 [36]. At high pH values, citric acid becomes deprotonated and exists mainly as anionic Cit3- [37]. Lower pH values are expected to result in increased extraction efficiencies because the acidic protons exchange with REEs. The fact that this was not the case in the scaled-up experiments suggests that pH was not the dominant factor affecting the leaching process when gangue elements are not quickly dissolved by the acid to release REEs into the solution. Because citric acid chelates with charged species at the surface of IACs, it is possible that these sources make up a smaller fraction of feedstock material, resulting in overall lower amounts of extractable REEs.
The feedstock material has a large impact on the overall leaching efficiency. Multimodal characterization of these underclays determined the presence of REE–phosphates (e.g., monazite and xenotime or their hydrated forms of rhabdophane and churchite), apatitic phases, and degradation products such as crandallite embedded within the underclays [14]. Citric acid is an effective organic ligand in REE complexation of phosphate minerals [38] and increases the solubility of P [39]. Apatite, for example, is dissolved by ionic detachment of calcium and orthophosphate ions from the mineral surface. The high extraction efficiencies of Ca and P suggest a significant amount of the phosphate and apatitic phases are solubilized by the citric acid lixiviant (Table 2). Other elements like Al and Si are abundant within underclays and can be indicative of the dissolution of IACs in a citric acid environment [40]. As shown in Table 2, less than 1% of Al and Si available in the underclay samples is extracted into the leachate over 18 days. If the releases of Al and Si are indicative of the extent of IAC dissolution, low Al and Si extraction efficiencies suggest little breakdown of IAC phases, especially compared to phases primarily containing Ca and P. Therefore, the REEs released from IAC phases are more likely to come from the easily accessible surface-bound REEs rather than REEs embedded within the underclay matrix. The dissolution of P and Ca, on the other hand, suggests REEs may be released from within phosphate and apatitic phases to a greater extent than from within IACs.
The distribution of gangue elements in the leachate solution suggests there is a greater breakdown of phosphate and apatitic phases compared to IACs. This is supported by the distribution of REEs extracted into the leachate which shows greater extraction efficiencies for middle REEs (MREEs) including Sm, Eu, and Gd. The strong MREE enrichment of the leachate solution suggests that calcium- and phosphate-bearing minerals could be a significant source of the REE extracted from these samples. Citric acid has been shown to primarily extract MREEs from apatite phases, further adding evidence for this claim [38]. Meanwhile, Y and the heavy REEs (HREEs) Tb, Dy, Ho, Er, Tm, Yb, and Lu are more likely to be leached from the surfaces of the clay matrix or mineral surfaces [14]. The amounts of HREEs extracted into the leachate are much lower than those of MREEs, suggesting that a smaller portion of the REEs are from IAC sources. Based on the particularly low extraction efficiencies of Al and Si, very little IAC may be dissolved which may limit the amount of REEs that can be released from this material, especially when compared to phosphate-bearing minerals. Several critical minerals (e.g., Co, Ni, and Cu) also show higher extraction efficiencies than most of the other cations present in the leachate. In particular, 28.5% of Co is extracted by the end of the experiment, on par with the efficiencies obtained for Ca, P, and MREEs (Table 2). The extraction efficiencies of these CMs are much higher than that of Fe and Mn but lower than that of Zn, all of which come from the same d-block elements. This suggests that the elemental group may not be the dominant factor contributing to extractability. Instead, the feedstock source may play a larger role in the rate of REE extraction and ultimately the leaching efficiency.
3.2. Leaching Profiles
The dissolution and precipitation of metals in solution typically follows one of several kinetic profiles based on the time-dependent leaching behavior [41,42]. As seen in Figure 2, the TREE leaching profile shows two distinct kinetic regimes—an initial leaching phase followed by a second slower phase until equilibrium is reached. The presence of two stages reveals a shift in leaching rate due to changes in the rate limiting mechanism or exhaustion of the species from a specific source. Given the presence of IAC phases in the MKT underclay samples [14], the initial increase in concentration may be dominated by the leaching of ion-exchangeable REEs from the easily accessible IAC surfaces. Once these sources of REEs are exhausted, the mechanism may transition to a diffusion-controlled process from within less accessible REEs associated with the clay and mineral phases.
Cations such as Ca and P share similar kinetic behavior to REEs, indicating that they follow a similar leaching mechanism or are leached from a similar source material (Figure 3a). As mentioned previously, Ca and P are major cations in phosphate-bearing minerals such as apatite. Their release into solution at such extraction efficiencies suggests a dissolution of the apatite minerals which may cause the exposure and subsequent leaching of the embedded REEs. However, this is not the case for other gangue elements like Al, Si, and Fe whose concentrations continue to rise over the course of the 18-day experiment (Figure 3b). These elements exhibit a different overall leaching mechanism and more closely follow a hyperbolic fashion. The absence of a plateau indicates that the reaction kinetics for these gangue elements have not reached equilibrium by the conclusion of the mixing barrel experiments. This suggests that much slower leaching rates occur in gangue elements when compared to TREEs. The leaching profiles of critical minerals is represented in Figure 3c by the elements Co, Ni, and Cu. Like the TREE profile (Figure 3a), CM concentration in the leachate reaches an equilibrium within the timeframe of the experiments. The steepness in the leaching profiles of CM suggests that the majority of the leachable species are extracted within the 18-day experiment. This is in contrast to the leaching profile of Fe (Figure 3b), despite all being transition metals. The difference in leaching profile between Fe and other CMs may be influenced by the accessibility of the element within the feedstock material.
3.3. Rate Determining Mechanism
Each of the equations summarized in Table 2 is based on the fractional conversion (Χ) of the solid which is the reacted mass divided by the initial mass of the reactant (Χ = Mt/Mi). Χ is typically calculated by weighing the solid before and after the reaction to determine the total mass that is released from the solid particles. The concentration data retrieved from the mixing barrel experiments correspond to the amount of solubilized REEs leached into the solution from the solid particles. Applying the SCM, JE, and GBM to the mixing barrel data, all displayed good fits with JE having the best fit for the first 4 days (stage 1) and SCM film diffusion fitting days 4–18 (stage 2) best (Figure 4). However, many fits were nearly as good, causing ambiguity over which equation represents the rate limiting mechanism. For instance, both film diffusion and product layer diffusion are nearly identical in fit during the second stage of the process, indicating that diffusion may have mixed control mechanisms in this regime.
3.4. Modified Diffusion-Controlled Mechanism
While the geometrical contraction models provide good fits to the MKT data, the masses used to fit these models do not account for the total mass of the particle that is released from the underclay through complexation with the lixiviant. Rather, MDCM (Equation (3)) is a better fit to the leachate data (R2 = 0.997) and fits the entire dataset non-linearly rather than fitting two linear equations to the different kinetic regimes. The good fit of the TREE concentration data to MCDM validates that the main source of REEs from these samples undergoes diffusion control as the rate limiting mechanism (Figure 5). The fit also reveals very slow diffusion with an apparent diffusion coefficient of 2.86 × 10⁻⁹ cm2 s−1, which was calculated from Equation (2). For comparison, the diffusion coefficient of REEs out of mineral phases at 600–800 °C is about 2 × 10⁻⁶ cm2 s−1 [43]. The coefficients for the gangue elements show relative rates of diffusion with underclay-associated cations having the slowest rates of diffusion, such as Al and Si having diffusion coefficients of 4.28 × 10⁻¹⁰ cm2 s−1 and 2.57 × 10⁻¹⁰ cm2 s−1, respectively (Table 3). Meanwhile, cations associated with phosphate-bearing minerals have coefficients an order of magnitude higher than those associated with clays. This suggests that the dissolution of apatite material occurs to a higher degree than in clay minerals at pH 2.8.
In addition to the diffusion coefficients and rate constants, the MDCM is useful for estimating the equilibrium concentration of REEs in the leachate (qe) as well as the concentration of species leached from the underclay by non-diffusion-controlled mechanisms (q0). Table 3 reveals that a measurable portion of REEs is leached into the solution by non-diffusive means. This amount of REEs is represented by q0 as a percentage of qe, which for TREEs is 22.2%. This means that over 20% of the TREEs leached into solution come from non-diffusion-limited mechanisms, such as chemical reaction or surface adsorption controls. The greater presence of HREEs that are leached by non-diffusive mechanisms is expected since HREEs tend to leach from the surfaces of IAC and mineral phases. Interestingly, this was also the percentage of ion-exchangeable REEs measured by leaching with ammonium sulfate by Montross et al. (2020) compared to the total amount of REEs leached by citric acid (10 μg/g ion-exchangeable REEs using (NH4)2SO4 and 45 μg/g total REEs using citrate) [16]. These results validate the MDCM as a method for elucidating the rate controlling mechanisms to measure REE leachate from underclay feedstocks using weak organic acid.
A comparison of major cations shows that Ca, which is typically associated with mineral phases, has 36.0% of its extractable content leached by non-diffusive mechanisms (Table 3). Meanwhile, P only has 4.61% of its leached content attributed to non-diffusive means. This discrepancy could arise because apatite tends to dissolve by the ionic detachment of Ca cations. Meanwhile, low molecular weight organic acids like citrate complex with the P on the material [39]. This could expose more surfaces where Ca is available to be leached, resulting in higher extraction efficiencies than P. Underclay-associated elements Al and Si also show contrasting results to one another (Table 3). Only 3.63% of Al is leached by non-diffusive means which is expected since it is embedded in the underclay matrix. Si, however, leaches 14.5% of its content by the non-diffusive controls. Much of the Al and Si in the mixing barrel samples are expected to come from underclay sources such as illite [14]. The structure of illite consists of two layers of silica tetrahedrons surrounding a single layer of alumina octahedrons [40]. Hence, the Si from the outer layers of silica may be more easily leached without undergoing diffusion through the underclay matrix. Since very small percentages of both Si and Al are leached from within solid particles, this leads to more Si being leached into the solution from the outer surfaces of the IAC.
Ni, Co, and Cu were also leached into the solution by non-diffusive means within the first 2–10 hr of the leaching process (Table 3). The fact that over 40% of these species (over 50% for Co) are leached by non-diffusive means indicates that they are easily leachable from the feedstock material. This could be beneficial for leaching these species in short time frames. However, the overall low extraction efficiencies presented in Table 1 reach a plateau earlier than the other cations measured. This suggests that while much of these CMs are leached from the mineral quickly, a significant portion is extracted by non-diffusive means and small percentage of the overall CM content available in the original sample is leached by diffusion from within the clay particles.
3.5. Determination of the Diffusion-Controlled Mechanism
The MDCM (Equation (3)) describes when a process is diffusion controlled but it does not distinguish the types of diffusion that may be occurring in the system. Therefore, Boyd plots were used to distinguish the extraction process as film or intraparticle diffusion controlled. The results of the Boyd plot show the TREE data pass through the origin (yint = 0.0502), indicating that the leaching mechanism is controlled by intraparticle diffusion (Figure 6a). Most other cations also exhibited intraparticle diffusion as the rate limiting step, including Al, Si, and P. The Boyd plot for Ca, however, did not pass through the origin which suggests that film diffusion is the rate limiting mechanism for Ca (Figure 6b). During the first 96 hr (prior to equilibrium), the resulting line does not pass through the origin (yint = 0.163). This observation signifies that film diffusion plays a large role in the Ca leaching mechanism over the entire course of the experiments rather than intraparticle diffusion. As mentioned previously, Ca ions embedded in the surface of the apatite minerals readily chelate with citric acid and leach into the solution. Therefore, they are likely more accessible for extraction from the surface of the clay particles. Other species share a similar trend with Ca and are dominated by film diffusion. These elements include the cations Mg, Mn, K, Ni, Co, and Cu (Table 4). These elements also show >30% of their content leached by non-diffusive means (Table 3), further indicating that a surface-controlled process such as film diffusion most likely controls the leaching rate of these species.
3.6. Reaction Kinetics
Now that it is established that the rate limiting mechanism of the REE leaching process is intraparticle diffusion controlled, the rate can be described by a kinetic equation corresponding to intraparticle diffusion. Plotting the TREE concentration data to the generic power law model provided a better fit than the IPD model with R-squared values of 0.996 and 0.976, respectively (Figure 7). The n value of the power law is 0.305 which is farther away from the value of 1 than the 0.5 exponent used in IPD. This signifies that the rate of REE extraction decreases faster than what is modeled by the IPD equation. Consistent with this claim, the power law parameters of REE and the major cations tabulated in Table 5 show that the elements with the slowest rate of decrease have the highest values for n (but less than 1). The kinetic rate constant also provides a measure of how fast the process occurs with higher values meaning that the element is leached into solution at a faster rate. However, these values cannot be compared to one another because the units differ depending on the value of n for the element of interest. Underclay-associated elements such as Al and Si have higher values of n and therefore diffuse from the clay or minerals with a slower rate of decrease than REEs. This is consistent with the fact that the leachate concentrations of these elements do not reach equilibrium during the course of the mixing barrel experiments.
4. Conclusions
The Jander equation, shrinking core, and Ginstling–Brounshtein kinetic models were examined to determine the kinetic profiles and type of leaching behavior of REEs and other major cations using experimental data for a Middle Kittanning underclay that was subjected to a citric acid solution. However, none of these models accurately describes the full set of experimental leachate concentration data as it is necessary to break the full reaction time down into two distinct kinetic regimes. A modified diffusion-controlled adsorption kinetics model, which also accounts for a relatively small fraction of species with kinetics governed by non-diffusion-controlled mechanisms, was shown to best fit the full set of experimental leachate concentration data. An initial rapid leaching of surface REEs is followed by a slow intraparticle diffusion mechanism. The leaching profiles of REEs and gangue cations are comparable to Ca and P with similar kinetic profiles and rate parameters. A greater percentage of MREEs were extracted from the solid particles than HREEs or LREEs, further suggesting REEs are primarily leached from the phosphate-bearing phases rather than the underclay material itself. Critical minerals (e.g., Co, Ni, and Cu) follow a similar trend as REEs at a faster initial leaching rate. Other cations associated with the underclay materials such as Al and Si exhibited much slower kinetics and did not reach equilibrium in the experimental time frame. This is likely due to the underclay material being primarily composed of a phyllosilicate matrix which is insoluble and may not undergo the same leaching mechanisms.
The primary leaching mechanism over the 18-day experiment was determined to be diffusion controlled. Using the modified diffusion-control model, the apparent diffusion coefficient was calculated to be 2.86 × 10⁻⁹ cm2 s−1 for TREEs. This was on par with the diffusion parameters of Ca and P but an order of magnitude greater than that of Al and Si. This strongly suggests that REEs are predominately leached from the same phases as Ca and P and most likely come from mineral surfaces (e.g., hydroxyapatite or crandallite) rather than diffusion from the clay matrix. In addition, the diffusion coefficients of CMs are on the same order of magnitude as those of REEs. The MDCM model indicated that up to 22% of the TREEs leached into solution occurred by non-diffusive mechanisms, which represents the amount of REEs leached directly from the particle surfaces in the initial hours of the leaching process. This number is similar to the ion-adsorbed REEs measured by Montross et al. (2020) using ammonium sulfate, signifying this may be the main source of the non-diffusive REEs. It is important to note that it is not clear if these surface-reacted REEs come from ion-adsorbed phases or subsequent mineral dissolution as new surfaces are exposed.
Boyd plots were employed to determine the leaching mechanism of REEs after establishing the kinetic mechanism as diffusion controlled. Those results indicated that the REEs were leached primarily as intraparticle diffusion rather than film control. However, Ca and the CMs Ni, Co, and Cu also appear to follow film diffusion control mechanisms even though the Boyd plots indicate that the kinetic mechanism for recovery of these species is primarily controlled by film diffusion. A proposed mechanism is that Ca, P, and easily accessible REE species are first leached from the particle surface of apatitic phases within the first several hours of the extraction. Once these species are leached, the mechanism for the REEs and P shifts to intraparticle diffusion control for the remainder of the reaction time. This behavior suggests that the majority of REEs which are extracted into the leachate come from within the particle, either from specific REE-bearing minerals or within the underclay matrix.
The gangue cations (Al and Si) have less non-diffusive leaching than REE species. It is likely that these elements are dominated by diffusion with strong ionization energy based on the low extraction efficiencies and slow kinetics. Further investigation is needed to confirm whether the diffusion limits observed are a result of inherent intraparticle diffusion, product layer formation, or both. Based on our models, it is likely a combination of both, but additional imaging techniques are necessary to verify this hypothesis. We recognize there is additional work to be carried out to examine the precipitation of rare earth oxalates similar to the preliminary findings in Yang et al. (2022) as well as their influence on REE trace element extraction [16].
The modeling results from this study coupled with the experimental findings from previous benchtop and upscaled experiments show the importance of experimental design parameters on the leaching kinetics and overall extraction efficiencies of REEs and major cations from underclay materials. Taken as a whole, these findings are necessary for the development of technoeconimic analysis to evaluate the economic performance of citric acid leaching of REEs under various conditions and inform strategies for domestic and international recovery of REEs and CMs to implement sustainable efforts to make use of underutilized coal waste streams and adjacent IAC deposits.
Author Contributions
Conceptualization, W.B., J.Y. and C.V.; methodology, P.P. and W.B.; software, P.P.; validation, P.P, W.B., J.Y. and C.V.; formal analysis, P.P.; investigation, P.P.; data curation, J.Y. and C.V.; writing—original draft preparation, P.P. and C.V.; writing—review and editing, W.B., J.Y. and C.V.; supervision, W.B. and C.V.; project administration, C.V.; funding acquisition, C.V. All authors have read and agreed to the published version of the manuscript.
Funding
This work was performed in support of the U.S. Department of Energy’s (DOE) Fossil Energy and Carbon Management, Rare Earth Elements/Minerals Sustainability Field Work Proposal 1022420.
Data Availability Statement
Data supporting reported results can be found at https://edx.netl.doe.gov/ree-cm/.
Acknowledgments
This work was carried out under the ORISE Post-graduate Research Program at NETL. The authors wish to thank Burt Thomas (Technical Portfolio Lead) for programmatic guidance, direction, and support. Priscilla Prem would also like to thank the Mickey Leland Energy Fellowship Program for initiating her participation in this project.
Conflicts of Interest
The authors declare no conflict of interest.
References
- Haque, N.; Hughes, A.; Lim, S.; Vernon, C. Rare Earth Elements: Overview of Mining, Mineralogy, Uses, Sustainability and Environmental Impact. Resources 2014, 3, 614–635. [Google Scholar] [CrossRef]
- Imholte, D.D.; Nguyen, R.T.; Vedantam, A.; Brown, M.; Iyer, A.; Smith, B.J.; Collins, J.W.; Anderson, C.G.; O’Kelley, B. An assessment of U.S. rare earth availability for supporting U.S. wind energy growth targets. Energy Policy 2018, 113, 294–305. [Google Scholar] [CrossRef]
- U.S. Geological Survery (USGS). Rare Earths Mineral Commodity Summaries. 2021. Available online: https://pubs.usgs.gov/periodicals/mcs2021/mcs2021-rare-earths.pdf (accessed on 4 August 2021).
- Yang, X.J.; Lin, A.; Li, X.-L.; Wu, Y.; Zhou, W.; Chen, Z. China’s ion-adsorption rare earth resources, mining consequences and preservation. Environ. Dev. 2013, 8, 131–136. [Google Scholar] [CrossRef]
- Kanazawa, Y.; Kamitani, M. Rare earth minerals and resources in the world. J. Alloys Compd. 2006, 408–412, 1339–1343. [Google Scholar] [CrossRef]
- Papangelakis, V.G.; Moldoveanu, G. In Recovery of Rare Earth Elements from Clay Minerals, Proceedings of the 1st Rare Earth Resources Conference, Milos, Greece, 4–9 June 2014. pp. 191–202. Available online: https://www.eurare.org/docs/eres2014/fifthSession/VladimirosPapangelakis.pdf (accessed on 4 August 2021).
- Brown, M.A.; Kropf, A.J.; Paulenova, A.; Gelis, A.V. Aqueous complexation of citrate with neodymium(III) and americium(III): A study by potentiometry, absorption spectrophotometry, microcalorimetry, and XAFS. Dalton Trans. 2014, 43, 6446–6454. [Google Scholar] [CrossRef] [PubMed]
- Moldoveanu, G.; Papangelakis, V. Recovery of rare earth elements adsorbed on clay minerals: II. Leaching with ammonium sulfate. Hydrometallurgy 2013, 131–132, 158–166. [Google Scholar] [CrossRef]
- Moldoveanu, G.A.; Papangelakis, V.G. An overview of rare-earth recovery by ion-exchange leaching from ion-adsorption clays of various origins. Mineral. Mag. 2016, 80, 63–76. [Google Scholar] [CrossRef]
- Shan, X.-q.; Lian, J.; Wen, B. Effect of organic acids on adsorption and desorption of rare earth elements. Chemosphere 2002, 47, 701–710. [Google Scholar] [CrossRef]
- Evangelou, M.W.H.; Ebel, M.; Schaeffer, A. Chelate assisted phytoextraction of heavy metals from soil. Effect, mechanism, toxicity, and fate of chelating agents. Chemosphere 2007, 68, 989–1003. [Google Scholar] [CrossRef]
- Wang, L.; Liao, C.; Yang, Y.; Xu, H.; Xiao, Y.; Yan, C. Effects of organic acids on the leaching process of ion-adsorption type rare earth ore. J. Rare Earths 2017, 35, 1233–1238. [Google Scholar] [CrossRef]
- Huang, Y.; Wang, D.; Liu, H.; Fan, G.; Peng, W.; Cao, Y. Selective complexation leaching of copper from copper smelting slag with the alkaline glycine solution: An effective recovery method of copper from secondary resource. Sep. Purif. Technol. 2023, 326, 124619. [Google Scholar] [CrossRef]
- Yang, J.; Montross, S.; Britton, J.; Stuckman, M.; Lopano, C.; Verba, C. Microanalytical Approaches to Characterizing REE in Appalachian Basin Underclays. Minerals 2020, 10, 546. [Google Scholar] [CrossRef]
- Montross, S.N.; Yang, J.; Britton, J.; McKoy, M.; Verba, C. Leaching of Rare Earth Elements from Central Appalachian Coal Seam Underclays. Minerals 2020, 10, 577. [Google Scholar] [CrossRef]
- Yang, J.; Bauer, S.; Verba, C. Strategies to Recover Easily-Extractable Rare Earth Elements and Other Critical Metals from Coal Waste Streams and Adjacent Rock Strata Using Citric Acid; National Energy Technology Laboratory (NETL): Pittsburgh, PA, USA; Morgantown, WV, USA, 2022. [Google Scholar]
- Zhang, W.; Honaker, R. Characterization and recovery of rare earth elements and other critical metals (Co, Cr, Li, Mn, Sr, and V) from the calcination products of a coal refuse sample. Fuel 2020, 267, 117236. [Google Scholar] [CrossRef]
- Bauer, S.; Yang, J.; Stuckman, M.; Verba, C. Rare Earth Element (REE) and Critical Mineral Fractions of Central Appalachian Coal-Related Strata Determined by 7-Step Sequential Extraction. Minerals 2022, 12, 1350. [Google Scholar] [CrossRef]
- Ait Brahim, J.; Ait Hak, S.; Achiou, B.; Boulif, R.; Beniazza, R.; Benhida, R. Kinetics and mechanisms of leaching of rare earth elements from secondary resources. Miner. Eng. 2022, 177, 107351. [Google Scholar] [CrossRef]
- Xiao, Y.; Liu, X.; Feng, Z.; Huang, X.; Huang, L.; Chen, Y.; Wu, W. Role of minerals properties on leaching process of weathered crust elution-deposited rare earth ore. J. Rare Earths 2015, 33, 545–552. [Google Scholar] [CrossRef]
- He, Z.; Zhang, Z.; Yu, J.; Zhou, F.; Xu, Y.; Xu, Z.; Chen, Z.; Chi, R. Kinetics of column leaching of rare earth and aluminum from weathered crust elution-deposited rare earth ore with ammonium salt solutions. Hydrometallurgy 2016, 163, 33–39. [Google Scholar] [CrossRef]
- Safari, V.; Arzpeyma, G.; Rashchi, F.; Mostoufi, N. A shrinking particle—Shrinking core model for leaching of a zinc ore containing silica. Int. J. Miner. Process. 2009, 93, 79–83. [Google Scholar] [CrossRef]
- Faraji, F.; Alizadeh, A.; Rashchi, F.; Mostoufi, N. Kinetics of leaching: A review. Rev. Chem. Eng. 2020, 38, 113–148. [Google Scholar] [CrossRef]
- Jander, W. Reaktionen im festen Zustande bei höheren Temperaturen. Reaktionsgeschwindigkeiten endotherm verlaufender Umsetzungen. Z. Für Anorg. Und Allg. Chem. 1927, 163, 1–30. [Google Scholar] [CrossRef]
- Ginstling, A.; Brounshtein, B. Concerning the diffusion kinetics of reactions in spherical particles. J. Appl. Chem. USSR 1950, 23, 1327–1338. [Google Scholar]
- Pang, Y.; Li, Q. A review on kinetic models and corresponding analysis methods for hydrogen storage materials. Int. J. Hydrog. Energy 2016, 41, 18072–18087. [Google Scholar] [CrossRef]
- Crank, J. The Mathematics of Diffusion, 2nd ed.; Oxford University Press: Oxford, UK, 1975. [Google Scholar]
- Perez, E.E.; Carelli, A.A.; Crapiste, G.H. Temperature-dependent diffusion coefficient of oil from different sunflower seeds during extraction with hexane. J. Food Eng. 2011, 105, 180–185. [Google Scholar] [CrossRef]
- Viegas, R.; Campinas, M.; Costa, H.; Rosa, M. How do the HSDM and Boyd’s model compare for estimating intraparticle diffusion coefficients in adsorption processes. Adsorption 2014, 20, 737–746. [Google Scholar] [CrossRef]
- Plazinski, W.; Rudzinski, W. Kinetics of Adsorption at Solid/Solution Interfaces Controlled by Intraparticle Diffusion: A Theoretical Analysis. J. Phys. Chem. C 2009, 113, 12495–12501. [Google Scholar] [CrossRef]
- Boyd, G.E.; Schubert, J.; Adamson, A.W. The Exchange Adsorption of Ions from Aqueous Solutions by Organic Zeolites. I. Ion-exchange Equilibria1. J. Am. Chem. Soc. 1947, 69, 2818–2829. [Google Scholar] [CrossRef]
- Reichenberg, D. Properties of Ion-Exchange Resins in Relation to their Structure. III. Kinetics of Exchange. J. Am. Chem. Soc. 1953, 75, 589–597. [Google Scholar] [CrossRef]
- Turner, B.D.; Henley, B.J.; Sleap, S.B.; Sloan, S.W. Kinetic model selection and the Hill model in geochemistry. Int. J. Environ. Sci. Technol. 2015, 12, 2545–2558. [Google Scholar] [CrossRef]
- Dada, A.O.; Adekola, F.A.; Odebunmi, E.O. A novel zerovalent manganese for removal of copper ions: Synthesis, characterization and adsorption studies. Appl. Water Sci. 2017, 7, 1409–1427. [Google Scholar] [CrossRef]
- Tsibranska, I.; Hristova, E. Comparison of different kinetic models for adsorption of heavy metals onto activated carbon from apricot stones. Bulg. Chem. Commun. 2011, 43, 370–377. [Google Scholar]
- Silva, A.M.N.; Kong, X.; Hider, R.C. Determination of the pKa value of the hydroxyl group in the α-hydroxycarboxylates citrate, malate and lactate by 13C NMR: Implications for metal coordination in biological systems. BioMetals 2009, 22, 771–778. [Google Scholar] [CrossRef] [PubMed]
- Shi, Q.; Zhao, Y.; Meng, X.; Shen, L.; Qiu, G.; Zhang, X.; Yu, H.; He, X.; He, H.; Zhao, H. Column leaching of ion adsorption rare earth ore at low ammonium concentration. J. Mater. Res. Technol. 2022, 19, 2135–2145. [Google Scholar] [CrossRef]
- Goyne, K.W.; Brantley, S.L.; Chorover, J. Rare earth element release from phosphate minerals in the presence of organic acids. Chem. Geol. 2010, 278, 1–14. [Google Scholar] [CrossRef]
- Bolan, N.S.; Naidu, R.; Mahimairaja, S.; Baskaran, S. Influence of low-molecular-weight organic acids on the solubilization of phosphates. Biol. Fertil. Soils 1994, 18, 311–319. [Google Scholar] [CrossRef]
- Uddin, F. Clays, nanoclays, and montmorillonite minerals. Metall. Mater. Trans. A 2008, 39, 2804–2814. [Google Scholar] [CrossRef]
- Kirby, C.S.; Rimstidt, J.D. Interaction of municipal solid waste ash with water. Environ. Sci. Technol. 1994, 28, 443–451. [Google Scholar] [CrossRef]
- Dijkstra, J.J.; van der Sloot, H.A.; Comans, R.N.J. The leaching of major and trace elements from MSWI bottom ash as a function of pH and time. Appl. Geochem. 2006, 21, 335–351. [Google Scholar] [CrossRef]
- Brady, J.; Cherniak, D. Diffusion in Minerals: An Overview of Published Experimental Diffusion Data. Rev. Mineral. Geochem. 2010, 72, 899–920. [Google Scholar] [CrossRef]
Figure 1.
Depiction of the shrinking core model in which the unreacted core is converted to a product layer. The rate limiting mechanism may follow film diffusion control, product layer diffusion control, or chemical reaction control at the particle surface.
Figure 1.
Depiction of the shrinking core model in which the unreacted core is converted to a product layer. The rate limiting mechanism may follow film diffusion control, product layer diffusion control, or chemical reaction control at the particle surface.

Figure 2.
Kinetic profile of TREEs leached by 0.1 M citric acid at ambient temperature and pressure shows two distinct kinetic regimes.
Figure 2.
Kinetic profile of TREEs leached by 0.1 M citric acid at ambient temperature and pressure shows two distinct kinetic regimes.

Figure 3.
Leaching profiles of (a) TREEs, Ca, and P, (b) gangue elements Al, Fe, and Si, and (c) critical minerals Co, Ni, Cu.
Figure 3.
Leaching profiles of (a) TREEs, Ca, and P, (b) gangue elements Al, Fe, and Si, and (c) critical minerals Co, Ni, Cu.

Figure 4.
TREE concentration data fits to (a) Jander equation (JE) and Ginstling–Brounshtein model (GBM) and (b) film diffusion, product layer diffusion (PL), and chemical reaction (CR) control models.
Figure 4.
TREE concentration data fits to (a) Jander equation (JE) and Ginstling–Brounshtein model (GBM) and (b) film diffusion, product layer diffusion (PL), and chemical reaction (CR) control models.

Figure 5.
TREE leaching data fitted to the modified diffusion control model (MDCM) (Equation (3)).

Figure 6.
Boyd plots of the (a) TREE and (b) Ca cation leaching process.

Figure 7.
TREE concentration data fitted to (a) the Weber–Morris intraparticle diffusion model (IPD) and (b) the power law model.
Figure 7.
TREE concentration data fitted to (a) the Weber–Morris intraparticle diffusion model (IPD) and (b) the power law model.


Table 1.
Select geometric contraction models fit to MKT leaching data to describe the extraction process of cationic species. The shrinking core model (SCM) is used to determine the physical phenomenon responsible for limiting the rate of species extraction from the ore. SCM is composed of three parts: liquid film diffusion, chemical reaction, and product layer diffusion. The Jander equation (JE) and Ginstling–Brounshtein model (GBM) both describe leaching processes which are diffusion limited. Each equation results in the rate constant (k) to describe the kinetics of the reaction.
| Geometric Contraction Model | Equation |
|---|---|
| Shrinking Core Model | |
| Liquid Film Diffusion Control | |
| Product Layer Diffusion Control | |
| Chemical Reaction Control | |
| Jander Equation | |
| Ginstling–Brounshtein Model |
Table 2.
REE and cation leaching efficiencies (wt.%) after 430 hr using 0.1 M citric acid–citrate leaching solution as modified from Yang et al. (2022) [16].
Table 2.
REE and cation leaching efficiencies (wt.%) after 430 hr using 0.1 M citric acid–citrate leaching solution as modified from Yang et al. (2022) [16].
| REE | Wt. % | Major Cations | Wt. % |
|---|---|---|---|
| Sc | 7.15 | Mg | 4.03 |
| Y | 18.9 | K | 0.578 |
| La | 1.06 | Ca | 31.0 |
| Ce | 3.08 | Al | 0.275 |
| Pr | 5.18 | Si | 0.146 |
| Nd | 8.56 | P | 26.0 |
| Sm | 23.9 | Mn | 3.26 |
| Eu | 34.1 | Fe | 2.83 |
| Gd | 36.6 | Zn | 24.2 |
| Tb | 34.2 | ||
| Dy | 27.0 | U | 8.61 |
| Ho | 20.0 | Th | 25.0 |
| Er | 15.2 | ||
| Tm | 11.4 | Cr | 0.387 |
| Yb | 9.64 | Co | 28.5 |
| Lu | 8.71 | Ni | 15.3 |
| TREE | 10.8 | Cu | 13.9 |
Table 3.
Parameters from the modified diffusion control model (MDCM) for individual and total REEs and relevant cations. The correlated output parameters include qe, q0, B, and t0, while De and % non-diffusive were calculated from these values.
Table 3.
Parameters from the modified diffusion control model (MDCM) for individual and total REEs and relevant cations. The correlated output parameters include qe, q0, B, and t0, while De and % non-diffusive were calculated from these values.
| REE | qe (µg g−1) | q0 (µg g−1) | B (hr−1) | t0 (hr) | R-Squared | De (cm2 s−1) | Non-Diffusive (%) |
| Sc | 1.79 | 2.52 × 10⁻¹ | 5.70 × 10⁻³ | 5.60 | 0.996 | 1.38 × 10⁻⁹ | 14.1 |
| Y | 10.5 | 2.98 | 1.20 × 10⁻² | 3.86 | 0.998 | 2.91 × 10⁻⁹ | 28.2 |
| La | 4.24 × 10⁻¹ | 0 | 1.08 × 10⁻² | 0 | 0.996 | 2.61 × 10⁻⁹ | 0 |
| Ce | 2.57 | 1.55 × 10⁻¹ | 1.12 × 10⁻² | 0.965 | 0.995 | 2.72 × 10⁻⁹ | 6.01 |
| Pr | 5.24 × 10⁻¹ | 5.76 × 10⁻² | 1.12 × 10⁻² | 1.96 | 0.996 | 2.72 × 10⁻⁹ | 11.0 |
| Nd | 3.48 | 4.41 × 10⁻¹ | 1.16 × 10⁻² | 2.07 | 0.996 | 2.81 × 10⁻⁹ | 12.7 |
| Sm | 2.17 | 4.57 × 10⁻¹ | 1.14 × 10⁻² | 3.38 | 0.996 | 2.78 × 10⁻⁹ | 21.0 |
| Eu | 6.79 × 10⁻¹ | 7.96 × 10⁻² | 1.47 × 10⁻² | 1.14 | 0.994 | 3.58 × 10⁻⁹ | 11.7 |
| Gd | 4.42 | 9.84 × 10⁻¹ | 1.23 × 10⁻² | 3.12 | 0.997 | 2.98 × 10⁻⁹ | 22.3 |
| Tb | 6.48 × 10⁻¹ | 1.79 × 10⁻¹ | 1.10 × 10⁻² | 4.49 | 0.997 | 2.67 × 10⁻⁹ | 27.6 |
| Dy | 2.78 | 7.74 × 10⁻¹ | 1.14 × 10⁻² | 4.20 | 0.997 | 2.77 × 10⁻⁹ | 27.8 |
| Ho | 3.96 × 10⁻¹ | 9.12 × 10⁻² | 1.35 × 10⁻² | 2.65 | 0.997 | 3.29 × 10⁻⁹ | 23.0 |
| Er | 8.00 × 10⁻¹ | 2.47 × 10⁻¹ | 1.16 × 10⁻² | 4.52 | 0.997 | 2.81 × 10⁻⁹ | 30.8 |
| Tm | 8.10 × 10⁻² | 2.42 × 10⁻² | 9.98 × 10⁻² | 4.95 | 0.998 | 2.42 × 10⁻⁹ | 29.9 |
| Yb | 4.01 × 10⁻¹ | 9.58 × 10⁻² | 1.13 × 10⁻² | 3.09 | 0.997 | 2.74 × 10⁻⁹ | 23.9 |
| Lu | 5.19 × 10⁻² | 1.48 × 10⁻² | 1.10 × 10⁻² | 4.23 | 0.996 | 2.68 × 10⁻⁹ | 28.4 |
| TREE | 30.0 | 6.65 | 1.18 × 10⁻² | 3.23 | 0.997 | 2.86 × 10⁻⁹ | 22.2 |
| Major Cations | qe (µg g−1) | q0 (µg g−1) | B (hr−1) | t0 (hr) | R-Squared | De (cm2 s−1) | Non-Diffusive (%) |
| Mg | 227 | 105 | 3.97 × 10⁻³ | 15.4 | 0.985 | 9.64 × 10⁻¹⁰ | 46.2 |
| K | 143 | 80.0 | 1.09 × 10⁻² | 5.78 | 0.974 | 2.64 × 10⁻⁹ | 56.0 |
| Ca | 1640 | 591 | 1.16 × 10⁻² | 3.69 | 0.998 | 2.81 × 10⁻⁹ | 36.0 |
| Al | 483 | 17.6 | 1.76 × 10⁻³ | 3.95 | 0.996 | 4.28 × 10⁻¹⁰ | 3.63 |
| Si | 716 | 104 | 1.06 × 10⁻³ | 38.3 | 0.997 | 2.57 × 10⁻¹⁰ | 14.5 |
| P | 486 | 22.4 | 1.78 × 10⁻² | 0.302 | 0.994 | 4.32 × 10⁻⁹ | 4.61 |
| Mn | 5.74 | 2.08 | 3.60 × 10⁻³ | 14.0 | 0.992 | 8.74 × 10⁻¹⁰ | 36.2 |
| Fe | 1170 | 39.1 | 1.72 × 10⁻³ | 6.11 | 0.998 | 4.17 × 10⁻¹⁰ | 3.34 |
| Zn | 31.3 | 6.79 | 6.21 × 10⁻³ | 5.50 | 0.995 | 1.51 × 10⁻⁹ | 21.7 |
| U | 5.15 × 10⁻¹ | 1.05 × 10⁻¹ | 1.07 × 10⁻² | 2.22 | 0.998 | 2.61 × 10⁻⁹ | 20.4 |
| Th | 4.25 | 3.41 × 10⁻¹ | 1.20 × 10⁻² | 1.08 | 0.999 | 2.92 × 10⁻⁹ | 8.01 |
| Ti | 3.79 | 0 | 9.73 × 10⁻⁴ | 7.86 | 0.994 | 2.36 × 10⁻¹⁰ | 0 |
| Cr | 1.64 | 0 | 3.31 × 10⁻⁴ | 57.4 | 0.994 | 8.04 × 10⁻¹¹ | 0 |
| Co | 12.6 | 6.90 | 9.84 × 10⁻³ | 7.92 | 0.998 | 2.39 × 10⁻⁹ | 54.8 |
| Ni | 16.7 | 7.62 | 1.16 × 10⁻² | 5.05 | 0.995 | 2.81 × 10⁻⁹ | 45.5 |
| Cu | 15.1 | 6.37 | 2.36 × 10⁻² | 2.81 | 0.995 | 5.73 × 10⁻⁹ | 42.1 |
Table 4.
Y-intercept values obtained from Boyd plots. Values < |0.1| signify species in which diffusion is dominated by intraparticle diffusion. Otherwise, it undergoes a film diffusion-controlled mechanism.
Table 4.
Y-intercept values obtained from Boyd plots. Values < |0.1| signify species in which diffusion is dominated by intraparticle diffusion. Otherwise, it undergoes a film diffusion-controlled mechanism.
| REE | Y-Int | R-Squared | Major Cations | Y-Int | R-Squared |
|---|---|---|---|---|---|
| Sc | 6.58 × 10⁻³ | 0.984 | Mg | 1.74 × 10⁻¹ | 0.938 |
| Y | 8.77 × 10⁻² | 0.992 | K | 3.41 × 10⁻¹ | 0.927 |
| La | −2.84 × 10⁻² | 0.981 | Ca | 1.63 × 10⁻¹ | 0.992 |
| Ce | −1.04 × 10⁻² | 0.985 | Al | 8.80 × 10⁻³ | 0.996 |
| Pr | 9.72 × 10⁻⁴ | 0.987 | Si | −5.65 × 10⁻³ | 0.975 |
| Nd | 5.15 × 10⁻³ | 0.985 | P | −2.45 × 10⁻² | 0.982 |
| Sm | 3.50 × 10⁻² | 0.990 | Mn | 1.01 × 10⁻¹ | 0.968 |
| Eu | 1.86 × 10⁻² | 0.981 | Fe | 2.56 × 10⁻³ | 0.995 |
| Gd | 4.97 × 10⁻² | 0.992 | Zn | 4.00 × 10⁻² | 0.988 |
| Tb | 6.45 × 10⁻² | 0.987 | |||
| Dy | 7.31 × 10⁻² | 0.992 | U | 6.14 × 10⁻² | 0.991 |
| Ho | 5.99 × 10⁻² | 0.992 | Th | 1.16 × 10⁻² | 0.995 |
| Er | 8.37 × 10⁻² | 0.986 | Ti | 4.23 × 10⁻⁴ | 0.966 |
| Tm | 9.01 × 10⁻² | 0.987 | Cr | −1.52 × 10⁻³ | 0.955 |
| Yb | 6.54 × 10⁻² | 0.994 | Co | 2.77 × 10⁻¹ | 0.961 |
| Lu | 8.47 × 10⁻² | 0.982 | Ni | 2.51 × 10⁻¹ | 0.968 |
| TREE | 5.02 × 10⁻² | 0.992 | Cu | 1.81 × 10⁻¹ | 0.967 |
Table 5.
Power law model parameters for individual and total REEs and major cations influenced by intraparticle diffusion behavior (excludes species controlled by film diffusion).
Table 5.
Power law model parameters for individual and total REEs and major cations influenced by intraparticle diffusion behavior (excludes species controlled by film diffusion).
| REE | k (µg g−1 h−n) | n | R-Squared | Major Cations | k (µg g−1 h−n) | n | R-Squared |
|---|---|---|---|---|---|---|---|
| Sc | 2.13 × 10⁻¹ | 0.385 | 0.990 | Al | 39.3 | 0.345 | 0.989 |
| Y | 2.58 | 0.280 | 0.996 | Si | 23.5 | 0.527 | 0.991 |
| La | 5.38 × 10⁻² | 0.405 | 0.997 | P | 93.2 | 0.345 | 0.997 |
| Ce | 3.88 × 10⁻¹ | 0.372 | 0.996 | Fe | 75.5 | 0.393 | 0.986 |
| Pr | 8.54 × 10⁻² | 0.357 | 0.997 | Zn | 5.62 | 0.305 | 0.993 |
| Nd | 6.10 × 10⁻¹ | 0.347 | 0.996 | ||||
| Sm | 4.35 × 10⁻¹ | 0.319 | 0.996 | U | 1.18 × 10⁻¹ | 0.282 | 0.997 |
| Eu | 1.37 × 10⁻¹ | 0.326 | 0.991 | Th | 7.15 × 10⁻¹ | 0.352 | 0.998 |
| Gd | 9.61 × 10⁻¹ | 0.304 | 0.996 | ||||
| Tb | 1.43 × 10⁻¹ | 0.299 | 0.993 | Ti | 1.62 × 10⁻¹ | 0.413 | 0.970 |
| Dy | 6.43 × 10⁻¹ | 0.290 | 0.995 | Cr | 7.18 × 10⁻³ | 0.762 | 0.980 |
| Ho | 9.44 × 10⁻² | 0.289 | 0.997 | ||||
| Er | 1.96 × 10⁻¹ | 0.279 | 0.993 | ||||
| Tm | 1.92 × 10⁻² | 0.278 | 0.995 | ||||
| Yb | 9.34 × 10⁻² | 0.284 | 0.998 | ||||
| Lu | 1.24 × 10⁻² | 0.282 | 0.992 | ||||
| TREE | 6.43 | 0.305 | 0.996 |
Disclaimer/Publisher’s Note: The statements, opinions and data contained in all publications are solely those of the individual author(s) and contributor(s) and not of MDPI and/or the editor(s). MDPI and/or the editor(s) disclaim responsibility for any injury to people or property resulting from any ideas, methods, instructions or products referred to in the content. |
© 2023 by the authors. Licensee MDPI, Basel, Switzerland. This article is an open access article distributed under the terms and conditions of the Creative Commons Attribution (CC BY) license (https://creativecommons.org/licenses/by/4.0/).
Share and Cite
MDPI and ACS Style
Prem, P.; Burgess, W.; Yang, J.; Verba, C. Extraction Kinetics of Rare Earth Elements from Ion-Adsorbed Underclays. Minerals 2023, 13, 1503. https://doi.org/10.3390/min13121503
AMA Style
Prem P, Burgess W, Yang J, Verba C. Extraction Kinetics of Rare Earth Elements from Ion-Adsorbed Underclays. Minerals. 2023; 13(12):1503. https://doi.org/10.3390/min13121503
Chicago/Turabian StylePrem, Priscilla, Ward Burgess, Jon Yang, and Circe Verba. 2023. "Extraction Kinetics of Rare Earth Elements from Ion-Adsorbed Underclays" Minerals 13, no. 12: 1503. https://doi.org/10.3390/min13121503
Note that from the first issue of 2016, this journal uses article numbers instead of page numbers. See further details here.