Effect of Ni–Mo Carbide Catalyst Formation on Furfural Hydrogenation


1
Novosibirsk State University, Pirogova Str., 2, 630090 Novosibirsk, Russia
2
Boreskov Institute of Catalysis SB RAS, Lavrentev Ave., 5, 630090 Novosibirsk, Russia
*
Author to whom correspondence should be addressed.
Catalysts 2018, 8(11), 560; https://doi.org/10.3390/catal8110560
Submission received: 22 October 2018
/
Revised: 9 November 2018
/
Accepted: 15 November 2018
/
Published: 19 November 2018
Abstract
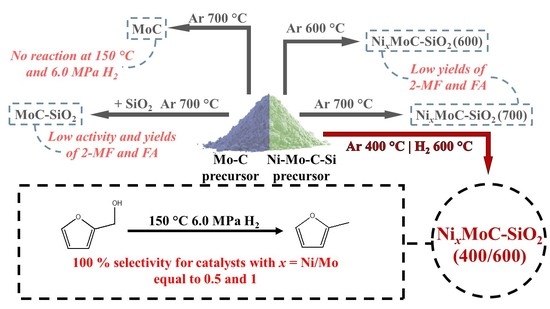
:High-loading Ni–Mo carbide catalysts were prepared by the modified gel-combustion method under various thermal treatment conditions. All samples were studied by X-ray diffraction (XRD) analysis, which showed that the catalysts could contain cubic and hexagonal molybdenum carbides, nickel, nickel oxide and Ni–Mo solid solutions, depending on the thermal treatment conditions. Study of catalyst activity and selectivity in the hydrogenation of furfural was carried out in a batch reactor at 150 °C and hydrogen pressure 6.0 MPa. Analysis of the reaction products showed that the highest yields of 2-methylfuran (2-MF) and furfuryl alcohol (FA) were achieved using catalysts synthesized by calcination of the nickel-molybdenum-carbon precursor at 400 °С with the following reduction in a stream of hydrogen at 600 °C. The best results for production of FA with a yield of 80 mol % and 2-MF with a yield of 29 mol % were observed using Ni6MoC–SiO2 (400/600) and Ni1MoC–SiO2 (400/600) catalysts, respectively. It has been shown that the addition of nickel to the carbide molybdenum catalyst significantly increases the activity of the catalytic systems. In addition, nickel also contributes to the formation of products formed by hydrogenation of the aromatic ring tetrahydrofurfuryl alcohol (THFA) and 2-methyltetrahydrofuran (2-MTHF).
1. Introduction
An intensive growth of energy consumption has led to the search for new types of alternative fuel and their comprehensive study. Against the background of a decrease in the reserves of fossil hydrocarbons and a significant increase in the prices of oil-refining products, obtaining of valuable chemicals and fuel derivatives from renewable raw materials has become very popular. Furfural is a promising bio-renewable resource for processing into different derivatives [1,2]. A technology for furfural production is the hydrolysis of hemicellulose, and the annual world production nowadays amounts to about 300 thousand tons [3,4]. Hydrogenation is one of the key furfural processing methods. Using this method, many substances, particularly 2-methylfuran (2-MF) and furfuryl alcohol (FA), can be obtained.
Furfuryl alcohol is one of the most important products of furfural conversion. Approximately 65% of furfural production is processed into this chemical compound [5]. FA can be used in the foundry resin manufacturing [6] or as an advanced solvent for highly effective chemical processes of chlorination of aromatics and oxygenation of organic compounds [7]. Also, FA is used for the production of polyesters, polyurethane foams and as a chemical building block for the synthesis of some pharmaceuticals (e.g., ranitidine) and fragrances [5,8].
Another high-value derivative, which can be obtained from furfural by selective hydrogenation, is 2-methylfuran. Due to its physical properties, 2-MF can be used as a fuel with an octane number of 74 [9,10] and it also could be converted to hydrocarbons of diesel fraction [11,12]. Nowadays, special attention is paid to the application of 2-methylfuran as a high-octane additive. This interest is based on the physical properties of 2-MF. In comparison with other furfural derivatives, 2-MF has a higher blending research octane number of 131. 2-MF has a low boiling point of 64 °C, which makes it an attractive component of the fuel for cold-start exhaust emission test. In addition, 2-methylfuran has already been tested as a part of a mixture with EN228 gasoline. In the study, a mixture containing 10 vol.% of 2-MF passed road tests on several vehicles with a total route length of 90 thousand kilometres. It was found that the addition of 2-MF did not have negative influence on the engine or the engine oil. Besides, the use of 2-MF as an additive leads to a fuel economy of 2% (compared to a mixture of ethanol and gasoline) [13].
A method for the industrial production of 2-MF and FA from furfural includes the use of Cu–Cr catalysts or catalytic systems based on Pt or Pd. For example, Wojcik et al. [14] have been investigating the hydrogenation of furan compounds in the presence of Ni Raney and Cu–CrO catalysts. It was found that the yield of FA using a copper–chromium oxide catalyst is 96–99% at 175 °C. Further hydrogenation of FA over Cu–CrO leads to the production of 2-methylfuran (36%), pentanol (36%), 1,5-pentanediol (14%) and 1,2-pentanediol (14%). A nearly 99% yield of 2-MF can be achieved using carbon supported Cu–Cr systems in the gas phase furfural hydrogenation [15,16]. However, a serious disadvantage of processes in the gaseous phase over Cu–Cr catalysts is a rapid catalyst deactivation associated with coke formation, change in the oxidation state of the copper, and agglomeration of Cu particles during the reaction due to high temperature [17,18]. A typical example of such systems are Cu–Cr catalysts investigated by Kai Yan and Aicheng Chen [19,20]. Authors found that Cu–Cr oxide catalyst with the Cu2+/Cr3+ ratio of 2 allows furfural to be hydrogenated with conversion of 95.0% and FA yield equal to 90.1% at T = 200 °C, contact time of 4 h and H2 pressure of 6.0 MPa. At the same time, all Cu–Cr systems are vulnerable to carbon deposition and deactivation, consequently reusing of the Cu–Cr sample with Cu2+/Cr3+ ratio of 2 under the same condition leads to conversion of 83.3% and FA yield of 75.3%. Moreover, Cu–Cr systems have high toxicity and a detrimental effect on the environment. Supported noble metals also demonstrate high activity in the selective hydrogenation of furfural and its derivatives. For example, Pd/TiO2 prepared by the standard wet impregnation method allows obtaining 2-MF from FA with a selectivity of 92.5% at room temperature [21]. However, this type of Pd-based catalysts also promotes polymerization reactions and the formation of THFA. Vetere et al. [22] showed a high selectivity of Pt supported on SiO2 in the hydrogenation of furfural to furfuryl alcohol and found that the catalytic activity can be increased by doping of Pt/SiO2 with a small amount of tin. It is possible to change selectivity and activity of Pt-based systems using other supports. Like, for instance, the hydrogenation of furfural over the impregnated 5 wt % Pt catalyst supported on Al2O3 results in a 46% feedstock conversion with keeping the FA selectivity at 98% [23]. In contrast, the use of Pt(5 wt %)/C catalyst decreases the FA selectivity to 28% and increases the furfural conversion to 94% [24]. In this way, noble metal catalysts opened wide possibilities to hydrogenate furfural. Nevertheless, Pt and Pd-based catalysts are less promising for the production of FA and 2-MF than Cu–Cr systems. Furthermore, a high cost of noble metals makes exploitation of these catalytic systems less economically viable.
Alternative catalysts for hydrogenation of furfural can be nickel-molybdenum carbide systems. Previously, the catalysts based on molybdenum carbide, have already proven themselves as highly effective catalysts for bio-oil and vegetable oil hydrotreatment [25,26]. An important feature of these catalysts is their activity in the formation of aromatic hydrocarbons and selectivity in the hydrogenation of alcohol and carbonyl groups [27,28,29,30]. Boullosa-Eiras et al. [31] compared Mo2C/TiO2 with MoO3/TiO2, Mo2N/TiO2 and MoP/TiO2 catalysts in the process of phenol hydrogenation. Based on the experimental data, molybdenum carbide was identified as the most active and selective catalyst for the hydrogenation of phenol to benzene. However, the study of the catalysts’ stability showed that the activity of Mo2C/TiO2 has declined by some 10 percent after 400 min of reaction time. Authors explain this catalyst behaviour by the deposition of coke on the catalyst surface and the decrease in the number of active sites. Lee et al. [32] investigated the activity of molybdenum carbide during the gas phase hydrogenation of furfural. They showed that molybdenum carbide is able to hydrogenate the aldehyde C=O group, which makes it possible to achieve 60% selectivity for 2-MF at relatively low temperatures about 150 °C. It is reported that the surface of the catalyst is presented by two types of sites: carbide and metal-like ones. Carbide sites have acidic properties and participate in the furfural chemisorption. The metal-like part of the surface interacts with molecular hydrogen and leads to its dissociative adsorption. Xiong and colleagues [29,30] studied Mo2C in the deoxygenation of aldehydes and alcohols. In particular, furfural and FA were used as model compounds. The dehydrogenation reactions of molecules were explored using temperature-programmed desorption, the HREELS method, and the theory of functional density. It was shown that molybdenum carbide is involved in a strong interaction with the aldehyde group of furfural, which corresponds to a high selectivity of furfural hydrogenation to 2-MF.
The reusability of the molybdenum carbide catalysts was investigated many times before. Rui Ma et al. [33] studied the process of guaiacol deoxygenation to monooxygenated phenols over activated carbon supported molybdenum carbide. They showed that similar conversion and selectivity towards the target products were achieved in three cycles of catalysts exploitation. At the same time, XRD patterns of the recovered catalysts showed negligible changes in nanoparticle sizes, thus indicating the high stability of these systems. Stability of molybdenum carbide under more aggressive conditions was studied by Dhandapani et al. [34]. They investigated simultaneous hydrogenation of cumene, hydrodesulphurization of dibenzothiophene, and hydrodeoxygenation of benzofuran over a β-Mo2C catalyst. Authors found that Mo2C had high hydrogenation activity for sulphur concentrations up to 30 ± 60 ppm S during 80 h, while the Pt catalyst deactivated immediately even with a small amount of sulphur in the feedstock. In another research, carbon supported molybdenum carbide doped by Ni was applied for selective hydrogenation of lignin [35]. According to this paper, the Ni-Mo2C/C catalyst was tested with an initial H2 pressure of 2 MPa and 250 °C for 2 h in a mixture of lignin and isopropanol. After each using, the sample was removed from reactor and separated from solid residual by a magnet. The yields of liquid product were almost unchanged during five runs and remained at around 60%. Herewith, the Ni and Mo contents in the liquid reaction phase were 0.75 and 17.8 μg·L−1, respectively. All these aspects also indicate good stability and reusability of Ni–Mo carbide catalysts. An important factor is that there is a method for regeneration of carbide catalysts by sequential oxidization of cemented metal carbide at a high temperature above 600 °C and carbonization with a gas mixture of methane and hydrogen [36].
Based on the reasons mentioned here, it is possible to claim that furfural conversion has an importance for modern industry and green chemistry. To reduce the impact on the environment, it is necessary to change the catalytic systems for furfural hydrogenation, as one of the most demanded processes. To avoid Cr-containing catalysts, molybdenum carbide could be suggested as an efficient, stable and environment friendly system for furfural hydrogenation.
In our previous research, the effect of bimetallic Ni–Mo carbide catalysts on the hydrogenation of anisole and ethyl caprate was studied [37]. It was shown that the presence of the Mo2C phase in the catalyst promotes the removal of the methoxy group from anisole without aromatic ring hydrogenation. At the same time, the addition of nickel in the catalyst significantly increases its activity and resistance to coke formation. Thus, Ni–Mo carbides have a high potential for hydrogenation of aldehydes and alcohols. An important application of these catalysts can be hydrogenation of furfural to FA and 2-MF. In the present work, we studied the effect of heat treatment of Ni–Mo carbide on its composition and catalytic properties in furfural hydrogenation to produce FA and 2-MF. It is important to note that Ni-modified molybdenum carbides were studied for the first time in the process of furfural hydrogenation. The catalysts are multicomponent systems resulting from the heat treatment of carbide precursors at 600 or 700 °С in argon or from the sequential treatment in an inert gas (Ar) and hydrogen at 400 and 600 °С, respectively. The X-ray diffraction (XRD) was used to determine the composition of the active phase in the catalysts. In addition, samples are characterized by transmission electron microscopy (TEM), X-ray photoelectron spectroscopy (XPS), nitrogen porosimetry and CO pulse chemisorption measurements. The carbon deposition during furfural hydrogenation is also studied by CHNS analysis of catalysts before and after the reaction.
2. Results and Discussion
2.1. Catalytic Performance of Carbide Catalysts In furfural Hydrogenation Process
On the first step, the influence of the stabilizing SiO2 additive on a sample of molybdenum carbide MoC calcined at 700 °C was studied. It was found that molybdenum carbide synthesized without ethyl silicate virtually does not catalyse furfural hydrogenation under the chosen conditions. The reaction was carried out for 3.5 h, but the concentration of furfural did not change. However, the introduction of silicon dioxide into the catalyst composition increases the activity and leads to the formation of target products, FA and 2-MF. At the same time, the MoC–SiO2 (700) catalyst promotes the formation of the condensation product of furfural and isopropyl alcohol, furfuryl-hydroxyl-isopropyl ether (FHIE). This compound probably appears before hydrogen introduction into the reactor during heating. Its concentration remains constant throughout the entire process (about 10 mol %). This indicates the equilibrium between furfural, isopropanol and their condensation product. Earlier, the formation of a similar product over bimetallic Ni–Cu catalysts was already observed by Khromova et al. [38], but the reasons for implementation of this reaction pathway were not discussed. The effect of acidic catalysts on the acetaldehyde and ethanol condensation was studied by Capeletti at al. [39]. Authors note the high activity of acidic catalytic systems in the condensation of a monohydric alcohol with the aldehyde to form a substance similar to FHIE. Thus, the formation of the furfural and isopropyl alcohol condensation product over molybdenum carbide can be explained by the acidity of its active sites, reported by Bennett et al. in [40]. Based on the reaction products analysis for sample MoC–SiO2 (700), a process scheme shown in Figure 1 was suggested. It includes the pathway for sequential hydrogenation of furfural to FA and 2-MF and the formation of FHIE.
Nevertheless, silica-stabilized molybdenum carbide showed a rather low activity. In the instance using a sample of MoC–SiO2 (700) for 3.5 h, the FA yield was 16%, and the yield of 2-MF was only 3%. Therefore, nickel-doped catalysts that have higher activity in the furfural hydrogenation reaction have been studied. The results obtained over nickel-containing catalysts synthesized under different temperature treatment processes are presented in Table 1.
For the majority of Ni–Mo catalysts, a rapid furfural conversion was observed. The main products of furfural hydrogenation were furfuryl alcohol (FA), tetrahydrofurfuryl alcohol (THFA), 2-methylfuran (2-MF), and 2-methyltetrahydrofuran (2-MTHF). The weak formation of FHIE was detected; its total amount did not exceed 4 mol % and was not taken into account. The formation of hydrogenated furan ring products (THFA and 2-MTHF) was observed over all calcined catalysts and over reduced NixMoC–SiO2 (400/600) systems with the atomic ratio with x ≥2. The accumulation of THFA and 2-MTHF was followed by a decrease in the FA and 2-MF concentration. Thus, for most catalysts, the target product yields achieved a certain maximum, after which they decreased. Table 1 demonstrates the yields of main products and the corresponding contact times and feedstock conversion values. From the data presented, it is clear that the nickel addition significantly increases the total activity of carbide catalysts. In this instance, the 95% conversion can be achieved in 140 min using the calcined at 700 °C catalyst with a minimal nickel content, Ni0.5MoC–SiO2 (700). At the same time, MoC–SiO2 (700) converts only 19% of furfural in 3.5 h under the applied conditions. In addition, Table 1 shows that the calcination regime of catalysts treatment significantly affects the maximal yields of FA and 2-MF. To optimize the thermal treatment conditions for Ni–Mo carbide catalysts, the dependences of FA and 2-MF maximal yields on the relative atomic ratio x = Ni/Mo were plotted point by point and analysed (Figure 2).
The graphs in Figure 2 demonstrate that the catalysts with x >0.5 obtained without the reduction stage have lower yields of the target products than the reduced systems. The maximal yield of FA fixed for the calcined catalyst Ni1MoC–SiO2 (600) is 70 mol %, while the system Ni6MoC–SiO2 (400/600) gives the yield of FA equal to 80 mol %. The same situation was observed for 2-MF, which can be obtained using the catalyst Ni1MoC–SiO2 (400/600) with the yield of 30 mol %, whereas unreduced catalysts are able to hydrogenate furfural to 2-MF with the yield only of 18 mol %. In addition, the NixMoC–SiO2 (400/600) series is characterized by a monotonic increase in the FA yield with a growth in the nickel content. This feature indicates the possibility of FA production by using the Ni–Mo catalysts with high nickel content. Probably, this behaviour of the catalytic properties of unreduced systems is due to the difference in the composition of the active component. Based on these reasons, the catalysts obtained by calcination and subsequent reduction were recognized as the most promising in the hydrogenation of furfural to 2-MF and FA. Therefore, they were studied in more detail in the catalyst characterization part.
2.2. Phase Composition of Ni–Mo Carbide Catalysts
All the catalysts considered in this paper were studied by X-ray diffraction analysis immediately after synthesis. Figure 3 shows the X-ray diffraction pattern of the MoC–SiO2 catalyst calcined at 700 °C in an argon flow. It exhibits broad reflections of cubic molybdenum carbide fcc-MoC1−x and narrow low-intensity peaks of hexagonal form hcp-Mo2C. The diffraction pattern of fcc-MoC1−x slightly differs from the reference data: the peaks are anisotropically broadened and slightly shifted. This behavior may be connected with the crystallites shape or the presence of stacking faults. The average crystallite size for fcc-MoC1−x was estimated from the 111 reflection to be about 40 Å.
X-ray analysis demonstrates that the calcination conditions of nickel-molybdenum-carbon precursors have a critical effect on the formation of phases. Thus, for samples obtained by calcination in an inert atmosphere at 600 °C, broad peaks corresponding to NiO and Ni reflections are observed, but there are no reflections of molybdenum-containing phases (Figure 4).
The absence of molybdenum reflections on the X-ray patterns can be explained by the formation of highly dispersed phases or amorphous carbide forms that are not visible by XRD. In particular, the formation of highly dispersed carbide forms was reported by Vitale et al. [41]. The presence of broadened peaks in molybdenum carbide synthesized at low temperatures was reported in their work. Table 2 lists the phase ratios and average crystallite sizes determined by the Rietveld method for the NixMoC–SiO2 (600) series.
Thus, the formation of carbide phases that can be observed by XRD does not occur under calcination conditions at 600 °C. However, for samples calcined at 700 °C, the diffraction pattern changes significantly (Figure 5).
All the samples calcined at 700 °C have reflections of hcp-Mo2C and nickel–molybdenum alloy Ni–Mo. Furthermore, there are wide peaks in the angular range of 2θ = 35–40° and 40–45°, which apparently belong to the fcc-MoC1−x phase. In the NixMoC–SiO2 (700) series, the reflections of the cubic form are broadened and shifted also for MoC–SiO2 (700). X-ray diffraction patterns of the catalysts differ in relative intensity, which corresponds to different phase ratios (Table 3).
As follows from Table 3, the largest content of Ni–Mo alloy is found in the Ni6MoC–SiO2 (700) sample, which corresponds to the initial loading. When the nickel content decreases, the amount of Ni–Mo alloy decreases too. The maximum amount of fcc-MoC1−x was found in the catalyst Ni0.5MoC–SiO2 (700). At the same time, the quantity of the cubic form decreases with an increase in the total Ni concentration. These dependences indicate a direct effect of the nickel content on the amount of carbide phase. Probably, nickel participates in the decomposition of the complexing agent and promotes carbon conversion to the gaseous products. Another way is also possible, in which molybdenum forms a more thermodynamically stable phase of Ni–Mo alloy without carbides formation. The lattice parameter for the Ni–Mo alloy is in the range of 3.554–3.559 Å, while that for pure nickel is equal to 3.535 Å (JCPDS card no. 4–850). Based on the calibration (see the Supplementary Material, Figure S1), the composition of the nickel-molybdenum alloy was determined for each catalyst. The nickel content in solid solutions was in the range of 91–93%.
Catalysts prepared by calcination in an inert atmosphere with the following reduction under hydrogen flow contain hcp-Mo2C and fcc-MoC1−x phases and Ni–Mo alloy. In addition, peaks of the mixed molybdenum and nickel nitride Mo3Ni2N were observed on the diffraction patterns. Earlier, the presence of these peaks had already been observed [37] and they were interpreted as reflections from the Mo3CNi2 phase. Figure 6 shows the X-ray diffraction patterns of the catalysts of NixMoC–SiO2 (400/600) series.
A special feature of the system is the formation of two solid solutions Ni0.86Mo0.14 and Ni0.95Mo0.05 for Ni6MoC–SiO2 (400/600) catalyst. There are wide peaks in the angular range of 2θ = 35–40° and 40–45° in the sample Ni0.5MoC–SiO2 (400/600). They probably belong to the fcc-MoC1−x. It follows from the X-ray diffraction pattern that nickel addition into reduced catalytic systems increases the content of nickel-molybdenum alloy. In particular, the largest content of the Ni–Mo solution equal to 96 wt % is found in the Ni6MoC–SiO2 (400/600) sample. The least amount of the alloy is detected in the Ni0.5MoC–SiO2 (400/600) catalyst and reaches 28 wt %. More detailed information about the phase content, average crystallite sizes, and lattice parameters is listed in Table 4.
Table 4 demonstrates that the lattice parameters of Ni–Mo alloys range from 3.545 to 3.586 Å, which correspond to a nickel content from 84% to 95%. The Ni0.95Mo0.05 phase has a lattice parameter close to pure nickel. It happens probably due to the release of the Ni phase from the Ni–Mo solution. The average crystallite size increases with the growth of the atomic ratio x = Ni/Mo. For example, the catalyst Ni0.5MoC–SiO2 (400/600) has the average crystallite size equal to 70 Å, whereas for Ni6MoC–SiO2 (400/600) this size reaches 160 Å (for the Ni0.95Mo0.05 phase it is 680 Å). It is worth noting that the total content of carbide phases decreases during the increase in the Ni loading (Figure 7). All these data indicate that nickel contributes to the carbide phase decomposition, whereas molybdenum prevents sintering of the catalyst particles.
According to data presented, it is important to note that there are two different types of phases in the composition of reduced Ni–Mo carbon containing catalysts. The first is the carbide phase, represented by three compounds (hcp-Mo2C, fcc-MoC1−x, Mo3СNi2). The second is the Ni–Mo alloy with a high nickel content (more than 86 wt %). The role of each type will be considered in the following research in the discussion of kinetics.
2.3. Texture Characterization, Active Surface and Carbon Content of Reduced Catalysts
In order to evaluate the quantity of active sites, the reduced samples of NixMoC–SiO2 (400/600) catalysts were studied by CO chemisorption. The number of active sites was calculated from the total adsorption of carbon monoxide according to the rigorous stoichiometry of one CO molecule per one active site. The data obtained are shown below in Table 5.
According to Table 5, the number of active sites decreases with increasing the nickel content. Apparently, it is connected with sintering processes, where nickel can play an important role as a component actively interacting with hydrogen at the reduction stage. On the other hand, this dependence correlates with the elemental analysis data. According to this analysis, there is a difference between total carbon content and carbon content calculated from XRD patterns (Figure 8). However, the difference is nearly absent for Ni4MoC–SiO2 (400/600) and Ni6MoC–SiO2 (400/600) catalysts. Remarkably, these samples are virtually free from carbide phases detected by XRD analysis, and they have the lowest number of active sites among other catalysts (see Table 5).
From the data presented, it is clear that the difference between total carbon amount and carbon amount included in carbide phases is equal to approximately 4 wt % for NixMoC–SiO2 (400/600) with x = 0.5, 1, 2; for MoC–SiO2 (700) the difference is equal to 11 wt %, and for other two catalysts the difference is absent. The existence of the discrepancy between results of elemental analysis and XRD patterns may indicate both the presence of a significant amount of highly dispersed carbide phases in the samples and the presence of amorphous free carbon. In any case, this feature indicates the complex composition of the obtained catalysts. Also, the existence of phases invisible for XRD analysis could explain high CO uptakes for NixMoC–SiO2 (400/600) with x < 4 in comparison with Ni4MoC–SiO2 (400/600) and Ni6MoC–SiO2 (400/600). Thus, exact determination of the active sites number by CO chemisorption is complicated due to the lack of data about composition of X-ray amorphous phases, and information about the nature of sites for furfural adsorption and CO adsorption may differ. Nevertheless, the data obtained were used for calculation of the catalysts turnover frequencies (TOF), whose results and discussion are presented below. Besides, Figure 8 demonstrates the difference in the carbon content of catalyst before and after reaction. There is a tiny gap between curves belonging to fresh and spent catalysts. It could be noted that in the case of monometallic catalyst MoC–SiO2 (700) the greatest increase in the carbon content was observed. With an increase in the nickel content, the amount of settled carbon in the catalyst decreases. Thus, the carbon deposition for catalyst MoC–SiO2 (700) is 3.5%, while for catalyst Ni1MoC–SiO2 (400/600) this value does not exceed 2.2%, and for system Ni6MoC–SiO2 (400/600) the increase in carbon content reaches only 0.3%. This feature of Ni–Mo carbide systems could be explained by their phase composition. The higher stability of bimetallic samples with high Ni content is apparently due to the fact that nickel contributes to the hydrogenation of carbon deposits with the formation of gaseous products. Herewith, carbides, prevailing in the catalysts with a low nickel content have a distinct acidity, which makes them vulnerable to coke formation. Nevertheless, Ni-containing catalysts NixMoC–SiO2 (400/600) show high resistance to carbon deposition and could be considered as stable and promising.
Considering the above-mentioned reasons, texture characteristics of catalysts NixMoC–SiO2 (400/600) were studied using nitrogen porosimetry method. All the samples had an adsorption isotherm corresponding to the structure of a micro-mesoporous material The analysis of results, including the total surface areas determined by Brunauer–Emmett–Teller (BET) method ABET, the total porous volumes V and the average pore sizes D, are presented in Table 6.
According to the data in Table 6, the total surface area ABET is in the range from 11.29 to 43.43 m2/g. These values exceed the previous ones obtained for similar catalysts [37], whose maximal surface area was ABET = 10 m2/g for the system Ni6MoC–SiO2 (400/600). This difference is most likely due to the influence of ethylene glycol, which is a good complexing agent and leads to an increase in the catalyst surface area. The high value of the catalysts surface area could be connected also with the existence of highly dispersed phases.
It was shown that the average pore diameter varies between 3.92 and 9.91 nm. These sizes characterize the mesoporous adsorbents. The total pore volume Vpore, determined from the maximum nitrogen uptake, increases with the rise of nickel content. This dependence is apparently explained by the high activity of nickel in hydrogenation reactions. In particular, nickel may catalyze the process of carbon removal on the stage of catalyst precursor reduction. Therefore, the introduction of nickel into the catalyst precursor ultimately leads to the release of the pores occupied by carbon. Earlier, Zhao et al. [42] showed that nickel allows improving the porous structure of the molybdenum carbide catalyst. Authors studied the catalysts surface images taken by scanning (SEM) and transmission (TEM) electron microscope. They found that the MoC sample had a dense structure without the pore system, while modification by nickel increases the specific surface area and results in the appearance of a developed pore structure. The data obtained by Zhao et al. [42] have a good agreement with the TEM catalysts characterization obtained in the current work and presented below. As a result, porous analysis of carbide catalysts NixMoC–SiO2 (400/600) has shown that the systems are mesoporous materials. The addition of ethylene glycol as a complexing agent and the introduction of nickel take an important place in the formation of their structure.
2.4. Surface Composition of Ni–Mo Carbide Catalysts
The relative atomic concentrations of the main elements determined by XPS are given in Table 7. It was found that the systems are multi-phased and heterogeneous. The samples include the components that could be described as molybdenum oxides on SiO2, a mixture of nickel and molybdenum carbides on SiO2, and nickel oxide on SiO2. In contrast to XRD data, oxygen was detected on the surface of catalysts by XPS. This oxygen may belong to Ni or Mo oxide formed after passivation. Nickel content on the surface increases with nickel content in the catalyst. It was found that the Ni/Mo ratio observed by XPS is less than the values of molar ratio x = Ni/Mo in the catalyst, which indicates that the surface is enriched with molybdenum. The carbon content for x = 4 and 6 is low, which is in agreement with XRD and CHNS analysis.
2.5. Catalysts Characterization by Transmission Electron Microscopy
Figure 9 presents TEM images and corresponding patterns of Energy-dispersive X-ray spectroscopy (EDX) for Ni1MoC–SiO2 (400/600) catalyst. The images are typical for whole series of reduced NixMoC–SiO2 (400/600) systems.
According to TEM data, there are large particles of Ni–Mo alloy (400–500 nm) with around 10 wt % of Mo (Figure 9a). In addition, we detected inclusions of small 1–2 nm particles of molybdenum carbide in a silica matrix (Figure 9b). The small size of the carbide phase confirms that there are highly dispersion phases in catalysts compound, which cannot be detected by XRD that correlates with the mentioned earlier difference between CHNS and XRD analysis. Herewith, analysis of different TEM images showed, that the appearance of carbon-containing particles decreases with growth in atomic ratio x = Ni/Mo in the catalyst, while small molybdenum oxide inclusions were observed. It indicates that dispersed carbide phase is replacing by oxide phase. It was noted that in most cases Ni–Mo alloys particles have significant sizes. It means Ni–Mo phase has low active surface and could barely participate in the sorption and transformation of furfural and its derivatives, but it could be involved in highly efficient spill over of atomic hydrogen from Ni sites to molybdenum carbide or oxide. As shown previously molybdenum oxides have high activity in the hydrogenation of aromatic ring [43], and they could be an active site for the non-selective adsorption of furfural and furfuryl alcohol leading to hydrogenation of furan ring and formation of THFA and 2-MTHF.
2.6. Kinetics Modeling of Furfural Hydrogenation over Reduced Ni–Mo Carbide Catalysts
To study the activity and selectivity of the reduced catalysts, the dependences of reagent and products concentrations on the reaction time were studied (Figure 10). As it follows from the kinetic profiles of the reaction, the main products of furfural hydrogenation for the catalysts Ni0.5MoC–SiO2 (400/600) and Ni1MoC–SiO2 (400/600) were FA and 2-MF. THFA was detected for the reduced systems NixMoC–SiO2 (400/600) with x > 1. The formation of 2-MTHF was observed in small amounts up to 6 mol % for the Ni6MoC–SiO2 (400/600) catalyst with a high nickel content. Also, during the reaction, the formation of FHIE and its hydrogenation products was observed, but their total amount was low, and the total content did not exceed 5 mol %, therefore these compounds were not taken into account in kinetic calculations. As it follows from the graphs in Figure 10, the conversion rate of the feedstock increases with the growth of nickel amount in the catalyst. However, together with the increase in the nickel content, the yield of furan ring hydrogenation products (THFA and 2-MTHF) also increases. An important feature of the reduced systems is the kinetics shift zone, which is observed for catalysts Ni0.5MoC–SiO2 (400/600) and Ni1MoC–SiO2 (400/600) after 110 min of reaction. The presence of this zone is reflected by the rapid change in the reaction profile. It is accompanied by a fall and subsequent reduction of the catalyst activity near 110 min. The existence of such a region may be explained by changes in the composition of the catalyst active component during the reaction.
Based on the reaction products distribution, a furfural hydrogenation scheme was proposed for catalysts NixMoC–SiO2 (400/600) (Figure 11).
This scheme includes the route of furfural hydrogenation to FA, which can be converted to 2-MF or THFA. The aromatic ring of 2-MF can be hydrogenated to form 2-MTHF. All kinetic constants k0-k3 were determined according to the proposed scheme and the reaction products. Since the hydrogen pressure did not change during the experiment, the dependence of the reaction rates on the hydrogen pressure was taken into account in the rate constants.
The kinetic modelling was based on the proposed scheme of reactions (Figure 11), and calculations were carried out with the use of the following model:
where km is the rate constant, Ci and Cm are the mole fractions of each component, Ri is the reaction rate, and n is the order of the reaction (n = 1 for all reactions). An experimental point serves as t = 0, Ci and Cm are equal to the mole fractions of the corresponding compounds at the first point.
The set of equations was solved by the numerical integration using the Runge–Kutta method, and kinetic parameters were found by minimizing the sum of squared differences of the estimated and experimental values of the mole fraction of each compound for each experimental point. The minimizing function has the form:
where j is the number of the experimental point; and i is the serial number of the compound from the reaction scheme.
The concentration variations of the reactant and products in the reaction mixture as a function of reaction time and kinetic modelling results are displayed in Figure 10.
For determination of the reactions rate constants, the experimental points to 110 min were taken. This choice is due to the presence of kinetics shift zone for low-nickel catalysts (x = 0.5, 1), which can be associated with a change in the state of the active component during the reaction. Thus, reaction rate constants for all NixMoC–SiO2 (400/600) catalysts were obtained and their values are listed in Table 8.
The calculated data demonstrated that, for the reduced catalytic systems, there is a linear increase in the effective rate constants of furfural hydrogenation to FA with an increase in the nickel content in the catalyst (Figure 12).
The values of rate constants were used to calculate the selectivity for the formation routes of 2-MF and THFA from FA. This calculation was carried out according to the formulas below. The possibility of 2-MF hydrogenation to 2-MTHF was not taken into account since this route was found only for the Ni6MoC–SiO2 (400/600) catalyst and was not observed for other systems.
Here, k1 is the reaction rate constant for hydrogenation of FA to THFA, and k2 is the rate constant for hydrogenation of FA to 2-MF.
It was shown that selectivity of 2-MF formation from FA decreases with an increase in the atomic ratio x = Ni/Mo (Figure 13).
According to Figure 13, the highest selectivity for 2-MF formation is achieved for the catalysts with a low nickel content. The maximum selectivity of ca. 100% is achieved over Ni0.5MoC–SiO2 (400/600) and Ni1MoC–SiO2 (400/600) catalysts. Comparing the selectivity values and the data of catalysts surface composition, it can be found that in the NixMoC–SiO2 (400/600) series with x = 1, 2, 4, 6, an exponential decrease in the selectivity is observed with an increase in nickel content on the catalyst surface (Figure 14).
As it follows from Figure 14, the optimal nickel content in the surface layer for efficient 2-MF production does not exceed 22%. At the same time, saturation of the surface with nickel leads to a decrease in the selectivity. In particular, when the Ni quantity in the surface layer achieves 65%, the selectivity of such catalyst does not exceed 44%. It is important to note that the Ni6MoC–SiO2 (400/600) sample containing the highest quantity of Ni–Mo alloys (96% according to XRD) keeps the selectivity for 2-MF equal to 35%. In addition, within the limit of 100% Ni content on the catalyst surface, the selectivity remains equal to 28%. As it was mentioned earlier, catalysts with the atomic ratio x = Ni/Mo of 4 and 6 do not actually contain carbide phases. Their main component is a nickel-molybdenum alloy, which promotes the formation of THFA and 2-MTHF. Thus, molybdenum carbide exhibits a high selectivity in the formation of 2-MF.
Probably, molybdenum carbide is responsible for the adsorption of furfural in a conformation which leads to the formation of FA and 2-MF, whereas nickel contributes to the activation of molecular hydrogen. Indeed, Shi et al. [44] performed detailed density functional theory (DFT) and microkinetic calculations to provide a fundamental understanding of the mechanism of furfural hydrogenation over molybdenum carbide surface. They showed that there are five adsorption configurations of furfural on the Mo2C surface. The most stable is the cis-furfural absorbed via the η2(C=O) bonding configuration with the C=O bond elongated, and furan ring tilted away from the surface. From this configuration, two competitive pathways are possible, which include C–H scission that leads to furan formation, and hydrogenation that results in formation of intermediate product F–CH2O, where F is 2-furanyl radical. She et al. shown that the C-O dissociation of F-CH2O into F-CH2+O is more favoured than F-CH2O hydrogenation into furfuryl alcohol both kinetically and thermodynamically. Once FA (F-CH2OH) is formed, it can easily go back to F-CH2O under equilibrium condition due to the much low back energy barrier. Therefore, the most favoured surface species are the co-adsorbed F-CH2 and O, which are used for the formation of 2-methylfuran. Herewith, the pathway of F–CH2O formation occurs when the catalyst surface is covered by hydrogen, especially in the case of 4H pre-covered surface. On the other hand, it is clearly known that Ni is a highly reactive catalyst for organic compounds hydrogenation. In the instance, Rodiansono et al. [45] showed that Raney–Ni–clay composite catalysts immediately hydrogenate furfural to THFA through the quiet formation of FA at 120 °C and 2.0 MPa of H2. Such behavior of Ni in hydrogenation reaction indicates unselective chemisorption of furfural on the surface by different parts of its structure, both the ring and the C=O bond. In our case, the samples include Ni–Mo alloy and its activity, apparently, differs from the activity of pure nickel, however, common properties remain the same. Besides, in accordance with TEM analysis, there are large particles of Ni–Mo alloy and highly dispersion molybdenum oxide in catalysts. Therefore, apparently, the Ni–Mo particles participate in hydrogen activation followed by transfer to molybdenum carbide or oxide sites. Molybdenum carbide allow converting furfural to FA and 2-MF, while molybdenum oxide leads to formation of THFA and 2-MTHF.
In order to evaluate the specific catalytic activity, we used results of CO chemisorption measurements. The specific activity was determined as the initial conversion rate of furfural over one active site. This definition corresponds to the formula:
where k0 is the rate constant of furfural hydrogenation to FA; is the initial amount of furfural equal to 0.0254 moles; and is the number of active sites. The data obtained are listed in Table 9.
Analysis of Table 9 shows that the first four samples with the atomic ratio of x = 0.5–2 have relatively similar values of specific activity. At the same time, the Ni4MoC–SiO2 (400/600) and Ni6MoC–SiO2 (400/600) systems are characterized by a significantly higher specific activity up to 1.2–1.4 s−1, which may be due to a change in the nature of active component or a change in their surface composition, which were discussed earlier.
Remarkably, the specific activity of the carbide catalyst with atomic ratio x = Ni/Mo is equal to 0.5 and 1 is comparable with the activity of highly dispersed Ni supported on SiO2. For instance, the Ni1MoC–SiO2 (400/600) sample has TOF equal to 0.035 s−1, whereas TOF of the Ni/SiO2 sample prepared by impregnation method has a maximum of 0.036 s−1 under similar conditions of furfural hydrogenation [46]. Pushkarev et al. [47] reported that Pt nanoparticles supported on MCF-17 mesoporous silica are able to hydrogenate furfural to FA with the selectivity of 68%. Authors tested Pt/MCF-17 samples with different particle sizes in the vapor-phase furfural hydrogenation at atmospheric pressure and 443−513 K. They found that the most selective Pt-based catalysts have specific activity between 0.04 and 0.08 s−1. In our case, systems Ni4MoC–SiO2 (400/600) and Ni6MoC–SiO2 (400/600) have the turnover number 1.11 and 1.39 s−1 and their selectivity to FA formation is also high enough. Cu based catalysts, which were investigated in the liquid-phase furfural hydrogenation, also demonstrated low activity in comparison with carbides. For instance, Villaverde et al. [48] examined the CuZnAl, CuMgAl and Cu–Cr catalyst, which were synthesized by co-precipitation, in a bath reactor at 110 °C and pressure 1.0 MPa. In all cases, the selectivity to furfuryl alcohol reached 100% under the specified conditions. However, the TOF values for CuMgAl, Cu–Cr and CuZnAl were 0.049, 0.022 and 0.006 s−1, respectively. Bhogeswararao and Srinivas [23] reported about Pt systems supported on γ-Al2O3, which were tested in gaseous phase furfural hydrogenation at 25 °C over the pressure range from 2.0 to 6.0 MPa. The maximal yield (91%) of FA was achieved using the Pt (5 wt %)/Al2O3 catalyst. Furthermore, the TOF number for this system was 3.06 s−1. This value is much higher than the maximal turnover number detected for Ni–Mo carbides considered in this work. Therefore, a comparison of specific activities of the obtained catalysts with other alternative systems shows that Ni–Mo carbides have a rather high efficiency in furfural hydrogenation. Nevertheless, there are catalytic systems with beter catalytic properties, and searching for the ways to increase the activity of carbides remains an actual challenge.
Thus, it is necessary to note that the investigated Ni–Mo catalysts consist of a carbide phase responsible for the selective furfural adsorption and formation of FA and 2-MF, a Ni–Mo alloy involved in the hydrogen activation, and molybdenum oxide responsible for the non-selective furfural adsorption. Therefore, the exact combination of these phases, carbide and metal, allows maintaining high activity and selectivity of the catalyst. Thus, further development of a catalyst with a high content of molybdenum carbide, promoted with a small amount of Ni, can lead to high yields of 2-MF in furfural hydrogenation.
3. Materials and Methods
3.1. Catalyst Preparation
The precursors of carbide catalysts NixMoC–SiO2 with the atomic ratio x = Ni/Mo equal to 0, 0.5, 1, 2, 4, and 6 were prepared by the modified gel-combustion method [42,49] using citric acid and ethylene glycol as the complexation agents. The source of Mo and Ni was the salts of (NH4)6Mo7O24∙4H2O (98%, Reachim) and Ni(NO3)2∙6H2O (98%, Reachim), respectively.
For the synthesis of catalysts, the corresponding quantities of (NH4)6Mo7O24∙4H2O, Ni(NO3)2∙6H2O and citric acid were dissolved in water under vigorous stirring and heating to 80 °C. Citric acid (CA) was introduced into the mixture with a molar ratio n = CA/(Ni + Mo) equal to 1. Further, ethylene glycol was added to the solution in the same amount as CA. When the homogeneous solution was obtained, ethyl silicate-32 was added (the amount of SiO2 was 10 wt % for all samples excluding the amount of carbon). The solution was heated to form a viscous substance. The obtained samples were dried at 100 °C until the moisture was completely removed.
The dried and ground powder of the precursor was calcined in a quartz reactor under various heat treatment conditions. Catalytic systems NixMoC–SiO2 (600) and NixMoC–SiO2 (700) with the atomic ratio x = Ni/Mo equal to 0, 0.5, 1, 2, 6 were prepared by calcination of the corresponding precursors in the Ar flow at 600 and 700 °C, respectively. The reduced catalysts NixMoC–SiO2 (400/600) with x = Ni/Mo of 0.5, 1, 2, 4, and 6 were synthesized by calcination in the Ar flow at 400 °C and following reduction in an H2 atmosphere at 600 °C. Molybdenum carbide without SiO2 was synthesized by calcination at 700 °C in an inert atmosphere. After every temperature treatment, the samples were cooled to room temperature without air access and passivated by ethanol impregnation.
3.2. X-ray Diffraction
The phase composition of Ni–Mo carbide catalysts was investigated by X-ray diffraction analysis. In this study, a D8 Advance X-ray diffractometer (Bruker, Frankfurt, Germany) equipped with a Lynxeye linear detector was used. Monochromatic CuKα radiation (λ = 1.5418 Å) was applied for the analysis. XRD patterns were obtained in the 2θ range from 15° to 80° with a step of 0.05° and accumulation time of 3–5 s at each point. The average crystallite size was determined using the Scherrer equation from the integral width of the diffraction lines.
Phase contents were obtained using calibration graphs constructed from the calculated diffraction patterns for Ni, fcc-MoC1−x, and hcp-Mo2C. Finally, the Rietveld method [50] was employed to refine the lattice parameters and the phase ratio.
3.3. Texture Characteristics
The texture characteristics of the reduced catalysts were examined using the low-temperature nitrogen porosimetry. An automated volumetric adsorption analyser ASAP 2400 (Micromeritics Instrument Corp., Norcross, GA, USA) was used for the analysis. Before recording the nitrogen adsorption isotherms, the samples were outgassed at 150 °C and pressure 0.13 Pa for 4 h. The experimental data were then used to calculate the surface area ABET.
3.4. CO Pulse Chemisorption Measurements
The number of active sites in the reduced catalysts NixMoC–SiO2 (400/600) were determined by CO pulse chemisorption measurements using a Chemosorb analyser (Modern Laboratory Equipment, Novosibirsk, Russia). Before analysis, the catalysts were reduced in a stream of H2 at 350 °C. Further, the samples were cooled to 25 °C into Ar atmosphere and CO was pulsed into the reactor until complete sample saturation was observed. The total CO uptake was used to calculate the number of active sites.
3.5. Elemental Analysis
The carbon content in the catalysts before and after reaction was determined using a Vario El III elemental analyser, CHNS version (Elementar, Germany).
3.6. X-ray Photoelectron Spectroscopy
The XPS measurements were made using a photoelectron spectrometer (SPECS Surface Nano Analysis GmbH, Berlin, Germany) equipped with a PHOIBOS-150 hemispherical electron energy analyser, a FOCUS-500 X-ray monochromator, and an XR-50 X-ray source with a double Al/Ag anode. The spectrometer was also equipped with a high-pressure cell that makes it possible to heat samples before analysing under gaseous mixtures at pressures up to 0.5 MPa. The spectra were recorded using monochromatic Al Ka radiation (hv = 1486.74 eV) and a fixed analyser pass energy of 20 eV under ultra-high vacuum conditions. Since SiO2 is included into the catalyst composition, the binding energy scale was calibrated by the internal standard method against the Si2p line of silicon. Relative concentrations of elements were determined from the integral intensities of the core-level spectra using the cross sections according to Scofield [51]. For detailed analysis, the spectra were fitted into several peaks after background subtraction by the Shirley method [52]. The fitting procedure was performed using the CasaXPS software. The shape of lines was approximated by the convolution of Gaussian and Lorentzian functions. Before the analysis, all catalysts were additionally reduced under 1 bar of H2 at 350 °C for 30 min in the high-pressure cell.
3.7. Transmission Electron Microscopy
The structure and microstructure of powders were examined by high-resolution transmission electron microscopy (HRTEM) on a JEM-2010 electron microscope (JEOL, Tokyo, Japan) at an accelerating voltage of 200 kV and point-to-point resolution of 0.14 nm. The microscope was equipped with a XFlash energy-dispersive X-ray (EDX) spectrometer (Bruker, Ettlingen, Germany) with energy resolution, 125 eV. Prior to electron-microscopic examination, the particles were immersed in ethanol and applied to holey carbon substrates (hole diameter near 1 μm) secured on copper grids. The particles were applied using a UZD-1UCh2 ultrasonic processor, which allowed us to achieve a uniform distribution of the particles over the substrate surface. After the particles on the carbon substrate and grid were withdrawn from the ethanol, it was evaporated.
3.8. Catalytic Activity Tests
The study of catalysts activity in the furfural hydrogenation was carried out in a batch reactor (Autoclave Engineers, Erie, PA, USA) equipped with a 300 mL stainless steel reactor. Before the reaction, a pre-ground catalyst (1 g of a fine powder with the size <0.071 mm) was placed in an autoclave and activated in situ in an H2 stream at a temperature of 350 °C for 60 min. The hydrogen flow was 300 mL/min. After activation, 60 mL of 5 wt % furfural in isopropanol was added into the cooled reactor. The reactor was then sealed, and the mixture was heated to 150 °C for 40 min. When the specified temperature was reached, 6.0 MPa of H2 was fed into the reactor. The onset and endpoint of the reaction corresponded to the times when stirring was turned on and off. The stirring rate was 1800 rpm. During the whole process, samples were taken for analysis, and the pressure in the reactor was held at 6.0 MPa. Liquid samples were taken at intervals of 2, 5, 10, 20, 30, and 40 min.
To evaluate carbonization degree of the catalysts, each sample after reaction (the total contact time was 310 min for every experiment) was removed from the chilled reactor and separated from the liquid phase by filtration at room temperature. Further, all the samples were carefully washed with acetone and then dried at 60 °C. The washed and dried catalyst was used for evaluation of the carbon content.
Qualitative analysis of the liquid products was carried out using an Agilent 7000B (Santa Clara, Calif., United States) gas chromatography–mass spectrometer equipped with a triple quadrupole analyser and quartz capillary column CD Wax. NIST.11 database was used to identify the components of the analysed sample. Quantitative analysis of the liquid products of furfural hydrogenation was carried out using an Agilent Technologies GC-7820A (Santa Clara, Calif., United States) gas chromatograph equipped with a flame ionization detector (FID), HP-5 capillary column (stationary phase (5%-phenyl)-methyl polysiloxane, 30 m|0.32 mm|0.25 μm) and CM-WAX capillary column (stationary phase 100% polyethylene glycol, 30 m|0.32 mm|0.25 μm). The temperature program for both columns was: 50 °C held for 4 min, 8 °C/min to 240 °C, and holding the final temperature for 3 min. The injector and detector temperatures were 300 and 360 °C, respectively. Argon was used as a carrier gas. The 0.6 μL samples of were injected into the gas chromatograph with a chromatographic syringe. The reaction mixture components were identified by retention times, which were determined separately for each component in the calibration. The HP-5 column was used to identify and separate 2-MF and 2-MTHF. Determination of the other components was carried out using the CM-WAX column.
4. Conclusions
The experiments demonstrated that the introduction of stabilizing SiO2 additive into the molybdenum carbide catalyst significantly increases the activity of MoC during hydrogenation of furfural. It has been shown that the NixMoC–SiO2 catalysts synthesized by reduction of nickel molybdenum-carbon precursor are able to hydrogenate furfural to 2-methylfuran and furfuryl alcohol with higher yields than the catalysts obtained by calcination in an inert. It has been found that the introduction of nickel significantly increases the specific activity of reduced Ni–Mo carbide catalysts in the hydrogenation of furfural from TOF = 0.016 s−1 for Ni0.5MoC–SiO2 to TOF = 1.39 s−1 for Ni6MoC–SiO2. It was found that the nickel introduction increases the yields of furfuryl alcohol and products of complete hydrogenation of furan ring—tetrahydrofurfuryl alcohol and 2-methyltetrahydrofuran. The presence of carbide and metal phases in the samples was revealed by XRD analysis. In accordance with the catalytic activity of systems with different Ni content, we found that the metal part represented by Ni–Mo alloy is apparently responsible for the hydrogen activation. At the same time, the carbide part, including such phases as hcp-Mo2C, fcc-MoC1−x and Mo3СNi2, participates in loosening of the C=O bond of furfural, which leads to the formation of furfuryl alcohol and 2-methylfuran. Molybdenum oxide particles, detected from TEM patterns, participate in non-selective furfural and furfuryl alcohol adsorption leading to the hydrogenation of the aromatic ring. According to the values of reaction rate constants and the proposed reaction scheme, the selectivity of 2-methylfuran formation from furfuryl alcohol was calculated. The maximal selectivity of furfuryl alcohol processing to 2-methylfuran reaches 100% for the low-nickel systems. As a result of this evaluation, the reduced catalysts Ni0.5MoC–SiO2 and Ni1MoC–SiO2 can be considered as the most promising catalysts for selective furfural hydrogenation to produce the ecological high-octane additive, 2-methylfuran. Furthermore, it has been demonstrated that the reduced carbide catalysts with the atomic ratio Ni/Mo from 1 to 2 can provide the greatest yield of the target products at 150 °С and hydrogen pressure 6.0 MPa, with the maximal yield of furfuryl alcohol reaching 75 mol %, and the yield of 2-methylfuran reaching 30 mol %.
Supplementary Materials
The following are available online at https://www.mdpi.com/2073-4344/8/11/560/s1, Mass Transfer Calculations, Figure S1: The dependence of the lattice parameter on the parameter x in Ni1−xMox.
Author Contributions
Conceptualization, V.A.Y.; Formal analysis, A.A.S.; Investigation, I.N.S. and O.A.B.; Visualization, A.A.S.; Writing—original draft, I.N.S.; Writing—review & editing, V.A.Y.
Funding
This research was funded by the Ministry of Science and Higher Education of the Russian Federation: project No. 14.575.21.0171, identification number of the project RFMEFI57517X0171, title “Development of methods for processing the products of non-food plant raw materials conversion into furanic high-octane additives for motor fuels and into other high-value chemical products”.
Acknowledgments
The authors express gratitude to Sergei G. Zavarukhin for carrying out the mathematical calculations and participation in the kinetic modeling. We thank Andrey A. Saraev for carrying out XPS analysis and Evgeny Yu. Gerasimov for making TEM analysis.
Conflicts of Interest
The authors declare no conflict of interest.
References
- Mariscal, R.; Maireles-Torres, P.; Ojeda, M.; Sadaba, I.; Lopez Granados, M. Furfural: A renewable and versatile platform molecule for the synthesis of chemicals and fuels. Energy Environ. Sci. 2016, 9, 1144–1189. [Google Scholar] [CrossRef]
- Li, X.; Jia, P.; Wang, T. Furfural: A Promising Platform Compound for Sustainable Production of C4 and C5 Chemicals. ACS Catal. 2016, 6, 7621–7640. [Google Scholar] [CrossRef]
- Dashtban, M.; Gilbert, A.; Fatehi, P. Production of furfural: Overview and challenges. J. Sci. Technol. Forest. Prod. Process. 2012, 2, 44–53. [Google Scholar]
- Dutta, S.; De, S.; Saha, B.; Alam, M.I. Advances in conversion of hemicellulosic biomass to furfural and upgrading to biofuels. Catal. Sci. Technol. 2012, 2, 2025–2036. [Google Scholar] [CrossRef]
- Hoydonckx, H.E.; Van Rhijn, W.M.; Van Rhijn, W.; De Vos, D.E.; Jacobs, P.A. Furfural and Derivatives. In Ullmann’s Encyclopedia of Industrial Chemistry; Wiley-VCH Verlag GmbH & Co. KGaA: Weinheim, Germany, 2007. [Google Scholar]
- Barr, J.B.; Wallon, S.B. The chemistry of furfuryl alcohol resins. J. Appl. Polym. Sci. 2003, 15, 1079–1090. [Google Scholar] [CrossRef]
- Rasina, D.; Lombi, A.; Santoro, S.; Ferlin, F.; Vaccaro, L. Searching for novel reusable biomass-derived solvents: Furfuryl alcohol/water azeotrope as a medium for waste-minimised copper-catalysed azide–alkyne cycloaddition. Green Chem. 2016, 18, 6380–6386. [Google Scholar] [CrossRef]
- Kottke, R. Furan derivatives. In Kirk-Othmer Encyclopedia of Chemical Technology; John Wiley & Sons, Inc.: Hoboken, NJ, USA, 2000. [Google Scholar]
- Bayan, S.; Beati, E. Furfural and its derivatives as motor fuels. Chim. Ind. 1941, 23, 432–434. [Google Scholar]
- Wang, C.; Xu, H.; Daniel, R.; Ghafourian, A.; Herreros, J.M.; Shuai, S.; Ma, X. Combustion characteristics and emissions of 2-methylfuran compared to 2,5-dimethylfuran, gasoline and ethanol in a DISI engine. Fuel 2013, 103, 200–211. [Google Scholar] [CrossRef]
- Corma, A.; de la Torre, O.; Renz, M. Production of high quality diesel from cellulose and hemicellulose by the Sylvan process: Catalysts and process variables. Energy Environ. Sci. 2012, 5, 6328–6344. [Google Scholar] [CrossRef]
- Balakrishnan, M.; Sacia Eric, R.; Bell Alexis, T. Selective Hydrogenation of Furan-Containing Condensation Products as a Source of Biomass-Derived Diesel Additives. ChemSusChem 2014, 7, 2796–2800. [Google Scholar] [CrossRef] [PubMed]
- Lange, J.P.; van der Heide, E.; van Buijtenen, J.; Price, R. Furfural—A Promising Platform for Lignocellulosic Biofuels. ChemSusChem 2011, 5, 150–166. [Google Scholar] [CrossRef] [PubMed]
- Wojcik, B.H. Catalytic Hydrogenation of Furan Compounds. Ind. Eng. Chem. 1948, 40, 210–216. [Google Scholar] [CrossRef]
- Burnett, L.W.; Johns, I.B.; Holdren, R.F.; Hixon, R.M. Production of 2-Methylfuran by Vapor-Phase Hydrogenation of Furfural. Ind. Eng. Chem. 1948, 40, 502–505. [Google Scholar] [CrossRef]
- Holdren, R.F. Manufacture of Methylfuran. U.S. Patent 2,445,714, 20 July 1948. [Google Scholar]
- Rao, R.; Dandekar, A.; Baker, R.T.K.; Vannice, M.A. Properties of Copper Chromite Catalysts in Hydrogenation Reactions. J. Catal. 1997, 171, 406–419. [Google Scholar] [CrossRef]
- Liu, D.; Zemlyanov, D.; Wu, T.; Lobo-Lapidus, R.J.; Dumesic, J.A.; Miller, J.T.; Marshall, C.L. Deactivation mechanistic studies of copper chromite catalyst for selective hydrogenation of 2-furfuraldehyde. J. Catal. 2013, 299, 336–345. [Google Scholar] [CrossRef]
- Yan, K.; Liu, Y.; Lu, Y.; Chai, J.; Sun, L. Catalytic application of layered double hydroxide-derived catalysts for the conversion of biomass-derived molecules. Catal. Sci. Technol. 2017, 7, 1622–1645. [Google Scholar] [CrossRef]
- Yan, K.; Chen, A. Efficient hydrogenation of biomass-derived furfural and levulinic acid on the facilely synthesized noble-metal-free Cu–Cr catalyst. Energy 2013, 58, 357–363. [Google Scholar] [CrossRef]
- Iqbal, S.; Liu, X.; Aldosari, O.F.; Miedziak, P.J.; Edwards, J.K.; Brett, G.L.; Akram, A.; King, G.M.; Davies, T.E.; Morgan, D.J.; et al. Conversion of furfuryl alcohol into 2-methylfuran at room temperature using Pd/TiO2 catalyst. Catal. Sci. Technol. 2014, 4, 2280–2286. [Google Scholar] [CrossRef]
- Vetere, V.; Merlo, A.B.; Ruggera, J.F.; Casella, M.L. Transition metal-based bimetallic catalysts for the chemoselective hydrogenation of furfuraldehyde. J. Braz. Chem. Soc. 2010, 21, 914–920. [Google Scholar] [CrossRef] [Green Version]
- Bhogeswararao, S.; Srinivas, D. Catalytic conversion of furfural to industrial chemicals over supported Pt and Pd catalysts. J. Catal. 2015, 327, 65–77. [Google Scholar] [CrossRef]
- Hronec, M.; Fulajtarová, K.; Liptaj, T. Effect of catalyst and solvent on the furan ring rearrangement to cyclopentanone. Appl. Catal. A Gen. 2012, 437–438, 104–111. [Google Scholar] [CrossRef]
- Patel, M.A.; Baldanza, M.A.S.; Teixeira da Silva, V.; Bridgwater, A.V. In situ catalytic upgrading of bio-oil using supported molybdenum carbide. Appl. Catal. A Gen. 2013, 458, 48–54. [Google Scholar] [CrossRef]
- Wang, F.; Xu, J.; Jiang, J.; Liu, P.; Li, F.; Ye, J.; Zhou, M. Hydrotreatment of vegetable oil for green diesel over activated carbon supported molybdenum carbide catalyst. Fuel 2018, 216, 738–746. [Google Scholar] [CrossRef]
- Cai, Z.; Wang, F.; Zhang, X.; Ahishakiye, R.; Xie, Y.; Shen, Y. Selective hydrodeoxygenation of guaiacol to phenolics over activated carbon supported molybdenum catalysts. Mol. Catal. 2017, 441, 28–34. [Google Scholar] [CrossRef]
- Chen, C.-J.; Lee, W.-S.; Bhan, A. Mo2C catalyzed vapor phase hydrodeoxygenation of lignin-derived phenolic compound mixtures to aromatics under ambient pressure. Appl. Catal. A Gen. 2016, 510, 42–48. [Google Scholar] [CrossRef]
- Xiong, K.; Lee, W.S.; Bhan, A.; Chen, J.G. Molybdenum carbide as a highly selective deoxygenation catalyst for converting furfural to 2-methylfuran. ChemSusChem 2014, 7, 2146–2149. [Google Scholar] [CrossRef] [PubMed]
- Xiong, K.; Yu, W.; Chen, J.G. Selective deoxygenation of aldehydes and alcohols on molybdenum carbide (Mo2C) surfaces. Appl. Surf. Sci. 2014, 323, 88–95. [Google Scholar] [CrossRef]
- Boullosa-Eiras, S.; Lødeng, R.; Bergem, H.; Stöcker, M.; Hannevold, L.; Blekkan, E.A. Catalytic hydrodeoxygenation (HDO) of phenol over supported molybdenum carbide, nitride, phosphide and oxide catalysts. Catal. Today 2014, 223, 44–53. [Google Scholar] [CrossRef]
- Lee, W.-S.; Wang, Z.; Zheng, W.; Vlachos, D.G.; Bhan, A. Vapor phase hydrodeoxygenation of furfural to 2-methylfuran on molybdenum carbide catalysts. Catal. Sci. Technol. 2014, 4, 2340–2352. [Google Scholar] [CrossRef]
- Ma, R.; Cui, K.; Yang, L.; Ma, X.; Li, Y. Selective catalytic conversion of guaiacol to phenols over a molybdenum carbide catalyst. Chem. Commun. 2015, 51, 10299–10301. [Google Scholar] [CrossRef] [PubMed]
- Dhandapani, B.; St. Clair, T.; Oyama, S.T. Simultaneous hydrodesulfurization, hydrodeoxygenation, and hydrogenation with molybdenum carbide. Appl. Catal. A Gen. 1998, 168, 219–228. [Google Scholar] [CrossRef]
- Wang, Y.-Y.; Ling, L.-L.; Jiang, H. Selective hydrogenation of lignin to produce chemical commodities by using a biochar supported Ni–Mo2C catalyst obtained from biomass. Green Chem. 2016, 18, 4032–4041. [Google Scholar] [CrossRef]
- Hartline, A.G.; Campbell, J.A.; Magel, T.T. Process for Reclaiming Cemented Metal Carbide. U.S. Patent 3,953,194 (A), 27 April 1976. [Google Scholar]
- Smirnov, A.A.; Geng, Z.; Khromova, S.A.; Zavarukhin, S.G.; Bulavchenko, O.A.; Saraev, A.A.; Kaichev, V.V.; Ermakov, D.Y.; Yakovlev, V.A. Nickel molybdenum carbides: Synthesis, characterization, and catalytic activity in hydrodeoxygenation of anisole and ethyl caprate. J. Catal. 2017, 354, 61–77. [Google Scholar] [CrossRef]
- Khromova, S.A.; Bykova, M.V.; Bulavchenko, O.A.; Ermakov, D.Y.; Saraev, A.A.; Kaichev, V.V.; Venderbosch, R.H.; Yakovlev, V.A. Furfural Hydrogenation to Furfuryl Alcohol over Bimetallic Ni–Cu Sol–Gel Catalyst: A Model Reaction for Conversion of Oxygenates in Pyrolysis Liquids. Top. Catal. 2016, 59, 1413–1423. [Google Scholar] [CrossRef]
- Capeletti, M.A.R.; Balzano, L.; de la Puente, G.; Laborde, M.; Sedran, U. Synthesis of acetal (1,1-diethoxyethane) from ethanol and acetaldehyde over acidic catalysts. Appl. Catal. A Gen. 2000, 198, L1–L4. [Google Scholar] [CrossRef]
- Bej, S.K.; Bennett, C.A.; Thompson, L.T. Acid and base characteristics of molybdenum carbide catalysts. Appl. Catal. A Gen. 2003, 250, 197–208. [Google Scholar] [CrossRef]
- Vitale, G.; Frauwallner, M.L.; Scott, C.E.; Pereira-Almao, P. Preparation and characterization of low-temperature nano-crystalline cubic molybdenum carbides and insights on their structures. Appl. Catal. A Gen. 2011, 408, 178–186. [Google Scholar] [CrossRef]
- Zhao, L.; Fang, K.; Jiang, D.; Li, D.; Sun, Y. Sol–gel derived Ni–Mo bimetallic carbide catalysts and their performance for CO hydrogenation. Catal. Today 2010, 158, 490–495. [Google Scholar] [CrossRef]
- Smirnov, A.A.; Khromova, S.A.; Ermakov, D.Y.; Bulavchenko, O.A.; Saraev, A.A.; Aleksandrov, P.V.; Kaichev, V.V.; Yakovlev, V.A. The composition of Ni-Mo phases obtained by NiMoOx-SiO2 reduction and their catalytic properties in anisole hydrogenation. Appl. Catal. A Gen. 2016, 514, 224–234. [Google Scholar] [CrossRef]
- Shi, Y.; Yang, Y.; Li, Y.-W.; Jiao, H. Mechanisms of Mo2C(101)-Catalyzed Furfural Selective Hydrodeoxygenation to 2-Methylfuran from Computation. ACS Catal. 2016, 6, 6790–6803. [Google Scholar] [CrossRef]
- Rodiansono, R.; Hara, T.; Shimazu, S. Total hydrogenation of biomass-derived furfural over raney nickel-clay nanocomposite catalysts. Indones. J. Chem. 2013, 13, 101–107. [Google Scholar] [CrossRef]
- Nakagawa, Y.; Nakazawa, H.; Watanabe, H.; Tomishige, K. Total Hydrogenation of Furfural over a Silica-Supported Nickel Catalyst Prepared by the Reduction of a Nickel Nitrate Precursor. ChemCatChem 2012, 4, 1791–1797. [Google Scholar] [CrossRef]
- Pushkarev, V.V.; Musselwhite, N.; An, K.; Alayoglu, S.; Somorjai, G.A. High structure sensitivity of vapor-phase furfural decarbonylation/hydrogenation reaction network as a function of size and shape of Pt nanoparticles. Nano Lett. 2012, 12, 5196–5201. [Google Scholar] [CrossRef] [PubMed]
- Villaverde, M.M.; Bertero, N.M.; Garetto, T.F.; Marchi, A.J. Selective liquid-phase hydrogenation of furfural to furfuryl alcohol over Cu-based catalysts. Catal. Today 2013, 213, 87–92. [Google Scholar] [CrossRef]
- Stux, A.M.; Laberty-Robert, C.; Swider-Lyons, K.E. Pechini synthesis and characterization of molybdenum carbide and nickel molybdenum carbide. J. Solid State Chem. 2008, 181, 2741–2747. [Google Scholar] [CrossRef]
- Rietveld, H. A profile refinement method for nuclear and magnetic structures. J. Appl. Crystallogr. 1969, 2, 65–71. [Google Scholar] [CrossRef] [Green Version]
- Scofield, J.H. Hartree-Slater subshell photoionization cross-sections at 1254 and 1487 eV. J. Electron Spectrosc. Relat. Phenom. 1976, 8, 129–137. [Google Scholar] [CrossRef]
- Shirley, D.A. High-resolution X-ray photoemission spectrum of the valence bands of gold. Phys. Rev. B 1972, 5, 4709. [Google Scholar] [CrossRef]
Figure 1.
Scheme of furfural hydrogenation over calcined catalyst MoC–SiO2 (700) at T = 150 °C, P = 6.0 MPa, mcat = 1.000 g, and furfural/isopropanol molar ratio equal to 0.033.
Figure 1.
Scheme of furfural hydrogenation over calcined catalyst MoC–SiO2 (700) at T = 150 °C, P = 6.0 MPa, mcat = 1.000 g, and furfural/isopropanol molar ratio equal to 0.033.

Figure 2.
A comparison of FA (a) and 2-MF (b) yields for the catalysts obtained under different temperature treatment regimes. Conditions of furfural hydrogenation: T = 150 °C, P = 6.0 MPa, mcat = 1.000 g, and furfural/isopropanol molar ratio equal to 0.033.
Figure 2.
A comparison of FA (a) and 2-MF (b) yields for the catalysts obtained under different temperature treatment regimes. Conditions of furfural hydrogenation: T = 150 °C, P = 6.0 MPa, mcat = 1.000 g, and furfural/isopropanol molar ratio equal to 0.033.

Figure 3.
XRD pattern of the calcined MoC–SiO2 (700) catalyst.

Figure 4.
XRD patterns of the calcined catalysts: (a) Ni0.5MoC–SiO2 (600); (b) Ni1MoC–SiO2 (600); (c) Ni2MoC–SiO2 (600); (d) Ni6MoC–SiO2 (600).
Figure 4.
XRD patterns of the calcined catalysts: (a) Ni0.5MoC–SiO2 (600); (b) Ni1MoC–SiO2 (600); (c) Ni2MoC–SiO2 (600); (d) Ni6MoC–SiO2 (600).

Figure 5.
XRD patterns of the calcined catalysts: (a) Ni0.5MoC–SiO2 (700); (b) Ni1MoC–SiO2 (700); (c) Ni2MoC–SiO2 (700); (d) Ni6MoC–SiO2 (700).
Figure 5.
XRD patterns of the calcined catalysts: (a) Ni0.5MoC–SiO2 (700); (b) Ni1MoC–SiO2 (700); (c) Ni2MoC–SiO2 (700); (d) Ni6MoC–SiO2 (700).

Figure 6.
XRD patterns of the calcined and reduced catalysts: (a) Ni0.5MoC–SiO2 (400/600); (b) Ni1MoC–SiO2 (400/600); (c) Ni2MoC–SiO2 (400/600); (d) Ni4MoC–SiO2 (400/600); (e) Ni6MoC–SiO2 (400/600).
Figure 6.
XRD patterns of the calcined and reduced catalysts: (a) Ni0.5MoC–SiO2 (400/600); (b) Ni1MoC–SiO2 (400/600); (c) Ni2MoC–SiO2 (400/600); (d) Ni4MoC–SiO2 (400/600); (e) Ni6MoC–SiO2 (400/600).

Figure 7.
Dependence of the total content of carbide phases on the atomic ratio x = Ni/Mo for the calcined and reduced NixMoC–SiO2 (400/600) catalysts.
Figure 7.
Dependence of the total content of carbide phases on the atomic ratio x = Ni/Mo for the calcined and reduced NixMoC–SiO2 (400/600) catalysts.

Figure 8.
Relation of the total carbon content and carbon content determined from XRD data with atomic ratio x = Ni/Mo for the calcined and reduced NixMoC–SiO2 (400/600) catalysts and calcined MoC–SiO2 (700) catalyst.
Figure 8.
Relation of the total carbon content and carbon content determined from XRD data with atomic ratio x = Ni/Mo for the calcined and reduced NixMoC–SiO2 (400/600) catalysts and calcined MoC–SiO2 (700) catalyst.

Figure 9.
TEM images of the reduced Ni1MoC–SiO2 (400/600) catalyst with corresponding EDX patterns.

Figure 10.
Dependence of reagent and products concentrations on the reaction time for the calcined and reduced NixMoC–SiO2 (400/600) catalysts: (a) Ni0.5MoC–SiO2 (400/600); (b) Ni1MoC–SiO2 (400/600), (c) Ni2MoC–SiO2 (400/600); (d) Ni4MoC–SiO2 (400/600), (e) Ni6MoC–SiO2 (400/600); symbols—experimental data, lines—calculated data; reaction conditions: T = 150 °C, P = 6.0 MPa, mcat = 1.000 g, and furfural/isopropanol molar ratio equal to 0.033.

Figure 11.
Scheme of furfural hydrogenation over calcined and reduced NixMoC–SiO2 (400/600) catalysts at T = 150 °C, P = 6.0 MPa, mcat = 1.000 g, and furfural/isopropanol molar ratio equal to 0.033.
Figure 11.
Scheme of furfural hydrogenation over calcined and reduced NixMoC–SiO2 (400/600) catalysts at T = 150 °C, P = 6.0 MPa, mcat = 1.000 g, and furfural/isopropanol molar ratio equal to 0.033.

Figure 12.
Dependence of the reaction rate constant k0 for different calcined and reduced catalysts NixMoC–SiO2 (400/600) and calcined sample MoC–SiO2 (700) on the atomic ratio x = Ni/Mo. Reaction conditions: T = 150 °C, P = 6.0 MPa, mcat = 1.000 g, and furfural/isopropanol molar ratio equal to 0.033.

Figure 13.
Dependence of selectivity for 2-MF and THFA formation from FA on the atomic ratio x = Ni/Mo. Reaction conditions: T = 150 °C, P = 6.0 MPa, mcat = 1.000 g, and furfural/isopropanol molar ratio equal to 0.033.
Figure 13.
Dependence of selectivity for 2-MF and THFA formation from FA on the atomic ratio x = Ni/Mo. Reaction conditions: T = 150 °C, P = 6.0 MPa, mcat = 1.000 g, and furfural/isopropanol molar ratio equal to 0.033.

Figure 14.
Relation of the selectivity for 2-MF formation from FA with the surface nickel content.


Table 1.
The results of furfural hydrogenation over Ni–Mo carbide systems synthesized under various heat treatment conditions. Reaction conditions: T = 150 °C, P = 6.0 MPa, mcat = 1.000 g, and furfural/isopropanol molar ratio equal to 0.033.
Table 1.
The results of furfural hydrogenation over Ni–Mo carbide systems synthesized under various heat treatment conditions. Reaction conditions: T = 150 °C, P = 6.0 MPa, mcat = 1.000 g, and furfural/isopropanol molar ratio equal to 0.033.
| Entry | Catalyst | Contact Time, Min | Furfural Conversion, mol % | Yields of Reaction Products, mol % | |||
|---|---|---|---|---|---|---|---|
| FA | 2-MF | THFA | 2-MTHF | ||||
| 1 | Ni0.5MoC–SiO2 (600) | 180 | 58 | 54 | 4 | - | - |
| 2 | Ni1MoC–SiO2 (600) | 60 | 92 | 70 | 9 | 12 | 1 |
| 3 | Ni2MoC–SiO2 (600) | 20 | 79 | 40 | 15 | 22 | 2 |
| 4 | Ni6MoC–SiO2 (600) | 40 | 66 | 34 | 7 | 23 | 2 |
| 5 | Ni0.5MoC–SiO2 (700) | 140 | 95 | 67 | 15 | 12 | 1 |
| 6 | Ni1MoC–SiO2 (700) | 80 | 85 | 56 | 16 | 11 | 2 |
| 7 | Ni2MoC–SiO2 (700) | 30 | 86 | 58 | 6 | 20 | 2 |
| 8 | Ni6MoC–SiO2 (700) | 20 | 89 | 41 | 10 | 30 | 2 |
| 9 | Ni0.5MoC–SiO2 (400/600) | 210 | 69 | 55 | 14 | - | - |
| 10 | Ni1MoC–SiO2 (400/600) | 210 | 91 | 60 | 29 | 2 | - |
| 11 | Ni2MoC–SiO2 (400/600) | 140 | 82 | 71 | 7 | 4 | - |
| 12 | Ni4MoC–SiO2 (400/600) | 140 | 95 | 76 | 5 | 14 | - |
| 13 | Ni6MoC–SiO2 (400/600) | 80 | 94 | 80 | 4 | 9 | 1 |
Table 2.
Phase composition and average crystallite sizes for calcined NixMoC–SiO2 (600) catalysts.
| Catalyst | Ni Content, wt % | Average Crystallite Size of Ni, Å | Ni Content, wt % | Average Crystallite Size of NiO, Å |
|---|---|---|---|---|
| Ni0.5MoC–SiO2 (600) | 25 | 100 | 75 | 35 |
| Ni1MoC–SiO2 (600) | 40 | 115 | 60 | 25 |
| Ni2MoC–SiO2 (600) | 40 | 130 | 60 | 27 |
| Ni6MoC–SiO2 (600) | 88 | 85 | 12 | 45 |
Table 3.
Phase composition of the calcined NixMoC–SiO2 (700) catalysts.
| Catalyst | Phase | Content of Phase, wt % | Average Crystallite Size, Å | Lattice Parameter of Ni–Mo alloy, Å |
|---|---|---|---|---|
| Ni0.5MoC–SiO2 (700) | hcp-Mo2C | 23 | 160 | |
| fcc-MoC1−x | 49 | – | ||
| Ni0.91Mo0.09 | 28 | 150 | 3.559 | |
| Ni1MoC–SiO2 (700) | hcp-Mo2C | 30 | 400 | |
| fcc-MoC1−x | 34 | – | ||
| Ni0.92Mo0.08 | 36 | 350 | 3.558 | |
| Ni2MoC–SiO2 (700) | hcp-Mo2C | 29 | 630 | |
| fcc-MoC1−x | 8 | – | ||
| Ni0.92Mo0.08 | 63 | 220 | 3.556 | |
| Ni6MoC–SiO2 (700) | hcp-Mo2C | 4 | 250 | |
| fcc-MoC1−x | 19 | – | ||
| Ni0.93Mo0.07 | 77 | 130 | 3.554 |
Table 4.
Phase composition of the calcined and reduced NixMoC–SiO2 (400/600) catalysts.
| Catalyst | Phase | Content of Phase, wt % | Average Crystallite Size, Å | Lattice Parameter of Ni–Mo alloy, Å |
|---|---|---|---|---|
| Ni0.5MoC–SiO2 (400/600) | hcp-Mo2C | 17 | - | 3.586 |
| fcc-MoC1−x | 51 | - | ||
| Mo3СNi2 | 4 | - | ||
| Ni0.84Mo0.16 | 28 | 70 | ||
| Ni1MoC–SiO2 (400/600) | hcp-Mo2C | 17 | 220 | 3.573 |
| fcc-MoC1−x | 0 | – | ||
| Mo3СNi2 | 41 | 350 | ||
| Ni0.88Mo0.12 | 42 | 160 | ||
| Ni2MoC–SiO2 (400/600) | hcp-Mo2C | 14 | 170 | 3.577 |
| fcc-MoC1−x | 0 | - | ||
| Mo3СNi2 | 2 | - | ||
| Ni0.87Mo0.13 | 84 | 110 | ||
| Ni4MoC–SiO2 (400/600) | hcp-Mo2C | 8 | 220 | 3.576 |
| fcc-MoC1−x | 0 | - | ||
| Mo3СNi2 | 2 | - | ||
| Ni0.87Mo0.13 | 90 | 160 | ||
| Ni6MoC–SiO2 (400/600) | hcp-Mo2C | 1 | - | 3.580 3.545 |
| fcc-MoC1−x | 0 | - | ||
| Mo3СNi2 | 3 | - | ||
| Ni0.86Mo0.14 | 65 | 160 | ||
| Ni0.95Mo0.05 | 31 | 680 |
Table 5.
The number of active sites in calcined and reduced NixMoC–SiO2 (400/600) catalysts.
| Catalyst | The Number of Active Sites Determined by CO Chemisorption, μmol/g |
|---|---|
| Ni0.5MoC–SiO2 | 90.4 |
| Ni1MoC–SiO2 | 64.7 |
| Ni2MoC–SiO2 | 65.5 |
| Ni4MoC–SiO2 | 8.0 |
| Ni6MoC–SiO2 | 11.9 |
Table 6.
The total surface area ABET, the average pore size D and the total pore volume V for the calcined and reduced NixMoC–SiO2 (400/600) catalysts.
Table 6.
The total surface area ABET, the average pore size D and the total pore volume V for the calcined and reduced NixMoC–SiO2 (400/600) catalysts.
| Catalyst | ABET, m2/g | V, cm3/g | D, nm |
|---|---|---|---|
| Ni0.5MoC–SiO2 (400/600) | 11.29 | 0.0149 | 5.27 |
| Ni1MoC–SiO2 (400/600) | 11.35 | 0.0189 | 6.67 |
| Ni2MoC–SiO2 (400/600) | 27.75 | 0.0307 | 4.42 |
| Ni4MoC–SiO2 (400/600) | 43.43 | 0.0512 | 4.71 |
| Ni6MoC–SiO2 (400/600) | 23.17 | 0.0574 | 9.91 |
Table 7.
XPS data and atomic ratio of elements on the surface of the calcined and reduced NixMoC–SiO2 (400/600) catalysts.
Table 7.
XPS data and atomic ratio of elements on the surface of the calcined and reduced NixMoC–SiO2 (400/600) catalysts.
| Catalyst | Ni/Si | Mo/Si | O/Si | C/Si | Ni/Mo |
|---|---|---|---|---|---|
| Ni1MoC–SiO2 (400/600) | 0.87 | 3.04 | 4.84 | 2.02 | 0.29 |
| Ni2MoC–SiO2 (400/600) | 0.69 | 1.08 | 2.75 | 2.24 | 0.65 |
| Ni4MoC–SiO2 (400/600) | 0.45 | 0.24 | 1.55 | 0.20 | 1.50 |
| Ni6MoC–SiO2 (400/600) | 0.77 | 0.18 | 1.54 | 0.34 | 4.56 |
Table 8.
Reaction rate constants of the furfural conversion over calcined and reduced NixMoC–SiO2 (400/600) catalysts at T = 150 °C, P = 6.0 MPa, mcat = 1.000 g, and furfural/isopropanol molar ratio equal to 0.033.
Table 8.
Reaction rate constants of the furfural conversion over calcined and reduced NixMoC–SiO2 (400/600) catalysts at T = 150 °C, P = 6.0 MPa, mcat = 1.000 g, and furfural/isopropanol molar ratio equal to 0.033.
| Catalyst | k0·103, min−1 | k1·103, min−1 | k2·103, min−1 | k3·103, min−1 |
|---|---|---|---|---|
| Ni0.5MoC–SiO2 | 3.4 ± 0.1 | – | 3.6 ± 0.7 | – |
| Ni1MoC–SiO2 | 5.3 ± 0.1 | – | 3.2 ± 0.5 | – |
| Ni2MoC–SiO2 | 15 ± 0.6 | 1.1 ± 0.2 | 2.6 ± 0.3 | – |
| Ni4MoC–SiO2 | 21 ± 0.5 | 1.6 ± 0.2 | 1.3 ± 0.1 | – |
| Ni6MoC–SiO2 | 39 ± 2 | 2.4 ± 0.2 | 1.3 ± 0.2 | 2.4 ± 0.2 |
Table 9.
TOF values for calcined and reduced NixMoC–SiO2 (400/600) catalysts. Reaction conditions: T = 150 °C, P = 6.0 MPa, mcat = 1.000 g, and furfural/isopropanol molar ratio equal to 0.033.
Table 9.
TOF values for calcined and reduced NixMoC–SiO2 (400/600) catalysts. Reaction conditions: T = 150 °C, P = 6.0 MPa, mcat = 1.000 g, and furfural/isopropanol molar ratio equal to 0.033.
| Catalyst | TOF, s−1 |
|---|---|
| Ni0.5MoC–SiO2 | 0.016 ± 0.001 |
| Ni1MoC–SiO2 | 0.035 ± 0.001 |
| Ni2MoC–SiO2 | 0.097 ± 0.004 |
| Ni4MoC–SiO2 | 1.11 ± 0.03 |
| Ni6MoC–SiO2 | 1.39 ± 0.07 |
© 2018 by the authors. Licensee MDPI, Basel, Switzerland. This article is an open access article distributed under the terms and conditions of the Creative Commons Attribution (CC BY) license (http://creativecommons.org/licenses/by/4.0/).
Share and Cite
MDPI and ACS Style
Shilov, I.N.; Smirnov, A.A.; Bulavchenko, O.A.; Yakovlev, V.A. Effect of Ni–Mo Carbide Catalyst Formation on Furfural Hydrogenation. Catalysts 2018, 8, 560. https://doi.org/10.3390/catal8110560
AMA Style
Shilov IN, Smirnov AA, Bulavchenko OA, Yakovlev VA. Effect of Ni–Mo Carbide Catalyst Formation on Furfural Hydrogenation. Catalysts. 2018; 8(11):560. https://doi.org/10.3390/catal8110560
Chicago/Turabian StyleShilov, Ivan N., Andrey A. Smirnov, Olga A. Bulavchenko, and Vadim A. Yakovlev. 2018. "Effect of Ni–Mo Carbide Catalyst Formation on Furfural Hydrogenation" Catalysts 8, no. 11: 560. https://doi.org/10.3390/catal8110560
Note that from the first issue of 2016, this journal uses article numbers instead of page numbers. See further details here.