Article

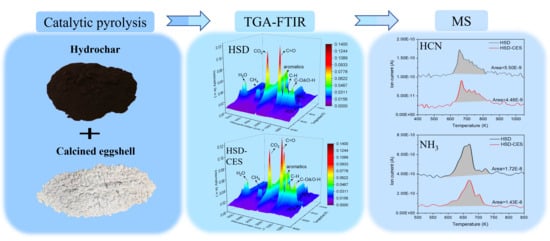
Catalytic Pyrolysis of Hydrochar by Calcined Eggshells for Bioenergy Production: Improved Thermo-Kinetic Studies and Reduced Pollutant Emissions

1
Research Center for Eco-Environmental Sciences, Chinese Academy of Sciences, 18 Shuangqing Road, Beijing 100085, China
2
University of Chinese Academy of Sciences, Beijing 100049, China
*
Author to whom correspondence should be addressed.
Catalysts 2023, 13(9), 1297; https://doi.org/10.3390/catal13091297
Submission received: 23 July 2023 / Revised: 7 September 2023 / Accepted: 11 September 2023 / Published: 14 September 2023
(This article belongs to the Special Issue Catalytic Conversion of Low Carbon Energy)

Abstract

:
Bioenergy production from hydrochar via catalytic thermal conversion is of increasing importance to easing the energy shortage. The catalytic pyrolysis characteristics of hydrochar derived from sawdust (HSD) with calcined eggshell (CES) were investigated by the thermogravimetric–Fourier transform infrared spectroscopy–mass spectrometry (TG-FTIR-MS) method. Kinetic and thermodynamic parameters were determined by two iso-conversional model-free methods, namely, Kissinger–Akahira–Sunose (KAS) and Flynn–Wall–Ozawa (FWO). The results demonstrated that HSD exhibited a high fuel quality, with elevated carbon content (54.03%) and an increased high calorific value (21.65 MJ Kg−1). CES significantly enhanced the pyrolysis behavior of HSD by promoting the secondary cracking of organic vapors under the synergistic effect of CaO and mineral elements. Compared to non-catalytic pyrolysis, the residual mass and average activation energy of HSD-CES decreased by 29.61% and 14.10%, respectively, and the gaseous products of H2 and CO from HSD-CES increased by 26.14% and 22.94%, respectively. Furthermore, the participation of CES effectively suppressed the emission of pollutants in the HSD pyrolysis process, with a 27.13% reduction in CH4, a 22.76% reduction in HCN, and a 20.28% reduction in NH3. This study provides valuable guidance on the potential use of hydrochar for renewable energy production.

Graphical Abstract

1. Introduction

With the growing global population and rapid industrial progress, there is a marked increase in demand for non-renewable resources such as coal and petroleum. However, the over-reliance on fossil fuels causes resource depletion and serious environmental problems. As a result, there is an urgent need for the development of clean and renewable energy sources. Biomass energy is the fourth-largest source of energy worldwide, producing an annual output of 146 billion tons [1], and offers significant advantages in terms of cleanliness and renewability. The efficient development of biomass energy can help alleviate the global energy and environmental crisis and lead to the achievement of carbon neutrality [2,3]. Currently, approximately 232 million m3 of wood residue is produced annually worldwide, and it has become a promising biomass resource that might be used as an alternative to fossil fuels [4,5]. Nonetheless, its utilization is impeded due to its high moisture content, low energy density, and low accumulation density. Hydrothermal carbonization (HTC) is a simple pretreatment technology that upgrades waste biomass into materials with high fuel quality, promising to increase the practical application value of wood residues [6]. For example, hydrochar prepared from sawdust had a 39% higher high calorific value (HHV) and 44% higher carbon content compared to the parent biomass [7]. In addition, HTC technology is anticipated to increase the stacking accumulation of wood residues and reduce storage and transportation costs [8].
Pyrolysis is an ideal pathway for the production of energy, fuels, and value-added chemicals. In contrast to the direct pyrolysis of raw biomass, the direct pyrolysis of hydrochar exhibited several advantages, including reduced energy consumption, enhanced thermal efficiency, and optimized composition of gas products [7,9]. In addition, compared with non-catalytic pyrolysis, the appropriate catalyst could further reduce energy input and time consumption and improve the quality of products [10,11,12]. For example, the catalytic co-pyrolysis behavior of chlorella and polyethylene was investigated by a thermogravimetric analyzer [13]. The results showed that the activation energy decreased dramatically, from 144.93–225.84 kJ/mol (without catalyst) to 75.37–76.90 kJ/mol with the use of HZSM-5/LS catalysts. In addition, catalysts such as Ni-Ca2SiO4 have been demonstrated to promote the fracture of light organic molecules, reduce the activation energy, and increase the yields of H2 and CO [14]. Despite the many advantages of catalysts, most of them face challenges such as high cost, complex preparation processes, and susceptibility to deactivation [15]. One emerging solution is the use of solid wastes as heterogeneous catalysts, which can significantly reduce costs and promote sustainable fuel production.
Eggshells are a typical food waste and are generated in large quantities by food-processing and manufacturing facilities. It is estimated that over 250,000 tons of eggshells are discarded in landfills annually without any pre-treatment, resulting in a series of environmental issues [16]. The primary component of eggshells is calcium carbonate, followed by proteins and other mineral elements. When subjected to high-temperature calcination, eggshells can be easily transformed into valuable calcium-based catalysts [17]. Studies have shown that calcium-based catalysts have had a positive effect on the thermal conversion of biomass. For example, calcined eggshell (CESs) and CaO showed a significant catalytic effect on tar cracking/reforming, deoxidation, and deacidification, and had a good selectivity for high-value gas products such as H2 and CO [18,19]. Therefore, it is expected that CESs can serve as an effective catalyst for hydrochar energy conversion, offering environmental and economic benefits.
In this study, the catalytic pyrolysis of hydrochar derived from sawdust (HSD) was carried out by thermogravimetric–Fourier transform infrared spectroscopy–mass spectrometry (TG-FTIR-MS), using calcined eggshell (CES) as a catalyst. The main objectives are as follows: (1) to reveal the effect of CES on the behavior of HSD pyrolysis; (2) to analyze the effect of CES on the kinetics and thermodynamics of the HSD pyrolysis reaction; and (3) to assess the role of CES on gas evolution and pollutant emissions during HSD catalytic pyrolysis. This study would provide valuable insights into the effective utilization of hydrochar for renewable energy production.

2. Results and Discussion

2.1. Characterization of Hydrochar

The proximate analysis, ultimate analysis, and HHV of HSD are shown in Table 1. Compared with SD, the volatile matter content, H/C, and O/C of HSD decreased, while the fixed carbon content increased significantly. Moreover, the HHV of HSD was increased from 18.86 to 21.65 MJ Kg−1 compared to SD. These findings demonstrated that HSD exhibited a higher fuel quality and holds potential as a solid fuel for bioenergy production. The N and S concentration in HSD was slightly elevated compared to that of SD, while they were significantly lower than those values found in hydrochar derived from other raw materials, such as municipal sludge and rice husks [20,21]. Consequently, the reduction of harmful emissions during HSD pyrolysis was expected, further indicating that it was a suitable candidate for solid fuel.

2.2. Effect of Catalyst on Thermal Decomposition Behavior of Hydrochar

The TG and DTG curves obtained from the catalytic pyrolysis of HSD by CES and CaO at different heating rates are shown in Figure 1, and the corresponding characteristic parameters are listed in Table 2. As illustrated in Figure 1a, the thermal decomposition of HSD was observed to take place in three stages. The first stage, between 329 K and 450 K, involved water evaporation. The second phase, between 450 K and 691 K, was the rapid-weight-loss phase (around 51.34%), corresponding to the maximum weight-loss peak of the DTG curve (Figure 1b). This phase mainly involved the volatile release due to the thermal decomposition of hemicellulose, cellulose, and some lignin. The last stage was marked by a slow weight loss (around 17.69%), due to the chemical bonds of phenol, benzene, and other aromatic rings in lignin being resistant to breakage [22].
The pyrolytic behavior of HSD was significantly altered due to the addition of CES and CaO, as shown in Figure 1c,e. Two new weight-loss peaks, located around 700 K and 900 K, were visualized in the DTG spectra of HSD-CES and HSD-CaO, respectively (Figure 1d,f). Two new weight-loss peaks of HSD-CES were mainly attributed to the secondary cleavage reaction of some volatile compounds, including aromatic ring skeleton, carboxylic acids, phenols, ethers, and ketones. These reactions were predominantly triggered by the presence of CaO [23], which served as the principal constituent of CES. As revealed by XRD patterns (Figure 2), the peak of CES was comparable to that of standard CaO, suggesting that the composition of CES had changed from CaCO3 to CaO. It was noteworthy that the signal intensity of all weight-loss peaks of HSD-CES was higher than that of HSD-CaO, indicating that CES had a better catalytic effect than CaO. This was attributed to the presence of other mineral components in CES, such as Na and K, which could effectively promote the cleavage of macromolecules [24]. Therefore, the higher catalytic ability of CES led to the lowest residual mass of HSD-CES compared to HSD and HSD-CaO. For example, at a heating rate of 20 K/min, the residual mass of HSD-CES was 22.63%, which was 19.80% lower than that of HSD-CaO, and 29.61% lower than that of HSD. In both catalytic pyrolysis and non-catalytic pyrolysis reactions of HSD, the heating rate mainly affected the maximum weight loss rate (-RP) of the reaction, and as the heating rate increased, the -RP also was increased due to the heightened thermal energy [25].

2.3. Kinetic Analysis

Conducting a thorough investigation into the kinetics of hydrochar catalytic pyrolysis was vital for its process design and large-scale production. The FWO and KAS model-free methods were utilized to conduct a kinetic analysis of the catalytic pyrolysis of HSD at a range of heating rates. As depicted in Figure 3, the E A   value for all samples at varying heating rates was determined by the slopes of curves drawn by ln ( β ) and ln ( β T ) with 1 T , based on a specified conversion degree ( α ). The detailed kinetic parameters, including E A and regression coefficient ( R 2 ), are listed in Table 3. The R 2 value, which represented the degree of agreement between the test data and the fitted function, exceeded 96.7% for each experiment, confirming the high accuracy and significance of the model.
The E A value varied with the conversion rate, indicating that HSD had a complex structure and pyrolysis process [26]. The ranges of E A for non-catalytic pyrolysis of HSD, as measured by FWO and KAS models, were 196.07–231.71 kJ mol−1 and 196.03–230.77 kJ mol−1, respectively. On the other hand, the E A ranges of HSD-CaO calculated by the FWO and KAS models were 191.25–208.49 mol−1 and 190.89–207.98 kJ mol−1, respectively. For HSD-CES, it was 171.73–199.2 kJ mol−1 and 170.43–198.27 kJ mol−1, respectively. The E A values calculated by the two methods were close to each other, which verified the accuracy and reliability of the obtained E A values for HSD catalytic pyrolysis. The minimum value of E A for the non-catalytic pyrolysis reaction occurred when α = 0.5 , whereas catalytic pyrolysis occurred when α = 0.2 . With the increase of the E A value, the reaction rate was accelerated, but the energy required in the pyrolysis process was also increased. The average E A values, as determined by FWO and KAS, of HSD-CES were 180.80 kJ mol−1 and 179.44 kJ mol−1, respectively, which, together, were 14.10% lower than the values for non-catalyzed pyrolysis. Therefore, minimal energy consumption was expected when using CES as a catalyst for catalytic pyrolysis of hydrochar, which facilitated the development of hydrochar energy conversion.

2.4. Thermodynamics Analysis

The thermodynamic parameters, such as A , Δ H , and Δ G , of HSD in non-catalytic pyrolysis and catalytic pyrolysis reactions were determined and are presented in Table 3. The average value of A for HSD was calculated to be 9.67 × 10¹⁷ s−1, revealing that complex reactions took place during pyrolysis, which required high levels of energy consumption [27]. When CaO and CES were added to the pyrolysis reaction, the average value of A decreased significantly, especially for CES, which fell to as low as 2.14 × 10¹⁵ s−1, indicating that CES could convert the complex reaction into a semi-simple-complex reaction and reduce the energy input [28]. Both Δ H and Δ G reflected the energy consumption during HSD pyrolysis, a value which decreased significantly for catalytic pyrolysis compared to non-catalytic pyrolysis. For example, the average values of Δ H and Δ G for HSD-CES were calculated by FWO to be only 175.40 kJ mol−1 and 169.25 kJ mol−1, respectively, demonstrating that CES had a stronger catalytic ability. Δ S was a direct measure of the disorder degree in the system and is visualized in Figure 4. In the absence of a catalyst, the pyrolysis reaction of HSD had positive Δ S throughout the conversion range, and the same observation was obtained when CaO was used as a catalyst. However, under certain conditions ( α = 0.2 ~ 0.5 ), the Δ S value of the HSD pyrolysis reaction was negative when using CES as the catalyst. The negative values of Δ S indicated that CES had a stronger catalytic capacity and prompted HSD pyrolysis to produce more volatiles, resulting in reduced yields of liquid and solid products with more “organized” structure than those reactions without catalyst and with the presence of CaO [28,29].

2.5. Effect of Catalyst on Gas Evolution

The FTIR technique was used to analyze the gas evolution during HSD pyrolysis at a heat rate of 20 K min−1, as presented in Table 4 and Figure 5. As shown in Figure 5a, the gas production was mainly concentrated between 500–750 K, corresponding to the weight-loss peak in the DTG profile. In this temperature interval, several distinct absorption bands were detected in the order of 3750–3500 cm−1 (H2O), 3050–2700 cm−1 (CH4), 2400–2250 cm−1 (CO2), 2250–2050 cm−1 (CO), 1800–1650 cm−1 (C=O), 1600–1450 cm−1 (aromatics skeletal), 1425–1305 cm−1 (C-H), 1300–1000 cm−1 (C-O and O-H), 968–965 cm−1 (NH3), and 720–710 cm−1 (HCN) [30]. The addition of a catalyst did not change the gas type, but had a significant effect on the gas content and distribution, as shown in Figure 5b,c. For example, the addition of CES and CaO significantly changed the evolution of CO2, which was distributed in two temperature intervals, 600–700 K and 850–1000 K. The first peak was derived from the fracture and reforming of carbonyl or carboxyl groups, and the second peak was generated from the secondary cleavage of volatiles and the high-temperature decomposition of CaCO3. In addition, the overall peak intensities, in the range of 1800–1000 cm−1, conformed to the pattern of HSD-CES > HSD-CaO > HSD. These peaks originated mainly from the decomposition of cellulose, hemicellulose, and lignin to produce aromatic skeletons, carboxylic acids, aldehydes, phenols, alcohols, and ethers, and these molecules would further cleave to gas products or condense to tar [31,32].
Due to the simultaneous evolution of multiple volatile compounds with similar chemical structures, it was difficult to accurately analyze a particular species by FTIR spectroscopy; therefore, MS spectrometry was combined with the existing method to determine the relative content of a specific species. In the non-catalytic and catalytic HSD pyrolysis processes, four typical gas products and two nitrogen-containing harmful substances were mainly involved. Ionization fragments of H2, CH4, CO, CO2, NH3, and HCN were detected, with corresponding mass-to-charge (m/z) values of 2, 16, 28, 44, 17, and 27, respectively. As shown in Figure 6a, the CO yield of HSD-CES increased by 22.94% and 18.82% compared to HSD and HSD-CaO, respectively, indicating that CES could effectively promote the secondary cracking of volatiles and char residues. Similarly, the H2 content (Figure 6b) of HSD-CES was improved by 26.14% and 16.22% compared to HSD and HSD-CaO, respectively, which was attributed to the enhanced water–gas shift reaction, proving that CES upgraded the quality of gas products. Additionally, the total CO2 output (Figure 6c) of HSD-CES was higher than that of HSD and HSD-CAO, which proved that CES promoted the reforming of carbonyl or carboxyl groups and the secondary cracking of volatiles at high temperatures. It was noteworthy that the content of CH4 (Figure 6d) significantly decreased with the addition of catalysts, particularly CES, which reduced it by 27.13%. CH4 was mainly derived from the demethylation of methoxyl and acetyl groups and the breakdown of long chains caused by the thermal cracking of hydrocarbon oligomers in HSD [33]. The decrease in CH4 was beneficial in slowing down global warming and improving the value of pyrolysis products.
The environmental hazards of the N element have often been ignored; therefore, the effects of catalysts on harmful substances (HCN) and NOx precursor (NH3) were investigated in detail, as shown in Figure 6e,f. Compared with non-catalytic pyrolysis, the addition of CES could reduce the content of HCN and NH3 by 22.76% and 20.28%, respectively, by inhibiting the decarboxylation, dehydrogenation, and deamination of amide-N. This resulted in amide-N being easily converted into pyrrolic-N and pyridinic-N, which remained in the char and provided nutrients for plants when used as soil. It was noted that HCN or NH3 could react with CaO to form CaCxNy and H2/CO, which could be further decomposed harmlessly into N2 at 723 K [34].
The above assessment elucidated the reaction mechanism of catalytic pyrolysis of HSD by CES. The addition of CES effectively promoted the dehydration, decarboxylation, and chain-breaking of lignin, cellulose, and hemicellulose in HSD, and released more volatile matter, including aromatic ring skeleton, carboxylic acids, phenols, ethers, and ketones. Subsequently, the volatile matter and char residues performed a secondary cracking reaction in the presence of CaO and mineral components in the CES catalyst to produce light organic compounds. These light organic compounds were further cracked and reformed to produce H2, CO2, CO, CH4, and small-molecule hydrocarbons. In addition, CES reduced HCN and NH3 emissions during pyrolysis by inhibiting the decarboxylation, dehydrogenation, and deamination of amide-N.

3. Experimental Design

3.1. Hydrochar Preparation

The hydrochar feedstock used in this study was pinewood sawdust (SD) obtained from a furniture processing plant located in Shandong Province. Around 10 g SD was mixed with 50 mL ultrapure water in a 100-mL stainless autoclave, which was then heated at 493 K and autogenous pressure was sustained for 2 h. After the reactor temperature gradually dropped to room temperature, the resulting mixture was collected and underwent vacuum filtration to obtain hydrochar. The prepared hydrochar (HSD) was dried, ground, and passed through a 200-mesh sieve for further pyrolysis experiments. The yield of the HSD was determined to be 56% on a dry basis.

3.2. Catalyst Preparation

The eggshell used in this study was obtained from a breakfast shop in Beijing. Before use, the eggshells were thoroughly washed with ultrapure water to remove surface impurities, then crushed and sieved through a 200-mesh sieve and calcined in a tube furnace at 1173 K for 2 h under an inert atmosphere. The final product was labeled as CES. As a comparison, high-grade pure commercial CaO was supplied by Sinopec Chemical Reagent Co. LTD.,Shanghai, China.

3.3. Characterization

The proximate analysis was conducted according to the standard GB/T28731-2012 [35]. An elemental analyzer (Flash Smart CHNS/O, Thermo Fisher Scientific, Waltham, MA, USA) was used to determine the contents of C, H, O, N, and S. The HHV was measured via an oxygen bomb calorimeter (DY-ZDHW-6, Hebi Daewoo Instrument Co., Ltd., Hebei, China). The chemical structure of samples was determined from 400–4000 cm−1 by Fourier transform infrared spectroscopy (FTIR, Nicolet 8700, Thermo Fisher Scientific, Waltham, MA, USA). The element content was analyzed using an inductively coupled plasma optical emission spectrometer (ICP-OES, PerkinElmer, Waltham, MA, USA). Before analysis, 0.1 g of CES was digested on a heated plate with an HNO3/H2O2 mixture (1:1) and then determined by ICP-OES. The crystalline structures were characterized by X-ray diffraction (XRD, Bruker Advance D8 diffractometer, Karlsruhe, Germany) with Cu Kα radiation and scanned in the 2θ range of 10–90° with a rate of 5° min−1.

3.4. TG-FTIR-MS Analysis

The catalyst pyrolysis experiment of hydrochar was conducted using a thermogravimetric analyzer (STA 449F3, Netzsch, Germany) coupled with an FTIR spectrophotometer (Nicolet iS10, Bruker, Germany) and MS (QMS 403, Netzsch, Germany). Before initiation of the reaction, a 100 mL min−1 argon flow was introduced into the TG at room temperature for 10 min to eliminate air and unexpected impurities from the reactor. Each experiment employed approximately 15 mg of HSD and 5 mg of catalysts added to a crucible (99% Al2O3) and heated from 313 K to 1173 K at varying heating rates of 10 to 40 K min−1 with an argon flow rate of 200 mL min−1. The TG, FTIR, and MS link channels and gas cells were maintained at 473 K to prevent gas condensation. FTIR detected gas approximately every seven seconds in the wave number range of 4000–400 cm−1, while pyrolysis products were analyzed by MS every one second. Each experiment was repeated three times to ensure reliable results.

3.5. Kinetic and Thermodynamic Analysis

To analyze TGA data, the iso-conversional model-free approach was adopted, and the Arrhenius equation was utilized. It was assumed that converting raw materials to products was only a one-step process. Therefore, according to Arrhenius, the reaction rate constant k can be defined as:
k = k 0 e ( E R T )
where k 0 and T represent exponential prefactor (min−1) and absolute temperature (K), and R and E are the gas constant (8.314 J mol−1 K−1) and activation energy (kJ mol−1), respectively. For hydrochar volatilization, the rate equation is:
d x d t = k f x
where x and t represent the conversion rate of reactant and time, respectively. The conversion factor of hydrochar pyrolysis is related to temperature. Therefore, the conversion factor can be expressed as:
x = α 0 α t α 0 α f
where α 0 , α t , and α f are the mass of hydrochar at the beginning, a specific time, and the end of the pyrolysis reaction. According to Equations (1) and (2), we get:
d x d t = k 0 e ( E R T ) f ( x )
Based on the uniform dynamic reaction of samples, f ( x ) can be expressed as:
f ( x ) = ( 1 - x ) n
δ is the heating rate. δ is expressed as:
δ = d T d t = d T d x × d x d t
Combining Equations (4)–(6), we determine that:
d x ( 1 x ) n = k 0 δ e ( E R T ) d T
Equation (7) represents the transformation of hydrochar with temperature. By integrating Equation (7), we determine the following:
g κ = 0 x d x f ( x ) = 0 T A δ e ( E R T ) d T
where g κ is the integral form of f ( x ) .

3.5.1. Model-Free Methods

The Flynn–Wall–Ozawa (FWO) approach is a widely utilized iso-conversional method that does not require an assumption of an order of reaction and can encompass various degrees of mass conversion. In this study, Doyle’s approximation was employed to derive the kinetic parameters of hydrochar pyrolysis, specifically, the activation energy, utilizing the FWO methodology.
ln δ = ln A E R g x 2.315 0.457 E R T
The graphs of ln δ   and 1 T   at different heating rates provide parallel lines of 0–1 conversion values, with each conversion yield corresponding to E in slope 0.457 E R .
Kissinger–Akahira–Sunose (KAS) is a model-free method for calculating the activation energy of materials. Compared with FWO, the KAS method is widely used because of its higher accuracy, namely:
ln ( δ T 2 ) = ln A E R g ( x ) E R T
ln ( δ T 2 ) and 1 T in the formula represent the slope and intercept, respectively, from which the activation energy of the reaction can be calculated.

3.5.2. Thermodynamic Parameters

The thermodynamic parameters, including A and the changes of Gibbs free energy ( Δ G , KJ mol−1), enthalpy ( Δ H , KJ mol−1), and entropy ( Δ S , J mol−1 K−1), are calculated using the following equations, respectively [36]:
A = β E e x p ( E R T m ) R T m 2
Δ H = E R T
Δ G = E + R T m l n ( K B T m h A )
Δ S = Δ H Δ G T m
where K B and h respectively denote the Boltzmann constant (1.381 × 10⁻²³ J K−1) and the Plank constant (6.626 × 10⁻³⁴ J s), and T m and R are the temperatures corresponding to the maximum degradation rate and the universal gas constant (8.314 J mol−1 K−1), respectively.

4. Conclusions

HSD exhibited a high fuel quality with increased carbon content (54.03%) and elevated HHV (21.65 MJ Kg−1). Compared with non-catalytic pyrolysis, CES catalyst promoted the release and secondary pyrolysis of volatiles during HSD pyrolysis, and the residual mass and average activation energy of HSD-CES decreased by 29.61% and 14.10%, respectively. Importantly, CES upgraded the quality of gas products during HSD pyrolysis, and the content of H2 and CO increased by 26.14% and 22.94%, respectively. In addition, CES also had a positive impact on reducing harmful gas emissions by inhibiting the decarboxylation, dehydrogenation, and deamination of amide-N, with a 22.76% reduction in HCN, and a 20.28% reduction in NH3. The present study has demonstrated that, with enhanced gas yield, high quality of gas products, and less emission of harmful substances, hydrochar exhibits promise as an energy carrier for bioenergy production by catalytic pyrolysis.

Author Contributions

S.Y.: Conceptualization, Methodology, Investigation, Data Analysis, Validation, Writing—Original Draft; Z.C.: Methodology; J.W.: Visualization; D.L.: Writing—Review and Editing; L.L.: Writing—Review and Editing; Z.L.: Resources, Methodology, Writing—Review and Editing. All authors have read and agreed to the published version of the manuscript.

Funding

This work was funded by the Shandong Province Major Scientific and Technological Innovation Project (2021CXGC010803) and the National Natural Science Foundation of China (21876188).

Data Availability Statement

Data presented in this study are available on request to the corresponding author.

Conflicts of Interest

The authors declare no conflict of interest.

References

  1. Wang, Z.; Shen, D.; Wu, C.; Gu, S. Thermal behavior and kinetics of co-pyrolysis of cellulose and polyethylene with the addition of transition metals. Energy Convers. Manag. 2018, 172, 32–38. [Google Scholar] [CrossRef]
  2. Jara-Cobos, L.; Abril-González, M.; Pinos-Vélez, V. Production of Hydrogen from Lignocellulosic Biomass: A Review of Technologies. Catalysts 2023, 13, 766. [Google Scholar] [CrossRef]
  3. Zhang, C.; Chen, W.-H.; Zhang, Y.; Ho, S.-H. Influence of microorganisms on the variation of raw and oxidatively torrefied microalgal biomass properties. Energy 2023, 276, 127612. [Google Scholar] [CrossRef]
  4. Xu, T.; Zheng, X.; Xu, J.; Wu, Y. Hydrogen-Rich Gas Production from Two-Stage Catalytic Pyrolysis of Pine Sawdust with Nano-NiO/Al2O3 Catalyst. Catalysts 2022, 12, 256. [Google Scholar] [CrossRef]
  5. Xu, T.; Xu, J.; Wu, Y. Hydrogen-Rich Gas Production from Two-Stage Catalytic Pyrolysis of Pine Sawdust with Calcined Dolomite. Catalysts 2022, 12, 131. [Google Scholar] [CrossRef]
  6. Nzediegwu, C.; Naeth, M.A.; Chang, S.X. Carbonization temperature and feedstock type interactively affect chemical, fuel, and surface properties of hydrochars. Bioresour. Technol. 2021, 330, 124976. [Google Scholar] [CrossRef]
  7. Li, J.; Zhao, P.; Li, T.; Lei, M.; Yan, W.; Ge, S. Pyrolysis behavior of hydrochar from hydrothermal carbonization of pinewood sawdust. J. Anal. Appl. Pyrolysis 2020, 146, 104771. [Google Scholar] [CrossRef]
  8. Liu, Z.; Quek, A.; Balasubramanian, R. Preparation and characterization of fuel pellets from woody biomass, agro-residues and their corresponding hydrochars. Appl. Energy 2014, 113, 1315–1322. [Google Scholar] [CrossRef]
  9. Nawaz, A.; Kumar, P. Impact of temperature severity on hydrothermal carbonization: Fuel properties, kinetic and thermodynamic parameters. Fuel 2023, 336, 127166. [Google Scholar] [CrossRef]
  10. Iminabo, M.; Yip, A.C.K.; Iminabo, J.T.; Pang, S. Application of MgO-Titanomagnetite mixture in high-temperature catalytic pyrolysis of radiata pine. Biomass Convers. Bior. 2023, in press. [Google Scholar] [CrossRef]
  11. Wang, X.; Li, D.; Gao, Z.; Guo, Y.; Zhang, H.; Ma, D. The Nature of Interfacial Catalysis over Pt/NiAl2O4 for Hydrogen Production from Methanol Reforming Reaction. J. Am. Chem. Soc. 2023, 145, 905–918. [Google Scholar] [CrossRef] [PubMed]
  12. Guo, J.; Peng, M.; Jia, Z.; Li, C.; Liu, H.; Zhang, H.; Ma, D. Kinetic Evidence of Most Abundant Surface Intermediates Variation over Ptn and Ptp: Few-Atom Pt Ensembles Enable Efficient Catalytic Cyclohexane Dehydrogenation for Hydrogen Production-II. ACS Catal. 2022, 12, 7248–7261. [Google Scholar] [CrossRef]
  13. Yap, T.L.; Loy, A.C.M.; Chin, B.L.F.; Lim, J.Y.; Alhamzi, H.; Chai, Y.H.; Yiin, C.L.; Cheah, K.W.; Wee, M.X.J.; Lam, M.K.; et al. Synergistic effects of catalytic co-pyrolysis Chlorella vulgaris and polyethylene mixtures using artificial neuron network: Thermodynamic and empirical kinetic analyses. J. Environ. Chem. Eng. 2022, 10, 107391. [Google Scholar] [CrossRef]
  14. Yang, H.; Ji, G.; Clough, P.T.; Xu, X.; Zhao, M. Kinetics of catalytic biomass pyrolysis using Ni-based functional materials. Fuel Process. Technol. 2019, 195, 106145. [Google Scholar] [CrossRef]
  15. Gao, N.; Salisu, J.; Quan, C.; Williams, P. Modified nickel-based catalysts for improved steam reforming of biomass tar: A critical review. Renew. Sustain. Energy Rev. 2021, 145, 111023. [Google Scholar] [CrossRef]
  16. Photiou, P.; Vyrides, I. Calcined eggshells in anaerobic digestion: Buffering acidification in AD and evaluating end products from phosphate adsorption as soil conditioners. J. Environ. Chem. Eng. 2022, 10, 107957. [Google Scholar] [CrossRef]
  17. Raheem, A.; Liu, H.; Ji, G.; Zhao, M. Gasification of lipid-extracted microalgae biomass promoted by waste eggshell as CaO catalyst. Algal Res. 2019, 42, 101601. [Google Scholar] [CrossRef]
  18. Gan, D.K.W.; Loy, A.C.M.; Chin, B.L.F.; Yusup, S.; Unrean, P.; Rianawati, E.; Acda, M.N. Kinetics and thermodynamic analysis in one-pot pyrolysis of rice hull using renewable calcium oxide-based catalysts. Bioresour. Technol. 2018, 265, 180–190. [Google Scholar] [CrossRef]
  19. Li, H.; Wang, Y.; Zhou, N.; Dai, L.; Deng, W.; Liu, C.; Cheng, Y.; Liu, Y.; Cobb, K.; Chen, P.; et al. Applications of calcium oxide–based catalysts in biomass pyrolysis/gasification—A review. J. Clean. Prod. 2021, 291, 125826. [Google Scholar] [CrossRef]
  20. Liu, H.; Basar, I.A.; Nzihou, A.; Eskicioglu, C. Hydrochar derived from municipal sludge through hydrothermal processing: A critical review on its formation, characterization, and valorization. Water Res. 2021, 199, 117186. [Google Scholar] [CrossRef]
  21. Nizamuddin, S.; Siddiqui, M.T.H.; Baloch, H.A.; Mubarak, N.M.; Griffin, G.; Madapusi, S.; Tanksale, A. Upgradation of chemical, fuel, thermal, and structural properties of rice husk through microwave-assisted hydrothermal carbonization. Environ. Sci. Pollut. Res. Int. 2018, 25, 17529–17539. [Google Scholar] [CrossRef] [PubMed]
  22. Yang, H.; Yan, R.; Chen, H.; Lee, D.H.; Zheng, C. Characteristics of hemicellulose, cellulose and lignin pyrolysis. Fuel 2007, 86, 1781–1788. [Google Scholar] [CrossRef]
  23. Xu, C.; Chen, S.; Soomro, A.; Sun, Z.; Xiang, W. Hydrogen-rich syngas production from biomass gasification using synthesized Fe/CaO active catalysts. J. Energy Inst. 2018, 91, 805–816. [Google Scholar] [CrossRef]
  24. Koido, K.; Kurosawa, K.; Endo, K.; Sato, M. Catalytic and inhibitory roles of K and Ca in the pyrolysis and CO2 or steam gasification of Erianthus, and their effects on co-gasification performance. Biomass Bioenergy 2021, 154, 106257. [Google Scholar] [CrossRef]
  25. Mishra, R.K.; Mohanty, K. Pyrolysis kinetics and thermal behavior of waste sawdust biomass using thermogravimetric analysis. Bioresour. Technol. 2018, 251, 63–74. [Google Scholar] [CrossRef]
  26. Chong, C.T.; Mong, G.R.; Ng, J.-H.; Chong, W.W.F.; Ani, F.N.; Lam, S.S.; Ong, H.C. Pyrolysis characteristics and kinetic studies of horse manure using thermogravimetric analysis. Energy Convers. Manag. 2019, 180, 1260–1267. [Google Scholar] [CrossRef]
  27. Balasundram, V.; Ibrahim, N.; Kasmani, R.M.; Hamid, M.K.A.; Isha, R.; Hasbullah, H.; Ali, R.R. Thermogravimetric catalytic pyrolysis and kinetic studies of coconut copra and rice husk for possible maximum production of pyrolysis oil. J. Clean. Prod. 2017, 167, 218–228. [Google Scholar] [CrossRef]
  28. Loy, A.C.M.; Gan, D.K.W.; Yusup, S.; Chin, B.L.F.; Lam, M.K.; Shahbaz, M.; Unrean, P.; Acda, M.N.; Rianawati, E. Thermogravimetric kinetic modeling of in-situ catalytic pyrolytic conversion of rice husk to bioenergy using rice hull ash catalyst. Bioresour. Technol. 2018, 261, 213–222. [Google Scholar] [CrossRef]
  29. Ahmad, M.S.; Mehmood, M.A.; Liu, C.G.; Tawab, A.; Bai, F.W.; Sakdaronnarong, C.; Xu, J.; Rahimuddin, S.A.; Gull, M. Bioenergy potential of Wolffia arrhiza appraised through pyrolysis, kinetics, thermodynamics parameters and TG-FTIR-MS study of the evolved gases. Bioresour. Technol. 2018, 253, 297–303. [Google Scholar] [CrossRef]
  30. Kai, X.; Li, R.; Yang, T.; Shen, S.; Ji, Q.; Zhang, T. Study on the co-pyrolysis of rice straw and high-density polyethylene blends using TG-FTIR-MS. Energy Convers. Manag. 2017, 146, 20–33. [Google Scholar] [CrossRef]
  31. Ni, Z.; Bi, H.; Jiang, C.; Sun, H.; Zhou, W.; Qiu, Z.; Lin, Q. Research on the co-pyrolysis of coal slime and cellulose-based on TG-FTIR-MS, artificial neural network, and principal component analysis. Fuel 2022, 320, 123960. [Google Scholar] [CrossRef]
  32. Chang, G.; Miao, P.; Yan, X.; Wang, G.; Guo, Q. Phenol preparation from catalytic pyrolysis of palm kernel shell at low temperatures. Bioresour. Technol. 2018, 253, 214–219. [Google Scholar] [CrossRef]
  33. Burra, K.R.G.; Liu, X.; Wang, Z.; Li, J.; Che, D.; Gupta, A.K. Quantifying the sources of synergistic effects in co-pyrolysis of pinewood and polystyrene. Appl. Energy 2021, 302, 117562. [Google Scholar] [CrossRef]
  34. Nan, H.; Xiao, Z.; Zhao, L.; Yang, F.; Xu, H.; Xu, X.; Qiu, H. Nitrogen Transformation during Pyrolysis of Various N-Containing Biowastes with Participation of Mineral Calcium. ACS Sustain. Chem. Eng. 2020, 8, 12197–12207. [Google Scholar] [CrossRef]
  35. GB/T28731-2012; Methods for industrial analysis of solid biomass fuels. National Coal Standardization Technical Committee: Beijing, China, 2012.
  36. Lang, Q.; Zhang, B.; Liu, Z.; Chen, Z.; Xia, Y.; Li, D.; Ma, J.; Gai, C. Co-hydrothermal carbonization of corn stalk and swine manure: Combustion behavior of hydrochar by thermogravimetric analysis. Bioresour. Technol. 2019, 271, 75–83. [Google Scholar] [CrossRef] [PubMed]
Figure 1. TG curves of (a) HSD, (c) HSD-CaO, and (e) HSD-CES, and DTG curves of (b) HSD, (d) HSD-CaO, and (f) HSD-CES at different heating rates.
Catalysts 13 01297 g001
Figure 2. The XRD patterns of CES and eggshell.
Catalysts 13 01297 g002
Figure 3. Linear plot for determining activation energy of (a) HSD, (c) HSD-CaO, and (e) HSD-CES by KAS; (b) HSD, (d) HSD-CaO, and (f) HSD-CES by FWO.
Catalysts 13 01297 g003
Figure 4. Entropy for HSD, HSD-CES, and HSD-CaO using KAS and FWO methods at different conversions.
Catalysts 13 01297 g004
Figure 5. The three-dimensional spectral plot of the gases produced from the pyrolysis of (a) HSD, (b) HSD-CaO, and (c) HSD-CES at a heating rate of 20 K min−1 in FTIR.
Catalysts 13 01297 g005
Figure 6. Evolution of (a) CO, (b) H2, (c) CO2, (d) CH4, (e) HCN, and (f) NH3 from the respective pyrolysis of HSD, HSD-CaO, and HSD-CES at a heating rate of 20 K min−1 in MS.
Catalysts 13 01297 g006
Table 1. Proximate analysis, ultimate analysis, and HHV of raw material and hydrochar.
SamplesProximate Analysis a (wt.%)Ultimate Analysis a (wt.%)HHV
(MJ kg−1)
FC bVM cAshCHO dNS
SD14.3184.810.9046.266.3746.080.460.0318.86
HSD26.5272.041.5254.036.1038.700.850.0621.65
a Measured on a dry basis. b FC, fixed carbon. c VM, volatile matter. d By difference.
Table 2. Tm, Rp, and WR of HSD, HSD-CaO, and HSD-CES at different heating rates.
Heating Rate
(K min−1)
HSDHSD-CaOHSD-CES
Tm a (K)-Rp b (% min−1)WR c (%)Tm a (K)-Rp b (%min−1)WR d (%)Tm a (K)-Rp b (% min−1)WR d (%)
10636.059.1631.50634.656.1629.31639.356.8824.59
20649.5517.8529.33649.9512.0127.11653.1513.2522.63
30656.5526.5331.13658.6518.5627.70659.8519.0923.81
40662.2523.1930.04664.3523.5329.81663.6524.4624.53
a Tm, the temperature corresponding to the maximum degradation rate. b -Rp, the maximum weight-loss rate. c WR, the pyrolysis residue mass. d WR, the pyrolysis residue mass altered by modifying the effect of the catalyst weight.
Table 3. Comparison of E A , A , Δ H , and Δ G with different kinetic models corresponding to different conversion degrees of non-catalytic and catalytic pyrolysis of HSD.
α FWOKAS
E A
(KJ·mol−1)
R 2 A
(s−1)
Δ H
(KJ·mol−1)
Δ G
(KJ·mol−1)
E A
(KJ·mol−1)
R 2 A
(s−1)
Δ H
(KJ·mol−1)
Δ G
(KJ·mol−1)
HSD0.2196.040.9696.51 × 1015190.64153.37196.070.9666.55 × 1015190.67153.34
0.3203.110.9882.50 × 1016197.71146.11203.220.9872.55 × 1016197.82146.00
0.4202.020.9942.03 × 1016196.63147.22201.910.9931.99 × 1016196.51147.35
0.5196.340.9986.90 × 1015190.94153.05195.800.9986.22 × 1015190.40153.62
0.6200.100.9991.41 × 1016194.70149.20199.620.9991.29 × 1016194.22149.69
0.7230.780.9964.77 × 1018225.38117.78231.710.9965.69 × 1018226.31116.83
Average204.73 9.67 × 1017199.33144.46204.72 9.60 × 1017199.32144.47
HSD-CES0.2171.730.9676.20 × 1013166.33178.59170.430.9634.84 × 1013165.03179.93
0.3177.070.9911.72 × 1014171.67173.09175.760.9901.34 × 1014170.35174.44
0.4176.610.9941.57 × 1014171.21173.57175.100.9931.18 × 1014169.70175.12
0.5175.990.9921.40 × 1014170.59174.20174.310.9911.01 × 1014168.91175.93
0.6184.220.9776.71 × 1014178.82165.73182.800.9745.12 × 1014177.40167.20
0.7199.200.9701.16 × 1016193.80150.34198.260.9679.71 × 1015192.86151.31
Average180.80 2.14 × 1015175.40169.25179.44 1.77 × 1015174.04170.66
HSD-CaO0.2191.250.9802.18 × 1015185.82160.09190.890.9772.04 × 1015185.46160.46
0.3193.010.9913.04 × 1015187.58158.28192.480.9902.75 × 1015187.05158.82
0.4192.950.9983.00 × 1015187.52158.34192.250.9982.63 × 1015186.82159.06
0.5192.680.9992.86 × 1015187.25158.62191.810.9992.42 × 1015186.39159.51
0.6200.260.9961.20 × 1016194.84150.83199.620.9951.062 × 1016194.19151.49
0.7208.490.9705.69 × 1016203.06142.39207.980.9665.16 × 1016202.55142.92
Average196.44 1.33 × 1016191.01154.76195.84 1.20 × 1016190.41155.37
Table 4. The wave number ranges for absorption peaks and their corresponding volatile species.
Wave Number Range (cm−1)Functional GroupPossible Species
3750–3500O-H stretchingH2O
3050–2700C-H stretchingCH4
2400–2250C-O stretchingCO2
2250–2050CO stretchingCO
1800–1650C=O stretchingCarboxylic acids, Ketones,
Aldehydes
1600–1450C-C stretching,
Benzene skeletal
Aromatics skeletal
1425–1305C-H bendingAlkanes
1300–1000C-O stretching,
O-H bending
Phenols, Alcohols, Ethers
Disclaimer/Publisher’s Note: The statements, opinions and data contained in all publications are solely those of the individual author(s) and contributor(s) and not of MDPI and/or the editor(s). MDPI and/or the editor(s) disclaim responsibility for any injury to people or property resulting from any ideas, methods, instructions or products referred to in the content.

