Review

Hydrogen, Ammonia and Symbiotic/Smart Fertilizer Production Using Renewable Feedstock and CO2 Utilization through Catalytic Processes and Nonthermal Plasma with Novel Catalysts and In Situ Reactive Separation: A Roadmap for Sustainable and Innovation-Based Technology

1
Blacksea Advanced Technology Research and Application Centre (KITAM), Ondokuz Mayis University, Samsun 55139, Türkiye
2
Department of Chemical and Biomolecular Engineering, Case Western Reserve University, Cleveland, OH 44106-7217, USA
3
School of Chemical Engineering and Advanced Materials, Newcastle University, Newcastle-upon-Tyne NE1 7RU, UK
Catalysts 2023, 13(9), 1287; https://doi.org/10.3390/catal13091287
Submission received: 22 June 2023 / Revised: 23 August 2023 / Accepted: 25 August 2023 / Published: 8 September 2023
(This article belongs to the Special Issue Application of Catalysts in CO2 Capture, Production and Utilization)

Abstract

:
This multi-disciplinary paper aims to provide a roadmap for the development of an integrated, process-intensified technology for the production of H2, NH3 and NH3-based symbiotic/smart fertilizers (referred to as target products) from renewable feedstock with CO2 sequestration and utilization while addressing environmental issues relating to the emerging Food, Energy and Water shortages as a result of global warming. The paper also discloses several novel processes, reactors and catalysts. In addition to the process intensification character of the processes used and reactors designed in this study, they also deliver novel or superior products so as to lower both capital and processing costs. The critical elements of the proposed technology in the sustainable production of the target products are examined under three-sections: (1) Materials: They include natural or synthetic porous water absorbents for NH3 sequestration and symbiotic and smart fertilizers (S-fertilizers), synthesis of plasma interactive supported catalysts including supported piezoelectric catalysts, supported high-entropy catalysts, plasma generating-chemical looping and natural catalysts and catalysts based on quantum effects in plasma. Their performance in NH3 synthesis and CO2 conversion to CO as well as the direct conversion of syngas to NH3 and NH3—fertilizers are evaluated, and their mechanisms investigated. The plasma-generating chemical-looping catalysts (Catalysts, 2020, 10, 152; and 2016, 6, 80) were further modified to obtain a highly active piezoelectric catalyst with high levels of chemical and morphological heterogeneity. In particular, the mechanism of structure formation in the catalysts BaTi1−rMrO3−x−y{#}xNz and M3O4−x−y{#}xNz/Si = X was studied. Here, z = 2y/3, {#} represents an oxygen vacancy and M is a transition metal catalyst. (2) Intensified processes: They include, multi-oxidant (air, oxygen, CO2 and water) fueled catalytic biomass/waste gasification for the generation of hydrogen-enriched syngas (H2, CO, CO2, CH4, N2); plasma enhanced syngas cleaning with ca. 99% tar removal; direct syngas-to-NH3 based fertilizer conversion using catalytic plasma with CO2 sequestration and microwave energized packed bed flow reactors with in situ reactive separation; CO2 conversion to CO with BaTiO3−x{#}x or biochar to achieve in situ O2 sequestration leading to higher CO2 conversion, biochar upgrading for agricultural applications; NH3 sequestration with CO2 and urea synthesis. (3) Reactors: Several patented process-intensified novel reactors were described and utilized. They are all based on the Multi-Reaction Zone Reactor (M-RZR) concept and include, a multi-oxidant gasifier, syngas cleaning reactor, NH3 and fertilizer production reactors with in situ NH3 sequestration with mineral acids or CO2. The approach adopted for the design of the critical reactors is to use the critical materials (including natural catalysts and soil additives) in order to enhance intensified H2 and NH3 production. Ultimately, they become an essential part of the S-fertilizer system, providing efficient fertilizer use and enhanced crop yield, especially under water and nutrient stress. These critical processes and reactors are based on a process intensification philosophy where critical materials are utilized in the acceleration of the reactions including NH3 production and carbon dioxide reduction. When compared with the current NH3 production technology (Haber–Bosch process), the proposed technology achieves higher ammonia conversion at much lower temperatures and atmospheric pressure while eliminating the costly NH3 separation process through in situ reactive separation, which results in the production of S-fertilizers or H2 or urea precursor (ammonium carbamate). As such, the cost of NH3-based S-fertilizers can become competitive with small-scale distributed production platforms compared with the Haber–Bosch fertilizers.

Graphical Abstract

1. Introduction

Scope and Structure: This is a highly multi-disciplinary, application-oriented and unusually long research paper with extensive review. Due to these attributes, it was felt that a guide should be provided to help the reader navigate through various strands of science, engineering and technology. The paper could have been split into smaller, topic-specific communications. However, the author and the editors believed that, due to the significance of the proposed technology, a single paper is more appropriate for providing a comprehensive proposal, albeit rather long and multi-disciplinary. Otherwise, the connectivity between different strands of the proposed technology might disintegrate thus denigrating its impact.
The objective is to provide a comprehensive guide for technology transfer for the production of ammonia-based symbiotic/smart fertilizers (S-fertilizers) at small-to-medium-sized process-intensified plants in the first instance as a technology-based solution in preventing climate change/global warming. The long-term aim is to produce anhydrous NH3 as transport fuel and hydrogen storage as the means of achieving more environmental impact. The elements of the proposed technology have several technology-readiness levels, ranging from a fully commercial biomass gasifier for power generation to process-intensified novel catalytic plasma reactors to plasma responsive catalysts based on quantum effects in plasma, which prevent NH3 (product) decomposition in plasma space, thus making plasma NH3 synthesis competitive. The proposed technology also utilizes natural and renewable materials as catalysts through which they themselves are upgraded for use in agriculture as S-fertilizers, which outperform the Classical/Current/Commercial fertilizers (C-fertilizers) based on Haber–Bosch ammonia.
In order to achieve the above objective, we first identify the critical elements of the proposed technology as summarized in the visual abstract. These critical elements are: (1) Materials, including catalysts and micro-porous water absorbents for S-fertilizers; (2) Processes, which include plasma generation using novel quantum effect catalysts, CO2-conversion to CO, direct NH3- synthesis from H2 enhanced/N2 depleted syngas from the multi-oxidant gasifier; (3) Multi-Reaction Zone Reactors M-RZR applied to the design of gasifiers, syngas cleaners and plasma reactors for ammonia synthesis with in situ sequestration using water/acid absorbents or CO2 based sequestration of NH3.
In the “Results Section”, the above “critical elements” have been illustrated with experimental results. In each topic experimental section, methodology and equipment are described briefly often with reference to our previous work. The new data provided indicate the feasibility of the proposed technology with support from the recent relevant scientific literature. In all cases, the processes, equipment, reactors, chemical plants, catalysts and PolyHIPE Polymer (PHP) material were designed, have been built and commissioned by the author before they were used in general research in his research group.
In line with the structure of the experimental results, the “Conclusions and Recommendations Section” is also divided into sub-sections, summarizing the important findings relevant to the recommended technology illustrated through a process flow diagram at the end of the paper. The techno-economic aspects of the proposed technology are provided with emphasis on H2 generation from biomass and water as the limiting chemical for the production of S-fertilizers, urea, nitric acid and anhydrous NH3. Due to the extensity of the scope and multi-disciplinarity of the paper as well as the presence of several novel concepts and inventions, the review and the references are also extensive, and hence, this study may appear as a “review” but the data presented are new. In this respect, this paper is an original research article.

1.1. Motivation for a Sustainable Distributed Process-Intensified Ammonia Technology

Global warming and climate change require the urgent development of novel processing technologies in order to prevent and abate their impact on the globe and societies. Global warming and its disruptive effects on climate are now associated with the emergence of Food, Energy and Water (FEW) shortages (FEWs). It is therefore imminently prudent to develop novel processing technologies based on renewable feedstocks and energy with zero- or negative-carbon emission while preserving water resources and land fertility [1]. This can only be achieved if the enabling novel processes are integrated not only at the processing platform level but also globally (through FEW-nexus management) so as to prevent shifting the entropy (or the footprint) burden of manufacture to other sectors, thus resulting in the enhancement of global warming. Further, the security of food, energy, water production, supply and distribution require small-scale locally resourced manufacturing platforms, which should also be free from the burden of “Economies of Scale”. To a certain extent, these attributes can be achieved by using the design philosophy of Process Intensification (PI) [2].
However, PI by itself cannot achieve economic viability if intensified unit operations are not integrated within the chemical plant level, so manufacturing takes place in a Process-Intensified Plant. A more desirable manufacturing approach is to integrate the processes at a global scale in order to minimize the entropy increase due to processing and lower the final product cost below that of the well-established, fossil-fuel-based current technology.
An excellent example is, in fact, ammonia. As 85% ammonia is converted into fertilizers, including ammonium nitrate, sulfate and phosphate, these final products should be obtained directly during ammonia synthesis. In order to achieve such a process, low-temperature and low-pressure nonthermal catalytic plasma ammonia synthesis with in situ sequestration through reactive separation has been achieved and highly efficient ammonia-based fertilizers have been obtained [3]. This process not only enhances conversion to ammonia but also results in novel “symbiotic/smart fertilizers”, which act as a synthetic root system (capable of creating a synthetic rhizosphere within its pores), enhancing a more efficient fertilizer delivery and water management system in which the water and nutrient (fertilizer) path-length to the plant roots (rhizosphere) is minimized [4,5,6]. This type of processing approach therefore cuts several manufacturing stages of fertilizer production from the current technology (Haber–Bosch, HB) in which ammonia is converted to fertilizer by aqueous phase neutralization using strong acid followed by ammonia salt crystallization. The energy cost of HB-ammonia is 0.50 MJ/mol, which is very close to its theoretical value of 0.48 MJ/mol, achieved over a century. On the other hand, the theoretical energy cost of ammonia by nonthermal plasma synthesis is 0.25 MJ/mol, illustrating the motivation for an integrated process that can deliver smart/highly efficient fertilizers at a low cost from renewable feedstock in small-scale plants [3].
Several novel fertilizer systems, known as “smart fertilizers” are available [7,8,9,10,11,12,13]. They are mainly based on hydrophilic super-absorbing polymers (SAPs) or biochar. “Symbiotic fertilizers” introduced by the author [2,3,4,5,6] significantly differ from these “smart fertilizers” with respect to their physical and chemical structure, their interactions with the roots of plants, soil microorganisms, micronutrient and water [2,3,4,5,6]. The symbiotic fertilizers are highly porous, biologically active, hydrophilic (biodegradable) polymers where the basic material is generically known as PolyHIPE Polymers in which their characteristics can be changed over a wide range through processing [14,15] and chemical and biochemical synthesis routes [3,4,5,6,16,17,18,19,20]. Most importantly, they associate with the plant roots and become an integral part of the plant, forming micro-rhizosphere domains and significantly extending the interfacial area between the plant roots and environment [3,4,5,6]. Unlike SAPs and other soil additives such as biochar, PHP-based fertilizers can be inoculated with microorganisms for efficient nitrogen fixation by plants, even if the plant itself is not leguminous and unable to fix nitrogen [4,5,6]. The enhancement of growth and yield with symbiotic fertilizers increases to over 300% under water and nutrient stress [3,4,5,6]. Further, in line with the UN recommendations on the promotion of perennial crops with longer penetrating roots [7], these symbiotic fertilizer systems can remain in the soil for decades if needed as their biodegradability can be controlled [19,20].
Biomass growth and yield enhancements through the close proximity of the fertilizer to plant root have now been utilized through the mechanical insertion of fertilizers using specially developed agriculture machinery [21]. However, the efficiency of this method is far below that achieved through synthetic rhizosphere generation with microporous soil additives such as hydrophilic PHPs.
In this study, we propose a possible integrated interdisciplinary technology route to achieve a substantial impact on the prevention of global warming, developing sustainable energy and agriculture technologies through ammonia and novel smart fertilizers, thus addressing food, energy and water issues described as FEWs. Unavoidably, such a technology is highly interdisciplinary and although well within the aims and scope of the call for this special virtual issue publication, we will confine our attention to the most critical elements of the proposed technology. This study provides several novel process pathways and reactors, ranging from the laboratory to the pilot-plant scale. All of the equipment and reactors were designed, manufactured and commissioned by the author, and here, their performances are illustrated to show the feasibility of the individual processes and their integration.
For brevity, we refer to such technology as “Climate Change Abatement Technologies”. We confine our scope to the following critical vectors; namely the development of: (1) Materials; (2) Processes; and (3) Reactors, all of which should be integrated to achieve the stated objective. Clearly, the development of these critical vectors must be seen as model prototypes, not necessarily final products. This is necessary for the replication of the results and assessing performance, cost and efficiency. In transferring such developments to industrial-scale platforms, issues such as scale-up (via pilot plants with increasing capacity and optimization), industrial-scale health-and-safety protocols, feedstock properties, cost and product performance need to be considered within a limited operational span.

1.2. Critical Materials

1.2.1. Nano-Structured Microporous PolyHIPE Polymers (PHPs)

PolyHIPE Polymers (PHPs), also referred to as PolyHIPE, were developed at Unilever Research Laboratories, Liverpool, UK [22] during the 1980s (the development team included the present author) and acronymized by Unilever researchers as PHP (Polymerized High Internal Phase Emulsion Polymer; as opposed to emulsion polymers for which the phase volume is less than 74%). This is a highly versatile material with worldwide recognition and increasing applications; see for example Zhang et al. [19]. The attraction of PHP is that their physical, chemical and biological structure can be controlled over a wide range of variables, and therefore they can be used in the intensification of some processes in agriculture (AgroProcess Intensification), biotechnology (BioProcess Intensification) and chemical technology (Chemi-Process Intensification). The overarching driving force in these process intensifications is entropic and called the “Confinement Phenomenon” in which the behavior of the matter (including microorganisms and mammalian and plant cells) is dependent on the size and biochemical nature of the confining space [2,23]. This hypothesis could be tested by using PolyHIPE Polymers with well-controlled architecture (pore, interconnect size, etc.) and biochemical structures. Relevant to the proposed technology, these intensified processes include: AgroProcess intensifications and ecosystem development [2,3,4,5,6,24]. BioProcess intensifications, tissue engineering [15,16,17,18,25,26] and Chemi-Process Intensifications address several processes and products, providing the background to the proposed technology [2,27,28,29].
In order to achieve a high degree of structural uniformity in PolyHIPE Polymer, special equipment has also been developed together with the understanding of the interactions between emulsion structure formation and the prevailing fluid mechanics based on flow-induced phase inversion [14,30,31,32,33,34]. For high temperature and catalyst applications, the metallization of PolyHIPE Polymers by flow-induced electrodeless deposition was developed [35].
Especially in AgroProcess and BioProcess Intensification applications, the most important characteristics of PHP include the control of pores and interconnecting hole sizes as well as the biochemistry and nano-pores of the pore surface, which are essential for the free movement of the messenger, metabolic and nutrient molecules. The pore size of PHP often dictates the rate of proliferation, differentiation, viability and metabolic activity in micro-organisms and mammalian cells due to the external stressor imposed by confinement within the PHP-pore which, however, allows cell–cell communications through the presence of nano-pores in the pore surfaces. Therefore, functionalized PHP with a homogeneous pore structure is necessary to achieve a collective response to a stressor, which results in process intensification in agriculture and biology when PHP is used as support for microorganisms or mammalian cells. It is, therefore, necessary at this stage to choose PHP as the model critical material vector in the synthesis of smart/symbiotic fertilizers that can enhance fertilizer and water efficiency and, in fact, fix atmospheric nitrogen through plant roots [5,6,7,8].

1.2.2. Need for Symbiotic/Smart Fertilizers

The nexus between food-energy-water is clearly apparent from consumption and manufacturing statistics. Potentially, 30% of global energy consumption can be supplied sustainably by ammonia while currently 87% of industrial energy is consumed in ammonia production of which 85% is utilized in fertilizers for agriculture, which in turn consumes 80% of global fresh water [3]. Central to the FEW nexus is fertilizer which itself has peaked its productivity and there is a lack of a diminishing exploitable yield gap in agriculture, indicating that increased fertilizer consumption cannot enhance agricultural yield [1,4]. Coupled with the effects of global warming on agriculture (in particular stresses associated with water shortage, soil and air temperature rise, desertification as well as energy cost), the limit of fertilizer-based yield enhancement requires a new approach to fertilizer design, production and use. The proposed technology addresses these issues.
To a certain extent, the symbiotic fertilizers address water preservation and yield enhancement, especially under water and temperature stress while reducing fertilizer consumption through nitrogen fixation even in non-legumes [5,6,7]. On the other hand, smart fertilizers cover a multitude of fertilizer systems with a prescribed function. The main function of SAPs is slow release and water retention by soil [8], while biochar recycles the micronutrients back into the soil, modifies its structure and provides support for soil bacteria [8,9,10,11,12,13]. The fertilizer system introduced by Akay et al. [5,6,7] (acronymized as SRS, for Synthetic Root System or Synthetic RhizoSphere) is unique because they not only achieve fertilizer and water release to the plant roots with a diffusion path in tens of micrometers, but they also act as micro-bioreactors for soil bacteria in the enhancement of root infection in legumes. In the case of non-legumes, nitrogen fixation is achieved from air through bacteria cultivated within micropores. Without any fertilizer or bacteria within them, their function is primarily water and micronutrient absorption from the environment and their release to the plant, while over a longer period, allowing bacterial ingrowth thus providing a protective environment for microorganisms. In other words, hydrophilic PHP (with or without fertilizer) attracts plant roots (through chemi- and hydro-tropisms), nutrients and water so as to provide an efficient environment for rhizosphere bio-transformations. It was found that with PHP in the soil, although the plant root mass decreases, plant biomass/yield increases [4,5,6], indicating the enhancement of root function.
Recently, PolyHIPE Polymer has also been used in soilless cultivation [36] in which the above-cited attributes of PolyHIPE Polymers are utilized. Even as a non-biological soil additive, PHPs are highly effective in the absorption of water and ionic/non-ionic species in the soil and transferring them to the plant. PHPs can be chemically modified to have cationic or anionic functionality in order to achieve a wide electrolyte absorption range [3,16,19,37,38].
The level of BioProcess Intensification can reach over 100-fold but in AgroProcess Intensification the enhancement levels are more modest, reaching 3–4-fold (300–400%). Nevertheless, this level of plant yield enhancement, especially under water and nutrient stress is outstanding in agriculture. The only reason for this is the ability of the plant roots to penetrate the symbiotic fertilizer and form a synthetic rhizosphere, which is able to acquire water and nutrients from the soil environment [4,5,6,7].

1.2.3. PolyHIPE Polymer for In Situ Ammonia Sequestration and Symbiotic/Smart Fertilizer Generation

The cost-effectiveness of the symbiotic fertilizers can be further enhanced by using them as sequestration agents for ammonia during ammonia synthesis. As some 85% of current ammonia is used in fertilizer production and in agriculture, which also consumes 80% of water globally, the use of hydrophilic PHP for ammonia sequestration serves the dual purpose of nutrient and water management in agriculture. Therefore, sulfonated or acid (sulfuric, nitric or phosphoric) containing hydrophilic PHP was used to sequestrate ammonia from catalytic plasma reactors through in situ reactive separation of ammonia from the reaction medium using the novel Multi-Reaction Zone Reactors [3,39]. This results in a significant enhancement of energy efficiency compared with no sequestration. Energy Cost (EC) is reduced from 42.2 MJ/mol to 13.2 MJ/mol ammonia while the concentration of ammonia in the product stream increased from 5.4 mol% to 19.4 mol% per pass. It is possible to optimize the processing conditions in order to obtain significantly superior outcomes which, however, should conform with industrial safety restrictions due to the highly explosive nature of the reactants and products.
A recent analysis of ammonia cost comparison by Rouwenhorst and Lefferts [40] showed that the most important cost item in plasma ammonia synthesis is the recovery of ammonia and the re-circulation of unreacted nitrogen and hydrogen. This is not surprising because, in the theoretical analysis, the outlet ammonia concentration is very low (ca. 1 v%). However, much higher ammonia outlet concentrations are now available at ca. 12–20% albeit at a higher energy cost [3] even without any process optimization. Therefore, the reactive ammonia separation technique used by the author [3,39] in the sequestration of ammonia also yields a very high outlet ammonia concentration on par with the Haber–Bosch process (ca. 12–20 v%) with high conversion of nitrogen (ca. 40%), again, similar or better than that achieved by HB-process. In addition, the resulting product from ammonia sequestration is a highly versatile symbiotic fertilizer that is likely to be more effective in terms of utilization by the plants and preventing fertilizer loss (30–50%). When viewed in terms of the final product (symbiotic/smart fertilizer) cost, this process provides a highly efficient fertilizer system at a significantly lower cost due to the avoidance of high temperature, high pressure and high cost of ammonia recovery and hydrogen/nitrogen recycle as unreacted components of the ammonia synthesis reaction.
Furthermore, in the manufacture of neat ammonia as an energy vector or in obtaining urea fertilizer (with CO2 capture and utilization), CO2 can be used as a reversible sequestration agent to obtain ammonium carbamate as a solid product followed by heating to split it back to ammonia and CO2. Alternatively, ammonium carbamate can be processed to obtain urea, which can be regarded as CO2 capture and storage in soil [3]. These techniques described above [3,39] are ideally suitable for reaction systems like nonthermal plasma catalytic reactions when the reaction is confined to the plasma-catalyst zone. The reactants don’t undergo any other reaction in the product sequestration zone where only the reaction of the product (ammonia) with the sequestration agent (acidic PHP) takes place through a fast exothermic reaction.

1.2.4. Natural Materials for In Situ Ammonia Sequestration and Soil Additives

PolyHIPE Polymers have been used by the author in various “Confinement Phenomenon” based process intensification applications due to their versatility, namely in the control of their physical, chemical and biological characteristics, including their biodegradability and health and safety aspects. PolyHIPE Polymer allowed the determination of the optimum characteristics (pore and interconnect size, pore volume and surface (bio)chemistry) for any given application. Once these characteristics are determined, other natural materials may be used as an alternative to PolyHIPE Polymer. Three notable natural materials can be used as an alternative, which are already used as soil conditioners and smart fertilizers. They are biochar [8,9,10,11,12,13,41,42,43], bioash from the gasification or combustion of biomass [44,45,46,47,48,49,50] and leonardites [51,52,53,54,55,56,57]. Unlike biochar and ash, leonardites are available as mineable organo-mineral deposits, usually above the lignite fields. Although in principle, these natural soil additives can be used with a minimum of modification, they are still modified in order to enhance their desired properties including water uptake, surface area, concentration and accessibility of active sites for water and nutrient absorption. These can be achieved by acid treatment, which nevertheless strips metals as micronutrients for the plants. Leonardite has a significantly higher water absorption capacity due to the presence of humic and fulvic acids. However, leonardites have low nutrient content and their effectiveness without water stress in agriculture is not clear even in the supply of soil organic carbon [51]. Nevertheless, they can be used as acid carriers (which improves their soil additive characteristics without stripping micronutrients) for the sequestration of ammonia.
Further, as natural materials, the range of variability of their physical-chemical structures is very wide and the scope of modification of their structure is limited and costly. Therefore, in the present developmental stage, PolyHIPE Polymer provides an ideal model substrate for the repeatability and understanding of the prevailing mechanisms. As they can be made biodegradable within a controlled time span, they can also be used as an ideal scaffold for symbiotic/smart fertilizers and achieving sequestration in Multi-Reaction Zone Reactors as shown previously [3,39]. In Multi-Reaction Zone Reactor systems, ammonia is produced in Reaction Zone-1 by a catalytic plasma reaction, and the resulting ammonia is sequestrated in Reaction Zone-2 by using acid-containing sulfonated PolyHIPE Polymer to form symbiotic/smart fertilizer. Alternatively, the sequestration is carried out by CO2 to form ammonium carbamate, which can be recovered as a solid and used in urea production or the recovery of ammonia by heating the solid ammonium carbamate above 80 °C [3,39].

1.2.5. Heterogeneous Catalysts

Plasma-induced vibrationally and electronically excited small molecules together with other reactive species such as radicals, ions and free electrons generated from small gaseous molecules such as H2, N2, O2, CO2, CH4, have been utilized in several environmentally and industrially important synthesis and processes. These energy-related highly important processes include, notably, NH3 synthesis, CO2-splitting and conversion to higher hydrocarbon chemicals, CH4-reforming, N2-fixation/NOx generation from air for HNO3 synthesis and direct synthesis of ammonia-based novel fertilizers with or without CO2 utilization. The energy efficiency of these processes can be further increased by using catalysts, in particular, plasma-responsive catalysts. Rouwenhorst et al. [58] have provided a highly comprehensive review of catalytic plasma-based ammonia synthesis, which is also relevant to other energy-related catalytic plasma processes. More recently, Yan et al. [59] have given a review of catalytic plasma applied to several energy-related processes with a list of recent papers.
There has been significant progress in the understanding of the mechanisms of plasma reactions through experimental and theoretical studies. It is now understood that plasma reactions can be enhanced significantly in the presence of the catalysts in the above-cited energy-related reactions [59,60,61,62,63,64,65,66,67,68,69,70,71,72,73,74,75,76,77,78,79,80,81]. However, in the presence of catalysts, the mechanisms of plasma reactions differ significantly from thermochemical catalysts. Plasma activation of reactants via the formation of radicals often opens pathways that are thermodynamically impossible for ground-state reactants; in that case, the use of traditional catalysts is likely to be counterproductive as these will catalyze the reverse reaction, back to reactants [58].

1.2.6. Heterogeneous Catalysts for Plasma Processes

The choice of the catalyst is less determined by chemical properties and more by properties influencing discharge characteristics (e.g., dielectric properties and morphology), thereby influencing the plasma-phase dissociation of activated molecules [58]. A method to modify the plasma by radicals was first proposed by Akay et al. [3,67,69,70] who used a mix of dielectric materials (silanated silica with or without BaTiO3) as support for transition metal catalysts in the plasma reactor. The dielectric support material (paramagnetic or ferromagnetic) acts as a plasma catalyst promoter (PCP), which modifies the plasma characteristics whereas the transition metal catalyst performs the catalytic function. However, it was also shown that during the microwave-induced synthesis of the supported catalysts, BaTiO3 underwent a paraelectric-to-ferroelectric-to-piezoelectric phase transition, Akay [3,39,67,82,83]. Therefore, BaTiO3 now acted as a piezoelectric catalyst activated by microwave radiation in air converting nitrogen to NOx through a local (in micrometer size domains) chemical-looping process in plasma. The transition from ferroelectric to the piezoelectric phase also proceeds under plasma at a slower rate over a long period of on-stream in nonthermal plasma reactors [3,39,67]. This phase transition is primarily detected [39,67,83] by XRD of BaTiO3 when the reversal of the intensities at the following Bragg angles 45.1° and 45.5° corresponding to the reflections (002) and (200), respectively, as shown by Akay [83]. Microwave irradiation and exposure to plasma also result in extensive physical and chemical structural changes in BaTiO3 as detected by SEM at high magnifications [83], as well as color change from white to brown and then to black.
The piezoelectric phase transition in BaTiO3 is permanent and the catalyst activation (electron–hole pair generation) is achieved through mechanical strain. During the plasma reactions, fluctuations in plasma power, either intentionally (as in pulse plasma [68,83]) or random-spatial stresses due to plasma and thermal transients, will activate the piezoelectric catalysts. It is, therefore, necessary to identify the phase distribution in perovskites used as catalysts or plasma catalysis promoters.
Although heterogeneous catalysts benefit from high levels of porosity and interconnectivity for the accessibility of the catalytic sites, there is a major difference between thermal and plasma catalysis. As plasmas can only be generated in (sub)-micron or greater size pores, oxides of highly porous structures with pore sizes below 1 μm and large internal surface areas are not beneficial for maximum interaction between the active metal catalyst and the plasma [5] and the pore size in plasma catalysts should be larger than the Debye length, which is defined by the electron density and temperature in the plasma [58,59,60,61,66]. In most plasma reactors and processing conditions, this translates to a pore/pore interconnect size of several 100 nanometers [58].

1.2.7. Plasma–Catalyst Interactions

By definition, thermochemical catalysts or indeed catalyst support do not undergo any structural changes during reaction. However, catalytic plasma reactions appear to be symbiotic/synergistic; plasma modifies the catalyst structure, which in turn modifies the plasma [67,68,69,70,71]. As heterogeneous catalysts are almost all supported, the activity of the support (usually porous metal oxides/zeolites or silica/carbon/graphene) also strongly affects the catalyst and plasma reactions through their direct involvement [71,72,73,74,75,76,77,78,79,80,81,82,83]. Therefore, in the design of plasma-catalysts, the understanding of plasma reaction mechanisms through experiments and modelling is crucial. Conversely, the reaction mechanisms should also take into account the structures of the catalyst and its support.
In thermochemical catalysts, the catalytic activity decays due to poisoning [84], for example, carbon deposition. In plasma reactions, conversion and selectivity can increase [74] with time until the interaction between plasma and structural modification of the catalyst reaches equilibrium. The removal of plasma in the catalytic plasma Fischer–Tropsch synthesis causes rapid decay of the catalyst activity due to carbon deposition but the restoration of the plasma reverses the catalyst poisoning [74]. Similar results were also obtained in catalytic CO2 hydrogenation with or without plasma [85]. The absence of catalyst poisoning is of major industrial importance and therefore, in the cost comparisons between thermochemical and plasma methods, it should be taken into consideration.
Reactors with separate plasma and catalytic reaction zones (post-plasma reactors) are only useful for the long lifetime plasma generated reactive species with short residence time [58]. Otherwise, plasma generation and catalytic reaction should almost be simultaneous and take place in the same zone (in-plasma reactors) [58]. Having established the importance of in-plasma reactors, the same consideration also applies to catalyst design. As pointed out by Rouwenhorst et al. [58], the majority of the pores in a typical support material are smaller than 50 nm, and only plasma-activated species with a sufficiently long lifetime can penetrate into the pores, while most other species recombine or decay to the ground state before reaching the active catalyst surface within the pores. Thus, the contribution of the external surface area is likely to dominate in most cases [58]. The modification of plasma characteristics in the plasma space through the application of an electric field and dielectric packing will affect both the electron temperature and plasma chemistry.
Plasma catalysis proceeds on the catalyst surface affecting the absorbed species not necessarily penetrating into the catalyst interior due to Debye-length restrictions. It is, therefore, possible to enhance surface reactions through the choice of packing material as well as catalyst. As a packing material, for the modification of plasma characteristics, ferroelectrics with high dielectric constants yield significantly higher conversion and efficiency compared with dielectric materials [69,70,74,86,87,88,89,90,91,92,93]. Gomez-Ramirez et al. [88,89,90] used glass and Al2O3 as dielectrics and BaTiO3 and lead zirconate titanate (PZT) as ferroelectrics to demonstrate the effect of the packing material on the plasma current and ammonia yield in a packed-bed reactor. Both measures of high plasma efficiency were achieved with ferroelectrics compared with dielectrics. PZT performed better than BaTiO3 (Curie temperature is ca. 120 °C) due to the high Curie temperature of PZT. Even if the reactor wall temperature were to be below the Curie temperature, local temperatures within the packing material can exceed the Curie temperature thus transforming the ferroelectric structure to dielectric.
In nonthermal catalytic plasma reactions, the catalytic enhancement of selectivity and conversion can be attributed to two distinct effects: (1) Promotion of plasma as described above and (2) Promotion of catalytic (active) sites. As both effects result in the same outcome, they can both be regarded as catalysts. However, the promotion of plasma is often achieved through the use of very high dielectric constant ferroelectrics, below the Curie temperature, rather than dielectrics. These plasma promoters essentially enhance the reactions on their surface and in the plasma space and are therefore referred to as Plasma Catalysis Promoters (PCPs) [67,69,70,74]. As packing materials, they are often used as large particles (1–5 mm) so as to create large inter-particle plasma zones. They have almost no porosity with a surface area of no more than 1 m2/g.

1.2.8. Supported Nano-Catalysts with Semi-Conductor Characteristics and Crystal Defects

We have already discussed the desirable catalyst structures for plasma reactions. The emphasis should be given to the catalyst morphology of low-cost transition elements rather than costly noble metals, which are more widely used in thermochemical reactions. Currently, the emphasis in plasma catalysts is on the development of defect-rich morphologies, which will enhance the accessibility and concentration of active sites such as step sites (preferential reflection), as well as lattice vacancies that can be created without having to dope catalysts. However, the quantification of the structural heterogeneity (electronic and geometric) in the supported heterogeneous catalysts is still lacking.
Unlike all supported metal catalysts, catalysts developed by Akay [82,83] are synthesized from a liquid state in which the catalyst(s) precursor(s) (usually nitrate salt(s) in water) and support precursor (usually silane-coated SiO2 or TiO2 or their combination in water) are present in the combined precursor fluid. This fluid can also contain perovskite particles such as BaTiO3. Only the surface of the agglomerated SiO2 (or TiO2) particles is silane-coated and these particles are available in the nominal size range of 4–12 nm. The precursor fluid has low shear viscosity but high extensional viscosity even at very high catalyst support concentration due to silica particle stabilization by silane coating. The combined precursor fluid can contain small particles (ca. 50 µm) of co-support/co-catalyst (such as BaTiO3) particles as plasma promoters/co-catalysts. When the combined precursor fluid is subjected to microwave irradiation in air, film boiling takes place, forming thin liquid films due to the high extensional viscosity (and elasticity) of the fluid. The film thickness is ca. 100 nm–100 µm, depending on the rheological characteristics of the combined precursor fluid as well as the concentration of the dissolved and dispersed constituents of the precursor fluid. As the precursor fluid becomes viscous, the film thickness increases and the dispersed particulate phase is trapped within the film.
These films are responsible for the co-assembly of the catalyst and catalyst support, which also undergoes de-agglomeration and de-aggregation forming nano-scale molecular assemblies [82,83]. When the films collapse back into the precursor fluid, they have already undergone co-assembly. Water evaporation and catalyst salt decomposition at the air-water-silane interface result in the stabilization of the thin films as the reactions at the air-water or air-solid interfaces are very rapid in the presence of reactive species including hydroxyl ions [82,83,94,95,96]. However, upon re-entry into the bulk solution, they do not re-dissolve in the fluid but accumulate as layers of long thin strips. Following water evaporation, the resulting porous solid mass undergoes catalyst precursor decomposition provided that the microwave power input is above a threshold. This critical microwave power is dependent on the catalyst loading and the atomic number of the catalyst. In the case of binary and tertiary catalysts, the critical power is reduced substantially. The decomposition of the catalyst nitrate salt is very rapid and auto-catalytic due to the fact that the surface reactions are very fast at the air–water interface [82,83,94,95,96]. Depending on the type of catalyst and microwave power, the whole process typically ranges from 1 to 4 min.
For brevity, we represent these silica-supported single catalysts as M/Si = X where X is the molar ratio of the catalyst (M) and SiO2 support (Si). In the case of binary catalysts (M1) and (M2), they are represented as M1/M2/Si = X/Y/Z. When BaTiO3 (BT) was used as a co-catalyst in silica-supported single catalysts, the structure was represented as {M/Si = X}/BT = Y. In all cases, X, Y, and Z are the molar ratios. The structures of M/Si = X, M1/M2/Si = X/Y/Z or {M/Si = X}/BT = Y were evaluated through extensive TEM and SEM studies [82,83] and a tentative mechanism was proposed [83]. These catalysts with a semi-conductor type of structure are highly porous (porosity ca. 70% with a nominal tap density of ca. 0.2 g/cm3) and have a hierarchic pore structure that allows the penetration of plasma into the pores thus creating 10–100 µm size plasma zones. However, another important reason for plasma penetration into the catalyst pores is their semi-conductor structure. Such catalytic structures thus allow the utilization of the catalyst interior regions making the catalyst surface area meaningful. Typically, the surface area decays from the surface area of silica (~300 m2/g) to 100 m2/g as the catalyst loading is increased to ca. 70 mol%. BaTiO3, as a plasma catalysis promotor, and these catalysts at a loading of 20 mol% have been used in nonthermal plasma reactions including ammonia synthesis [67,69], direct conversion of CH4 to hydrogen and higher hydrocarbons [70], Fischer–Tropsch synthesis [74], CO2 splitting [86,87], CH4 dry reforming [97,98], in all of which high conversions have been achieved over a period of several days without decay in plasma activity.

1.2.9. Microwave-Induced Plasma Generating Catalysts

More recently [83], it was shown that both BaTiO3 and these catalysts could generate plasma in air when subjected to microwave irradiation, producing NO and NO2 when the molar ratio of the catalyst and the support, SiO2, is approximately greater than 1/2. Extensive SEM and XRD and Energy Dispersive X-ray spectroscopy (EDS) studies showed that the catalysts had a high degree of chemical and morphological heterogeneity as determined through the spatial distribution of oxygen concentration and the catalyst/support ratio, both of which result in morphological heterogeneity.
Furthermore, although they are termed as supported catalysts, their structure, properties and response in plasma reactions are different from the classical supported catalysts. They undergo structural change during plasma reactions over an extended period (several days) but the chemical and morphological heterogeneity increase with microwave irradiation within minutes.
In this study, the characteristics of these catalysts and the mechanism of structure formation as a result of processing under the combined radiation (microwave or UV) and flow have been evaluated. Combined with their performance in various reactions, these analyses help us engineer plasma-responsive heterogeneous supported catalysts with high activity and quantifiable heterogeneity. In the understanding of the catalyst–plasma-reaction interactions, we also consider inherent quantum effects present due to the nano-structure of these catalyst systems and catalyst porogenesis which results in the generation of dusty (complex, non-ideal) plasma.

1.3. Critical Processes

1.3.1. Gasification

The annual renewable energy potential of global biomass waste is approximately eight times that of the global energy demand [99,100]. This energy source compares well with wind-based energy potential (ca. seven times) but is well below that of solar energy at ca. 100-fold. However, compared with wind and solar energy resources, the spatial distribution of biomass is narrow and near the population centers thus easier to harvest and utilize [67,99]. Further, unused biomass undergoes bacterial degradation and emits biogenic CO2 as well as more potent greenhouse gases such as CH4 and NOx. Biomass is also the only renewable source of carbon (and its derivatives) that can always be captured and utilized as soil additive (biochar and bio-ash from gasification) in order to achieve net negative greenhouse gas emission.
In recent years, there has been a concerted drive for the techno-economic feasibility, life cycle and environmental impact assessments of bioenergy from various types of biomass and biomass waste and the means of achieving the most efficient biomass-to-energy-and-chemicals conversion [67,99,100,101,102,103,104,105,106,107,108,109,110,111,112,113,114,115]. These studies show that bioenergy with carbon capture and storage (BECCS) has the potential to limit global warming by providing net negative greenhouse gas emissions [100,101,102,103,104,105,106,107,108,109,110]. In biomass-to-chemicals conversion, including ammonia production and in bioenergy applications, hydrogen is always the limiting chemical. Compared to electrolysis and fossil-based processes with carbon capture, only BECCS can provide carbon-negative hydrogen and this route is more favorable as regards human health impact and near-term economics [100,109].
According to the above-cited analyses, the thermochemical conversion of biomass to bioenergy and chemicals using gasification is the most energy-efficient process with the lowest environmental impact, as also determined by the exergy measure of impact [99,100,101,110,111,112,113,114,115]. It is also interesting to note that compared with the biological route, the thermochemical conversion of biomass is the preferred option, mainly due to very rapid conversion rate, its robustness and flexibility.
Biomass-based energy-chemical production facilities, including gasification, however, carry the burden of “Economies of Scale” and therefore a high degree of innovation is necessary to circumvent these disadvantages [67,99]. This is because of the fact that the availability and characteristics of biomass are localized and the gasifiers must be small-scale, typically 1–5 MWe in capacity per reactor. However, the downstream processes such as syngas cleaning, direct power generation from clean syngas using internal combustion engine or gas engine generators or syngas-to-chemicals conversions can be carried out at higher capacities since at that stage, to a large extent, syngas loses its source identity. Higher capacity syngas processing is therefore carried out by combining outputs from several gasifiers, typically at 20–50 MWe. However, the economic viability of bio-syngas as feedstock is highly dependent on the price stability and relatively high cost of natural gas and electricity. This represents an important impediment to the development of bioenergy and fully commercial gasifier—syngas cleaning—syngas conversion technologies.
Gasification is a complex technology due to feedstock variability. When air is used as the oxidant in the gasifier, a high concentration of nitrogen (ca. 50%) and oxygenates are present in syngas, which lowers its calorific value and processing efficiency and increases toxin emissions. Low calorific value syngas cannot be used in continuous electricity generation as small fluctuations in calorific value cause disruption to the gas engine electricity generation. Hence, oxygen-enriched air, water, chemical looping agents or carbon dioxide as oxidation agents are used to increase the calorific value and make syngas-to-chemical conversion more efficient [67,99,101,105,106].
In this study, we confine our attention to biomass-based sustainable energy, ammonia and smart fertilizer production through gasification, CO2 utilization, syngas upgrading and syngas cleaning followed by conversion of clean syngas to ammonia and/or sym-biotic/smart fertilizers through catalytic plasma processes. We also report the results obtained from 2 MWe and 50 kWe scale gasifiers in which real biomass was used and the produced syngas were subjected to tar removal/syngas cleaning processes. In the case of the 2 MWe gasifier, clean syngas was used in electricity generation. However, due to the complexity and scope of such an undertaking, we used a model syngas (with no tar or contaminants) in the catalytic plasma conversion to ammonia and subsequent fertilizer production with CO2 sequestration. It is important to use real biomass in gasification as model compounds do not undergo successive physical-chemical transformations as biomass does. The understanding of these changes is essential in scale-up, start-up, shut-down and continuous power production or syngas conversion to chemicals or fertilizers.

1.3.2. Syngas Cleaning

In the case of the down-draft fixed-bed gasifiers developed by the author, the existing syngas cleaning technology based on commercial Wet Electrostatic Precipitators (for tar and particulate removal) or direct syngas scrubbing were sufficient to produce electricity through gas engine generators at large scales (500 kWe–2 MWe) using various biomass feedstock [67,99,114]. However, further tar removal or conversion of tars to low molecular mass hydrocarbons is necessary for the conversion of syngas to liquid fuels or chemicals, including ammonia [3,74,103,104,105,106,107,110,111,112,114,115,116,117,118,119,120,121,122,123,124].
Essentially, there are two techniques for tar removal, which involve cracking of the tar molecules to smaller molecules or removal of the tars through absorption or precipitation via syngas washing. In situ tar cracking within the gasifier (primary tar cracking) is clearly the preferred option as it does not require an additional unit operation and it can utilize the heat generated within the gasifier. In situ tar cracking enhances the calorific value of the syngas by ca. 10% and hence the processing efficiency. In order to enhance in situ tar cracking, it is possible to use thermochemical catalysts [117] which, however, can have adverse implications on cost and environmental impact. Further, there is no specific additive for general-purpose tar cracking applications suitable for all biomass/biomass waste gasification [118]. However, CaO minerals [119,120,121], which have an array of catalytic metals, are often utilized as natural catalysts and are capable of sequestrating acidic compounds including HCl and SOx as well as being used as a chemical-looping agent for biomass oxidation in gasification [118,119,120,121].
In most applications, in situ tar cracking must be followed by syngas scrubbing (and drying) to remove the particulates and water-soluble components in syngas. This process thus further removes the tars with high dew-point and the resulting syngas can be used in gas engine electricity generators [99,114,122]. However, when converting syngas to valuable chemicals, such as liquid fuels and methanol, more stringent cleaning is necessary [122,123,124]. These methods include thermal plasma as a means of tar cracking and co-gasification [125,126,127].

1.3.3. Gasifier Ash as Micronutrient-Rich Soil Additive

As ash from the gasification of some waste streams can contain harmful components such as heavy metals, their ash (also known as fly ash) cannot be used in agriculture. However, ash from biomass/biomass waste from controlled sources is suitable both as a soil additive and a source of micronutrients. Therefore, it can be classified as bio-ash to reflect its source and generation.
In dealing with biological and chemical toxins in contaminated biomass, maximum gasifier temperature and the residence time in the maximum temperature zone (oxidation zone) are regulated, which can affect the calorific value and the biomass-to-fuel conversion efficiency as well as the capital and operating costs of the gasifier. This is because the high-temperature requirement (for the destruction of toxins, ca. 1200 °C) increases the capital cost. The solid material (fly ash) from the gasifier contains carbon at 2–25 wt% [44,45,46]. Regulatory authorities in the UK limit the amount of carbon in ash to less than 5 wt%. In order to achieve this condition, gasifier outlet temperatures are kept high or a second oxidation zone is added to the gasifier [39,67]. Although ash-carbon reduction enhances syngas output, overall energy efficiency is lowered due to higher temperature at the gasifier outlet. An alternative method is to use bio-ash from the gasifier as a micronutrient-rich soil additive to improve ecosystem and crop yield [47,48,49] or other applications [50]. The presence of high carbon concentration in bio-ash can be justified on the grounds of gasifier efficiency and the economic benefits of gasifier bio-ash. Biomass-derived ash from the gasifier would have a higher concentration of micro-nutrient (metals) compared with pyrolysis biochar.

1.3.4. Tars as a Natural Herbicide and Pesticide

Tars from wood represent a class of natural herbicides and pesticides [4,5,128,129,130,131,132]. The use of tars and pitch oil from the pyrolysis of wood (mainly pine and birch) has a long history of use in communities as a disinfectant and the current trend is seen as a revival [133,134]. The use of tars from biomass/biomass waste in agriculture will not have the same restriction as domestic use. Therefore, following tar cracking, a second stage of dry tar deposition/precipitation can be implemented using suitable absorbents such as sulfonated-nitrated PolyHIPE Polymers. They not only remove tars but also metal ions because such polymers behave like surfactants. Tar-loaded PolyHIPE Polymers are then recycled back into the soil as micro-nutrients, herbicides/pesticides, water absorbents and soil conditioners.

1.4. Critical Process-Intensified Reactors

1.4.1. Process Intensification (PI)

The critical reactors for the proposed sustainable ammonia and smart-symbiotic fertilizer production based on biomass (as a source of carbon and hydrogen) with or without CO2 capture and utilization should be based on Process Intensification (PI). This approach is necessary for techno-economic reasons since the production facilities are distributed (locally operated), small scale (ca. 5–50 MWe energy output as opposed to >500 MWe plants based on current centralized plants), and the capital and running costs must be competitive. Several other attributes of process-intensified plants make them ideal for small-scale operations without the burden of economies of scale [2,3,39,67,135]. The important facilitators for intensification in such reactors include [2]: (a) Large surface area density (surface area per unit volume) for heat and mass transfer; (b) Presence of at least one “intensification field” such as electrical, plasma, microwave or UV radiation field; (c) In situ separation of products to shift the chemical equilibrium or to prevent product decomposition; (d) The existence of a driving force for diffusion and reaction such as reactive in situ separation of products, catalysts with accessibility of reactive sites and short diffusion path for the reactants and products.
The facilitation of PI by reactive separation with easy accessibility of reactive sites requires a barrier/resistance-free diffusion path to the reaction zones (low activation energy). However, this concept has not been implemented in reactor designs in non-intensified reactors. In situ separation is often carried out using membranes, including ion transport dense membrane reactors, which function through electrochemical or catalytic reaction pathways [3,67,136,137,138,139,140,141]. Ionic membranes are most useful for separations at high temperatures (ca. 800 °C) encountered, for example, in gasification [67]. The specific separation processes include: hydrogen separation from syngas, oxygen enrichment of air or oxygen separation from air [3,139] or separation of oxygen from reaction mixtures, such as those encountered in CO2 splitting [141], and when a specific gaseous molecule needs to be permeated [3,138,139]. Nevertheless, a membrane barrier still restricts the rate of permeation; requiring ionization at the feed side membrane surface, diffusion through the dense membrane and recombination at the permeate side of the membrane. Permeation can be enhanced by the application of an electric field across the membranes [3,67,139].
Recent reviews [80,142,143] and advances in novel reactors with absorption in gasification [144,145], catalytic plasma-based ammonia synthesis, Fischer–Tropsch, dry reforming of methane and CO2 splitting are available [3,39,146,147,148,149,150,151,152]. In particular, thermochemical equilibrium analysis by Hessel et. al. [148,151] lead to novel ammonia, hydrogen and synthetic fuel production from CO2 processes and reactors. Although no industrial-scale plasma-based ammonia or other energy conversion plants are present, ozone production plants at an industrial scale are available. Ammonia produced by nonthermal plasma at atmospheric pressures is particularly suitable for reactive/absorption-based separations since the temperature and pressure swings required are not as significant as those encountered in the Haber–Bosch process. In situ separation of ammonia is important to shift the reaction to its formation as well as reduce the burden on the downstream separation and unreacted gas recycling. Non-reactive separation is carried out using absorbents when anhydrous ammonia is produced in a second desorption stage [146,147]. The absorption and desorption stages operate in tandem [142,143]. The efficiency gained in ammonia synthesis with product absorption is affected by the absorption capacity, absorbent porosity characteristics and the temperatures of the product outlet and absorption and desorption stages.

1.4.2. Multi-Reaction Zone Reactors (M-RZR) for Ammonia and Symbiotic Fertilizer Production and In Situ Sequestration/Separation

In situ separation of ammonia through absorption on suitable absorbents yields significant ammonia cost reduction [3,39,149]. The reactive separation techniques introduced by Akay [3,39] are particularly suitable for nonthermal plasma synthesis of ammonia or indeed other energy-related synthesis or CO2 splitting. It is based on the fact that in catalytic plasma reactions, the reaction is predominantly localized in the plasma zone. If the product can react with the reactive absorbent or sequestration material, placed in the vicinity of the plasma reaction zone, then ammonia is removed from the plasma reaction zone and immobilized. This process does not require any discrete barriers between the plasma reaction zone and the sequestration zone [3,39]. It was further observed and theoretically demonstrated that the diffusion of ammonia towards the sequestration zone is accelerated if the sequestration of ammonia is exothermic, which creates zero ammonia concentration on the sequestration material. As a sequestration material, sulfonated PolyHIPE Polymer (s-PHP) particles were used with a variety of mineral acids (sulfuric, nitric or phosphoric acids or their combination) absorbed by s-PHP. Therefore, the resulting material is a symbiotic fertilizer that acts as a synthetic root system enhancing plant growth and crop yield, especially under water stress, as demonstrated previously [4,5,6].
It was also demonstrated that CO2 gas can be injected into the emerging ammonia gas stream, which, upon cooling below 80 °C, forms solid ammonium carbamate [39]. The process can be carried out in a fluidized bed reactor seeded with ammonium carbamate particles using cold CO2. Enlarged ammonium carbamate particles are then recovered to obtain urea or allowed to decompose above 80 °C to yield CO2 and NH3. This process is therefore useful in obtaining anhydrous ammonia and will benefit from the low ammonia synthesis temperature in order to facilitate the sequestration reaction. Clearly, this process illustrates the importance of low-temperature and low-pressure catalytic plasma processes in ammonia synthesis.
To achieve in situ separation in catalytic plasma synthesis, a novel reactor system was developed. Figure 1 is a diagrammatic illustration of this reactor, called Multi-Reaction Zone Reactor (M-RZR) [3,39]. In M-RZR, catalytic plasma ammonia synthesis takes place in Reaction Zone-1. Produced ammonia preferentially diffuses to Reaction Zone-2 where it reacts with the sequestration agent (acidic PolyHIPE Polymer) to form symbiotic fertilizer. It is possible to use alternative sequestration agents such as acid-absorbed leonardite or biochar to enhance their nitrogen content. When CO2 is used as the sequestration agent, the design of Reaction Zone-2 is different; this reaction zone is now a fluidized bed operating below 80 °C. However, in both cases, there are no discrete barriers present between the reaction zones and the product gases (ammonia) migrate from the plasma reaction zone to the sequestration zone under an entropic driving force due to an exothermic sequestration reaction.
The spontaneous removal of NH3 shifts the equilibrium towards the product and hence conversion and selectivity are enhanced resulting in energy efficiency. For example [3,39], it is possible to obtain ca. 40% nitrogen conversion per pass with ca. 20% ammonia concentration in the product stream. The resulting Energy Cost (EC) is ca. 13 MJ/mol NH3, which is nearly an order of magnitude lower than a single plasma reactor without sequestration [3,69]. This technique also eliminates the costly process of recovery of unreacted hydrogen and nitrogen from ammonia so that they can be recirculated.
Process Intensification in reactors has several well-known features including in situ product separation through selective membranes, enhancement of surface area density for heat and mass transfer, carrier mediation, imposition of a PI processing facility such as electric, ultra-sound, plasma or stress (flow) fields [2,3,4,14,15,16,17,18,24,25,26,27,28,29,30,39,67,70]. Furthermore, the combination of such intensification fields and PI methods can result in hybrid reactors with extraordinary levels of intensification [39,67,82]. In diffusion-controlled processes or reactions, the reduction of the diffusion path is clearly a target for PI, which can be achieved by using reactors or catalysts with three levels of length scales, especially in gas phase reactions; (1) Macroscopic level for convective transfer, which is always necessary for industrial-scale application, (2) Nano level for mass transfer and (3) Microscopic level for reactor connectivity between the macroscopic and nano-scale levels of the reactor [2,3]. In fact, this concept already exists in physiological processes where mass transfer can take place through lipid bilayers, which can be further facilitated through neural control [153]. Chemical reactors modelled on physiological processes can have significant PI attributes when they are supplemented by structured catalysts operating at high temperatures and pressures in the presence of additional PI fields such as electric, plasma and microwave.
Nevertheless, physical barriers, however small in scale, provide heat and mass transfer restrictions and are dependent on the availability of suitable materials with desired selectivity and inertness characteristics under long-term operation conditions such as those encountered in membrane separations and reactions. Therefore, a new processing and reactor strategy should be devised and applied to catalytic reactions where even the nano-scale barriers and the thermodynamic equilibrium restrictions are eliminated to reduce the number of reaction stages. In this respect, the current ammonia synthesis is an ideal target for the demonstration of such concepts. Clearly, such a process cannot be applicable in general reaction engineering but its application to energy-intensive processes such as ammonia synthesis and other energy conversion processes is likely to make a real impact on the prevention of global warming especially if these processes are integrated at a global scale to deliver further energy and cost savings.

2. Globally Integrated Process-Intensified Sustainable Hydrogen, Ammonia and Fertilizer Production with CO2 Sequestration: A Roadmap

Following the above review and the basis of globally integrated process intensification in the development of sustainable food, energy and water production, we propose a roadmap to illustrate the connectivity, economic and technological symbiosis of these production platforms. It is this integration and symbiosis that makes the proposed technology sustainable and prevents the burden of greenhouse emissions from shifting between these fundamental sectors. This roadmap is applied to the production of symbiotic and smart fertilizer and ammonia-based fertilizer derivatives based on critical materials and unit operations described above. The investigated technology platforms do not exclude some of the fossil-fuel-based raw material inputs such as CH4, CO2, CO and bio-ash/biochar and mineral/carbon-based materials such as leonardite, as their use for some time is inevitable.
The current research is based on the technology roadmap shown in Figure 2. Central to this technology is the Multi-Reaction Zone Reactor. M-RZR (shown in Figure 1) with inputs including: (1) Plasma power source; (2) Catalysts; (3) Functional microporous polymers such as PolyHIPE Polymers, PHPs, (or equivalent) and natural carbon-based materials including biochar/bio-ash and leonardite. The raw material inputs include: (1) H2 either from water or CH4 (as currently practiced) or from biogas; (2) Syngas (containing CO, CO2; N2; H2; CH4 as the main components the proportion of which is dependent on the processing conditions) from various sources including from biomass (either as energy crops or most desirably biomass-waste) through gasification as well as N2 from air. When H2 is generated from the gasification of biomass/biomass waste, the inputs into the gasifier include biomass as well as O2 and N2 from air and H2O as the source of oxygen and hydrogen. The gasification plant includes the gasifier reactor, gas cleaning and hydrogen-enrichment units.
The output products from the gasifier include electricity and heat, bio-char and bio-ash and syngas to the M-RZR for conversion into ammonia with recycled CO2 or ammonia-based symbiotic/smart fertilizers (S-F) or urea depending on the operation conditions of the M-RZR. The technology and material inputs (such as plasma power source and reactors, catalysts and functional PolyHIPE Polymers or equivalent) to the M-RZR find other applications in chemical technology, micro-electronics, electromagnetic radiation absorption, biotechnology, medicine, pharmaceuticals, agriculture, soilless agriculture, soil and water remediation, gas cleaning and nuclear power generation, as described previously. Therefore, functional PHPs have the potential to be a large volume material/chemical/commodity product. This type of approach is clearly intended to lower the cost of input functional PHP as a recyclable material with an end-use as a soil conditioner and symbiotic smart fertilizer.
In the following sections, examples of the critical reactors with a small-to-pilot plant scale are provided. In the second part of this study, we provide a new insight into the nano-structure of the plasma responsive—plasma generating catalysts developed by the author and used in several of the examples provided in this work and elsewhere. All the equipment-reactors cited in this study were designed, manufactured and commissioned by the author and utilized by his researchers and industrial partners.

3. Hydrogen Generation and Biomass-to-Electricity Conversion by Gasification

3.1. Performance of a Large-Scale Down-Draft Fixed-Bed Biomass Gasifier

Hydrogen generation from biomass can be achieved by gasification the design of which significantly affects hydrogen yield and the calorific value of the syngas. Here, we present a novel gasifier based on the Multi-Reaction Zone Reactor (M-RZR) concept albeit with some restrictions. Due to the simplicity of ammonia synthesis, which essentially involves the activation of N≡N bond by non-thermal plasma and subsequent catalytic conversion to ammonia, it is possible to carry out the reaction in a M-RZR without barriers where the RZ-1 reaction is in the primary reactor (for NH3 synthesis) while the RZ-2 reaction zone is essentially used as a sequestration stage to affect the equilibrium conversion. The reaction mechanism of catalytic nonthermal Dielectric Barrier Discharge (DBD) plasma-based ammonia synthesis (with or without catalyst) and the experimental results indicate that ammonia is the only product from the DBD-plasma reactor [58,59,60,61,62,63,64,65,66,71,72,73,75,76,77,78,79,80,81]. In the presence of large numbers of reactive species that can also react with the sequestration agent at RZ-2, the M-RZR concept would be difficult to implement without further modification. However, the sequestration reaction at RZ-2 is essentially a neuralization reaction between NH3 and strong acid, it is unlikely that the reactive species in the plasma will take part in secondary reactions at RZ-2. Due to the pressure differential between RZ-1 and RZ-2 as well as the low overall temperature of the reactor (50–150 °C) the mineral acids absorbed by the acid carrier in RZ-2, the mineral acid diffusion to RZ-1 is not possible as the acid-base neutralization reaction is spontaneous.
When the M-RZR concept is applied to more complex reactions such as those encountered in the gasification of biomass for syngas and hydrogen generation, several restrictions are encountered for full implementation. Nevertheless, it is still possible to design a gasifier reactor through the concept of open reaction zones where the reactants emerging from various reaction zones are introduced to other reactants in order to achieve high selectivity and energy efficiency. Where possible, thermal energy and chemical potential associated with reactions should be utilized as the driving force for separation as demonstrated previously [3,39].
The first stage of syngas use is in electricity generation as the required syngas quality (in terms of particulate and tar concentrations) is not high. Due to the fact that biomass/biomass waste gasifiers are small-scale syngas generators, syngas must be used directly (after tar and particulate removal) in gas engine generators without a buffer zone where syngas can be stored. In most cases, tar deposition and precipitation require a second stage (outside the gasifier reactor) for tar recovery and tar disposal. Tar cracking during gasification is the preferred option because this process benefits from the catalytic action of several metal oxides present in the biomass. Further, it increases syngas calorific value. In order to prevent the release of a cocktail of toxins, particulates and metal oxides in flue gases into air during combustion in the gas engines and to prevent damage to the electricity generators in the long term, tar and particulate removal by using water scrubbing followed by drying of syngas is necessary. Wet Electro-Static Precipitators (WESP) are often used for this purpose [154,155,156,157,158,159].
Two gas engine generators (Janbacher GmbH, Frankenthal, Germany) were used to generate electricity from the syngas obtained by the gasification of various biomass and biomass waste and the electricity was fed to the UK National Grid. These generators were capable of operating with syngas with a calorific value as low as ca. 3 MJ/Nm3. The down-draft fixed-bed 2 MWe gasifier was based on the patented design by Dogru and Akay [114], which was scaled up from 50 kWe to 1 MWe and then to 2 MWe output capacity.
The fuel was wood waste with characteristics shown in Table 1. Methods of analysis and the definitions commonly used in the gasification studies are available in various previous publications by the author [99,114,119,123,154,155,156,157] and some recent comprehensive reviews, which are also useful for comparative gasifier performance [160,161,162]. The Equivalence Ratio (ER) was ER = 0.25, which represents the ratio of oxygen in the air intake and the stochiometric oxygen required for complete combustion.
Table 2 provides the composition of the syngas from a down-draft fixed-bed 2 MWe gasifier and the composition of the emerging effluent gas after the electricity generator. Table 2 also shows the corresponding upper emission limits of the various chemicals in the effluent as required by the European Waste Incinerator Directive (EWID). The data provided here can be considered to be a typical baseline for the first stage of biomass/biomass waste-to-usable energy conversion. As seen from Table 2, the calorific value of the syngas is 5.2 MJ/Nm3, which is twice the amount required for the continuous operation of the electricity generator.
The above results indicate that the performance of a 2 MWe biomass waste gasification plant (including syngas cleaning) based on the patent [114] is satisfactory to generate electricity using sufficiently high calorific value syngas. The flue gas emissions are well within the European Waste Incineration Directive (EWID) limits. However, primarily, syngas hydrogen concentration must be significantly enhanced at the expense of CO2, N2, CO. Further, tar concentration should be reduced below 1 mg/Nm3 in order to convert syngas from biomass to valuable products including ammonia, fertilizers, liquid fuels, methanol, ethanol [122]. In the following sections, we present the preliminary results including the structure and performance of a novel 50 kWe pilot plant scale multi-oxidant (Air, O2, H2O and CO2) gasifier and syngas cleaning equipment operating under catalytic electric and plasma fields.

3.2. Multi-Oxidant and Up-Down-Draft Fixed-Bed Gasifier Design

The design of the present gasifier is based on the experience gained from two large-scale (1 and 2 MWe) [114,154,155,156,157] and a pilot plant gasifier [67,99,119,123,124]. Nevertheless, the current design has several unique features, which allow it to operate under various operating conditions in order to achieve H2-enhanced syngas suitable for ammonia or fertilizer production with CO2 utilization. The important design characteristics and image of the present gasifier are shown in Figure 3a–e.
Figure 3a is a simplified diagram and Figure 3b is the engineering drawing of the pilot-scale 50 kWe capacity fixed-bed gasifier reactor. In Figure 3b, the full height of the reactor is 2363 mm and the maximum height of the pilot plant shown in Figure 3e is ca. 3.5 m. Figure 3e does not show the biomass loading facility and second-stage syngas cleaning. The following facilities and reaction zones can be identified in these figures:
(a)
Feed Zone (68): Biomass is fed into the Feed Zone (68) using the feed screw (70) via an airlock.
(b)
Drying Zone (72) and Combustion Zone (80): As the biomass fuel moves downwards, hot combustion gases from the Combustion Zone (80) heat the biomass fuel and remove moisture from the fuel. The oxidant for the Combustion Zone (80) is air-fed from the air inlet (78). This facility is primarily used if bridging takes place. This method ensures that syngas quality is not compromised and the bridge is broken without having to use physical methods.
(c)
Pyrolysis Zone (82): Below the localized Combustion Zone (80), the Pyrolysis Zone (82) is located for which heat is provided by the oxidation zone below.
(d)
Oxidation Zone-1 (84): The partial oxidation of biomass is initially provided by supplying either air or externally oxygen-enriched air and the flue gases are removed from the exhaust (76) through an up-draft gasification mode. Once the temperature reaches ca. 800 °C, the oxygen-selective membranes become operational. Then the flue gas valve is closed and the syngas is withdrawn from the top of the outer reactor as illustrated in Figure 3a,b. When the steady state is established and the temperature in the oxidation Zone-1 reaches ca. 1200 °C, CO2 or H2O is injected into this zone (84a) through the inlet (100). A similar facility is present to inject CO2 or H2O into the reduction Zone (90) as shown in Figure 3c.
(e)
Reduction Zone (90): The Reduction Zone (90) is in the form of a catalytic vortex flow reactor, illustrated in Figure 3c. Gases from the Oxidation Zone (84) enter into the Reduction Zone (90) through the perforated grid (88). Zone (90) is in the form of a ring-main to which four vortex arms (94) are attached. The number of vortex arms can be increased with increasing syngas generation capacity. These tubular stainless steel vortex reactors are lined with porous nickel mesh and coated [34,35] using a silica-supported nickel catalyst (denoted as Ni/Si = 1/4 Mw-A) [82,83] for in situ thermal tar cracking. Syngas is accelerated through this reactor while mixing with either carbon dioxide or steam as oxidant. The injection of water into the ring-main (90) results in a rapid pressure rise and steam surge through the vortex arms and it results in the removal of particles from the catalyst surface. At the outlet, gases from the vortex arms impinge onto the wall of the outer reactor to separate the gases from the particulates in a cyclone process. These particles are small (<0.5 mm) as larger and denser particles move from the oxidation Zone-1 (84) directly into the second oxidation Zone-2 (103) under gravity. In order to reduce the load on the syngas suction fan, water injection is carried out at 3 bar through a non-return valve. The evaporation of water increases the pressure in the gasifier Reduction Zone (90).
(f)
Oxidation Zone-2 (103): Separated gases from the Reduction Zone (90) are sucked upwards in the annular space between the walls of the inner and outer reactors and leave the gasifier. Under steady-state operations, the gasifier operates in down-draft mode. However, in order to strip the bio-ash from its carbon, the surviving biomass particles from gasification are subjected to oxidation in the Oxidation Zone-2. The supply of the oxidant to this zone is identical to that in Oxidation Zone-1. The resulting gases from this Zone (103) flow vertically upwards into the Reduction Zone (90) under the action of the suction fan. In Zone (90), they mix with the gases from the oxidation Zone-1 (84) while the carbon-stripped bio-ash is collected at the entrance of the ash-removal auger (30) and removed gradually as they also act as a seal for the gasifier. Due to the high concentration of solids in this zone, a surface scraper (106) operates in this zone where the operation mode of the gasifier is up-draft.
(g)
Air Separation/Oxygen Enrichment Zone (20): There are two air separation/oxygen enrichment Zones both represented as (20) in Figure 3a and Figure 3d. They provide oxygen-enriched air to oxidation Zones 1 and 2. They are identical in structure but the oxygen enrichment level in Zone-2 (84b) is lower depending on the desired level of carbon-stripping. The structure of these zones is shown in Figure 3d. Air intake (16) into the air-space (108) allows the establishment of thermal equilibrium so that the oxygen-selective dense membrane (15) is at ca. 800 °C although these membranes can operate at a lower temperature (ca. 600 °C) [3]. Therefore, the temperatures in the oxidation Zones 1 and 2 are >800 °C and 600 °C, respectively, commensurate with the temperatures of these zones. However, the surface wall temperatures in these zones are very high (ca. 1000–1300 °C) due to syngas combustion on oxygen-rich surfaces. The oxygen-selective membrane (15) is supported by a microporous Ni-B metal to protect the membrane against thermal spikes. Oxygen atoms permeate through the membrane and recombine to form oxygen molecules on the permeate side in the O2 space (110) before entering into the oxidation Zone (84) through the perforated high-temperature stainless steel wall (111) and another perforated ceramic lining (112). Examples of oxygen-selective membranes include perovskites such as BaCo(0.4)Fe(0.6−x)Zr(x)O(3−δ) where x = 0–0.4 and δ is the oxygen vacancy. Oxygen permeation is enhanced by the presence of an exothermic reaction on the permeate side as this creates a very large entropy-based driving force for diffusion as shown previously [3,138]. Membranes are sealed in their position using commercially available high-temperature ceramic sealants [3,138]. The retentate air stream leaves the oxygen separation zone at the exit (18) with enhanced nitrogen content.
(h)
Other Facilities: Syngas from the gasifier outlet is subject to syngas cleaning, which results in tar recovery. Tars and bio-ash can either be utilized in various applications or returned to the gasifier from the inlet port (37). As seen from Figure 3b, in addition to the main syngas outlet and outlet (76) there are four gas sampling ports, which are located at the Drying Zone (72), Pyrolysis (82) Oxidation Zone-1 (84) and Reduction Zone (90). The temperatures in these zones as well as at the oxidation Zone-2 (103) and syngas outlet are also monitored. The data collected are used to control the syngas quality as well as to ensure a continuous operation. Under normal operating conditions, the gasifier is started by using air- or oxygen-enriched air so that excessive heating of the gasifier is avoided. Alternatively, a mixture of oxygen and CO2 can be used for this purpose. When the equilibrium is reached with temperature in the oxidation zone ca. 1200 °C, intermitted water injection can start for steam gasification. However, water injection lowers the temperature and hence water injection is terminated until the next cycle when the temperature of the oxidation zone is reduced to 1000 °C. In this way, the average temperature in the oxidation zone is kept at ca. 1100 ± 100 °C. However, this temperature can be increased or reduced at will through primary changes in the equivalence ratio and water injection frequency and its amount.
Although air-fired gasifiers produce low calorific value syngas, nitrogen, which accounts for ca. 50% of syngas, acts as a carrier of syngas and reduces the excessive surface temperature of the reactor. However, this function can also be achieved by using CO2 or water, both of which enhance syngas calorific value, and in the case of water, it also increases H2 concentration. As shown in Figure 3a,b, CO2 and water/steam injection can be carried out in both the oxidation and reduction zones. Another advantage of water injection in the reduction zone is the lowering of the outlet syngas and ash temperatures while enhancing the syngas calorific value. Steam gasification results in lower tar generation.
Finally, the image of the 50 kWe multi-oxidant pilot plant gasifier is shown in Figure 3d before commissioning and commissioning experiments. This figure depicts the general assembly of various unit operations including the gasification reactor and syngas cleaner and the footprint of the plant.

3.3. Multi-Oxidant Gasification of Biomass for Hydrogen Generation

Although the design of the current gasifier is novel, the methodology used in its performance evaluation is the same as those based on our previous studies [67,99,119,123,124]. In the present study, we initially used air as the oxidant at an Equivalence Ratio of 0.25. In this case, air was injected into the gasifier at the oxygen/air space (at location 84 in Figure 3a,b,d). Wood chips were densified to form pellets of 8 mm diameter and ca. 30 mm length. During gasification, the composition of syngas and the temperature of drying, pyrolysis, oxidation and reduction zones were monitored. The variation of syngas composition as a function of time is shown in Figure 4. Here, the multi-oxidant gasifier operating in down-draft mode was used with air as the oxidant at an Equivalent Ratio = 0.25. As seen in this figure, within ca. 60 min, a steady state is reached although fluctuations in temperature and compositions are present primarily due to feedstock loading and variability in the feedstock composition and the packing rearrangement in the fixed-bed as fresh feed is added.
Water injection was carried out after the temperature in the Oxidation Zone-1 reached ca. 1200 °C. It was carried out in pulses when water was injected into the gasifier through the oxygen/air space so that steam constituted 5 wt% of the oxidant. Table 3 is the summary of the gasifier performance summarizing the syngas composition at the gasifier outlet. Due to the variations in temperatures in various locations and that of the syngas composition, we have provided the range of syngas composition as well as the average values of H2/CO, H2/N2, Cold Gas Efficiency and Average Low Heating Value (LHV).
It was found that the gasifier is able to run without bridging for ca. 10 h when the process was discontinued. The monitoring of temperature and gas composition ensures consistency in syngas quality through a feedback control system. It can be seen that the hydrogen content of syngas increased by ca. 3-fold and CO concentration and Low Heating Value (LHV) were enhanced by a factor of 2 when water was used as co-oxidant with air. The cold gas efficiency which is a measure of the feedstock energy to chemical energy conversion efficiency, increases from 78% to 89%. As seen in Table 3, the H2/N2 ratio increases by a factor of 10 from 0.22 to 2.3 when the air feed was added 5 wt% water.
The current initial results indicate that the multi-oxidant gasifier can deliver high H2/CO and H2/N2 ratio syngas for syngas-to-chemicals conversions. Both CO2 and H2O can be injected into the O2 space or the catalytic vortex reactors (Figure 3 (Location 84) and (Location 90) respectively). Injection into the oxygen space is necessary to stop excessive temperature rise. Water and CO2 injection into the catalytic vortex reactors reduces tar concentration and enhances H2 and CO concentrations. By adjusting the O2/N2/CO2/H2O ratio in the oxidant feed, syngas composition with a desired H2/CO/N2 can be obtained for a given specific reaction. It is interesting to note that when the Haber–Bosch process is carried out under microwave irradiation under moderate pressures (0.1–0.65 MPa) and temperatures (280–400 °C) using Cs-Ru/CeO2 catalyst, maximum ammonia production was achieved at H2/N2 =1/1 with a broad maximum range approximately spanning from 1 < H2/N2 < 2 depending on the pressure [162]. The corresponding H2/N2 ratio in the plasma reactor is ca. 3/1 at the stochiometric value. Therefore, the syngas composition from the gasification of biomass is suitable for the Haber–Bosch process with microwave radiation intensification. H2/N2 can be further enhanced by increasing the amount of water injection at each injection cycle or by increasing the O2/N2 ratio in the oxidant air feed.
As seen from Table 2 and Table 3, the syngas composition and calorific value of the 2 MWe and 50 kWe gasifiers are similar when operated using air as the oxidant. It is demonstrated in Section 6 of this paper that clean syngas containing H2, CO, CO2, N2 can be used to obtain ammonia and urea through the ammonium carbamate route using nonthermal plasma. Therefore, syngas with a high H2/N2 ratio is desirable and it can be achieved by using oxygen-enriched air and water as co-oxidants, as demonstrated here.

4. Syngas Cleaning

4.1. Sulfonated PolyHIPE Polymer (s-PHP) in Tar Removal from Syngas

Apart from particulate matter, which can be removed ultimately by syngas washing, tars in syngas are the main obstacles for syngas utilization downstream. Removal of tars reduces the calorific value of syngas and it is often preferable to degrade the tars into CO and H2. Tar removal from syngas by using sulfonated PolyHIPE Polymer (s-PHP) in packed beds was shown to remove over 85% of tars, thus reducing the syngas dew point significantly [45,99,119,123,124]. The mechanism of tar removal by s-PHP can be considered to be similar to surface active material removal by s-PHP from extremely stable emulsions as a result of which emulsion breakdown (demulsification) and separation occurs [28,29]. We note that both s-PHP and tars have surface activity due to the presence of hydrophilic-lipophilic moieties in both substances. The highly efficient demulsification by s-PHP is a result of the preferential diffusion of surfactants into s-PHP where they form stable lyotropic liquid crystal phases thus achieving low entropy. Hence, the diffusion of surface active molecules into s-PHP is an entropic process [2]. The removal of surface active species in emulsions and subsequent demulsification using s-PHP is further enhanced by the application of an electric field [27,163,164]. Therefore, in this study, we have developed a syngas tar removal process in which tars can either be removed through absorption by s-PHP or deposited within the pores of the electrode during electrostatic separation followed by degradation into small molecules. Alternatively, both methods can be applied simultaneously.

4.2. Syngas Cleaning Equipment

Figure 5 is the drawing of the syngas cleaning reactor, developed by the author. It operates at atmospheric pressure. It consists of a stainless-steel cylindrical vessel (300) and two functional zones (316, 322) separated by a porous metal mesh made from nickel, which also acts as the earth electrode (311) with an electrical connection (212) and guided rod support ties (315). This ground electrode is caged between two metal wire meshes (313, 315) on either side of it. The central high-voltage electrode is in the form of two connected truncated double cones (301b, 301a) placed on a plastic platform for electrical isolation.
The cylindrical assembly is closed from the top (319) and bottom (318) by two plates through ceramic O-rings. The central electrode platform is secured by screws (302). Water spray at the top (305) and bottom (303) facility is provided in which spray water is fed through a concentric pipe system (307, 308) while syngas is fed (304) or collected (306) from the annular regions. Tar captured on the porous catalytic earth electrode and in the tar collection space (316) both act as a barrier for the gas and hence tar removal from the bottom exit (317) has to be carried out gradually. Additional exit ports (309, 310) provide facilities for high voltage connection and temperature measurement while the tars collected in the region (316) are pumped out from the bottom exit (317).
The high voltage electrode (301 a,b) was electrically isolated completely (surface area = 810 cm2). Alternatively, only the top conical part (301b) was isolated completely together with part of the bottom cone, This configuration is referred to as partial isolation in which the surface area of the exposed electrode was 290 cm2. Electrical insulation was through bonded high-density polyethylene on the steel electrode. Water spray was only used when the electrode was fully isolated. It was also possible to pack sulfonated-PolyHIPE Polymer particles in the space between the electrodes in order to improve the tar removal efficiency.

4.3. Model Syngas and Tar

In order to assess the performance of the electric field enhanced tar removal equipment, the experiments were carried out using a model syngas (carbon dioxide) which was bubbled through an untreated crude oil supplied by BP Amoco to create tars within the carrier gas. The crude oil was previously used [27] by the author for the generation of stable oil-in-water emulsion and then separating (demulsification) of the resulting emulsion into water and oil under an electric field in the presence of s-PHP [27,28,29].
Carbon dioxide gas bubbling through the fresh crude oil was carried out at 80 °C during each experiment which lasted for 3 h. Model syngas flow rate was 1 L/min with inlet temperature of 43 ± 3 °C and outlet temperature of 20 ± 2 °C from the syngas cleaning equipment. Initially, model syngas at the entrance to the syngas cleaner was subjected to the tar capture and analyzed as described previously [99,114,119,123,154,155]. This procedure was repeated for the model syngas emerging from the syngas cleaner outlet. The amount of model tar collected at the entrance to the separator was constant at CTar-0 = 22 ± 2.1 g/Nm3 of model syngas. The tar removal efficiency was calculated from;
XTar = 100 × [(CTar-0 − CTar-1)/CTar-0]
where CTar-1 is the outlet tar concentration. The hydrocarbon distribution in the model syngas was determined by Gas Chromatography (Agilent 6890N) both at the inlet and outlet. Due to the lower temperature of the syngas cleaner, some of the hydrocarbons condense within the equipment and it amounts to 19% tar removal. The maximum electric field strength used was 25 kV. The experiments were carried out with or without an electric field and in the presence or absence of 76 g sulfonated-PHP [3] (degree of sulfonation 95.6%) packed into the space between the electrodes. These polymers were prepared as described previously [3]. They were in the form of ca. 3 cm diameter and 5 mm thick disks.

4.4. Syngas Tar Removal Equipment Performance

Syngas cleaning is required in power generation using an internal combustion engine and the technology is available for the removal of the main target of cleaning, namely tars. Working with large- and small-scale gasifiers (50 kWe–2 MWe capacity) for power generation, we have shown that highly porous hydrophilic/sulfonated PolyHIPE Polymers can remove surface active species including tars from gases or water [28,29,39,99,123]. Although tar (from wood) containing s-PHPs can be used as a natural herbicide and pesticide [4,99], up to 10% reduction in syngas calorific value takes place [99,123]. Therefore, the degradation of tars into lower hydrocarbons is more desirable for energy efficiency. Tar degradation can be achieved by using high-intensity electric fields or plasma fields, which however do not exclude the use of tar absorbents such as s-PHP in order to achieve higher conversion efficiency.
In this study, we present the results for the most efficient technique. The GC spectrum of the model syngas in which CO2 is used as the carrier gas is shown in Figure 6. This GC spectrum indicates the presence of several unidentified hydrocarbons. Note that the full scale of the chromatogram for the tar at the inlet is 85,000 µV whereas, this scale is reduced to 2800 µV for the outlet. However, it can be seen that the degree of syngas cleaning is selective, for example, high molecular components appearing at 18.5 min (tetradecane) and 20 min (hexadecane) completely disappear after treatment whereas, the unidentified components appearing at 4.1, 4.8 and 6.2 min are still present albeit at a much lower concentration. These results indicate that high molecular weight tar components degrade readily whereas the small molecular weight components appear to have better survival rate during passage through the electric field and s-PHP bed.
The design of the conical high voltage electrode is such that the flow between the cone and cylindrical earth electrodes creates a two-dimensional velocity profile in which the radial component of the velocity vector forces the large molecular weight tars towards the earth electrode (collector electrode) where they are captured [163,164]. Furthermore, unlike large bulky molecules with surface activity which can form aggregates of significantly larger moieties, the small molecules will not be aggregated or affected by this type of flow. Therefore, the electric field-flow field fractionation and deposition at the collector electrode will be less effective [165,166].
The tar removal characteristics under various conditions are shown in Table 4 which indicates that s-PHP is a good tar removal material with ca. 62% tar removal efficiency. The effect of the electric field dominates the tar removal but clearly, in the presence of s-PHP, ca. 99% tar removal becomes possible. The contribution of the syngas flow geometry to tar removal appears to be low (when Applied Voltage = 0) although on the basis of flow-induced particle deposition, it can be expected to contribute to the deposition of charged droplets [163,164].
Table 4 shows that s-PHP is a good tar removal material with ca. 62% tar removal efficiency. The effect of the electric field dominates the tar removal but clearly, in the presence of s-PHP, ca. 99% tar removal becomes possible. The contribution of the syngas flow geometry to tar removal appears to be low (when Applied Voltage = 0) although on the basis of flow-induced particle deposition can be expected to contribute to the deposition of charged droplets [163,164].
It can also be seen that s-PHP is an efficient scavenger of the model tar in its own right as also shown previously using real syngas and tars produced during gasification [99,119,123,124]. The affinity of s-PHP towards the absorption of surface active agents (including surfactants) has also been encountered in the demulsification of highly stable oil-in-water emulsions, which are stabilized by tar-like surface active agents (but not surfactants) when surface active hydrocarbons are removed selectively from the oil phase of emulsions under electric field [28,29]. Demulsification of emulsions stabilized by surfactants [27] as well as absorption of surfactants within the pores and formation of stable highly viscous lamella surfactant phases was also observed [163,164], both in the presence or absence of an electric field.
The application of an electric field also enhances tar removal when the electrodes are not isolated. This is due to the degradation of the high molecular weight surface active tars, which was also encountered in other separation processes under an electric field. It was observed that there was some surfactant/surface active stabilizer degradation on the electrode if the high-voltage electrode was exposed [27,163,164]. The inspection of the GC-spectra in Figure 6 indicates that although high molecular weight tars have been removed almost completely, new low molecular weight species appear when the tar molecules pass through the electric field. This is due to the degradation of high molecular tars.
The combination of the electric field and s-PolyHIPE Polymer therefore results in further enhancement of model tar removal when the high-voltage electrode is partially isolated. In this case, tar removal efficiency reaches nearly 99%. These observed enhancement levels are also similar to electric field demulsification in the presence of s-PHP [27] as well as the removal of surfactants with or without dispersed hydrocarbons (oil phase) through cross-flow micro-filtration under an electric field [163,164].
It is important to note that the present experiments are also applicable to tar removal from the associated petroleum gas (oil-well gas), which is currently being flared due to the lack of small-scale gas cleaning and conversion to oil at a global cost of ca. $100 B/year [74].

5. Catalytic Plasma Splitting of Carbon Dioxide with Oxygen Sequestration

5.1. Background

The purpose of this section is to demonstrate the use of biochar as a sequestration media for oxygen, generated through the catalytic plasma reduction of carbon dioxide to carbon monoxide using the novel Multi-Reaction Zone Reactors (M-RZR) with simultaneous reactive separation as demonstrated by Akay [3,39]. The significance [67] of M-RZR was previously demonstrated in the sequestration of ammonia produced by catalytic plasma synthesis in which acidic sulfonated PolyHIPE Polymer (s-PHP) was used as the sequestration material to enhance the conversion and ammonia concentration in the reaction stream to levels above the current Haber–Bosch synthesis. The most important cost item in ammonia synthesis (either by plasma methods or Haber–Bosch processes) is the ammonia removal from the reaction mixture and recycling of the unreacted gases. Thus, M-RZRs with in situ reactive sequestration not only reduce this cost significantly but also produce in situ symbiotic/smart fertilizers with excellent cost and performance advantages [3]. The current research now extends the use of M-RZR with simultaneous (reversible or irreversible) reactive separation to CO2 reduction to CO with O2 sequestration using biochar. As such, this would serve two additional purposes: (a) Carbon dioxide sequestration and its use as feedstock for fuel (CO) generation, (b) Biochar upgrading for use in agriculture.
Before examining these developments, we first investigate the catalytic plasma CO2 reduction in the presence of N2. This process is important because most CO2 feedstocks contain N2 as a result of fossil fuel or biomass combustion in power stations etc. Furthermore, the understanding of oxygen splitting from CO2 in the presence of N2 is also important in direct catalytic plasma conversion of hydrogen-rich syngas (containing CO2, CO and N2) to ammonia and ammonia derivatives as proposed previously. In particular:
(a)
In addition to ammonium carbamate formation when NH3 is sequestrated, do nitrated ammonium derivatives such as ammonium nitrate, urea, etc. form in the catalytic syngas conversion to fertilizers?
(b)
Can the level of oxygen in the reaction mixture be controlled to enhance conversion and selectivity towards a target product through oxygen sequestration by in situ reactive separation?
(c)
Can any such sequestration process yield a sustainable and useful product so as to lower the energy cost of CO2 capture and utilization?
(d)
In addition to the optimization of process variables such as the type and strength of plasma and plasma reactor, can plasma catalysts be designed to achieve the desired product and to achieve cost benefits?
(e)
Finally, can biochar as well as ash from the gasification of biomass (i.e., bio-ash) be used as a catalyst in plasma-induced CO2 splitting?
The following sections on non-thermal plasma experiments have been designed to answer the above questions. This current study is essentially an extension of the author’s previous work [3,67,69,70,74,86,87,97,98] in which the general-purpose Dielectric Barrier Discharge (DBD) equipment [67,69] shown in Figure 7 is used.

5.2. Catalytic Dielectric Discharge Barrier (DBD) Nonthermal Plasma Equipment

A general-purpose DBD plasma reactor system was developed by Akay and Zhang [69] and used in several subsequent publications on catalytic plasma reactions including ammonia synthesis [3,69], direct hydrogen generation from methane [70], Fischer–Tropsch synthesis [74], CO2 de-oxygenation [86,87], methane dry reforming [97,98]. The diagrammatic illustration of the reactor system is shown in Figure 7. Different types of plasma reactors can be used. In Figure 7a the basic single reaction-zone reactor is shown (201), which is detailed in Figure 7b.
The basic single reaction-zone plasma reactor (Figure 7b) consists of two concentric quartz tubes. The outer tube has an inner diameter of 32 mm and the inner tube has an outer diameter of 17 mm thus giving an annular reactor gap of 7.5 mm. The high voltage electrode (207) and the ground electrode (206) are connected to the power supply (208) providing an alternating sinusoidal high voltage up to 20 kV amplitude (peak-to-peak) and 20 kHz frequency. The ground electrode (in the form of stainless-steel mesh) can be located either outside the outer tube or inside the reactor while the counter electrode (207) placed inside the inner tube as shown in Figure 7a. The annular gap (209) is filled with catalyst and/or Plasma Catalysis Promoters (PCPs) in the form of 3 mm BaTiO3 or glass spheres in the reaction zone of 100 cm3 corresponding to the length of the electrodes. Outside the catalyst region, the reactor is packed with glass wool at the inlet and outlet (205).
The reactants are fed from the gas cylinders (202-n) through Mass Flow Controllers (MFCs 203-n) via a gas mixer (204). The reaction mixture is analyzed after passing the effluent through a Gas Chromatograph. Alternatively, in the case of ammonia synthesis, effluent gases were titrated with a dilute H2SO4 solution to determine ammonia concentration.
In the case of ammonia synthesis from syngas and CO2-to-CO conversion in the presence (or absence) of N2, the feed gases are introduced into the reactor from high-pressure bottles via MFCs (203-n). A back pressure valve at the exit of the dielectric barrier discharge reactor was used to monitor the pressure in the reactor. In the current study, only CO2 and N2 feeds were used to obtain an inlet gas mixture ranging from 0 to 93% N2 at a total flow rate of 50 mL/min. The reaction products were analyzed online using a Varian 450 Gas Chromatograph. The apparent CO2 conversion is defined as:
EA = 100 × {[Moles of CO2 in] − [Mols of CO2 out]}/[Moles of CO2 in]
Apart from nitrogen compounds, the concentration of the gases from the reactor outlet is measured by using Gas Chromatography with a thermal conductivity detector as described previously [69,74]. In order to determine the changes in the volumetric flow rate as a result of chemical reactions, a constant flow nitrogen stream (6.0 mL/min) was added to the effluent gas stream as a reference.
When the catalytic conversion processes were carried out in the presence of a sequestration agent (such as solid acids or acids absorbed in porous absorbents such as sulfonated PolyHIPE Polymers in ammonia synthesis and bio-char in the present study) we used the Multi-Reaction Zone Reactor, which is shown diagrammatically in Figure 8.
In Figure 8, the plasma reactor (Reaction Zone-1, RZ-1, where the catalytic plasma reaction takes place) is identical to the single reactor described previously (Figure 7) with the same dimensions. However, in the M-RZR reactor, the outer quartz tube has several holes (1 mm diameter) in the plasma generation region. The inner quartz tube can also be replaced by a tube with holes when the reactants are fed through the high-voltage electrode. Both electrodes are made of stainless-steel wire mesh to allow the transport of gases without any resistance. The plasma reactor temperature can be kept within a prescribed temperature range by a cooling jacket in which air at room temperature is circulated. This heat transfer facility also helps to control the temperature of the absorbent/sequestrating agent placed in the second reaction zone (RZ-2).
Although the Reaction Zone-1 (plasma zone) operates in continuous mode, in the current experiments, the Reaction Zone-2 operates in batch mode. Therefore, the amount of absorbents/sequestration agent is well in excess of what is required during a single experimental run of 50 h.
Catalysts [82,83] and/or PCPs (BaTiO3 spheres) are loaded in the plasma region with a total volume of 100 mL. It was shown previously that the conversion efficiency of the plasma reactions is dependent strongly on the electrode configuration [3,69,70,74,86,87]. Higher efficiencies are obtained if the plasma is generated when the electrodes are within the catalyst bed and they are separated by high dielectric constant PCPs. Especially in the presence of supported metal catalysts (even in metal oxide form and in the presence of PCPs), they are sufficiently conductive to cause electrical discharges and hence there is always a limit to the electrical potential applied. The following Electrode Configurations (EC-n) are used:
  • EC-1a: Both electrodes (2 and 6 in Figure 7b) are outside the plasma zone and isolated through the inner and outer walls of the quartz reactor.
  • EC-1b: Same as EC-1a but a stainless-steel mesh is placed within the reactor facing the ground electrode across the outer wall of the reactor. This configuration was used previously and referred to as BaTiO3 + mesh [86,87].
  • EC-2: Ground electrode (6) is within the plasma zone and hence is not isolated. This configuration was used previously and referred to as BaTiO3/mesh [86,87].
  • EC-3: Both electrodes (2 and 6) are within the plasma zone and hence both electrodes are not isolated.
  • EC-4: Ground electrode (6) is behind the perforated outer wall. High voltage electrode (2) is behind the inner wall which is not perforated. This applies to the M-RZR system shown in Figure 7b.

5.3. Carbon Dioxide-to-Carbon Monoxide Conversion in a Single Reaction Zone DBD Reactor

The single reaction zone plasma reactor described above was also used [86,87] for the conversion of CO2 to CO and O2. Here, the plasma catalysis promoter was BaTiO3 and the catalyst was Ni/SiO2 = ¼ Mw-ABC catalyst [67,82,83]. The preparation method of the catalysts, their properties and notation are available [67,82,83]. In some publications, these catalysts were wrongly identified and denoted when they were used in dry reforming of methane [97,98] and CO2 splitting [86,87]. Furthermore, in these publications [86,97,98], the method of preparation was also incorrectly reported and as a result, subsequent interpretations were also wrong. It was concluded [86,87] that the apparent high CO2 conversion observed when the ground electrode was within the reactor (i.e., EC-2 mode) was due to the catalytic effect of the stainless-steel electrode within the plasma zone of the reactor in contact with BaTiO3. This conclusion is drawn because of the fact that almost identical conversion levels were obtained when a stainless-steel mesh was included within the reactor in EC-1b mode. However, these studies did not include the EC-3 and EC-4 reactor modes.
Table 5 shows the variation of CO2 conversion as a function of plasma power input for various electrode configurations. It can be seen that the variation of CO2 conversion is strongly dependent on electrode configurations and, as expected, on input plasma power. The best electrode confirmation is EC-2 when the ground electrode is within the plasma space in contact with BaTiO3 particles, which were thought to be acting as plasma catalysis promotors (PCPs). As detailed later, attributing this to BaTiO3 is wrong because, for the reasons concluded in Section 12, barium titanate is in the form of BaTiO3−x−y{#}xNz where z = 2y/3 and {#} is an oxygen vacancy and may act as a piezoelectric catalyst.
However, EC-3 (both electrodes are in the plasma space) is also very effective at low-power inputs before direct electric discharges start between the electrodes. The EC-4-based reactor (Figure 7), when a metal sheet is present inside the reaction zone facing the ground electrode, is also better than EC-1 (when both electrodes are isolated). The presence of a small amount of Ni/Si = 1/4 Mw-ABC catalyst (4.5 wt% or 50 v%) also enhances CO2 conversion by about 20% compared with no catalyst use (i.e., compare EC-1 and EC-2). We have not tested the catalyst performance under more favorable conditions of EC-2 to EC-4.
Furthermore, it can also be seen from Figure 3 of Zhang et al. [86,87] that, when the high-voltage electrode is within the reactor (EC-3 mode), the CO2 conversion is almost identical with EC-1b or EC-2 modes. These results indicate that the notion of stainless-steel mesh acting as a catalyst cannot be sustained because the surface area of the ground electrode is 5.4 times greater than the surface area of the high-voltage electrode. Based on the fact that any catalytic contribution to CO2 conversion by the inserted stainless steel should be proportional to the surface area, the expected CO2 conversion in EC-3 mode should have been significantly smaller.
It can also be seen from Table 5 that, in EC-4 electrode mode, the initial CO2 conversion is similar to that exhibited in EC-1a mode but as the input plasma power increased, the CO2 conversion levels tend to that exhibited by EC-2 mode of operation. We note that at higher plasma power, plasma is generated in part outside the reactor as the ground electrode is partially isolated because of the presence of holes on the outer surface of the plasma reactor.
The effect of CO2 flow rate on conversion is shown in Table 6. As can be seen from Table 6, when the flow rate is increased by a factor of 4, the decrease in conversion is 2.6-fold. Table 5 shows that in all cases investigated, when increasing plasma power from 46 W to 106 W (2.30-fold increase), the corresponding increase in CO2 conversion is 2.23 fold at best (EC-4) and 1.62-fold at worst (EC-2).
It was shown in numerous publications that, as a Plasma Catalysis Promotor, BaTiO3, provides a more efficient conversion in DBD reactors than glass, not only in CO2 conversion [67,86,87] but also in direct CH4 conversion [70] to hydrogen and hydrocarbons as well as CH4 reforming [97,98] with CO2. This is due to the fact that glass is a dielectric with permittivity of ca. 10 whereas, BaTiO3 is a ferroelectric with permittivity ranging from ca. 1 k to ca. 6 k depending on temperature and crystallite size. However, the Curie temperature of BaTiO3 is relatively low (ca. 120–130 °C) and hence, ferroelectrics with high Curie temperatures will provide even more efficient conversion at elevated temperatures as conclusively demonstrated recently by Gomez-Ramirez et al. [88,89,90] and Navascués et al. [91]. However, this is only true for stoichiometric BaTiO3, not phase transformed piezoelectric barium titanate with structure BaTiO3−x−y{#}xNz (z = 2y/3).

5.4. Effect of Nitrogen Concentration in CO2 Conversion

This process is important as most flue gases contain ca. 50 mol% nitrogen gas. An understanding of this process is also important in the direct conversion of CO2 and N2 to ammonia-based fertilizers. It has been shown that CO2 conversion in DBD reactors was enhanced in the presence of nitrogen gas which, however, also underwent oxidation, producing nitrogen oxides, N2O and NOx at several 100 ppm levels [167,168,169,170]. Here, we study the effect of N2 on the conversion of CO2 in a DBD reactor using the electrode configuration EC-1 and BaTiO3 particles (3 mm) as packing material. However, we have not measured the concentration of any evolved NOx molecules.
The results are tabulated in Table 7 and Table 8. Table 7 shows the effect of N2 on CO2 conversion at a fixed total flow rate (CO2 + N2) with a flow rate of 50 mL/min and plasma power of 106 W. The effect of the total flow rate is also shown when the N2 concentration is 2.5 mol%. The apparent CO2 conversion, EA (see Equation (2)), increases very rapidly in the presence of a small amount of N2 and continues increasing up to 75% N2 and levels off thereafter. However, the effective CO2 conversion, EE, initially increases with N2 concentration up to 10% followed by decay to zero with further increase. The effective CO2 conversion is defined as:
EE = EA × (Flow rate of CO2)/(Total gas flow rate)
The effect of plasma power on CO2 conversion at a fixed total flow rate of 50 mL/min and N2 concentration of 50% is shown in Table 8.
We can therefore conclude that in plasma reactors with perovskite or spinel type of high dielectric constant plasma catalysis promoters occupying the plasma zone of the reactors, non-isolated (exposed) electrode(s) contribute to the CO2 conversion through electro-catalysis. This has been demonstrated by Solymosi [167] in the electrochemical conversion of CO2 to CO. Furthermore, as the first step in the catalytic conversion, oxygen vacancies in perovskites and spinel type of catalysts promote the enhancement of CO2 absorption on the catalyst surface, the creation of such domains can be expected to promote CO2 conversion. The oxygen vacancies are created during plasma generation over BaTiO3 or SiO2 supported catalysts of the type developed by the author (i.e., {M/Si = X}/BaTiO3 = Y type of single or binary catalysts) through a locally operating chemical looping process with oxidation and reduction domains in the catalysts separated only by micrometer distances [83].

5.5. Catalytic Plasma Carbon Dioxide Splitting in the Presence of Biochar as a Catalyst and In Situ Oxygen Scavenger

In these experiments, we used the Multi-Reaction Zone Reactor (M-RZR) in order to sequestrate oxygen radicals to enhance the CO2 splitting. Another important motivation was to modify biochars so as to make them more hydrophilic to improve their soil conditioning characteristics including high water retention and plant root and bacterial association in the rhizosphere zone in agricultural applications. This experiment is an exact replica of the use of hydrophilic acidic PolyHIPE Polymer (loaded in the Reaction Zone-2, RZ-2) for the sequestration of ammonia produced in the Reaction Zone-1 (RZ-1), using M-RZR as described previously [3].
In the present experiments, using the M-RZR shown in Figure 8, RZ-1 is the catalytic DBD plasma CO2 splitting reactor. Electrode configuration in RZ-1 was in EC= 4 mode as shown in Figure 7b and Figure 8. The plasma reaction space was filled with 165 g BaTiO3 particles (3 mm) and 8 g Ni/Si = 1/4 Mw-ABC catalyst (50% by volume of the total space).
The RZ-2 of M-RZR contained 1200 g biochar particles (ca. 3 mm) used for the sequestration of the oxygen. Before starting the plasma experiment, biochar in RZ-2 was purged with carbon dioxide at a flow rate of 100 mL/min for 70 h. The carbon dioxide flow rate was reduced to 50 mL/min and then the plasma was turned on at 50 W power. The emergent gases were analyzed using Gas Chromatography after 20 h of continuous reaction. The outlet gas composition was: CO2 = 0.931; CO = 0.046; H2 = 0.003; O2 = 0.002 and N2 = 0.018.
As seen from these data, based on the concentration of CO (=4.6%), the expected concentration of oxygen is 2.3%. Therefore, the expected O2 concentration is reduced more than 10-fold compared with the expected O2 based on the CO concentration at the outlet. N2 was also detected (1.8%) in the outlet gas. During the pyrolysis of lignocellulosic biomass, the hydrogen and oxygen content of biomass decreases while the concentration of carbon (ca. 85 wt%) and nitrogen (ca. 1.7 wt%) increase significantly. Although hydrogen is likely to be the result of the reaction between biochar and oxygen radicals, it is unlikely that the presence of N2 is due to the same reason. It is more likely that this nitrogen is due to the desorption of nitrogen from the biochar, which is of course an excellent adsorber of all the gases involved in the reaction.
Relatively low levels of CO, expected from the stochiometric balance of CO2 splitting can be attributed to the enhanced solubility of CO in carbon in the presence of catalytic metals, such as Cu, Mn, etc., which are also present in charcoal [171]. Although the principle of in situ sequestration of the oxygen by biochar is demonstrated, the system is not conducive to the evaluation of the kinetics of the reactions due to the solubility of the gases in biochar, including that of CO2, CO and NOx.

5.6. Biochar as Plasma Catalyst and Oxygen Scavenger

The electrical conductivity of biochar can be changed over a wide range by promoting the concentration of highly conductive carbon phases such as graphite or by the addition of metal oxides. At low pyrolysis temperatures (400–600 °C), biochar has dominantly amorphous, non-organized phases composed of aromatic and aliphatic structures (ratio of ca. 0.4) and has low electrical conductivity [171,172,173]. In its own right, biochar has an abundance of catalytic metals and can act as a low-cost catalyst [171,174,175,176].
Although they are unlikely to replace well-characterized, reproducible and highly stable chemical catalysts, including plasma catalysts, they are seen as an important renewable material in climate change mitigation, especially in agriculture as a soil additive [177] as well as in numerous other applications [171,178]. Therefore, biochars can be used in applications such as the present one in which they act as catalysts and at the same time they are chemically modified to be more effective soil conditioners. This type of dual-purpose approach eliminates the use of synthetic catalysts while providing superior (more hydrophilic) biochar as a soil additive or natural smart fertilizer providing micronutrients and ammonia. Its use in NH3 synthesis will result in NH3 sequestration through absorption by biochar and hence NH3 can be recovered from it by desorption.
Due to these attributes, notwithstanding their shortcomings, biochar (as well as its carbon-depleted form, bio-ash) can be used in plasma reactions as a catalyst over a restricted temperature and time span. As a result, it is possible to induce further desirable attributes in the biochar structure, such as the enhancement of their hydrophilicity. Here, in this demonstration, we use biochar obtained from the pyrolysis zone of the gasifier developed by the author [67] and used in the gasification characteristics of bagasse [45,119,123,124].
In this demonstration, using only the RZ-1 part of the M-RZR, we placed 8 g biochar together with 165 g BaTiO3 (3 mm) particles in the plasma zone of the reactor. Because biochar is also porous, the length of the plasma zone could be adjusted so that the volumetric concentration of biochar and BaTiO3 was 50–50 by volume. In this case, no Ni/Si = 1/Mw-ABC catalyst was used. Biochar was degassed for 24 h using CO2 at 100 mL/min at 100 °C before the start of the plasma when the flow rate was reduced to 50 mL/min and plasma power was 50 W. The emergent gases were analyzed after 20 h. After the reaction, biochar was recovered and analyzed (together with the original biochar before plasma) by FTIR. The emergent gas composition was: CO2 = 0.778; CO = 0.171; O2 = 0.037; H2 = 0.014 and trace amounts of N2 was detected. These results indicate that in the presence of biochar in close contact with BaTiO3 in the plasma zone, CO2 splitting is enhanced considerably but the presence of O2 is also enhanced at [CO]/[O2] = 4.6 whereas, previously, this ratio was 23. It can be expected that the amount of biochar was limited and the length of the reaction was too long so the active sites of biochar were already depleted. The same argument applies to the reduced H2 and N2 concentrations.
The FTIR spectra of the biochar before and after the reaction are shown in Figure 9a,b, respectively. Before the reaction, the spectrum band at wavenumber 3316 cm−1, ν(O-H), represents the hydroxyl groups in phenolic and aliphatic structures while the band at 2943 cm−1, ν (C-H), is C-H stretching in aromatic methoxy and methyl and methylene groups [179]. Both of these bands disappear after the oxidation of biochar as seen in Figure 9b. The disappearance of ν(O-H) band at 3316 cm−1 is due to the dehydration of biochar. The disappearance of the band at 2943 cm−1, ν (C-H), indicates the reduction of biochar hydrogen content through reaction with oxygen.
Most importantly, as seen in these two spectra, a shoulder band at 1710 cm−1 appears in Figure 9b after the reaction of biochar with oxygen. This band, ν (C=O), is due to unconjugated C=O stretching vibrations in carbonyl groups of hemicellulose, which is due to the combustion reaction of carbon and oxygen. As there is no combustion in the system, these results show that O produced during CO2 splitting, reacts with carbon to produce carbonyl groups. Bands at 1584 cm−1 and 1400 cm−1 in both biochars (before and after plasma reaction) are attributed [173] to charged carboxylate groups (COO). The band at 873 cm−1 is significantly enhanced after the plasma reaction. Bands at 1590–870 cm−1 are attributed to aromatic C-N/R-O-C/R-O-CH3 bonds indicating the oxygenation of the aromatic phases. It is interesting to note that plasma etching of metal-organic frameworks (zeolitic imidazolate framework-8) films [180] by oxygen plasma results in the formation of carbonyl moieties (C=O) at 1710 cm−1. On the other hand, nitrogen plasma induces mild etching and grafting of nitrile groups (-C≡N) [180] identifiable at 2206 cm−1. This band in the FTIR of the plasma exposed biochar is absent as seen in Figure 9b.
The pyrolysis process promotes the elimination of H and O and enhancement of C from the organic phase and increasing the pyrolysis temperature drives the elimination of H and O towards completion and mineralization of carbon and oxygen through the formation of carbonates at higher pyrolysis temperatures. Carbon is also the primary element in condensed aromatic structures, which dominate the organic phase of biochar; while O is the key element in many polar organic functional groups on biochar surfaces, which influence biochar reactivity in soil environments [181,182]. The appearance of carbonyl groups in hemicellulose and oxygenation of the aromatic phases are hence useful in the sequestration of cationic micronutrients (mainly metals) by biochar in soil [181].
These experiments indicate that CO2 can be sequestrated through biochar—BaTiO3 catalyzed plasma reaction with in situ oxygen sequestration, which improves not only CO2 conversion and CO yield but also enhances the biochar quality through oxygenation without affecting hydrogenation. In pyrolysis, [H]/[O] molar ratio remains constant at ca. 1.2 and hence the current process generates independent oxygenation of biochar.

6. Direct Conversion of Hydrogen Enriched Model Syngas to Ammonia via Ammonium Carbamate with CO2 Sequestration and Utilization

6.1. Background

The direct conversion of syngas to ammonia clearly eliminates the separation of hydrogen and nitrogen from the other components of syngas, including CO2, CO, CH4 and C2H4/C2H6 as well as the minor hydrocarbons. However, although there is sufficient N2 present in syngas, hydrogen concentration is too low and hence it needs to be enhanced by the addition of hydrogen externally, requiring a syngas conditioning stage. That said, the presence of excess CO2 can be an advantage for the in situ NH3 sequestration to shift the equilibrium towards NH3 formation. In its own right, ammonia is a very efficient absorbent of CO2 at a theoretical capacity of ca. 0.33 mol CO2/mol NH3. Therefore, ammonia has been used for CO2 capture (see for example Reference [3]) from coal-powered power plants (formation of solid ammonium carbamate (NH2COONH4) below 80 °C) and even used as a fertilizer in the form of ammonium carbonate (NH4)2CO3 or ammonium bicarbonate, (NH4)HCO3 or ultimately, as urea (NH2CONH2). When these materials are used as fertilizers, this will allow the diffusion of CO3−2 or HCO3 ions in soil and then into groundwater aquifers where it can be sequestrated by forming CaCO3 thus achieving CO2 removal from biomass (negative CO2 emission) or fossil fuels (reduced CO2 emission) while nitrogen is metabolized by plants.
Alternatively, if anhydrous ammonia is to be obtained for fuel applications, ammonium carbamate decomposition yields NH3 and CO2 as shown in Figure 1. These two gases can be separated through the selective absorption of CO2 and CO2 is recycled. Therefore, CO2 itself can be used as a gaseous ammonia sequestrator/scavenger to obtain a solid ammonium carbamate that releases ammonia upon heating.

6.2. Experimental Results

The direct conversion of syngas to ammonium carbamate (and then to urea or anhydrous NH3) in a DBD-nonthermal plasma was first proposed by the author [3,39,67]. Essentially, the proposed synthesis is a combination of three competing syntheses: Ammonia synthesis (N2 and H2), dry reforming of methane (involving CO2 and CH4) [97,98] and Fischer–Tropsch synthesis [74] (CO and H2 as well as CO2 via CO generation). Here, we demonstrate the feasibility of the direct conversion of syngas to ammonia using a model syngas with enhanced H2 (but well below the stochiometric ratio of [H2]/[N2] = 3). In the following experiments, a hydrogen-enriched model syngas was constituted and supplied in a pressurized gas bottle replacing the CO2 bottle used in the previous experiments (see Figure 6a). The composition of the feed gas mixture was: H2 = 0.4; N2 = 0.36; CO2 = 0.1; CO = 0.1 and CH4 = 0.04 with [H2]/[N2] = 1.11. This gas mixture is then fed into the DBD reactor and the emerging gases are first passed through the ice trap to solidify ammonium carbamate. Non-condensable products are then analyzed for hydrocarbons.
The solid material was recovered from the ice-trap and analyzed by FTIR. It revealed that the material was (NH4)2CO3, which was formed as a result of the reaction of ammonium carbamate, NH2COONH4, with water upon exposure to air and the possible formation of water during the plasma reaction. The analysis of the non-condensable gases (at 0 °C) by gas chromatography indicated the presence of higher hydrocarbons (C2-C5) in the effluent together with unreacted gases and a reduction in the outlet gas flow rate.
Table 9 summarizes the results obtained from a hydrogen-enriched model syngas mixture containing the gases commonly encountered in syngas generated by gasification. The gas compositions before and after passing through the plasma reactor and processing conditions are shown in this table.
It can be seen from Table 9 that the reaction favors Fischer–Tropsch synthesis since neither the CH4/(CO2 + CO) ratio nor the N2/H2 ratio is optimum for an efficient dry reforming or ammonia conversion, respectively. Nevertheless, the recovery of ammonium carbamate as a solid product indicates that ammonia was formed and sequestrated by CO2.
Table 9 also shows that the concentrations of CH4, CO2 and N2 in the gas phase have increased while that of H2 and CO have reduced. These changes can be accounted for through a mass balance on H, C, N and O in Equation (4) below:
0.1 CO2 + 0.4 H2 + 0.36 N2 + 0.04 CH4 + 0.1 CO → 0.071 CO2 + 0.157 H2 + 0.269 N2 + 0.115 CH4 + 0.013 CO + 0.005 C2H4 + 0.066 NO + 0.0284 (NH2)COO(NH4) (solid)
In Equation (4), water evolution is assumed to be absent. NO and NO2 were not measured, and hence their concentrations are calculated from the mass balance on carbon, hydrogen, nitrogen and oxygen. The method used is an optimization technique in which mass balance on each element is carried out using the coefficients of the compounds in the above equation, followed by overall mass balance. These coefficients were updated until the mass balance closure, ([Mass in]/[Mass out]) reaches 1 ± σ where σ represents an acceptable level of accuracy and therefore is the target variable for minimization. In the present case, the mass balance closure is 0.94. It is also known that the concentration of NO2 is low compared with NO when air is subjected to plasma reaction [83,168] and hence NO2 does not appear in the above equation. We have also assumed [74,97,98] that C2+ hydrocarbons were C2H4 as we have already shown and that the other C3+ or higher hydrocarbons were ignored as their concentrations are very low. From the above equation, it can be seen that molar concentrations of the main gaseous products or unreacted gases (CO2, H2, N2, CH4 and CO) agree very well with the measured concentrations tabulated in Table 9.
The above reaction indicates that despite unfavorable reactant composition for ammonia synthesis (H2/N2 = 1.11) which requires H2/N2 ≈ 3, a significant amount of ammonia is produced and sequestrated in situ in the form of ammonium carbamate (2.84 mol%). The amount of ammonia produced from ammonium carbamate therefore represents 5.68 mol% NH3, which corresponds to total molar H conversion of E(ΣH) = 17.7 mol% and total molar N conversion E(ΣN) = 7.9 mol%. E(ΣH) and E(ΣN) are defined as:
E(ΣH) = 100 × [Total H in ammonium carbamate produced]/[Total H input from syngas]
E(ΣN) = 100 × [Total N in ammonium carbamate produced]/[Total N input from syngas]
Similarly, we define the molar carbon sequestration efficiency, E1(ΣC), through the formation of ammonium carbamate as:
E1(ΣC) =100 × [Total C in ammonium carbamate produced]/[Total C input from syngas]
Therefore, H2 and N2 conversions represent an acceptable level especially when the H2/N2 ratio is far from the stoichiometric value. These results demonstrate the significance of in situ NH3 sequestration in catalytic plasma reactions. Carbon sequestration due to syngas-to-ammonium carbamate conversion is estimated as E1(ΣC) = 11.8 mol%. However, as a significant amount of CH4 is formed and CH4 (it is produced from renewable source) can be recovered as a useful by-product and converted directly to H2 and carbon, we can also define total carbon sequestration potential, E2(ΣC), of the process as:
E2(ΣC) = 100 × [Total C in ammonium carbamate and CH4]/[Total C input from syngas]
The estimated total carbon sequestration potential of NH3 + CO2 is E2(ΣC) = 61.8 mol%.
These results show that it is possible to convert syngas or indeed flue gases directly to ammonia-based fertilizers provided that H2 concentration in the reactant gas stream is sufficiently high to promote ammonia synthesis. We have already shown that a high [H2]/[N2] ratio can be achieved through biomass gasification with dual air and water oxidant use. The other important factors to consider include the tailoring of the catalyst, reactor electrode configuration, reactor design for the promotion of CO2 sequestration with NH3 as well as the other processing conditions such as gas flow rate and reactor temperature. This proof-of-concept demonstration also represents carbon sequestration from syngas from the gasification of biomass while obtaining either ammonia or ammonia-based carbonous fertilizers, which itself represents a natural, long-term carbon sequestration and utilization through the formation of CaCO3.
The significance of the above results can be understood when we consider the equivalent NH3 outlet concentration of 5.68 mol% with those obtained from nonthermal catalytic plasma experiments using H2 and N2 only, producing ca. 1-3 mol% except when using piezoelectric BaTiO3−x−y{#}xNz with Ni/Si = X catalysts [3,39,67,69].

7. Piezoelectric Catalyst Development

7.1. Microwave Radiation Induced Ferroelectric-to-Piezoelectric Phase Transition under Plasma and Its Application to Synthesis of Piezoelectric Black Barium Titanate Catalyst

In the above-described reactions, BaTiO3 cannot be regarded as a plasma catalysis promoter because it acts as a piezoelectric catalyst in its own right. Another distinction must be made between the thermochemical and plasma catalysts. The efficiency of the former decays in service while that of the latter enhances. This is achieved in two ways: Either BaTiO3 is exposed to plasma over a long period of time during catalytic plasma reactions (days), or it can be modified using microwave radiation with plasma generation for a short period of time (a few minutes). As shown by Akay [39,67,82,83,170] and Akay et al. [69,70], BaTiO3 undergoes morphological changes during prolonged (ca. 50–150 h) plasma catalysis when BaTiO3 is used as a plasma catalysis promoter. However, the implications and the mechanism of these changes have not been investigated. Although the microwave plasma-induced morphological changes in BaTiO3 have been investigated by Akay [39,67,82,83] the mechanism of the process and its wider implications in plasma catalysis, solar energy harvesting and energy storage have not been considered.
The first study showing the transformation of BaTiO3 particles from ferroelectricity to piezoelectricity by microwave radiation was carried out by Akay [67,83]. In this study, fresh BaTiO3 particles (1 or 3 mm diameter) were placed in HNO3 (or H2SO4) overnight followed by distilled water washing. They were then subjected to microwave irradiation in air at 1800 W for 2 min with the generation of plasma and NO + NO2. These samples were then cooled and the process was repeated 5 times (total irradiation time of 10 min). The experiments were repeated at 900 W microwave power. Each time, the generation of plasma was observed. This process can also be carried out at lower microwave powers where the lowest microwave power available was 200 W. The extensive XRD, SEM and EDS analysis performed on the microwaved BaTiO3 particles revealed the nature and the extent of these changes [83,170].
The fresh BaTiO3 particles were white-cream colored, those particles microwaved at 900 W were dark cream and grey colored while those particles microwaved at 1800 W were black colored. Microwave plasma-induced color changes are associated with the transition from ferroelectric-to-piezoelectric phase change as discussed earlier. It must be pointed out that those particles microwaved at 900 W had a few black particles but, in the analyses, only the cream-colored particles were used.
The XRD spectrum of fresh BaTiO3 is shown in Figure 10. The identification of the XRD reflections and the crystallite size associated with each peak were evaluated previously [83]. In order to evaluate the morphological changes in microwave irradiated BaTiO3 with plasma generation in air, we examined each reflection separately for all the peaks associated with the fresh and microwaved samples.
As shown previously [83,170], the intensities of the peaks at 2θ = 44.9° (reflection (002)) and 2θ = 45.4° (reflection (200)) switch when fresh BaTiO3 particles are microwave irradiated (at 1800 W for 10 min) with plasma generation and NOx evolution. In Figure 11a–f, we examine all the reflections more closely for the fresh (identified as F), cream-colored (Identified as C) and black-colored (Identified as B) BaTiO3 particles, which were crushed for powder-XRD measurements. The Bragg angles (2θ) and the reflections associated with them are shown in parenthesis.
XRD reflection intensity switch is a result of phase transition [83,183,184] from paraelectricity (cubic phase) or ferroelectricity (tetragonal phase, i.e., non-centrosymmetric) to piezoelectricity (expanded tetragonal phase) when the Weiss-domains acquire dipole alignment while still keeping the tetragonal phase, albeit with slight distortion. Due to microwave heating and plasma generation, the maximum temperature was ca. 200 °C during each cycle of microwave irradiation in air. Therefore, there is the possibility of ferroelectric BaTiO3 first developing a paraelectric phase before the transformation to a piezoelectric phase since the Curie temperature of BaTiO3 is 120–130 °C. Nevertheless, once the piezoelectric phase is acquired, the Curie temperature increases, the magnitude of which is dependent on the piezoelectric coefficient, d33. At a typical value [183,184,185] of d33 ≈ 400 pC/N, the Curie temperature of TC ≈ 320 °C can be expected [185], which is well above the maximum irradiation temperature.
Figure 11 clearly indicates that microwave irradiation and plasma evolution result in:
(a)
Clear reflection intensity change at 44.90°, (002) and 45.37°, (200) for the black-colored BaTiO3 and equalization of the corresponding intensities for the cream-colored BaTiO3.
(b)
The broadening of the peaks in the microwave-irradiated samples indicates that, as expected, the microwave-irradiated samples have higher amorphous fractions than the fresh BaTiO3. However, the cream-colored BaTiO3 is more amorphous than the black-colored BaTiO3.
(c)
Due to the amorphization process, a number of weak peaks disappear in the microwave-irradiated samples.
(d)
In the microwave-irradiated samples, in addition to the broadening of the peaks, peak positions shift towards higher Bragg angles.
It must be pointed out that not the whole of the barium titanate particles undergo phase change. This phase change is likely to be concentrated at the surface section of the particles. When these particles are crushed for XRD analysis, the reflections include the original paraelectric phase.
As shown previously [83], SEM and EDS studies clearly illustrated the hallmarks of profound morphological and chemical heterogeneities in BaTiO3 and spinel or perovskite-type catalysts synthesized by microwave-induced plasma shock. These crystallographic defects include: electrical activity, (formation of electrical treeing; Lichtenberg phenomenon [186]) in BaTiO3 particles together with extensive porogenesis, formation of layered planes (with spaces between the planes filled with lattice exudates as a result of amorphization), anion (oxygen) and cation (Ba2+ or Ti3+/Ti4+) vacancies, morphological heterogeneities and color change from white to cream to brown and black with increasing microwave power and dose during irradiation in air. It is important to note that these changes are present in the same material within micron-to-nano scale proximity [83]. Therefore, it is possible that they represent chemical-looping piezoelectric catalysts with adjacent oxidation and reduction domains but with piezoelectric catalytic characteristics in all domains.
The electrical treeing also indicates that microwave irradiation imposes not only electrical field but also thermal stresses, which cause crack nucleation and propagation. The propagating cracks are reflected in the path of the electrical activity [186]. This synergistic failure mode indicates that microwave irradiation achieves some of the prerequisites of catalysis, namely, absorption of energy, development of high stresses for piezoelectric catalysis and high electrical activity between the separated domains. These results confirm that ferroelectric materials exhibit a strong nonlinear coupling between electrical, mechanical, and thermal fields.
The motivation for the synthesis of perovskite (or indeed spinel) type oxides with vacancies and doping is that such structural modifications result in enhanced activity and the transformation from paraelectric or ferroelectric state to piezoelectric state, which can be used in several microelectronic applications, energy harvesting, energy storage and energy conversion including piezocatalysis [187,188,189,190,191]. Although thermochemical-, electrochemical- and photo-piezocatalysis have been studied, to the best knowledge of the author, plasma-piezocatalysis has not been investigated.
Before examining the generation of chemical and morphological heterogeneity in BaTiO3 due to shock microwave irradiation with plasma generation, we first review the types and effects of crystallographic defects in perovskite catalysts as the observed structures and catalytic activity in these catalysts are directly associated.

7.2. Defect Engineering in Catalysts and Perovskites

What differentiates photo- and plasma-catalysis from thermodynamic catalysis is that, in the latter, catalysis does not require an initiation stage whereas the former two require initiation from an external energy source greater or equal to the bandgap of the catalyst. The three stages of photo- and plasma-catalysis include: (1) Energy absorption; (2) Creation of charge carriers and their transfer to the catalytic sites; and (3) Surface redox reactions. The creation of defects in catalysts therefore targets enhancing the energy efficiency in these three stages. Due to the fact that the history of photocatalysis for water splitting dates back several decades compared with catalytic plasma for CO2 or CH4 splitting or synthesis of NH3, urea and higher hydrocarbons from CO2 or CH4, the former provides valuable insight into the latter.
It is now well-understood that suitable crystallographic defects in catalysts could enhance several important functions in ferroelectric and piezoelectric catalysts. These functions include the enhancement of: electrochemical reactivity, electronic conductivity, ionic diffusivity, charge separation efficiency, carrier concentration, concentration of dangling bonds on surfaces, transition from step sites to catalytically active terrace site morphology, permittivity, piezoelectric coefficient, polarization, cation disorder, creation of oxygen vacancies and crystal structure amorphization. These structural modulations are induced through processing, chemical modification (either partial reduction or incomplete oxidation [191]) of existing catalysts by introducing substitutional or interstitial impurity [191,192,193,194,195,196], and high-energy radiation at 0.1 MeV levels [197].
In photocatalytic water splitting, the prerequisite energy absorption stage requires a solar absorption threshold at ca. 600 nm, which corresponds to a bandgap of 2 eV for good harvesting of solar photons. For example, the application of BaTiO3 in solar water splitting is limited because barium titanate has a large bandgap (ca. 3.0–3.3 eV) although its valance band and the conduction band edges are in the suitable position for photocatalysis. Furthermore, only 5% of solar radiation is in the ultraviolet frequency range while visible light constitutes more than 45%. Therefore, for efficient solar photosynthesis, the bandgap should be lowered and the frequency range of absorption should be extended. This condition can be achieved by metal nitrides and mixed anion compounds, such as metal oxynitrides and metal oxysulfides because of their suitable band gap and band edges [198]. However, due to their harsh processing environment, several of the desired characteristics (energy absorption, carrier generation and separation, surface chemical reaction) become difficult to control. Homogeneous doping to create chemical and morphological defects also extends the visible solar radiation absorption range of wide band gap semiconductors.
Structure modification or synthesis of suitable defect-rich materials aims to produce homogeneous photocatalysts. However, photocatalysis essentially involves thin film surface reaction whereas catalytic plasma reactions occur both on the catalyst surface as well as within the bulk through the generation of interconnected microscopic and sub-microscopic pores. However, this concept can apply to photosynthesis provided that the reaction environment allows the penetration of photons into the pores.
That said, catalytic plasma reactions have several other advantages over that of photocatalysis, which will be considered separately. Below, we examine the creation of defects in oxide catalysts, including perovskites, and their effects on their catalytic performance.

7.3. Anion Vacancies

The most important anion defect is the oxygen vacancy. It is now known that the enhancements of piezoelectric coefficient, remnant polarization, charge separation efficiency, carrier concentration, ion diffusivity, concentration of dangling bonds on surfaces and the transition from step sites to catalytically active terrace sites morphology in self-modified perovskites are due to crystallographic defects, in particular oxygen vacancies [191,192,193,194,195,196,197,198,199,200,201]. Oxygen vacancies generate electrons with energies within the bandgap, which is reduced (for BaTiO3 from ca. 3.2 to 2.4 eV) in piezoelectric materials compared with the original materials. Oxygen vacancies enhance the diffusion of O2− ions from the crystal lattice through the enhancement of diffusion channels and reduced diffusion barriers.
Due to the similar ionic diameters of oxygen and nitrogen, nitrogen substitution is often used for oxygen vacancy generation without introducing serious lattice distortion in the crystal lattice of the Ti4+ coordinated tetragonal phases [191]. However, in anionic monodoping, several unoccupied impurity states appear within the band gap, which may trap the photogenerated carriers due to charge imbalance thus reducing the photocatalytic efficiency [199,200,201]. When double doping through anionic (or indeed cationic) substitution is performed, the band gap is reduced further compared with monodoping and band gap edges move to visible light frequencies [199,200,201].
As pointed out by Goumri-Said and Kanoun [201], in double N co-doped BaTiO3, the replacement of the two closest O atoms by two N dopants introduces two net holes and a new N-N is created in which the bond length is 0.1518 nm. This distance is significantly shorter than the distance between the closest O atoms (0.2830 nm) in defect-free BaTiO3, indicating strong coupling between two N dopant atoms. It is possible that titanium is partially in Ti3+ state (which has covalent characteristics) in order to accommodate N-N bonding. It also indicates that due to oxygen vacancy, the sublattice is distorted to accommodate the double N dopants. This crystal distortion can generate permanent piezoelectric phases within barium titanate [201].
Hydrogen substitution [202] in BaTiO3 to obtain BaTiO3−xHx (x = 0.5) was shown to create excellent ammonia catalysis. The performance of these barium titanate oxyhydride catalysts matches that of conventional supported Ru catalysts including Cs-Ru/MgO or Ru/BaTiO3. Vacancy-free oxyhydride barium titanate BaTiO3−xHx is stable in air and water and has paramagnetic characteristics. Due to the liable nature of the hydride species, BaTiO3−xHx has been used as a versatile precursor towards mixed-anion substitution.
Nedumkandathil et al. [203] investigated the processing and structure of hydride reduction of tetragonal BaTiO3 and concluded that the resulting material was a complex disordered perovskite with the formula BaTiO3−xHy{#}(x−y) where {#} is oxygen vacancy with x < 0.6 and 0.04 < y < 0.25. Guo et al. [204] have shown that BaTiO3−xHy{#}(x−y) could be nitrated readily in N2 atmosphere at 450 °C to yield tetragonal phases BaTiO3−xN(2x/3)−y {#}(x/3)+y without significant distortion. In contrast with the nitridation of vacancy-free oxyhydride, BaTiO3−xHx, oxynitrides from BaTiO3−xHy{#}(x−y) appeared to be not fully nitrided and titanium remained partially as Ti3+ and the bandgap was in a range 2.4–2.5 eV.
Although the emphasis in defect engineering has been focused on narrowing the bandgap, bringing the bandgap edges within the absorption frequency range of solar energy and generation and transfer of charge carriers, the enhancement of catalyst energy absorption characteristics has also been considered. Efficient absorption is particularly important in electromagnetic protection where a large energy absorption coefficient is desirable over an extended frequency range [205]. The formation of a disordered layer is attributed to the numerous oxygen vacancies that form dangling bonds and distortion of the atomic arrangement [191]. The utilization of dangling barium bonds is a possibility to substitute impurities to enhance energy absorption. One such impurity for efficient energy absorption is the formation of Ba3N2 as nitrogen appears to be the best option for this substitution [206]. This substitution can be carried out without the introduction of too many impurities into the crystal lattice as nitrogen is often used to replace O2− ions in BaTiO3 when creating oxygen vacancies. In BaTiO3, BaO terminated surfaces can be replaced by Ba(NOx)2 disordered nitrate clusters creating a disordered sublattice [207].

7.4. Cation Vacancies

In BaTiO3, substitutional cation impurities are carried out with barium as well as Ti to improve piezoelectric properties such as piezoelectric coefficient, Curie temperature and energy storage capacity [184,208,209]. In the investigation of the cation defects, Ti4+ has been the main target due to its multivalency and the covalent characteristics of Ti3+, which is also the main source of defect formation. This is partly due to the fact that in obtaining piezoelectric black perovskites, including barium titanate, black TiO2 is often used as a precursor. In a theoretical study, Ertekin and Rezaee [210] considered O, Ba and Ti vacancies of the type Ba(1−3x)TiO3(1−x) and BaTi(1−3x/2)O3(1−x). They concluded that as barium vacancies have a lower electrostatic charge than titanium vacancies, the mobility of oxygen vacancies increases with increasing concentration of barium vacancies compared with titanium vacancies [210]. Furthermore, the synergistic effects are also present in piezoelectric catalysts in which the polarization field promotes charge separation and electron transfer while suppressing charge recombination. Oxygen vacancies are the main charge carriers and hence their presence in piezoelectric or pyroelectric catalysts will create a more efficient charge separation and transfer with reduced charge recombination [211].
When BaTiO3 particles were microwave irradiated in air with plasma generation, the color changed from white to cream, to brown and finally to black indicating a change from ferroelectric to piezoelectric phase, which is accompanied by the intensity reversal of the twin peaks at 2θ = 44.9°, (002) and 2θ = 45.37°, (200) in the XRD spectrum as seen in Figure 11d [83,170]. The importance of black-colored catalysts is that they are able to adsorb nearly full solar spectrum [193]. The irradiation conditions dictate the extent of the phase change within the BaTiO3 particles.
More recently, black piezoelectric BaTiO3 particles were synthesized [191] starting, (as a precursor) with black piezoelectric TiO2, which has excellent photocatalytic characteristics including a narrow bandgap [212]. Since the publication by Chen et al. [212] further improvements in black TiO2 have taken place including the introduction of substitutional and interstitial defects such as Ti3+, Ti–OH, Ti–H species, oxygen vacancies, as in barium titanate. Furthermore, the use of black TiO2 as a precursor facilitates the production of core-shell structures [213,214]. One such core-shell structure is Amorphous TiO2 @ Crystalline TiO2 as an efficient solar catalyst [214]. Nevertheless, the use and the types of engineered defects in black TiO2 are not conclusive [214].
Although the color change (from white-to-darker colors such as brown and black) in perovskites indicates the presence of defects, this appears [186] to be due to anion doping, rather than tetrahedral distortion and the partial transformation of Ti4+ to Ti3+. Kang et al. [198] synthesized BaLa4Ti4O(15−x)Ny perovskites and observed a large reduction in band gap (from 3.77 to 2.07 eV) and found no significant lattice distortion and the color change was attributed to substituted N3 species forming Ti-N bonds.

7.5. Amorphization Process in Ferroelectric-Piezoelectric Catalysts

One of the common effects of anionic or cationic doping in perovskites is the formation of disordered (amorphous) phases. Depending on the mechanism of formation, the catalyst itself can be X-ray amorphous with defects homogeneously distributed throughout [82,83]. Alternatively, if a crystalline catalyst is to be modified, the amorphous phases usually nucleate at grain boundaries or at the crystal defects. In this case, the catalyst remains crystalline with amorphous phases being detectable through analytical measurements, including XRD and high-resolution transmission electron microscopy.
The amorphization process through energy shock (i.e., large energy input per unit time per unit mass or surface area if the amorphization is confined to the surface) is a novel process used in the synthesis of defect-rich supported catalysts [82,83] as well as in the fracturing of a granite type of hard rocks [215,216,217] based on energy absorption at the grain boundaries, especially in the presence of water [217].
As in catalysts, the grain boundaries or the crystallite interfaces have high structural defects which render such interfaces amorphous. These interfaces also represent nano-scale locations where energy absorption is high compared with the defect-free crystal sites, as discussed previously. Therefore, in the presence of mechanical stress, the absorbed energy can initiate cracks and cause the accumulation of further defects, creating stress concentration at crystallite boundaries and at defective crystal domains [218].
This model is most readily understood in semi-crystalline polymers such as low- and high-density polyethylene [219,220,221]. Upon irradiation (solar and gamma-rays), such semi-crystalline materials develop microscopic cracks if there is residual stress due to, for example, molecular orientation in the absence of annealing. However, due to the phase transition from a folded chain semi-crystalline state to an ordered molecular orientation, they also become more resistant toward radiation-induced oxidation in air. Therefore, in semi-crystalline materials with residual or applied stress, any radiation damage is concentrated at the amorphous region as the energy absorption is the highest and molecules are more mobile [215,216,217,218,219,220,221]. Molecular orientation creates a high-entropy material (compared with the original highly crystalline state) with enhanced mechanical strength due to broad stress distribution thus avoiding stress concentration at grain boundaries [219,220,221].
Amorphization in metal-organic frameworks (MOFs) used as catalysts has also been observed [73,80]. Using a Ni-MOF-74 catalyst in plasma ammonia synthesis, it was found that the porous catalyst had a superior performance due to its porosity which was, however, compromised when the plasma power was above 200 W because of amorphization of the porous framework. This study provides a number of conclusions; the importance of the power input in amorphization in organo-metallic compounds and that extensive amorphization can lead to degradation of mechanical strength and physical structure.
In polymorphic materials, amorphization can be achieved by high-energy irradiation and shock mechanical deformation imposed in order to generate sudden mechanical stresses. External energy shock imposition triggers irreversible elastic instability in crystals thus creating defects and amorphous domains. The existing crystal defects, including dislocations, serve as nucleation centers for the propagation of amorphous domains. The accommodation of such defects results in the transformation from an equilibrium to a non-equilibrium high-entropy amorphous state [218].
Amorphization technology has been advanced through the introduction of high-entropy alloys, which show excellent mechanical characteristics. Here, equiatomic metals (usually five transition metals, which are also the main non-precious catalysts) constitute a multicomponent alloy that is amorphized to create high-entropy materials [222,223,224,225]. Most of the constituents are chosen from the Period-4 transition metals and hence high-entropy alloys have also been considered as catalysts and energy storage applications [226,227]. In addition, high-entropy-supported catalysts have been developed [83,228].
The amorphization techniques are not conducive to industrial-scale production as these techniques require high pressures and temperatures. Alternatively, in small-scale operations, medium to high-energy sources can be used at atmospheric conditions [229,230,231]. Fan et al. [229] and Li et al. [230] use pulsatile ultrasound (frequency 20 kHz) at an energy level of 2–60 kJ/cm2 from a sonotrode. Sonification causes rapid pressure build-up in the sample followed by relaxation. The concentration of the amorphous phase increases with the number of sonification cycles, reaching 52% after 120 cycles [230]. The high-resolution TEM images show the co-existence of crystalline and amorphous domains [229,230]. At low sonification cycles, the amorphous phase appears to be the continuous phase, which then reverses as the number of cycles are increased [229,230]. We note that sonification is also used to activate piezoelectric catalysts in aqueous media.
Wang et al. [231] used a laser scanning ablation technique to synthesize high-entropy alloys onto substrates through a number of energy shock cycles (average at 2 × 10⁵ W/cm2 with peak pulse at 2 × 10⁹ W/cm2) at room temperature. This technique is carried out in the liquid phase and is very similar to that of the synthesis of co-assembly catalysts by microwave irradiation of the catalyst(s) precursor salts in water with nano-sized catalyst support particles dispersed in the precursor fluid [82,83].
However, it is not clear from the above studies if cyclic imposition is necessary and the same results could be achieved with continuous irradiation. Cyclic energy imposition allows the surge in internal stresses causing defects in crystal lattice thus leading to accommodation of the amorphous phase before the imposition of the next shock. It can also allow temperature decay in the sample. It is easy to control the transient temperature rise and decay in liquid phase processing due to good heat transfer. Therefore, cyclic processing in liquids can be expected to curtail surges in stresses due to temperature gradients [82,83]. Nevertheless, in fixed solid samples with a very large power shock, as in Fan et al. [229], Li et al. [230] and Wang et al. [231], cyclic pulsatile power input is necessary to control the degree of amorphization.
Clearly, the methods cited in this brief review indicate that the imposition of energy shock is best achieved through the use of electromagnetic radiation rather than by the imposition of stress through deformation (as in ball-mill mechanochemistry). Both stress and absorbed energy create crystal defects and fracture for amorphization. Stress generation can be achieved either by pre-deformation without elastic recovery as in radiation-induced micro-crack generation in oriented macromolecules [219,220,221], or through the generation of thermal gradients as in continuous or pulsatile microwave plasma shock methods [82,83], pulsatile ultrasound irradiation [229,230], pulsatile laser scanning ablation [231] or simultaneous deformation and irradiation [219]. These studies illustrate the generic nature of the process whereby localized amorphization is achieved in different materials using the same principles of stress generation in materials.
In order to predict the performance, the emphasis was given to the synthesis of catalysts with a single-type defect in photocatalysts. However, it is not clear if such catalysts show greater efficiency compared with a cocktail of different types of defects within the same catalysts. Clearly, the presence of more than one type of defect introduces different pathways operating under different thermodynamic conditions and even in resonance with the neighboring catalytic site. One of the reasons for the high activity of high-entropy catalysts can be attributed to the synergy through the collective activity of different components and their vast number of alloys and mixtures. Therefore, further investigation should be carried out as regards the introduction of various types of defects into the same catalysts without compromising their mechanical integrity.

7.6. Chemical and Morphological Heterogeneity of the Microwave Irradiated BaTiO3

The chemical heterogeneity of the microwave irradiated BaTiO3 spheres as well as other perovskite and spinel oxides (with or without barium titanate), which were used in energy conversion processes, were studied by EDS through the distribution of Ba, Ti, O and N in the same sample. The state of oxygen concentration was characterized by lattice oxygen index [83], RO, defined as RO = [O]/([Ba] + [Ti]). When RO = 1.5, [O] = 0.6 (stochiometric concentration), and barium titanate has no oxygen vacancy, excess oxygen or any nitrogen present in its crystal lattice. However, the chemical structure of the microwaved barium titanate differs from its stochiometric state of BaTiO3 (when RO = 1.5; [O] = 0.6) within the same sample as RO deviates from domain to domain from its stoichiometric value of RO = 1.5. The observed experimental range of RO was approximately 0.5 < RO < 7.
Here, in Table 10, we illustrate the chemical heterogeneity in the microwave-irradiated samples. In this study, local mapping of the composition of the microwave-irradiated samples was carried out by using EDS. These results were divided into five categories; (1) Oxygen-depleted and nitrogen-free regions; (2) Oxygen-rich and nitrogen-free regions; (3) Dusty surface: O-poor and N-rich; (4) Oxygen-rich and nitrogen-poor (small amount of nitrogen, <10 mol% nitrogen); and (5) Oxygen- and nitrogen-rich but barium- and titanium-depleted regions. The composition of fresh BaTiO3 before it was microwaved is also shown in Table 10.
It is clear that the surface chemical composition of fresh BaTiO3 has drastically changed, creating chemically different regions within the same sample. Table 10 shows that the composition of the fresh commercial barium titanate is commensurate with the stochiometric formula, BaTiO3 (Domain-0) with small deviations which, in the present case, are due to the presence of excess BaO. The concentration of oxygen ([O] = 0.611) and [Ba]/[Ti] = 1.02 and RO = 1.57. Such deviations are to be expected from batch to batch of commercial materials.
In the heavily oxygen-depleted region ([O] = 0.333, Domain = 1), no N is present while in Domain-2, oxygen concentration is very high at [O] = 0.676 with no nitrogen present. No N was detected when RO ≈< 2.1 as shown previously [83]. The dusty surface, Domain-3 is slightly oxygen-poor, [O] = 0.581 but N-rich, [N] = 0.151. In Domain-4, when RO = 2.69, both [Ba]/[Ti] ratio and [N] start to increase while at Domain-5, a very large value of RO (=6.73) is observed with [N] and [O] both reach asymptotic values of ≈0.2 and ≈0.680, respectively. Both Ba and especially Ti concentrations are reduced with [Ba]/[Ti] = 13.4. It must be emphasized that as [Ti] is very low, EDS values have large variability.
Clearly, Table 10 shows profound chemical changes and heterogeneity in barium titanate due to microwave irradiation. The chemical heterogeneity is accompanied by equally profound morphological changes. The underlying transformations are very rapid and take place in a solid state on the surface and within the porogenetic pores. Here, we provide an update on those results presented previously [83,170]. This update mainly aims to understand the mechanism of chemical and morphological changes and their heterogeneity, which results in porogenesis and piezoelectricity with high concentration of cation and anion defects.
The activity of piezocatalysts is initiated when they experience mechanical deformation, which induces polarization and creation of charge carriers for redox reactions. The generation of charge carriers is not sufficient for catalysis as the excitation of electron–hole pairs (e− & h+) does not take place by mechanical stresses. Currently, electron–hole pair excitation is achieved by an external energy source, namely, ultrasound irradiation (ca. 10−10 eV) in aqueous media with photochemical applications such as water splitting and pollutant degradation [191,192,193,194,195,196,197]. Here, the ultrasonic irradiation can thermally excite charge carriers through the collapse of cavities in aqueous media.
In photocatalysts, the required energy for electron–hole pair generation is equal to or greater than the bandgap of the catalyst (typically ca. 3 eV). The bandgap determines the light absorption wavelength range of the catalyst. The generated charge carriers are first separated by diffusion followed by transfer to the catalyst surface to react in redox reactions. Recombination of the charge carriers reduces the catalyst efficiency. Polarization, as induced in piezoelectric catalysts reduces recombination.
It is clear from Table 10 that the above-cited defects (oxygen or cation vacancies and the resulting sublattice distortion) can be achieved in BaTiO3 at significantly low energy levels (ca. 10−5 eV) by combining microwave radiation with substitutional and interstitial impurities instead of high-energy radiation (ca. 105 eV) [83]. It is important to note that in vacancy creation, it is not only the level of excitation energy (ranging from kHz (ultrasound), MHz (nonthermal plasma), GHz (microwave), THz (solar) and EHz (X-ray)) but the presence of substitutional and interstitial impurities is important as well as the excitation rate. Therefore, as the excitation energy level increases from kHz to EHz, the excitation time becomes shorter and pulsatile excitation becomes necessary to control the vacancy-creation process.
In Table 10, we also present the chemical composition of the dusty surface (Domain-3). It indicates that although oxygen concentration ([O] = 0.581) is near the theoretical concentration ([O] = 0.6), dust particles are rich in nitrogen and titanium, indicating nitrogen substitution in the crystal structure and the domination of titanium terminated lattice. As discussed later, these particles are generated as a result of plasma erosion and play an important role in plasma catalysis.

7.7. Morphological Heterogeneity and Amorphization of the Microwave Irradiated Barium Titanate with Plasma Generation

As pointed out, prolonged microwave irradiation of BaTiO3 particles at high power and doses causes profound morphological changes, which not only result in phase transition from ferroelectric to piezoelectric state but also induce some desirable attributes as catalysts. These attributes include porogenesis and the formation of extensive nano-plates with nano-scale separation. In addition to the ferroelectric-to-piezoelectric phase change, both of these acquired characteristics are highly beneficial in thermochemical, electrochemical and plasma catalysis. These new characteristics are likely to result in quantum effects in catalyst activation and enhance piezoelectric catalysis. In the case of plasma catalysis, microwave-generated pores range from ~10 nm to 10 μ and hence they are large enough (pores in micrometers) for plasma penetration. However, nano-plate separation is at a few nanometer range, which is too small for plasma activity. Nevertheless, they are likely to be the source of quantum effects and allow the Knutson type of diffusion of small molecules encountered in energy conversion processes. Further, these plates, separated at nano-scale, are likely to take part in piezocatalytic reactions, as a small mechanical stress (due to thermal oscillations and dynamics of the reactor) will induce a large piezoelectric response. They also provide extended surface area for piezocatalysis and confine molecular aggregates in nano-sized domains with high electric field strength.

7.8. BaTiO3 Crystal Lattice Structure, Domain Walls and Grain Boundaries

In order to understand and interpret the significance of the radiation and plasma-induced structures, it is necessary to examine the crystal lattice structures in ferroelectric perovskites in general and BaTiO3 in particular. Ferroelectric crystals are defined by having a spontaneous polarization, that can be reoriented by an electric field. The spontaneous polarization is induced by a non-centrosymmetric crystal structure such as in BaTiO3 (a perovskite), below the Curie temperature (Tc = 120 °C) above which it is in a paraelectric phase with no net polarization. In the temperature range of 5 °C to 120 °C, BaTiO3 adopts a polar tetragonal phase, which has six stable polarization directions parallel to the edges of the unit cell, resulting in six distinct crystal variants [232]. In rhombohedral phases, 8 variants and, in orthorhombic phases, 12 variants are present [232]. These crystal structures determine the set of available polarization directions. Within the crystal, a region with uniform polarization constitutes a domain in which only a single crystal variant is found. Wherever domains meet, narrow interfaces known as domain walls form [232,233,234,235,236].
There are two types of domain walls in tetragonal crystal phases; 180° and 90° domain walls. In 90° domain walls, polarization direction changes by 90° whereas, in 180° domain walls, the directional change is 180°, resulting in anti-parallel polarizations in the boundary-sharing domains. Thus, in 90° domain walls, there is a unique domain orientation present. Rhombohedral phases produce 70.5°, 109.5° and 180° domain walls while the orthorhombic crystals have 60°, 90°, 120° and 180° domain walls [232,233,234].
A collection of domains with size in sub-μm levels constitutes grains that themselves have defects at the grain boundaries. Grain size increases with domain size. The available literature [237,238,239] indicates that domain size range is ca. 300 nm to ca. 1 μm while the grain size is 1–30 μm.
It was proposed that a greater fraction of unstable domains could imply a higher density of 180° domain walls [235]. In addition, this implies that domain nucleation is preferred over growth at shorter time scales (at high loading/excitation rates). As the loading rate is increased, a larger density of domain walls becomes mobile, which may also explain the reduction in the coercive field. Due to the mobility of 90°domain walls, ferroelectric materials exhibit strong nonlinear electro-mechanical responses to electric fields and electromagnetic radiation [236].
These complex structures and their evolution in solid state indicate the existence of a very fast reaction at relatively low temperatures. However, theoretical studies of domain pattern formation in ferroelectric crystals indicate that such a domain pattern is the result of competition between the reduction in energy achieved by mixing two types of domains (thus improving the alignment of the average polarization with the external field) and the energetic cost of the domain walls. The competition of energies determines an equilibrium domain wall spacing [232]. It is also possible that the minimum energy state consists of several such laminates, sandwiched together to form a multi-rank lamination [232]. The above review provides the background in highlighting the mechanism of the chemical-morphological transformations and their heterogeneity in BaTiO3 as described below.

7.9. Experimental Results on Microwave Radiation and Plasma-Induced Morphological Transformations in BaTiO3

The SEM images at various magnifications in Figure 12 illustrate the morphology of the microwave-irradiated barium titanate. Figure 12a illustrates the surface appearance of the irradiated BaTiO3 at small magnification. There are two types of structures that co-exist; either the surface is covered with small ca. 1 μm particles or a continuous porous skin layer formed through the fusion of the particles. In Figure 12b, the presence of small barium titanate particles is shown together with the part of a large particle where the genesis of a pore and particle can be observed. The porous skin structure is shown in Figure 12c where the extent and size distribution of the pores can be seen. Immediately below the skin, through a large pore, the new layered structure of the irradiated (with plasma generation) BaTiO3 is shown.
Under these two types of surface structure, there are lamellar structures formed by the pilling up of thin layered domains (nano-plates) forming slopped stacks which can also be described as steps. The 90° domain walls can be identified as the horizontal lines which define the height of the steps. These step-like domains mainly present as a collection of laminates (or lamellae). We define the single laminate structure as a micro-plate, which pacts to form thicker sandwiched multi-rank laminates, which we refer to as macro-plates. However, the thicker laminates (macro-plates) bifurcate through the formation of defects at the bifurcation point. Bifurcation also causes macro-plate separation thus causing further increase in nano-porosity. It is also interesting to note that, lamellar aggregate splitting is always in the form of bifurcations, not as multiple random de-laminations.
Furthermore, the nano-plates, micro-plates and macro-plates are separated by an abundance of BaTiO3 lattice exudate-particles, which are possibly rejected from the crystal lattice during the formation of the nano-plates. These exudates (shown as white-colored ellipsoidal droplets) are absent in fresh, non-irradiated BaTiO3. Note that the lattice-exudate particles have a wide size range, spanning from ca. 10 nm–100 nm. To the best knowledge of the author, these inter-nanoplate exudates have not been observed previously.
These lattice exudates essentially act as spacers between micro-plates and their nano-plate constituents. Figure 12d illustrates nano-plates (around the pore) and micro-plates (outside the pore). Figure 12e shows the micro-plates formed by the close packing of nano-plates and separated by the lattice-exudate particles in the form of droplets. The micro-plate dimensions are very large, (ca. 10 μm) except for their thickness which varies in the range of ca. 20 nm (single micro-plate thickness) to 300 nm (macro-plate thickness formed by micro-plates). Figure 12f illustrates the details of the fracture surface of the microwave-irradiated BaTiO3. They are in the form of steps with variable step heights.
A close examination of the SEM images shows that these micro-plates are made of three types of proto-nano-plates/structures: rectangular nano-plates (denoted as ), inverted U-shaped (Π) and inverted-V shaped (Ʌ) nano-structures. These proto nano-plates construct the steps in 3-dimension through close packing separated by lattice exudates. As can be deduced from Figure 12f–h, the approximate dimensions of the proto nano-plates are: Thickness ≈ 10 nm; Length ≈ 100–200 nm; Width ≈ 50–200 nm.
Figure 12i illustrates the development of a new type of micro-plane with a thickness of ca. 20 nm separated by the lattice exudates. The lattice exudates appear to have been pressed into circular domains, rather than ellipsoidal droplet-shape. These micro-planes also appear to be flexible forming a continuous undulating sheet with length and width dimensions in micrometers. Therefore, these plates are described as micro-sheets to distinguish them from the micro-plates illustrated in Figure 12f,g.
The XRD study shown in Figure 11a–f indicates that the crystallinity of the fresh BaTiO3 is the highest compared with that of the microwave-irradiated samples. However, what is interesting is that BaTiO3 initially undergoes amorphization at lower microwave doses (900 W), and at higher doses (1800 W), crystallinity increases but never fully recovers. It is possible that during microwave irradiation and plasma generation, the layered structure of BaTiO3 undergoes delamination when BaTiO3 crystals exude impurities from the crystal lattice, both anions and cations. This causes excessive levels of crystal defects because these ions do not have a similar ionic size and valance as those of Ba2+, Ti4+ and O2−. During microwave irradiation (with plasma generation) of BaTiO3 in the presence of air and absorbed HNO3, additional crystal defects will be created due to substitutional and interstitial impurity, cation disorder and amorphization. The ejection of the impurities, in the form of lattice exudates, proto-nano structures are formed (see Figure 12h), which then undergo self-assembly to form the laminated micro- and macro-plates.

7.10. Mechanism of Lattice-Exudate Formation and Amorphization of BaTiO3

As lattice exudates have an important function of separating proto-nano-plates as well as micro-plates and micro-sheets, the identification of their chemical and physical characteristics is important. This identification may also reveal their contribution to the use of BaTiO3 as a ferroelectric or piezoelectric catalyst. The lattice exudates first appear on the surface of the microwave-irradiated BaTiO3 as they emerge from the pores on the surface as seen in Figure 12b and penetrate into the bulk as shown in Figure 12c–i.
It appears that the surface lattice exudates are rejected through the surface pores as they agglomerate as shown in Figure 13a. In fact, they also appear to form the surface layer near the surface pores as well as the pores themselves as agglomerated exudates force through the surface as shown in Figure 13a. Figure 13b illustrates the macro-plates with lattice exudates that have a similar size range as those on the surface. However, in Figure 13b there is evidence of aggregation of the lattice exudates.
The results of the EDS study of micro-sheets and macro-plates are shown in Figure 14 and Figure 15, respectively. These studies include the EDS-layered image (Figure 14a and Figure 15a) and EDS spectra (Figure 14b and Figure 15b) and elemental mapping of Ba, Ti, O (Figure 14c–e and Figure 15c–e). As shown in Figure 14a and Figure 15a, lattice exudation is clearly present in the EDS-layered images but it cannot be identified in the Ba, Ti and O mappings in Figure 14c–e and Figure 15c–e. This, therefore, suggests that the chemical composition of these exudates is similar to the background BaTiO3.
However, the EDS spectrum shown in Figure 14b and Figure 15b indicates that in addition to Ba, Ti and O, there are trace amounts of Al, Fe, Si, S and C present. The presence of carbon is due to the surface coating of the SEM-EDS samples. The presence of Al, Fe, Si and S (all at ca. 0.3 wt%) can be attributed to feedstock impurities in the manufacture of barium titanate. Therefore, it is possible that these impurities are ejected from the crystal lattice into the grain boundaries where they form aggregates. However, due to the lack of accurate in situ composition determination, at this stage, we assume that the lattice exudates are amorphous BaTiO3 with Al, Fe, Si, S. The interstitial impurities such as Al and Fe can replace Ba or Ti and S, as a chalcogen [240,241] can replace oxygen in the crystal lattice causing distortion. Furthermore, these impurities also cause point defects.
Plasma-based energy shock is also present during microwave irradiation and plasma generation [83]. Previously, we have shown [83] that prolonged (ca. 150 h) exposure to nonthermal plasma (without any microwave irradiation) resulted in morphological changes on the BaTiO3 surface, similar to those encountered when BaTiO3 was subjected to microwave radiation and plasma generation. These experiments [67,70,82,83,86,87] relate to catalyst synthesis in air with the generation of NOx and CH4 conversion to H2 as well as CO2 conversion to CO. Therefore, in addition to the presence of nonthermal plasma, BaTiO3 particles were in contact with several excited atoms, ions and molecules which could contribute to the structural changes in BaTiO3.
A typical morphology change during prolonged nonthermal plasma reactions is illustrated in Figure 16 when methane was converted to hydrogen and higher hydrocarbons using BaTiO3 in a DBD plasma reactor [70]. As seen in Figure 16, although the thickness of the bundled micro-plates is similar to those in Figure 12, Figure 13, Figure 14 and Figure 15, the concentration of lattice exudates is very low, almost non-existent compared with the case of microwaved BaTiO3 shown in Figure 12, Figure 13, Figure 14 and Figure 15. Figure 16 also illustrates more clearly the structure of the proto-nano-plate shapes, , Π and Ʌ compared with those in Figure 12d–f where lattice exudates have caused distortion to the proto-nano-plates.
The effect of microwave irradiation in air and plasma generation on the morphology of BaTiO3 changes is shown in Figure 17a–c. The magnification in these three figures is identical for direct comparison. These figures illustrate the development of amorphous structures during microwave irradiation in air. These SEM images are obtained from the same sample at different locations or with the same processing history.
Figure 17a illustrates the presence of bundles of micro-plates with lattice exudates. Figure 17b shows that the micro-plates have partially undergone crystalline-to-amorphous transition. This transition appears to have started between the micro-plate interfaces and the lattice exudates appear to be absent. The micro-plates now consist of two parallel regions; an amorphous phase and a crystalline phase with ladder structures formed by the proto-nano-plates. However, the widths of the proto-nano-plates are now smaller than the starting structure shown in Figure 17a. Figure 17c shows that the transition from the crystalline-to-amorphous phase is complete and the micro-plates are formed from the agglomeration of nano-particles.
Figure 16 and Figure 17 indicate that in BaTiO3, the co-assembly of three types of nano-structures (, Π and Ʌ) results in the formation of micro-plates during prolonged (ca. 100 h) plasma exposure without any significant generation of lattice exudates. Microwave with plasma generation in air results in the formation of the same type of micro-plates from the co-assembly of nano-plates together with a large number of lattice exudates due to the amorphization of crystalline BaTiO3 as considered previously [83]. This process now takes place within a few minutes rather than hundreds of hours in the absence of microwave irradiation. It is possible that microwave plasma shock creates a rapid growth and aggregation of the intra-crystallite amorphous phase in BaTiO3 and the enhancement of the amorphous phase volume due to a decrease in density. These amorphous phases are displaced from the crystallite domain boundaries as lattice exudates. The XRD results indicate the enhancement of the amorphous phase. As the above morphological transformations occur in the same sample at different locations, they indicate that these structures (crystalline, semi-crystalline and amorphous) represent varying levels of microwave energy absorption. This conclusion is in line with the visual observation that plasma generation starts at the center of the microwave reactor where the maximum dose is present [242,243]. During microwave irradiation of nitric-acid-doped barium titanate particles, plasma generation does not start spontaneously but starts on the surface of a few BaTiO3 particles and spreads rapidly to the other particles.
In metals, high-energy (ca. 1 keV) radiation generates point defects and vacancies. Accumulation of these point defects forms interstitial clusters, stacking fault tetrahedral and voids in the materials [244,245,246,247]. These defects would lead to swelling, hardening, amorphization and embrittlement, which finally cause material failures [248,249]. Nano-crystalline materials, which contain large fractions of grain boundaries, have better radiation resistances compared with their single crystalline counterpart [247,250]. Therefore, it has been thought that grain boundaries act as effective sinks for point defects generated by radiation [247,251,252,253].
The recent mechanism proposed by Wei et al. [247] for the nanocrystalline metal resistance to high-energy radiation fracture is based on the absorption and annihilation of point defects by the climb motion of line defects at a grain boundary. This suggests that the grain boundaries eliminate vacancies and in fact act as a barrier (arrester) for crack propagation and crack healing. Therefore, phase transition takes place at the grain boundaries which can enhance mechanical strength [254].
Nanocrystals themselves act as centers for stopping the crack front before the growth of line defects reaches a critical length when the stress concentration at the crack front exceeds the tensile stress of the material. This mechanism forms the basis of material reinforcement. Furthermore, the rate of solid-state reactions induced by radiation (including solar and gamma radiations) is reduced if the local stress distribution is broad in the amorphous domains of the semi-crystalline materials while the presence of stress concentrations accelerates initiation and propagation of local fracture domains leading to catastrophic failure [220,255]. The fracture energy is reduced by stress as described by the Zhurkov equation, which has been generalized for solids and liquids [166], and quantum effects are incorporated through plasma temperature and ion plasma frequency [255]. Therefore, the proposed mechanism for radiation-induced segregation at grain boundaries in metals needs to address the well-established theoretical and experimental results for different materials.
In the case of ceramics, which form line compounds, there is a strong thermodynamic driving force to resist off-stoichiometry [256]. Nevertheless, in ceramics, radiation can induce a notable segregation of one of the constituent elements to grain boundaries thus locally creating a non-stoichiometric composition as observed in BaTiO3 previously [83] and summarized in Table 10 in this study. However, unlike the radiation-induced segregation in metals, segregation in ceramics is strongly temperature dependent. The theoretical calculations by Wang et al. [256] indicate that this difference is due to the defect energy landscape present in the covalent system. This model can explain why irradiated BaTiO3 has such a wide range of Ba/Ti ratios in which [Ba]/[Ti] = 13 as seen in Table 10.

8. Preparation of Supported High-Entropy Catalysts for Nonthermal Plasma Facilitated Reactions

8.1. Background

The use of high-entropy alloys and oxides (perovskites, spinels and garnets) as catalysts has been considered on the basis of their morphology and chemical heterogeneity which provide a “cocktail effect” [257]. Due to their high electrical conductivity, high-entropy alloys are not suitable as plasma catalysts. However, the electrical conductivity of high-entropy catalyst oxides can be controlled [258,259,260]. Increasing oxygen vacancy concentration increases the carrier density and improves the conductivity of an N-type semi-conductor, and the effect is the opposite for a P-type semi-conductor [258]. When 4+ valence elements substituted host cations, extremely low electrical conductivity was observed in some high-entropy oxides due to lower oxygen vacancies. Therefore, electrical conductivities could largely be controlled (enhanced or reduced) by optimizing the concentration of oxygen vacancies originating from charge compensation in other high-entropy oxides. Electrical conductivities of high-entropy garnet oxides were even lower compared to single component oxides due to the local distortion effect [260]. Similar to electrical conductivity, the introduction of chemical disorder into a compound with the addition of high-entropy metals increases the ionic conductivity through the creation of local disorder [261]. The locally disordered locations create overlapping sites with reduced energy differences for the transport of charge carriers, including ions in electrochemical catalysis.
Previously, it was shown that the single- or multi-metal oxide catalysts prepared through the co-generation of support (SiO2) and catalyst from liquid-to-solid phase transformation by microwave irradiation with plasma generation resulted in a porous catalyst that was highly heterogeneous both chemically and morphologically [82,83,170]. These oxide catalysts can be described as (AxByOz)/(SiO2)λ. Although x = y=1 and 0.25 < λ < 2, in the resulting catalyst oxide, x, y, z, λ are all spatially variable in micron-size domains within the catalysts depending on the processing conditions and overall composition. The chemical heterogeneity is reflected by the morphological heterogeneity. Therefore, within the catalyst, there are pockets of chemically stable connected regions to facilitate charge transfers. These aspects of the catalyst structure make them attractive as catalysts due to their high activity, easy processing and, in certain cases, reversibility of the chemical-morphological structure, which introduces chemical-looping ability [82,83,170].
It was found that in single component (AxByOz)/(SiO2)λ version of the catalysts (y = 0), denoted as M/Si = X/Y where M is the metal catalyst and X, Y are the number of moles of M and Si, there is a critical microwave power required to decompose the catalyst precursor (usually M(NO3)n) in air at relatively low temperatures (ca. 200 °C). The critical power increases with atomic weight and the concentration of the catalyst for single and low valency catalysts (Ni, Cu, Zn). However, for high, multi-valency catalysts (Cr, Mn, Fe, Co tested), the critical power is low and when X ≥1, plasma is generated at low microwave powers. In the case of binary-supported catalysts (denoted as M1/M2/Si = X/Y/Z), the critical power required is significantly lower than that of the single valency catalyst component. Once again, plasma is generated under microwave irradiation when ([M1] + [M2])/[Si] ≥ 1. Plasma generation takes place following the decomposition of the catalyst precursor salt.
The nano-scale structure of these catalysts has been evaluated. It was found that in single-component catalysts, the XRD-based crystallite size increases with increasing [M]/[Si] ratio. These catalysts also have structural decorations due to phase separation during the nitrate decomposition stage. However, in binary catalysts at high catalyst loadings with plasma generation, the XRD spectra indicate the presence of an almost complete amorphous phase or very low crystallite size.
These results indicate that the process results in the generation of a catalyst with high oxygen vacancy and chemical and morphological heterogeneities and therefore high activity, which is sufficient to cause a chemical reaction involving the constituents of the catalyst and support precursor fluid and that of air. Under microwave irradiation, the resulting reactions cause plasma generation, which further accelerates the decomposition thus completing the reaction typically within ca. 30 s under the experimental conditions of reference [83]. An investigation of the phase diagrams of binary catalysts as a function of temperature with or without SiO2 support indicates the presence of stable phases within a small compositional range [262,263,264,265,266,267,268,269]. Such phases can form readily by multivalent cation substitution in multi-component systems. These configurational entropy stabilized phases invariably have substantial lattice distortion and significant electronic coupling of metal 3d and oxygen 2p orbitals for increased covalency [268] as also observed in piezoelectric BaTiO3 and other perovskites. Therefore, the observed heterogeneity in chemical composition is a result of spinel islets in the equilibrium phase diagrams of several AB2O4 spinels where A, B = Cr, Fe, Mn, Co, Ni, Cu, Zn and Si. More recently, high-entropy spinel-type catalysts have also been synthesized [260,270,271,272,273,274,275,276]. Si-containing spinels are formed at elevated temperatures [275,276].
To the best knowledge of the present author, supported high-entropy catalysts have not been investigated. Such SiO2-supported catalysts can be represented nominally as:
(M(1)M(2)M(3)…M(n))3 O4−x/SiO2 = X
where M(n) n = 1, 2, 3,… N are the catalytic elements in which N ≥ 5 (for high-entropy catalysts) and
X = (Σ [M(n)])/[Si]
Here, X is the ratio of the total molar concentration of the metals to the molar concentration of the support. In order to maximize the configurational entropy of the system, we use an equiatomic concentration; i.e., [M(1)] = [M(2)] = [M(3)]…= [M(n)]. In line with our previous study [83], we also consider the case when X = (Σ [M(n)])/[Si] = 1 so that the resulting catalyst can generate plasma during the processing and thereafter.
Several quantitative methods for predicting the structure of the resulting high-entropy alloys and oxides have been established [272,273,274]. They can only be applied to supported high-entropy catalyst oxides as a guideline if the catalyst support forms intermetallic compounds within a tight concentration range. Nevertheless, there are important overlaps between the processing of plasma-generating-chemical looping catalysts and high-entropy metal oxides as both types of catalysts undergo high-temperature reactions. However, in radiation-induced plasma-generation-based catalyst processing the overall reaction temperature is low, local temperatures can reach several thousand degrees followed by a rapid decay that freezes the reaction products. Therefore, unlike the thermal or combustion-based high-entropy material processes with subsequent heat treatment, radiation/plasma reactions are non-equilibrium processes.
The participation of the support (SiO2) in the catalytic process is through pore and defect generation and the introduction of semi-conductivity, which enables the highly metal-loaded catalysts to be suitable for use in plasma catalysis, with or without plasma generation. However, it was assumed that SiO2 did not react with the metal oxides. We can expect the formation of silicates and generation of M-O-Si bonds when the local concentrations favor stable phases.
Cobalt has been used in most of the high-entropy materials and oxides as the primary element. A vast number of relevant data indicate that for MxCo3−xO4 spinel oxides, the Bragg angles in all the spinel oxides are very similar to that of Co3O4, irrespective of the co-metal component [277,278,279,280,281,282].

8.2. Significance of Supported High-Entropy Catalysts

The interest in high-entropy oxides as catalysts is that it is possible to engineer oxygen vacancies and disordered cation distribution, which is driven by competition between bond enthalpy and entropy of cation occupancy [277,280,283,284,285]. The significance of oxygen vacancies (M-{#}-M) and the covalent nature of the M-O-M bonds have been reviewed previously in connection with perovskite piezocatalysts, black TiO2 and microwave-plasma-modified black-BaTiO3. Spinel high-entropy catalysts offer new types of metal–oxygen bonding M1-O-M2 and oxygen vacancy M1-{#}-M2 where M1 and M2 are two of the components across an O-bond or O-vacancy {#} and M1 and M2 combination increases with increasing components in high-entropy spinels. Chen et al. [285] have synthesized (FeCoNi)O4 medium entropy catalysts in which the synergistic actions of multiple cation substitution and oxygen vacancy creation activate covalent Fe-O-Co bonds. O-bridged Fe–O–Co bimetallic sites promote the formation of μ(O–O) intermediates and undergo the direct O2 evolution route, thus accelerating oxygen evolution in electrocatalytic reactions.
Until recently, it was assumed that all the cations equally and randomly occupied the octahedral and tetrahedral sites in high-entropy materials, including catalysts and oxides without preference [286,287,288,289]. However, in a study by Sarkar et al. [288] aimed at providing a correlation between the long-range magnetic structure and cation spin-oxidation states of the model spinel-high-entropy oxides, (Co0.2Cr0.2Fe0.2Mn0.2Ni0.2)3O4, significant preferences in cation occupation were observed resulting in the lowest configurational entropy allowed by the given composition in a spinel structure. The proposed model for the spinel high-entropy oxide structure exhibited behavior similar to (Co0.6Fe0.4)(Cr0.3Fe0.1Mn0.3Ni0.3)2O4. These results were confirmed by Johnstone et al. [289] who have also shown that by using a non-magnetic post-transition metal, Ga, the preference of the cation occupation of the octahedral and tetrahedral sites could be tailored. In the absence of Ga, the site occupancy in (Cr, Mn, Fe, Co, Ni)3O4 is such that Cr and Ni exclusively occupy octahedral sites and Co has tetrahedral occupancy while Fe and Mn have mixed occupancy. The increase in Ga concentration reduces the tetrahedral site occupancy by all the components as their occupancy increases in the octagonal sites.
In the current study, Zn/ZnO was used because it has well-known catalytic properties based on its high electrochemical coupling coefficient and radiation absorption coefficient as well as its desirable piezoelectric characteristics including charge separation, electron trapping, defect formation and photoactivity [290,291,292,293,294]. Like the current plasma generating single- or multi-component catalysts, these attributes are related to an extensive array of interface morphologies when used with other catalysts [291,292,293,294,295]. In fact, CuO is the most widely used catalyst [291,292,293,294,295] with ZnO. Another motivation for choosing Zn was that, like Ga used in spinel-high-entropy oxides [288,289], it is a nonmagnetic post-transition metal. It was shown that in ZnxMySbzO4 spinels (M = Cr, Mn, Ni), the temperature of the spinel formation increases with increasing atomic number of the M substitution and that the tetrahedral sites are exclusively occupied by Zn [290]. Furthermore, as also indicated by Sarkar et al. [288] and Johnston et al. [289], the site selectivity on the catalyst promoter (Ga) is dependent on the synthesis method, choice of reagents or thermal treatments performed on the samples.

8.3. Experimental Results

Supported high-entropy catalysts were prepared using the technique for the synthesis of plasma-generating chemical-looping single- or multi-component (with three metals) catalysts, which can be described as medium entropy supported catalysts [83,170]. The catalyst precursor fluid consisted of equimolar nitrate salts of Cr, Fe, Co, Cu and Zn dissolved in 30 wt% gamma-glycidoxypropyltrimethoxysilane-coated 5 nm diameter silica particle dispersion. We note that, during microwave irradiation, silane-coated silica particles undergo de-aggregation as described previously [83,170]. The composition of the precursor fluid is [Cr] = [Fe] = [Co] = [Cu] = [Zn] = 0.1 and [Si] = 0.5. This precursor solution (20 mL) was subjected to microwave irradiation in a round bottom ceramic dish for 8 min at 1 kW power. In all cases, the resulting black metal oxide highly porous powder was used for SEM, EDS and XRD analysis without further treatment.
The XRD results indicated that the catalyst was amorphous. This result is in line with previous experience in that when high-valency multi-valent catalysts such as Cr, Fe and Co are used with monovalent catalysts such as Ni and Zn the resulting SiO2-supported catalysts are amorphous. The same is also true when multivalent catalysts are combined as multi-component catalysts, as in the present case of high-entropy-supported catalysts. The SEM investigation showed that, unlike the single- or binary-supported catalysts, the surface structure lacked decorations as a result of phase separation.
The distribution of the components on the surface of the {(Σ [M(n)])/[Si] = 1} supported high-entropy catalyst was evaluated by EDS and shown in Figure 18, which shows a typical surface structure as well as the mapping of the all the components, including Si. Figure 18a is the electron image of the surface, while Figure 18b–g are the mapping of Si, Cr, Fe, Co, Cu and Zn, respectively. The elemental distributions of all the components match each other, including that of the catalyst support, Si. However, the Co-mapping shown in Figure 18e indicates that there are regions where the intensity of Co is significantly higher than the other regions. Further, the intensities of the counts associated with the components are different indicating that the surface concentrations are not similar.
Table 11 shows the distribution of the concentrations of all the elements. It can be seen from Table 11, that Si is present throughout the catalyst surface. Due to its widely differing electronegativity and ionic radius compared with the metal catalysts, the participation of the support (SiO2) in the catalytic process is through pore and defect generation and introduction of semi-conductivity. This enables the highly metal-loaded catalyst to be suitable for use in plasma catalysis with or without plasma generation. It is often assumed that SiO2 does not react with the metal oxides. Silica-containing spinel oxides have been found to form [275] at temperatures above 800 °C. In the present method [82,83], very high transient local temperatures are reached. Hence, the formation of silicates and M-O-Si bonds can be expected [258,262,263,264]. It was found in supported single multivalent catalysts, M/Si = X, that at high catalyst concentrations (X > 1), new minor reflections appear in the XRD patterns [83]. The available data show [275,276] that these extra reflections are compatible [275] with SixCo3−xO4 spinel oxides (0 < x < 2).
The concentration of the multivalent components, Cr, Fe and Cu are very similar while that of Co is well above the other multivalent components. On the other hand, there is hardly any Zn present on the surface. Figure 18 indicates that the dominant spinel oxide is nominally MCo2O4 rather than CoM2O4 (M = Cr, Fe, Cu, Zn, Si). This is due to the low octahedral site preference energy of cobalt cations [277,280,283,284,285].
In microwave-induced binary and multi-component silica-supported catalysts with multivalent metals, the XRD patterns do not yield sufficient information for structural evaluation because the catalyst is amorphous/glassy [83]. Hence, at present, we cannot evaluate the catalyst structure in the supported high-entropy catalysts from the XRD studies. However, EDS images shown in Figure 18 suggest that Co not only makes SixCo3−xO4 spinel oxides but also spinel oxides with the other components of the high-entropy supported catalysts as MxCo3−xO4 (M = Cr, Fe, Cu, Zn). A vast number of relevant data indicate that for MxCo3−xO4 spinel oxides, the Bragg angles in all the spinel oxide cases are very similar to that of Co3O4, irrespective of the co-metal component [277,278,279,280,281,282].

8.4. Compositional and Morphological Heterogeneity

Another important aspect of spinel-high-entropy catalysts is that, essentially, in micron-to-nano scale domains, they are heterogeneous with respect to their local structure and composition [271,288]. As shown previously [83], the current silica-supported single- or binary or tertiary catalysts have exactly these features. Surprisingly, the extent of the structure and energy demand to achieve the processing of these catalysts decreases with increasing number of components. The micron-to-nano size structure formation is a result of phase separation during the decomposition of the nitrate salts (or indeed other water-soluble salts) of the catalyst precursor during radiation-induced transformation to catalyst oxides and their alloying when very rapid solid-state reaction takes place typically in ca. 20 s. Although the energy required for the catalyst precursor salt decomposition increases with increasing atomic weight and catalyst concentration, it is also strongly dependent on the catalyst and radiation power. In the decomposition reaction, the power requirement for monovalent catalysts is higher than that for multivalent catalysts, which can also create plasma at sufficiently high concentrations. In a binary catalyst with monovalent and multivalent catalysts, the decomposition of the catalyst salts takes place at a lower power input than that required for the monovalent catalyst. This can be explained by the formation of thermodynamically preferred binary phases between the components.
It is not surprising that as the number of catalyst components is increased, especially the multivalent components, the probability of alloying between the components increases, which lowers the power requirement while the size of the morphological structures, including crystallite size, decreases. These characteristics are associated with the phase behavior as well as the transient temperatures during fast solid-state reactions and subsequent quenching. As the crystallite size decreases, XRD-peaks broaden, which makes the multicomponent catalysts appear amorphous thus preventing the determination of the phases. We note that almost all high-entropy materials, including the catalysts, have several multivalent components, including Cr, Mn, Fe, Co and Cu.
It is, therefore, necessary to examine the behavior of the single, binary and tertiary component supported catalysts separately with cobalt as the common component. This examination indicates the trend finally observed in high-entropy spinels with at least five metal components. In so doing, in addition to Co, we examine Cu as the highest atomic weight co-catalyst in the high-entropy catalyst system and Zn as the catalyst promoter, especially in the presence of Cu.
Figure 19 illustrates the characteristics of: (a) Co/Si = 1/4 A (1 kW); (b) Co/Cu/Si = 1/1/8 A (1 kW); (c) Co/Cu/Si = 1/1/8 A (1 kW)B(TA = 600 C, 2 h); (e) Co/Cu/Si = 1/1/8 A (1.8 kW); and (e) Cu/Si = 1/4 A (1.8 KW) catalysts prepared at a microwave power of 1 kW (Figure 19a–c) and 1.8 kW (Figure 19d,e) power using the method and notation described previously [82,83] in which the letter (A) indicates catalysts that were not subjected to any further treatment after microwave processing at the indicated microwave power for 4 min. It also indicates that the silane coating on the 5 nm diameter silica particles was not removed. In all cases, nitrate salts of Co and Cu were used and the SiO2 source was Bindzil CC301 (now called Levasil CC301 from Nouryon, Sweden). Letter (B) in the catalyst description indicates that the catalyst sample after production was annealed at 600 °C to remove the silane coupling agent and to investigate phase separation during annealing.
In Figure 19, the surface decorations of the catalysts are illustrated through SEM images associated with the crystalline structure by XRD. All surfaces consisted of plain SiO2-rich background and metal-rich decorations. The type of decoration is dependent on the microwave power as well as the subsequent heat treatment (annealing at temperature TA).
The comparison of Figure 19a,e indicates that Cu produces more pronounced decorations compared with Co. When the Co-containing catalysts are subjected to heat treatment (annealing), the surface decorations become dimmed as seen in Figure 19a-1 SEM-1 (Co/Si = 1/4 A) and Figure 19a-2 SEM-2 (heat treated, Co/Si = 1/4 AB) respectively. A similar effect is also observed in the Co/Cu binary catalyst as shown in Figure 19c SEM, which also shows the appearance of Cu-rich nano-rods and plates as a result of phase separation. However, although the structure of the flower-like Co-rich decorations becomes more diffused, they are still identifiable after heat treatment.
As seen from the comparison of Figure 19a,b and Figure 20, silica-supported Co/Cu/Si binary catalyst produces more pronounced decorations than the corresponding Co/Si single catalyst. It was also found that for Co/Cu/Si = 1/4 A (1 kW) (Figure 19b) catalysts, there were two slightly differing decorations as illustrated in Figure 20a,b. The surface decoration for this catalyst is shown in Figure 19b SEM at high magnification and in Figure 20a at low magnification. Figure 20b shows the decorations on the pore surfaces at high magnification. Figure 20a also shows the extent of the decorations spread on the silica-rich smooth surface.
The XRD spectra associated with each surface decoration (Figure 19) show that Cu-containing catalysts have sharper peaks indicating the presence of more crystalline phases and larger crystallite size. As indicated previously [83], at high metal concentrations, several new XRD peaks appeared when Co/Si > 1. A close examination of Figure 4c of Reference [83] indicates that for Co/Si = 2/1-A, the clearly identifiable peak at 52.1° is assigned [275,276] to the SiCo2O4 spinel as this peak is the dominant reflection of this spinel and Co3O4 does not have any peaks in this region. However, for Co/Si = 1/4 A catalysts, we can expect a very small amount of SiCo2O4 spinel formation mixed with Co3O4 spinel and SiO2.
It is clear that the combination of Co and Cu provides a highly heterogeneous catalyst both in terms of morphology and chemical composition. Both of these characteristics are enhanced after heat treatment when not only the silane coating disappears but also thermodynamic equilibrium is established for the Co-Cu-Si system.
As shown previously, the microwave power requirement (Critical power, P*) to form silica-supported spinel oxide (M/Si ≤ 1, M = Cr, Mn, Fe, Co, Ni, Cu—all transition metals) from nitrate salts increased as Cr ≈ Mn ≈ Fe < Co < Ni < Cu. This order is opposite to that provided by Poleti et al. [290] for ternary spinel oxides (ZnxMySbz)O4 (when the transition metals M = Cr, Mn, Co, Ni were substituted) in which the reaction temperature (as opposed to microwave power in the present case) increased with Cr ≈ Mn ≈ Co > Ni. Furthermore, it was also observed that the reaction temperature was reduced with increasing transition metal concentration. (ZnxMySbz)O4 spinel is somewhat similar to the high-entropy catalyst system used presently, (Cr, Fe, Co, Cu, Zn)/Si, because in addition to the use of a post-transition metal, Zn, a metalloid, Sb, was used by Poleti et al. [290] in place of Si. It was found that Zn was divided in its occupancy of the crystal lattice sites and it exclusively occupied the tetrahedral sites whereas octahedral sites were occupied by all components, including Zn.
Table 11 shows that the Zn concentration in (Cr/Fe/Co/Cu/Zn)/Si = 1 high-entropy catalyst is very low. This cannot be explained by the critical power requirement of Zn/Si = 1/4 A because P* = 450 W for this catalyst [83]. Unlike all of the SiO2-supported transition metal oxides (M/Si = 1/4 A), Zn/Si = 1/4 A is dense [83] indicating that Zn(NO3)2 molecules are unable to escape the confinement of SiO2 cages during microwave irradiation as illustrated previously [83].
The XRD and EDS analysis of various Co/Si; Cu/Si and Co/Cu/Si catalysts are summarized in Table 12 where the crystallite sizes at the maximum intensity reflections associated with CuO (at 2θ = 35.6°) and Co3O4 (at 2θ = 36.8°) are shown as a function of processing history. We can assume that these two XRD peaks are associated with CuO and Co3O4 spinel [296,297,298] with some CuCo2O4 as the dominant peak at 2θ = 37.0° (reflection [299,300,301]) for CuCo2O4 coincides with that of Co3O4. We note that in multicomponent systems, the position of XRD peaks is dependent on processing and annealing conditions as well as the purity of the components. Therefore, the accuracy of the diffraction angles is ca. ±0.15°. Further complication is due to the fact that the dominant diffraction [278,297,298,299,300,301] for MCo2O4 spinel (M = Cr, Fe, Ni, Cu, Zn, Si for example) is only smaller by ca. 0.2° compared with that of Co3O4. It can be seen that for Co/Cu/Si = 1/1/8 A catalysts, the crystallite sizes for Co3O4 and CuO are lower than that of corresponding crystallite sizes in Co/Si = 1/4 A and Cu/Si = 1/4 A. As can be expected, due to the faster processing time, when the microwave power is high, crystallite size is lower in Co/Cu/Si = 1/1/8 A catalysts. The thermal processing of Co/Cu/Si = 1/1/8 (AB) catalysts (at 300 °C) or annealing of microwave (1 kW) processed Co/Cu/Si=1/1/8 AB at 600 °C, results in an increase in Co3O4 and especially in CuO size.
The presence of Cu in the Co/Cu/Si = 1/1/8 A catalyst results in the formation of strong and extensive decorations, which are significantly richer in Cu than Co, especially when the catalyst is prepared at high microwave power at 1.8 kW. Compared with the sample preparation at 1 kW, the total metal content (Co + Cu)/Si ratio of the decorations is more than 10-fold higher when the catalyst is prepared at 1.8 kW. Heat treatment results in a reduction in the (Co + Cu)/Si ratio. In the case of a Si-rich smooth background surface, (Co + Cu)/Si ratio is near the theoretical value of 0.25 and does not change significantly with heat treatment. However, if the process is carried out at a high temperature (300 °C) or at high microwave power (1.8 kW), (Co + Cu)/Si ratio is slightly higher at ca. 0.42. Once again, annealing of the supported catalysts reduces the catalyst/silica ratio.
As seen in Table 13, unlike Cu, Fe/Si catalysts do not form any nano-structure or decorations on their surface. Compared with Co, the crystallite size is significantly smaller even after heat treatment (sample Co/Fe/Si = 1/1/8 AB). In the case of Co/Fe/Si = 1/1/8 A catalysts, crystallite size for Fe3O4 spinel remained low and no surface decorations were observed even at high magnifications.

9. Quantum Effects in Catalytic Plasma Processes, Catalyst Porogenesis and Generation of Negatively Charged Plasma Dust Particles as Collider Catalysts

9.1. Background

Due to the importance of sustainable NH3 production and CO2 capture and its catalytic conversion to useful products, a huge number of scientific publications are now available, some of which also deal with the mechanism of its conversion to CO. In order to innovate suitable technologies to prevent global warming, the understanding of the mechanisms of CO2 and the associated H2O splitting as well as nitrogen fixation (either by NH3 or NOx syntheses or NH3 sequestration with CO2) is necessary so that efficient-sustainable processes, reactors and catalysts can be developed. Most of such available mechanisms have been proposed in solar energy splitting of H2O using TiO2 and related catalysts due to their extensive use in water splitting.
Despite the similarity between catalytic solar energy and plasma CO2 splitting, the latter lags behind the former in the research and understanding of the dynamics of the process, although catalytic plasma reactions have certain advantages over photoreactions. In plasma catalysis, in line with water splitting, most studies aim to develop catalysts with a small bandgap, high oxygen vacancy and charge transfer characteristics. Essentially, most of these studies assume thermodynamic equilibrium and do not differentiate between the catalytic activity of different catalyst facets, their abundance and accessibility and the interactions between the catalyst support and catalyst morphology/cluster size in assessing performance. These physical characteristics are primarily acquired by processing thus making inter-catalyst performance comparisons difficult. The catalyst modification by the prevailing reaction media is not considered either, partly due to the classical understanding of catalysis.
However, there have been important advances in the understanding of the dynamics of photocatalytic processes for CO2 and H2O splitting. In these studies, interactions at the atomic scale between the excitation field, catalysts, reactants and products are explored through in situ spectroscopy and microscopy, supplemented by density functional theory (DFT) calculations, which have been further advanced by incorporating quantum mechanics aspects of catalytic reactions. These advances relevant to CO2 splitting and NH3 synthesis have been briefly reviewed. It is important to indicate that, to the best knowledge of the author, these theoretical and experimental advances have not been applied or considered in catalytic plasma reactions. In this present study, it is shown that some of the experimental results obtained in rapid structure transformation in BaTiO3 during microwave irradiation with plasma generation and CO2 splitting and NH3 synthesis can be better understood in terms of quantum effects.

9.2. Analytical Techniques and In Situ Observation of Catalyst/CO2 Interactions

In situ spectroscopic techniques were developed for the detection of reaction intermediates [302,303] and reaction-environment-dependent dynamic evolution of active sites in the catalyst (i.e., the transformation between the surface terrace and step sites) [304]. Atomically resolved mapping of catalyst surfaces was achieved using High Angle Annular Dark Field Scanning Transmission Electron Microscopy (HAADF-STEM) [280,305,306], Atomic Force Microscopy (AFM), Scanning Tunnelling Microscopy (STM) or combined AFM and STM have been successfully used for the in situ observation of oxygen vacancy sites and their generation [307,308,309,310,311,312]. The noncontact AFM provides an exceptional spatial resolution due to the use of a terminal oxygen atom functionalized tip [309,310]. Noncontact-AFM was used in the in situ imposition excitation field (such as UV-radiation) or annealing of the catalyst. For the first time, the dynamic evolution of catalytic activity and excitation of the reactants during catalysis can now be studied at atomic scale by using noncontact AFM, and the results are interpreted in combination with density functional theory calculations [309].
The effect of confinement of catalytic reactions to a nano-scale environment was demonstrated recently by Li et al. [312] using a scanning tunnelling microscope. Individual hydrogen molecules sandwiched between the STM tip and a copper substrate (Cu(001)) were dissociated solely by the reciprocating movement of the STM tip. DFT calculations were carried out to understand the mechanism of the reaction which appears to be catalyzed by the presence of other adatoms or diatomic molecules (Au and Co are used) on the substrate.
It is interesting to note that the confinement phenomenon [23] has been utilized at various length scales, ranging from ca. 100 μm to nano-scale [23,82,83], in which the ratio of the size of the confinement environment-to-confined species is typically <10 in order to achieve an unusual response from the confined matter. This phenomenon is equally valid for biological and physical systems in which the walls of the confining environment also affect the reaction-transformation outcome. The nano-reactors assemble spontaneously and the reaction can be initiated by an external energy field such as radiation or electric field [82,83]. This phenomenon formed the basis of process intensification in agriculture, biology, chemical and energy conversion processes [2,3,4,5,6,14,15,16,17,18,23,24,25,26,27,28,29,30,31]. In some cases, the reaction may not be achieved without the confinement. A recent finding by Chen [313] the effects of cations indicates that without the presence of a cation (onto which CO2 molecules are adsorbed) electrochemical splitting of CO2 simply does not take place.

9.3. Quantum Effects in Catalytic Plasma Reactions: Catalyst—CO2 Interactions

In plasma- and photo-catalysis, CO2 must be activated to acquire a bent structure as a prerequisite for dissociation. This process is achieved through plasma activation of CO2 molecules which is thought to have led to the non-biological route of earth’s oxygenation through CO2 dissociation to carbon and O2 [314,315]. Another energy source for CO2 activation and dissociation is the shortest wavelength of ultraviolet light (vacuum ultraviolet, VUV) radiation [316], which leads to low photoconversion levels (ca. 5%) to O2 and carbon. The majority of CO2 follows the minimum energy path to CO and O as the primary products of CO2 splitting [316]. Nevertheless, the findings of Lu et al. on O2 [316] indicate the existence of another photo-dissociation path of CO2 other than the well-accepted CO and O route. New reaction pathways have been calculated through the DFT calculations in which the relationship between the energy of a molecule (or a collection of them, molecular clusters) and its geometry is also considered. This relationship, known as Potential Energy Surface (PES) [317,318,319,320,321,322,323,324] is obtained from the application of the Schrödinger equation to molecules in which, as the first perturbation, the nuclei are considered to be stationary compared with the dynamics of the electrons [317,318,319,320,321,322,323,324]. This approach is highly relevant to molecular interactions with catalyst surfaces when the reactant molecular geometry changes as it goes through intermediate stages during catalytic reactions. The incorporation of the PES concept into DFT calculation can therefore allow the discovery of new reaction paths, which is not compatible with the minimum energy path approach in non-equilibrium reactions.
Several theoretical papers based on modified DFT calculations have appeared and they are used in the interpretation of experimental results that are compatible with quantum effects in catalysis in photo-dissociation of CO2 and H2O in particular [317,318,319,320,321,322] and polyatomic catalytic reactions in general [317,325,326].
Metal and metal oxide clusters, nanoparticles and quantum dots (nano-crystals) are used as heterogeneous photocatalysts. Such clusters are also present in a plasma-generating-chemical looping porous semi-conductor type of single or multi-component catalysts located on SiO2-rich pore walls. Furthermore, as shown herein, such structural heterogeneities are also present in microwave-irradiated BaTiO3 catalysts or their combination with SiO2-supported plasma-generating catalysts that have local semi-conductor characteristics [82,83]. Highly comprehensive reviews of metal/metal oxide clusters [327] and CO2 orientation modes and subsequent reactions on catalytic surfaces and clusters are available [328].

9.4. Quantum Effects in Catalytic Plasma Reactions: Plasma-Induced Catalyst Erosion and Dusty (Complex) Plasma Characteristics

When plasma comes into contact with solids, plasma-induced erosion (sometimes referred to as “corrosion”) takes place through ion and electron impact, especially in materials with microstructural defects [329,330]. Therefore, the acuteness of this phenomenon in catalysts should be expected, although there are no studies on plasma erosion in catalysts. In addition to the ion-impact mechanism cited above for plasma-induced erosion, a second mechanism is based on the nucleation, growth and aggregation of atomic/molecular precursors inside plasma discharge into quantum dots and nano-particles. This effect was first observed in plasma-assisted chip production in the semi-conductor industry [331,332,333]. The resulting particles (named dust, typically in the size range of 10 nm–10 μm) in the presence of nonthermal plasma acquire an electrical charge by collecting electrons and ions from the plasma, or by photo-electron emission if they are exposed to UV radiation. The charged dust particles interact with the electrons and ions, forming a multi-component plasma generically called dusty (or complex) plasma. The size of the dust particles also affects plasma properties and hence dusty plasma is usually considered nano-dusty plasma or micro-dusty plasma. Such specific dusty plasmas can be generated under laboratory conditions but a broad particle size spectrum is present in the astrophysical environments.
The presence of charged particles changes the entire dynamics of the plasma domain and results in several phenomena that have been the subject of investigation over the last 40 years and applied to nano-particle processing [334]. Comprehensive reviews of the phenomena associated with dusty plasma and its applications are available [335,336,337]. However, the application of dusty plasma to catalyst processing and catalytic plasma has not been considered previously. In this paper, we present data that indicate the formation of dust particles during catalytic plasma reactions and their effect on the reaction path in CO2 splitting.
The following characteristics of the dusty plasma are relevant to catalytic plasma processes:
(a)
Formation of dust particles by plasma-induced catalyst erosion, which is likely to be acute due to the extensive morphological defects which are present in photo- and plasma-catalysts.
(b)
Nano-dust particles are formed either as quantum dots with semi-conduction characteristics or nano-particles from the reactive precursors.
(c)
Electrons are removed from the plasma discharge (Havnes effect [338]) by dust particles to form negatively charged particles, with electron number density [339] in the range 105–106 elementary charges per μm3 of the dust.
(d)
The charge density of the dust particles is governed by the surrounding environment (such as electron density in the gas space) as well as the density, shape and size of the particles [337]. However, according to Petersen et al. [333], the size dependence is weak.
(e)
The ion density and electric potential profile are almost independent of both, dust size as well as dust density [340].
(f)
Results available from the RF-generated plasma suggest that the plasma and dust cloud appear to coexist and coupling of both is weak [340].
(g)
Many-particle quantum mechanics calculations by Balzer et al. [341] predict that energetic ion-particle collision can excite the electrons in the solid leading to the occupation of a single lattice position by two electrons thus forming a doubloon. Doubloons have homogeneous distribution in this non-equilibrium state [341].
(h)
In the investigation of dust density waves (propagation of dust particles in the subsonic ion flow direction or at an oblique angle), it was found that the impact between electrons and neutral gas atoms (which results in plasma glow as a signature of energetic electrons) was enhanced in the presence of dust and the maximum in glow brightness was followed by dust density maximum [342].
(i)
If the interparticle spacing is on the order of or less than the Debye length, the dust particles will interact strongly through their mutual Coulomb fields [337]. When the plasma-generating supported perovskite or spinel catalysts, (including BaTiO3) are used as packed beds in a plasma reactor, this condition is satisfied.
At this stage, several other manifestations of the dusty plasma phenomenon will not be considered. These include dust density waves, the formation of voids in the form of dust-free gas spaces, vortices and shock waves generated by dust particles [335,336,337,338,339,340,341].

9.5. Experimental Demonstration of Microwave Plasma-Induced Erosion of BaTiO3 Particles

The generation of highly charged catalyst dust nano-particles can be expected to act as activated quantum dots and/or nano/micro catalyst aggregates. In the first instance, it is necessary to show that plasma-generating catalysts undergo plasma erosion, and dust particles are generated from the catalyst. In this demonstration, solid 3 mm diameter BaTiO3 spheres are used as they have high mechanical stability. Furthermore, when plasma is generated using microwave irradiation in air, these large spheres are stationary and they do not undergo any mechanical attrition thus creating fractured particles. However, due to their fixed position during microwave irradiation, their response to microwave and plasma has high spatial variability which in turn causes high levels of structural and compositional heterogeneity [83] as can also be seen in Table 10.
BaTiO3 samples used in the evaluation of the plasma eroded dust were obtained in the same way as those used previously in the evaluation of heterogeneities in microwave plasma-induced effects [83]. These particles were irradiated at 1800 W for 4 min with the generation of plasma. Figure 21 shows two such regions on the same particle. Figure 21a illustrates the proximity of these two locations and the locations of the EDS analysis.
Location-1 shows highly deformed grains merging at the grain boundaries through the fusion of fine particles. Due to the deformation and fusion, the original nearly spherical grains are now close-packing but the fusing grains form a long-range anisotropic micro-structure and their surfaces are now pitted as shown in Figure 21b. Near Location-2, the long-range structure disappears and the original grain structure appears. However, these grains are now covered with dust particles as shown in Figure 21c. The shapes of these grains are substantially the same as the original grains although there are various grain boundaries that are in the process of fusion and shape changes from nominally spherical grains to elongated grains.
The EDS results shown in Table 14 indicate that the discrete particulate-containing region with dusty surface (Location-2) has a very high nitrogen content while oxygen concentration is very close to the theoretical value of 0.6. It appears that the particles are rich in Ti as [Ba]/[Ti] = 0.907 indicating that the surface is primarily Ti-terminated and hence suitable for photocatalysis or plasma catalysis. Ba-terminated BaTiO3 (111) surface have high oxygen concentration in the form of BaO3. These particles also have very high nitrogen concentration [N] = 0.151, which is an indication of high oxygen vacancy and nitrogen substitution in the catalyst. On the other hand, at Location-1, the structured part of BaTiO3 is formed by the fusing of smaller particles, with [Ba]/[Ti] = 0.943 and low oxygen concentration, indicated by an oxygen index RO = 1.07. Additionally, the nitrogen concentration is reduced by a factor of 2 compared with Location-2.

9.6. Mechanism of Particle Generation and Porogenesis

A criterion for the catalyst fragmentation through fracture under microwave-plasma was given previously [83]. According to this criterion, represented by Equation (11), the ratio (AN) of input surface power density (PS) must be greater than dynamic surface power density (a CED/λ) in order to start the fragmentation in irradiated materials.
AN = PS/(a CED/λ)
Here, (a) is the particle size formed, which is equivalent to the size of the material domain removed from the bulk material; CED is the cohesive energy density and λ is the relaxation time. Both power densities represent energy per unit surface per unit time indicating the importance of energy shock in irradiated materials. It is important to note that if the relaxation time λ is small, or when the fracturing domain (a) is large, the power density requirement is high for fracture and particle formation. In the case of solid polymers or fluids, λ is inversely proportional to viscosity and can be obtained from the proton-relaxation NMR (i.e., λ = T2-relaxation time). Typically, λ = 10−5 s for covalent solid polymers and for ionic solid λ can be expected to be several orders of magnitude lower [14].
Equation 11 represents a fracture criterion based on energy power shock, rather than slow, progressive erosion of the catalyst by plasma constituents, primarily by ions. This slow cumulative process due to ion impact can be termed as plasma creep and the estimate of the relaxation time is assumed to be the inverse of the ion plasma frequency (typical time-scale for ion motion) estimated at 10−20 s [255].
The AN number provides a qualitative upper limit of surface power density necessary for the production of plasma particle generation; it does not provide a mechanistic description of the process. It is likely that there are two competing mechanisms present in plasma dust formation. As seen from Table 14, the nitrogen concentration in both locations with micrometer and nanometer particle ranges are very high and they cannot be regarded as N-doping but should be regarded as N-substitution. Hence, the effects of interstitial substitution include the creation of O-vacancies (as in N-doping) but also direct TiN and Ti2N formation at the Ti-terminated surfaces (100) and (111) or at the oxygen vacancies. As both TiN and Ti2N provide high photoactivity for TiO2 we can expect further enhancement of the catalytic activity of BaTiO3 as a result of interstitial nitrogen substitution [343,344,345]. We note that Ti-terminated (100) surfaces can be regarded as TiO2.
When the surface layer of BaTiO3 is bombarded with plasma constituents in the presence of nitrogen, the interstitial nitrogen N3− facilitates oxygen-vacancy formation and the accompanying reduction of Ti4+ to Ti3+, which are thought to be the active centers in photocatalysis by TiO2. The valence band of interstitial N3− lies above that of O2−, allowing lower energy photoexcitation from diamagnetic nitrogen to Ti 3d orbitals, which is seen as a significant reduction in band gap [346,347]. Furthermore, the crystal lattice anisotropy increases with N-substitution [346,347] because the Ti–N bond distance is longer than Ti–O bond length.
Smaller, near-spherical plasma particles can be generated by interstitial substitution through the formation of compounds from the constituents of BaTiO3 and the plasma. As microwave irradiation is carried out in air likely compounds generated by the catalyst-plasma interactions include BaTiO3−x-y {#}xNz where z = 2y/3 and {#} represents oxygen vacancy. Due to the vacancies and lattice anisotropy, the locally produced compounds have higher specific volumes compared with the host BaTiO3 and hence, they are rejected from the lattice to achieve stress relaxation. As a result, nano-scale surface porogenesis takes place producing nano-particulates with high vacancies and N-substitution, both of which establish high catalytic activity in these porogenetic particles [170]. This process has also recently been observed in the processing of nitrogen-rich carbons [348]. The nano-sized plasma particles can self-assemble rapidly to form the structures shown in Figure 12, Figure 13, Figure 14, Figure 15, Figure 16, Figure 17 and Figure 21.
After the formation of a domain rich in defects and plasma-induced reaction products, there needs to be a mechanism to eject them from the host-surface. This is achieved by phase separation as well as stress generation due to higher specific volume (lower density). If the imposed irradiation surface energy is not sufficient, such defect regions grow so that another stress-based mechanism can eject them from the host material. This ejection mechanism is due to stress generation as a result of thermal gradients and differential volume expansion under repeated microwave and plasma irradiation. The particles produced through this mechanism have irregular size and wider size distribution compared with nano-sized particles. When these particles are ejected from the surface, pores and pitted surfaces appear as shown in SEM images of Figure 21.
A close examination of Figure 12 indicates that some of the small pores (<100 nm) have what appear to be lattice exudates growing through the pore, indicating that such exudates push the weakened defective domains from the surface and create particles. It is possible that the near-spherical-shaped lattice exudates are generated through the same process but some of the exudates may remain attached to the surface because their growth is restricted by the layered structure of BaTiO3. Only the lattice exudates that grow near the surface (unrestricted) are able to grow and form particles in plasma.

9.7. Third Body Impact in Catalysis

The result of the porogenesis of pristine BaTiO3 under irradiation and plasma in air results in plasma dust with a modified chemical composition, which can be represented as BaTiO3−x−y{#}xNz. These particles in the nanometer range (ca. 10–100 nm) can also be expected to have nano-porosity and can be regarded as catalyst clusters acting as third-body colliders. Such nano-particles exhibit higher catalytic activity than their corresponding bulk materials because of their significantly enhanced surface/volume ratio (further enhanced by their nano-porosity), as well as their highly heterogeneous surface microenvironment [349,350,351,352,353]. Local defects and pores allow reactant molecules and plasma to penetrate into the subsurface of the catalyst clusters thus enhancing the catalytically active surface area. The existence of plasma activity within the pores of barium titanate or silica-supported perovskite catalysts of the type M/Si = X or M(1)/M(2)/Si = X/Y/Z has been demonstrated previously [82,83].
These cluster- and nano-particles (plasma dust) can take part in catalysis in the plasma space as a source of electrons without the source holes, which thus prevents electron–hole recombination. They also act as a third-body collider with reactive species. The third body impact chemistry in fluids (both gaseous and liquid) provides novel pathways and selectivity [354,355,356]. Collisional energy transfer can be elastic (with rebound) when the electron transfer takes place without any physical adsorption of the reactive species on the third body surface or it can be inelastic when the adsorption takes place on the surface.
Elastic collisions ensure constant activity of the third body without surface saturation. The loss of electrons from the third body is replenished from the plasma space. Inelastic collisions are dependent on the dynamics of the collision as well as the electronic characteristics of both the third body and the reactive species. In principle, it is therefore possible to modify the surface structure of the third body for a specific selectivity and high activity. In order to promote high-energy electron impact, Mehta et al. [62] investigated catalyst design using two approaches, electronic and geometric considerations in a third body, and concluded that these two characteristics were interactive and could not be decoupled. Nevertheless, plasma- and radiation-induced dust generation is therefore useful in catalytic plasma reactions. Catalytic plasma dust particles enhances plasma activity at low electron density while promoting catalysis on their surface and suppressing electron impact reactions in the plasma space.

10. Mechanism of Catalytic Plasma CO2 Reduction Using BaTiO3 and M/Si = X Catalysts

10.1. Background

As described previously, when nitric-acid-doped BaTiO3 spheres or powder are subjected to microwave irradiation in air, micron-scale domains with physical and chemical heterogeneity develop on the surface of BaTiO3, which can penetrate into its bulk. The resulting structure can be represented as BaTiO3−x−y{#}xNz where z = 2y/3, and {#} is the oxygen vacancy. When BaTiO3 is irradiated in air in the presence of the combined catalyst and silica support precursor fluid, the resulting catalyst system can be denoted as (M/Si = X)/(BT) = Y where M is the metal catalyst and X is the molar ratio of metal and silica support while Y represents the molar ratio of catalyst and barium titanate. In this case, the barium titanate structure can be represented as BaTi1−rMrO3−x−y{#}xNz. Therefore, this structure represents a co-doped barium titanate.
As apparent from the literature cited in this study, the overwhelming research on photocatalytic CO2 reduction has been based on TiO2 and its derivatives. This research on TiO2 also provides insight and guidance into the design of catalysts and understanding of catalytic plasma processes. Similarly, BaTiO3 has been researched extensively as a ferroelectric material, consequently, there is a wealth of information available. Therefore, BaTiO3 presents a unique opportunity as the chemistry of Ti-terminated (100) surfaces is very similar to that of TiO2.
Local oxygen vacancies, compositional fluctuations, metal-oxygen bonding covalency and piezoelectric effects result in the high catalytic activity of TiO2. These observations are also valid for BaTiO3 but not for other Group-II titanates, ATiO3 (A = Mg, Ca, Sr, Ba), and there are no structural differences between the local (scale of scrutiny = 10 A°) and average structures in ATiO3 except BaTiO3 [357,358]. The validity of this property for other perovskite and spinels has not been investigated. However, the relatively low Curie temperature of BaTiO3 can restrict its use but the conversion of paraelectric BaTiO3 to piezoelectric BaTiO3 removes this drawback and makes BaTiO3 unique as a model and practical/useful plasma catalyst [83]. The discoveries of black-piezoelectric BaTiO3 [83] and TiO2 [222,223] are likely to enhance their use and further research into photo- and plasma-catalysis.
In order to enhance the activity of BaTiO3 and perovskite or spinel type of SiO2 supported catalysts (M/Si = X, M = Cr, Fe, Co, Ni, Cu) in plasma reactions, these two materials have been physically or chemically combined [67,69,74,83,86,87,97,98] in ammonia synthesis and CO2 splitting and, in both cases, an enhanced activity has been observed. Some of these results have been replicated recently in the catalytic plasma synthesis of ammonia [359]. The combination of BaTiO3 and M/Si = X to form a BaTiO3@M/Si = X has been provided in this study. However, in the current study, we will not consider the CO2 splitting mechanism using combined BaTiO3 and M/Si = X.
Monodoping of a semi-conductor with either cations or anions usually generates impurity bands within the band gap, which can act as electron–hole recombination centers. On the other hand, the simultaneous cation and anion co-doping results in charge compensation, thus preventing recombination [360,361].
Using the technique described previously, metal- and nitrogen-doped BaTiO3 was obtained in the form of {(M/Si = X)/BaTiO3} = Y where the metal itself shows catalytic activity [83]. Unlike high temperature (ca. 1000 °K) thermochemical doping-substitution under reducing conditions, the resulting barium titanate itself undergoes structural changes acquiring porosity, oxygen vacancy, simultaneous anion and cation substitution and piezoelectricity with the generation of negatively charged plasma dust particles. This catalyst can be represented as BaTi1−rMrO3−x−y{#}xNz, where M can be chosen from transition metal catalysts as can be concluded from Table 10.
The DFT studies are usually based on the BaTiO3 (100) or (111) surfaces, which also indicate that both surfaces have oxygen vacancies and the Ti-O bond presents a non-negligible covalent character [362,363]. BaTiO3 (100) surface is weakly polar and can exhibit either a BaO or a TiO2 termination as shown in Figure 22a,b, respectively. On the BaO-terminated surface, large Ba cations are coordinated with 8 O2− compared with 12 in the bulk. On the TiO2 surface, smaller Ti cations are coordinated with 5 O2− compared with 6 in the bulk. The TiO2 terminated surface is slightly more stable than the BaO surface and as a result, both types of surfaces coexist [362]. The unit cell dimension in the BaTiO3 (100) surface is 0.283 nm.
Unlike the Ba-terminated BaTiO3(100) shown in Figure 22a, the Ba-terminated BaTiO3 (111) surface is O-rich with BaO3 composition and negatively charged. Ti-terminated surface is O-deficient and positively charged consisting of Ti cations only. The surface Ti ions do not bond to the other ions of the terminated surface because the distance between them is too large (unit cell length = 0.565 nm). Therefore, they are coordinated only by the O ions of the Ba-O layer below.
It is usually assumed that the contribution of Ba2+ to the activity of BaTiO3 is minor and is only responsible for the construction of crystal structure [364]. However, as the dangling Ba2+ ions are highly active, there is evidence that O2 adsorbed on the BaO-terminated surface undergoes dissociation [365].
The foregoing summary indicates that the mechanisms of CO2 reduction on BaTiO3 (100) and (111) surfaces and the associated terminations will be different, dictated by the surface chemistry and geometry. However, this should not be seen as a degradation of the catalytic activity of modified BaTiO3, because the existence of different reaction pathways could enhance overall conversion, each pathway being energetically more favorable to the plasma-activated reactive species. This will of course apply to other reactions, including NH3 synthesis from different feedstock.

10.2. Simplified Modelling of TiO2-Terminated BaTiO3 (100) Surface and Reaction Mechanism

In order to illustrate the effects of surface terminations we use a barium titanate model with oxygen vacancies only. The 3D descriptions of the TiO2 and BaO terminated BaTiO3−x{#}x (100) surfaces are shown in Figure 22a,b. These 3D descriptions of the TiO2 and BaO terminated surfaces can be reduced to a 1D representation as shown in Figure 23. Atomic layers below the surface have a diminishing influence with increasing depth on the surface chemistry and their effects can be ignored [365].
In Figure 23, the TiO2 terminated BaTiO3−x{#}x (100) surface is shown along a line passing through the Ti-cations. Here, we ignore the possible co-cation (Ba2+) contribution to the electronic state at each active site. Figure 23 shows four different active sites represented as A, B, C and D associated with Ti3+, Ti4+ and O2− ions and oxygen vacancies {#}. It is likely that each site energetically favors specific CO2 and intermediate reactant orientation, as well as the reaction that should be determined through DFT calculations.
The proposed mechanism of CO2 reduction on the TiO2-terminated BaTiO3−x{#}x (100) surface is described below through a number of reactions. For the sake of simplicity, the orientation of the reacting molecules is not indicated. In light of the background publications, we can assume that CO2 orientation is bent with a variable angle as low as ca. 120°.
(a)
Reaction-1. CO2 reduction at oxygen vacancy [Ti3+ {#} Ti3+] and restoration of {O2−} site. We can assume that microwave plasma processed BaTiO3 already has a range of oxygen vacancies as depicted in Figure 23 (Site-A). Reaction-1 illustrates the restoration of the {O2−} site through electron transfer from two Ti3+ cations bordering the oxygen vacancy to the CO2 molecule with the release of CO.
CO2 + [Ti3+ {#} Ti3+] = CO + [Ti4+ {O2−} Ti4+]
(b)
Reaction-2. CO2+ cation generation at the [Ti3+ {#} Ti4+] sites. In nonthermal plasma reactions, CO2 cations are known to be generated and attributed to high-energy electron impact with CO2 molecules [91]. These ions can also be generated when CO2 molecules are adsorbed at the [Ti3+ {#} Ti4+] oxygen vacancy sites as in Figure 23 (Site-C). As a result, the Ti4+ cations are converted into a more active Ti3+ state as in [Ti3+ {#} Ti3+]. The reaction is shown in Reaction-2.
CO2 + [Ti3+ {#} Ti4+] = CO2+ + [Ti3+ {#} Ti3+]
(c)
Reaction-3. O2 generation at [Ti3+ {O2−} Ti4+] and restoration of [Ti3+ {#} Ti3+] sites. CO2+ cations generated in Reaction-2 are consumed at the active Site-B leading to CO and O2 generation and the restoration of the oxygen vacancy [Ti3+ {#} Ti3+] as shown in Reaction-3. When combined, Reactions 1 and 2 restore the existing oxygen vacancies, leading to CO2 dissociation into CO and O2.
CO2+ + [Ti3+ {O2−} Ti4+] = CO + O2 + [Ti3+ {#} Ti3+]
(d)
Reaction-4. Charged catalyst plasma dust particles as an electron source and a third-body, M(n)−. The above mechanisms take place on the catalyst surface. Several other reactions occur in the plasma space based on electron impact. It is often proposed that CO2 decomposition can take place in the plasma space through electron impact. The electron-rich plasma dust particles can be represented as M(n)−, where n is the number of electrons per dusty plasma particle. We can assume that the impact of CO2 with them results in the reduction of CO2 and the formation of oxygen atoms according to Reaction-4.
CO2 + M(n)− = CO + O + M(n)−
(e)
Reaction-5. Reaction of oxygen radicals at [Ti4+ {O2−} Ti4+] sites. Oxygen radicals are highly soluble and can diffuse within the crystal lattice [323] to react with the oxygen anions and cause the formation of oxygen vacancies.
[Ti4+ {O2−} Ti4+] + O = [Ti3+ {#} Ti3+] + O2
The above reactions indicate that the oxygen vacancies are lost and re-generated through a number of reactions involving the reactive sites A, B, C and D on the TiO2 terminated BaTiO3−x{#}x (100) surface. The activity of other facets and terminations should be investigated in order to determine the principle reactions in the decomposition of CO2.

11. Preparation of Composite Supported Metal Oxide Catalysts and Piezoelectric Barium Titanate

11.1. Background

In order to decouple the catalysis in plasma space and on the catalyst surface, Akay [67,82,83] used BaTiO3 as the plasma catalysis promoter (PCP) and M/Si = X catalysts together; either as a physical mixture or as a dispersion of BaTiO3 in M/Si = X. It was shown that this type of mixed catalysts could achieve high conversions in various reactions, including ammonia synthesis [67,69], ammonia synthesis with in situ ammonia sequestration [3], Fischer–Tropsch synthesis [74], CO2 splitting [86,87] and CH4 reforming with CO2 [67,97,98]. However, due to the absence of knowledge on the paraelectric-ferroelectric-piezoelectric phase transformation of BaTiO3 during prolonged plasma reactions, some of the results were misinterpreted. The current study can now correct these errors. More recently, Liu et al. [93] confirmed the results obtained by Akay [3,67] and Akay and Zhang [69] as regards the use of mixed BaTiO3 and supported catalysts. However, the nature of the combined BaTiO3 and supported catalyst used by Liu [93] is not clear.
In this section, we show that during the preparation of composite BaTiO3 + supported perovskite or spinel-type catalysts using the method described previously [67,83], the resulting catalyst has a piezoelectric BaTiO3 core with oxygen vacancies and highly porous supported metal oxide skin, represented as M/Si = X. This type of composite catalyst can be described as {M/Si = X}@BaTiO3−x{#}x.

11.2. Experimental Results

Fresh BaTiO3 spheres (diameter ≈ 3 mm) were soaked in 67% HNO3 for 2 h and rinsed with excess water to remove the surface acid. To the silica support precursor, fluid (Bindzil CC 301) was added to a sufficient amount of Co(NO3)3 salt to obtain Co/Si = 2/1. Then, 10 g of this solution was added to 15 g BaTiO3 spheres (containing absorbed HNO3). The resulting mixture was microwave irradiated in a Pyrex bowl for 1 min at 1800 W. Because Co/Si > 1 and also due to the presence of BaTiO3 particles [67,83], after 30 s, NOx gases evolved and then within 10 s, plasma glow started. The experiment was stopped after 20 s. The surface temperature of the composite catalyst was ca. 180 °C, well above the Curie temperature of BaTiO3.
As BaTiO3 particles are dense, vigorous boiling during microwave irradiation of the catalyst nitrate salt and silica dispersion fluid could not cause flotation of the particles. However, there was sufficient agitation to coat the particles with silica-supported Co3O4 catalyst oxide.
The SEMs of a Co/Si = 2/1 coated BaTiO3 particle are shown in Figure 24. Figure 24a shows three of the coated particles with large numbers of pores. The morphology of Co3O4 coating is illustrated in Figure 24b, which also confirms the presence of pores connecting the surface to the BaTiO3 core. The morphology of Co3O4 is similar to that obtained without BaTiO3. The size of these pores is ca. 3 μm, which allows the penetration of plasma into BaTiO3. The morphology of BaTiO3 below the Co3O4 coating is observed by partially removing the Co3O4 coating as shown in Figure 24c, which also shows the formation of plasma dust particles (size range of ca. 1–2 μm) on the BaTiO3 surface. The thickness of the Co3O4 coating is ca. 2 μm. The detailed morphology of the BaTiO3 is further illustrated in Figure 24d, which shows the presence of microplate formation. In fact, fragmented microplates are also observed in the cross-section of the Co3O4 coating around the periphery of the opening, which exposes the BaTiO3 core in Figure 24c.
As shown previously, the formation of micro-plates with nano-thickness is associated with phase transformation from ferroelectric to a piezoelectric phase with regions of oxygen vacancies and nitrogen substitution (see Table 10). Therefore, we can assume that during the processing of composite catalyst, BaTiO3 not only undergoes phase change but also acquires oxygen vacancies and nitrogen substitution within a period of some 20 s. An alternative method would be to use black piezoelectric BaTiO3 particles when producing these composite catalysts. This requires microwave irradiation of the nitric-acid-doped BaTiO3 particles in the first instance and their use in the production of catalyst (M/Si = X) coating from the solution. This will ensure the transformation of paraelectric-ferroelectric barium titanate to a piezoelectric state. This method may also affect the structure of the M/Si = X catalyst as well as that of the core black-BaTiO3 catalyst.

11.3. Implications of Piezoelectric Phase Formation during Plasma Reactions

As shown earlier, the prolonged exposure of BaTiO3 to plasma as a catalyst/co-catalyst result in the acquisition of piezoelectricity on its surface. Therefore, when the same BaTiO3 particles are used in other experiments, they are likely to appear more effective. However, if BaTiO3 particles are not directly exposed to plasma (i.e., when the large particles of BaTiO3 are used with another catalyst), plasma exposure may be curtailed so that the ferroelectric-to-piezoelectric transformation will be absent. Therefore, BaTiO3 will suffer from ferroelectric-to-paraelectric phase change when the temperature exceeds the Curie temperature of 120 °C.
When BaTiO3 was used with Ni/Si = 1/4 catalyst in a packed bed DBD-plasma reactor for CO2 splitting [97,98], the conversion was constant at ca. 23% but drastically reduced to ca. 9% when the reactor temperature was increased to 140 °C. On the other hand, when BaTiO3 was used, CO2 conversion was lower at ca. 19% but remained constant over the temperature range of 70–140 °C. The fall in conversion in BaTiO3 + Ni/Si = 1/4 combined catalyst was attributed to the sintering of the Ni particles [97,98]. However, it was also found that the crystallite size and the surface area of the Ni/Si = 1/4 catalyst remained almost constant after the experiment. Therefore, the decrease in CO2 conversion cannot be explained by catalyst sintering. In any case, the catalyst went through a temperature of 550 °C and any possible sintering would have occurred at that stage.
The likely explanation for this behavior is that, when BaTiO3 was used by itself, it acquired a piezoelectric phase and oxygen vacancies during repeated and prolonged experiments and hence the temperature increase did not affect its surface structure. On the other hand, the Ni/Si = 1/4 catalyst covered the BaTiO3 surface preventing any DBD-plasma induced phase change and the acquisition oxygen defects.

12. Conclusions and Recommendations

The aim of this study was to provide a plausible route for the establishment of a globally integrated sustainable ammonia-based symbiotic-smart fertilizer technology in the prevention/abatement of global warming. This technology would constitute the first step towards the production of anhydrous ammonia as a possible future transport fuel and hydrogen carrier. Furthermore, the proposed route is entirely based on renewables involving biomass/biomass waste (also other wastes) and water for hydrogen and carbon monoxide generation through gasification and air for nitrogen as feedstock.
The proposed technology is based on Integrated Process Intensification (IPI). The critical elements of the proposed technology are reviewed and enabling research results are provided. The following conclusions represent the justification for the proposed technology presented in Section 12.7 as recommendation.

12.1. Processes for Hydrogen and Syngas Generation for Ammonia and Symbiotic-Smart Fertilizers

(a)
The production is carried out in small-scale, distributed platforms with an energy handling capacity of ca. 10–50 MWe, rather than at GWe levels as in centralized facilities such as the Haber–Bosch ammonia plants [3,39,366]. Distributed plants have short start-up and shut-down times, and are able to operate with highly variable feedstock, sourced locally. The fully integrated process-intensified plants do not have the burden of “economies of scale”, which are the characteristics of centralized production plants [135].
(b)
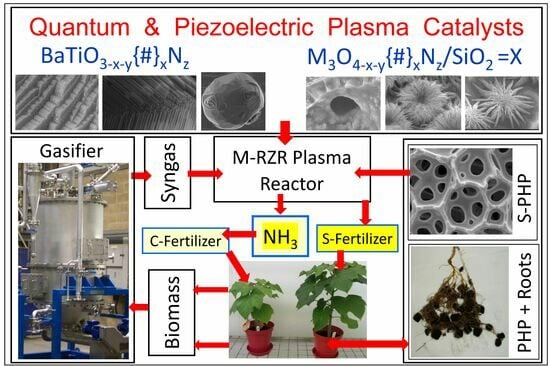
In order to provide low capital and operating costs, IPI-based reactors should perform more than one unit operation, such as those in Multi-Reaction Zone Reactors [3,39] and those proposed by Hessel et al. [148,151]. In this respect, non-thermal, atmospheric, low-temperature, catalytic plasma is ideally suited as the primary reaction zone. The examples provided here include ammonia synthesis and ammonia sequestration using either CO2 to obtain ammonium carbamate/urea or acidic porous materials to obtain symbiotic-smart fertilizers. Other examples include: (i) plasma CO2 splitting using biochar or bio-ash from gasifiers as catalysts and in situ biochar upgrading, (ii) use of hydrogen-enriched syngas from a multi-oxidant biomass gasifier to obtain ammonium carbamate as a precursor for urea.
(c)
As shown, by using the multi-oxidant (oxygen-enriched air and water) gasification, the hydrogen content of syngas can be brought to a level for direct ammonium carbamate production. However, the resulting syngas still requires cleaning/tar elimination before it can be used for ammonia/ammonium carbamate production. As hydrogen is the limiting component in most applications, if needed, the whole syngas can be converted to hydrogen through a water–gas shift reaction (CO + H2O = H2 + CO2) [367].
(d)
The pilot-plant size 50 kWe multi-oxidant up-down-draft fixed-bed gasifier benefits from in situ air separation using oxygen-selective membranes operating in the oxidation zone at the mean temperature of 1100 °C. The function of this type of membrane is not to completely separate air but to enrich the air oxygen concentration in order to increase the temperature of the oxidation zone in the catalyst for water injection and also to lower the nitrogen concentration in syngas so that it is suitable for direct ammonium carbamate and subsequently its conversion to anhydrous ammonia. The permeation flux of oxygen can be further increased (by nearly 100-fold) through the activation of the oxygen-selective membranes at ca. 1000 °C by using non-Faradaic electrochemical catalysis (NEMCA) [368,369,370].
(e)
Throughout this study, the catalytic plasma technology has been promoted in various conversion processes as the Reaction Zone-1 (RZ-1) in the Multi-Reaction Zone Reactor (M-RZR). Therefore, there are issues to be considered: (1) Plasma reactors, and (2) Catalysts for use in plasma reactors.
(1)
Dielectric Barrier Discharge (DBD) reactors are routinely used in catalytic plasma synthesis. Although some engineering knowledge is available for such reactors (see for example [39,170] and references therein), they are not satisfactory for industrial-scale operations due to the presence of high electric fields, precision engineering, limited capacity and explosive gases. Therefore, the use of microwave-induced plasma reactors should be considered in industrial applications as industrial-scale microwave reactors are already in use.
(2)
In this study, the nature of efficient radiation-induced catalyst activation and their performance is investigated. It is clear that the attributes of efficient catalysts for plasma and UV-radiation applications are significantly different than the thermochemical catalysts. However, plasma and UV-radiation catalysts themselves have also differences. UV-radiation is necessary for the catalyst excitation whereas no such requirement is needed for plasma catalysts, except for piezoelectric plasma catalysts, which can be activated through external stressors such as thermal fluctuations or microwave/ultrasound excitations which create transient polarization in such catalysts.

12.2. Black-Barium Titanate (BaTi1−rMrO3−x−y{#}xNz) as a Unique Piezoelectric Plasma Catalyst with Quantum Effects: Synthesis, Structure Evaluation and Performance in CO2 Splitting

(a)
Following the review of recent developments in catalysts for UV-radiation-induced reactions, in particular for water-splitting reactions, catalysts for plasma applications were considered. A novel process is presented, which is based on microwave radiation-induced conversion of paraelectric-ferroelectric BaTiO3 to black piezoelectric barium titanate with disordered lattice containing N- and Ti -substitutions and oxygen vacancies {#}. The non-stoichiometric formula of the resulting black-barium titanate is BaTi1−rMrO3−x−y{#}xNz, where M is a transition metal catalyst (optional).
(b)
The radiation-induced chemical heterogeneity leading to the formation of BaTi1−rMrO3−x−y{#}xNz also results in structural heterogeneity which is evaluated by extensive SEM and EDS studies. These studies reveal the mechanism of chemical and morphological transformations. It is shown that during the microwave irradiation of HNO3 (or H2SO4), doped BaTiO3 underwent rapid solid-state transformation, which was accompanied by color change (white-to-black) and extensive amorphization as detected by XRD. The resulting material had a large number of morphological features including nano- and micro-plates decorated and separated by nano-sized domains which are described as crystal lattice exudates.
(c)
Another important microscopic morphological transition is porogenesis when particles in the size range of ca. 10 nm–1000 nm are ejected from the surface of the BaTiO3 particles during the microwave radiation-induced phase change. This porogenetic process also penetrates the bulk making the chemically heterogenetic barium titanate (BaTi1−rMrO3−x−y{#}xNz) porous which is also useful in plasma catalysis for surface area enhancement and plasma propagation.
(d)
The porogenetic particles with a chemical structure of BaTi1−rMrO3−x−y{#}xNz, can be considered plasma dust particles, which are catalytically more active than the bulk material due to their nano-size. They are essentially negatively charged BaTi1−rMr O3−x−y{#}xNz assemblies but do not have the electron holes. The implications of the nano-structure in the BaTi1−rMrO3−x−y{#}xNz catalyst and in the porogenetic particles are considered in terms of quantum effects which can provide new catalytic pathways in plasma reactions.
(e)
The occurrence of dusty (complex) plasma ranges from natural to artificial environments, covering a host of scientific disciplines, from astrophysics to magnetic fusion devices (tokamaks) to semiconductor processing. This range also indicates the size range of the plasma environment. It will be interesting to investigate the quantum effects within the pores of catalysts where the plasma environment is confined to μm-size domains with nano-size catalytic particles.

12.3. Supported High Entropy Catalysts

(a)
An example of a supported high-entropy catalyst synthesis is provided for the first time. The synthesis was performed using the microwave shock as described previously [82,83]. This catalyst can be represented as (Cr0.1Fe0.1Co0.1Cu0.1Zn0.1)O3−x {#}x/SiO2 = 1. The catalytic activity of such a catalyst is based on the cocktail effect of the components and their alloys, which is further enhanced by its highly amorphous morphology. The SEM and EDS studies show that the structure is devoid of nano-structured decorations. The surface composition is dictated by Co but Zn is almost absent.
(b)
In order to understand the structure formation in the supported high-entropy catalysts, silica-supported medium entropy catalysts were also investigated. It was shown that Cu- and Co-containing supported catalysts are most likely to form surface decorations. However, in high-entropy catalysts formed from components with similar atomic size and multi-valent states, the probability of alloying increases, and hence the surface decorations (which form as a result of phase separation) are absent.

12.4. Biochar/Bio-Ash as a Natural Co-Catalyst in CO2 Splitting and Biochar Upgrading

(a)
CO2 splitting to CO and O2 was studied using a nonthermal catalytic plasma reactor. As catalyst, BaTi1−rMrO3−x−y{#}xNz and Co/Si = 1/4 catalyst were used. The results were interpreted in terms of phase transition in BaTiO3 to the defect-rich piezoelectric barium titanate. The presence of a silica-supported Co-catalyst enhanced CO2 conversion provided that BaTiO3 was in the piezoelectric state. In addition, biochar was used in order to sequestrate the evolved O2 which enhanced conversion and at the same time upgraded biochar (for use as a soil additive) by oxygenation.
(b)
A mechanism of catalytic plasma-induced CO2 is proposed based on TiO2-terminated BaTiO3−x{#}x (100) surface. The overall reaction mechanism is based on oxygen vacancy generation – restoration reactions involving Ti3+, Ti4+, O2− and dusty-plasma particles. It is argued that this type of modelling is more informative in the understanding of heterogeneous catalytic reactions.

12.5. Ammonia Synthesis and Efficiency Evaluation

(a)
We consider the effect of combined BaTiO3−x−y{#}xNz and Ni/Si = 1/4 catalysts in ammonia synthesis in order to demonstrate the importance of defect-rich piezoelectric black-BaTiO3 catalysts and negatively charged plasma dust particles. It is important to note that, as some 85% of anhydrous ammonia is used in fertilizer production, direct ammonia-based fertilizer production should be the priority, which can make the current catalytic plasma production economically feasible. Therefore, the comparison included various data on catalytic plasma NH3 synthesis and it’s in situ conversion to highly effective symbiotic-smart ammonia fertilizers.
(b)
A comprehensive review of unconventional catalysis by Bogaerts et al. [367] indicated that in catalytic plasma ammonia synthesis, the lowest energy cost was 1.5 MJ/mol [371] and the outlet NH3 concentration of 9.0 mol% (yield 17.1%) [69]. It is important to note that the corresponding values for Haber–Bosch ammonia are: 0.5 MJ/mol and 8–15 mol%. Very high outlet ammonia concentrations can be obtained under special conditions. Shah et al. [372] obtained an ammonia concentration of 19.1 mol% by using RF-plasma under reduced pressure whereas, 19.4% ammonia concentration per pass (nitrogen conversion 40.4%) was achieved with in situ ammonia sequestration using multi-reaction zone reactor catalytic plasma with BaTiO3−x−y{#}xNz and Ni/Si = 1/4 catalyst [3,67]. Wang et al. [373] also used a membrane-based in situ separation via catalyst protection in a DBD reactor to obtain an ammonia yield of 1.5 g/kWh with 5.3% outlet NH3 concentration. The effects of reactor type, electrode configuration and catalyst on NH3 outlet concentration and energy yield are shown in Table 15.
In Table 15, DBD-1 and DBD-2 represent concentric cylinder-packed-bed DBD reactors. In DBD-1, both electrodes are outside the quartz reactor walls whereas in DBD-2, the ground electrode is located in the reactor. In all cases, the DBD-2 reactor performs better than DBD-1 as regards energy efficiency although ammonia concentration remains constant.
(c)
The effect of catalyst and co-catalyst is also illustrated using DBD-1 and DBD-2 reactors. It was found that Ni/Si = X catalyst performed best compared with Co/Si = X and Fe/Si = X catalyst [67] and hence subsequently, Ni/Si = X catalyst was used in all the ammonia synthesis experiments, including when these catalysts were used with BaTiO3 as a co-catalyst/plasma catalysis promoter. The efficiency of Ni catalyst in [M/Si = X]/BaTiO3 = Y (M = Ni, Co, Fe) over Co and Fe was confirmed recently [93]. It can be seen from Table 15 that, the Ni/Si = 1/4 catalyst performs better than BaTiO3 with respect to outlet ammonia concentration and energy yield. When Ni/Si = 1/4 catalyst and BaTiO3 are used together, efficiency increases although the outlet ammonia concentration remains unchanged at 6.4%. The outlet concentration increases with increasing power input; at the power input of 195 W, the outlet concentration reaches 9.0%, which is comparable to that of the Haber–Bosch process.
(d)
It can be seen from Table 15 that when ammonia was sequestrated using acidic PolyHIPE Polymer using the Multi-Reaction Zone Reactor (Number- 8; M-RZR in Table 15), the maximum outlet concentration increased to 19.4% and the energy cost reduced 13.2 MJ/mol-NH3. It must be pointed out that these results were obtained under non-optimized conditions both for Ni/Si = X (X could be increased to 2) and processing conditions, including plasma power and frequency and total gas flow rate, etc. Optimization enhancements of energy yield efficiency by a factor of 3 [359].
(e)
The combination of a metal catalyst with a ferroelectric perovskite plasma catalytic promoter, lead zirconate titanate (PZT) was used by Navascues et al. [303] as the Curie temperature of PZT is significantly higher than that of BaTiO3. These catalyst systems were (1) PZT; (2) Al2O3 coated PZT and (3) Ru/Al2O3 coated PZT. It was concluded that, unlike several previous reports, the yield and energy efficiency for the ammonia synthesis did not significantly improve when including Ru particles, even at temperatures at which an incipient catalytic activity could be inferred. However, under some operating conditions, Al2O3-coated PZT gave a higher yield and energy efficiency. It is not clear that the structural modifications described in the current study for BaTiO3 apply to PZT and therefore should be investigated.
(f)
Although it is possible that these results are specific to the PZT and Ru/Al2O3 combination, they indicate the importance of both the plasma catalysis promotor (moderator) and the supported catalyst system. BaTiO3 represents a unique position as a ferroelectric/piezoelectric catalyst with both anion and cation substitutions and oxygen vacancies which renders its relatively low Curie Temperature irrelevant for use as a catalyst above 120 °C. Furthermore, as demonstrated previously [3,67,69,82,83] (see also Table 10), the supported single catalysts (M/Si = X) or binary catalysts (M(1)/M(2)/Si = X/Y/Z) or the composite catalysts with BaTi1−rMrO3−x−y{#}xNz appear to yield higher outlet ammonia concentration as well as higher energy efficiency.
(g)
High ammonia outlet temperature is important because it affects the cost incursion in the downstream processes, notably the ammonia recovery and the recycling of the unreacted gases. The recent ammonia production cost analyses by Wang et al. [374] and Rouwenhorst et al. [40,149] indicate that low outlet NH3, the recycling cost constitutes more than that of the ammonia synthesis cost for a distributed production platform. Therefore, several techniques have been adopted to enhance ammonia output concentration [3,39,40,148,149,375,376]. Evidently, (see for example Table 15), this level of conversion (0.2%) used in the model is too low. Therefore, the cost prediction should substantially improve when using conversions of ca. 12% or more. In order to enhance the conversion, in addition to the optimization of various processing parameters (plasma pulsation, temperature, flow rate, etc.), the main enhancement will come from plasma-promoting design and optimization, microwave plasma processing, integrated intensified processes, and in situ ammonia sequestration [2].
(h)
We have already discussed the enhancement expectations from plasma promoting/catalyst design and integrated-intensified microwave plasma processing using plasma generating-chemical looping catalysts [3,39,67,82,83,170]. In situ ammonia sequestration using either acids or CO2 [3,39,67] resulted in further enhancement in conversion (ca. 20% NH3 outlet concentration and ca. 40% nitrogen conversion) and energy cost reduction (13.2 MJ/mol) with energy yield of 4.64 g/kWh. Recently, Rouwenhorst et al. [149] added another technique of sequestration to enhance energy efficiency to 2.3 g NH3/kWh. These improvements are insufficient to get to the energy efficiency level of Haber–Bosch (≈155 g NH3/kWh) for the production of anhydrous NH3. However, it is likely that the implementation of the proposed measures to produce symbiotic/smart ammonia-based fertilizers through the use of plasma-generating catalysts in microwave reactors with in situ sequestration using acid-containing, water absorbents will create a new generation of fertilizers which will help to reduce ammonia/fertilizer cost and generate symbiotic-smart fertilizer systems which can enhance crop yield, fertilizer, and water efficiencies.
(i)
The main energy cost in ammonia synthesis without in situ recovery consists of energy consumption associated with synthesis (i.e., Energy Cost, EC), ammonia recovery and unreacted gas recycle. Ammonia recovery and gas recycle costs are inversely proportional to ammonia yield. Hence, for a given ammonia plant, the total energy cost (ET) of ammonia production can be assumed to be inversely proportional to the outlet ammonia concentration, Cout and given by:
ET = EC/[Cout]n
where n ≥ 1 and the value of the power index, n, is a function of recovery and recycle operations. High values of (n) indicate low efficiency gas separation and recycle.
(j)
The catalyst and reactor/process efficiency comparisons can be misleading when they are only based on Energy Cost (EC), Energy Yield, (EY) or outlet concentration Cout, all of which depend on the Specific Input Energy (SIE). A better comparison can be based on the Energy Cost per unit mol% conversion (EU); i.e., EU = ET = EC/[Cout]n (n = 1). This will ensure that the cost of ammonia recovery is incorporated in the overall assessment of a given catalyst and process. As no data are available for the energy cost of the post-synthesis recovery-recycle, we assume that n = 1 as a comparator. In Table 15, the variation of ET (n = 1) is shown as a single comparator data for various plasma reactors, processes and catalysts some of which have sufficient attributes for commercialization. ET (n = 1) for the Haber–Bosch process, ranges from 6.25 to 3.33 MJ/mol2 whereas the best result for the DBD reactor with in situ NH3 sequestration is 68 MJ/mol2. Nevertheless, this result is not optimized and only reflects the effects of NH3 sequestration and the type of catalyst used. However, both of these variables themselves have not been optimized and the resulting product is not NH3 but a fertilizer with no NH3 recovery and N2 + H2 recycle does not require cyclic decompression-compression and cooling as in HB-process. Clearly, the use of EC/Cout as a measure of ammonia cost is a more accurate differentiator than Energy Cost, which does not take into account the NH3 separation cost.

12.6. The Significance of Porogenetic Plasma Dust as Catalyst

(a)
The recent theoretical study by Perillo, et al. [377] and van’t Veer et al. [378] and experimental investigations by Navascues et al. [379,380] on the apparent very low conversion in ammonia synthesis indicate that, after formation, NH3 undergoes dissociation (reverse reaction) in the plasma space due to electron impact. Another reason for the low NH3 concentration is the recombination processes termed N-MAR (nitrogen molecular-activated recombination) [377]. This theoretical study concludes that two nitrogen-including recombination reaction paths are dominant; the ion conversion of NH species followed by dissociative recombination and the proton transfer between H2+ and N2, producing N2H+ which then undergoes dissociation into N2 and H upon electron impact [381]. These findings led to the inevitable question if catalysts are in fact useful in plasma synthesis and the necessity of optimizing the feed H2/N2 ratio according to the catalyst [303,382,383]. Alternative methods of preventing NH3 dissociation include product removal from the plasma zone as discussed previously or pulsate plasma [384,385], which also promotes the enhancement of CO2+ cations leading to CO2 splitting [386].
(b)
As plasma-generated dust particles remove the electrons from the plasma space, NH3 dissociation due to electron impact should be reduced while the recombination of reactive N species should be prevented. This process thus explains why the use of BaTiO3−x−y{#}xNz type of piezoelectric catalysts [82,83,170], which are formed as a result of plasma and microwave irradiation, yield high NH3 in the range of ca. 9–20% [3,39,67,69].
(c)
As concluded by Rouwenhorst et al. [387], in order to prevent reverse reactions from taking place in the plasma space, the dissociation of N2 and H2 should take place on the catalyst surface. However, this is only possible in low-power DBD plasmas [367]. Therefore, porogenetically created plasma dust particles can generate low-power plasma space but have high catalytic activity on their surface.
(d)
In piezoelectric catalysts, an external force is required for the generation of electrons and holes. However, in dusty plasma particles, lattice excitation results from the emission of phonons, and hence such particles do not require an external energy field to acquire electrons, and their large size ensures the retention of their large electron concentration.

12.7. A Roadmap for Sustainable Production of Hydrogen, Ammonia and Symbiotic-Smart Fertilizers

As the ultimate objective of this study, here we provide a summary of a roadmap for sustainable hydrogen, ammonia and symbiotic-smart fertilizer production using biomass waste, water and air in order to abate climate change and address the emerging food, renewable energy and water shortages. The advances made in this technology will form the basis of sustainable anhydrous ammonia production as a fuel and hydrogen carrier. The critical elements of the proposed technology are reviewed and examined and novel (often patented) processes, reactors and materials are described to support the feasibility of the proposed technology.
Recently, several feasibility studies for ammonia production from renewable resources became available [40,149,151,376,388,389,390,391,392]. They indicate that by 2030, a competitive green Haber–Bosch process will be achieved. This process will be based on combined wind power and PV, as well as solar energy water splitting for hydrogen production. The same conclusion is also valid for catalytic plasma. Therefore, the relevant questions include: (1) Why use small-scale catalytic plasma generators for nitrogen fixation with or without CO2 utilization? (2) Why use biomass/biomass waste as the feedstock for electricity, hydrogen and renewable carbon?
The primary answer is that the theoretical energy cost of plasma ammonia is nearly 2.5 times lower than that of Haber–Bosch ammonia. Further, the small scale, low temperature and atmospheric pressure intensified ammonia processing reactors also allow the co-production of other useful products [3,148] with short start-up and shut-down times [2]. Small-scale operations are the essence of sustainable production and utilization. The emergent technology must also be judged by its potential for: (a) Prevention of global warming; (b) Climate change abatement; (c) Waste utilization; and (d) Distributed production-consumption and resource utilization.
These desirable attributes have recently been demonstrated by Osorio-Tejada et al. [393], whose analyses showed that the centralized Haber–Bosch ammonia had 2.96 kg.CO2-eq/kg.NH3 while the non-thermal plasma method using biogas had a negative CO2 footprint at −2.07 kg.CO2-eq/kg.NH3, thus clearly indicating the value of local ammonia production.
The use of biomass and biomass waste (or indeed, other waste streams such as municipal solid waste and sewage sludge) is not only sustainable but also essential as unused biomass contributes to greenhouse gas emissions. Furthermore, biomass/waste gasification and CO2 utilization in urea fertilizer production also provide another path for a negative CO2 process through nitrogen fixation. Several life cycle analyses indicate that H2 generation, for example with gasification, using biomass and biowaste from various sources provides only a slightly positive carbon footprint (without Carbon Capture and Storage, CCS) and a negative carbon footprint with CCS [394]. As stressed by Antonini et al. [394], this negative carbon footprint is not obtained at the cost of important trade-offs with regard to ecosystem quality, human health or resource depletion, with the exception of high forest land use. Fuel cell electric vehicles using hydrogen from biomass (both wood and biomethane from biogas) with CCS as fuel turn out to be the most climate-friendly among all options, with even possible negative total greenhouse gas emissions [394]. However, as the global energy potential of biomass waste is very similar to that of wind power, the stress on land use for biomass is unwarranted. Moreover, biomass-waste distribution is narrower than that of wind energy and it is near the human habitats.
Future sustainable ammonia production scenarios often assume that based on solar and wind energy, large-scale H2 generation would be possible at a competitive price through water electrolysis. In a recent life cycle analysis for green H2 production, Terlouw et al. [395] question this assumption, indicating that H2 production via water electrolysis with low costs and low greenhouse emissions is currently only possible at specific locations. They advocate that the decision-makers should consider aspects beyond costs and greenhouse gas emissions when designing large-scale hydrogen production systems to avoid risks coming along with the supply of essential scarce materials.
Carbon Capture and Storage [396], its integration within an industrial cluster [397] and its utilization of CO2 at source are economically more advantageous than the removal of CO2 from air as in Carbon Dioxide Removal (CDR) technologies [396], even after its release to the atmosphere. As indicated by Terlouw et al. [398], the emissions avoided due to the substitution of certain processes (due to system expansion in LCA) can be easily misinterpreted as negative emissions, i.e., as carbon removal from the atmosphere. Based on the observed inconsistencies and shortcomings, these authors recommend interpreting available CDR life cycle analyses results with caution.
The proposed technology herein represents a circular economy involving Food (Agriculture) Energy (Electricity + Heat) and Water (primarily in agriculture). Starting from agriculture, biomass is utilized to generate power, hydrogen, nitric acid, ammonia, urea and symbiotic-smart fertilizers which address the emergent water shortages. The interchangeability transformation between these final products represents economic advantages. For example, one of the products, urea, can be regarded as a hydrogen vector (as in NH3), crop yield enhancer and a means of achieving a negative carbon footprint when it is used as a fertilizer with the highest nitrogen content. Life cycle and techno-economic analyses of urea production and use indicate that CO2 sequestration and storage in soil [399,400,401,402] provide economic and environmental advantages. Recently, urea electrolysis has been explored as a promising energy-saving avenue for sustainable hydrogen production in comparison with conventional water electrolysis because of the low cell voltage, remediation of urea-rich wastewater and abundant electrocatalysts [403,404,405].
A simplified diagrammatic illustration (process flow diagram) of the proposed technology is shown in Figure 25 in which the nature of the component processes is provided in the figure caption. This process is based on the available know-how described herein with different levels of technology readiness. Gasification technology ranges from pilot-scale to full-commercial scale.
The technology readiness of various components is widely different. Gasification technology is currently available for power production at a full-commercial scale. The gasifier system described herein is available at a pilot-scale and further improvements can be implemented. The most important element of the ammonia-fertilizer synthesis technology is the nature of the catalyst. The plasma-generating chemical looping supported catalysts and perovskite-based plasma promoting catalysts, in particular, microwave-plasma modified barium titanate piezoelectric-quantum effect catalysts, represent a very promising development for plasma reactors. The generalized version of such catalysts can be represented as Ba1−mMm(1)Ti1−rMr(2)O3−x−y{#}xNz (M(1) = Alkaline earth metal; M(2) = Transition metal catalyst), which has oxygen vacancies, {#}, nitrogen, barium and titanium substitutions thus creating highly active porous catalysts, which can also be used as proton conducting membranes [368,369,406]. The use of microwave plasma should be preferred because of the availability of microwave technology but also for health and safety reasons at industrial-scale processes.
The creation of plasma dust particles through a porogenetic process has important consequences in plasma reactions in which electrons in the plasma zone are mopped up by these particles in the size range of 10 nm–10 μm. As a result, plasma-induced product dissociation or nitrogen molecular-activated recombination reactions are suppressed hence the apparently very low ammonia concentration experienced in plasma synthesis reactions is avoided. Furthermore, unlike the piezoelectric catalysts, the plasma dust catalysts do not require any external excitation and hence can be used in solar-energy water-splitting reactions.
The final attribute of plasma-generating chemical-looping catalysts is that it is now possible to use directly, microwave-radiation-induced plasma in purpose-designed chemical reactors, such as Multi-Reaction Zone Reactors [3,39]. Currently, plasma generation and catalytic reactions take place in sequential sections of the microwave reactors which can result in the decay of the plasma-activated species. This drawback will not be present in the proposed microwave-induced catalytic plasma reactors. Furthermore, various means of applying microwave radiation make structured reactors (i.e., M-RZR) more efficient as they can be deemed to be process-intensified and suitable for small-to-medium scale commercial operations. The advantages and drawbacks of microwave reactor technologies are available in recent reviews [407,408,409,410].
Although our immediate objective is to contribute to the abatement of global warming, plasma technology in general and the proposed technology in particular with emphasis on anhydrous ammonia and symbiotic-smart fertilizer production have future and space-age applications in transport fuel, soilless-agriculture, lunar or spacecraft agriculture-horticulture [4,36,411,412] as well as precision agriculture [413] including at-field (in-soil) and on-demand fertilization [414].

Funding

The work was supported by three European Union projects granted to the author: (1) COPIRIDE (Combining Process Intensification-driven Manufacture of Microstructured Reactors and Process Design regarding Industrial Dimensions and Environment, Grant CP-IP 228853); (2) POLYCAT (Modern Polymer-Based Catalysts and Microflow Conditions as Key Elements of Innovation and Fine Chemical Synthesis, Grant CP-IP 246095); (3) BIDEB 2236 grant administered by the Turkish Scientific and Technical Research Council, TUBITAK (Grant Reference No = 115C045). COPIRIDE and POLYCAT projects were coordinated by Professor Volker Hessel.

Data Availability Statement

The data used to support the findings of this study are included within the article.

Acknowledgments

The author is grateful for the above-cited grants and expresses his thanks to the technical support staff at Ondokuz Mayis University’s central research and development laboratories (KITAM). The author thanks Mehmet Kuran (Vice-president of Ondokuz Mayis University, Samsun, Turkiye), Mohan Sankaran (Case Western Reserve University, Cleveland, OH, USA, now at University of Illinois at Urbana-Champaign, Urbana, Il, USA) where this research was completed when the author was a visiting professor, Peter Greenwood (Nouryon, Sweden) and David Hughes, Jeff Lawrence and Gary Montague (Teesside University, Sunderland, UK) for their support and help.

Conflicts of Interest

The research summarized in this paper refers to several patents and one patent application by the author.

References

  1. Tilman, D.; Cassman, K.G.; Matson, P.A.; Naylor, R.; Polasky, S. Agricultural sustainability and intensive production practices. Nature 2002, 418, 671–677. [Google Scholar] [CrossRef] [PubMed]
  2. Akay, G. Bioprocess and chemical process intensification. In Encyclopaedia of Chemicals Processing; Lee, S., Ed.; Taylor & Francis: New York, NY, USA, 2006; Volume 1, pp. 183–199. [Google Scholar]
  3. Akay, G. Sustainable ammonia and advanced symbiotic fertilizer production using catalytic multi-reaction-zone reactors with nonthermal plasma and simultaneous reactive separation. ACS Sustain. Chem. Eng. 2017, 5, 11588–11606. [Google Scholar] [CrossRef]
  4. Akay, G.; Burke, D.R. AgroProcess intensification through synthetic rhizosphere media for nitrogen fixation and yield enhancement. Am. J. Agric. Biol. Sci. 2012, 7, 150–172. [Google Scholar]
  5. Akay, G.; Fleming, S. AgroProcess Intensification: Microbioreactors as soil additives with nitrogen fixing bacterium Azospirillum brasilense to enhance its potential as self-sustaining biofertiliser. Green Process. Synth. 2012, 1, 427–437. [Google Scholar]
  6. Akay, G.; Burke, D.R. Synthetic Symbiotic System as Soil Additives to Deliver Active Ingredients through Plant Roots for Enhanced Plant and Crop Yield. US Patent US8898955, 2 December 2014. [Google Scholar]
  7. Dunbabin, V.M.; Postma, J.A.; Schnepf, A.; Pagès, L.; Javaux, M.; Wu, L.; Leitner, D.; Chen, Y.L.; Rengel, Z.; Diggle, A.J. Modelling root–soil interactions using three–dimensional models of root growth, architecture and function. Plant Soil 2013, 372, 93–124. [Google Scholar] [CrossRef]
  8. Chen, J.; Lü, S.; Zhang, Z.; Zhao, X.; Li, X.; Ning, P.; Liu, M. Environmentally friendly fertilizers: A review of materials used and their effects on the environment. Sci. Total Environ. 2018, 614, 829–839. [Google Scholar] [CrossRef]
  9. Gutierrez, C.F.; Sanabria, J.; Raaijmakers, J.M.; Oyserman, B.O. Restoring degraded microbiome function with self-assembled communities. FEMS Microbiol. Ecol. 2020, 96, fiaa225. [Google Scholar] [CrossRef] [PubMed]
  10. Lehmann, J.; Cowie, A.; Masiello, C.A.; Kammann, C.; Woolf, D.; Amonetta, J.E.; Cayuela, M.L.; Camps-Arbestain, M.; Whitman, T. Biochar in climate mitigation. Nat. Geosci. 2021, 14, 883–892. [Google Scholar] [CrossRef]
  11. Chen, J.; Wu, J.; Raffa, P.; Picchioni, F.; Koning, C.E. Superabsorbent Polymers: From long-established, microplastics generating systems, to sustainable, biodegradable and future proof alternatives. Prog. Polym. Sci. 2022, 125, 101475. [Google Scholar] [CrossRef]
  12. Bi, R.; Zhang, Q.; Zhan, L.; Xu, X.; Zhang, X.; Dong, Y.; Yan, X.; Xiong, Z. Biochar and organic substitution improved net ecosystem economic benefit in intensive vegetable production. Biochar 2022, 4, 46. [Google Scholar] [CrossRef]
  13. Venugopalan, V.K.; Nath, R.; Chandran, S. Smart fertilizers-a way ahead for sustainable agriculture. J. Plant Nutr. 2022, 45, 2068–2076. [Google Scholar] [CrossRef]
  14. Akay, G. Flow-induced phase inversion in the intensive processing of concentrated emulsions. Chem. Eng. Sci. 1998, 53, 203–223. [Google Scholar] [CrossRef]
  15. Akay, G.; Dawnes, S.; Price, V.J. Microcellular Polymers as Cell Growth Media and Novel Polymers. European Patent EP1183328, 8 August 2012. (Priority GB19980026701 (1998) and represents the first ever paper on the use of POLYHIPE Polymer in tissue engineering and bioprocess intensification). [Google Scholar]
  16. Akay, G.; Noor, Z.Z.; Calkan, O.F.; Ndlovu, T.M.; Burke, D.B. Process for Preparing a Functionalized PolyHIPE Polymer. US Patent US 07820729, 26 October 2010. [Google Scholar]
  17. Akay, G.; Bokhari, M.A.; Byron, V.J.; Dogru, M. Development of nano-structured materials and their application in bioprocess-chemical process intensification and tissue engineering. In Chemical Engineering Trends and Developments; Galan, M.A., Del Valle, E.M., Eds.; Wiley: London, UK, 2005; pp. 171–196. [Google Scholar]
  18. Akay, G.; Birch, M.A.; Bokhari, M.A. Microcellular polyHIPE polymer supports osteoblast growth and bone formation in vitro. Biomaterials 2004, 25, 3991–4000. [Google Scholar] [CrossRef] [PubMed]
  19. Zhang, T.; Sanguramath, R.A.; Israel, S.; Silverstein, M.S. Emulsion templating: Porous polymers and beyond. Macromolecules 2019, 52, 5445–5479. [Google Scholar] [CrossRef]
  20. Dikici, B.A.; Malayeri, A.; Sherborne, C.; Dikici, S.; Paterson, T.; Dew, L.; Hatton, P.; Asencio, I.O.; MacNeil, S.; Langford, C.; et al. Thiolene- and polycaprolactone methacrylate-based polymerized High Internal Phase Emulsion (PolyHIPE) scaffolds for tissue engineering. Biomacromolecules 2022, 23, 720–730. [Google Scholar] [CrossRef] [PubMed]
  21. Du, X.; Liu, C.; Jiang, M.; Yuan, H. Design and development of fertilizers point-applied device in root-zone. Appl. Eng. Agric. 2022, 38, 559–571. [Google Scholar] [CrossRef]
  22. Barby, D.; Haq, Z. Low Density Porous Cross-Linked Polymeric Materials and Their Preparation. European Patent EP0060138, 3 September 1986. [Google Scholar]
  23. Akay, G. Theoretical Bases of “Confinement Phenomenon” and the Use of PolyHIPE Polymer in Its Proof and Applications; Progress Report for Unilever Research Port Sunlight Laboratory (Document Number: E ENG 0656); Exeter University: Exeter, UK, September 1992. [Google Scholar]
  24. Akay, G.; Fleming, S. Engineered ecosystem development for AgroProcess Intensification. WIT Trans. Ecol. Environ. 2012, 114, 485–495. [Google Scholar]
  25. Akay, G.; Erhan, E.; Keskinler, B. Bioprocess intensification in flow-through monolithic microbioreactors with immobilized bacteria. Biotechnol. Bioeng. 2005, 90, 180–190. [Google Scholar] [CrossRef]
  26. Bokhari, M.A.; Akay, G.; Zhang, S.G.; Birch, M.A. Enhancement of osteoblast growth and differentiation in vitro on a peptide hydrogel-polyHIPE polymer hybrid material. Biomaterials 2005, 26, 5198–5208. [Google Scholar] [CrossRef]
  27. Akay, G.; Noor, Z.Z.; Dogru, M. Process intensification in water-in-crude oil emulsion separation by simultaneous application of electric field and novel demulsifier adsorbers based on PolyHIPE Polymers. In Microreactor Technology and Process Intensification; ACS Symposium Series; American Chemical Society: Washington, DC, USA, 2005; Volume 914, pp. 378–392. [Google Scholar]
  28. Akay, G.; Vickers, J. Methods for Separating Oil and Water Using Polyhipe Polymers. US Patent US8177985, 15 May 2012. [Google Scholar]
  29. Akay, G.; Pekdemir, T.; Shakorfow, A.M.; Vickers, V. Intensified demulsification and separation of thermal oxide reprocessing interfacial crud (THORP-IFC) simulants. Green Synth. Process. 2012, 1, 109–127. [Google Scholar] [CrossRef]
  30. Akay, G. Stable Oil in Water Emulsions and a Process for Preparing Same. European Patent EP0649867, 17 September 2001. (Priority EP93308521, 13 December 1993). [Google Scholar]
  31. Akay, G. Flow induced phase inversion in powder structuring by polymers. In Polymer Powder Technology; Narkis, M., Rosenzweig, N., Eds.; Wiley: New York, NY, USA, 1995; Chapter 20; pp. 542–587. [Google Scholar]
  32. Kumar, A.; Li, S.; Cheng, C.-M.; Lee, D. Recent developments in phase inversion emulsification. Ind. Eng. Chem. Res. 2015, 54, 8375–8396. [Google Scholar] [CrossRef]
  33. Kumar, A.; Li, S.; Cheng, C.-M.; Lee, D. Flow-induced phase inversion emulsification in tapered microchannels. Lab Chip. 2016, 21, 4173–4180. [Google Scholar] [CrossRef]
  34. Akay, G.; Calkan, B.; Hasni, H.; Mohamed, R. Preparation of Nanostructured Microporous Composite Foams. European Patent EP2342272, 25 September 2013. [Google Scholar]
  35. Akay, G.; Calkan, B. Preparation of nanostructured microporous metal foams through flow induced electroless deposition. J. Nanomat. 2015, 2015, 275705. [Google Scholar] [CrossRef]
  36. Kovačič, J.M.; Terezija Ciringer, T.; Ambrožič-Dolinšek, J.; Kovačič, S. Use of emulsion-templated, highly porous polyelectrolytes for in vitro germination of chickpea embryos: A new substrate for soilless cultivation. Biomacromolecules 2022, 23, 3452–3457. [Google Scholar] [CrossRef]
  37. Barlık, N.; Keskinler, B.; Kocakerim, M.M.; Akay, G. Surface modification of monolithic PolyHIPE Polymers for anionic functionality and their ion exchange behaviour. J. Appl. Polym. Sci. 2015, 132, 42286. [Google Scholar] [CrossRef]
  38. Barlik, N.; Keskinler, B.; Kocakerim, M.M.; Akay, G. Functionalized PolyHIPE Polymer monoliths as an anion-exchange media for removal of nitrate ions from aqueous solutions. Desalination Water Treat. 2016, 57, 26440–26447. [Google Scholar] [CrossRef]
  39. Akay, A. Catalytic Multi-Reaction Zone Reactor System. US Patent US11498845, 15 November 2022. [Google Scholar]
  40. Rouwenhorst, K.H.R.; Lefferts, L. Feasibility study of plasma-catalytic ammonia synthesis for energy storage applications. Catalysts 2020, 10, 999. [Google Scholar] [CrossRef]
  41. Mosley, L.M.; Willson, P.; Hamilton, B.; Butler, G. The capacity of biochar made from common reeds to neutralise pH and remove dissolved metals in acid drainage. Environ. Sci. Pullut. Res. 2015, 22, 15113–15122. [Google Scholar] [CrossRef] [PubMed]
  42. Sahin, O.; Taskin, M.B.; Kaya, E.C.; Atakol, O.; Emir, E.; Inali, A.; Gunes, A. Effect of acid modification of biochar on nutrient availability and maize growth in a calcareous soil. Soil Use Manag. 2017, 33, 447–456. [Google Scholar] [CrossRef]
  43. Vaughn, S.F.; Kenar, J.A.; Tisserat, B.; Jackson, M.J.; Joshee, N.; Vaidya, B.N.; Peterson, S.C. Chemical and physical properties of Paulownia elongata biochar modified with oxidants for horticultural applications. Ind. Crops Prod. 2017, 97, 260–267. [Google Scholar] [CrossRef]
  44. Shibaoka, M. Carbon content of fly ash and size distribution of unburnt char particles in fly ash. Fuel 1986, 65, 449–450. [Google Scholar] [CrossRef]
  45. Jordan, C.A.; Akay, G. Speciation and distribution of alkali, alkali earth metals and major ash forming elements during gasification of fuel cane bagasse. Fuel 2012, 91, 253–263. [Google Scholar] [CrossRef]
  46. Ukwattage, N.L.; Ranjith, P.G.; Bouazza, M. The use of coal combustion fly ash as a soil amendment in agricultural lands (with comments on its potential to improve food security and sequester carbon). Fuel 2013, 109, 400–408. [Google Scholar] [CrossRef]
  47. Dzantor, E.K.; Adeleke, E.; Kankarla, V. Using coal fly ash in agriculture: Combination of fly ash and poultly litter as soil amendments for bioenergy feedstock production. Coal Combust. Gasif. Prod. 2015, 7, 33–39. [Google Scholar]
  48. Yao, X.; Zhao, Z.; Chen, S.; Zhou, H.; Xu, K. Migration and transformation behaviours of ash residues from a typical fixed-bed gasification station for biomass syngas production in China. Energy 2020, 201, 117646. [Google Scholar] [CrossRef]
  49. Mu, L.; Li, T.; Zuo, S.; Yin, H.; Dong, M. Effect of leaching pretreatment on the inhibition of slagging/sintering of aquatic biomass: Ash transformation behavior based on experimental and equilibrium evaluation. Fuel 2022, 323, 124391. [Google Scholar] [CrossRef]
  50. Li, X.; Bai, C.; Qiao, Y.; Wang, X.; Yang, K.; Colombo, P. Preparation, properties and applications of fly ash-based porous geopolymers: A review. J. Clean. Production 2022, 359, 132043. [Google Scholar] [CrossRef]
  51. Arrobas, M.; de Almeida, S.F.; Raimundo, S.; da Silva Domingues, L.; Rodrigues, M.Â. Leonardites rich in humic and fulvic acids had little effect on tissue elemental composition and dry matter yield in pot-grown olive cuttings. Soil Syst. 2022, 6, 7. [Google Scholar] [CrossRef]
  52. Kaya, C.; Şenbayram, M.; Akram, N.A.; Ashraf, M.; Alyemeni, M.N.; Ahmad, P. Sulfur-enriched leonardite and humic acid soil amendments enhance tolerance to drought and phosphorus deficiency stress in maize (Zea mays L.). Sci. Rep. 2020, 10, 6432. [Google Scholar] [CrossRef] [PubMed]
  53. Qian, S.; Ding, W.; Yang, Y.; Sun, J.; Ding, Q. Humic acids derived from leonardite-affected growth and nutrient uptake of corn seedlings. Commun. Soil Sci. Plant Anal. 2016, 47, 1275–1282. [Google Scholar]
  54. Bhattacharya, S.S.; Kim, K.H.; Das, S.; Uchimiya, M.; Jeon, B.H.; Kwon, E.; Szulejko, J.E. A review on the role of organic inputs in maintaining the soil carbon pool of the terrestrial ecosystem. J. Environ. Manag. 2016, 167, 214–227. [Google Scholar] [CrossRef]
  55. Yolcu, H.; Seker, H.; Gullap, M.K.; Lithourgidis, A.; Gunes, A. Application of cattle manure, zeolite and leonardite improves hay yield and quality of annual ryegrass (Lolium multiflorum Lam.) under semiarid conditions. Aust. J. Crop. Sci. 2011, 5, 926–931. [Google Scholar]
  56. Ece, A.; Saltali, K.; Eryigit, N.; Uysal, F. The effects of leonardite applications on climbing bean (Phaseolus vulgaris L.) yield and some soil properties. J. Agronomy. 2007, 6, 480–483. [Google Scholar]
  57. Akinremi, O.O.; Janzen, R.L.; Lemke, R.L.; Larney, F.J. Response of canola, wheat and green beans to Leonardite additions. Can. J. For. Res. 2000, 80, 437–443. [Google Scholar] [CrossRef]
  58. Rouwenhorst, K.H.R.; Engelmann, Y.; van ‘t Veer, K.; Postma, R.S.; Bogaerts, A.; Lefferts, L. Plasma-driven catalysis: Green ammonia synthesis with intermittent electricity. Green Chem. 2020, 22, 6258–6287. [Google Scholar] [CrossRef]
  59. Yan, C.; Waitt, C.; Akintola, I.; Lee, G.; Easa, J.; Clarke, R.; Geng, F.; Poirier, D.; Otor, H.O.; Rivera-Castro, G.; et al. Recent advances in plasma catalysis. J. Phys. Chem. C 2022, 126, 9611–9614. [Google Scholar] [CrossRef]
  60. Neyts, E.C.; Bogaerts, A. Understanding plasma catalysis through modelling and simulation. J. Phys. D Appl. Phys. 2014, 47, 1–18. [Google Scholar] [CrossRef]
  61. Neyts, E.C.; Ostrikov, K.; Sunkara, M.K.; Bogaerts, A. Plasma catalysis: Synergistic effects at the nanoscale. Chem. Rev. 2015, 115, 13408–13446. [Google Scholar] [CrossRef]
  62. Mehta, P.; Barboun, P.; Herrera, F.A.; Kim, J.; Rumbach, P.; Go, D.B.; Hicks, J.C.; Schneider, W.F. Overcoming ammonia synthesis scaling relations with plasma-enabled catalysis. Nat. Catal. 2018, 1, 269–275. [Google Scholar] [CrossRef]
  63. Chen, J.G.; Crooks, R.M.; Seefeldt, L.C.; Bren, K.L.; Bullock, R.M.; Darensbourg, M.Y.; Holland, P.L.; Hoffman, B.; Janik, M.J.; Jones, A.K.; et al. Beyond fossil fuel-Driven nitrogen transformations. Science 2018, 360, eaar6611. [Google Scholar] [CrossRef]
  64. Mehta, P.; Barboun, P.M.; Engelmann, Y.; Go, D.B.; Bogaerts, A.; Schneider, W.F.; Hicks, J.C. Plasma-catalytic ammonia synthesis beyond the equilibrium limit. ACS Catal. 2020, 10, 6726–6734. [Google Scholar] [CrossRef]
  65. Vervloessem, E.; Gorbanev, Y.; Nikiforov, A.; De Geyter, N.; Bogaerts, A. Sustainable NOx production from air in pulsed plasma: Elucidating the chemistry behind the low energy consumption. Green Chem. 2022, 24, 916–929. [Google Scholar] [CrossRef]
  66. Bogaerts, A.; Zhang, Q.; Zhang, Y.; Van Laer, K.; Wang, W. Burning questions of plasma catalysis: Answers by modelling. Catal. Today 2019, 337, 3–14. [Google Scholar] [CrossRef]
  67. Akay, G. Ammonia Production by Integrated Intensified Processes. US Patent US9416019, 16 August 2016. (Priority: GB Patent Application, 1014304.8A, 27 August 2010). [Google Scholar]
  68. Kim, H.-H.; Teramoto, Y.; Ogata, A.A.; Takagi, H.; Nanba, T. Atmospheric-pressure nonthermal plasma synthesis of ammonia over ruthenium catalysts. Plasma Process. Poly. 2017, 14, 1–9. [Google Scholar] [CrossRef]
  69. Akay, G.; Zhang, K. Process intensification in ammonia synthesis using novel co-assembled supported micro-porous catalysts promoted by non-thermal plasma. Ind. Eng. Chem. Res. 2017, 56, 457–468. [Google Scholar] [CrossRef]
  70. Chiremba, E.; Zhang, K.; Kazak, C.; Akay, G. Direct nonoxidative conversion of methane to hydrogen and higher hydrocarbons by dielectric barrier discharge plasma with plasma catalysis promotors. AIChE J. 2017, 63, 4418–4429. [Google Scholar] [CrossRef]
  71. Barboun, P.; Mehta, P.; Herrera, F.A.; Go, D.B.; Schneider, W.F.; Hicks, J.C. Distinguishing plasma contributions to catalyst performance in plasma-assisted ammonia synthesis. ACS Sustain. Chem. Eng. 2019, 7, 8621–8630. [Google Scholar] [CrossRef]
  72. Wang, Y.; Craven, M.; Yu, X.; Ding, J.; Bryant, P.; Huang, J.; Tu, X. Plasma-enhanced catalytic synthesis of ammonia over a Ni/Al2O3 catalyst at near-room temperature: Insights into the importance of the catalyst surface on the reaction mechanism. ACS Catal. 2019, 9, 10780–10793. [Google Scholar] [CrossRef]
  73. Shah, J.; Wu, T.; Lucero, J.; Carreon, M.A.; Carreon, M.L. Nonthermal plasma synthesis of ammonia over Ni-MOF-74. ACS Sustain. Chem. Eng. 2019, 7, 377–383. [Google Scholar] [CrossRef]
  74. Akay, G.; Zhang, K.; Al-Harrasi, W.S.S.; Sankaran, R.M. Catalytic plasma Fischer–Tropsch synthesis using hierarchically connected porous Co/SiO2 catalysts prepared by microwave-induced co-assembly. Ind. Eng. Chem. Res. 2020, 59, 12013–12027. [Google Scholar] [CrossRef]
  75. Barboun, P.M.; Hicks, J.C. Unconventional catalytic approaches to ammonia synthesis. Annu. Rev. Chem. Biomol. Eng. 2020, 11, 503–521. [Google Scholar] [CrossRef] [PubMed]
  76. Patil, B.S.; van Kaathoven, A.S.R.; Peeters, F.; Cherkasov, N.; Wang, Q.; Lang, J.; Hessel, V. Deciphering the synergy between plasma and catalyst support for ammonia synthesis in a packed DBD reactor, J. Phys. D Appl. Phys. 2020, 53, 144003. [Google Scholar] [CrossRef]
  77. Gorbanev, Y.; Engelmann, Y.; van’t Veer, K.; Vlasov, E.; Ndayirinde, C.; Yi, Y.; Bals, S.; Bogaerts, A. Al2O3-supported transition metals for plasma-catalytic NH3 synthesis in a DBD plasma: Metal activity and insights into mechanisms. Catalysts 2021, 11, 1230. [Google Scholar] [CrossRef]
  78. Ma, H.; Sharma, R.K.; Welzel, S.; van de Sanden, M.C.M.; Tsampas, M.N.; Schneider, W.F. Observation and rationalization of nitrogen oxidation enabled only by coupled plasma and catalyst. Nat. Commun. 2022, 13, 402. [Google Scholar] [CrossRef] [PubMed]
  79. Liu, J.; Zhu, X.; Hu, X.; Tu, X. Plasma-assisted ammonia synthesis in a packed-bed dielectric barrier discharge reactor: Roles of dielectric constant and thermal conductivity of packing materials. Plasma Sci. Technol. 2022, 24, 025503. [Google Scholar] [CrossRef]
  80. Palma, V.; Cortese, M.; Renda, S.; Ruocco, C.; Martino, M.; Meloni, E. A Review about the recent advances in selected nonthermal plasma assisted solid–gas phase chemical processes. Nanomaterials 2020, 10, 1596. [Google Scholar] [CrossRef] [PubMed]
  81. Zhou, D.; Zhou, R.; Zhou, R.; Liu, B.; Zhang, T.; Xian, Y.; Cullen, P.J.; Lu, X.; Ostrikov, K. Sustainable ammonia production by non-thermal plasmas: Status, mechanisms, and opportunities. Chem. Eng. J. 2021, 421, 129544. [Google Scholar] [CrossRef]
  82. Akay, G. Co-assembled supported catalysts: Synthesis of nano-structured supported catalysts with hierarchic pores through combined flow and radiation induced co-assembled nano-reactors. Catalysts 2016, 6, 80. [Google Scholar] [CrossRef]
  83. Akay, G. Plasma generating—Chemical looping catalyst synthesis by microwave plasma shock for nitrogen fixation from air and hydrogen production from water for agriculture and energy technologies in global warming prevention. Catalysts 2020, 10, 152. [Google Scholar] [CrossRef]
  84. Argyle, M.D.; Bartholomew, C.H. Heterogeneous catalyst deactivation and regeneration: A review. Catalysts 2015, 5, 145–269. [Google Scholar] [CrossRef]
  85. Xu, S.; Chansai, S.; Xu, S.; Stere, C.E.; Jiao, Y.; Yang, S.; Hardacre, C.; Fan, X. CO poisoning of Ru catalysts in CO2 hydrogenation under thermal and plasma conditions: A combined kinetic and diffuse reflectance infrared Fourier Transform Spectroscopy–Mass Spectrometry study. ACS Catal. 2020, 10, 12828–12840. [Google Scholar] [CrossRef]
  86. Al-Harrasi, W.S.S.; Zhang, K.; Akay, G. Process intensification in gas-to-liquid reactions: Plasma promoted Fischer-Tropsch synthesis for hydrocarbons at low temperatures and ambient pressure. Green Process. Synth. 2013, 2, 479–490. [Google Scholar] [CrossRef]
  87. Zhang, K.; Zhang, G.; Liu, X.; Phan, A.N.; Luo, K.; Akay, G. Correction to “A study on CO2 decomposition to CO and O2 by the combination of catalysis and dielectric-barrier discharges at low temperatures and ambient pressure”. Ind. Eng. Chem. Res. 2020, 59, 502. [Google Scholar] [CrossRef]
  88. Gómez-Ramírez, A.; Cotrino, J.; Lambert, R.M.; González-Elipe, A.R. Efficient synthesis of ammonia from N2 and H2 alone in a ferroelectric packed-bed DBD reactor. Plasma Sour. Sci. Technol. 2015, 24, 065011. [Google Scholar] [CrossRef]
  89. Gómez-Ramírez, A.; Montoro-Damas, A.M.; Cotrino, J.; Lambert, R.M.; González-Elipe, A.R. About the enhancement of chemical yield during the atmospheric plasma synthesis of ammonia in a ferroelectric packed bed reactor. Plasma Process. Polym. 2017, 14, 1600081. [Google Scholar] [CrossRef]
  90. Gómez-Ramírez, A.; Álvarez, R.; Navascués, P.; García-García, F.J.; Palmero, A.; Cotrino, J.; González-Elipe, A.R. Electrical and reaction performances of packed-bed plasma reactors moderated with ferroelectric or dielectric materials. Plasma Process. Polym. 2021, 18, 2000193. [Google Scholar] [CrossRef]
  91. Navascués, P.; Cotrino, J.; González-Elipe, A.R.; Gómez-Ramírez, A. Plasma assisted CO2 dissociation in pure and gas mixture streams with a ferroelectric packed-bed reactor in ambient conditions. Chem. Eng. J. 2022, 430, 133066. [Google Scholar] [CrossRef]
  92. Ma, Y.; Tian, Y.; Zeng, Y.; Tu, X. Plasma synthesis of ammonia in a tangled wire dielectric barrier discharge reactor: Effect of electrode materials. J. Energy Inst. 2021, 99, 137–144. [Google Scholar] [CrossRef]
  93. Zhu, X.; Liu, J.; Hu, X.; Zhou, Z.; Li, X.; Wang, W.; Wu, R.; Tu, X. Plasma-catalytic synthesis of ammonia over Ru-based catalysts: Insights into the support effect. J. Energy Inst. 2022, 102, 240–246. [Google Scholar] [CrossRef]
  94. Flury, M.; Aramrak, S. Role of air-water interfaces in colloid transport in porous media: A review. Water Resour. Res. 2017, 53, 5247–5275. [Google Scholar] [CrossRef]
  95. Martins-Costa, M.T.C.; Anglada, J.M.; Franciscoc, J.S.; Ruiz-Lopez, M.F. Photosensitization mechanisms at the air–water interface of aqueous aerosols. Chem. Sci. 2022, 13, 2624. [Google Scholar] [CrossRef] [PubMed]
  96. Ruiz, M.P.; Faria, J.A. Catalysis at the solid-liquid-liquid interface of water-oil Pickering emulsions: A tutorial review. ACS Eng. Au 2022, 2, 295–319. [Google Scholar] [CrossRef]
  97. Akay, G.; Zhang, K.; Chiremba, E. CO2 reforming of CH4 over nano-porous catalysts promoted by dielectric-barrier discharges. In Proceedings of the EU COPIRIDE Integrated Project Review Meeting Presentation, Mainz, Germany, 24 July 2012. Full report: COPIRIDE Project Output (17-02-2013). [Google Scholar]
  98. Zhang, K.; Mukhriza, T.; Liu, X.; Greco, P.P.; Chiremba, E. A study on CO2 and CH4 conversion to synthesis gas and higher hydrocarbons by the combination of catalyst and dielectric-barrier discharges. Appl. Catal. A Gen. 2015, 502, 138–149. [Google Scholar] [CrossRef]
  99. Akay, G.; Jordan, A.C. Gasification of fuel cane bagasse in a downdraft gasifier: Influence of lignocellulosic composition and fuel particle size on syngas composition and yield. Energy Fuel 2011, 25, 2274–2283. [Google Scholar] [CrossRef]
  100. Wu, N.; Lan, K.; Yao, Y. An integrated techno-economic and environmental assessment for carbon capture in hydrogen production by biomass gasification, Resources. Conserv. Recycl. 2023, 188, 106693. [Google Scholar] [CrossRef]
  101. Lan, K.; Zhang, B.; Yao, Y. Circular utilization of urban tree waste contributes to the mitigation of climate change and eutrophication. One Earth 2022, 5, 944–957. [Google Scholar] [CrossRef]
  102. Maitlo, G.; Ali, I.; Mangi, K.H.; Ali, S.; Maitlo, H.A.; Unar, I.N.; Pirzada, A.M. Thermochemical conversion of biomass for syngas production: Current status and future trends. Sustainability 2022, 14, 2596. [Google Scholar] [CrossRef]
  103. Nunes, L.J.R. Biomass gasification as an industrial process with effective proof-of-concept: A comprehensive review on technologies, processes and future developments. Results Eng. 2022, 14, 100408. [Google Scholar] [CrossRef]
  104. Tezer, Ö.; Karabağ, N.; Öngen, A.; Çolpan, C.Ö.; Ayol, A. Biomass gasification for sustainable energy production: A review. Int. J. Hydrogen Energy 2022, 47, 15419–15433. [Google Scholar] [CrossRef]
  105. Piazzi, S.; Patuzzi, F.; Baratieri, M. Energy and exergy analysis of different biomass gasification coupled to Fischer-Tropsch synthesis configurations. Energy 2022, 249, 123642. [Google Scholar] [CrossRef]
  106. Antolini, D.; Piazzi, S.; Menin, L.; Baratieri, M.; Patuzzi, F. High hydrogen content syngas for biofuels production from biomass air gasification: Experimental evaluation of a char-catalyzed steam reforming unit. Int. J. Hydrogen Energy 2022, 64, 27421–27436. [Google Scholar] [CrossRef]
  107. Ruiz, M.; Schnitzer, A.; Courson, C.; Mauviel, M. Fe-doped olivine and char for in-bed elimination of gasification tars in an air-blown fluidised bed reactor coupled with oxidative hot gas filtration. Carbon Resour. Convers. 2022, 5, 271–288. [Google Scholar] [CrossRef]
  108. Shahbaz, M.; AlNouss, A.; Ghiat, I.; Mckay, G.; Mackey, H.; Elkhalifa, S.; Al-Ansari, T. A comprehensive review of biomass based thermochemical conversion technologies integrated with CO2 capture and utilisation within BECCS networks. Resour. Conserv. Recycl. 2021, 173, 105734. [Google Scholar] [CrossRef]
  109. Donnison, C.; Holland, R.A.; Hastings, A.; Armstrong, L.-M.; Eigenbrod, F.; Taylor, G. Bioenergy with carbon capture and storage (BECCS): Finding the win–wins for energy, negative emissions and ecosystem services—Size matters. GCB Bioenergy 2020, 12, 586–604. [Google Scholar] [CrossRef]
  110. Centi, G.; Iaquaniello, G.; Perathoner, S. Chemical engineering role in the use of renewable energy and alternative carbon sources in chemical production. BMC Chem. Eng. 2019, 1, 5. [Google Scholar] [CrossRef]
  111. Sansaniwala, S.K.; Rosen, M.A.; Tyagic, S.K. Global challenges in the sustainable development of biomass gasification: An overview. Renew. Sust. Energy Rev. 2017, 80, 23–43. [Google Scholar] [CrossRef]
  112. Yao, Y.; Graziano, D.; Riddle, M.; Cresko, J.; Masanet, E. Greener pathways for energy-intensive commodity chemicals: Opportunities and challenges. Curr. Opin. Chem. Eng. 2014, 6, 90–98. [Google Scholar] [CrossRef]
  113. Gilbert, P.; Alexander, S.; Thurnley, P.; Brammer, J. Assessing economically viable carbon reductions for the production of ammonia from biomass gasification. J. Clean. Prod. 2014, 64, 581–589. [Google Scholar] [CrossRef]
  114. Dogru, M.; Akay, G. Catalytic Gasification. US Patent US08252072, 28 August 2012. [Google Scholar]
  115. Saidur, R.; Boroumandjazi, G.; Mekhilef, S.; Mohammed, H.A. A review on exergy analysis of biomass based fuels. Renew. Sust. Energy Rev. 2012, 16, 1217–1222. [Google Scholar] [CrossRef]
  116. Liu, Q.; Zhong, W.; Zhou, J.; Yu, Z. Effects of S and Al on K migration and transformation during coal and biomass co-combustion. ACS Omega 2022, 7, 15880–15891. [Google Scholar] [CrossRef]
  117. Zhang, Z.; Xiang, X.; Shen, Z.; Wang, Y.; Li, X.; Zou, X.; Xu, H.; Cao, Y.; Chen, H.; Wang, Y. Construction of high-performance NiCe-MOF derived structured catalyst for steam reforming of biomass tar model compound. Int. J. Hydrogen Energy 2022, 47, 32004–32014. [Google Scholar] [CrossRef]
  118. Míguez, J.L.; Porteiro, J.; Behrendt, F.; Blanco, D.; Patiño, D.; Dieguez-Alonso, A. Review of the use of additives to mitigate operational problems associated with the combustion of biomass with high content in ash-forming species. Renew. Sust. Energy Rev. 2021, 141, 110502. [Google Scholar] [CrossRef]
  119. Jordan, C.A.; Akay, G. Effect of CaO on Tar Production and Dew Point Depression during Gasification of Fuel Cane Bagasse in a Novel Downdraft Gasifier. Fuel Process. Technol. 2013, 106, 654–660. [Google Scholar] [CrossRef]
  120. Li, B.; Mbeugang, C.F.M.; Huang, Y.; Liu, D.; Wang, Q.; Zhang, S. A review of CaO based catalysts for tar removal during biomass gasification. Energy 2022, 244, 123172. [Google Scholar] [CrossRef]
  121. Zhang, Q.; Bu, T.; Lu, J.; Jin, Z.; Chen, D.; Qiu, F.; Feng, Y.; Hu, W. Effects of quicklime conditioning on the volatile reforming and tar elimination performance of sewage sludge pyrochar. J. Anal. Appl. Pyrolysis 2022, 168, 105732. [Google Scholar] [CrossRef]
  122. Woolcock, P.J.; Brown, R.C. A review of cleaning technologies for biomass-derived syngas. Biomass Bioenergy 2013, 52, 54–84. [Google Scholar] [CrossRef]
  123. Akay, G.; Jordan, C.A.; Mohamed, A.H. Syngas cleaning with nano-structured micro-porous ion exchange polymers in biomass gasification using a novel downdraft gasifier. J. Energy Chem. 2013, 22, 426–435. [Google Scholar] [CrossRef]
  124. Jordan, C.A.; Akay, G. Occurrence, composition and dew point of tars produced during gasification of fuel cane bagasse in a downdraft gasifier. Biomass Bioenergy. 2012, 42, 51–58. [Google Scholar] [CrossRef]
  125. Rueda, Y.G.; Helsen, L. The role of plasma in syngas tar cracking. Biomass Convers. Biorefinery 2020, 10, 857–871. [Google Scholar] [CrossRef]
  126. Soedarsono, H.P.; Faizal, F.; Panatarani, C.; Joni, I.M. Carbon functionalized material derived from byproduct of plasma tar-cracking unit on biomass gasifier collected using standard impinger method. Processes 2022, 10, 1733. [Google Scholar] [CrossRef]
  127. Okati, A.; Khani, M.R.; Shokri, B.; Monteiro, E.; Rouboa, A. Parametric studies over a plasma co-gasification process of biomass and coal through a restricted model in Aspen plus. Fuel 2023, 331, 125952. [Google Scholar] [CrossRef]
  128. Hagner, M.; Pasanen, T.; Penttinen, O.-P.; Lindqvist, B.; Lindqvist, I.; Tiilikkala, K.; Setälä, H. Effects of birch tar oil on soil organisms and plants. Agric. Food Sci. 2010, 19, 13–23. [Google Scholar] [CrossRef]
  129. Hagner, M.; Penttinen, O.-P.; Pasanen, T. Acute toxicity of birch tar oil on aquatic organisms. Agric. Food Sci. 2010, 19, 24–33. [Google Scholar] [CrossRef]
  130. Tiilikkala, K.; Fagernäs, L.; Tiilikkala, J. History and use of wood pyrolysis liquids as biocide and plant protection product. Open Agric. J. 2010, 4, 111–118. [Google Scholar] [CrossRef]
  131. Richert, A.; Kalwasinska, A.; Brzezinska, M.S.; Dabrowska, G.B. Biodegradability of novel polylactide and polycaprolactone materials with bacteriostatic properties due to embedded birch tar in different environments. Int. J. Mol. Sci. 2021, 22, 10228. [Google Scholar] [CrossRef] [PubMed]
  132. Richert, A.; Olewnik-Kruszkowska, E.; Dabrowska, G.B.; Dabrowski, H.P. The role of birch tar in changing the physicochemical and biocidal properties of polylactide-Based films. Int. J. Mol. Sci. 2022, 23, 268. [Google Scholar] [CrossRef]
  133. Stacey, R.J.; Dunne, J.; Brunning, S.; Devièse, T.; Mortimer, R.; Ladd, S.; Parfitt, K.; Evershed, R.; Bull, I. Birch bark tar in early Medieval England—Continuity of tradition or technological revival? J. Archaeol. Sci. Rep. 2020, 29, 102118. [Google Scholar] [CrossRef]
  134. Tintner, J.; Leibrecht, F.; Pfeifer, C.; Konuk, M.; Srebotnik, E.; Woitsch, J. Pitch oil production–An intangible cultural heritage in Central Europe. J. Anal. Appl. Pyrolysis 2021, 159, 105309. [Google Scholar] [CrossRef]
  135. Akay, G. Renewable resources come together. Chem. Eng. 2005, 784, 27–30. [Google Scholar]
  136. Kawahara, A.; Takahashi, Y.; Hirano, Y.; Hirano, M.; Ishihara, T. Importance of pore structure control in porous substrate for high oxygen penetration in La0.6Sr0.4Ti0.3Fe0.7O3 thin film for CH4 partial oxidation. Solid State Ion. 2011, 190, 53–59. [Google Scholar] [CrossRef]
  137. Hashim, S.S.; Mohamed, A.R.; Bhatia, S. Oxygen separation from air using ceramic-based membrane technology for sustainable fuel production and power generation. Renew. Sust. Energy Rev. 2011, 15, 1284–1293. [Google Scholar] [CrossRef]
  138. El Naggar, A.M.A.; Akay, G. Novel intensified catalytic nan-structured nickel-zirconia supported palladium based membrane for high temperature hydrogen production from biomass generated syngas. Int. J. Hydrogen Energy 2013, 38, 6618–6632. [Google Scholar] [CrossRef]
  139. Shin, D.; Kang, S. Optimization of an ion transport membrane reactor system for syngas production. Energy Rep. 2022, 8, 3767–3779. [Google Scholar] [CrossRef]
  140. Micari, M.; Agrawal, K.A. Oxygen enrichment of air: Performance guidelines for membranes based on techno-economic assessment. J. Membr. Sci. 2022, 641, 119883. [Google Scholar] [CrossRef]
  141. Pandiyan, A.; Kyriakou, V.; Neagu, D.; Welzel, S.; Goede, A.; van de Sanden, M.C.M.; Tsampas, M.N. CO2 conversion via coupled plasma-electrolysis process. J. CO2 Util. 2022, 57, 101904. [Google Scholar] [CrossRef]
  142. Amhamed, A.I.; Qarnain, S.; Hewlett, S.; Sodiq, A.; Abdellatif, Y.; Isaifan, R.J.; Alrebei, O.F. Ammonia production plants—A review. Fuels 2022, 3, 408–435. [Google Scholar] [CrossRef]
  143. Das, A.; Peu, S.D. A Comprehensive Review on recent advancements in thermochemical processes for clean hydrogen production to decarbonize the energy sector. Sustainability 2022, 14, 11206. [Google Scholar] [CrossRef]
  144. Yang, X.; Kan, T.; Kheradmand, A.; Xu, H.; Strezov, V.; Yu, A.; Jiang, Y. Tunable syngas production from two-stage sorption-enhanced steam gasification of sewage sludge. Chem. Eng. J. 2021, 404, 126069. [Google Scholar] [CrossRef]
  145. Santos, M.P.S.; Hanak, D.P. Techno-economic feasibility assessment of sorption enhanced gasification of municipal solid waste for hydrogen production. Int. J. Hydrogen Energy 2022, 47, 6586–6604. [Google Scholar] [CrossRef]
  146. Peng, P.; Cheng, Y.; Hatzenbeller, R.; Addy, M.; Zhou, N.; Schiappacasse, C.; Chen, D.; Zhang, Y.; Anderson, E.; Liu, Y.; et al. Ru-based multifunctional mesoporous catalyst for low-pressure and non-thermal plasma synthesis of ammonia. Int. J. Hydrogen Energy 2017, 42, 19056–19066. [Google Scholar] [CrossRef]
  147. Peng, P.; Chen, P.; Addy, M.; Cheng, Y.; Anderson, E.; Zhou, N.; Schiappacasse, C.; Zhang, Y.; Chen, D.; Hatzenbeller, R.; et al. Atmospheric plasma-assisted ammonia synthesis enhanced via synergistic catalytic absorption. ACS Sustain. Chem. Eng. 2019, 7, 100–104. [Google Scholar]
  148. Sarafraz, M.M.; Tran, N.N.; Pourali, N.; Rebrov, E.V.; Hessel, V. Thermodynamic potential of a novel plasma-assisted sustainable process for co-production of ammonia and hydrogen with liquid metals. Energy Convers. Manag. 2020, 210, 112709. [Google Scholar] [CrossRef]
  149. Rouwenhorst, K.H.R.; Mani, S.; Lefferts, L. Improving the Energy Yield of Plasma-Based Ammonia Synthesis with In Situ Adsorption. ACS Sustain. Chem. Eng. 2022, 10, 1994. [Google Scholar] [CrossRef]
  150. Zhang, S.; Gao, Y.; Sun, H.; Fan, Z.; Shao, T. Dry reforming of methane by microsecond pulsed dielectric barrier discharge plasma: Optimizing the reactor structures. High Volt. 2022, 7, 718–729. [Google Scholar] [CrossRef]
  151. Sarafraz, M.M.; Christo, F.C.; Tran, N.N.; Fulcheri, L.; Hessel, V. Conversion of greenhouse gases to synthetic fuel using a sustainable cyclic plasma process. Int. J. Hydrogen Energy 2023, 48, 6174–6191. [Google Scholar] [CrossRef]
  152. Hong, J.; Prawer, S.; Murphy, A.B. Plasma catalysis as an alternative route for ammonia production: Status, mechanism, and Prospects for Progress. ACS Sustain. Chem. Eng. 2018, 6, 15–31. [Google Scholar] [CrossRef]
  153. Akay, E.M.; Okumus, Z.; Yildirim, O.S.; Bokhari, M.A.; Akay, G. Synthetic organs for transplant and bio-mimic reactors for process intensification using nano-structured micro-porous materials. WIT Trans. Biomed. Health 2010, 15, 383–394. [Google Scholar]
  154. Dogru, M.; Howarth, C.R.; Akay, G.; Keskinler, B.; Malik, A.A. Gasification of hazelnut shells in a downdraft gasifier. Energy 2002, 27, 415–427. [Google Scholar] [CrossRef]
  155. Akay, G.; Dogru, M.; Calkan, O.F.; Calkan, B. Biomass processing in biofuel applications. In Biofuels for Fuel Cells; Lens, P., Westermann, P., Haberbauer, M., Moreno, A., Eds.; IWA Publishing: London, UK, 2005; Chapter 4; pp. 51–75. [Google Scholar]
  156. Akay, G.; Dogru, M.; Calkan, O.F. Biomass to rescue. Chem. Eng. 2006, 787, 55–57. [Google Scholar]
  157. Akay, G.; Calkan, O.F. Performance of an intensified downdraft gasifier at 50 kWe and 1 MWe. In Proceedings of the AIChE Spring Meeting, New Orleans, LA, USA, 6–10 April 2008. ACS Symposium Series, Paper No: 171a. [Google Scholar]
  158. Balas, M.; Lisy, M.; Kubicek, J.; Pospisil, J. Syngas cleaning by wet scrubber. WSEAS Trans. Heat Mass Transf. 2014, 9, 195–204. [Google Scholar]
  159. Min, J.; Nam, S.B.; Kim, N.R.; Kim, D.-J.; Yoon, Y.-S.; Park, S.-N.; Gu, J.-H. A study on the characteristics of particulate matter in the syngas produced from the waste gasification with cleaning systems for energy utilization. J. Mater. Cycles Waste Manag. 2017, 19, 1155–1165. [Google Scholar] [CrossRef]
  160. Naaz, Z.; Ravi, M.R.; Kohli, S. Modelling and simulation of downdraft biomass gasifier: Issues and challenges. Biomass Bioenergy 2022, 162, 106483. [Google Scholar] [CrossRef]
  161. Ibrahim, A.; Veremieiev, S.; Gaskell, P.H. An advanced, comprehensive thermo-chemical equilibrium model of a downdraft biomass gasifier. Renew. Energy 2022, 194, 912–925. [Google Scholar] [CrossRef]
  162. Wang, Y.; Khan, T.S.; Wildfire, C.; Shekhawat, D.; Hu, J. Microwave-enhanced catalytic ammonia synthesis under moderate pressure and temperature. Catal. Commun. 2021, 159, 106344. [Google Scholar] [CrossRef]
  163. Akay, G.; Wakeman, R.J. Mechanisms of permeate flux decay, solute rejection and concentration polarisation in crossflow filtration of a double chain ionic surfactant dispersion. J. Membr. Sci. 1994, 88, 177–195. [Google Scholar] [CrossRef]
  164. Akay, G.; Wakeman, R.J. Electric field enhanced crossflow microfiltration of hydrophobically modified water soluble polymers. J. Membr. Sci. 1996, 131, 229–236. [Google Scholar] [CrossRef]
  165. Giddings, J.C. A new separation concept based on a coupling of concentration and flow nonuniformities. Sep. Sci. 1966, 1, 123–125. [Google Scholar] [CrossRef]
  166. Akay, G. Stress-Induced diffusion and chemical reaction in nonhomogeneous velocity gradient fields. Polym. Eng. Sci. 1982, 22, 798–804. [Google Scholar] [CrossRef]
  167. Solymosi, F. The bonding, structure and reactions of CO2 adsorbed on clean and promoted metal surfaces. J. Mol. Catal. 1991, 65, 337–358. [Google Scholar] [CrossRef]
  168. Snoeckx, R.; Heijkers, S.; Van Wesenbeeck, K.; Lenaerts, S.; Bogaerts, A. CO2 conversion in a dielectric barrier discharge plasma: N2 in the mix as a helping hand or problematic impurity? Energy Environ. Sci. 2016, 9, 30–39. [Google Scholar] [CrossRef]
  169. Bogaerts, A.; Tu, X.; Whitehead, J.C.; Centi, G.; Lefferts, L.; Guaitella, O.; Azzolina-Jury, F.; Kim, H.-H.; Murphy, A.B.; Schneider, W.F.; et al. The 2020 plasma catalysis roadmap. J. Phys. D Appl. Phys. 2020, 53, 443001. [Google Scholar] [CrossRef]
  170. Akay, G. Synthesis of Plasma Generating-Chemical Looping Catalysts. US Patent Application Publication US2023/0064758, 2 March 2023. [Google Scholar]
  171. Rashid, M.S.; Liu, G.; Yousaf, B.; Hamid, Y.; Rehman, A.; Arif, M.; Ahmed, R.; Song, Y.; Ashraf, A. Role of biochar-based free radicals in immobilization and speciation of metals in the contaminated soil-plant environment. J. Environ. Manag. 2023, 325, 116620. [Google Scholar] [CrossRef]
  172. Nishimiya, K.; Hata, T.; Imamura, Y. Analysis of chemical structure of wood charcoal by X-ray photoelectron spectroscopy. J. Wood Sci. 1998, 44, 56–61. [Google Scholar] [CrossRef]
  173. Cohen-Ofri, I.; Weiner, L.; Boaretto, E.; Mintz, G.; Weiner, S. Modern and fossil charcoal: Aspects of structure and diagenesis. J. Archaeol. Sci. 2006, 33, 428–439. [Google Scholar] [CrossRef]
  174. Cha, J.S.; Park, S.H.; Jung, S.-C.; Ryu, C.; Jeon, J.-K.; Shin, M.-C.; Park, Y.-K. Production and utilization of biochar: A review. J. Ind. Eng. Chem. 2016, 40, 1–15. [Google Scholar] [CrossRef]
  175. Li, S.; Huang, A.; Chen, Y.-J.; Li, D.; Turng, L.-S. Highly filled biochar/ultra-high molecular weight polyethylene/linear low density polyethylene composites for high-performance electromagnetic interference shielding. Compos. Part B Eng. 2018, 153, 277–284. [Google Scholar] [CrossRef]
  176. Li, L.; Zhang, Y.; Cai, D.; Yu, M.; Cao, K.; Sun, J.; Zhang, L.; Zhang, Q.; Zou, G.; Song, Z. Characteristics and mechanism of microwave-induced discharge of spherical bio-char with graphite addition. Fuel 2023, 331, 125771. [Google Scholar] [CrossRef]
  177. Liu, Q.; Meki, K.; Zheng, H.; Yuan, Y.; Shao, M.; Luo, X.; Li, X.; Jiang, Z.; Li, F.; Xing, B. Biochar application in remediating salt-affected soil to achieve carbon neutrality and abate climate change. Biochar 2023, 5, 45. [Google Scholar] [CrossRef]
  178. Mood, S.H.; Pelaez-Samaniego, G.-P. Perspectives of engineered biochar for environmental applications: A review. Energy Fuels 2022, 36, 7940–7986. [Google Scholar] [CrossRef]
  179. Zhao, J.J.; Shen, X.-J.; Domene, X.; Alcaniz, J.-M.; Liao, X.; Palet, C. Comparison of biochars derived from different types of feedstock and their potential for heavy metal removal in multiple-metal solutions. Sci. Rep. 2019, 9, 9869. [Google Scholar] [CrossRef] [PubMed]
  180. de Mello, M.D.; Ahmad, M.; Lee, D.T.; Dimitrakellis, P.; Miao, Y.; Zheng, W.; Nykypanchuk, D.; Vlachos, D.G.; Tsapatsis, M.; Boscoboinik, J.A. In situ tracking of nonthermal plasma etching of ZIF-8 films. ACS Appl. Mater. Interfaces 2022, 14, 19023–19030. [Google Scholar] [CrossRef]
  181. O’Connor, D.; Peng, T.; Zhang, J.; Tsang, D.C.W.; Alessi, D.S.; Shen, Z.; Bolan, N.S.; Huo, D. Biochar application for the remediation of heavy metal polluted land: A review of in situ field trials. Sci. Total Environ. 2018, 619, 815–826. [Google Scholar] [CrossRef]
  182. Bakshi, S.; Banik, C.; Laird, D.A. Estimating the organic oxygen content of biochar. Sci. Rep. 2020, 10, 13082. [Google Scholar] [CrossRef] [PubMed]
  183. Shao, S.; Zhang, J.; Zhang, Z.; Zheng, P.; Zhao, M.; Li, J.; Wang, C. High piezoelectric properties and domain configuration in BaTiO3 ceramics obtained through the solid-state reaction route. J. Phys. D Appl. Phys. 2008, 41, 125408. [Google Scholar] [CrossRef]
  184. Huang, S.; Zeng, J.; Zheng, L.; Man, Z.; Ruan, X.; Shi, X.; Li, G. A novel piezoelectric ceramic with high Curie temperature and high piezoelectric coefficient. Ceram. Int. 2020, 46, 6212–6216. [Google Scholar] [CrossRef]
  185. Meng, Y.; Chen, G.; Huang, M. Piezoelectric materials: Properties, advancements, and design strategies for high-temperature applications. Nanomaterials 2022, 12, 1171. [Google Scholar] [CrossRef]
  186. Zhang, Y.; Sun, J.; Liu, C.; Hou, X.; Wang, J. Phase field modelling of coupling evolution of fracture and dielectric breakdown in ferroelectric materials. Int. J. Mech. Sci. 2022, 236, 107747. [Google Scholar] [CrossRef]
  187. Starr, M.; Wang, X. Fundamental analysis of piezocatalysis process on the surfaces of strained piezoelectric materials. Sci. Rep. 2013, 3, 2160. [Google Scholar] [CrossRef]
  188. Wu, J.; Qin, N.; Bao, D. Effective enhancement of piezocatalytic activity of BaTiO3 nanowires under ultrasonic vibration. Nano Energy 2018, 45, 44–51. [Google Scholar] [CrossRef]
  189. Xiong, F.; Tan, S.; Yao, X.; An, Q.; Mai, L. Crystal defect modulation in cathode materials for non-lithium ion batteries: Progress and challenges. Mater. Today 2021, 45, 169–190. [Google Scholar] [CrossRef]
  190. Wei, X.-K.; Domingo, N.; Sun, Y.; Balke, N.; Dunin-Borkowski, R.E.; Mayer, J. Progress on emerging ferroelectric materials for energy harvesting, storage and conversion. Adv. Energy Mater. 2022, 12, 2201199. [Google Scholar] [CrossRef]
  191. Ji, M.; Kim, J.H.; Ryu, C.-H.; Lee, Y.-I. Synthesis of self-modified black BaTiO3–x nanoparticles and effect of oxygen vacancy for the expansion of piezocatalytic application. Nano Energy 2022, 95, 106993. [Google Scholar] [CrossRef]
  192. Bai, S.; Zhang, N.; Gao, C.; Xiong, Y. Defect engineering in photocatalytic materials. Nano Energy 2018, 53, 296–336. [Google Scholar] [CrossRef]
  193. Lin, L.; Huang, J.; Li, X.; Abass, M.A.; Hang, S. Effective surface disorder engineering of metal oxide nanocrystals for improved photocatalysis. Appl. Catal. B Environ. 2017, 203, 615–624. [Google Scholar] [CrossRef]
  194. Hoshina, T.; Sase, R.; Nishiyama, J.; Takeda, H.; Tsurumi, T. Effect of oxygen vacancies on intrinsic dielectric permittivity of strontium titanate ceramics. J. Ceram. Soc. Japan. 2018, 126, 263–268. [Google Scholar] [CrossRef]
  195. Yamada, T.; Takeda, H.; Tsurumi, T.; Hoshina, T. Possibility of ferroelectric bismuth and nitrogen co-doped barium titanate. J. Ceram. Soc. Jpn. 2020, 128, 486–491. [Google Scholar] [CrossRef]
  196. Liu, Q.; Zhai, D.; Xiao, Z.; Tang, C.; Sun, Q.; Bowen, C.R.; Luo, H.; Zhang, D. Piezo-photoelectronic coupling effect of BaTiO3@TiO2 nanowires for highly concentrated dye degradation. Nano Energy 2022, 92, 106702. [Google Scholar] [CrossRef]
  197. Sickafus, K.E.; Larson, A.C.; Yu, N.; Nastasi, M.; Hollenberg, G.W.; Garner, F.A.; Bradt, R.C. Cation disorder in high dose, neutron-irradiated spinel. J. Nucl. Mater. 1995, 219, 128–134. [Google Scholar] [CrossRef]
  198. Kang, Y.; Wang, L.; Xu, X.; Chen, X.-Q.; Wang, L.; Liu, G. Homogeneously nitrogen doped BaLa4Ti4O15 extending visible light responsive range for photocatalytic oxygen evolution. ACS Mater. Lett. 2023, 5, 275–281. [Google Scholar] [CrossRef]
  199. Wang, J.; Huang, J.; Meng, J.; Li, Q.; Yang, J. Double-hole codoped huge-gap semiconductor ZrO2 for visible-light photocatalysis. Phys. Chem. Chem. Phys. 2016, 18, 17517–17524. [Google Scholar] [CrossRef]
  200. Fo, Y.; Zhou, X. A theoretical study on tetragonal BaTiO3 modified by surface co-doping for photocatalytic overall water splitting. Int. J. Hydrogen Energy 2022, 47, 19073–19085. [Google Scholar] [CrossRef]
  201. Goumri-Said, S.; Kanoun, M.B. Insight into the effect of anionic–anionic co-doping on BaTiO3 for visible light photocatalytic water splitting: A first-principles hybrid computational study. Catalysts 2022, 12, 1672. [Google Scholar] [CrossRef]
  202. Kobayashi, Y.; Tang, Y.; Kageyama, T.; Yamashita, H.; Masuda, N.; Hosokawa, S.; Kageyama, H. Titanium-based hydrides as heterogeneous catalysts for ammonia synthesis. J. Am. Chem. Soc. 2017, 139, 18240–18246. [Google Scholar] [CrossRef] [PubMed]
  203. Nedumkandathil, R.; Jaworski, A.; Grins, J.; Bernin, D.; Karlsson, M.; Eklof-Osterberg, C.; Neagu, A.; Tai, C.-W.; Pell, A.J.; Haussermann, U. Hydride reduction of BaTiO3-oxyhydride versus O vacancy formation. ACS Omega 2018, 3, 11426–11438. [Google Scholar] [CrossRef] [PubMed]
  204. Guo, H.; Jaworski, A.; Chen, Z.; Lu, C.; Slabon, A.; Häussermann, U. Barium titanium oxynitride from ammonia-free nitridation of reduced BaTiO3. Inorganics 2021, 9, 62. [Google Scholar] [CrossRef]
  205. Jiang, W.; Loh, H.; Low, B.Q.L.; Zhu, H.; Low, J.; Heng, J.Z.X.; Tang, K.Y.; Li, Z.; Loh, X.J.; Ye, E.; et al. Role of oxygen vacancy in metal oxides for photocatalytic CO2 reduction. Appl. Catal. B Environ. 2023, 321, 122079. [Google Scholar] [CrossRef]
  206. Manjunatha, H.C.; Seenappa, L.; Chandrika, B.M.; Chikka, H. A study of photon interaction parameters in barium compounds. Ann. Nucl. Energy 2017, 109, 310–317. [Google Scholar] [CrossRef]
  207. Mudiyanselage, K.; Szanyi, J. NO2 uptake under practically relevant conditions on BaO/Pt(111). Catal. Today 2012, 181, 116–123. [Google Scholar] [CrossRef]
  208. Rached, A.; Wederni, M.A.; Khirouni, K.; Alaya, S.; Martín-Palma, R.J.; Dhahri, J. Structural, optical and electrical properties of barium titanate. Mater. Chem. Phys. 2021, 267, 124600. [Google Scholar] [CrossRef]
  209. Borkar, S.N.; Aggarwal, P.; Deshpande, V.K. Effect of calcium substitution on structural, dielectric, ferroelectric, piezoelectric, and energy storage properties of BaTiO3. Curr. Appl. Phys. 2022, 39, 205–213. [Google Scholar] [CrossRef]
  210. Ertekin, N.; Rezaee, S. Effect of anion and cation vacancies pairs in conduct of the Ba(1–3x) TiO3(1–x) and BaTi(1–3x/2)O3(1–x) (x = 0.0033) as a memristor. Mater. Today Commun. 2022, 31, 103333. [Google Scholar] [CrossRef]
  211. Qiao, Z.; Wang, C.; Zou, Y.; Wu, X.; Liu, Z. Oxygen vacancy and pyroelectric polarization collaboratively enhancing PEC performance in BaTiO3 photoelectrodes. Colloids Surf. A Physicochem. Eng. Asp. 2022, 647, 129073. [Google Scholar] [CrossRef]
  212. Chen, X.; Liu, L.; Yu, P.Y.; Mao, S.S. Increasing solar absorption for photocatalysis with black hydrogenated titanium dioxide nanocrystals. Science 2011, 331, 745–750. [Google Scholar] [CrossRef]
  213. Wang, B.; Shen, S.; Mao, S.S. Black TiO2 for solar hydrogen conversion. J. Mater. 2017, 3, 96–111. [Google Scholar]
  214. Rajaraman, T.S.; Parikh, S.P.; Gandhi, V.G. Black TiO2: A review of its properties and conflicting trends. Chem. Eng. J. 2020, 389, 123918. [Google Scholar] [CrossRef]
  215. Lu, G.M.; Feng, X.T.; Li, Y.H.; Zhang, X. The Microwave-induced fracturing of hard rock. Rock Mech. Rock. Eng. 2019, 52, 3017–3032. [Google Scholar] [CrossRef]
  216. Samir, M.; Deyab, H.R.; Hassani, F.; Kermani, M.; Agus, P.; Sasmito, A.P. Experimental investigation on the effects of microwave irradiation on kimberlite and granite rocks. J. Rock Mech. Geotech. Eng. 2021, 13, 267–274. [Google Scholar]
  217. Peinsitt, T.; Kuchar, F.; Hartlieb, P.; Moser, P.; Kargl, H.; Restner, U.; Sifferlinge, N.A. Microwave heating of dry and water saturated basalt, granite and sandstone. Int. J. Min. Miner. Eng. 2010, 2, 18–29. [Google Scholar] [CrossRef]
  218. Ma, E. Amorphization in mechanically driven material systems. Scr. Mater. 2003, 49, 941–946. [Google Scholar] [CrossRef]
  219. Akay, G.; Tincer, T.; Aydin, E. The effect of orientation on the radiation induced degradation of polymers. Eur. Polym. J. 1980, 16, 597–600. [Google Scholar] [CrossRef]
  220. Akay, G.; Tincer, T. The effect of orientation on radiation-induced degradation in high density polyethylene. Polym. Eng. Sci. 1982, 21, 8–17. [Google Scholar] [CrossRef]
  221. Liu, Q.; Yang, H.; Zhao, J.; Liu, S.; Xia, L.; Hu, P.; Lv, Y.; Huang, Y.; Kong, M.; Li, G. Acceleratory and inhibitory effects of uniaxial tensile stress on the photo-oxidation of polyethylene: Dependence of stress, time duration and temperature. Polymer 2018, 148, 316–329. [Google Scholar] [CrossRef]
  222. Yeh, J.-W.; Chen, S.-K.; Lin, S.-J.; Gan, J.-Y.; Chin, T.-S.; Shun, T.-T.; Tsau, C.-H.; Chang, S.-Y. Nanostructured high-entropy alloys with multiple principal elements: Novel alloy design concepts and outcomes. Adv. Eng. Mater. 2004, 6, 299–303. [Google Scholar] [CrossRef]
  223. Cantor, B.; Chang, I.; Knight, P.; Vincent, A. Microstructural development in equiatomic multicomponent alloys. Mater. Sci. Eng. A 2004, 375, 213–218. [Google Scholar] [CrossRef]
  224. Jian, W.-R.; Xie, Z.; Xu, S.; Yao, X.; Beyerlein, I.J. Shock-induced amorphization in medium entropy alloy CoCrNi. Scr. Mater. 2022, 209, 114379. [Google Scholar] [CrossRef]
  225. Pacchioni, G. High-entropy materials go nano. Nat. Rev. Mater. 2022, 7, 156. [Google Scholar] [CrossRef]
  226. Li, K.; Chen, W. Recent progress in high-entropy alloys for catalysts: Synthesis, applications, and prospects. Mater. Today Energy 2021, 20, 100638. [Google Scholar] [CrossRef]
  227. Chen, L.; Deng, S.; Liu, H.; Wu, J.; Qi, H.; Chen, J. Giant energy-storage density with ultrahigh efficiency in lead-free relaxors via high-entropy design. Nat. Commun. 2022, 13, 3089. [Google Scholar] [CrossRef]
  228. Akay, G. Process Intensification in the Catalytic Synthesis of Supported Catalysts with Hierarchic Pore Structure. International Patent Publication PCT WO/2013/108045, 25 July 2013. [Google Scholar]
  229. Fan, C.; Li, L.; Wen, W.; Li, H.; Fu, J.; Ruan, W.; Ren, S.; Sohrabi, S.; Zhang, Z.; Liang, X.; et al. Rapid amorphization of CrMnFeCoNi high-entropy alloy under ultrasonic vibrations. Mater. Des. 2023, 225, 111575. [Google Scholar] [CrossRef]
  230. Li, L.; Lyu, G.-J.; Li, H.; Fan, C.; Wen, W.; Lin, H.; Huang, B.; Sohrabi, S.; Ren, S.; Liang, X.; et al. Ultra-fast amorphization of crystalline alloys by ultrasonic vibrations. J. Mater. Sci. Technol. 2023, 142, 76–88. [Google Scholar] [CrossRef]
  231. Wang, B.; Wang, C.; Yu, X.; Cao, Y.; Gao, L.; Wu, C.; Yao, Y.; Lin, S.; Zou, Z. General synthesis of high-entropy alloy and ceramic nanoparticles in nanoseconds. Nat. Synth. 2022, 1, 138–146. [Google Scholar] [CrossRef]
  232. Potnis, P.R.; Tsou, N.-T.; Huber, J.E. A Review of domain modelling and domain imaging techniques in ferroelectric crystals. Materials 2011, 4, 417–447. [Google Scholar] [CrossRef] [PubMed]
  233. Shu, Y.C.; Bhattacharya, K. Domain patterns and macroscopic behaviour of ferroelectric materials. Philos. Mag. B 2001, 81, 2021–2054. [Google Scholar] [CrossRef]
  234. Arlt, G.; Sasko, P. Domain configuration and equilibrium size of domains in BaTiO3 ceramics. J. Appl. Phys. 1980, 51, 4956–4960. [Google Scholar] [CrossRef]
  235. Trolier-McKinstry, S.; Gharb, N.B.; Damjanovic, D. Piezoelectric nonlinearity due to motion of 180° domain walls in ferroelectric materials at subcoercive fields: A dynamic poling model. Appl. Phys. Lett. 2006, 88, 202901. [Google Scholar] [CrossRef]
  236. Kannan, V.; Trassin, M.; Kochmann, D.M. Kinetics of ferroelectric switching in poled barium titanate ceramics: Effects of electrical cycling rate. Materialia 2022, 25, 101553. [Google Scholar] [CrossRef]
  237. Hoshina, T.; Kigoshi, Y.; Hatta, S.; Teranishi, T.; Takeda, H.; Tsurumi, T. Size effect and domain-wall contribution of barium titanate ceramics. Ferroelectrics 2010, 402, 29–36. [Google Scholar] [CrossRef]
  238. Ghosh, D.; Sakata, S.; Carter, J.C.; Thomas, P.A.; Han, H.; Nino, J.C.; Jones, J.L. Domain wall displacement is the origin of superior permittivity and piezoelectricity in BaTiO3 at intermediate grain sizes. Adv. Funct. Mater. 2014, 24, 885–896. [Google Scholar] [CrossRef]
  239. Bencan, A.; Oveisi, E.; Hashemizadeh, S.; Veerapandiyan, V.K.; Hoshina, T.; Rojac, T.; Deluca, M.; Drazic, G.; Damjanovic, D. Atomic scale symmetry and polar nanoclusters in the paraelectric phase of ferroelectric materials. Nat. Commun. 2021, 12, 3509. [Google Scholar] [CrossRef] [PubMed]
  240. Wu, K.; Rodríguez-Córdoba, W.E.; Liu, Z.; Zhu, H.; Lian, T. Beyond band alignment: Hole localization driven formation of three spatially separated long-lived exciton states in CdSe/CdS nanorods. ACS Nano 2013, 7, 7173–7185. [Google Scholar] [CrossRef]
  241. Gao, D.; Xu, J.; Wang, L.; Zhu, B.; Yu, H.; Yu, J. Optimizing atomic hydrogen desorption of sulfur-rich NiS1+x cocatalyst for boosting photocatalytic H2 evolution. Adv. Mater. 2022, 34, 2108475. [Google Scholar] [CrossRef]
  242. Law, V.J.; Dowlin, D.P. Converting a microwave oven into a plasma reactor: A review. Int. J. Chem. Eng. 2018, 3, 2957194. [Google Scholar] [CrossRef]
  243. Zamri, A.A.; Ong, M.Y.; Nomanbhay, S.; Show, P.L. Microwave plasma technology for sustainable energy production and the electromagnetic interaction within the plasma system: A review. Environ. Res. 2021, 197, 111204. [Google Scholar] [CrossRef]
  244. Wirth, B.D. How does radiation damage materials? Science 2007, 318, 923–924. [Google Scholar] [CrossRef] [PubMed]
  245. Uberuaga, B.P.; Hoagland, R.G.; Voter, A.F.; Valone, S.M. Direct transformation of vacancy voids to stacking fault tetrahedra. Phys. Rev. Lett. 2007, 99, 135501. [Google Scholar] [CrossRef]
  246. Matsukawa, Y.; Zinkle, S.J. One-dimensional fast migration of vacancy clusters in metals. Science 2007, 318, 959–962. [Google Scholar] [CrossRef]
  247. Wei, J.; Feng, B.; Tochigi, E.; Shibata, N.; Ikuhara, Y. Direct imaging of the disconnection climb mediated point defects absorption by a grain boundary. Nat. Commun. 2022, 13, 1455. [Google Scholar] [CrossRef]
  248. Odette, G.R.; Alinger, M.J.; Wirth, B.D. Recent developments in irradiation-resistant steels. Annu. Rev. Mater. Res. 2008, 38, 471–503. [Google Scholar] [CrossRef]
  249. Sickafus, K.E.; Grimes, R.; Valdez, J.; Cleave, A.; Tang, M.; Ishimaru, M.; Corish, S.M.; Stanek, C.R.; Uberuaga, B.P. Radiation-induced amorphization resistance and radiation tolerance in structurally related oxides. Nat. Mater. 2007, 6, 217–223. [Google Scholar] [CrossRef] [PubMed]
  250. Rose, M.; Balogh, A.G.; Hahn, H. Instability of irradiation induced defects in nanostructured materials. Nucl. Instrum. Methods Phys. Res. Sect. B 1997, 127–128, 119–122. [Google Scholar] [CrossRef]
  251. Nita, N.; Schaeublin, R.; Victoria, M. Impact of irradiation on the microstructure of nanocrystalline materials. J. Nucl. Mater. 2004, 329–333, 953–957. [Google Scholar] [CrossRef]
  252. Fu, C.-C.; Torre, J.D.; Willaime, F.; Bocquet, J.-L.; Barbu, A. Multiscale modelling of defect kinetics in irradiated iron. Nat. Mater. 2005, 4, 68–74. [Google Scholar] [CrossRef]
  253. Bai, X.-M.; Voter, A.F.; Hoagland, R.G.; Nastasi, M.; Uberuaga, B.P. Efficient annealing of radiation damage near grain boundaries via interstitial emission. Science 2010, 327, 1631–1634. [Google Scholar] [CrossRef]
  254. Frolov, T.; Olmsted, D.L.; Asta, M.; Mishin, Y. Structural phase transformations in metallic grain boundaries. Nat. Commun. 2013, 4, 1899. [Google Scholar] [CrossRef]
  255. Chugunov, A.I.; Horowitz, C.J. Breaking stress of neutron star crus. Mon. Not. R. Astron. Soc. 2010, 407, L54–L58. [Google Scholar] [CrossRef]
  256. Wang, X.; Zhang, H.; Baba, T.; Jiang, H.; Liu, C.; Guan, Y.; Elleuch, O.; Kuech, T.; Morgan, D.; Idrobo, J.-C.; et al. Radiation-induced segregation in a ceramic. Nat. Mater. 2020, 19, 992–998. [Google Scholar] [CrossRef]
  257. Albedwawi, S.H.; AlJaberi, A.; Haidemenopoulos, G.N.; Polychronopoulou, K. High entropy oxides-exploring a paradigm of promising catalysts: A review. Mater. Des. 2021, 202, 109534. [Google Scholar] [CrossRef]
  258. Bao, H.; Zhu, S.; Zhou, L.; Fu, H.; Zhang, H.; Cai, W. Mars–van-Krevelen mechanism-based blackening of nano-sized white semiconducting oxides for synergetic solar photo-thermocatalytic degradation of dye pullutants. Nanoscale 2020, 12, 4030–4039. [Google Scholar] [CrossRef]
  259. Botros, M.; Janek, J. Embracing disorder in solid state batteries. Science 2022, 378, 1273–1274. [Google Scholar] [CrossRef]
  260. Zhang, F.; Cheng, F.; Cheng, C.; Guo, M.; Liu, Y.; Miao, Y.; Gao, F.; Wang, X. Preparation and electrical conductivity of (Zr, Hf, Pr, Y, La) O high entropy fluorite oxides. J. Mater. Sci. Technol. 2022, 105, 122–130. [Google Scholar] [CrossRef]
  261. Zeng, Y.; Ouyang, B.; Liu, J.; Byeon, Y.-W.; Cai, Z.; Miara, L.J.; Wang, Y.; Ceder, G. High-entropy mechanism to boost ionic conductivity. Science 2022, 378, 1320–1324. [Google Scholar] [CrossRef]
  262. Liu, H.; Cui, Z.; Chen, M.; Zhao, B. Phase equilibrium study of ZnO-‘FeO’-SiO2 system at fixed Po2 10−8 atm. Metall. Mater. Trans. B 2016, 47, 164–173. [Google Scholar] [CrossRef]
  263. Lee, C.S.; Matori, K.A.; Ab Aziz, S.H.; Kamari, H.M.; Ismail, I.; Zaid, M.H. Fabrication and characterization of glass and glass-ceramic from rice husk ash as a potent material for opto-electronic applications. J. Mater. Sci. Mater. Electron. 2017, 28, 17611–17621. [Google Scholar] [CrossRef]
  264. Liu, H.; Cui, Z.; Chen, M.; Zhao, B. Phase equilibria study of the ZnO–‘FeO’–SiO2–MgO system at Po2 10−8 atm. Miner. Process. Extr. Metall. 2018, 127, 242–249. [Google Scholar] [CrossRef]
  265. Ma, S.; Huang, S.D.; Liu, Z.P. Dynamic coordination of cations and catalytic selectivity on zinc–chromium oxide alloys during syngas conversion. Nat. Catal. 2019, 2, 671–677. [Google Scholar] [CrossRef]
  266. Mostafa, M.M.M.; Bajafar, W.; Gu, L.; Narasimharao, K.; Abdel Salam, M.; Alshehri, A.; Khdary, N.H.; Al-Faifi, S.; Chowdhury, A.D. Electrochemical characteristics of nanosized Cu, Ni, and Zn cobaltite spinel materials. Catalysts 2022, 12, 893. [Google Scholar] [CrossRef]
  267. Noormohammadi, E.; Sanjabi, S.; Soavi, F.; Poli, F. Electrodeposited Cobalt–Copper mixed oxides for supercapacitor electrodes and investigation of the Co/Cu ratio on the electrochemical performance. Mater. Renew. Sustain. Energy 2023, 12, 53–61. [Google Scholar] [CrossRef]
  268. Zhang, Q.; Hu, Y.; Wu, H.; Zhao, X.; Wang, M.; Wang, S.; Feng, R.; Chen, Q.; Song, F.; Chen, M.; et al. Entropy-stabilized multicomponent porous spinel nanowires of NiFeXO4 (X = Fe, Ni, Al, Mo, Co, Cr) for efficient and durable electrocatalytic oxygen evolution reaction in alkaline medium. ACS Nano 2023, 17, 1485–1494. [Google Scholar] [CrossRef]
  269. Aydinyan, S.; Kirakosyan, H.; Sargsyan, A.; Volobujeva, O.; Kharatyan, S. Solution combustion synthesis of MnFeCoNiCu and (MnFeCoNiCu)3O4 high entropy materials and sintering thereof. Ceram. Int. 2022, 48, 20294–20305. [Google Scholar] [CrossRef]
  270. Wang, Y.; Li, H.; Liu, H.; Yang, L.; Zeng, C. Preparation and formation mechanism of Cr-free spinel-structured high entropy oxide (MnFeCoNiCu)3O4. Ceram. Int. 2023, 49, 1940–1946. [Google Scholar] [CrossRef]
  271. Sarkar, A.; Breitung, B.; Hahn, H. High entropy oxides: The role of entropy, enthalpy and synergy. Scr. Mater. 2020, 187, 43–48. [Google Scholar] [CrossRef]
  272. Anandkumar, M.; Trofimov, E. Synthesis, properties, and applications of high-entropy oxide ceramics: Current progress and future perspectives. J. Alloys Compd. 2023, 960, 170690. [Google Scholar] [CrossRef]
  273. Ye, Y.F.; Wang, Q.; Lu, J.; Liu, C.T.; Yang, Y. High-entropy alloy: Challenges and prospects. Mater. Today 2016, 19, 349–362. [Google Scholar] [CrossRef]
  274. Pan, Y.; Liu, J.-X.; Tu, T.-Z.; Wang, W.; Zhang, G.-J. High-entropy oxides for catalysis: A diamond in the rough. Chem. Eng. J. 2023, 451, 138659. [Google Scholar] [CrossRef]
  275. Ortega-Zarzosa, G.; Araujo-Andrade, C.; Compean-Jasso, M.E.; Mart, J.R.; Ruiz, F. Cobalt oxide/silica xerogels powder: X-ray diffraction, infrared and visible absorption studies. J. Sol-Gel Sci. Technol. 2002, 24, 23–29. [Google Scholar] [CrossRef]
  276. Cheng, W.; Rechberger, F.; Ilari, G.; Ma, H.; Lin, W.-I.; Niederberger, M. Amorphous cobalt silicate nanobelts@carbon composites as stable anode material for lithium ion batteries. Chem. Sci. 2015, 6, 6908. [Google Scholar] [CrossRef]
  277. Guragain, D.; Zequine, C.; Gupta, R.K.; Mishra, S.R. Facile synthesis of bio-template tubular MCo2O4 (M = Cr, Mn, Ni) microstructure and its electrochemical performance in aqueous electrolyte. Processes 2020, 8, 343. [Google Scholar] [CrossRef]
  278. Saaid, F.I.; Arsyad, A.; Azman, N.S.H.; Kumar, A.; Yang, C.-C.; Tseng, T.-T.; Winie, T. The synergistic effect of iron cobaltite compare to its single oxides as cathode in supercapacitor. J. Electroceram. 2020, 44, 183–194. [Google Scholar] [CrossRef]
  279. Li, J.; Jiang, N.; Liao, J.; Feng, Y.; Liu, Q.; Li, H. Nonstoichiometric Cu0.6Ni0.4Co2O4 nanowires as an anode material for high performance lithium storge. Nanomaterials 2020, 10, 191. [Google Scholar]
  280. Tian, G.; Liu, X.; Zhang, C.; Fan, X.; Xiong, H.; Li, Z.; Yan, B.; Zhang, L.; Wang, N.; Peng, H.-J.; et al. Accelerating syngas-to-aromatic conversion via spontaneously monodispersed Fe in ZnCr2O4 spinel. Nat. Commun. 2022, 13, 5567. [Google Scholar] [CrossRef]
  281. Rost, C.M.; Sachet, E.; Borman, T.; Moballegh, A.; Dickey, E.C.; Hou, D.; Jones, J.L.; Curtarolo, S.; Maria, J.-P. Entropy-stabilized oxides. Nat. Commun. 2015, 6, 8485. [Google Scholar] [CrossRef] [PubMed]
  282. Yang, Y.; Gong, J.; Cai, D.; Li, Y.; Sun, Y.; Wang, W.; Feng, C. Flexible synthesis of CuCo2O4 hexagonal nanocrystal by melting salt modified combustion method as high-performance anode materials for lithium-ion batteries. J. Electroceram. 2023, 50, 57–66. [Google Scholar] [CrossRef]
  283. Navrotsky, A.; Kleppa, O. The thermodynamics of cation distributions in simple spinels. J. Inorg. Nucl. Chem. 1967, 29, 2701–2714. [Google Scholar] [CrossRef]
  284. Fang, Y.; Zhang, S.; Ohodnicki, P.R.; Wang, G. Relation between cation distribution and chemical bonds in spinel NiFe2O4. Mater. Today Commun. 2022, 33, 104436. [Google Scholar] [CrossRef]
  285. Cheng, Z.; Yang, H.; Xu, Y.; Jiang, J.; Xu, Q. Active bimetallic Fe–O–Co sites built on 2D trimetallic complex spinel oxides for industrially oxygen evolution electrocatalyst. Mater. Today Chem. 2022, 26, 101214. [Google Scholar] [CrossRef]
  286. Lin, C.-C.; Chang, C.-W.; Kaun, C.-C.; Su, Y.-H. Stepwise evolution of photocatalytic spinel-structured (Co, Cr, Fe, Mn, Ni)3O4 high entropy oxides from first principles calculations to machine learning. Crystals 2021, 11, 1035. [Google Scholar] [CrossRef]
  287. Cieslak, J.; Reissner, M.; Berent, K.; Dabrowa, J.; Stygar, M.; Mozdzierz, M.; Zajusz, M. Magnetic properties and ionic distribution in high entropy spinels studied by mossbauer and ab initio methods. Acta Mater. 2021, 206, 116600. [Google Scholar] [CrossRef]
  288. Sarkar, A.; Eggert, B.; Witte, R.; Lill, J.; Velasco, L.; Wang, Q.; Sonar, J.; Ollefs, K.; Bhattacharya, S.S.; Brand, R.A.; et al. Comprehensive investigation of crystallographic, spin-electronic and magnetic structure of (Co0.2Cr0.2Fe0.2Mn0.2Ni0.2)3O4: Unraveling the suppression of configuration entropy in high entropy oxides. Acta Mater. 2022, 226, 117581. [Google Scholar] [CrossRef]
  289. Johnstone, G.H.J.; González-Rivas, M.U.; Taddei, K.M.; Sutarto, R.; Sawatzky, G.A.; Green, R.J.; Oudah, M.; Hallas, A.M. Entropy engineering and tunable magnetic order in the spinel high-entropy oxide. J. Am. Chem. Soc. 2022, 144, 20590–20600. [Google Scholar] [CrossRef]
  290. Poleti, D.; Vasović, D.; Karanović, L.; Branković, Z. Synthesis and characterization of ternary zinc-antimony-transition metal spinels. J. Solid State Chem. 1994, 112, 39–44. [Google Scholar] [CrossRef]
  291. Wang, Z.L. Splendid one-dimensional nanostructures of zinc oxide: A new nanomaterial family for nanotechnology. ACS Nano 2008, 2, 1987–1992. [Google Scholar] [CrossRef] [PubMed]
  292. Morkoç, H.; Özgür, Ü. Zinc Oxide: Fundamentals, Materials and Device Technology; Wiley-VCH: Weinheim, Germany, 2009; ISBN 978-3-527-40813-9. [Google Scholar]
  293. Fortunato, E.; Gonçalves, A.; Pimentel, A.; Barquinha, P.; Gonçalves, G.; Pereira, L.; Ferreira, I.; Martins, R. Zinc oxide, a multifunctional material: From material to device applications. Appl. Phys. A 2009, 96, 197–205. [Google Scholar] [CrossRef]
  294. Wojnarowicz, J.; Chudoba, T.; Lojkowski, W. A review of microwave synthesis of zinc oxide nanomaterials: Reactants, process parameters and morphologies. Nanomaterials 2020, 10, 1086. [Google Scholar] [CrossRef] [PubMed]
  295. Sugiyama, H.; Nakamura, N.; Watanabe, S.; Kim, J.; Kitano, M.; Hosono, H. Electronic promotion of methanol synthesis over Cu-loaded ZnO-based catalysts. J. Phys. Chem. Lett. 2023, 14, 1259–1264. [Google Scholar] [CrossRef] [PubMed]
  296. Flores-Lasluisa, J.X.; Quílez-Bermejo, J.; Ramírez-Pérez, A.C.; Huerta, F.; Cazorla-Amorós, D.; Morallón, E. Copper-doped cobalt spinel electrocatalysts supported on activated carbon for hydrogen evolution reaction. Materials 2019, 12, 1302. [Google Scholar] [CrossRef]
  297. Wang, L.; Yi, Y.; Guo, H.; Du, X.; Zhu, B.; Zhu, Y. Highly dispersed Co nanoparticles prepared by an improved method for plasma-driven NH3 decomposition to produce H2. Catalysts 2019, 9, 107. [Google Scholar] [CrossRef]
  298. Xu, C.; Tan, J.; Zhang, X.; Huang, Y. Petal-like CuCo2O4 spinel nanocatalyst with rich oxygen vacancies for efficient PMS activation to rapidly degrade pefloxacin. Sep. Purif. Technol. 2022, 291, 120933. [Google Scholar] [CrossRef]
  299. Ferreira, T.A.S.; Waerenborgh, J.C.; Mendonça, M.H.R.M.; Nunes, M.R.; Costa, F.M. Structural and morphological characterization of FeCo2O4 and CoFe2O4 spinels prepared by a coprecipitation method. Solid State Sci. 2003, 5, 383–392. [Google Scholar] [CrossRef]
  300. Kurnaz Yetim, N.; Kurşun Baysak, F.; Koç, M.M.; Nartop, D. Characterization of magnetic Fe3O4@SiO2 nanoparticles with fluorescent properties for potential multipurpose imaging and theranostic applications. J. Mater. Sci. Mater. Electron. 2020, 31, 18278–18288. [Google Scholar] [CrossRef]
  301. Favors, Z.; Wang, W.; Bay, H.H.; George, A.; Ozkan, M.; Ozkan, C.S. Stable cycling of SiO₂ nanotubes as high-performance anodes for lithium-ion batteries. Sci. Rep. 2014, 4, 4605. [Google Scholar] [CrossRef]
  302. George, A.; Shen, B.; Craven, M.; Wang, Y.; Kang, D.; Wu, C.; Tu, X. A review of non-thermal plasma technology: A novel solution for CO2 conversion and utilization. Renew. Sustain. Energy Rev. 2021, 135, 109702. [Google Scholar] [CrossRef]
  303. Navascués, P.; Garrido-García, J.; Cotrino, J.; González-Elipe, A.R. Gómez-Ramírez, Incorporation of a metal catalyst for the ammonia synthesis in a ferroelectric packed-bed plasma reactor: Does it really matter? ACS Sustain. Chem. Eng. 2023, 11, 3621–3632. [Google Scholar] [CrossRef] [PubMed]
  304. Ou, Y.; Li, S.; Wang, F.; Duan, X.; Yuan, W.; Yang, H.; Zhang, Z.; Wang, Y. Reversible transformation between terrace and step sites of Pt nanoparticles on titanium under CO and O2 environments. Chin. J. Catal. 2022, 43, 2026–2033. [Google Scholar] [CrossRef]
  305. Pantzas, K.; Patriarche, G. Experimental quantification of atomically-resolved HAADF-STEM images using EDX. Ultramicroscopy 2021, 220, 113152. [Google Scholar] [CrossRef] [PubMed]
  306. Cha, E.; Chung, H.; Jang, J.; Lee, J.; Lee, E.; Ye, J.C. Low-dose sparse-view HAADF-STEM-EDX tomography of nanocrystals using unsupervised deep learning. ACS Nano 2022, 16, 10314–10326. [Google Scholar] [CrossRef]
  307. Diebold, U.; Li, S.-C.; Schmid, M. Oxide surface science. Annu. Rev. Phys. Chem. 2010, 61, 129–148. [Google Scholar] [CrossRef]
  308. Setvin, M.; Hulva, J.; Parkinson, G.S.; Schmid, M.; Diebold, U. Electron transfer between anatase TiO2 and an O2 molecule directly observed by atomic force microscopy. Proc. Natl. Acad. Sci. USA 2017, 114, E2556–E2562. [Google Scholar] [CrossRef] [PubMed]
  309. Sokolovic, I.; Reticcioli, M.; Calkovsky, M.; Wagner, M.; Schmid, M.; Franchini, C.; Diebold, U.; Setvin, M. Resolving the absorption of molecular O2 on the rutile TiO2(110) surface by noncontact atomic force microscopy. Proc. Natl. Acad. Sci. USA 2020, 117, 14827–14837. [Google Scholar] [CrossRef] [PubMed]
  310. Katsube, D.; Shimizu, R.; Sugimoto, Y.; Hitosugi, T.; Abe, M. Identification of OH groups on SrTiO3(100)-( 13 × 13 )-R33.7° reconstructed surface by non-contact atomic force microscopy and scanning tunnelling microscopy. Appl. Phys. Lett. 2023, 122, 017602. [Google Scholar] [CrossRef]
  311. Lakhera, S.K.; Rugma, T.P.; Rishi Krishna, B.S.; Rabiee, N.; Bernaurdshaw, N. Pivotal role of oxygen during the synthesis of Cu(OH)2/TiO2 and its effect on photocatalytic hydrogen production activity. Catal. Today 2023, 43, 114007. [Google Scholar] [CrossRef]
  312. Li, S.; Czap, G.; Li, J.; Zhang, Y.; Yu, A.; Yuan, D.; Kimura, H.; Wu, R.; Ho, W. Confinement-induced catalytic dissociation of hydrogen molecules in a scanning tunnelling microscope. J. Am. Chem. Soc. 2022, 144, 9618–9623. [Google Scholar] [CrossRef] [PubMed]
  313. Chen, L.D. Cations play an essential role in CO2 reduction. Nat. Catal. 2021, 4, 641–642. [Google Scholar] [CrossRef]
  314. Ridge, S.; Resasco, J.; Walton, A.; Seger, B.; Bell, A.T.; Chan, K. Understanding cation effects in electrochemical CO2 reduction. Energy Environ. Sci. 2019, 12, 3001–3014, Erratum in Energy Environ. Sci. 2020, 13, 646–647. [Google Scholar]
  315. Holland, H.D. The oxygenation of the atmosphere and oceans. Philos. Trans. R. Soc. Lond. Ser. B 2006, 361, 903–915. [Google Scholar] [CrossRef]
  316. Lu, Z.; Chang, Y.C.; Yin, Q.-Z.; Ng, C.Y.; Jackson, W.M. Evidence for direct molecular oxygen production in CO2 photodissociation. Science 2014, 346, 61–64. [Google Scholar] [CrossRef]
  317. Schlegel, H.B. Exploring potential energy surfaces for chemical reactions: An overview of some practical methods. J. Comput. Chem. 2003, 24, 1514–1527. [Google Scholar] [CrossRef]
  318. Szabó, I.; Császár, A.G.; Czakó, G. Dynamics of the F + CH3Cl → Cl + CH3F SN2 reaction on a chemically accurate potential energy surface. Chem. Sci. 2013, 4, 4362. [Google Scholar] [CrossRef]
  319. Wang, Y.; Song, H.; Szabó, I.; Czakó, G.; Guo, H.; Yang, M. Mode specific SN2 reaction dynamics. J. Phys. Chem. Lett. 2016, 7, 3322. [Google Scholar] [CrossRef]
  320. Maeda, S.; Harabuchi, Y.; Takagi, M.; Taketsugu, T.; Morokuma, K. Artificial force induced reaction (AFIR) method for exploring quantum chemical potential energy surfaces. Chem. Rec. 2016, 16, 2232–2248. [Google Scholar] [CrossRef]
  321. Rousseau, R.; Glezakou, V.A.; Selloni, A. Theoretical insights into the surface physics and chemistry of redox-active oxides. Nat. Rev. Mater. 2020, 5, 460–475. [Google Scholar] [CrossRef]
  322. Tasi, D.A.; Győri, T.; Czakó, G. On the development of a gold-standard potential energy surface for the OH + CH3I reaction. Phys. Chem. Chem. Phys. 2020, 22, 3775–3778. [Google Scholar] [CrossRef]
  323. Hussain, A.; Nabi, A.G.; Javaid, S. Remarkable reactivity of Fe modified Cu(100) surface towards CO2 decomposition: A DFT study. Mater. Today Commun. 2023, 34, 105395. [Google Scholar] [CrossRef]
  324. Zhao, C.; Xu, H. Activation of CO2 by Direct Cleavage Triggered by Photoelectrons on Rutile TiO2(110). J. Phys. Chem. Lett. 2023, 14, 1928–1933. [Google Scholar] [CrossRef] [PubMed]
  325. Ganyecz, A.; Mezei, P.D.; Kállay, M. Oxygen reduction reaction on TiO2 rutile (110) surface in the presence of bridging hydroxyl groups. Comput. Theor. Chem. 2019, 1168, 112607. [Google Scholar] [CrossRef]
  326. Song, H.; Xie, W.; Zhang, C.; Yang, M. Toward a comprehensive understanding of mode-specific dynamics of polyatomic reactions: A Full-Dimensional Quantum Dynamics Study of the H + NH3 Reaction. J. Phys. Chem. A 2022, 126, 663–669. [Google Scholar] [CrossRef]
  327. Fernando, A.; Weerawardene, K.L.D.M.; Karimova, N.V.; Aikens, C.M. Quantum mechanical studies of large metal, metal oxide, and metal chalcogenide nanoparticles and clusters. Chem. Rev. 2015, 115, 6112–6216. [Google Scholar]
  328. Taifan, W.; Boily, J.-F.; Baltrusaitis, J. Surface chemistry of carbon dioxide revisited. Surf. Sci. Rep. 2016, 71, 595–671. [Google Scholar] [CrossRef]
  329. Kitamura, J.; Mizuno, H.; Kato, N.; Aoki, I. Plasma-Erosion Properties of Ceramic Coating Prepared by Plasma Spraying. Mater. Trans. 2006, 47, 1677–1683. [Google Scholar] [CrossRef]
  330. Kasashima, Y.; Tabaru, T.; Matsuda, O.; Motomura, T. Investigation of the relationship between plasma etching characteristics and microstructures of alumina ceramics for chamber parts. Jpn. J. Appl. Phys. 2019, 58, 041001. [Google Scholar] [CrossRef]
  331. Bouchoule, A.; Boufendi, L. Particulate formation and dusty plasma behaviour in argon-silane RF discharge. Plasma Sources Sci. Technol. 1993, 2, 204. [Google Scholar] [CrossRef]
  332. Deka, B.C.T.; Bailung, Y.; Sharma, D.; Sharma, S.K.; Bailung, H. Spatiotemporal evolution of a self-excited dust density wave in a nanodusty plasma under strong Havnes effect. Phys. Plasmas 2021, 28, 123702. [Google Scholar]
  333. Petersen, A.; Asnaz, O.H.; Tadsen, B.; Greiner, F. Decoupling of dust cloud and embedding plasma for high electron depletion in nanodusty plasmas. Commun. Phys. 2022, 5, 308. [Google Scholar] [CrossRef]
  334. Chen, X.; Hogan, C.J. Nanoparticle dynamics in the spatial afterglows of nonthermal plasma synthesis reactors. Chem. Eng. J. 2021, 411, 128383. [Google Scholar] [CrossRef]
  335. Fortova, V.E.; Ivlevb, A.V.; Khrapakb, S.A.; Khrapaka, A.G.; Morfill, G.E. Complex (dusty) plasmas: Current status, open issues, perspectives. Phys. Rep. 2005, 421, 1–103. [Google Scholar] [CrossRef]
  336. Morfill, G.E.; Ivlev, A. Complex plasmas: An interdisciplinary research field. Rev. Mod. Phys. 2009, 81, 1353–1404. [Google Scholar] [CrossRef]
  337. Merlino, R. Dusty plasmas: From Saturn’s rings to semiconductor processing devices. Adv. Phys. X 2021, 6, 1. [Google Scholar] [CrossRef]
  338. Haves, O.; Morfill, G.E.; Goertz, C.K. Plasma potential and grain charges in a dust cloud embedded in a plasma. J. Geophys. Res. Space Phys. 1984, 89, 10999–11003. [Google Scholar] [CrossRef]
  339. Staps, A.T.J.; Donders, T.J.M.; Platier, B.; Beckers, J. In-situ measurement of dust charge density in nanodusty plasma. J. Phys. D Appl. Phys. 2022, 55, 08LT01. [Google Scholar] [CrossRef]
  340. Davari, H.; Farokhi, B.; Asgarian, M.A. Particle simulation of the strong magnetic field effect on dust particle charging process. Sci. Rep. 2023, 13, 1111. [Google Scholar] [CrossRef]
  341. Balzer, K.; Rasmussen, M.R.; Schlünzen, N.; Joost, J.-P.; Bonitz, M. Doublon formation by ions impacting strongly correlated finite lattice system. Phys. Rev. Lett. 2018, 121, 267602. [Google Scholar] [CrossRef]
  342. Arp, O.; Caliebe, D.; Menzel, K.O.; Piel, A.; Goree, J.A. Experimental investigation of dust density waves and plasma glow. IEEE Trans. Plasma Sci. 2010, 38, 842–846. [Google Scholar] [CrossRef]
  343. Mondol, M.M.H.; Kim, C.-U.; Jhung, S.H. Titanium nitride@nitrogen-enriched porous carbon derived from metal–organic frameworks and melamine: A remarkable oxidative catalyst to remove indoles from fuel. Chem. Eng. J. 2022, 450, 138411. [Google Scholar] [CrossRef]
  344. Kong, L.; Liang, X.; Wang, M.; Wu, C.-M.L. Theoretical screening of transition metal-embedded Ti2n for high-efficiency hydrogen evolution reaction. ACS Sustain. Chem. Eng. 2022, 10, 4152–4160. [Google Scholar] [CrossRef]
  345. Bai, X.; Guan, J. Applications of MXene-based single atom catalysts. Small Struct. 2023, 4, 2200354. [Google Scholar] [CrossRef]
  346. Valentin, C.D.; Finazzi, E.; Pacchioni, G.; Selloni, A.; Livraghi, S.; Paganini, M.C.; Giamello, E. N-doped TiO2: Theory and experiment. Chem. Phys. 2007, 339, 44–56. [Google Scholar] [CrossRef]
  347. Foo, C.; Li, Y.; Lebedev, K.; Chen, T.; Day, S.; Tang, C.; Tsang, S.C.E. Characterisation of oxygen defects and nitrogen impurities in TiO2 photocatalysts using variable-temperature X-ray powder diffraction. Nat. Commun. 2021, 12, 661. [Google Scholar] [CrossRef]
  348. Eichler, J.E.; Burrow, J.N.; Wang, Y.; Calabro, D.C.; Mullins, C.B. Unraveling porogenesis in nitrogen rich K+-activated carbons. Carbon 2022, 186, 711–723. [Google Scholar] [CrossRef]
  349. Schlögl, R.; Abd Hamid, S.B. Nanocatalysis: Mature science revisited or something really new? Angew. Chem. Int. Ed. 2004, 43, 1628–1637. [Google Scholar] [CrossRef]
  350. Fu, Q.; Yang, F.; Bao, X. Interface-confined oxide nanostructures for catalytic oxidation reactions. Acc. Chem. Res. 2013, 46, 1692–1701. [Google Scholar] [CrossRef]
  351. Lu, L.; Zou, S.; Fang, B. The critical impact of ligands on heterogeneous nanocatalysis: A review. ACS Catal. 2021, 11, 6020–6058. [Google Scholar] [CrossRef]
  352. Yang, R.; Bao, Z.; Sun, Y. Probing and leveraging the structural heterogeneity of nano-materials for enhanced catalysis. ACS Nanosci. Au 2023, 3, 140–152. [Google Scholar] [CrossRef] [PubMed]
  353. Jing, W.; Shen, H.; Qin, R.; Wu, Q.; Liu, K.; Zheng, N. Surface and interface coordination chemistry learned from model heterogeneous metal nanocatalysts: From atomically dispersed catalysts to atomically precise clusters. Chem. Rev. 2023, 123, 5948–6002. [Google Scholar] [CrossRef]
  354. Matsugi, A. Modeling third-body effects in the thermal decomposition of H2O2. Combust. Flame 2021, 225, 444–452. [Google Scholar] [CrossRef]
  355. Barbet, M.C.; Burke, M.P. Impact of “missing” third-body efficiencies on kinetic model predictions of combustion properties. Proc. Combust. Inst. 2021, 38, 425–432. [Google Scholar] [CrossRef]
  356. Oladeji, A.V.; Courtney, J.M.; Rees, N.V. Copper deposition on metallic and non-metallic single particles via impact electrochemistry. Electrochim. Acta 2022, 405, 139838. [Google Scholar] [CrossRef]
  357. Culbertson, C.M.; Flak, A.T.; Yatskin, M.; Cheong, P.H.-Y.; Cann, D.P.; Dolgos, M.R. Neutron total scattering studies of Group-II titanates (ATiO3, A2+=Mg, Ca, Sr, Ba). Sci. Rep. 2020, 10, 3729. [Google Scholar] [CrossRef] [PubMed]
  358. Su, L.; Huyan, H.; Sarkar, A.; Gao, W.; Yan, X.; Addiego, C.; Kruk, R.; Hanh, H.; Pan, X. Direct observation of elemental fluctuation and oxygen octahedral distortion-dependent charge distribution in high entropy oxides. Nat. Commun. 2022, 13, 2358. [Google Scholar] [CrossRef]
  359. Liu, J.; Zhu, X.; Zhou, C.; Du, J.; Gan, Y.; Chen, G.; Tu, X. Plasma-catalytic ammonia synthesis over BaTiO3 supported metal catalysts: Process optimization using response surface methodology. Vacuum 2022, 203, 111205. [Google Scholar] [CrossRef]
  360. Yang, K.; Dai, Y.; Huang, B. Review of first-principles studies of TiO2: Nanocluster, bulk, and material interface. Catalysts 2020, 10, 972. [Google Scholar] [CrossRef]
  361. Fo, Y.; Ma, Y.; Dong, H.; Zhou, X. Tuning the electronic structure of BaTiO3 for an enhanced photocatalytic performance using cation-anion cooping: A first principles study. New J. Chem. 2021, 45, 8228–8239. [Google Scholar] [CrossRef]
  362. Rakotovelo, S.P.; Moussounda, G.; Haroun, F.M.; Legare, P.; Rakotomahevitra, A.; Parlebas, C.J. DFT study of BaTiO3 (001) surface with O and O2 adsorption. Eur. Phys. J. B 2007, 57, 291–297. [Google Scholar] [CrossRef]
  363. Chun, H.-J.; Youngju Lee, Y.; Kim, S.; Yoon, Y.; Kim, Y.; Park, S.-C. Surface termination of BaTiO3(111) single crystal: A combined DFT and XPS study. Appl. Surf. Sci. 2022, 578, 152018. [Google Scholar] [CrossRef]
  364. Wang, Q.; Domen, K. Particulate photocatalysts for light-driven water splitting: Mechanisms, challenges, and design strategies. Chem. Rev. 2020, 120, 919–985. [Google Scholar] [CrossRef] [PubMed]
  365. Landau, M.V.; Vidruk, R.; Vingurt, D.; Fuks, D.; Herskowitz, M. Grain boundaries in nanocrystalline catalytic materials as a source of surface chemical functionality. Rev. Chem. Eng. 2014, 30, 379–401. [Google Scholar] [CrossRef]
  366. Pal, D.B.; Chand, R.; Upadhyay, S.N.; Mishra, P.K. Performance of water gas shift reaction catalysts: A review. Renew. Sust. Energy Rev. 2018, 93, 549–565. [Google Scholar] [CrossRef]
  367. Bogaerts, A.; Centi, G.; Hessel, V.; Rebrov, E. Challenges in unconventional catalysis. Catal. Today 2023, 420, 114180. [Google Scholar] [CrossRef]
  368. Stoukides, M.; Vayenas, C.G. The effect of electrochemical oxygen pumping on the rate and selectivity of ethylene oxidation on polycrystalline silver. J. Catal. 1981, 70, 137–146. [Google Scholar] [CrossRef]
  369. Vernoux, P.; Lizarraga, L.; Tsampas, M.N.; Sapountzi, F.M.; De Lucas-Consuegra, A.; Valverde, J.L.; Souentie, S.; Vayenas, C.G.; Tsiplakides, D.; Balomenou, S.; et al. Ionically conducting ceramics as active catalyst supports. Chem. Rev. 2013, 113, 8192–8260. [Google Scholar] [CrossRef] [PubMed]
  370. Zhang, Z.; Li, C.; Du, X.; Zhu, Y.; Huang, L.; Yang, K.; Zhao, J.; Liang, C.; Yu, Q.; Li, S.; et al. Deciphering exogenous electric field promoting catalysis from the perspectives of electric energy and electron transfer: A review. Chem. Eng. J. 2023, 452, 139098. [Google Scholar] [CrossRef]
  371. Hollevoet, L.; Jardali, F.; Gorbanev, Y.; Creel, J.; Bogaerts, A.; Martens, J.A. Towards green ammonia synthesis through plasma-driven nitrogen oxidation and catalytic reduction. Angew. Chem. Int. Ed. 2020, 59, 23825–23829. [Google Scholar] [CrossRef]
  372. Shah, J.; Wang, W.; Bogaerts, A.; Carreon, M.L. Ammonia synthesis by radio frequency plasma catalysis: Revealing the underlying mechanisms. ACS Appl. Energy Mater. 2018, 1, 4824–4839. [Google Scholar] [CrossRef]
  373. Wang, Y.; Yang, W.; Xu, S.; Zhao, S.; Chen, G.; Weidenkaff, A.; Hardacre, C.; Fan, X.; Huang, J.; Tu, X. Shielding protection by mesoporous catalysts for improving plasma-catalytic ambient ammonia synthesis. J. Am. Chem. Soc. 2022, 144, 12020–12031. [Google Scholar] [CrossRef] [PubMed]
  374. Wang, X.; Du, X.; Chen, K.; Zheng, Z.; Liu, Y.; Shen, X.; Hu, C. Predicting the ammonia synthesis performance of plasma catalysis using an artificial neural network model. ACS Sustain. Chem. Eng. 2023, 11, 4543–4554. [Google Scholar] [CrossRef]
  375. Zhang, J.; Li, X.; Zheng, J.; Du, M.; Wu, X.; Song, J.; Cheng, C.; Li, T.; Yang, W. Non-thermal plasma-assisted ammonia production: A review. Energy Convers. Manag. 2023, 293, 117482. [Google Scholar] [CrossRef]
  376. Osorio-Tejada, J.; van’t Veer, K.; Long, N.V.D.; Tran, N.N.; Fulcheri, L.; Patil, B.S.; Bogaerts, A.; Hessel, V. Sustainability analysis of methane-to-hydrogen-to-ammonia conversion by integration of high-temperature plasma and non-thermal plasma processes. Energy Convers. Manag. 2022, 269, 116095. [Google Scholar] [CrossRef]
  377. Perillo, R.; Chandra, R.; Akkermans, G.; Vijvers, W.; Graef, W.; Classen, I.; Van Dijk, J.; De Baar, M. Studying the influence of nitrogen seeding in a detached-like hydrogen plasma by means of numerical simulation. Plasma Phys. Control. Fusion 2018, 60, 105004. [Google Scholar] [CrossRef]
  378. Van’t Veer, K.; Engelmann, Y.; Reniers, F.; Bogaerts, A. Plasma Catalytic Ammonia Synthesis in a DBD Plasma: Role of Micro-discharges and Their Afterglows. J. Phys. Chem. C 2020, 124, 22871–22883. [Google Scholar] [CrossRef]
  379. Navascués, P.; Obrero-Pérez, J.M.; Cotrino, J.; González-Elipe, A.R.; Gómez-Ramírez, A. Isotope Labelling for Reaction Mechanism Analysis in DBD Plasma Processes. Catalysts 2019, 9, 45. [Google Scholar] [CrossRef]
  380. Navascués, P.; Obrero-Pérez, J.M.; Cotrino, J.; González-Elipe, A.R.; Gómez-Ramírez, A. Unraveling Discharge and Surface Mechanisms in Plasma-Assisted Ammonia Reactions. ACS Sustain. Chem. Eng. 2020, 8, 14855–14866. [Google Scholar] [CrossRef]
  381. Yaala, M.B.; Saeedi, A.; Scherrer, D.-F.; Moser, L.; Steiner, R.; Zutter, M.; Oberkofler, M.; De Temmerman, G.; Marot, L.; Meyer, E. Plasma-assisted catalytic formation of ammonia in N2–H2 plasma on a tungsten surface. Phys. Chem. Chem. Phys. 2019, 21, 16623–16633. [Google Scholar] [CrossRef]
  382. Andersen, J.A.; Christensen, J.M.; Østberg, M.; Bogaerts, A.; Jensen, A.D. Plasma-catalytic dry reforming of methane: Screening of catalytic materials in a coaxial packed-bed DBD reactor. Chem. Eng. J. 2020, 397, 125519. [Google Scholar] [CrossRef]
  383. Andersen, J.A.; Holm, M.C.; van’t Veer, K.; Christensen, J.M.; Østberg, M.; Bogaerts, A.; Jensen, A.D. Plasma-catalytic ammonia synthesis in a dielectric barrier discharge reactor: A combined experimental study and kinetic modelling. Chem. Eng. J. 2023, 457, 141294. [Google Scholar] [CrossRef]
  384. Zeng, X.; Zhang, S.; Liu, Y.; Hu, X.; Ostrikov, K.K.; Shao, T. Energy-efficient pathways for pulsed-plasma-activated sustainable ammonia synthesis. ACS Sustain. Chem. Eng. 2023, 11, 1110–1120. [Google Scholar] [CrossRef]
  385. Kim, M.; Biswas, S.; Nava, G.; Wong, B.M.; Mangolini, L. Reduced energy cost of ammonia synthesis via RF plasma pulsing. ACS Sustain. Chem. Eng. 2022, 10, 15135–15147. [Google Scholar] [CrossRef]
  386. Fu, Q.; Wang, Y.; Chang, Z. Study on the conversion mechanism of CO2 to O2 in pulse voltage dielectric barrier discharge at Martian pressure. J. CO2 Util. 2023, 70, 102430. [Google Scholar] [CrossRef]
  387. Rouwenhorst, K.H.R.; Kim, H.-H.; Lefferts, L. Vibrationally excited activation of N2 in plasma-enhanced catalytic ammonia synthesis: A kinetic analysis. ACS Sustain. Chem. Eng. 2019, 7, 17515–17522. [Google Scholar] [CrossRef]
  388. Rouwenhorst, K.H.R.; Van der Ham, A.G.J.; Mul, G.; Kersten, S.R.A. Islanded ammonia power systems: Technology review & conceptual process design. Renew. Sustain. Energy Rev. 2019, 114, 109339. [Google Scholar]
  389. Fasihi, M.; Weiss, R.; Savolainen, J.; Breyer, C. Global potential of green ammonia based on hybrid PV-wind power plants. Appl. Energy 2021, 294, 116170. [Google Scholar] [CrossRef]
  390. Valera-Medina, A.; Amer-Hatem, F.; Azad, A.K.; Dedoussi, I.C.; de Joannon, M.; Fernandes, R.X.; Glarborg, P.; Hashemi, H.; He, X.; Mashruk, S.; et al. Review on Ammonia as a Potential Fuel: From Synthesis to Economics. Energy Fuels 2021, 35, 6964–7029. [Google Scholar] [CrossRef]
  391. Bouaboula, H.; Ouikhalfan, M.; Saadoune, I.; Chaouki, J.; Zaabout, A.; Belmabkhout, Y. Addressing sustainable energy intermittence for green ammonia production. Energy Rep. 2023, 9, 4507–4517. [Google Scholar] [CrossRef]
  392. Campion, N.; Nami, H.; Swisher, P.R.; Hendriksen, P.V.; Münster, M. Techno-economic assessment of green ammonia production with different wind and solar potentials. Renew. Sustain. Energy Rev. 2023, 173, 113057. [Google Scholar] [CrossRef]
  393. Osorio-Tejada, J.; Tran, N.N.; Hessel, V. Techno-environmental assessment of small-scale Haber-Bosch and plasma-assisted ammonia supply chains. Sci. Total Environ. 2022, 826, 154162. [Google Scholar] [CrossRef] [PubMed]
  394. Antonini, C.; Treyer, K.; Moioli, E.; Bauer, C.; Schildhauer, T.J.; Mazzotti, M. Hydrogen from wood gasification with CCS—A techno-environmental analysis of production and use as transport fuel. Sustain. Energy Fuels 2021, 5, 2602–2621. [Google Scholar] [CrossRef]
  395. Terlouw, T.; Bauer, C.; Rosa, L.; Mazzotti, M. Large-scale hydrogen production via water electrolysis: A techno-economic and environmental assessment. Energy Environ. Sci. 2022, 15, 3583–3602. [Google Scholar] [CrossRef]
  396. Zhu, X.; Xie, W.; Wu, J.; Miao, Y.; Xiang, C.; Chen, C.; Ge, B.; Gan, Z.; Yang, F.; Zhang, M.; et al. Recent advances in direct air capture by adsorption. Chem. Soc. Rev. 2022, 51, 6574–6651. [Google Scholar]
  397. Castro-Amoedo, R.; Granacher, J.; Daher, M.A.; Maréchal, F. On the role of system integration of carbon capture and mineralization in achieving net-negative emissions in industrial sectors. Energy Environ. Sci. 2023, 16. [Google Scholar] [CrossRef]
  398. Terlouw, T.; Bauer, C.; Rosa, L.; Mazzotti, M. Life cycle assessment of carbon dioxide removal technologies: A critical review. Energy Environ. Sci. 2021, 14, 1701–1721. [Google Scholar] [CrossRef]
  399. Witte, C.-P. Urea metabolism in plants. Plant Sci. 2011, 180, 431–438. [Google Scholar] [CrossRef] [PubMed]
  400. Kumar, P.; Verma, S.; Gupta, A.; Paul, A.R.; Jain, A.; Haque, N. Life Cycle Analysis for The Production of Urea Through Syngas. IOP Conf. Ser. Earth Environ. Sci. 2021, 795, 012031. [Google Scholar] [CrossRef]
  401. Khalidy, R.; Arnaud, E.; Santos, R.M. Natural and human-induced factors on the accumulation and migration of pedogenic carbonate in soil: A Review. Land 2022, 11, 1448. [Google Scholar] [CrossRef]
  402. Dia Milani, D.; Ali Kiani, A.; Nawshad Haque, N.; Sarabjit Giddey, S.; Paul Feron, P. Green pathways for urea synthesis: A review from Australia’s perspective. Sustain. Chem. Clim. Action 2022, 1, 100008. [Google Scholar] [CrossRef]
  403. Sun, X.; Ding, R. Recent progress with electrocatalysts for urea electrolysis in alkaline media for energy-saving hydrogen production. Catal. Sci. Technol. 2020, 10, 1567–1581. [Google Scholar] [CrossRef]
  404. Tong, Y.; Chen, L.; Dyson, P.J.; Fei, Z. Boosting hydrogen production via urea electrolysis on an amorphous nickel phosphide/graphene hybrid structure. J. Mater. Sci. 2021, 56, 17709–17720. [Google Scholar] [CrossRef]
  405. Anuratha, K.S.; Rinawati, M.; Wu, T.H.; Yeh, M.H.; Lin, J.Y. Recent development of nickel-based electrocatalysts for urea electrolysis in alkaline solution. Nanomaterials 2022, 12, 2970. [Google Scholar] [CrossRef] [PubMed]
  406. Mora, J.C.; Singh, K.; Hill, J.M.; Thangadurai, V.; Ponnurangam, S. Surface Basicity Controlled Degradation and Recoverability of Proton Conducting Perovskites, BaZr0.8Ce0.1Y0.1O3–δ and Ba0.5Sr0.5Ce0.6Zr0.2Gd0.1Y0.1O3–δ, in the Presence of CO2. J. Phys. Chem. C 2023, 127, 8529–8538. [Google Scholar] [CrossRef]
  407. Kitchen, H.J.; Vallance, S.R.; Kennedy, J.L.; Tapia-Ruiz, N.; Carassiti, L.; Harrison, A.; Whittaker, A.G.; Drysdale, T.D.; Kingman, S.W.; Gregory, D.H. Modern microwave methods in solid-state inorganic materials chemistry: From fundamentals to manufacturing. Chem. Rev. 2014, 114, 1170–1206. [Google Scholar] [CrossRef]
  408. Horikoshi, S.; Schiffmann, R.F.; Fukushima, J.; Serpone, N. Microwave Chemical and Materials Processing; Springer Nature: Singapore, 2017; ISBN 978-981-10-6465-4. [Google Scholar]
  409. Ramirez, A.; Hueso, J.L.; Abian, M.; Alzueta, M.U.; Mallada, R.; Santamaria, J. Escaping undesired gas-phase chemistry: Microwave-driven selectivity enhancement in heterogeneous catalytic reactors. Sci. Adv. 2019, 5, eaau9000. [Google Scholar] [CrossRef]
  410. Priecel, P.; Lopez-Sanchez, J.A. Advantages and limitations of microwave reactors: From chemical synthesis to the catalytic valorization of biobased chemicals. ACS Sustain. Chem. Eng. 2019, 7, 3–21. [Google Scholar] [CrossRef]
  411. Baldry, M.; Gurieff, N.; Keogh, D. Imagining sustainable human ecosystems with power-to-x in-situ resource utilisation technology. Acta Astronaut. 2022, 192, 190–198. [Google Scholar] [CrossRef]
  412. Nguyen, M.T.P.; Knowling, M.; Tran, N.N.; Burgess, A.; Fisk, I.; Watt, M.; Escribà-Gelonch, M.; This, H.; Culton, J.; Hessel, V. Space farming: Horticulture systems on spacecraft and outlook to planetary space exploration. Plant Physiol. Biochem. 2023, 194, 708–721. [Google Scholar] [CrossRef]
  413. Pathak, H.S.; Brown, P.; Best, T. A systematic literature review of the factors affecting the precision agriculture adoption process. Precis. Agric. 2019, 20, 1292–1316. [Google Scholar] [CrossRef]
  414. Butler, C.; Fan, Y.; Grewal, S.; Winter, L.R. At-field and on-demand nitrogenous fertilizer synthesis. ACS Sust. Chem. Eng. 2023, 11, 5803–5818. [Google Scholar] [CrossRef]
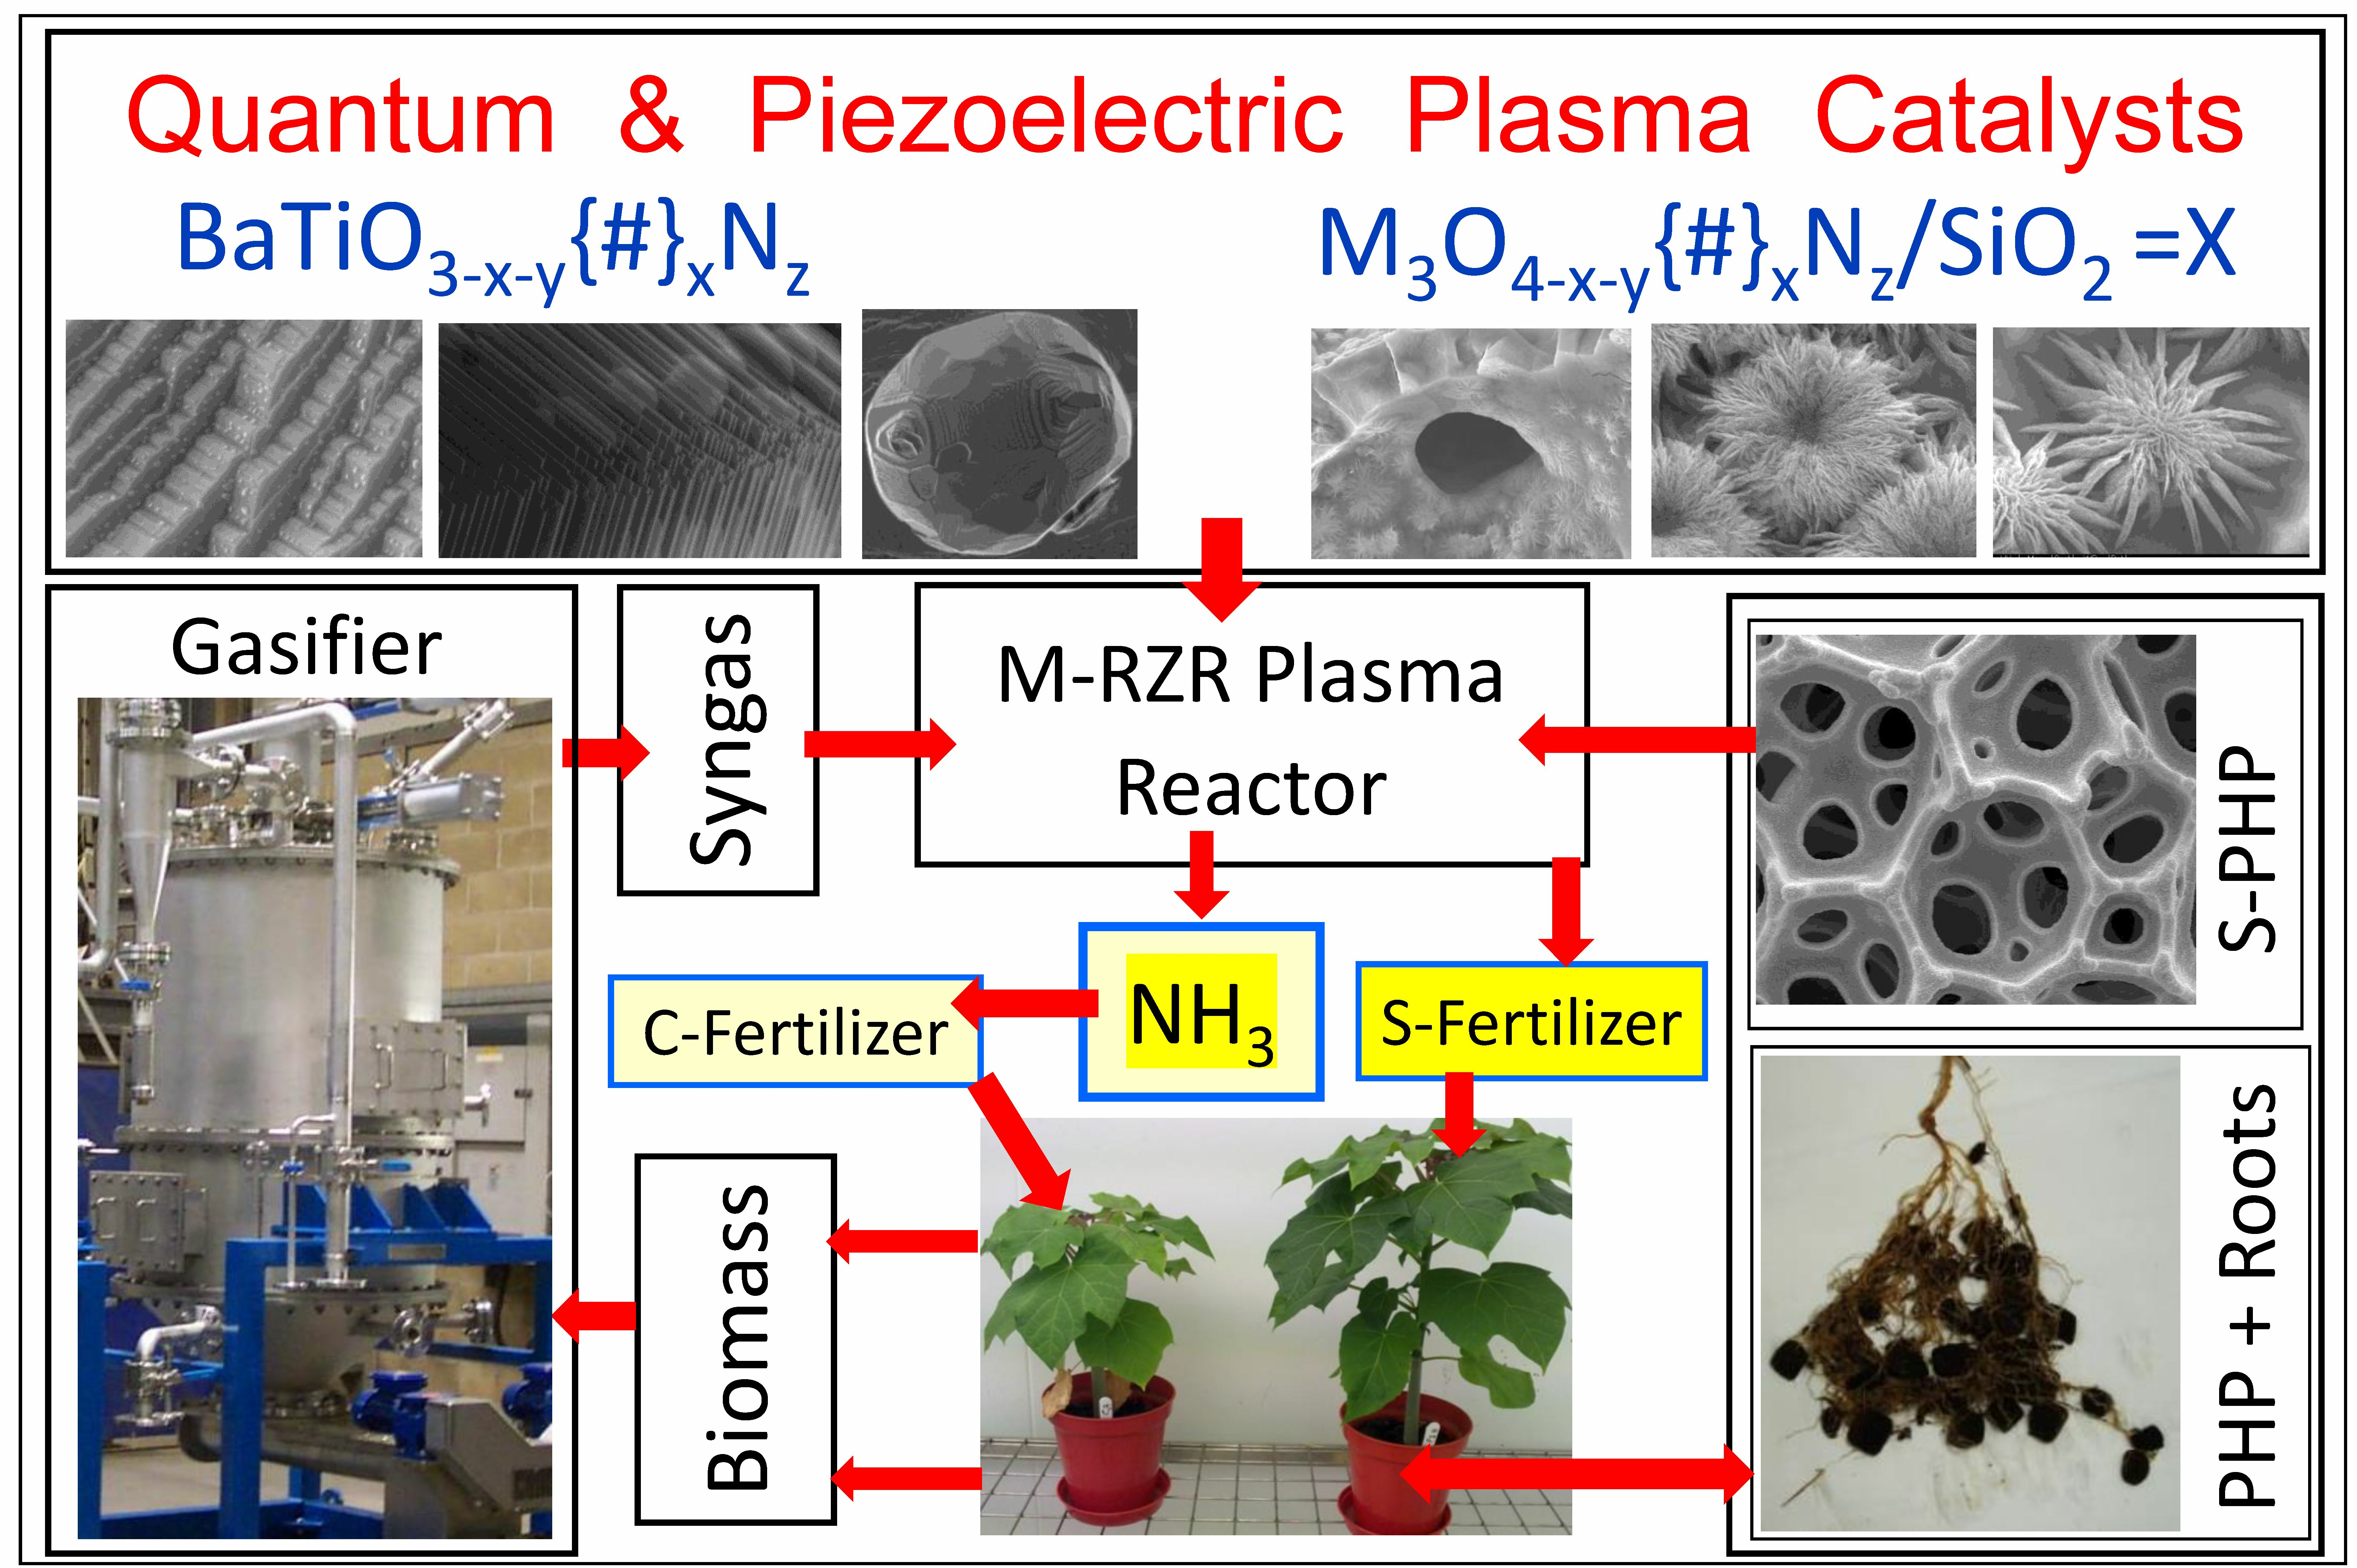
Figure 1. Multi-Reaction Zone Catalytic Reactor with application to ammonia synthesis (@RZ-1) and its subsequent sequestration either @RZ-2 (reaction with CO2 to obtain ammonium carbamate for urea production or anhydrous NH3 after decomposition and separation) or @RZ-3 (neutralization with acid within the pores of a carrier, such as sulfonated PolyHIPE Polymer, S-PHP). For general applications of the M-RZR system, the reactants A1 and A2 enter into the reaction zone RZ-1 and form two gaseous products B1 and B2. They are sequestrated separately by the sequestration agents, A3 and A4 at the reaction zones RZ-3 and RZ-2 respectively thus forming the products, B3 and B4. Reprinted with permission from American Chemical Society, Sustainable Chemistry and Engineering, 2017, 5, 11588–11606 (Reference [3]).
Catalysts 13 01287 g001
Figure 2. Overall technology map illustrating the position of: (a) Type of feedstock used for hydrogen, ammonia, symbiotic-smart fertilizer and urea production using Multi-Reaction Zone Reactor (M-RZR) system and gasification of biomass/waste; (b) Hydrogen generated from methane (blue hydrogen) or water or biogas for direct use in catalytic plasma ammonia synthesis; (c) Direct use of gasification generated syngas as feedstock; (d) Use of fully renewable feedstock (biomass/waste, water and air) for heat/power and syngas generation for ammonia and ammonia derivatives; (e) Gasification plant with its major components for syngas and heat/power generation; (f) Catalytic M-RZR plant with sulfonated PolyHIPE Polymer (S-PHP) or carbon dioxide as irreversible sequestration agents for symbiotic/smart fertilizers (S-F) and ammonium carbamate (AC) for urea production and carbon dioxide utilization; (g) Use of carbon dioxide as reversible sequestration agent for ammonium carbamate production and subsequent decomposition for anhydrous ammonia production; (h) Major inputs to M-RZR including catalysts, plasma power, sulfonated-Poly HIPE Polymer (S-PHP) or equivalent, with mineral acid(s); (i) Secondary products for other applications of the major inputs in order to provide economic viability and nexus; (j) Primary products (symbiotic/smart fertilizers (S-F), urea, ammonia and heat & power from gasification).
Catalysts 13 01287 g002
Figure 3. Multi-oxidant 50 kWe rated fixed-bed up-down draft catalytic gasifier. (a) Diagrammatic illustration of the gasifier reactor; (b) Engineering drawing showing the exact locations and size of various elements of the gasifier reactor (height of the reactor in this engineering drawing = 2363 mm) (c) Vortex reactor for syngas reduction; (d) Membrane air separation/oxygen enhancement facility; (e) Full image of the gasifier before the insulation of the reactors and commissioning showing the auxiliary equipment such as water scrubbers, ash removal facility, water pumps and gas blowers, cyclones for initial particulate removal, fuel inlet system and water scrubber main tank (Maximum height of the pilot plant gasifier is 3.5 m).
Catalysts 13 01287 g003aCatalysts 13 01287 g003bCatalysts 13 01287 g003cCatalysts 13 01287 g003d
Figure 4. The variation of syngas composition as a function of time when the multi-oxidant gasifier operating in down-draft mode was used with air as the oxidant at Equivalence Ratio = 0.25. The syngas component C2Hn refers to the combination of C2H4 + C2H6. This figure also illustrates the response of the gasifier to “start-up” and “shut-down”.
Catalysts 13 01287 g004
Figure 5. Electric field enhanced tar removal reactor.
Catalysts 13 01287 g005
Figure 6. GC spectrum of the model tar: (a) At the inlet to the syngas cleaner (Abundance full scale 85,000 µV); (b) At the outlet of the syngas cleaner (Abundance full scale 2800 µV).
Catalysts 13 01287 g006aCatalysts 13 01287 g006b
Figure 7. General-purpose plasma reactor system and catalytic Dielectric Barrier Discharge (DBD) reactor. (a) Flow diagram. (b) Basic DBD plasma reactor with non-porous walls made from quartz. (1) Outer wall, (2) High voltage central electrode, (3) Inlet for the reactants, (4) Glass wool, (5) Catalyst and PCP space, (6) Ground electrode, (7) Product outlet. Reprinted with permission from American Chemical Society, Industrial and Engineering Chemistry Research, 2017, 56, 457–468 (Reference [69]).
Catalysts 13 01287 g007
Figure 8. Two-reaction zone reactor consisting of catalytic plasma reaction zone (Reaction Zone-1) and product sequestration zone packed with absorbent particles (Reaction Zone-2).
Catalysts 13 01287 g008
Figure 9. FTRI spectra of the charcoal: (a) Before use as a catalyst; (b) After use in the catalytic plasma CO2 splitting as a catalyst.
Catalysts 13 01287 g009
Figure 10. XRD spectrum of fresh BaTiO3.
Catalysts 13 01287 g010
Figure 11. XRD spectra of fresh (F) and microwave irradiated BaTiO3 at 900 W power (Cream-colored particles (C)) and at 1800 W (black-colored particles (B)) at various Bragg angles (2θ). (a) Reflections (001) and (100); (b) Reflections (101) and (110); (c) Reflection (111); (d) Reflections (002) and (200); (e) Reflections (102) and (210); (f)Reflections (112) and (211) (g) Reflections (202) and (220).
Catalysts 13 01287 g011aCatalysts 13 01287 g011bCatalysts 13 01287 g011c
Figure 12. Determination by SEM of morphology heterogeneity of microwave irradiated BaTiO3 showing the variety of ordered and amorphous structures on the surface and below the surface (up to ca. 200 μm from the surface). (a) Surface of the irradiated particles showing the formation of a skin layer and accumulation of fragmented particles; (scale bar= 10 μm); (b) Presence of particles at a higher magnification in a region with barium titanate particle in transformation also showing the genesis of a small particle, (scale bar= 1 μm); (c) Structure of the skin layer with pores of varying size exposing the structure below (scale bar= 1 μm); (d) Detailed structure below the skin as observed through a surface pore illustrating the existence of several types of micro-to-nano structures which are examined below; (scale bar= 5 μm); (e) Micro-plates formed by the close packing of three types of nano-plates (-, Π- and Ʌ-shaped) separated by lattice-exudate drops (see also Figure 13) forming bundles of laddered structures which are also separated by exudate nano-particles; (scale bar= 1 μm); (f) Illustration of the proto nano-plates (-, Π- and Ʌ-shaped) and their packing into 3-dimensional macro-plates separated by lattice exudates; (scale bar= 1 μm); (g) Closely packed micro-plates with thickness ca. 10 nm separated by lattice exudates and bifurcations, (scale bar = 1 μm); (h) Collection of proto-nano-plates at higher magnification; (scale bar 100 nm); (i) Transformation of 90° domains into micro-sheets due to microwave plasma shock: Enlarged view of (g) possibly revealing the mechanism of micro-sheet formation from the fusion of -, Π- and Ʌ-shaped nano-structures with thickness ca. 10 nm and separated by nano-exudate particles; (scale bar = 1 μm).
Catalysts 13 01287 g012aCatalysts 13 01287 g012b
Figure 13. Crystal lattice exudates at high magnifications on the surface and below the surface of microwave-irradiated BaTiO3. (a) Exudates near surface pores. (b) Association of exudates with macro-plates. In both images, Scale bar = 100 nm.
Catalysts 13 01287 g013
Figure 14. Surface structure (with 180° domain walls) and composition (in molar fraction) of the micro-sheets (shown in Figure 10d) after the microwave irradiation of BaTiO3. (a) EDS-layered image showing the closely packed oriented ca. 10 nm thick micro-plates with amorphous BaTiO3-exudate particles, which act as spacers between the layers of the packed micro-plates. (b) EDS spectrum of the surface of the macro-plates providing the surface composition as: [Ba] = 0.194; [Ti] = 0.195%; [O] = 0.611; [Ba]/[Ti] = 0.995 and lattice oxygen index, RO = 1.57. (c) Ba-mapping. (d) Ti-mapping, (e) O-mapping. In all cases, the scale bar = 500 nm.
Catalysts 13 01287 g014
Figure 15. Surface structure (90° domains and domain walls) and composition (in molar fraction) of the micro-plates (shown in Figure 10g–i) after the microwave irradiation of BaTiO3. (a) EDS-layered image showing a large bundle of micro-plates (ca. 1 μm) and lattice exudates. (b) EDS spectrum of the surface of the macro-plate bundle providing the surface composition as: [Ba] = 0.157; [Ti] = 0.159%; [O] = 0.684; [Ba]/[Ti] = 0.987 and lattice oxygen index, RO = 2.17. (c) Ba-mapping. (d) Ti-mapping, (e) O-mapping. In all cases, scale bar = 500 nm.
Catalysts 13 01287 g015
Figure 16. Structural change of BaTiO3 after 80 h of direct methane conversion to H2 and higher hydrocarbons during nonthermal plasma reaction at 100 W power input. Methane flow rate = 25 mL/min at 120 °C. Details of the experimental conditions are available [70].
Catalysts 13 01287 g016
Figure 17. The effect of microwave irradiation and plasma generation in air on the development of morphological heterogeneity in BaTiO3. Experimental conditions: Irradiation time = 2 min with periodic cooling to room temperature followed by another irradiation period repeated 5 times, Microwave power = 1800 W. (a) Crystalline micro-plates with lattice exudates; (scale bar = 100 nm) (b) Transformation of crystalline micro-plates to amorphous micro-plates. It also shows the surface structure above the micro-plates; (scale bar= 500 nm) (c) Fully transformed amorphous micro-plates; (scale bar = 100 nm).
Catalysts 13 01287 g017
Figure 18. EDS analysis of the SiO2-supported high-entropy spinel oxide catalyst with nominal composition [Cr] = [Fe] = [Co] = [Cu] = [Zn] = 0.1 and [Si] = 0.5. (a) Electron image; (b) Si-mapping; (c) Cr-mapping; (d) Fe-mapping; (e) Co-mapping; (f) Cu-mapping; (g) Zn-mapping.
Catalysts 13 01287 g018
Figure 19. Illustration of surface decorations by SEM and associated XRD-spectra of silica-supported single Co and Cu catalysts or their binary combinations under different processing conditions. (a) Co/Si = 1/4 A (1 kW); (b) Co/Cu/Si = 1/1/8 A (1 kW); (c) Co/Cu/Si = 1/1/8 A (1 kW) B (TA = 600 °C, 2 h); (d) Co/Cu/Si = 1/1/8 A (1.8 kW); and (e) Cu/Si = 1/4 A (1.8 KW).
Catalysts 13 01287 g019aCatalysts 13 01287 g019b
Figure 20. Structure of the decorations on the surface and small pores of the SiO2 supported Co/Cu binary catalyst Co/Cu/Si = 1/1/8 A (1 kW) (a) Free surface structure at low magnification, Scale bar = 50 μm) (see Figure 19c for high magnification); (b) Pore surface structure (Scale bar = 5 μm).
Catalysts 13 01287 g020
Figure 21. Surface structure of microwave irradiated BaTiO3 particles that generate plasma during irradiation. (a) Overall surface showing two different surface morphologies and the locations of the EDS analysis (Scale bar = 1 mm); (b) Dust-free surface, Location-1 (Scale bar = 10 μm); (c) Dusty surface, Location-2 (Scale bar = 100 μm).
Catalysts 13 01287 g021aCatalysts 13 01287 g021b
Figure 22. Model for BaTiO3 (100) surface. (a) BaO-termination; (b) TiO2-termination.
Catalysts 13 01287 g022
Figure 23. 1D representation of active sites on TiO2 terminated BaTiO3−x{#}x (100) surface.
Catalysts 13 01287 g023
Figure 24. SEM images of Co/Si = 2/1 catalyst-coated BaTiO3. (a) Overall appearance and surface structure (Scale bar = 100 μm); (b) Surface at a higher magnification showing the detail of the Co3O4 morphology (Scale bar = 1 μm); (c) Appearance of BaTiO3 below the Co3O4 surface coating showing the porogenesis of ca. 2 μm particles ejected from a large BaTiO3 particle (Scale bar = 1 μm); (d) Detail of the BaTiO3 particle surface at higher magnification (Scale bar = 1 μm).
Catalysts 13 01287 g024
Figure 25. Flow diagram of integrated processes for self-contained biomass-based sustainable circular technology for the production of power, H2, HNO3, NH3, urea and symbiotic-smart fertilizers from air (A) and water (W) with CO2 utilization. Individual unit processes are: (1) Gasifier with in situ oxygen-nitrogen separation, bio-ash (BA) recycle (as catalyst) and two-stage syngas cleaning, SC-1 (for power generation) and SC-2 (for syngas conversion to ammonium carbamate (AC), urea and symbiotic-smart fertilizers (S-F); (2) Plasma-generating chemical-looping silica supported catalyst packed plasma reactors RP-1 (plasma nitrogen fixation with NO generation) and RP-2 for catalyst regeneration (with periodic water injection) and hydrogen production; (3) Multi-Reaction Zone Reactor (M-RZR) operating with plasma for direct conversion of syngas to ammonia or ammonia based fertilizer using soil additives—acid carriers (SA-AC) such as sulfonated PolyHIPE Polymers; (4) NO generated in PR-1 together with unreacted nitrogen are oxidized with oxygen in the Nitric Acid Reactor (NAR) to produce HNO3 and the unreacted nitrogen and oxygen are returned to the Plasma Reactor-3 (PR-3). Bio-ash (BA) and Bio-tar (BT) from the gasifier are utilized in agriculture as nutrients and herbicides while the agricultural and biowaste provide the feedstock for the gasifier. Bio-ash is also recycled into the gasifier as a source of a cocktail of catalysts. Renewable feedstock is indicated by cyan coloring and the products are highlighted in yellow.
Catalysts 13 01287 g025
Table 1. Proximate and ultimate analysis of the wood fuel used in the 2 MWe gasifier based on Dogru and Akay design [114].
Proximate Analysis & Physical PropertyUltimate Analysis & Heating Values
Moisture Content (wt%)12.8Carbon (wt%)45.1
Volatile matter (wt% db *)63.8Hydrogen (wt%)6.1
Fixed carbon (wt% db *)18.7Oxygen (wt%)44.5
Absolute density (kg/m3)841Nitrogen (wt%)0.6
Bulk density (kg/m3)283Sulfur (wt%)0.4
Approximate wood chips size (cm)10Ash content (wt% db)3.3
High Heating Value (HHV) MJ/kg17.9
Low Heating Value (LHV) MJ/kg16.6
* db = Dry basis.
Table 2. Syngas composition from a large experimental 2 MWe fixed-bed down-draft gasifier fueled by wood waste and air and subsequently water scrubbed for electricity generation using gas engine (Janbacher GmbH, Frankenthal, Germany) power generators. The effluent composition from the generator is compared with the European Waste Incineration Directive (EWID) limits.
Syngas Composition before Water ScrubbingEffluent Gas Composition from Gas Engine Generator
Parameter(Vol %)ParameterMeasuredEWID Limits
H213.7Particulates mg/Nm3<510
CO16.2Total Organic Carbon mg/Nm3<310
CH42.0HCl mg/Nm3<5.610
C2+0.2HF mg/Nm3<0.451
O22.6SO2 mg/Nm3<3850
H2O3.1NOx mg/Nm3<240400
CO212.4CO mg/Nm3<100Site specific
N252.8Total Heavy Metals mg/Nm3<0.250.5
Tar5.0 g/Nm3Hg mg/Nm3<0.010.05
LHV5.2 MJ/Nm3Cd +TI mg/Nm3<0.0070.05
Particulates10 g/Nm3Dioxins & Furans ng/Nm3<0.0020.1
Table 3. Summary of the multi-oxidant up-down gasifier performance with or without water injection.
Oxidant
Status
Range of Dry Gas Composition (Vol %)Average
H2/CO
Ratio
Average
H2/N2
Ratio
Average
Cold Gas
Efficiency
(%)
Average LHV
(MJ/Nm3)
H2COCH4CO2C2HnN2
Without Water10–1412–172–48–120–158–470.830.22786.0
With Water35–3727–305–712–150–110–211.32.38912.4
Table 4. Summary of model syngas cleaning/tar removal by using electric field with or without isolated electrodes and sulfonated PolyHIPE Polymer (s-PHP).
Electrode Type →Full Electrode InsulationPartial Electrode Insulation
Applied Voltage (kV)0102501025
Efficiency without s-PHP (%)19.1 ± 1.221.8 ± 1.330.1 ± 1.819.6 ± 1.280.1 ± 1.697.5 ± 1.3
Efficiency with s-PHP (%)61.8 ± 3.867.3 ± 4.278.2 ± 4.562.1 ± 3.886.6 ± 2.698.7 ± 0.9
Table 5. Variation of CO2 conversion with plasma power under various electrode configurations (EC-1 to EC-4) using BaTiO3 particles (3 mm) with or without SiO2 supported Ni0/NiO catalyst (denoted as Ni/Si = 1/4 Mw-ABC [67,82,83]) obtained by the co-assembly of support and catalyst during combined flow and microwave radiation induced co-assembly from solution [67,92,93]. In all cases, CO2 flow rate is 50 mL/min.
Plasma Power (W)CO2 Conversion under Different Electrode Configurations
EC-1a from Ref [87]EC-2EC-3EC-4
BaTiO3 +
Catalysts
BaTiO3 OnlyBaTiO3 Only
4612.710.016.315.610.6
6616.812.919.819.816.0
8619.716.122.924.319.6
10623.018.826.4-23.6
Table 6. The effect of flow rate on CO2 conversion in a 3 mm diameter BaTiO3 packed DBD reactor under electrode configuration EC-2 at plasma power of 86 W.
Flow Rate (mL/min)255075100
CO2 Conversion (mol%)27.216.113.110.3
Table 7. Effect of N2 concentration and flow rate on CO2 conversion in a BaTiO3 packed DBD reactor under electrode configuration, EC-1 at power 106 W.
Total Gas Flow Rate (mL/min) →5050751005050505050505050
N2 Concentration, (mol%) →02.52.52.5510202550759093
EA—Apparent CO2 conversion (mol%)18.829.921.016.231.033.034.635.741.647.047.447.6
EE—Effective CO2 conversion (mol%)18.829.220.515.829.529.727.726.820.811.84.743.33
Table 8. The effect of plasma power on CO2 conversion at a fixed total flow rate of 50 mL/min and N2 concentration of 50% in a BaTiO3 packed DBD reactor.
Plasma power (W)254650667586100106
EA—Apparent CO2 conversion (mol%)13.321.722.429.431.836.839.241.6
EE—Effective CO2 conversion (mol%)6.6510.911.214.715.916.416.920.8
Table 9. Catalytic plasma reaction of hydrogen-enriched model syngas in DBD reactor: Plasma power = 104 W; Electrode configuration = EC-1; Reactor wall temperature = 100 °C.
Before ReactionAfter Reaction
Total gas flow rate = 50 mL/minTotal gas flow rate = 35.8 mL/min
Inlet compositionProduct composition (measured)
CO2 = 10%;CO2 =11.3%C2 = 0.6%
H2 = 40%;H2 = 24.9%C3 = 0.03%
CH4 = 4%CH4 =18.3%C4 = 0.21%
CO = 10%CO = 2.0%C5 = 0.01%
N2 = 36%N2 = 42.7%
[H2]/[N2] = 1.11[H2]/[N2] = 0.58Solid product:
(NH2)COO(NH4)
Table 10. Concentration of constituents of microwave irradiated barium titanate at different locations. RO = [O]/([Ba] + [Ti]). Domain-(0) represents fresh stoichiometric BaTiO3; Domains-(1)–(5) are defect rich material.
Domain Type[O][Ba][Ti][N][Ba]/[Ti]RO
(0)  Fresh BaTiO30.6110.1960.1930.001.021.57
(1)  O-depleted; N-free0.3330.3430.3240.001.060.50
(2)  O-rich; N-free0.6760.1650.1590.001.042.09
(3)  Dusty surface: O-poor; N-rich0.5810.1280.1400.1510.9142.17
(4)  O-rich; N-poor0.6780.1360.1160.0701.172.69
(5)  O-rich; N-rich; Ti-depleted0.6800.0940.0070.21913.46.73
Table 11. Distribution of elements on the catalyst surface for ((Σ [M(n)])/[Si] = 1) catalyst when the input composition is: [Cr] = [Fe] = [Co] = [Cu] = [Zn] = 0.1 At% and [Si] = 0.5 At%.
ElementsSiCrFeCoCuZn
At %34.113.113.423.814.51.1
Table 12. Summary of the XRD and surface EDS analysis of Co/Si = 1/4 A; Cu/Si = 1/4 A and Co/Cu/Si = 1/1/8 A catalysts.
SampleCrystallite Size at Dominant Peak *
(nm)
EDS Analysis: Atomic Fractions at Decorative and Plain Surfaces +
Decorations (Flowers)Plain
Co3O4CuOCoCuSiCo + Cu
Si
CoCuSiCo + Cu
Si
Co/Si = 1/4 A
(1 kW)
9.20 0.06010.00.1930.3110.04770.00.2080.229
Cu/Si = 1/4 A
(1.8 kW)
11.70.00.1720.2040.8430.00.1080.2520.429
Co/Cu/Si=1/1/8(AB)
** Thermal@300 °C
11.825.30.08990.1210.1022.060.04510.03560.1910.424
Co/Cu/Si = 1/1/8 A
(1 kW)
6.4811.60.03610.05210.1910.4620.02520.02410.1820.271
Co/Cu/Si = 1/1/8 A
(1.8 kW)
5.467.930.0950.2350.1033.240.0480.0450.3230.288
Co/Cu/Si = 1/1/8 AB
(1 kW + 600 °C)
11.735.10.02510.02630.2090.2450.02450.02700.1950.264
EDS results for nanoplates (Spot-1)0.03020.1370.1780.939See Figure 19c SEM for identification of spot analysis
Notes: * Dominant diffraction peaks: 2θ = 35.6° (CuO) and 2θ= 36.8° (Co3O4). + Balance of the atomic fraction sums represents the oxygen content of the samples. ** This sample was prepared by the thermal method when the catalyst and catalyst support fluid were heated at 300 °C for 10 min.
Table 13. Summary of the XRD and surface EDS analysis of Fe/Si = 1/4 AB; Co/Fe/Si = 1/1/8 A and Co/Fe/Si = 1/1/8 AB.
CatalystCrystallite Size at Dominant Peak * (nm)Surface Composition +
(At. Fraction)
Co3O4Fe3O4CoFeSiCo + Fe
Si
Fe/Si = 1/4 AB-3.860.00.0780.1750.446
Co/Fe/Si = 1/1/8 A8.743.930.0260.0350.1950.313
Co/Fe/Si = 1/1/8 AB11.06.580.0240.0250.1760.278
Notes: * Dominant diffraction peaks [278,279,280,281,282,283,284,285,286,287,288,289,290,291,292,293,294,295,296,297,298,299,300,301]: 2θ= 35.6° (Fe3O4) and 2θ= 36.8° (Co3O4). + Balance of the atomic fraction sums represents the oxygen content of the samples.
Table 14. Compositional heterogeneity of the plasma dust particles at Locations 1 and 2.
Location (See SEM in Figure 21a)Concentration
(Atomic Fraction)
[Ba]/[Ti]RO
[Ba][Ti][O][N]
Location-1 (Particles in nm size range)0.2170.2300.4800.0730.9431.07
Location-2 (Particles in μm size range)0.1270.1400.5820.1510.9072.18
Table 15. The effect of reactor configuration and catalyst on ammonia synthesis efficiency.
Number-
Plasma &
Process Type
CatalystH2
N2
Flow
Rate
(mL
min)
Outlet
Conc.
Cout
(mol%)
Power
(W)
EC
Energy Cost
(MJ/mol-NH3)
RefET (n = 1) EC/Cout
(MJ/mol2)
1-RF (0.01 Atm)Au 19.1300264[372]1381
2-DBD-1BaTiO33253.893143[69]3763
3-DBD-2BaTiO33253.877112[69]2947
4-DBD-1Ni/Si = 1/43256.4115132[69]2063
5-DBD-2Ni/Si = 1/4
BaTiO3
3256.48781[69]1266
6-DBD-1Ni/S = 1/4
BaTiO3
3259.0195137[69]1522
7-DBD-2Ni/Si = 1/4
BaTiO3
4505.411442.2[3]781
8-DBD-M-RZRNi/Si = 1/4
BaTiO3
45019.47513.2[3]68.0
9-DBD-Catalyst shieldNi/MCM-13405.34051[373]962
10-Haber-BoschFe3-8–15-0.5[3]6.25–3.33
Disclaimer/Publisher’s Note: The statements, opinions and data contained in all publications are solely those of the individual author(s) and contributor(s) and not of MDPI and/or the editor(s). MDPI and/or the editor(s) disclaim responsibility for any injury to people or property resulting from any ideas, methods, instructions or products referred to in the content.

