
ZnO/TiO2 Composite Thin-Film Photocatalysts for Gas-Phase Oxidation of Ethanol
Chemical, Paper, and Biomedical Engineering Department, Miami University, Oxford, OH 45056, USA
*
Author to whom correspondence should be addressed.
Catalysts 2023, 13(8), 1203; https://doi.org/10.3390/catal13081203
Submission received: 13 July 2023
/
Revised: 1 August 2023
/
Accepted: 8 August 2023
/
Published: 11 August 2023
(This article belongs to the Special Issue Photocatalysis in Air Purification)
Abstract
:The aim of this project is to investigate the photocatalytic activity of ZnO/TiO2 composite films for the gas-phase oxidation of ethanol. Pure TiO2, pure ZnO, and their composites were formulated using a sol-gel synthesis method, and the resulting powders were cast and dried as thin films in a flat-plate ultraviolet light-emitting diode (UV LED) reactor. P25 TiO2 and commercially available ZnO were also used for comparison. The structural, morphological, and optical characteristics of the materials were characterized. The photocatalytic oxidation of ethanol vapors in air after 24 h of reactor operation was used to assess the relative photocatalytic activity of the ZnO/TiO2 composite films. Our results show that as ZnO content increased in the coupled semiconductor materials, the apparent photocatalytic activity decreased. In this study, pure ZnO (both sol-gel and purchased) had the least photocatalytic activity for vapor-phase ethanol oxidation in our test apparatus. For gas-phase photocatalysis, surface area was shown to be a critical feature for photocatalytic activity. However, the inherent photocatalytic activity of the materials was not decoupled from the effects of surface area in this study.
1. Introduction
Both titanium dioxide (TiO2) and zinc oxide (ZnO) are semiconductor materials that have been researched as photocatalysts for over 50 years [1,2,3]. TiO2 has been extensively researched as a photocatalyst due to its unique and beneficial properties, including its optical and electronic properties, chemical stability, low cost, and non-toxicity [3,4,5]. ZnO has also been researched as a photocatalyst, and reviews of ZnO as a photocatalyst have been published [6,7,8,9]. It has similar optical properties as TiO2, but ZnO has a higher light absorption efficiency across a larger fraction of the solar spectrum compared with TiO2. In addition, ZnO has antifouling and antibacterial properties [6,9]. The research question that this study addresses is whether TiO2 and ZnO can be coupled into composite materials to combine the benefits of each of the semiconductors and ultimately enhance their apparent photocatalytic activities for gas-phase applications.
1.1. Photocatalysis
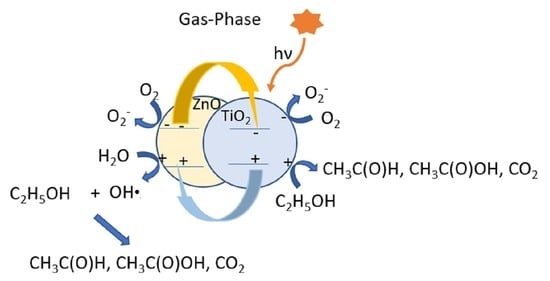
Photocatalysis is a process in which light activates a catalyst. The mechanism for photocatalysis is described by many researchers [10,11,12,13,14,15], and it is pictorially described in Figure 1 and in Equations (1)–(13).
In photocatalysis, the absorption of light by photocatalysts at sufficient energy to overcome its bandgap will generate an electron-hole pair (Equation (1)).
The electron, , jumps to the conduction band (cb), whereas the hole, , is left in the valence band (vb) of the electronic structure of the photocatalyst. These charges migrate to the surface of the photocatalyst, where they undergo redox reactions.
The hole ( will oxidize adsorbed water or a hydroxyl group at the surface, forming a hydroxyl radical, as shown in Equations (2) and (3).
The hole ( can also react with adsorbed organic compounds (RH), forming an organic radical, as shown in Equation (4).
The hydroxyl radicals subsequently react with adsorbed organic compounds (RH), ultimately resulting in carbon dioxide and water, as shown in Equation (5).
The electron ( will reduce an adsorbed oxygen molecule or other electron scavenger at the surface of the photocatalyst to produce a superoxide anion, as shown in Equation (6).
The superoxide anion, , can further react to form a peroxy radical and ultimately hydrogen peroxide, as shown in Equations (7)–(9) [17,18,19,20].
Hydrogen peroxide, however, can adsorb back onto the photocatalyst and be either reduced (Equation (10)) or oxidized (Equations (11) and (12)) [17,18,19,20].
The recombination of generated electrons and holes is depicted in Equation (13) and accounts for the inefficiency in the photocatalysis process.
1.2. Comparison of TiO2 and ZnO Photocatalysts
Both TiO2 and ZnO are wide-bandgap semiconductors, such that ultraviolet light (λ < ~380 nm) must be used to activate the photocatalysts. TiO2, in its anatase crystal form, is an indirect bandgap semiconductor that has a band gap of ~3.2 eV; the bandgap of the rutile crystal structure is ~3.0 eV [21]. ZnO is a direct bandgap semiconductor, which has a similar bandgap that can range from 3.1 eV to 3.37 eV [22]. Due to the differences in electronic energy structure, direct bandgap materials tend to have stronger light absorption properties and higher rates of electron-hole recombination than indirect bandgap semiconductors [23]. Therefore, ZnO, as a direct bandgap material, has stronger light absorption properties across a larger fraction of the solar spectrum compared with anatase TiO2 [6], but it also has a higher rate of electron-hole recombination than anatase TiO2 [7]. In both TiO2 and ZnO, the recombination of photo-generated electrons and holes within the semiconductor particles significantly lowers the efficiency of the photocatalytic process. The similarity between TiO2 and ZnO photocatalysts and their relative advantages with respect to photocatalysis motivated this study.
1.3. Methods to Improve Photocatalytic Efficiency
Numerous approaches to improving the photocatalytic efficiencies of ZnO and TiO2 have been investigated, including doping the semiconductor photocatalysts with metals and non-metals, incorporating the photocatalysts on supports, and coupling semiconductors [5,6,15,24]. All of these photocatalyst modification methods have the potential to enhance the photocatalytic activity by increasing the charge separation, decreasing the rate of electron-hole recombination, and shifting the light absorption range towards visible light [5,6,15,24].
Focusing on one approach here, the coupling of semiconductors has been investigated by researchers to reduce electron-hole recombination [3,5,25,26,27]. According to Ramírez-Ortega et al. (2014), an appropriate combination of the semiconductor materials can promote the transfer of photogenerated electrons from the conduction band of one semiconductor to that of the other and photogenerated holes from the valence band of one semiconductor to that of the other, which ultimately acts to enhance the charge separation and reduce the rate of electron-hole recombination [27]. Serpone et al. (1995) demonstrated that photogenerated electrons and holes can transfer from one semiconductor to another in coupled semiconductor systems [28]. The coupling of many different types of semiconductors has been investigated to improve photocatalytic efficiency [5,26,28], including the coupling of ZnO and TiO2 [29,30,31,32,33,34,35,36,37,38,39,40,41,42,43,44,45,46,47,48,49,50,51,52,53,54,55,56].
The coupling between TiO2 and ZnO semiconductors has been extensively researched, including for photogenerated charge formation and separation [40,41,44,45], for water splitting and hydrogen generation [47,48], for disinfection [32], and for removing dyes and other organic contaminants from water [29,35,36,37,38,43,46,49,50,55]. In most published studies, the ZnO/TiO2 composites have shown higher activity than that observed for pure ZnO and pure TiO2 [35,36,37,38,39,43], and the enhanced activity has been correlated with enhanced charge separation and lower rates of electron-hole recombination. However, very few articles have researched ZnO/TiO2 composite materials for gas-phase photocatalysis applications.
1.4. Photocatalysis in Gas-Phase Applications
TiO2 has been extensively studied for gas phase photocatalytic oxidation of volatile organic carbon compounds (VOCs) [15,24,57,58,59,60,61]. As stated by Zhong and Haghighat (2015), problems associated with gas-phase photocatalysis include photocatalyst deactivation, moderate removal efficiencies of VOCs, and partial oxidation by-products [57].
Photocatalyst deactivation occurs due to a buildup of by-products on the surface of the photocatalyst. The process is reversible if the by-products can be oxidized further by photocatalytic mechanisms (e.g., by hydroxyl radical attack). However, irreversible deactivation may also occur when non-oxidizable compounds build up on the surface, thus blocking adsorption and active sites on the photocatalyst [58].
According to Xu et al. (2022), the low quantum efficiency of photocatalysts restricts their practical application [24]. Therefore, strategies to improve the efficiency of the photocatalyst or to enhance charge separation to reduce the rate of electron-hole recombination have been researched, as described in Section 1.3 above. In addition, the surface area, morphology, and crystallinity of the photocatalysts also impact the efficiency of photocatalysis due to their roles in electron-hole generation and active site availability, in the adsorption of water vapor and VOCs, in mass transport processes, and in the desorption of by-products [24].
Studies on the use of ZnO or ZnO/TiO2 composite photocatalysts for gas-phase photocatalytic applications are relatively few [15,52,62,63,64]. In a review by Almaie et al. (2022), ZnO nanoparticles are one of the most promising candidates for VOC removal [15]. However, most of the cited studies in which ZnO was investigated as a gas-phase photocatalyst included those in which ZnO was doped with metals, coupled with or supported on a carbon-based material, or a metal oxide [15]. They concluded that more research is required to develop ZnO-based photocatalytic materials for the removal of VOCs [15]. A study by Liqiang et al. (2004) found that the photocatalytic activity of TiO2 is superior to that of ZnO with respect to activity and lifetime for the gas-phase photocatalytic oxidation of heptane [62]. Interestingly, Saucedo-Lucero and Arriaga (2015) investigated the deactivation of ZnO photocatalysts during the continuous degradation of hexane vapors and found that the accumulation of water vapor as well as by-product accumulation could be a reason for deactivation [63]. For both TiO2 and ZnO, photocatalyst deactivation is observed over time due to the buildup of partial oxidation by-products on the catalysts [15,24,59].
1.5. Photocatalytic Oxidation of Ethanol
The photocatalytic oxidation of ethanol vapors was used in this study to assess the apparent photocatalytic activity of the ZnO/TiO2 composite materials. The gas-phase photocatalytic oxidation of ethanol has been extensively investigated and published [65,66,67,68,69,70,71]. Muggli et al. (1997) used isotope labeling to identify reaction pathways for ethanol oxidation. They found that ethanol is oxidized to acetaldehyde, which either desorbs from the photocatalyst or is further oxidized to form acetic acid, formaldehyde, formic acid, and carbon dioxide [65]. This is supported by Coronado et al. (2003), who concluded that ethanol reacts with the surface of TiO2 to yield ethoxide complexes, and that acetates and formates are adsorbed on the photocatalyst surface as intermediates in the production of CO2 [66]. Takeuchi et al. (2010) found that ethanol and water vapors compete for photogenerated holes on TiO2, while adsorbed acetaldehyde and acetic acid oxidation rates are enhanced by the addition of water vapor, suggesting that they are oxidized predominantly by the hydroxyl radical [69]. Verbruggen et al. (2012) investigated factors that drive the photocatalytic oxidation of acetaldehyde. They note that acetaldehyde is readily oxidized to carbon dioxide and water when there are high concentrations of photogenerated holes available. In contrast, under low concentrations of photogenerated holes, acetic acid is found as an intermediate [72].
In this study, pure TiO2, pure ZnO, and ZnO/TiO2 composites were formulated and synthesized using a sol-gel method, and the resulting powders were used as thin films in a UV LED photocatalytic reactor. Commercially available Evoniks P25 TiO2 photocatalysts and Fisher Scientific ZnO were also used for comparison. The photocatalytic oxidation of ethanol vapors in air after 24 h of continuous reactor operation was used to assess the relative photocatalytic activity of the ZnO/TiO2 composite films. The effects of ethanol vapor flow rate, concentration, residence time, and ZnO/TiO2 compositions on the rate of ethanol vapor oxidation were investigated.
2. Results
2.1. Photocatalyst Characterizations
2.1.1. X-ray Diffraction (XRD)
XRD patterns of the TiO2-based and ZnO-based photocatalysts used in this study are shown in Figure 2a,b, respectively. As shown in Figure 2a, Evonik P25 TiO2 has a crystal structure that contains both anatase and rutile, reported to be in a ratio of approximately 4 to 1 [73,74,75,76,77,78]. The sol-gel TiO2-based photocatalysts are predominantly anatase, as indicated by the predominant peaks in Figure 2a at Bragg angles of 25.4°, 37.9°, 48.1°, 54.2°, 55.0°, and 62.9°. In 100T0Z, there appears to be a small peak at 30.8°, which represents the brookite crystal phase of TiO2. In 90T10Z, there appears to be a small peak at 27.6°, indicating the presence of rutile TiO2. The 75T25Z photocatalyst, however, appears to be a mixture of crystal phases, with predominantly ZnTiO3 and smaller amounts of anatase and rutile TiO2. Interestingly, none of the ZnO/TiO2 composite materials prepared for this study have peaks in their XRD profiles that are representative of ZnO. This suggests that ZnO in the composite materials was either amorphous or the ZnO crystal structures were below the detection limit of the XRD. As shown in Figure 2b, both 0T100Z and the commercially available ZnO used in this study have a similar zincite crystal structure, as indicated by the predominant peaks at 31.7°, 34.4°, 36.2°, 47.5°, 56.6°, 62.8°, and 67.9°.
The crystallite sizes of all photocatalysts were calculated based upon the predominant peaks in the XRD profiles (25.3° for anatase TiO2, 32.7° for ZnTiO3, and 36.2° for ZnO) and using the Scherrer equation, which is provided in Equation (14) [77,78].
In Equation (14), D is the diameter of the crystal (nm), K is a shape factor near unity (assumed to be 0.9), λ is the wavelength of the X-ray used for the XRD (0.154 nm for Cu X-ray emission source), β is the full width of the peak at half maximum (in radians), and θ is the Bragg angle of the peak. As summarized in Table 1, the crystal size for P25 TiO2 was approximately 23 nm, whereas the sol-gel TiO2-based photocatalysts that were predominantly anatase were smaller (<20 nm). The crystal sizes of ZnTiO3 in 75T25Z and ZnO in 0T100Z were much larger at approximately 41 nm. The crystal size of the purchased ZnO photocatalyst was approximately 70 nm, the largest crystal size of the photocatalysts used in this study.
2.1.2. Scanning Electron Microscopy (SEM) and Energy Dispersion Spectrometry (EDS)
SEM images of the sol-gel samples are provided in Figure 3. All SEM micrographs were taken at magnifications of 30,000×. The TiO2-based catalysts have similar morphologies, which are agglomerations of partially sintered spherical particles. The spherical particles are less than 400 nm. There is very little difference in appearance between the particles in 100T0Z, 95T5Z, 90T10Z, and 75T25Z. However, the dispersion of “debris” increased as the ZnO content in the photocatalysts increased. The morphology of 0T100Z is much different than that of TiO2-based photocatalysts, as it contains micro-sized plate-like flower structures.
The elemental compositions (mass ratios of Zn/Ti) of the photocatalysts were obtained using EDS, and a comparison with the intended Zn/Ti mass ratios is made in Table 1. The proximity of the measured and intended Zn/Ti mass ratios supports the conclusion that the photocatalyst compositions were prepared as intended.
2.1.3. Bandgap Analyses
The bandgap analyses were conducted using diffuse reflectance UV-Vis spectrometry on powder samples of the photocatalysts. These data are shown in Figure S1 in the Supplementary Materials. The analysis methods described by Makuła et al. (2018) [79] were used to create Tauc plots from the diffuse reflectance data using Equations (15) and (16). For these analyses, all photocatalysts were treated as indirect semiconductors, except for 0T100Z and ZnO, which are direct semiconductors. The Tauc plots for the photocatalysts are shown in Figure 4 and Figure 5. The resulting bandgaps for the photocatalysts are summarized in Table 1.
In Equations (15) and (16), h is the Planck constant (4.1357 × 10⁻¹⁵ eV s), ν is the photon’s frequency (s−1), Eg is the band gap energy (eV), and B is a constant. The γ factor depends on the nature of the electron transition and is equal to 1/2 or 2 for the direct and indirect transition band gaps, respectively [79].
2.1.4. BET Surface Area
The BET surface area analyses of the photocatalysts used in this study are summarized in Table 1. They are based on adsorption isotherms of nitrogen at 77 K, which are provided in Figure S2. The specific surface areas generally decrease with increasing ZnO concentration in the ZnO/TiO2 composite photocatalysts, from nearly 50 m2/g for 100T0Z to 9 m2/g for 0T100Z. 100T0Z and P25 have similar specific surface areas of nearly 50 m2/g. The purchased ZnO has the smallest surface area at 3.5 m2/g.
2.1.5. FTIR Analyses
FTIR analyses were conducted on new and used photocatalysts in an effort to assess the functional organic groups that remain on the surface of the photocatalyst after use. Figure 6 compares new and used catalysts for 100T0Z after 28 days of use and ZnO after approximately 7 days of use. In both cases, the used catalysts have organic functional groups remaining on them after use, including C-H stretches at 2900–3000 cm−1, C-O stretches at 1260 cm−1, C-O stretches between 1000 and 1100 cm−1, and C-H stretches at 790 cm−1. In addition, there appear to be lower concentrations of adsorbed hydroxyl groups on the used photocatalyst surface, as indicated by the relative peaks between 3000 cm−1 and 3500 cm−1. While both photocatalysts had adsorbed species on their surfaces following use in the UV LED reactor, 100T0Z still had photocatalytic activity and was degrading more than 95% of ethanol vapor, whereas ZnO had very low activity overall in our test system for the photocatalytic oxidation of ethanol vapor.
2.2. Photocatalytic Performance for the Gas-Phase Oxidation of Ethanol
2.2.1. Adsorption of Ethanol Vapors and Initial Reactivity
Figure 7 shows breakthrough curves for the adsorption of ethanol vapor on newly prepared photocatalytic films. The CO2 concentration was obtained at the end of the experimental trial using an Amprobe CO2 meter. Figure 7a,b show the experimental results for P25 TiO2 and purchased ZnO, respectively.
A summary of the breakthrough trials is shown in Figure S3, and similar data for all photocatalysts are provided in the Supplementary Materials, Figure S4a–g. These trials demonstrate that all TiO2-based photocatalysts have initial photocatalytic activity, as indicated by the strong acetaldehyde formation and degradation with time after the UV LEDs were turned on. Table S1 summarizes the breakthrough times for all photocatalysts used in this study. Figure 8 compares the ethanol adsorption breakthrough times with the total surface area of the photocatalyst in the UV LED reactor, where breakthrough is defined as the time required for the outlet ethanol concentration to reach 30% of the inlet ethanol concentration. While we did not decouple the effects of surface area and surface chemistry, Figure 8 shows a strong correlation between the surface area of the photocatalyst and the adsorption of the ethanol in the reactor.
2.2.2. Photocatalytic Oxidation of Ethanol after 24 h on Steam
The gas-phase photocatalytic oxidation of ethanol after at least 24 h of reactor operation was used as a measure of the gas-phase photocatalytic activity of ZnO/TiO2 composite materials. P25 TiO2 and purchased ZnO were used for comparison. Figure 9, Figure 10 and Figure 11 graphically summarize the 24-h experimental data acquired in this study. Figure 9a–c show the ethanol conversion at three different ethanol flow rates into the reactor and at three different residence times. The three key results are as follows: (1) as ZnO content in the ZnO/TiO2 composite materials increases, their photocatalytic activity generally decreases for gas-phase ethanol oxidation; (2) as the ethanol flow rate into the reactor increases, the ethanol % conversion for lower-activity materials decreases; and (3) residence time has only a minor impact on the percentage of ethanol degraded under the conditions studied.
As the photocatalytic activity of the composite materials decreased, acetaldehyde and acetic acid concentrations in the reactor effluent increased. This is shown in Figure 10 for 95T5Z and in Figure S4a–f, in which ethanol conversions for each photocatalyst and their corresponding acetaldehyde and acetic acid selectivities are shown. These data support the reaction scheme proposed by Nimlos et al. (1996), where ethanol is oxidized sequentially to acetaldehyde, acetic acid, formaldehyde, formic acid, and ultimately carbon dioxide [67]. However, formaldehyde and formic acid were not detected in the reactor effluent stream in this study. The presence of acetic acid is also supported by Verbruggen et al. (2012), who indicated that lower concentrations of photogenerated electron-hole pairs on the photocatalysts would favor the formation of acetic acid as a partial oxidation product of ethanol [72].
Figure 11a,b show the ethanol conversion rate as a function of the ethanol flow rate into the reactor. Figure 11a represents the rate of reaction per illuminated area (the area of the reactor base covered by photocatalyst), which depends upon the reactor design. Figure 11b represents the rate of reaction per surface area of the photocatalyst in the reactor (the product of the mass of the photocatalyst and its specific surface area). In Figure 11a, the plots are linear for P25 and 100T0Z because the catalysts degraded ~100% of the ethanol vapor that entered the reactor. However, similar plots for the other photocatalysts had a Langmuir-Hinshelwood type of form [17,55,67,70]. Therefore, the experimental data were fit to a Langmuir-Hinshelwood kinetic expression, shown in Equation (17), using the sum of least squares method.
In Equation (17), r is the rate of ethanol oxidation (µmoles ethanol/min/m2), k is an apparent reaction rate constant (µmoles ethanol/min/m2), Ke is an adsorption equilibrium constant (m3/µmole), and Ce is the ethanol concentration in the reactor (µmoles ethanol/m3).
The model parameters used for each material are provided in Table 2. In Table 2, k′ is the apparent reaction rate constant when normalized to the illuminated area, whereas k″ is the apparent rate constant when normalized to the surface area of the photocatalyst in the reactor. Noted is that as ZnO composition increases in the ZnO/TiO2 composites, the apparent reaction rate constants (k′ and k″) decrease while the equilibrium coefficients, Ke, increase. In Figure 11b, it appears as if ZnO has the highest photocatalytic activity per unit surface area of catalyst. This result is similar to the results of Saucedo-Lucero and Arriaga (2013), who concluded in their study that ZnO had a higher hexane vapor degradation velocity than TiO2 when normalized to surface area [64]. However, as shown in Table 2, the apparent rate constant, k″, for ZnO, which is normalized to surface area, is quite low compared with those of pure TiO2 and ZnO/TiO2 composite materials.
3. Discussion
Coupling of semiconductors has been one method for improving charge separation and reducing the rate of electron-hole recombination in photocatalyst research. The coupling of ZnO and TiO2 semiconductors attempts several benefits, including higher photo-generation efficiency of electron-hole pairs, higher electron mobility, greater absorption of light across a wider range of wavelengths, and lower electron-hole recombination rates, among others. The benefits of longer lifetimes of electron-hole pairs in ZnO/TiO2 composite materials have been realized in liquid-phase applications [35,36,37,38,43]. However, very few publications have reported on the same composites for gas-phase applications [52]. A few researchers have suggested their consideration for air cleaning applications [9,30]. For example, in a review by Dhiman et al. (2022), the authors concluded that ZnO-based catalysts should be considered for air cleaning applications [9]. Pant et al. (2020) recommended that ZnO/TiO2 on carbon nanofibers may be a suitable photocatalyst for air purification [30]. These and other recommendations by researchers were the motivation for investigating ZnO/TiO2 composite materials for the gas-phase photocatalytic oxidation of ethanol. Table 3 summarizes the results of selected studies in which ZnO-based photocatalysts were used for gas-phase applications. It is noted that there appear to be some discrepancies in the published literature regarding the application of ZnO-based materials in gas-phase photocatalytic applications.
The results of this study show that the addition of ZnO to TiO2-based photocatalysts was detrimental to the gas-phase photocatalytic activity of the composite materials. As ZnO content in the composite materials increased, the apparent photocatalytic activity decreased for the gas-phase photocatalytic oxidation of ethanol. Similar results were also found by Liao et al. (2012) for the gas-phase photocatalytic oxidation of formaldehyde [52]. In our study, we also found that as the ZnO content in the composite materials increased, the specific surface areas of the composites decreased. A decrease in the specific surface area of the photocatalyst correlates with a smaller number of active sites on which ethanol vapor can adsorb and fewer active sites on which ethanol can react with photogenerated holes and hydroxyl radicals. This result is supported by Verbruggen et al. (2012), who concluded that available surface area on the photocatalyst is a prevailing factor in gas-phase applications [72]. Purchased ZnO and 0T100Z had the lowest apparent photocatalytic activity for the vapor-phase oxidation of ethanol, and they also had the lowest specific surface areas of the photocatalysts used in this study.
In the composite ZnO/TiO2 materials, ZnO content up to a Zn/Ti mass ratio of 0.15 did not significantly alter the morphology, crystallinity, crystal size, or band gap energy, all of which could impact the apparent photocatalytic activity of the materials. The morphologies of 100T0Z, 95T5Z, and 90T10Z appear to be comprised of similar agglomerations of sintered spherical particles. Their crystal structures are predominantly anatase TiO2, and the addition of ZnO to these materials decreased the anatase crystal size slightly.
Although it is understood that small changes in surface and bulk properties and morphology could impact photocatalytic activity, the decrease in surface area among these three photocatalysts appeared to be the most significant property that correlated with ZnO content and a reduction in apparent photocatalytic activity. However, the inherent photocatalytic activities of the composite materials were not decoupled from the effects of surface area in this study. While surface area is just one key property of photocatalysts, other properties, including crystallinity and crystal structure, morphology, and surface properties with respect to water and VOC adsorption, can impact the apparent and inherent photocatalytic activity of the materials.
For 75T25Z, significant structural changes were observed compared with the other TiO2-based composites. While the morphology and bandgap were similar to those of the other TiO2-based composite materials, the crystal structure of 75T25Z was a mixture of predominantly ZnTiO3 and smaller amounts of anatase TiO2 and rutile TiO2. In addition, the crystal size of the ZnTiO3 was much larger than that of the anatase crystal sizes in the other composite photocatalysts used in this study. Interestingly, 75T25Z had a similar specific surface area and apparent photocatalytic activity as 90T10Z. This further supports the idea that the specific surface area is an important photocatalyst characteristic for gas-phase photocatalytic activity.
While the photocatalytic activity of the ZnO/TiO2 composite materials decreased with increasing ZnO for the gas-phase photocatalytic oxidation of ethanol, these same materials were shown to have photocatalytic activity in the aqueous-phase photocatalytic oxidation of ethanol (Supplementary Materials, Figure S6 and Table S2). In addition, the purchased ZnO used in this study rapidly decolorized a methylene blue solution and had apparent activity similar to P25 (Figures S7 and S8). Therefore, the ZnO/TiO2 composite photocatalysts used in this study have significant photocatalytic activity in the aqueous phase, but they have shown relatively lower activity in the gas phase. Reasons for this observation have been considered, and they include the adsorption of water to trap photogenerated holes, the desorption of photogenerated by-products, and the role of H2O2 in the photocatalytic activity of the composite materials.
According to published literature, the formation of the hydroxyl radical due to the oxidation of adsorbed hydroxyl groups on the photocatalyst is a key step in the photocatalytic oxidation of organic compounds. In addition, adsorbed organic compounds can react directly with a photogenerated hole at the surface of the photocatalyst. In the gas phase, there is competitive adsorption between water vapor and the organic compound. Organic vapors would have to be adsorbed to the photocatalyst in gas-phase photocatalysis in order to react with the photogenerated hole or hydroxyl radicals. Our data shows that the lower surface areas of the ZnO-containing composite photocatalysts were detrimental to the extent of adsorption of ethanol on the surface of the photocatalyst. In addition, as surface area decreases, electron-hole pairs would have less active surface area on which to react with adsorbed molecules, and recombination of the photogenerated electrons and holes would occur more readily. In the aqueous phase, the surfaces of the photocatalysts are saturated with adsorbed water. Therefore, the concentration of adsorbed water, and hence the rate of hydroxyl radical formation, would be relatively constant.
As many researchers have found, coupling semiconductors may enhance charge separation and reduce electron-hole recombination rates [35,36,37,38,39,43]. This should also be beneficial to photocatalysis in gas-phase applications if the mass transfer rates (adsorption and desorption) and surface coverage (extents of adsorption) of water vapor and organic vapors are sufficient to take advantage of the enhanced charge separation. In this study, the benefits of charge separation in the composite ZnO/TiO2 photocatalysts were not realized in the gas phase.
Deactivation of photocatalysts occurs when partial oxidation products do not readily desorb from the photocatalyst [71]. This was observed in this study, as organic functional groups on the used photocatalysts were present (Figure 6). In addition, the presence of acetic acid in the reactor effluent infers that it is also present on the surface of the photocatalyst. Since acetic acid is much less volatile than ethanol and acetaldehyde, it is likely that acetic acid would desorb much more slowly from the photocatalyst surface. Therefore, the rate of oxidation and desorption of acetic acid and other partial oxidation by-products on the photocatalyst surface may have limited the apparent photocatalytic activity of the ZnO/TiO2 composite materials. This is supported by Sola et al. (2016), who found evidence of acetate species buildup on TiO2 during the gas-phase photocatalytic oxidation of ethanol [68]. The buildup of partial oxidation products on ZnO has also been reported as a mechanism for deactivation [62,63].
In the liquid phase, desorption of the partial oxidation by-products is assisted by the water acting as a solvent for the by-products as well as acting to replace the adsorbed partial oxidation by-products on the photocatalyst surface. While deactivation in the water phase may still occur, photocatalyst deactivation is much more significant in gas-phase applications [15,24,59].
The role of hydrogen peroxide (H2O2) on photocatalytic activity was investigated by several researchers [17,18,19,20,54]. It was found that H2O2 formed in the photocatalytic oxidation mechanism (Equations (8) and (9)) adsorbs onto TiO2 to either scavenge the electron (Equation (10)) or react with the hole to form hydroxyl radicals (Equation (11)). However, H2O2 adsorbs onto ZnO to a much lesser extent compared with TiO2 [17,54], and the formation of H2O2 in the liquid phase appears to correspond to the rate at which organic compounds are oxidized [54]. Differences in H2O2 formation and adsorption may have contributed to the apparent decrease in photocatalytic activity of ZnO/TiO2 composites as ZnO content increased.
4. Materials and Methods
4.1. Materials and Chemicals
All reagents were of analytical grade and used without any further purification. Zinc acetate dihydrate (98–101% grade) was purchased from Alfa Aesar; sodium hydroxide (98%) was purchased from Sigma-Aldrich; ethanol (100%) was purchased from Decon Laboratory Inc.; titanium (IV) tetra-isopropoxide (97%) was purchased from Aldrich Chemicals; titanium dioxide (P25 TiO2) was purchased from Evonik Industries; and zinc oxide (ZnO) was purchased from Fisher Scientific.
4.2. Sol-Gel Synthesis of Pure and Composite TiO2 and ZnO Photocatalysts
A sol-gel synthesis method, depicted in Figure 1, was used to synthesize the ZnO and TiO2 photocatalysts and the composites in ZnO/TiO2 mass ratios of 0.05; 0.1; and 0.25. The ZnO sol was prepared by a modified procedure described by Lee et al. (2009) [82] and J.N. Hasnidawani et al. (2016) [83]. In brief, 26.95 g Zn acetate dihydrate was added to 100 mL deionized water. An amount of 9.87 g NaOH was dissolved in 20 mL deionized water. These two solutions were mixed and magnetically stirred for 1 h. The resulting solution was added to 50 mL ethanol, ultrasonically stirred for 30 min, and magnetically stirred for an additional hour. This final mixture was aged 24 h before use.
The TiO2 sol was prepared based on the procedure published by Cano-Casanova et al. (2018) [84]. In this procedure, 37 mL of titanium tetra-isopropoxide was mixed with 29.15 mL absolute ethanol. After magnetically stirring for 1 h, this solution was mixed with a solution containing 15 mL concentrated hydrochloric acid and 15 mL absolute ethanol dropwise. This final solution was ultrasonically stirred for 30 min, followed by magnetic stirring for 1 h.
The final TiO2 and ZnO solutions above were mixed in the appropriate ratios and stirred for 1 h to synthesize the composite photocatalysts. The mixtures were then dried for 12 h at 100 °C. The dried powders were washed with deionized water and dried again at 100 °C for 12 h. Finally, the powders were calcined at 550 °C for 2 h.
The samples prepared for this study are summarized in Table 1. The sample notation used in this study indicates the relative mass ratios of TiO2 and ZnO in the composite materials. For example, 90T10Z indicates a nominal ratio of 90 mass% TiO2 and 10 mass% ZnO in the composite material.
4.3. Characterization Techniques
The catalysts were characterized for morphology, elemental composition, crystallinity and crystal phase, surface area, and bandgap. The morphology of each photocatalyst was investigated using a Zeiss Supra 35 VP FEG SEM. The images were taken at 30,000× magnification. The surface composition of each photocatalyst was analyzed using electron dispersive spectroscopy (EDS) (attached to Zeiss Supra 35 VP FEG SEM) taken at 20 KeV with an aperture size of 120 µm. Powder X-ray diffraction (XRD) analyses were conducted on all the photocatalysts using Bruker D8 X-ray diffractometer. Crystalline phases and space groups were investigated using the software Diffrac EVA. The band gap analysis was carried out on diffuse reflectance spectra collected between 200 nm and 700 nm for each sample using UV/VIS/NIR Lambda 750 S spectrophotometer. Brunauer–Emmett–Teller (BET) surface area and pore-size distribution were collected using nitrogen adsorption in a Micromeritics TriStar BET surface area analyzer. Fourier transform infrared (Nicolet 670 FTIR, Thermo Electron Corporation, Waltham, MA, USA) analyses were conducted on selected photocatalysts before and after use in the UV LED photocatalytic reactor to characterize organic functional groups remaining on the photocatalyst in the UV LED photocatalytic devices.
4.4. Photocatalytic Reactor and Test System
The photocatalytic test system consisted of a UV LED reactor, a DC power supply, a mass flow controller to control the flow rate of air through the system, and a diffusion cell vapor generator, as shown in Figure 12a. A UV LED plate reactor was used to compare the performance of the photocatalysts. The base of the reactor (Figure 12b) was made of aluminum and had internal dimensions of 11.4 cm × 11.4 cm and a depth of 1.91 cm. The base of the reactor was coated with 0.5 g photocatalyst, using ethanol as a dispersant. Once air dried, the aluminum base with the photocatalyst was further dried in an oven at 105 °C for over 1 h. After removing the reactor base from the oven and allowing it to cool, the reactor was assembled for experimental trials.
The top of the reactor, or cover, was made of methyl methacrylate. The cover contained five equally spaced strips of UV-LEDs, as shown in Figure 12c. Each strip consisted of eleven 365 nm wavelength UV LEDs (3 LEDs/25 mm), and the strips were spaced approximately 1.7 cm apart. The UV LEDs were powered with a 12V DC power supply, and the total power to each reactor was approximately 7 W. The light intensity at the surface of the photocatalyst was approximately 4.5 mW/cm2 (see Figure S9). Two test systems were run simultaneously, as shown in Figure 12d.
Two types of experiments were conducted: (1) dark adsorption experiments followed by initial photocatalytic activity; and (2) photocatalytic activity after 24 h of continuous reactor operation. Each is discussed in turn below.
4.5. Photocatalytic Performance
4.5.1. Dark Adsorption and Initial Photocatalytic Activity
Ethanol vapor (100 ± 15 ppm) at 100 cm3/min was introduced to the reactor with the UV LEDs off, and the effluent ethanol concentration was measured with time. After the ethanol concentration reached at least 30% of the inlet ethanol vapor concentration, the UV LEDs were turned on, and the concentrations of ethanol and acetaldehyde were tracked with time for approximately 1 h.
4.5.2. Photocatalytic Activity after 24 h of Continuous Reactor Operation
Air flow rates (compressed house air with relative humidity between 15% and 40%) were maintained at 25, 50, or 100 cm3/min, and the path lengths of the diffusion cell vapor generator were varied to achieve three different ethanol diffusion rates at each air flow rate. After at least 24 h of continuous operation at each set of test conditions, gas samples from the inlet and outlet of the reactor were taken manually using a 250 μL gas-tight syringe and analyzed using a calibrated gas chromatograph (HP 5890) with a flame ionization detector (GC/FID). Three samples of the inlet and outlet were made for each set of test conditions.
5. Conclusions
The overall aim of this project was to investigate the gas-phase photocatalytic activity of ZnO/TiO2 composite films in a flat-plate ultraviolet light-emitting diode (UV LED) photocatalytic reactor. The photocatalytic oxidation of ethanol vapors in air after 24 h of reactor operation was used to assess the relative photocatalytic activity of the ZnO/TiO2 composite films. Our results show that as the ZnO composition in the photocatalytic film increases, the apparent photocatalytic activity decreases, and pure ZnO (both synthesized and purchased) had the least photocatalytic activity for vapor-phase ethanol oxidation in our test apparatus. The specific surface area of the photocatalysts was shown to be an important photocatalyst characteristic for gas-phase photocatalytic oxidation of ethanol. ZnO has a lower surface area and a larger crystal size than TiO2-based photocatalysts. Both of these features of ZnO compared with TiO2 lead to lower photocatalytic activity due to fewer adsorption sites for ethanol vapors and higher rates of electron-hole recombination. Differences in the formation, desorption, and degradation of partial oxidation by-products of ethanol have also contributed to the decrease in the apparent photocatalytic activity of ZnO-containing photocatalytic films.
Supplementary Materials
The following supporting information can be downloaded at: https://www.mdpi.com/article/10.3390/catal13081203/s1, Figure S1: Nitrogen adsorption isotherms at 77 K on the photocatalysts used in this study.; Figure S2: Breakthrough curves for the adsorption of ethanol vapor on the photocatalysts in the UV LED photocatalytic reactor. The experimental trials were conducted at 110 cm3/min air flow rate with inlet ethanol concentrations = 100 (±20) ppm.; Figure S3: Dark adsorption experiments followed by turning the LEDs on. Photocatalyst mass in the reactor = 0.5 g (±0.08) g. (a) P25 TiO2; (b) 100T0Z; (c) 95T5Z; (d) 90T10Z; (e) 75T25Z; (f) 0T100Z; (g) ZnO. Inlet ethanol concentration = 100 ppm (±20 ppm) at 110 cm3/min air flow rate; Figure S4: Ethanol conversion and selectivity of acetaldehyde and acetic acid for the various experimental trials conducted in this study. (a) P25 TiO2; (b) 100T0Z; (c) 95T5Z; (d) 90T10Z; (e) 75T25Z; (f) ZnO. 0T100Z is not included in this set of figures because the conversion of ethanol was < 10% in the first experimental trial, and further trials with it were not conducted; Figure S5: Diffuse reflectance data. (a) Diffuse reflectance vs wavelength. (b) Light absorption vs wavelength for photocatalysts, derived from diffuse reflectance data; Figure S6: Liquid-phase photocatalytic oxidation of ethanol in deionized water. Initial ethanol concentration = 180 mg/L. Photocatalyst concentration = 0.5 g/L. Light intensity = 3.2 ± 1.3 mW/cm2. (a) P25, ZnO, Control; (b) 100T0Z, 95T5Z, 90T10Z; (c) 75T25Z, 0T100Z; Figure S7: Photograph of experimental tests showing the decolorization of 0.01 mM methylene blue solution in deionized water. Photocatalyst = 0.5 g/L. Light intensity = 3.2 ± 1.3 mW/cm2; Figure S8: Qualitative image of the decolorization of 0.01 mM methylene blue in deionized water at (from left to right) 0 min, 5 min, and 13 min. Samples on the left are P25 samples. Samples on the right are ZnO samples; Figure S9: Light intensity as functions of placement and distance away from the UV LED cover; Figure S10: Gas-phase calibration of the GC/FID for ethanol vapors. (a). Peak area as a function of ethanol concentration in mg/L. (b). Peak area as a function of ethanol concentration in ppm. 250 µL injections of gas-phase samples. Table S1: Summary of experimental data acquired from photocatalytic oxidation of ethanol following adsorption experiments; Table S2: Summary of apparent first-order rate constants, kappt, for the photocatalytic oxidation of ethanol in water.
Author Contributions
Conceptualization, I.S. and C.B.A.; methodology, I.S. and C.B.A.; validation, I.S. and C.B.A.; formal analysis, I.S. and C.B.A.; investigation, I.S. and C.B.A.; resources, I.S. and C.B.A.; data curation, I.S. and C.B.A.; writing—original draft preparation, I.S.; writing—review and editing, C.B.A.; visualization, I.S. and C.B.A.; supervision, C.B.A.; project administration, C.B.A.; funding acquisition, I.S. and C.B.A. All authors have read and agreed to the published version of the manuscript.
Funding
This article was developed, in part, under Assistance Agreement No. SV-84001601-0 awarded by the U.S. Environmental Protection Agency to Miami University. It has not been formally reviewed by the US EPA. The views expressed in this document are solely those of the authors of this article and do not necessarily reflect those of the Agency. The EPA does not endorse any products or commercial services mentioned in this publication.
Data Availability Statement
Most data acquired for this manuscript are summarized in the Supplementary Materials. All other data can be obtained at the request of the corresponding author.
Acknowledgments
Thanks to Matt Duley for training on the SEM/EDS and to Doug Hart for assisting with laboratory equipment and space.
Conflicts of Interest
The authors declare no conflict of interest.
References
- Horikoshi, S.; Serpone, N. Can the photocatalyst TiO2 be incorporated into a wastewater treatment method? Background and prospects. Catal. Today 2020, 340, 334–346. [Google Scholar] [CrossRef]
- Coronado, J.M. A Historical Introduction to Photocatalysis. In Design of Advanced Photocatalytic Materials for Energy and Environmental Applications; Green Energy and Technology; Coronado, J., Fresno, F., Hernández-Alonso, M., Portela, R., Eds.; Springer: London, UK, 2013. [Google Scholar] [CrossRef]
- Schneider, J.; Matsuoka, M.; Takeuchi, M.; Zhang, J.; Horiuchi, Y.; Anpo, M.; Bahnemann, D.W. Understanding TiO2 photocatalysis: Mechanisms and materials. Chem. Rev. 2014, 114, 9919–9986. [Google Scholar] [CrossRef]
- Dharma, H.N.C.; Jaafar, J.; Widiastuti, N.; Matsuyama, H.; Rajabsadeh, S.; Othman, M.H.D.; Rahman, M.A.; Jafri, N.N.M.; Suhaimin, N.S.; Nasir, A.M.; et al. A Review of Titanium Dioxide (TiO2)-Based Photocatalyst for Oilfield-Produced Water Treatment. Membranes 2022, 12, 345. [Google Scholar] [CrossRef]
- Zhu, D.; Zhou, Q. Action and mechanism of semiconductor photocatalysis on degradation of organic pollutants in water treatment: A review. Environ. Nanotechnol. Monit. Manag. 2019, 12, 100255. [Google Scholar] [CrossRef]
- Ong, C.B.; Ng, L.Y.; Mohammad, A.W. A review of ZnO nanoparticles as solar photocatalysts: Synthesis, mechanisms and applications. Renew. Sustain. Energy Rev. 2018, 81, 536–551. [Google Scholar] [CrossRef]
- Qi, K.; Cheng, B.; Yu, J.; Ho, W. Review on the improvement of the photocatalytic and antibacterial activities of ZnO. J. Alloys Compd. 2017, 727, 792–820. [Google Scholar] [CrossRef]
- Hezam, A.; Drmosh, Q.A.; Ponnamma, D.; Bajiri, M.A.; Qamar, M.; Namratha, K.; Zare, M.; Nayan, M.B.; Onaizi, S.A.; Byrappa, K. Strategies to enhance ZnO photocatalyst’s performance for water treatment: A comprehensive review. Chem. Rec. 2022, 22, e202100299. [Google Scholar] [CrossRef]
- Dhiman, P.; Rana, G.; Kumar, A.; Sharma, G.; Vo, D.V.N.; Naushad, M. ZnO-based heterostructures as photocatalysts for hydrogen generation and depollution: A review. Environ. Chem. Lett. 2022, 20, 1047–1081. [Google Scholar] [CrossRef]
- Huang, Y.; Ho, S.S.; Lu, Y.; Niu, R.; Xu, L.; Cao, J.; Lee, S. Removal of indoor volatile organic compounds via photocatalytic oxidation: A short review and prospect. Molecules 2016, 21, 56. [Google Scholar] [CrossRef] [Green Version]
- Ren, G.; Han, H.; Wang, Y.; Liu, S.; Zhao, J.; Meng, X.; Li, Z. Recent advances of photocatalytic application in water treatment: A review. Nanomaterials 2021, 11, 1804. [Google Scholar] [CrossRef]
- Lin, L.; Chai, Y.; Zhao, B.; Wei, W.; He, D.; He, B.; Tang, Q. Photocatalytic oxidation for degradation of VOCs. Open J. Inorg. Chem. 2013, 3, 14–25. [Google Scholar] [CrossRef] [Green Version]
- Alberici, R.M.; Jardim, W.F. Photocatalytic destruction of VOCs in the gas phase using titanium dioxide. Appl. Catal. B Environ. 1997, 14, 55–68. [Google Scholar] [CrossRef]
- Zhao, J.; Yang, X. Photocatalytic oxidation for indoor air purification: A literature review. Build. Environ. 2003, 38, 645–654. [Google Scholar] [CrossRef]
- Almaie, S.; Vatanpour, V.; Rasoulifard, M.H.; Koyuncu, I. Volatile organic compounds (VOCs) removal by photocatalysts: A review. Chemosphere 2022, 306, 135655. [Google Scholar] [CrossRef] [PubMed]
- Almquist, C.B.; Kocher, J.; Saxton, K.; Simonson, L.; Danciutiu, A.; Nguyen, P.J.; Bain, J. A Novel Application of Photocatalysis: A UV-LED Photocatalytic Device for Controlling Diurnal Evaporative Fuel Vapor Emissions from Automobiles. Catalysts 2023, 13, 85. [Google Scholar] [CrossRef]
- Sahel, K.; Elsellami, L.; Mirali, I.; Dappozze, F.; Bouhent, M.; Guillard, C. Hydrogen peroxide and photocatalysis. Appl. Catal. B Environ. 2016, 188, 106–112. [Google Scholar] [CrossRef]
- Hirakawa, T.; Yawata, K.; Nosaka, Y. Photocatalytic reactivity for O2− and OH radical formation in anatase and rutile TiO2 suspension as the effect of H2O2 addition. Appl. Catal. A Gen. 2007, 325, 105–111. [Google Scholar] [CrossRef]
- Domènech, X.; Ayllón, J.A.; Peral, J. H2O2 Formation from photocatalytic processes at the ZnO/water interface. Environ. Sci. Pollut. Res. 2001, 8, 285–287. [Google Scholar] [CrossRef]
- Diesen, V.; Jonsson, M. Formation of H2O2 in TiO2 photocatalysis of oxygenated and deoxygenated aqueous systems: A probe for photocatalytically produced hydroxyl radicals. J. Phys. Chem. C 2014, 118, 10083–10087. [Google Scholar] [CrossRef]
- Nosaka, Y.; Nosaka, A.Y. Reconsideration of intrinsic band alignments within anatase and rutile TiO2. J. Phys. Chem. Lett. 2016, 7, 431–434. [Google Scholar] [CrossRef]
- Davis, K.; Yarbrough, R.; Froeschle, M.; White, J.; Rathnayake, H. Band gap engineered zinc oxide nanostructures via a sol–gel synthesis of solvent driven shape-controlled crystal growth. RSC Adv. 2019, 9, 14638–14648. [Google Scholar] [CrossRef] [PubMed]
- Wikipedia Contributors. Direct and Indirect Band Gaps. Wikipedia, The Free Encyclopedia. Available online: https://en.wikipedia.org/w/index.php?title=Direct_and_indirect_band_gaps&oldid=1105981718 (accessed on 12 July 2023).
- Xu, Z.; Ren, Y.; Deng, X.; Xu, M.; Chai, W.; Qian, X.; Bian, Z. Recent Developments on Gas-Phase Volatile Organic Compounds Abatement Based on Photocatalysis. Adv. Energy Sustain. Res. 2022, 3, 2200105. [Google Scholar] [CrossRef]
- Bai, L.J.; Gang, K.O.U.; Gong, Z.Y.; Zhao, Z.M. Effect of Zn and Ti mole ratio on microstructure and photocatalytic properties of magnetron sputtered TiO2–ZnO heterogeneous composite film. Trans. Nonferrous Met. Soc. China 2013, 23, 3643–3649. [Google Scholar] [CrossRef]
- Serpone, N.A.V.E.; Emeline, A.V. Semiconductor Photocatalysis Past, Present, and Future Outlook. J. Phys. Chem. Lett. 2012, 3, 673–677. [Google Scholar] [CrossRef] [PubMed]
- Ramírez-Ortega, D.; Meléndez, A.M.; Acevedo-Peña, P.; González, I.; Arroyo, R. Semiconducting properties of ZnO/TiO2 composites by electrochemical measurements and their relationship with photocatalytic activity. Electrochim. Acta 2014, 140, 541–549. [Google Scholar] [CrossRef]
- Serpone, N.; Maruthamuthu, P.; Pichat, P.; Pelizzetti, E.; Hidaka, H. Exploiting the interparticle electron transfer process in the photocatalysed oxidation of phenol, 2-chlorophenol and pentachlorophenol: Chemical evidence for electron and hole transfer between coupled semiconductors. J. Photochem. Photobiol. A Chem. 1995, 85, 247–255. [Google Scholar] [CrossRef]
- Krasteva, L.K.; Papazova, K.I.; Bojinova, A.S.; Kaneva, N.V.; Apostolov, A.A. Synthesis and characterization of ZnO and TIO2 powders, nanowire ZnO and TiO2/ZnO thin films for photocatalytic applications. Bulg. Chem. Commun. 2013, 45, 625–630. [Google Scholar]
- Rangkooy, H.A.; Jahani, F.; Siahi Ahangar, A. Photocatalytic removal of xylene as a pollutant in the air using ZnO-activated carbon, TiO2-activated carbon, and TiO2/ZnO activated carbon nanocomposites. Environ. Health Eng. Manag. J. 2020, 7, 41–47. [Google Scholar] [CrossRef] [Green Version]
- Lachom, V.; Poolcharuansin, P.; Laokul, P. Preparation, Characterizations and Photocatalytic Activity of a ZnO/TiO2 Nanocomposite. Mater. Res. Express 2017, 4, 035006. Available online: https://iopscience.iop.org/article/10.1088/2053-1591/aa60d1 (accessed on 9 August 2023). [CrossRef]
- Mohsin, A.K. Preparation TiO2 and ZnO/TiO2 nanocomposites locally and use against Staphylococcus aureus. IOP Conf. Ser. Mater. Sci. Eng. 2020, 928, 072014. [Google Scholar]
- Shalaby, A.; Bachvarova-Nedelcheva, A.; Iordanova, R.; Dimitriev, Y.; Stoyanova, A.; Hitkova, H.; Ivanova, N.; Sredkova, M. Sol-gel synthesis and properties of nanocomposites in the Ag/TiO2/ZnO system. J. Optoelectroics Adv. Mater. 2015, 17, 248–256. [Google Scholar]
- Chen, J.; Liao, W.; Jiang, Y.; Yu, D.; Zou, M.; Zhu, H.; Zhang, M.; Du, M. Facile fabrication of ZnO/TiO2 heterogeneous nanofibres and their photocatalytic behaviour and mechanism towards rhodamine B. Nanomater. Nanotechnol. 2016, 6, 9. [Google Scholar] [CrossRef] [Green Version]
- Bai, N.; Liu, X.; Li, Z.; Ke, X.; Zhang, K.; Wu, Q. High-efficiency TiO2/ZnO nanocomposites photocatalysts by sol–gel and hydrothermal methods. J. Sol-Gel Sci. Technol. 2021, 99, 92–100. [Google Scholar] [CrossRef]
- Pant, B.; Ojha, G.P.; Kuk, Y.S.; Kwon, O.H.; Park, Y.W.; Park, M. Synthesis and characterization of ZnO-TiO2/carbon fiber composite with enhanced photocatalytic properties. Nanomaterials 2020, 10, 1960. [Google Scholar] [CrossRef]
- Cheng, C.; Amini, A.; Zhu, C.; Xu, Z.; Song, H.; Wang, N. Enhanced photocatalytic performance of TiO2-ZnO hybrid nanostructures. Sci. Rep. 2014, 4, 4181. [Google Scholar] [CrossRef] [Green Version]
- Upadhyay, G.K.; Rajput, J.K.; Pathak, T.K.; Kumar, V.; Purohit, L.P. Synthesis of ZnO: TiO2 nanocomposites for photocatalyst application in visible light. Vacuum 2019, 160, 154–163. [Google Scholar] [CrossRef]
- Hussein, A.M.; Mahoney, L.; Peng, R.; Kibombo, H.; Wu, C.M.; Koodali, R.T.; Shende, R. Mesoporous coupled ZnO/TiO2 photocatalyst nanocomposites for hydrogen generation. J. Renew. Sustain. Energy 2013, 5, 033118. [Google Scholar] [CrossRef]
- Li, D.; Jiang, X.; Zhang, Y.; Zhang, B.; Pan, C. A novel route to ZnO/TiO2 heterojunction composite fibers. J. Mater. Res. 2013, 28, 507–512. [Google Scholar] [CrossRef]
- Lin, H.Y.; Chou, Y.Y.; Cheng, C.L.; Chen, Y.F. Giant enhancement of band edge emission based on ZnO/TiO2 nanocomposites. Opt. Express 2007, 15, 13832–13837. [Google Scholar] [CrossRef]
- Hellen, N.; Park, H.; Kim, K.N.; Hellen, N.; Park, H.; Kim, K.N. Characterization of ZnO/TiO2 nanocomposites prepared via the sol-gel method. J. Korean Ceram. Soc. 2018, 55, 140–144. [Google Scholar] [CrossRef] [Green Version]
- Simsek, E.B.; Kilic, B.; Asgin, M.; Akan, A. Graphene oxide based heterojunction TiO2–ZnO catalysts with outstanding photocatalytic performance for bisphenol-A, ibuprofen and flurbiprofen. J. Ind. Eng. Chem. 2018, 59, 115–126. [Google Scholar] [CrossRef]
- Mofokeng, S.J.; Kumar, V.; Kroon, R.E.; Ntwaeaborwa, O.M. Structure and optical properties of Dy3+ activated sol-gel ZnO-TiO2 nanocomposites. J. Alloys Compd. 2017, 711, 121–131. [Google Scholar] [CrossRef]
- Wang, F.; Yu, D.; Dai, J. Photoelectrochemical characteristics of ZnO/TiO2 nanoheterojunctions. AIP Adv. 2019, 9, 035237. [Google Scholar] [CrossRef]
- Upadhaya, D.; Kumar, P.; Dhar Purkayastha, D. Superhydrophobic ZnO/TiO2 Heterostructure with Significantly Enhanced Photocatalytic Activity. J. Mater. Sci. Mater. Electron. 2019, 30, 10399–10407. Available online: https://link.springer.com/article/10.1007/s10854-019-01381-2 (accessed on 9 August 2023). [CrossRef]
- Li, Y.; Wang, L.; Liang, J.; Gao, F.; Yin, K.; Dai, P. Hierarchical heterostructure of ZnO@TiO2 hollow spheres for highly efficient photocatalytic hydrogen evolution. Nanoscale Res. Lett. 2017, 12, 531. [Google Scholar] [CrossRef]
- Zhang, B.; Li, Q.; Wang, D.; Wang, J.; Jiang, B.; Jiao, S.; Liu, D.; Zeng, Z.; Zhao, C.; Liu, Y.; et al. Efficient photocatalytic hydrogen evolution over TiO2-x mesoporous spheres-ZnO nanorods heterojunction. Nanomaterials 2020, 10, 2096. [Google Scholar] [CrossRef] [PubMed]
- Siuleiman, S.; Kaneva, N.; Bojinova, A.; Papazova, K.; Apostolov, A.; Dimitrov, D. Photodegradation of Orange II by ZnO and TiO2 powders and nanowire ZnO and ZnO/TiO2 thin films. Colloids Surf. A Physicochem. Eng. Asp. 2014, 460, 408–413. [Google Scholar] [CrossRef]
- Zha, R.; Nadimicherla, R.; Guo, X. Ultraviolet photocatalytic degradation of methyl orange by nanostructured TiO2/ZnO heterojunctions. J. Mater. Chem. A 2015, 3, 6565–6574. [Google Scholar] [CrossRef]
- Pérez-González, M.; Tomás, S.A.; Morales-Luna, M.; Arvizua, M.A.; Tellez-Cruz, M.M. Optical, structural, and morphological properties of photocatalytic TiO2-ZnO thin films synthesized by the sol-gel process. Thin Solid Film. 2015, 594, 304–309. [Google Scholar] [CrossRef]
- Liao, Y.; Xie, C.; Liu, Y.; Chen, H.; Li, H.; Wu, J. Comparison on photocatalytic degradation of gaseous formaldehyde by TiO2, ZnO and their composite. Ceram. Int. 2012, 38, 4437–4444. [Google Scholar] [CrossRef]
- Moradi, S.; Aberoomand-Azar, P.; Raeis-Farshid, S.; Abedini-Khorrami, S.; Givianrad, M.H. The effect of different molar ratios of ZnO on characterization and photocatalytic activity of TiO2/ZnO nanocomposite. J. Saudi Chem. Soc. 2016, 20, 373–378. [Google Scholar] [CrossRef] [Green Version]
- Mediouni, N.; Dappozze, F.; Khrouz, L.; Parola, S.; Amara, A.B.H.; Rhaiem, H.B.; Jaffrezic-Renault, N.; Namour, P.; Guillard, C. Correlation between Photocatalytic Properties of ZnO and Generation of Hydrogen Peroxide—Impact of Composite ZnO/TiO2 Rutile and Anatase. Catalysts 2022, 12, 1445. [Google Scholar] [CrossRef]
- Siwińska-Stefańska, K.; Kubiak, A.; Piasecki, A.; Goscianska, J.; Nowaczyk, G.; Jurga, S.; Jesionowski, T. TiO2-ZnO binary oxide systems: Comprehensive characterization and tests of photocatalytic activity. Materials 2018, 11, 841. [Google Scholar] [CrossRef] [Green Version]
- Štrbac, D.; Aggelopoulos, C.A.; Štrbac, G.; Dimitropoulos, M.; Novaković, M.; Ivetić, T.; Yannopoulos, S.N. Photocatalytic degradation of Naproxen and methylene blue: Comparison between ZnO, TiO2 and their mixture. Process Saf. Environ. Prot. 2018, 113, 174–183. [Google Scholar] [CrossRef]
- Zhong, L.; Haghighat, F. Photocatalytic air cleaners and materials technologies–abilities and limitations. Build. Environ. 2015, 91, 191–203. [Google Scholar] [CrossRef]
- Hay, S.O.; Obee, T.; Luo, Z.; Jiang, T.; Meng, Y.; He, J.; Murphy, S.C.; Suib, S. The viability of photocatalysis for air purification. Molecules 2015, 20, 1319–1356. [Google Scholar] [CrossRef] [Green Version]
- Jaison, A.; Mohan, A.; Lee, Y.C. Recent Developments in Photocatalytic Nanotechnology for Purifying Air Polluted with Volatile Organic Compounds: Effect of Operating Parameters and Catalyst Deactivation. Catalysts 2023, 13, 407. [Google Scholar] [CrossRef]
- Liang, W.; Li, J.; He, H. Photo-catalytic degradation of volatile organic compounds (VOCs) over titanium dioxide thin film. Adv. Asp. Spectrosc. 2012, 12, 341–372. [Google Scholar] [CrossRef] [Green Version]
- Das, J.; Rene, E.R.; Krishnan, J. Photocatalytic degradation of volatile pollutants. J. Environ. Chem. Toxicol. 2018, 2, 57–59. [Google Scholar]
- Liqiang, J.; Baifu, X.; Fulong, Y.; Baiqi, W.; Keying, S.; Weimin, C.; Honggang, F. Deactivation and regeneration of ZnO and TiO2 nanoparticles in the gas phase photocatalytic oxidation of n-C7H16 or SO2. Appl. Catal. A Gen. 2004, 275, 49–54. [Google Scholar] [CrossRef]
- Saucedo-Lucero, J.O.; Arriaga, S. Study of ZnO-photocatalyst deactivation during continuous degradation of n-hexane vapors. J. Photochem. Photobiol. A Chem. 2015, 312, 28–33. [Google Scholar] [CrossRef]
- Saucedo-Lucero, J.O.; Arriaga, S. Photocatalytic degradation of hexane vapors in batch and continuous systems using impregnated ZnO nanoparticles. Chem. Eng. J. 2013, 218, 358–367. [Google Scholar] [CrossRef]
- Muggli, D.S.; McCue, J.T.; Falconer, J.L. Mechanism of the photocatalytic oxidation of ethanol on TiO2. J. Catal. 1998, 173, 470–483. [Google Scholar] [CrossRef]
- Coronado, J.M.; Kataoka, S.; Tejedor-Tejedor, I.; Anderson, M.A. Dynamic phenomena during the photocatalytic oxidation of ethanol and acetone over nanocrystalline TiO2: Simultaneous FTIR analysis of gas and surface species. J. Catal. 2003, 219, 219–230. [Google Scholar] [CrossRef]
- Nimlos, M.R.; Wolfrum, E.J.; Brewer, M.L.; Fennell, J.A.; Bintner, G. Gas-phase heterogeneous photocatalytic oxidation of ethanol: Pathways and kinetic modeling. Environ. Sci. Technol. 1996, 30, 3102–3110. [Google Scholar] [CrossRef]
- Sola, A.C.; Garzón Sousa, D.; Araña, J.; González Díaz, O.; Doña Rodríguez, J.M.; Ramírez de la Piscina, P.; Homs, N. Differences in the vapour phase photocatalytic degradation of ammonia and ethanol in the presence of water as a function of TiO2 characteristics and the presence of O2. Catal. Today 2016, 266, 53–61. [Google Scholar] [CrossRef]
- Takeuchi, M.; Deguchi, J.; Sakai, S.; Anpo, M. Effect of H2O vapor addition on the photocatalytic oxidation of ethanol, acetaldehyde and acetic acid in the gas phase on TiO2 semiconductor powders. Appl. Catal. B Environ. 2010, 96, 218–223. [Google Scholar] [CrossRef]
- Sauer, M.L.; Ollis, D.F. Photocatalyzed oxidation of ethanol and acetaldehyde in humidified air. J. Catal. 1996, 158, 570–582. [Google Scholar] [CrossRef]
- Piera, E.; Ayllón, J.A.; Doménech, X.; Peral, J. TiO2 deactivation during gas-phase photocatalytic oxidation of ethanol. Catal. Today 2002, 76, 259–270. [Google Scholar] [CrossRef]
- Verbruggen, S.W.; Masschaele, K.; Moortgat, E.; Korany, T.E.; Hauchecorne, B.; Martens, J.A.; Lenaerts, S. Factors driving the activity of commercial titanium dioxide powders towards gas phase photocatalytic oxidation of acetaldehyde. Catal. Sci. Technol. 2012, 2, 2311–2318. [Google Scholar] [CrossRef]
- Almquist, C.B.; O’Hare, I.; Garza, L.; Badahman, A.; Jung, W.; Hanzel, S.; Neal, J. UV-LED Photocatalytic Device for the Oxidation of Ethanol and Hexane Vapors in Air. Chem. Proc. 2021, 6, 4. [Google Scholar] [CrossRef]
- Nargiello, M.; Herz, T. Physical-Chemical Characteristics of P-25 making it extremely suited as the catatalyst in photodegradation of organic compounds. Photocatalytic Purif. Treat. Water Air 1993, 3, 801–807. [Google Scholar]
- Ohtani, B.; Prieto-Mahaney, O.O.; Li, D.; Abe, R. What is Degussa (Evonik) P25? Crystalline composition analysis, reconstruction from isolated pure particles and photocatalytic activity test. J. Photochem. Photobiol. A Chem. 2010, 216, 179–182. [Google Scholar] [CrossRef] [Green Version]
- Almquist, C.B.; Biswas, P. Role of Synthesis Method and Particle Size of Nanostructured TiO2 on Its Photoactivity. J. Catal. 2002, 212, 145–156. [Google Scholar] [CrossRef]
- Uddin, M.J.; Cesano, F.; Chowdhury, A.R.; Trad, T.; Cravanzola, S.; Martra, G.; Mino, L.; Zecchina, A.; Scarano, D. Surface Structure and Phase Composition of TiO2 P25 Particles after Thermal Treatments and HF Etching. Front. Mater. 2020, 7, 192. Available online: https://www.frontiersin.org/articles/10.3389/fmats.2020.00192/full (accessed on 9 August 2023). [CrossRef]
- Han, E.; Vijayarangamuthu, K.; Youn, J.-S.; Park, Y.-K.; Jung, S.-C.; Jeon, K.-J. Degussa P25 TiO2 modified with H2O2 under microwave treatment to enhance photocatalytic properties. Catal. Today 2018, 303, 305–312. [Google Scholar] [CrossRef]
- Makuła, P.; Pacia, M.; Macyk, W. How To Correctly Determine the Band Gap Energy of Modified Semiconductor Photocatalysts Based on UV-Vis Spectra. J. Phys. Chem. Lett. 2018, 9, 6814–6817. [Google Scholar] [CrossRef] [Green Version]
- RealUV™ LED Strip Lights. Available online: https://store.waveformlighting.com/products/real-uv-led-strip-lights (accessed on 12 July 2023).
- RealUV™ LED Strip Lights Specification Sheet. Available online: https://store.waveformlighting.com/cdn/shop/files/realUV_LED_Strip_Lights_Specification_Sheet.pdf?v=2156247376753912624 (accessed on 12 July 2023).
- Lee, J.; Easteal, A.J.; Pal, U.; Bhattacharyya, D. Evolution of ZnO nanostructures in sol–gel synthesis. Curr. Appl. Phys. 2009, 9, 792–796. [Google Scholar] [CrossRef]
- Hasnidawani, J.N.; Azlina, H.N.; Norita, H.; Bonnia, N.N.; Ratim, S.; Ali, E.S. Synthesis of ZnO nanostructures using sol-gel method. Procedia Chem. 2016, 19, 211–216. [Google Scholar] [CrossRef] [Green Version]
- Cano-Casanova, L.; Amorós-Pérez, A.; Lillo-Ródenas, M.Á.; Román-Martínez, M.D.C. Effect of the preparation method (sol-gel or hydrothermal) and conditions on the TiO2 properties and activity for propene oxidation. Materials 2018, 11, 2227. [Google Scholar] [CrossRef] [Green Version]
Figure 1.
Schematic of the photocatalytic process to form hydroxyl radicals [16].
Figure 1.
Schematic of the photocatalytic process to form hydroxyl radicals [16].

Figure 2.
XRD profiles of photocatalysts. (a) TiO2-based photocatalysts. (b) ZnO-based photocatalysts.
Figure 2.
XRD profiles of photocatalysts. (a) TiO2-based photocatalysts. (b) ZnO-based photocatalysts.


Figure 3.
SEM micrographs of sol-gel synthesized photocatalysts. (a) 100T0Z; (b) 95T5Z; (c) 90T10Z; (d) 75T25Z; (e) 0T100Z.
Figure 3.
SEM micrographs of sol-gel synthesized photocatalysts. (a) 100T0Z; (b) 95T5Z; (c) 90T10Z; (d) 75T25Z; (e) 0T100Z.

Figure 4.
Tauc plots for bandgap analyses of TiO2-based photocatalysts (indirect semiconductor). (a) P25 TiO2; (b) 100T,0Z; (c) 95T5Z; (d) 90T10Z; (e) 75T25Z.
Figure 4.
Tauc plots for bandgap analyses of TiO2-based photocatalysts (indirect semiconductor). (a) P25 TiO2; (b) 100T,0Z; (c) 95T5Z; (d) 90T10Z; (e) 75T25Z.

Figure 5.
Tauc plots for bandgap analyses of ZnO-based photocatalysts (direct semiconductor). (a) 0T100Z; (b) ZnO (purchased).
Figure 5.
Tauc plots for bandgap analyses of ZnO-based photocatalysts (direct semiconductor). (a) 0T100Z; (b) ZnO (purchased).

Figure 6.
FTIR Spectra of new and used photocatalysts. (a) 100T0Z after 28 days of operation. (b) ZnO after 7 days of operation.
Figure 6.
FTIR Spectra of new and used photocatalysts. (a) 100T0Z after 28 days of operation. (b) ZnO after 7 days of operation.

Figure 7.
Dark adsorption followed by initial UV LED photocatalytic degradation of ethanol vapors. (a) P25 TiO2; (b) ZnO (purchased).
Figure 7.
Dark adsorption followed by initial UV LED photocatalytic degradation of ethanol vapors. (a) P25 TiO2; (b) ZnO (purchased).

Figure 8.
Ethanol adsorption breakthrough time as a function of surface area of photocatalyst in the UV LED photocatalytic reactor.
Figure 8.
Ethanol adsorption breakthrough time as a function of surface area of photocatalyst in the UV LED photocatalytic reactor.

Figure 9.
Summary of ethanol % conversion after 24 h of reactor operation. Ethanol flow rate into the reactor was (a) 0.7 µmoles/min; (b) 1.3 µmoles/min; (c) 1.9 µmoles/min.
Figure 9.
Summary of ethanol % conversion after 24 h of reactor operation. Ethanol flow rate into the reactor was (a) 0.7 µmoles/min; (b) 1.3 µmoles/min; (c) 1.9 µmoles/min.

Figure 10.
Conversion of ethanol, acetaldehyde, and acetic acid selectivities after 24 h of reactor operation for 95T5Z.
Figure 10.
Conversion of ethanol, acetaldehyde, and acetic acid selectivities after 24 h of reactor operation for 95T5Z.

Figure 11.
Ethanol reaction rate normalized to (a) illuminated surface area; (b) photocatalyst surface area.
Figure 11.
Ethanol reaction rate normalized to (a) illuminated surface area; (b) photocatalyst surface area.

Figure 12.
Diagrams and photographs of test system. (a) Schematic of test system. (b) reactor base showing photocatalytic film. (c) UV LEDs on cover of reactor. (d) Photographs of UV LED photocatalytic reactors in practice.
Figure 12.
Diagrams and photographs of test system. (a) Schematic of test system. (b) reactor base showing photocatalytic film. (c) UV LEDs on cover of reactor. (d) Photographs of UV LED photocatalytic reactors in practice.


Table 1.
Summary of photocatalyst properties used in this study.
| Catalyst ID | ZnO/TiO2 Mass Ratio a | Predominant Crystal Structure | Intended Mass Ratio (Zn/Ti) | Measured Mass Ratio (Zn/Ti) b | BET Surface Area (m2/g) | Crystal Size (nm) c | Bandgap (eV) |
|---|---|---|---|---|---|---|---|
| P25 | Anatase TiO2 | 49.5 | 22.9 | 3.05 | |||
| 100T0Z | 0 | Anatase TiO2 | 0 | 0 | 49.8 | 17.5 | 3.08 |
| 95T5Z | 0.05 | Anatase TiO2 | 0.07 | 0.085 | 37.7 | 14.2 | 3.19 |
| 90T10Z | 0.10 | Anatase TiO2 | 0.15 | 0.17 | 20.6 | 15.9 | 3.05 |
| 75T25Z | 0.25 | ZnTiO3 | 0.44 | 0.43 | 22.5 | 41.2 | 3.05 |
| 0T100Z | 1 | zincite | --- | --- | 9.15 | 40.6 | 3.18 |
| ZnO | zincite | 3.5 | 70.4 | 3.35 |
a nominal mass ratio based upon material synthesis. b elemental composition based upon EDS data. c crystal size based upon XRD profiles and the Scherrer Equation.
Table 2.
Summary of model parameters used to fit experimental data.
| Catalyst ID | k′ (µmoles/min/m2 Illuminated Area) | k″ (µmoles/min/m2 Surface Area) | Ke (µmoles/m3) | R2 |
|---|---|---|---|---|
| P25 | 4977 | 2.08 | 0.02 | 0.9981 |
| 100T0Z | 5006 | 2.08 | 0.02 | 0.9944 |
| 95T5Z | 562 | 0.308 | 0.21 | 0.9816 |
| 90T10Z | 106 | 0.127 | 1.3 | 0.9666 |
| 75T25Z | 104 | 0.096 | 2.6 | 0.9454 |
| 0T100Z | 13 | 0.036 | 2.1 | 1 1 |
| ZnO | 21 | 0.123 | 10 | 0.8967 |
1 Only 2 data points for this curve, so R2 = 1.
Table 3.
Summary of selected studies with ZnO-based photocatalysts in gas-phase applications.
| Gas-Phase Photocatalysis | |||
|---|---|---|---|
| Photocatalyst | Analyte | Conclusions | Reference |
| ZnO/TiO2 (Zn/Ti mass ratio = 0:1; 0.07:1; 0.15:1; 0.44:1; 1:0) | Ethanol (Ranging from 180–1800 ppm) | Pure TiO2 and P25 TiO2 had the highest apparent photocatalytic activity under UVA illumination in a flow reactor. As ZnO content in the composite materials increased, the apparent photocatalytic activity also decreased. The surface areas of the composite materials also decreased with increasing ZnO content. | This study |
| ZnO/Activated carbon; TiO2/Activated carbon ZnO/TiO2/Activated carbon | Xylene (100 ppm) | For up to 120 min of operation in a flow reactor, a composite 1ZnO/3TiO2/Activated carbon had a higher removal rate of xylene than AC/ZnO 5% and AC/TiO2 15%. | [30] |
| ZnO/TiO2 xZnO/(1 − x)TiO2 x = molar ratios: 1, 0.8, 0.6, 0.4, 0.2, 0 | Formaldehyde (50 ppm) | Pure TiO2 had the highest apparent photocatalytic activity under UVA illumination in a gas chamber. As ZnO content in the composite materials increased, the apparent photocatalytic activity decreased. The surface areas of the materials were not reported. | [52] |
| ZnO nanoparticles TiO2 nanoparticles | Heptane, SO2 | ZnO was more readily deactivated than TiO2 when oxidizing heptane under UVA illumination. Both ZnO and TiO2 were deactivated when oxidizing SO2. The surface areas of the materials were not reported. | [62] |
| ZnO on Perlite | Hexane (284 ppm) | ZnO was deactivated in less than 14 h in a flow reactor illuminated at 254 nm wavelength. It was concluded that water content on the photocatalyst was responsible for photocatalyst deactivation. | [63] |
| TiO2 on Perlite TiO2 on Poraver ZnO on Perlite ZnO on Poraver | Hexane (~500 ppm) | Similar hexane degradation rates for ZnO and TiO2 were observed in batch tests (254 nm wavelength). For continuous experiments, the TiO2 catalyst supported on Perlite showed higher degradation velocities than ZnO. However, when normalized to BET surface area, the ZnO impregnated onto Poraver resulted in better performance than TiO2 and ZnO on Perlite. | [64] |
Disclaimer/Publisher’s Note: The statements, opinions and data contained in all publications are solely those of the individual author(s) and contributor(s) and not of MDPI and/or the editor(s). MDPI and/or the editor(s) disclaim responsibility for any injury to people or property resulting from any ideas, methods, instructions or products referred to in the content. |
© 2023 by the authors. Licensee MDPI, Basel, Switzerland. This article is an open access article distributed under the terms and conditions of the Creative Commons Attribution (CC BY) license (https://creativecommons.org/licenses/by/4.0/).
Share and Cite
MDPI and ACS Style
Sanusi, I.; Almquist, C.B. ZnO/TiO2 Composite Thin-Film Photocatalysts for Gas-Phase Oxidation of Ethanol. Catalysts 2023, 13, 1203. https://doi.org/10.3390/catal13081203
AMA Style
Sanusi I, Almquist CB. ZnO/TiO2 Composite Thin-Film Photocatalysts for Gas-Phase Oxidation of Ethanol. Catalysts. 2023; 13(8):1203. https://doi.org/10.3390/catal13081203
Chicago/Turabian StyleSanusi, Ibrahim, and Catherine B. Almquist. 2023. "ZnO/TiO2 Composite Thin-Film Photocatalysts for Gas-Phase Oxidation of Ethanol" Catalysts 13, no. 8: 1203. https://doi.org/10.3390/catal13081203
Note that from the first issue of 2016, this journal uses article numbers instead of page numbers. See further details here.