
Hydrothermally Derived Mg-Doped TiO2 Nanostructures for Enhanced H2 Evolution Using Photo- and Electro-Catalytic Water Splitting


1
Nanochemistry Laboratory, Department of Chemistry, Jamia Millia Islamia, New Delhi 110025, India
2
Department of Chemistry, College of Science, King Saud University, P.O. Box 2455, Riyadh 11451, Saudi Arabia
3
Department of Chemistry, Illinois Institute of Technology, 3105 South Dearborn Street, Chicago, IL 60616, USA
*
Author to whom correspondence should be addressed.
Catalysts 2023, 13(5), 893; https://doi.org/10.3390/catal13050893
Submission received: 30 March 2023
/
Revised: 3 May 2023
/
Accepted: 10 May 2023
/
Published: 15 May 2023
(This article belongs to the Special Issue Advanced Nanostructured Materials for Modern Catalysis Applications)
Abstract
:Mg-doped TiO2 nano-structures in different compositions (1, 2.5 and 5%) were successfully synthesized by low-temperature hydrothermal route. X-ray diffraction and electron microscopic studies were used to investigate the crystal structure, surface morphology and particle size of the as-synthesized materials. Raman studies were carried out to elucidate the phase identification and the modes of vibrations to determine the impact of dopant ion on the crystal structures. The band gap was estimated using UV-DRS studies whereas, BET surface area analysis revealed an increase in the surface area of increasing Mg2+ ions concentration in TiO2 nanostructures. Among the synthesized various composition of nano-structures, 5% Mg-doped TiO2 photocatalyst showed maximum hydrogen evolution activity (38.96 mmol ) in an 8-h analysis cycle. Moreover, the 2.5% Mg-doped TiO2 nanocatalyst with tafel slopes of 123.5 and 126.7 mV/dec showed strong activity for both HER in 0.5 N H2SO4 and 0.1 N KOH, with an onset potential of 0.96 V (at 10 mA/cm2) and −1.38 V (at 1 mA/cm2) for HER, respectively. Experimental investigations deduced that the incorporation of Mg2+ ions in the TiO2 resulted in the increase of hydrogen generation catalytic activity of titanium dioxide owing to the synergistic effect provided by the remarkable surface area and the presence of defects introduced by doping.
1. Introduction
Population expansion and unregulated industrial growth have increased energy consumption, and as a consequence, hazardous chemicals and waste released into the air and rivers have caused pollution-related diseases, global warming and anomalous climate shifts [1,2,3,4,5,6]. Environmental pollution and insufficient clean, natural energy sources have become the world’s most pressing issues due to their long-term disastrous effects [7,8,9,10]. Due to the unabated production of these high-level nuclear wastes, several problems have arisen, which have affected countries like, France, UK, and Germany etc. [11]. Moreover, the March 2011 earthquake and tsunami in Fukushima, Japan, damaged the nuclear reactors, raising concerns about electricity supply and environmental damage from nuclear waste and coolants. Therefore, researchers should make it their objective to aid in the development of chemical technologies by developing energy producing pathways that are less harmful to the environment and more efficient in terms of both energy use and material resources, as these are some of the most pressing problems now confronting the scientific community [12,13,14,15]. Hydrogen (H2) as a fuel is one of the best alternatives for non-renewable energy resources [16,17,18]. As opposed to the pollution and smog caused by burning fossil fuels, H2 fuel produced by electrolysis or solar-driven photo/electrochemical routes offers a clean and environmentally friendly alternative to fossil derivatives [15,19,20,21,22,23,24]. Furthermore, a great deal of study has been conducted for the betterment of electrochemical efficiency and to engineer low-cost and effective multi-functional electrocatalytic materials for H2 evolution reactions (HER) and oxygen evolution reactions (OER), as a substitute of noble metal led electrocatalysis [25,26,27,28,29,30,31]. With the discovery of electrocatalysis, transition metal-based oxides, chalcogenides and phosphides, graphene derivatives and perovskites have been extensively utilized as potentially upgraded and effective bifunctional materials for this process [32,33,34,35,36,37,38].
Therefore, photo/electrocatalytic water splitting for H2 evolution has been shown to be a promising area of research, and TiO2 based catalysts have emerged as one of the most promising catalytic systems for photocatalytic/photovoltaic applications [34,35,39,40,41,42]. In addition, materials based on TiO2 are well-recognized as low-priced options with a wide range of possible chemical and electrical structural modifications [43,44]. However, fast charge-carrier recombination, poor photon-to-current conversion efficiency (IPCE), wide band-gap energy (>3 eV) and varying interfacial charge-transfer rates continue to restrict the practical applications of TiO2 nanostructures [41,45,46]. The direct applications of these materials in industries are challenging due to their relatively inefficient light use. The modification of physical and chemical characteristics and properties of nanomaterials such as the morphology, crystal phase, electron lifetime, electronic structure, energy band gap and positions, surface state and defect in nanocatalysts have recently been the topic of greater focus [45,47,48,49]. Several methods, including coupling with other semiconductors and doping with foreign elements, have been explored to generate TiO2 materials that lower band gaps and charge separation enhancement [13,22,50]. The addition of alkaline earth metal dopants such as Mg to TiO2 alters its band gap, leading to better electronic properties and increased photocatalytic activity. This doping process produces lattice defects such as oxygen vacancies and generates reactive oxygen species, which reduces electron and hole recombination, thereby boosting the photocatalytic performance of TiO2 nanoparticles [31,51]. The free electrons on a metal-doped nano-catalyst are generated by a process called surface plasmon resonance (SPR), which is triggered by metal doping of the TiO2 host lattice [52]. By efficiently trapping electrons via solar radiation absorption, SPR improves the charge transfer efficiency of metal-doped TiO2. In addition, metal doping results in the creation of Ti3+ in the TiO2 lattice, therefore interstitial site defects and oxygen vacancies are introduced which favour the HER activity of TiO2. Furthermore, as a result of metal, non-metal doping and heterostructured formation, an empty impurity band emerges over the valence band (VB), which facilitates kinetics of photo-induced charge carriers during photocatalysis [10,53,54].
In this paper, we have synthesized Mg-doped TiO2 via the simple hydrothermal method, which has been characterized by various techniques such as XRD, RAMAN, TEM, FESEM, EDAX, UV-DRS and BET surface area analysis. The doping of Mg to TiO2 improves the catalytic efficiency towards photocatalysis and electrocatalysis of water by increasing the separation of the photo generated charge carrier (electron-hole pairs) and by providing more surface-active sites with the specific surface area.
2. Results and Discussion
2.1. Powder X-ray Diffraction (PXRD) Studies
To determine the lattice structural properties of as-prepared nanostructures such as crystal structure, phase identification and purity, PXRD technique was employed. XRD patterns of 1, 2.5 and 5% Mg-doped TiO2 nanoparticles (NPs), as seen in Figure 1, were successfully indexed in the anatase phase of titanium dioxide (TiO2) using JCPDS card no. 71-1167 [5,55]. The synthesized material was pure, crystalline and no foreign peak related to Mg was observed, which proved that Mg2+ ions were completely doped in TiO2 [56,57]. From the XRD, it can be seen that Mg-doped TiO2 peaks have been shifted slightly, which shows that Mg2+ ions have been substituted to the host of TiO2 lattice. Additionally, the peak intensity and sharpness both increased with the increase in Mg2+ ion concentration to the TiO2 host lattice, reflecting an overall rise in crystallinity [57,58]. Furthermore, the 2θ values change to lower values during 1% doping of Mg2+ ions, further decreasing with 2.5% and 5% doping [57,58]. Therefore, as the ionic radii of Mg2+ ions (0.72 Å) are significantly greater than Ti4+ (0.61 Å), lattice expansion must have taken place when Ti4+ ions were substituted by Mg2+ ions. The crystallinity and crystallite size of Mg-doped TiO2 is significantly decreased, as predicted the impact of the Mg2+ dopant that also contributes to the growth of point defects like oxygen vacancies [51,58]. The inset of Figure 1 illustrates the Mg2+, O and Ti4+ lattice sites in the anatase phase crystal structure of Mg-doped TiO2 nanoparticles.
2.2. Transmission Electron Microscopy (TEM) Studies
The impact of Mg-doping on TiO2 nanoparticles is revealed by TEM studies as shown in Figure 2a–c. TEM images reveal that Mg deposited on the TiO2 host nanoparticles in the form of rough cubes with minor aggregation and black spots. Particle size histograms produced from the TEM images ranging from 4–24 nm showed the average particle size to be 10.45 ± 0.7, 10.07 ± 0.6 and 9.51 ± 0.6 nm for 1%, 2.5% and 5% Mg-doped TiO2 NPs, respectively, as shown in Figure 2d–f. Particle size also decreases when Mg2+ ion concentration rises, as further proven by increased surface area in BET investigations. Figure 2g–i show HRTEM micrographs of 1, 2.5, and 5% Mg-doped TiO2 NPs, all of which exhibit well-resolved lattice fringes and have interspacing of 0.348, 0.343 and 0.341 nm, respectively, which corresponds to (101) crystallographic plane of tetragonal TiO2.
2.3. Field Emission Scanning Electron Microscopy (FESEM) Studies
The surface morphology and particle shape of the nanostructures were studied using FESEM studies. The SEM micrographs of 1, 2.5, and 5% Mg-doped TiO2 NPs are shown in Figure 3a–c, respectively. The formation of rough, non-uniform NPs with an undefined morphology was observed in SEM micrographs. Additionally, as reported elsewhere, pure TiO2 NPs [5] had less roughness than Mg-doped TiO2 samples, whereas Mg-doped TiO2 NPs exhibited less aggregation than pure TiO2. Mg-doped TiO2 NP’s elemental distribution was analyzed by X-ray elemental mapping for more accurate identification of elements. It is evident from the X-ray elemental mapping, as shown in Figure 4a,c, that the as-synthesized nanoparticles included a high concentration of Magnesium, Titanium and Oxygen. Figure 4a,c have an inset depicting maps of the elements Mg, Ti and O with SEM micrographs. Figure 4b,d,e display the EDAX spectra of 1, 2.5, and 5% Mg-doped TiO2, which confirms the existence of Ti and O elements in the as-synthesized sample. The spectrum also demonstrates the successful doping of the element in the host compound.
The UV-visible reflectance spectra of the as-synthesized 1, 2.5 and 5% Mg-doped TiO2 NPs were recorded in diffuse reflectance spectral mode at room temperature, as shown in Figure 5a. The spectra clearly show that the absorption coefficient drops as the wavelength increases, which is typical behavior of many semiconductor materials caused by lattice deformation and internal electric fields inside the crystal. The optical band gap was determined by employing reflectance data in the following Kubelka-Munk equation, F(R∞) = α/s = (1 − R∞)2/2R∞ [20,23]. Using Tauc’s plot [F(R∞)hν]1/n Vs eV and linear extrapolation of [F(R∞)hν]1/n as depicted in Figure 5b, the band gaps of 1, 2.5, and 5% Mg-doped TiO2 nanoparticles were calculated [5,20]. The determined band gap values of 1, 2.5, 5% Mg-doped TiO2 NPs and pure TiO2 reported elsewhere [5] were found to be 3.18, 3.16, 3.13 and 3.19 eV, respectively. The existence of impurity or vacancy defect levels between the VB and conduction band (CB) levels may be responsible for the minute changes in the band gap [31,57]. This modifies the photo- and electro- catalytic activity of nano-structures [23,24,59].
2.4. Raman Studies
The introduction of Mg2+ dopant ions into TiO2 nanostructures and their effect on the crystal structure was examined via Raman spectroscopy. Figure 6 shows that the main peaks in the Raman spectra of TiO2 in the anatase phase are located at 143 (Eg), 195 (Eg), 393 (B1g), 513(A1g + B1g), and 635 (Eg) cm−1 [5,50]. Anatase TiO2 with the Eg mode is responsible for the strong peak at 143 (Eg) [5]. Such a peak’s steep profile, as discussed in the XRD results, is a direct reflection of the high degree of crystallinity present in these NPs. The Eg peak in TiO2 is connected to the symmetric stretching vibration of O-Ti-O, the symmetric bending vibration related to the B1g mode, and the antisymmetric bending vibration related to the A1g mode of TiO2 [5,57]. Mg2+ metal ion doping of the TiO2 host lattice will disturb it because the ionic radii of Mg2+ ions (0.72 Å) are somewhat greater than those of Ti4+ (0.61 Å). As a result, oxygen vacancies are produced in the TiO2 host lattice to balance the charge caused by the displacement of tetravalent Ti4+ ions by divalent Mg2+ metal ions [5,51,58]. Additionally, the Ti-O-Ti bond structure was impacted by the doping of Mg2+ ions with the TiO2 host lattice, and a new bond called Mg-O-Ti was generated, which affected all Raman-active modes. Moreover, a slight 143(Eg) peak shift in the Raman spectra of Mg-doped TiO2 nanostructures was seen as the concentration of Mg2+ dopant increased [5,51]. The results of the Raman investigations of 1, 2.5 and 5% Mg-doped TiO2 nanostructures (Figure 6) show that the doping of Mg2+ ions was accomplished effectively, and that the Raman spectrum correlated with the PXRD pattern.
2.5. BET Surface Area Studies
The surface area is a crucial factor in establishing the material’s characteristics. Therefore, the surface-active sites present in a material with a high surface area are crucial to the success of any given operation. As a result, a material with a large surface area will have more surface-active sites accessible for any activity to occur. A Brunauer-Emmett-Teller (BET) surface area analysis was performed for 1, 2.5, and 5% Mg-doped TiO2 nanostructures to determine their respective specific surface area, as shown in Figure 7. The specific surface area of the as-synthesized NPs was calculated using the N2 adsorption-desorption isotherms and was found to be 152.9, 164.2 and 198.1 m2 g−1 for 1, 2.5, and 5% Mg-doped TiO2 nanostructures, respectively. Adsorption points from the isotherm were utilized to calculate the average pore size distribution with the Barrett-Joyner-Halenda (BJH) plot. Figure 7b shows that the average pore size for 1, 2.5, and 5% Mg-doped TiO2 NPs are 16.95, 16.93 and 17.08 Å, respectively, indicating that all the samples are mesoporous. Using the isotherm’s adsorption and desorption points, the pore radius was determined using the Dubinin and Astakov (DA) method, as shown in Figure 7c, and was found to be 13.6, 13.4, and 14.1 nm for 1, 2.5, and 5% Mg-doped TiO2 NPs, respectively. BET surface area parameters of as-synthesized materials have been summarized in Table 1.
2.6. Photocatalytic Water Splitting for H2 Evolution Studies
The H2 evolution performance of as-synthesized nanomaterials was determined by photocatalytic water splitting studies. H2 was produced photo-catalytically over as-prepared 1, 2.5 and 5% Mg-doped TiO2 NPs in water using Na2S/Na2SO3 as a sacrificial agent, as illustrated in Figure 8a,b. The photocatalytic efficiency of 1, 2.5 and 5% Mg-doped TiO2 nanocatalysts was found to be approximately 17.89, 34.21 and 38.96 mmol in 8 h, which is higher than what has been reported for pure TiO2 nanocatalyst previously [5]. Furthermore, as shown in Figure 8c, the average H2 evolution rates for 1, 2.5, and 5% Mg-doped TiO2 photocatalysts are 2.24, 4.28, and 4.87 mmol h−1, respectively. The H2 evolution rate is affected by Mg2+ dopant concentrations in host TiO2 NPs as depicted in Figure 8a,b and the 5% Mg-doped TiO2 photocatalyst was shown to evolve maximum H2. The photocatalytic performance of metal-doped TiO2 synthesized through various methods was compared with the present work and summarized the results in Table 2. Experiments on the photocatalyst’s reusability and durability were conducted under ideal photocatalytic reaction conditions. Figure 8d shows a 5% Mg-doped TiO2 nanocatalyst recycled up to three times, with an 8-h reaction period. The results show that the amount of H2 evolved reduced from the initial value of 38.96 mmol in the first cycle to a final value of 37.7 mmol in the third cycle. In summary, the research demonstrates that the best performance of the 5% Mg-doped TiO2 photocatalytic H2 evolution exhibits an average H2 generation of 4.87 mmol h−1 in the presence of sacrificial agent Na2S/Na2SO3.
2.7. Possible Photocatalytic Reaction Mechanism of Mg-Doped TiO2 Nanoparticles
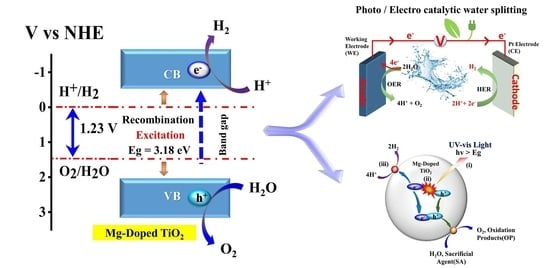
In Figure 9, a mechanism is proposed for the production of H2 gas using Mg-doped TiO2 NPs as the photocatalyst. UV-Visible light excites Mg-doped TiO2, leading to the generation of photoexcited electrons and holes in the CB and VB, respectively [13]. Noticeably, the metallic Mg has a high reducing power as TiO2 so that it can act as an electron donor center [39]. Specifically, the electrons in the CB of TiO2 are transferred to metallic Mg, while the holes are transferred to the VB of TiO2, thereby suppressing the recombination of photo generated electron-hole pairs in semiconductor materials and maintaining the strong reductive electrons and oxidative holes [34,64]. During water splitting, the strong reductive electrons in CB of metallic Mg interact with H+ to form H2, while the holes retained in VB of TiO2 are consumed by the Na2S/Na2SO3 sacrificial reagent [5,20,46]. The following rule governs the reaction pathway.
2.8. Electrocatalytic Water Splitting Studies
1, 2.5, and 5% Mg-doped TiO2 nanostructures were electrochemically studied in order to investigate the HER responses during electrocatalytic water splitting. The 0.5 N H2SO4 and 0.1 N KOH electrolytic solutions were used to record both HER responses under ambient conditions. Figure 10a,b depict the anodic and cathodic sweep of linear voltammetry (LSV) and cyclic voltammetry (CV) within the required potential window with 0.5 N H2SO4 electrolytic solution after IR correction. Figure 10c showed cyclic CV at scan rates ranging from 10 to 100 mV/s within a potential range of +1.5 to −1.5 V after IR correction. The overpotential decreased at 10 mA cm−2 cathode current density as the Mg2+ ion concentration in the TiO2 nanocatalyst increased up to 2.5%, demonstrating the best electrocatalytic HER activity of 2.5% Mg-doped TiO2. At 10 mA cm−2, the overpotential values of 0.98, 0.96 and 0.99 V were obtained for 1, 2.5 and 5% Mg-doped TiO2 electrocatalysts, respectively.
Furthermore, the electrocatalytic activity was performed with 0.1 N KOH alkaline solution to investigate the HER performance of as-synthesized 1, 2.5 and 5% Mg-doped TiO2 electrocatalysts. The cathodic LSV and CV curves with 0.1 N KOH electrolytic solution within the necessary potential window after IR correction are shown in Figure 10d,e. From the LSV study for HER in 0.1 N KOH electrolytes solution, it was observed that 0.44, 1.00 and 0.786 mA cm−2 current densities were generated at −1.38 V onset potential for 1, 2.5 and 5% Mg-doped TiO2 electrocatalysts, respectively. Thus, it was found that the 2.5% Mg-doped TiO2 nanocatalyst has a maximum current density for HER at onset potentials of −1.38 V in 0.1 N KOH electrolyte. CV scans of 2.5% Mg2+ ion doped TiO2 were run at a rate of 10–100 mV/s within a potential window of +1.5 and −1.5 V after IR correction, as depicted in Figure 10f. The reaction kinetics and mechanisms for electrocatalytic activity were determined with the use of HER responses utilizing tafel analysis. The size, surface area, shape and optical properties of nanoparticles, as well as the orientation of electrocatalysts, correspond perfectly with reaction kinetics and mechanisms [5,17,30,48]. Tafel slopes of as-synthesized 1, 2.5 and 5% Mg-doped TiO2 nanostructures for the H2O electrolysis for HER in both 0.5 N H2SO4 and 0.1 N KOH electrolytes solutions are shown in Figure 11a,b and also presented in Table 3 and Table 4 which show that 2.5% Mg-doped TiO2 has the lowest tafel slope values. Therefore, we performed the chronoamperometric analysis of 2.5% Mg-doped TiO2 electrocatalyst. According to Figure 12, the current density did not vary during the chronoamperometric (CA) experiments performed to examine the endurance and stability of a 2.5% Mg-doped TiO2 electrocatalyst running at a voltage −1.0 V up to 4000 s in 0.5 N H2SO4 electrolytic solution for the HER.
3. Experimental Section
3.1. Materials Required
The following solvents and reagents were used in the synthesis with no further purification: Titanium isopropoxide (Alfa Aesar, 97%, Heysham, Lancashire, UK), Magnesium acetate tetrahydrate (SRL, 99%, Sisco research laboratories Pvt. Ltd., Taloja, Maharashtra, India), Sodium hydroxide (Merck, 97%,Life Science Pvt. Ltd., Vikhroli, Mumbai, India), Glacial acetic acid (Fisher Scientific, Heysham, Lancashire, UK), Ethanol (Merck, 99.9%, Darmstadt, Germany), sodium sulfide (Na2S, 60%, SRL Pvt. Ltd., Taloja, Maharashtra, India), sodium sulfite (Na2SO3, Alfa Aesar, 98%, Heysham, Lancashire, UK) and extra pure deionized water.
3.2. Synthesis of Mg-Doped TiO2 Nanoparticles
1, 2.5, and 5% Mg-doped TiO2 NPs were produced by a hydrothermal approach using a laboratory autoclave. In order to avoid the direct oxidation of titanium isopropoxide to TiO2, 7.4 mL of glacial acetic acid was added to a round-bottom flask to carry out the reaction under controlled conditions and create an inert atmosphere with the purging of nitrogen gas. Then, 0.74 mL of titanium isopropoxide was added after creating an inert atmosphere with continuous stirring [5]. With the addition of 16.86 mL of distilled water, the final volume reached 25 mL, and the resultant solution is known as 0.1 M Ti4+ [5,65]. For doping 1% Mg ions into 0.1 M TiO2, 25 mL of 0.001 M Magnesium acetate solution was prepared. Subsequently, 50 mL of 0.1 M NaOH solution was added slowly while stirring the mixture on a magnetic stirrer for approximately 30 min. The autoclave containing the reaction mixture was then placed in a vacuum oven and heated for 12 h at a temperature of 150 °C. After cooling the reaction solution down to ambient temperature, it was centrifuged, rinsed many times with double distilled water and ethanol and kept at 60 °C in a vacuum oven to dry for 12 h. The dried precipitate was then ground into powder. For the 2.5 and 5% Mg2+ ion doping in TiO2 nanoparticles, the method was carried out distinctly using 25 mL of 0.0025 M Magnesium acetate solution for 2.5% doping and 25 mL of 0.005 M for 5.0% doping.
3.3. Characterizations
Powder X-ray diffraction (XRD) studies in the 2θ range of 20–80° were performed using a Rigaku Japan D/max 2500 diffractometer at the scanning rate of 5°/min with Ni-filtered Cu Kα1 radiation (λ = 1.5406 Å) and using a step size 0.05°/s to examine phase purity and the crystal structure of the as-prepared samples. Raman spectral investigations were analyzed utilizing an excitation wavelength of 532 nm and a He-Ne laser-equipped RENISHAW inVia Raman microscope (Leica Microsystems CMS GmbH, Wetzlar, Germany). Nanoparticles of undoped and Mg-doped TiO2 were analyzed by TEM using 200 kV TALOS equipment. The TEM samples were prepared in ethanol and a drop casting of suspension on a copper grid (carbon-coated). FESEM was utilized to analyze the surface morphology, elemental mapping and elemental analysis using a Nova Nano SEM-450 microscope (FEI Company, Hillsboro, OR, USA) accelerated at 20 kV voltage coupled with an energy-dispersive X-ray (EDAX) system. Studies of UV-visible DRS were carried out on a PerkinElmer Lambda 365 spectrophotometer. The band gap was calculated by recording reflectance spectra of as-synthesized materials between 200 and 800 nm. Furthermore, the BET surface area studies of Mg-doped TiO2 nanostructures were calculated using Nova 2000e, Quantachrome Instruments Limited, Boynton Beach, FL, USA, at liquid nitrogen temperature.
3.4. Photocatalytic H2 Evolution Measurements
The activity of as-synthesized nanostructures was measured using 0.128 M/500 mg of Na2S and 0.079 M/500 mg of Na2SO3 as sacrificial agents toward photocatalysis of H2O for H2 evolution using a UV-Visible light source [23]. An airtight photo reactor (50 mL cylindrical quartz cell) consisted of 20 mg of as-synthesized nanocatalysts, as required sacrificial agents and 50 mL double-distilled water was used to perform H2 evolution activity [5,30]. To achieve inert atmosphere conditions and flush out any residual gases (such as dissolved oxygen), the prepared solution was stirred while purging nitrogen gas continuously for 30 min. A quartz cell containing the solution mixture was affixed to the stirrer after being well mixed, and its flat surface was then exposed to a 170 W light source (200 W Hg-Xe arc lamp from Newport; Model 66906-200HXF-R15 Ozone-free). H2 production was measured using a Clarus 590 GC from PerkinElmer fitted with a TCD detector and nitrogen as the carrier gas. Samples were obtained hourly using a special airtight glass syringe. After being centrifuged out of the reaction mixture, the photocatalysts were dried and evaluated for their photocatalytic response, which showed maximal H2 generation over the course of three consecutive 8-h cycles. The photocatalysts were separated from the reaction solution via centrifugation, dried in an oven, and analyzed for their reusability, recyclability, photostability and photocatalytic response, the latter of which demonstrated maximum H2 production over the course of three consecutive 8-h cycles.
3.5. Electrode Preparation and Electrocatalytic Measurements
Electrochemical measurements were accompanied by Metrohm Autolab PGSTAT204 with a 3-electrode electrochemical cell setup (Pt wire as counter and saturated calomel electrode as reference electrode) at room temperature in 0.5 N H2SO4 and 0.1 N KOH electrolyte solutions for the HER reactions. A coating of catalyst dispersion on pretreatment ITO substrates with dimensions of 1 × 1 cm2 made working electrodes for electrochemical setup of as-synthesized 1, 2.5, and 5% Mg-doped TiO2 electrocatalysts [5]. The substrate was cleaned with ethanol, acetone, and isopropanol for 15 min in each solvent before being dropped onto the substrates. In order to make catalyst suspensions, 4 mg of electrocatalysts, 300 µL of isopropanol, and 15 µL of Nafion (5 wt%, Alfa Aesar) were mixed together [5,6,35]. The resultant mixtures were subjected to a 30-min sonication process. Following the method described previously, 200 μL of dispersions were dropped onto the conducting side of an ITO substrate (the side with the oxide layer). They were then allowed to dry overnight at 60 °C in a vacuum oven. To measure the electrochemical performance of the produced nanomaterials, LSV measurements were taken at 100 mV, CV measurements were taken in the range of 10–100 mV/s, and CA measurements were taken at −1.0 V for HER.
4. Conclusions
An eco-friendly low-temperature hydrothermal method was utilized to fabricate highly crystalline tetragonal Mg-doped TiO2 nanocatalysts. Increased photocatalytic and electrocatalytic performance can be attributed to various factors like high specific surface area, increased pore volume, the introduction of defects that facilitate Mg2+ ion doping. In terms of electrocatalytic and photocatalytic activity, 2.5% Mg-doped TiO2 exhibited optimum response in terms of HER electrocatalysis in both acidic (0.5 N H2SO4) and alkaline (0.1 NKOH) mediums. Furthermore, 2.5% Mg-doped TiO2 nanocatalysts showed high current density for HER in 0.5 N H2SO4 were 10 mA/cm2 with an overpotential at 0.96 V for HER and with Tafel slope of 123.5 mV/dec. By contrast, 5% Mg-doped TiO2 showed the highest 38.96 mmol H2 evolution in comparison to 1% and 2.5% Mg-doped TiO2 as photocatalysts. In this study, it was deduced that 5% Mg-doped TiO2 and 2.5% Mg-doped TiO2 nanocatalysts have better photo- and electro-catalytic activity, respectively. Therefore, we anticipate that these materials have the potential to upgrade the efficiency of sustainable energy resources due to their efficiency in photo/electrocatalysis for water splitting.
Author Contributions
M.F. is responsible for experimental investigation, data collection, measurements, analysis and rough draft of the manuscript, whereas T.A. is responsible for analysis, conceptualization, supervision and final draft of the manuscript. Y.M. and S.M.A. have been involved in data analysis, discussions and final reviewing of manuscripts. All authors have read and agreed to the published version of the manuscript.
Funding
T.A. thanks UGC, New Delhi, Govt. of India for the Research Grant for In-service Faculty Members. The authors also thank SERB, CSIR, BRNS and MoE (SPARC/2018-2019/P843/SL) for financial support to Nano Chemistry and Nano Energy Labs. The authors extend their sincere appreciation to Researchers Supporting Project number (RSP2023R29), King Saud University, Riyadh, Saudi Arabia.
Acknowledgments
T.A. thanks UGC, New Delhi, Govt. of India for Research Grant for In-service Faculty Members. Authors also thank SERB, CSIR, BRNS and MoE (SPARC/2018-2019/P843/SL) for financial support to Nano Chemistry and Nano Energy Labs. M.F. thanks to UGC, New Delhi for the research fellowship. Authors also acknowledge the DST PURSE program at CIF JMI and AIIMS New Delhi for electron microscopic studies. The authors extend their sincere appreciation to Researchers Supporting Project number (RSP2023R29), King Saud University, Riyadh, Saudi Arabia.
Conflicts of Interest
The authors declare no financial competing interest.
References
- Sadiq, I.; Ali, S.A.; Ahmad, T. Graphene-based derivatives heterostructured catalytic systems for sustainable hydrogen energy via overall water splitting. Catalysts 2023, 13, 109. [Google Scholar] [CrossRef]
- Wang, C.; Li, C.; Liu, J.; Guo, C. Engineering transition metal-based nanomaterials for high-performance electrocatalysis. Mater. Rep. Energy 2021, 1, 100006. [Google Scholar] [CrossRef]
- Pandit, M.A.; Billakanti, S.; Muralidharan, K. A simplistic approach for the synthesis of CuS-CdS heterostructure: A novel photocatalyst for oxidative dye degradation. J. Environ. Chem. Eng. 2020, 8, 103542. [Google Scholar] [CrossRef]
- Bergamini, L.; Sangiorgi, N.; Gondolini, A.; Sanson, A. CsPbBr3 for photoelectrochemical cells. Sol. Energy 2020, 212, 62–72. [Google Scholar] [CrossRef]
- Fazil, M.; Ahmad, T. Pristine TiO2 and Sr-doped TiO2 nanostructures for enhanced photocatalytic and electrocatalytic water splitting applications. Catalysts 2023, 13, 93. [Google Scholar] [CrossRef]
- Khan, H.; Lone, I.H.; Lofland, S.E.; Ramanujachary, K.V.; Ahmad, T. Exploiting multiferroicity of TbFeO3 nanoparticles for hydrogen generation through photo/electro/photoelectro-catalytic watersplitting. Int. J. Hydrogen Energy 2023, 48, 5493–5505. [Google Scholar] [CrossRef]
- Li, M.; Song, W.; Zeng, L.; Zeng, D.; Xie, C.; Yang, Q. Mechanistic study of N–H- and H–N-codoping of a TiO2 photocatalyst for efficient degradation of benzene under visible light. RSC Adv. 2020, 10, 2757–2766. [Google Scholar] [CrossRef]
- Pandit, N.A.; Ahmad, T. Tin oxide based hybrid nanostructures for efficient gas sensing. Molecules 2022, 27, 7038. [Google Scholar] [CrossRef]
- Hameed, R.A. Nanostructured phosphides as electrocatalysts for green energy generation in noble metal-free electrocatalysts: New trends in electrocatalysts for energy applications. J. Am. Chem. Soc. 2022, 2, 191–235. [Google Scholar]
- Srinivas, B.; Pandit, M.A.; Muralidharan, K. Importance of clean surfaces on the catalyst: SnS2 nanorings for environmental remediation. ACS Omega 2019, 4, 14970–14980. [Google Scholar] [CrossRef]
- Wealer, B.; Seidel, J.P.; Hirschhausen, C. Decommissioning of nuclear power plants and storage of nuclear waste: Experiences from Germany, France, and the UK. In Technological and Economic Future of Nuclear Power; Springer: Berlin/Heidelberg, Germany, 2019; pp. 261–286. [Google Scholar]
- Gao, L.; Li, Y.; Ren, J.; Wang, S.; Wang, R.; Fu, G.; Hu, Y. Passivation of defect states in anatase TiO2 hollow spheres with Mg doping: Realizing efficient photocatalytic overall water splitting. Appl. Catal. B Environ. 2017, 202, 127–133. [Google Scholar] [CrossRef]
- Baum, Z.J.; Diaz, L.L.; Konovalova, T.; Zhou, Q.A. Materials research directions toward a green hydrogen economy: A review. ACS Omega 2022, 7, 32908–32935. [Google Scholar] [CrossRef] [PubMed]
- Shaheen, S.; Sadiq, I.; Ali, S.A.; Ahmad, T. Bismuth-based multi-component heterostructured nanocatalysts for hydrogengeneration. Catalysts 2023, 13, 295. [Google Scholar] [CrossRef]
- Basavarajappa, P.S.; Patil, S.B.; Ganganagappa, N.; Reddy, K.R.; Raghu, A.V.; Reddy, C.V. Recent progress in metal-doped TiO2, non-metal doped/codoped TiO2 and TiO2 nanostructured hybrids for enhanced photocatalysis. Int. J. Hydrogen Energy 2020, 45, 7764–7778. [Google Scholar] [CrossRef]
- Ali, S.A.; Ahmad, T. Chemical strategies in molybdenum based chalcogenides nanostructures for photocatalysis. Int. J. Hydrogen Energy 2022, 29, 29255–29283. [Google Scholar] [CrossRef]
- Mehtab, A.; Banerjee, S.; Mao, Y.; Ahmad, T. Type-II CuFe2O4/graphitic carbon nitride heterojunctions for high-efficiency photocatalytic and electrocatalytic hydrogen generation. ACS Appl. Mater. Interfaces 2022, 14, 44317–44329. [Google Scholar] [CrossRef] [PubMed]
- Ali, S.A.; Sadiq, I.; Ahmad, T. Oxide based heterostructured photocatalysts for CO2 reduction and hydrogen generation. ChemistrySelect 2023, 8, e202203176. [Google Scholar] [CrossRef]
- Khan, M.I.; Farooq, W.A.; Saleem, M.; Bhatti, K.A.; Atif, M.; Hanif, A. Phase change, bandgap energy and electrical resistivity of Mg doped TiO2 multilayer thin films for dye sensitized solar cells applications. Ceram. Int. 2019, 45, 21436–21439. [Google Scholar] [CrossRef]
- Jain, S.K.; Fazil, M.; Naaz, F.; Pandit, N.A.; Ahmed, J.; Alshehri, S.M.; Mao, Y.; Ahmad, T. Silver-doped SnO2 nanostructures for photocatalytic watersplitting and catalytic nitrophenol reduction. New J. Chem. 2022, 46, 2846–2857. [Google Scholar] [CrossRef]
- Liu, Y.; Zhou, W.; Liang, Y.; Cui, W.; Wu, P. Tailoring band structure of TiO2 to enhance photoelectrochemical activity by codoping S and Mg. J. Phys. Chem. C 2015, 119, 11557–11562. [Google Scholar] [CrossRef]
- Nurlaela, E.; Ziani, A.; Takanabe, K. Tantalum nitride for photocatalytic watersplitting: Concept and applications. Mater. Renew. Sustain. Energy 2016, 5, 18. [Google Scholar] [CrossRef]
- Khan, H.; Mehtab, A.; Ahmed, J.; Lofland, S.E.; Ramanujachary, K.V.; Ahmad, T. Harvesting green hydrogen by self propelling built-in electric field photo/electro-catalytic performance of DyCrO3 nanoparticles developed by reverse microemulsion route. ChemNanoMat 2023, e202300091. [Google Scholar] [CrossRef]
- Li, P.; Kong, L.; Liu, J.; Yan, J.; Liu, S. Photoassisted hydrothermal synthesis of IrOx–TiO2 for enhanced water oxidation. ACS Sustain. Chem. Eng. 2019, 7, 17941–17949. [Google Scholar] [CrossRef]
- Kumar, S.S.; Himabindu, V. Hydrogen production by PEM water electrolysis—A review. Mater. Sci. Energy Technol. 2019, 2, 442–454. [Google Scholar]
- Trotochaud, L.; Young, S.L.; Ranney, J.K.; Boettcher, S.W. Nickel-iron oxyhydroxide oxygen-evolution electrocatalysts: The role of intentional and incidental iron incorporation. J. Am. Chem. Soc. 2014, 136, 6744–6753. [Google Scholar] [CrossRef]
- Herbaut, M.; Siaj, M.; Claverie, J.P. Nanomaterials-based water splitting: How far are we from a sustainable solution? ACS Appl. Nano Mater. 2021, 4, 907–910. [Google Scholar] [CrossRef]
- Ge, S.; Zhang, L.; Hou, J.; Liu, S.; Qin, Y.; Liu, Q.; Cai, X.; Sun, Z.; Yang, M.; Luo, J.; et al. Cu2O-derived Pt Cu nanoalloy toward energy-efficient hydrogen production via hydrazine electrolysis under large current density. ACS Appl. Energy Mater. 2022, 5, 9487–9494. [Google Scholar] [CrossRef]
- Du, L.; Sun, Y.; You, B. Hybrid water electrolysis: Replacing oxygen evolution reaction for energy-efficient hydrogen production and beyond. Mater. Rep. Energy 2021, 1, 100004. [Google Scholar] [CrossRef]
- Mehtab, A.; Alshehri, S.M.; Ahmad, T. Photocatalytic and photoelectrocatalytic water splitting by porous g-C3N4 nanosheets for hydrogen generation. ACS Appl. Nano Mater. 2022, 5, 12656–12665. [Google Scholar] [CrossRef]
- Xu, X.; Shao, Z.; Jiang, S.P. High-Entropy Materials for Water Electrolysis. Energy Technol. 2022, 10, 2200573. [Google Scholar] [CrossRef]
- Anantharaj, S.; Noda, S. Amorphous catalysts and electrochemical watersplitting: An untold story of harmony. Small 2020, 16, 1905779. [Google Scholar] [CrossRef] [PubMed]
- Da Silva, G.C.; Venturini, S.I.; Zhang, S.; Löffler, M.; Scheu, C.; Mayrhofer, K.J.; Ticianelli, E.A.; Cherevko, S. Oxygen evolution reaction on tinoxides supported iridium catalysts: Do we need dopants? ChemElectroChem 2020, 7, 2330–2339. [Google Scholar]
- Vasu, D.; Keyan, A.K.; Sakthinathan, S.; Chiu, T. Investigation of electrocatalytic and photocatalytic ability of Cu/Ni/TiO2/MWCNTs nanocomposites for detection and degradation of antibiotic drug Furaltadone. Sci. Rep. 2022, 12, 886. [Google Scholar] [CrossRef]
- Ali, S.A.; Ahmad, T. Enhanced hydrogen generation via overall water splitting using novel MoS2-BN nanoflowers assembled TiO2 ternary heterostructures. Int. J. Hydrogen Energy 2023. [Google Scholar] [CrossRef]
- Abdelghafar, F.; Xu, X.; Shao, Z. Designing single-atom catalysts toward improved alkaline hydrogen evolution reaction. Mater. Rep. Energy 2022, 2, 100144. [Google Scholar] [CrossRef]
- Bergamini, L.; Sangiorgi, N.; Gondolini, A.; Rancan, M.; Bottaro, G.; Armelao, L.; Sanson, A. CsPbBr3/platinum and CsPbBr3/graphite hybrid photoelectrodes for carbondioxide conversion to oxalic acid. Sol. Energy 2023, 254, 213–222. [Google Scholar] [CrossRef]
- Naaz, F.; Alshehri, S.M.; Mao, Y.; Ahmad, T. Unraveling the Chemoselective Catalytic, Photocatalytic and Electrocatalytic Applications of Copper supported WO3 Nanosheets. Catal. Commun. 2023, 178, 106678. [Google Scholar] [CrossRef]
- Vignesh, K.; Mathew, S.; Bartlett, J.; Pillai, S.C. Photocatalytic hydrogen production using metal doped TiO2: A review of recent advances. Appl. Catal. B Environ. 2019, 244, 1021–1064. [Google Scholar]
- Samuel, E.; Joshi, B.; Kim, M.; Swihart, M.T.; Yoon, S.S. Morphology engineering of photoelectrodes for efficient photoelectrochemical watersplitting. Nano Energy 2020, 72, 104648. [Google Scholar] [CrossRef]
- Mehtab, A.; Ahmad, T. Investigating the Spatial Charge Density Flow and Molecular Structure of g-C3N4 Photocatalyst from a Computational Perspective. Appl. Catal. A Gen. 2023, 659, 119190. [Google Scholar] [CrossRef]
- Kim, H.J.; Jackson, D.H.; Lee, J.; Guan, Y.; Kuech, T.F.; Huber, G.W. Enhanced activity and stability of TiO2-coated cobalt/carbon catalysts for electrochemical wateroxidation. ACS Catal. 2015, 5, 3463–3469. [Google Scholar] [CrossRef]
- Lei, M.; Guo, S.; Wang, Z.; Zhu, L.; Tang, H. Ultra rapid and deep debromination of tetrabromodiphenylether over noble-metal-free Cu/TiO2 nanocomposites under mild conditions. Environ. Sci. Technol. 2018, 52, 11743–11751. [Google Scholar] [PubMed]
- Lee, C.G.; Javed, H.; Zhang, D.; Kim, J.H.; Westerhoff, P.; Li, Q.; Alvarez, P.J. Porous electrospun fibers embedding TiO2 for adsorption and photocatalytic degradation of water pollutants. Environ. Sci. Technol. 2018, 52, 4285–4293. [Google Scholar] [CrossRef] [PubMed]
- Hamad, H.; Elsenety, M.M.; Sadik, W.; El-Demerdash, A.; Nashed, A.; Mostafa, A.; Elyamny, S. The superior photocatalytic performance and DFT insights of S-scheme CuO@TiO2 heterojunction composites for simultaneous degradation of organics. Sci. Rep. 2022, 12, 2217. [Google Scholar] [CrossRef] [PubMed]
- Li, C.; Hu, P.; Meng, H.; Jiang, Z. Role of sulfites in the water splitting reaction. J. Solut. Chem. 2016, 45, 67–80. [Google Scholar] [CrossRef]
- Gautam, A.; Sk, S.; Pal, U. Recent advances in solution assisted synthesis of transition metal chalcogenides for photo-electrocatalytic hydrogen evolution. Phys. Chem. Chem. Phys. 2022, 24, 20638–20673. [Google Scholar] [CrossRef]
- Ali, S.A.; Ahmad, T. Treasure trove for efficient hydrogen evolution through water splitting using diverse perovskite photocatalysts. Mater. Today Chem. 2023, 29, 101387. [Google Scholar] [CrossRef]
- Kavaliunas, V.; Krugly, E.; Sriubas, M.; Mimura, H.; Laukaitis, G.; Hatanaka, Y. Influence of Mg, Cu, and Ni dopants on amorphous TiO2 thin films photocatalytic activity. Materials 2020, 13, 886. [Google Scholar] [CrossRef]
- Wu, Y.; Li, Y.; Hu, H.; Zeng, G.; Li, C. Recovering hydrogen energy from photocatalytic treatment of pharmaceutical-contaminated water using Co3O4 modified {001}/{101}-TiO2 nanosheets. ACS ES&T Eng. 2021, 1, 603–611. [Google Scholar]
- Athira, K.; Merin, K.T.; Raguram, T.; Rajni, K.S. Synthesis and characterization of Mg doped TiO2 nanoparticles for photocatalytic applications. Mater. Today Proc. 2020, 33, 2321–2327. [Google Scholar]
- Singh, S.V.; Kumar, M.P.; Anantharaj, S.; Mukherjee, B.; Kundu, S.; Pal, B.N. Direct evidence of an efficient plasmon-induced hot-electron transfer at an in situ grown Ag/TiO2 interface for highly enhanced solar H2 generation. ACS Appl. Energy Mater. 2020, 3, 1821–1830. [Google Scholar] [CrossRef]
- Park, H.; Kim, H.; Moon, G.; Choi, W. Photoinduced charge transfer processes in solar photocatalysis based on modified TiO2. Energy Environ. Sci. 2016, 9, 411–433. [Google Scholar] [CrossRef]
- Behnajady, M.A.; Alizade, B.; Modirshahla, N. Synthesis of Mg-doped TiO2 nanoparticles under different conditions and its photocatalytic activity. Photochem. Photobiol. 2011, 87, 1308–1314. [Google Scholar] [CrossRef] [PubMed]
- Malligavathy, M.; Iyyapushpam, S.; Nishanthi, S.T.; Padiyan, D.P. Photoreduction synthesis of silver on Bi2O3/TiO2 nanocomposites and their catalytic activity for the degradation of methyl orange. J. Mater. Sci. Mater. Electron. 2017, 28, 18307–18321. [Google Scholar] [CrossRef]
- Giahi, M.; Pathania, D.; Agarwal, S.; Ali, G.A.; Chong, K.F.; Gupta, V.K. Preparation of Mg-doped TiO2 nanoparticles for photocatalytic degradation of some organic pollutants. Stud. UBB Chem. 2019, 64, 7–18. [Google Scholar] [CrossRef]
- Arshad, Z.; Khoja, A.H.; Shakir, S.; Afzal, A.; Mujtaba, M.A.; Soudagar, M.E.M.; Fayaz, H.; Farukh, S.; Saeed, M. Magnesium doped TiO2 as an efficient electron transport layer in perovskite solar cells. Case Stud. Therm. Eng. 2021, 26, 101101. [Google Scholar] [CrossRef]
- Le, T.S.; Hoa, T.H.; Truong, D.Q. Shape-controlled f-doped TiO2 nanocrystals for Mg-ion batteries. J. Electroanal. Chem. 2019, 848, 113293. [Google Scholar] [CrossRef]
- Tristantini, D.; Ibadurrohman, M. Photocatalytic hydrogen production from glycerol–water mixture over Pt-N-TiO2 nanotube photocatalyst. Int. J. Energy Res. 2013, 11, 1372–1381. [Google Scholar]
- Zhang, X.; Song, P.; Cui, X. Nitrogen-doped TiO2 photocatalysts synthesized from titanium nitride: Characterizations and photocatalytic hydrogen evolution performance. J. Adv. Oxid. Technol. 2013, 16, 131–136. [Google Scholar] [CrossRef]
- Kumar, M.K.; Bhavani, K.; Srinivas, B.; Kumar, S.N.; Sudhakar, M.; Naresh, G.; Venugopal, A. Nanostructured bismuth and nitrogen co-doped TiO2 as an efficient light harvesting photocatalyst under natural sunlight for the production of H2 by H2O splitting. Appl. Catal. A 2016, 515, 91–100. [Google Scholar] [CrossRef]
- Chen, D.; Gao, H.; Yao, Y.; Zhu, L.; Zhou, X.; Peng, X.; Zhang, X. Pd loading, Mn+ (n = 1, 2, 3) metal ions doped TiO2 nanosheets for enhanced photocatalytic H2 production and reaction mechanism. Int. J. Hydrogen Energy 2022, 47, 10250–10260. [Google Scholar] [CrossRef]
- Wei, X.; Li, J.; Liu, Z.; Yang, X.; Naraginti, S.; Xu, X.; Wang, X. Visible light photocatalytic mineralization of 17α-ethinylestradiol (EE2) and hydrogen evolution over silver and strontium modified TiO2 nanoparticles: Mechanisms and phytotoxicity assessment. RSC Adv. 2018, 8, 4329–4339. [Google Scholar] [CrossRef]
- Farooq, U.; Ahmed, J.; Alshehri, S.M.; Mao, Y.; Ahmad, T. Self-assembled interwoven nanohierarchitectures of NaNbO3 and NaNb1−xTaxO3 (0.05 ≤ x ≤ 0.20): Synthesis, structural characterization, photocatalytic applications, and dielectric properties. ACS Omega 2022, 7, 16952–16967. [Google Scholar] [CrossRef] [PubMed]
- Ganguli, A.K.; Vaidya, S.; Ahmad, T. Synthesis of nanocrystalline materials through reverse micelles: A versatile methodology for synthesis of complex metal oxides. Bull. Mater. Sci. 2008, 31, 415–419. [Google Scholar] [CrossRef]
Figure 1.
PXRD patterns of the as-synthesized 1, 2.5 and 5% Mg-doped TiO2 NPs. Inset shows the crystal structure of Mg-doped TiO2 anatase phase.
Figure 1.
PXRD patterns of the as-synthesized 1, 2.5 and 5% Mg-doped TiO2 NPs. Inset shows the crystal structure of Mg-doped TiO2 anatase phase.

Figure 2.
(a–c) TEM micrographs, (d–f) size distribution plots, and (g–i) HRTEM micrographs depicting the lattice spacing of the crystallographic planes of 1%, 2.5% and 5% Mg-doped TiO2 NPs.
Figure 2.
(a–c) TEM micrographs, (d–f) size distribution plots, and (g–i) HRTEM micrographs depicting the lattice spacing of the crystallographic planes of 1%, 2.5% and 5% Mg-doped TiO2 NPs.

Figure 3.
SEM micrographs of (a) 1%, (b) 2.5% and (c) 5% Mg-doped TiO2 nanostructures.

Figure 4.
Elemental mapping (Inset shows maps of Ti, Mg and O with SEM micrographs) of as-synthesized (a) 1% and (c) 5% and EDAX spectra of (b) 1%, (d) 2.5% and (e) 5% Mg-doped TiO2 nanoparticles.
Figure 4.
Elemental mapping (Inset shows maps of Ti, Mg and O with SEM micrographs) of as-synthesized (a) 1% and (c) 5% and EDAX spectra of (b) 1%, (d) 2.5% and (e) 5% Mg-doped TiO2 nanoparticles.

Figure 5.
(a) UV-vis DRS and (b)Tauc’s plot of 1, 2.5 and 5% Mg-doped TiO2 NPs.

Figure 6.
Raman spectra of 1, 2.5 and 5% Mg-doped TiO2 nanoparticles.

Figure 7.
(a) Nitrogen adsorption–desorption isotherms, (b) BJH pore-size distribution, and (c) DA average pore-size distribution plots of 1, 2.5 and 5% Mg-doped TiO2 NPs.
Figure 7.
(a) Nitrogen adsorption–desorption isotherms, (b) BJH pore-size distribution, and (c) DA average pore-size distribution plots of 1, 2.5 and 5% Mg-doped TiO2 NPs.

Figure 8.
(a) Photocatalytic H2 evolution curves under the UV-visible light irradiation as the function of irradiation time, (b) comparison of photocatalytic activity, (c) Average H2 evolution per hour of 1, 2.5 and 5% Mg-doped TiO2 NPs and (d) stability test of 5% Mg-doped TiO2 for up to three cycles.

Figure 9.
Schematic representation and possible electron transfer mechanism of photocatalytic H2 evolution.
Figure 9.
Schematic representation and possible electron transfer mechanism of photocatalytic H2 evolution.

Figure 10.
(a,b,d,e) show the LSV and CV plots of HER of as-synthesized 1, 2.5, 5% Mg-doped TiO2, whereas (c,f) show the CV plots of 2.5% Mg-doped TiO2 towards HER in 0.5 N H2SO4 and 0.1 N KOH electrolytic solution, respectively.
Figure 10.
(a,b,d,e) show the LSV and CV plots of HER of as-synthesized 1, 2.5, 5% Mg-doped TiO2, whereas (c,f) show the CV plots of 2.5% Mg-doped TiO2 towards HER in 0.5 N H2SO4 and 0.1 N KOH electrolytic solution, respectively.

Figure 11.
(a,b) shows HER Tafel plots of 1, 2.5, 5% Mg-doped TiO2 in 0.5 N H2SO4 and 0.1 N KOH electrolytic solution.
Figure 11.
(a,b) shows HER Tafel plots of 1, 2.5, 5% Mg-doped TiO2 in 0.5 N H2SO4 and 0.1 N KOH electrolytic solution.

Figure 12.
CA analysis at −1.0 V of 2.5% Mg-doped TiO2 nanoparticles.


Table 1.
BET surface area (SBET), Average pore size and Pore volume (VTotal) of synthesized nanocatalysts.
Table 1.
BET surface area (SBET), Average pore size and Pore volume (VTotal) of synthesized nanocatalysts.
| Sample | SBET/(m2 g−1) | Average Pore Size/Å | VTotal/(cm3 g−1) |
|---|---|---|---|
| 1% Mg-doped TiO2 | 152.9 | 16.95 | 0.317 |
| 2.5% Mg-doped TiO2 | 164.2 | 16.93 | 0.391 |
| 5% Mg-doped TiO2 | 198.1 | 17.08 | 0.449 |
Table 2.
Comparison of metal-doped TiO2 photocatalytic performance, synthesized by different methods.
Table 2.
Comparison of metal-doped TiO2 photocatalytic performance, synthesized by different methods.
| S. No. | Dopant | Synthesis Method | Parameters | Hydrogen Production | Ref. |
|---|---|---|---|---|---|
| 1. | Platinum, Nitrogen | Photodeposition method | 1150 mL Pyrex vessel, UV light | 3200 μmol | [59] |
| 2. | Nitrogen | Solid state/calcination method | UV-Vis light irradiation, Na2S/Na2SO3 | 18 μmol | [60] |
| 3. | Bismuth, Nitrogen | Sol-gel method | Solar light, methanol | 1800 μmol g−1 | [61] |
| 4. | Pd/0.2% K+ | Hydrothermal method | _ | 76.6 μmol h−1 | [62] |
| 5. | Strontium, silver | sol-gel method | 500 W Xe arc lamp | 49.4 μmol h−1 | [63] |
| 6. | Strontium | Hydrothermal method | 200 W, Hg-Xe arc lamp | 3.3 mmol h−1 | [5] |
| 7. | Magnesium | Hydrothermal method | 170 W, Hg-Xe arc lamp | 4.87 mmol h−1 | In this work |
Table 3.
HER electrodic parameters of Mg-doped TiO2 electrocatalysts in 0.5 N H2SO4 solution.
| S. No. | Materials | HER | Ref. | |
|---|---|---|---|---|
| Overpotential (V) to Attain 10 mA/cm2 | Tafel Slope (mV/dec) | |||
| 1. | 1% Mg-doped TiO2 | 0.99 | 139.57 | This work |
| 2. | 2.5% Mg-doped TiO2 | 0.98 | 123.5 | This work |
| 3. | 5% Mg-doped TiO2 | 0.95 | 130.26 | This work |
| 4. | Pristine TiO2 | 1.00 | 133.33 | [5] |
Table 4.
HER electrodic parameters of Mg-doped TiO2 electrocatalysts in 0.1 N KOH solution.
| S. No. | Materials | HER | |
|---|---|---|---|
| Cathodic Current Density (mA/cm2) at −1.38 V | Tafel Slope (mV/dec) | ||
| 1. | 1% Mg-doped TiO2 | 0.436 | 208.73 |
| 2. | 2.5% Mg-doped TiO2 | 1.00 | 126.30 |
| 3. | 5% Mg-doped TiO2 | 0.786 | 187.83 |
Disclaimer/Publisher’s Note: The statements, opinions and data contained in all publications are solely those of the individual author(s) and contributor(s) and not of MDPI and/or the editor(s). MDPI and/or the editor(s) disclaim responsibility for any injury to people or property resulting from any ideas, methods, instructions or products referred to in the content. |
© 2023 by the authors. Licensee MDPI, Basel, Switzerland. This article is an open access article distributed under the terms and conditions of the Creative Commons Attribution (CC BY) license (https://creativecommons.org/licenses/by/4.0/).
Share and Cite
MDPI and ACS Style
Fazil, M.; Alshehri, S.M.; Mao, Y.; Ahmad, T. Hydrothermally Derived Mg-Doped TiO2 Nanostructures for Enhanced H2 Evolution Using Photo- and Electro-Catalytic Water Splitting. Catalysts 2023, 13, 893. https://doi.org/10.3390/catal13050893
AMA Style
Fazil M, Alshehri SM, Mao Y, Ahmad T. Hydrothermally Derived Mg-Doped TiO2 Nanostructures for Enhanced H2 Evolution Using Photo- and Electro-Catalytic Water Splitting. Catalysts. 2023; 13(5):893. https://doi.org/10.3390/catal13050893
Chicago/Turabian StyleFazil, Mohd, Saad M. Alshehri, Yuanbing Mao, and Tokeer Ahmad. 2023. "Hydrothermally Derived Mg-Doped TiO2 Nanostructures for Enhanced H2 Evolution Using Photo- and Electro-Catalytic Water Splitting" Catalysts 13, no. 5: 893. https://doi.org/10.3390/catal13050893
Note that from the first issue of 2016, this journal uses article numbers instead of page numbers. See further details here.