
Alkali and Alkaline Earth Metals (K, Ca, Sr) Promoted Cu/SiO2 Catalyst for Hydrogenation of Methyl Acetate to Ethanol
by
 ,
,
Muhammad Naeem Younis
1,2,3,†,
Zhiheng Ren
2,†,
Chunshan Li
2,3,
Erqiang Wang
3,* and
Jie Li
1,2,* 1
Advanced Energy Science and Technology Guangdong Laboratory, Huizhou 516003, China
2
Beijing Key Laboratory of Ionic Liquids Clean Process, Key Laboratory of Green Process and Engineering, Key Laboratory of Multiphase Complex Systems, Institute of Process Engineering, Chinese Academy of Sciences, Beijing 100190, China
3
School of Chemical Engineering, University of Chinese Academy of Sciences, Beijing 100049, China
*
Authors to whom correspondence should be addressed.
†
These authors contributed equally to this work.
Catalysts 2023, 13(2), 450; https://doi.org/10.3390/catal13020450
Submission received: 28 December 2022
/
Revised: 11 February 2023
/
Accepted: 16 February 2023
/
Published: 20 February 2023
(This article belongs to the Section Catalytic Reaction Engineering)
Abstract
:The advancing effects of various alkali and alkaline earth metals (inclusive of K, Ca, and Sr) modified Cu/SiO2 catalysts, prepared with a modified precipitation-gel method, were investigated for the production of ethanol via hydrogenation of methyl acetate. Our results showed that Sr-doped catalysts exhibited the best and most consistent results during catalytic tests. A series of techniques, including X-ray diffraction technique, Raman spectroscopy, N2 adsorption/desorption, N2O titration method, FTIR spectroscopy, and H2 temperature, programmed desorption and reduction (TPD and TPR), and X-ray Photoelectron Spectroscopy, which was used to check the detailed characterization of Sr modification in the catalyst and its structural impacts on the properties of the catalyst. These results demonstrated that the addition of 5%Sr could strengthen the intrinsic stability of the catalyst by formulating the appropriate ratio of Cu+/(Cu0 + Cu+) to facilitate catalytic outcome improvement. The addition of 5%Sr-30%Cu/SiO2 under the most favorable conditions, resulting in the peak conversion of MA (95%) and ethanol selectivity (96%), indicates its magnificent catalytic stabilizing effects. Furthermore, the best performing catalyst was compared and tested under various conditions (LHSV and temperatures) and a 300 h long life run.
1. Introduction
Ethanol possesses an eco-friendly nature and acts as a renewable biofuel and sustainable energy source. It has been produced by using various biomass fermenting techniques for a long time, via different biological steps, all with high cost [1,2]. In this advanced research era, a new catalytic hydrogenation method to synthesize ethanol has gained remarkable attention, as the equipment used for the whole preparatory phase is economical, simple, and efficient as compared to expensive equipment used in acetic acid hydrogenation [3,4]. The hydrogenation of methyl acetate (MA) to synthesize ethanol is getting remarkable attention, as the MA being used is obtained from reacting acetic acid with methanol, which may further cut down the excessiveness of acetic acid and prevent its hydrogenation shortcomings [5]. Another source of MA is natural gas and coal, which is the result of a recent outpour towards the usage of shale gas and coal. Therefore, the hydrogenation of MA could be an economical and environment friendly process [6].
Various preparatory techniques have been used to formulate highly efficient catalysts in the hydrogenation process, including ammonia evaporation procedure [7,8,9,10], ion exchange method [11], impregnation technique [12], and urea precipitation method [13,14]. In MA hydrogenation, Cu/SiO2 is the preferred catalyst because of its irreducible SiO2 support and economical characteristics [15,16,17], and it constitutes sufficient Cu to improve the efficiency of the overall procedure [9]. According to previous literature, a Cu-based catalyst was found to be very active for C=O bond hydrogenation but inactive for C-C bond cleavage, although many of the precious metal catalysts behave otherwise [18,19,20,21,22,23,24]. Cu+ sites concentration on the surface of the catalyst supported strong bonding and adsorption of methoxy and acyl groups, while Cu0 sites supported hydrogen decomposition [25]. It has been demonstrated that the coexistence, balancing, appropriate distribution, and cooperated association between both Cu0 and Cu+ sites synergistically presented an enhanced catalytic effect and stability [5].
Cu/SiO2 catalyst modification with chromium (Cr) oxide has been a favored catalyst due to its greater stability and catalytic activity, but Cr toxicity causing ecological issues has made its applicability very restricted [26,27]. Instead of Cr, the catalytic performance of Cu/SiO2 could also be enhanced, stabilized, and made efficient by adding one more metal like Ce, La, Mg, Ag, Zn, Mn, In, B, or Ni, specifically increasing the concentration of Cu+ on the surface area and Cu dispersion [6,22,28,29,30,31,32,33,34,35,36]. The role of metal oxides in addition to the catalyst has been found to give signifying results owing to their agglomerating and sintering characteristics. A positive response of Zn-modified Cu/SiO2 catalyst was reported by Ying Ming et al. as demonstrating excellent activity of the catalyst for ethanol synthesis through ethyl acetate hydrogenation [37]. La-oxide addition to Cu/SiO2 to generate ethylene glycol via dimethyl oxalate hydrogenation was found to be significant to promote the activity of the catalyst [38]. CeO2-loaded Cu/SiO2 was examined by Ye et al., showing promoted results of the catalyst and stability via the reduction of Cu crystals and its dispersion enhancement [8].
It has been reported that promotion with alkali and alkaline metals of the catalyst Cu/SiO2 could generate the basic sites and influence the electronic structure of metal particles, which enhances the thermic stability and surface Cu dispersion during overall hydrogenation [39]. The addition of alkali earth metals could influence the active metal particles by stabilizing the small size of active metals and ultimately reducing the chances of agglomeration [40,41]. It was also reported that the addition of Ca, Sr, and K could increase surface area and enhance catalytic activity [42,43]. The structural composition of the catalyst, high Cu dispersion at the surface, strong Cu and silica chemical bonding, surface modifications, and the appropriate surface ratio of Cu+/(Cu0 + Cu+) all are vital characteristics for the promotion of catalytic efficiency. However, Cu catalysts are still challenging to overcome in their short lifetime, and the copper–silica interactions and the variations in structural composition during the whole hydrogenation procedure were hardly investigated. As far as we know, no detailed study has been reported on K, Ca, and Sr-modified Cu/SiO2 catalyst systems prepared by using the precipitation gel method for the hydrogenation reaction of MA.
In the present research work, the promoting effects of alkali and alkaline earth metals (K, Ca, and Sr) modified Cu/SiO2 catalysts for MA hydrogenation to produce ethanol was examined. The modified precipitation gel method was used to prepare the series of catalysts, and various analytical techniques were used to check the characterization of the prepared catalyst for the evaluation of promotor and copper interactions. By modifying additive quantities of Sr in the catalyst, the suitable ratio was finalized for Cu/SiO2 for MA hydrogenation to synthesize ethanol over 5%Sr-30%Cu/SiO2.
2. Results and Discussion
2.1. Physicochemical Properties of the Catalysts
The chemical compositions of the catalysts were estimated by ICP-AES and presented in Table 1, and these values were slightly lower than the designed values because some metal ions were weakly absorbed on silica gel and eluted during the repeated washing process.
The BET analysis was conducted to get the N2 adsorption–desorption isotherms and the BJH (Barret–Joyner–Halenda) pore size distribution of these catalysts, as exhibited in Figure 1. The isotherms of all the catalysts have followed the IUPAC type IV isotherms pattern, where a hysteresis loop was formed from p/p° ≈ 0.6–1.0, indicating the existence of a typical H3 class mesoporous structure [7,44]. The surface area (BET), and mean pore diameter (BJH method) of the support and catalysts are tabulated in Table 1, which indicates that the BET surface significantly improved in the promoted catalyst, with 5% Sr-promoted catalyst showing the maximum surface area of 119.3 m2/g. It is also of substantial importance that the BJH-pore volume of promoted catalysts also increased, which is a reason for improved activity and stability. Although the addition of promotor enhances the copper dispersion and decreases the aggregation of copper species, which usually causes the obstruction of pores, we observed increased BET surface area, pore diameter, and pore volume in the case of 5%Sr-30%Cu/SiO2 catalyst, as explained in TEM and XPS analysis in Section 3.3 and Section 3.5, respectively. However, the results also indicated that when the loading of Sr was further increased, BET surface area and BJH-pore volume decreased, which also explains the reduced MA conversion and selectivity of ethanol due to the formation of agglomerates [28,39]. Figure 1 revealed that the pore size of promoted catalysts lies in the range of 10–60 nm in most of the promoted catalysts.
In addition, copper species distribution during the hydrogenation of MA is crucial in determining the catalytic activities of Cu-based catalysts; therefore, the copper surface area of reduced catalysts was estimated via N2O titration and combined with CO-TPD and XAES analysis [29]. Following the introduction of the promoter, the surface area of Cu+ is increased in the reduced sample, whereas the surface area of Cu0 does not differ much from Cu/SiO2, as shown in Table 1. Cu/SiO2 with increased Sr content exhibits higher SCu+ values than other catalysts, and 5%Sr-30%Cu/SiO2, in particular, displays the highest SCu+ (44.6 m2/g). Nevertheless, a sufficient amount of Sr may increase SCu+ values without adverse consequences, which might be caused by the coating of strontium oxide on the catalyst surface.
2.2. Crystalline Phase and Morphology
XRD patterns of all the calcined and freshly reduced catalysts are presented in Figure 2a,b, respectively. A diffuse and broad diffraction peak at 21.8° was observed in all XRD patterns that could be assigned to amorphous silica [7]. In all of the calcined catalysts, diffraction peaks related to CuO were observed at 35.5° and 38.7° (JCPDS 05-0661). The diffraction peaks for CuO in promoted catalysts were much broader and less intense as compared to non-promoted catalysts. However, these peaks disappeared in reduced patterns shown in Figure 2b. Metallic Cu peaks at 43° and 50° (JCPDS 04-0836) were observed, and the phase attributed to Cu2O was noted at 36.5° (JCPDS 05-0667) in all promoted catalysts [7,45]. Table 2 listed the particle size of Cu (111) in all the freshly reduced studied catalysts, and it was revealed that the particle size of Cu metal was larger in non-promoted catalysts as compared to promoted catalysts. However, no visible diffraction peaks of promoted metals (K, Ca, or Sr) or their oxides were observed in the XRD patterns, hence, it could be established that these metal oxides were highly dispersed in these catalysts. It is also evident from Table 2 that in the case of Ca and Sr, Cu(111) particle size reduced as compared to non-promoted catalysts significantly. It was also observed that non-promoted catalyst Cu0 contents were very high as compared to Cu2+-contents, which is also in accordance with the studies of Wang et al. However, with the introduction of promoted metal, a broader peak of Cu2O could easily be observed with a less intense peak of Cu0 [46].
The absorption peaks of FTIR spectra shown in Figure 3 confirmed the presence of Cu phyllosilicate in promoted and non-promoted catalysts, and this fact could be supported by the appearance of the δOH band at 670 cm−1 and the υSiO shoulder peak at 1040 cm−1 [47]. The weak band observed at 670 cm−1 could be ascribed to δOH bond of Cu2SiO5(OH)2 [48]. All the promoted catalysts were initially dried and at that stage Cu2SiO5(OH)2 structure was formed, but during the calcination stage this structure vanishes, hence, very faint peaks were observed in FTIR. However, strong diffraction peaks related to CuO were observed at 35.5° and 38.7° in XRD patterns, due to which minor peaks related to Cu2SiO5(OH)2 might have covered, which also suggests its maximum decomposition after calcination [10]. Furthermore, the presence of band at 670 cm−1 related to copper phyllosilicate could be observed in all the promoted and nonpromoted catalysts, referring to the fact that this structure is largely preserved in all catalysts, however, its intensity varies in different catalysts, with 5%K-30%Cu/SiO2 showing the strongest intensity of the peak. The band observed at 490 cm−1 in all of the promoted and non-promoted catalysts may be due to CuO stretching vibrations [49,50]. Accordingly, the bands observed at 1110 cm−1, 800 cm−1, and 490 cm−1 could be attributed to the existence of SiO2 and copper oxides in the catalysts, which is also in agreement with XRD results.
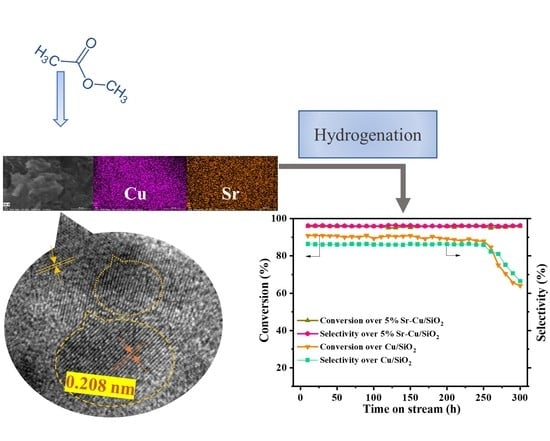
Figure 4 represents the TEM images and average Cu particle size distribution of best-performing 5%Sr-30%Cu/SiO2 and representative Cu/SiO2 catalysts to better understand the morphology of the catalyst series. The high dispersion state of Cu and Sr in 5%Sr-30%Cu/SiO2 catalyst was confirmed by TEM analysis, as shown in Figure 4a. The high-resolution transmission electron microscope image of Cu (111) nanocrystals revealed a clear crystal face structure with a lattice spacing of ca. 0.208 nm. Various diffraction rings and spots were seen in its selected area of electron diffraction (SAED). The reduced samples of Figure 4a,c show that the metallic black copper species are dispersed well on the silica, and the mean sizes for 5%Sr-30%Cu/SiO2 and Cu/SiO2 are 3.43 nm and 4.71 nm, respectively, suggesting that promotion with Sr makes the particles less prone to agglomeration. The TEM images in Figure 4g and respective particle size distribution in Figure 4h give more insight into the reason of 30%Cu/SiO2 deactivation after long-term testing of 300 h, where mean particle size increases from 4.71 nm to 7.07 nm. However, Figure 4e,f further show that the probable reason of better performance shown by 5%Sr-30%Cu/SiO2 among other catalysts might be its thermal stability, enhanced dispersion, and resistance towards copper aggregation and coagulation even after 300 h and minor increases in mean particle size of 5.38 nm, respectively. In addition, FESEM image of elemental mapping of reduced 5%Sr-30%Cu/SiO2 catalyst and the corresponding EDS elemental mappings of Cu and Sr (Figure 4i) suggest that both species are co-existent and uniformly dispersed on the silica texture.
2.3. H2-TPR and H2-TPD
The H2-TPR experiments were conducted, and profiles were recorded to investigate the reducibility of previously calcined Cu/SiO2 and xM-30%Cu/SiO2 catalysts. Figure 5 shows that the reduction peak centered at 201 °C of Cu/SiO2 catalyst, which results from the reduction of well-dispersed CuO and copper phyllosilicate [28]. According to the literature, the first peak is usually ascribed to well-dispersed CuO, and it appears at 191 °C in 30%Cu/SiO2 and at 186 °C in 5%K-30%Cu/SiO2. However, in the rest of the promoted catalysts, both low temperature peaks are merged and can be seen in Figure 5 [51]. Furthermore, observing the enlarged profiles revealed a third broader reduction peak that starts after 250 °C. This peak is easily identifiable in 30%Cu/SiO2 and is associated with the reduction of larger CuO crystallites and the partial reduction of Cu2+ to Cu+ as a result of higher copper loading (30%), which is consistent with XRD results. However, in the 5%Sr-30%Cu/SiO2 catalyst, this broader reduction peak is most likely caused by interactions between Cu species and Sr, since there is no obvious evidence to suggest the existence of large CuO crystallites from TPR profiles, which agrees with the XRD patterns.
Figure 6 shows the TPD profiles of hydrogen desorption from Cu/SiO2 and promoted catalysts. H2-TPD is a dynamic method that was used to analyze the adsorption behavior of H2 on preactivated (in pure hydrogen) catalysts. Two significant desorption peaks have been observed in all catalysts. The first, ranging from 50 °C to 130 °C, is linked to the chemisorbed H2 on the surface of the Cu, and the second broader peal ranges from 135 °C to 450 °C, which could be related to the chemisorbed splitting H species on the surface of the catalyst [52,53]. Moreover, the presence of a broader peak could be an indicator of many small metal particles [54]. In addition, the amount of H2 desorption based on the second peak was calculated and was in the following order: 5%Sr-30%Cu/SiO2 > 1%Sr-30%Cu/SiO2 > 10%Sr-30%Cu/SiO2 > 5%Ca-30%Cu/SiO2 > 5%K-30%Cu/SiO2 > 30%Cu/SiO2. Among all tested catalysts, the adsorption of split H-H on 5%Sr-30%Cu/SiO2 is the largest and that of 30%Cu/SiO2 is the smallest, which is consistent with the catalytic activity, indicating the importance of split H-H adsorptions [55]. It is also clear from Figure 6 that the intensities of H2 desorption peaks, as well as the amount of H2 desorbed, are clearly affected by Sr loading because Cu loading was unchanged. Accordingly, the higher SCu value of 5%Sr-30%Cu/SiO2, as shown in Table 1, and the intensities of broad high temperature peaks are enhanced by the promoter, suggesting that the presence of two chemisorbed H-species is linked to the introduction of the promoter in Cu/SiO2-based catalysts. Hence, the Sr-promoted catalyst has significantly enhanced hydrogen activation by influencing the electronic structure of metal contents and their mobility on the support and the concentration of active H-species on the catalyst surface.
2.4. Chemical States of Surface Species
Figure 7a represents the XPS spectra and X-ray-induced Auger electron spectroscopy (XAES) of reduced samples of all promoted and non-promoted catalysts. As shown in the figure, two peaks associated with the Cu 2p1/2 and Cu 2p3/2 were observed at 952.02 and 932.19, respectively. Moreover, the absence of satellite peaks also suggests that Cu2+ species had been reduced into Cu0 or Cu+ species [56]. Since Cu0 and Cu+ have nearly identical binding energies, the Cu LMM XAES spectrum of reduced catalysts was recorded to determine the amounts of surface Cu+ and Cu0 species [57]. According to Figure 7b, Sr exists only as a divalent oxidation state of Sr 3d3/2 and Sr 3d5/2 in all Sr-promoted Cu/SiO2 catalysts, as indicated by the two peaks at 133.7 and 135.3 eV, respectively, of the Sr 3d XPS curve. A slight shift in Sr 3d binding energies was also observed once Sr content was increased in the catalysts, which could be due to the build-up of strontium oxide species at the surface of the catalyst. The Cu+/(Cu0 + Cu+) ratio reached a maximum value of 0.6 when Cu/SiO2 was promoted with 5 wt.% strontium, however, this ratio reduced to 0.54 when the amount of promoter increased to 10%, and this observation is consistent with XRD and H2-TPR results. Zhang et al. had reported that the ratio of copper species on the surface of the catalyst could be affected by the alkaline nature of promoter. Thus, we speculated that in the case of 5%Ca-30%Cu/SiO2, the decline in Cu+/(Cu0 + Cu+) ratio could be the reason for the mild alkaline nature of Ca metal as compared to Sr [45].
The deconvolution performed over the recorded Cu LMM spectrum and shown in Figure 8 represents two overlapping peaks at 913.6 and 917.5 eV assigned to Cu+ and Cu0, respectively. Table 3 shows that the ratio of Cu+/(Cu0 + Cu+) is affected by the addition of promoters, and its value declined to 0.43 and 0.42 for 5%K-30%Cu/SiO2 and 5%Ca-30%Cu/SiO2, respectively, suggesting the introduction of promoters that influence the amount of Cu+ species on Cu/SiO2 catalyst. Table 3 also shows that both Cu+ and Cu0 content were affected by the promoter, and, in the case of Sr-promoted catalysts, also by the amount of promoter. As a consequence, 5%Sr promoted catalysts would generate more active sites and therefore enhance the Cu dispersion as compared to other promoted and non-promoted catalysts. Moreover, further increasing Sr content would not be advantageous. This implies that there is strong interaction or bonding formed between Cu and Sr species, as previously reported in the case of other Cu-promoted catalysts, which is also a reason for enhanced dispersion and higher Cu+ contents [38].
Raman spectra of all the promoted and non-promoted calcined catalysts alongside bulk CuO were also recorded and shown in Figure 9. Bulk CuO represented three characteristic bands, with a peak at 275 cm−1 being the most prominent. Although this band was observed in Cu/SiO2 with no significant shift, in 5%Sr-Cu/SiO2 catalysts a minor shift towards lower wavenumbers was observed, which could be a reflection of better metal support interaction derived from the formation of copper phyllosilicates. Similarly, in Figure 9b, the Raman spectra of spent catalysts were presented, and these catalysts were tested for long-term testing of almost 300 h. It could be seen that the characteristic peaks of both catalysts are still there, but the intensity of peaks was reduced. This implies that the crystallinity of the catalysts has been compromised as well as activity of the catalysts, hence, agglomeration of copper species is believed to be a major cause of the deactivation of Cu-based catalysts [58]. Wen et al. also reported that leaching of SiO2 from Cu/SiO2 catalysts could enhance rate of agglomeration of copper species after longer activity tests, therefore reducing the activity after an extensive time, and this could also be confirmed from TEM results presented in Figure 4 [59,60].
3. Experimental
3.1. Materials
The chemicals that are used for the preparation of the catalyst were purchased reagent grade, and no further purification was done. Copper nitrate (Cu(NO3)2.3H2O) [99.99%] was purchased from Aladdin (Shanghai, China), strontium nitrate (Sr(NO3)2) [99.5%] and calcium nitrate (Ca(NO3)2.4H2O) [99.0%] were purchased from Tianjin Fuchen Chemicals Reagent Factory (Beichen, Tianjin, China), colloidal silica (LUDOX AS-40, 40 wt.% suspension in H2O) was purchased from Sigma Aldrich (Burlington, MA, USA), and potassium nitrate (KNO3) [AR, >99.0%] and sodium hydroxide (NaOH, AR) were purchased from Beijing Chemical Works (Yizhuang, Beijing, China).
3.2. Catalyst Preparation
The modified precipitation gel method [7] was used to prepare Cu/SiO2 (using 30% Cu content) with different alkali and alkaline earth metals (K, Ca, Sr) as additives. 0.5 M solutions were made by adding Cu(NO3)2.3H2O as Cu source, and Sr(NO3)2 as Sr source separately in deionized water, and mixing was done at room temperature for 30 min. 5 M NaOH was added to the mixture of Cu and Sr solutions and thoroughly mixed for 1 h, and further sonication was done for 30 min. Following that, 40% colloidal silica was added as 40 wt.% suspension in H2O, and mixing and sonication were done for 30 min. The gel state catalyst was further mixed vigorously for 4 h at a temperature of 50 °C. Vacuum filtration and washing procedure were done (at least 4 times) until the pH of the water being collected became neutral (7.0). It was further allowed to dry for 12 h at a temperature of 120 °C. The catalyst obtained was finally calcined at 5 °C/min from 25 to 450 °C and kept at 450 °C for 3 h. The actual 5% Sr modified and 30 wt.% Cu catalyst (5%Sr-30%Cu/SiO2) was analyzed by inductively coupled plasma–optical emission spectroscopy (ICP-OES).
For comparing the efficiency of the prepared catalyst, more catalysts were also prepared, including 30%Cu/SiO2, 1%Sr-30%Cu/SiO2, 10%Sr-30%Cu/SiO2, 5%K-30%Cu/SiO2, 5%Ca-30%Cu/SiO2, and 5%Sr/SiO2. The same modified precipitation gel method as discussed above was used for the preparation of all comparing catalysts.
3.3. Catalyst Characterization
ICP-OES technique was done by using the instrument IRIS Intrepid II XSP (Thermofisher, Waltham, MA, USA) for analyzing the concentration of copper in the catalyst. Specific surface area testing of the catalyst was determined by using a Micromeritics ASAP 2020 Plus (Micromeritics Instruments Corporation, Norcross, GA, USA) porosimetry instrument. Before taking the measurements, the samples were first treated at 350 °C for 4 h. The surface area estimation was done by the Brunauer–Emmett–Teller (BET) method while the pore size distribution was calculated by the Barrett–Joyner–Halenda (BJH) method. The phase analysis of the samples was recorded as powder X-ray diffraction (PXRD) patterns on the Rigaku Smart Lab instrument (Rigaku, Tokyo, Japan), X-ray powder diffractometer, using Cu Kα (λ = 0.15406 nm) as the radiation source together with a scanning step of 10° per minute. The Scherrer equation was used for the average crystallite size calculations of reduced Cu (111) using the full width at half-maximum (FWHM) and diffraction peak at 2θ~43.2°. The infrared (IR) spectra of promoted and non-promoted catalysts were carried out on a Nicolet 6700 spectrometer (ThermoFisher Scientific, Waltham, MA, USA) with a spectra resolution of 4 cm−1 and recorded from 400 to 4000 cm−1. The KBr was mixed with the sample to form self-supporting wafer. Temperature-programmed reduction (TPR) was the technique used to determine the reduction temperatures and numbers of reducible species present in the catalyst. The reduction profiles were collected on an AutochemⅡ2920 Chemisorption (Micromeritics Instruments Corporation, Norcross, GA, USA) Apparatus (Micromeritics). In a typical procedure, 50 mg of sample was first pretreated in a quartz U-tube reactor at 120 °C for 1 h under He atmosphere, then cooled down to room temperature. After it reaches room temperature under helium, 10% H2-Ar was introduced into the tubular reactor, and temperature was ramped from 10 °C/min to 500 °C. H2 temperature-programmed desorption (H2-TPD) and H2 temperature-programmed reduction (H2-TPR) profiles were collected on the same equipment. Initially, the sample was reduced at 350 °C in 10% H2-Ar atmosphere for 4 h and then the adsorption was conducted at 50 °C for 1 h, followed by high purity purge by argon. Finally, desorption of H2 was measured at a linear heating program from 50 °C to 800 °C at 10 °C/min. The number of the metallic copper surface of catalyst was determined by N2O-titration at 90 °C, followed by CO-TPD in the above-described apparatus according to the procedure mentioned elsewhere by Van Der Grift et al. [61], assuming that Cu+ ions and Cu0 atoms occupy identical areas (1.47 × 10¹⁹ copper atoms/m2), as reported previously [28]. The surface copper and promoting metal species of the catalysts were detected by X-ray photoelectron spectroscopy (XPS), however, the ratio of different copper species was obtained by Auger electron spectroscopy (XAES), where Al Kα X-ray (hυ = 1486.6 eV) radiation source was used on an ESCA Lab220i-XL (ThermoFisher Scientific, Waltham, MA, USA) electron spectrometer (VG Scientific). First, the catalysts were activated by reducing at 350 °C for 4 h in pure hydrogen and were later compressed into a thin disk in a glovebox under appropriate pressure and transferred to a sealed container for XPS analysis. C1s peak (284.6 eV) was used to calibrate the binding energies (BE). FE-SEM images were taken using JEOL JSM-7600 (Pleasanton, CA, USA) at 15 kV, and the energy dispersion spectra were studied using an EFI Verios G4 scanning electron microscope equipped with Thermo NS7 (Waltham, MA, USA) energy dispersion spectrometer (EDS). A transmission electron microscope (JEM-2100, Pleasanton, CA, USA) was operated at 200 kV to characterize the morphology and structure of the samples, whereas EDS mapping in STEM mode reveals the elemental dispersion. Similarly, a scanning electron microscope (Hitachi S-4800, Chiyoda, Tokyo, Japan) equipped with energy dispersive X-ray (EDX) was also used to determine surface properties and chemical composition of the catalysts.
3.4. Catalyst Tests
The catalytic performance of Vapor phase MA hydrogenation was evaluated using a stainless-steel fixed-bed tubular microreactor installed vertically in a furnace, as shown in Figure 10. In a typical run, about 1.0 g 40–60 mesh size catalyst was loaded in the center of the reactor with both sides plugged with glass wool, and the rest of the reactor was packed with quartz powder (40–60 mesh). Before the hydrogenation reaction, the catalyst was activated in situ by heating at steady-state (2 °C/min) from room temperature to 350 °C under pure hydrogen flow for 4 h. In the next step, the reactor was cooled down to achieve the required reaction temperature (180 °C to 280 °C) and the system was pressurized slowly to targeted pressure (2.0–3.0 MPa) to test all the promoted and non-promoted xM-30%Cu/SiO2 catalysts. MA was fed into the pre-heater with a high-pressure precision pump, where it was evaporated and pre-mixed with H2 and carried into the reactor with H2 flow. Standard reaction conditions were H2/MA ratio of 15, GHSV fixed at 3000 h−1, LHSV in the range of 0.5–4.0 h−1, temperature 250 °C, and pressure at 2.5 MPa. The product stream (a mixture of methanol, ethanol, unreacted MA, and H2) was passed through a condenser, and separated product gases were analyzed by an online gas chromatograph, whereas separated liquid products were analyzed by a gas chromatograph device (Ruihong SP-7890, Tengzhou, Shandong, China) equipped with a flame ionization detector (FID) and an OV1701 capillary column. Shimadzu GC-MS (QP2010, Nakagyo-ku, Kyoto, Japan) was used to identify the contents of product mixture. The internal standard method with iso-butanol as the internal standard was used to calculate the conversion of MA and selectivity of ethanol. Once the system achieved steady-state, three readings were taken and the error bar was calculated.
The conversion of MA (%), selectivity (%), and yield (%) of ethanol were calculated using the following equations [29]:
3.5. Catalytic Performance and Stability
Table 4 summarizes the results of catalytic hydrogenation of MA over different catalysts. According to results tabulated in Table 4, 5%Sr/SiO2 was showing almost no activity for hydrogenation of MA to ethanol, suggesting that Sr has no active site for the reaction. The promotion with alkali and alkaline earth metals (K, Ca, Sr) enhanced the catalytic activity of Cu/SiO2 catalyst, with Sr promoting catalysts outperforming the rest of the promoted and non-promoting catalysts in terms of MA conversion (95.8%) and selectivity for ethanol (96.2%). Similarly, the addition of 5% K and 5% Ca also increased MA conversion to 92.2% and 91.1% and selectivity to 91.3% and 90.2%, respectively. It can be elucidated from experimental results that catalyst promotion with 1% strontium initially increased MA conversion and ethanol selectivity, but further increasing it to 10% significantly reduced the catalytic performance at similar reaction conditions. Similarly, spacetime yield (STY) value reaches a maximum with 5% Sr-promoted catalyst, e.g., 1.07 gEthanol/(gcat h), whereas in 10% Sr-promoted catalyst this value declines to 0.89 gEthanol/(gcat h), showing that a further increase in Sr content from optimum will reduce the performance of the catalyst.
3.5.1. Effect of Reaction Temperature
Figure 11 presented the MA conversion, and ethanol selectivity for 5%Sr-30%Cu/SiO2 and 30%Cu/SiO2 at different reaction temperatures, liquid hourly space velocity (LHSV), and pressures. As shown in Figure 11a, the two catalysts were further evaluated to check the effect of temperature on the activity of the catalyst, and therefore the temperature was changed from 190 °C to 280 °C. Both conversion and selectivity improved significantly throughout temperature range in Sr-promoted catalyst. It was observed that MA conversion and selectivity of ethanol increased by almost 50% when the temperature was increased from 190 °C to 220 °C in the case of Sr-promoted catalyst. It was also evident from data collected that activity was highest in terms of percentage yield (92.2%) at 250 °C, although MA conversion further increased a few points at 280 °C at the stake of ethanol selectivity, which was due to possible side reactions that occurred at higher temperatures and the consequent formation of byproducts, as was reported in our previous work [29].
3.5.2. Effect of Liquid Hourly Space Velocity
Figure 11b shows the effect of LHSV on MA conversion and ethanol selectivity, which is another important factor studied. As shown, LHSV varied from 0.5 h−1 to 4.0 h−1, and the highest MA conversion and ethanol selectivity were achieved at 0.5 h−1 (97.7% and 96.8%, respectively). A slight decline at 1.0 h−1 in 5%Sr-30%Cu/SiO2 catalyst was observed, which was still 6% higher than the non-promoted catalyst. At higher LHSV conditions, MA conversion, and the selectivity of ethanol, the 5%Sr-30%Cu/SiO2 catalyst was 87.4% and 85.1%, respectively, whereas, in non-promoted catalysts, these figures stand at 75.5% and 77.0%. This decrease was also evident in our previous studies [22,29,30]. It suggested that activity of the promoted catalyst was incredibly stable, even at the highest LHSV (4.0 h−1) as compared to the non-promoted catalyst, and it could be due to more active sites available for reaction, even under extreme conditions.
3.5.3. Effect of Pressure
The effect of pressure on MA conversion and ethanol selectivity was observed at a reaction temperature of 250 °C, with pressure from 1.0–3.0 MPa and 1.0 h−1 LHSV, as shown in Figure 11c. MA conversion enhanced with an increase in pressure and selectivity of ethanol also demonstrated a similar trend, with maximum MA conversion of 97.1% and selectivity of ethanol 96.9% at 3.0 MPa in Sr-promoted catalyst. This study has reflected that an increase in pressure from 2.5 MPa to 3.0 MPa had a minor effect on MA conversion and selectivity of ethanol.
3.5.4. Catalytic Stability
The comparison of long-term stability of best-performing promoted catalyst with non-promoted catalyst is of tremendous significance from both academic and industrial perspectives. The comparison of long-term catalytic stability of 5%Sr-30%Cu/SiO2 and non-promoted 30%Cu/SiO2 is presented in Figure 12. The Sr-promoted catalyst exhibited excellent stability and performed exceptionally for more than 300 h continuously in terms of MA conversion and selectivity for ethanol, which remained at 95% and 96%, respectively. However, a time-dependent decrease in the activity of the non-promoted catalyst was observed with a slow decline after 150 h, and this could be due to agglomeration of Cu species, as was evident from an increase in mean particle size to 7.07 nm of spent Cu/SiO2 catalyst, as shown in Figure 4e. Many previous works had reported that the inactivation of the Cu-based catalyst was mainly caused by the agglomeration of copper species; thus, we focused on the observations of agglomerative phases by TEM and Raman to verify this phenomenon [59,60]. It also could be found that after long-term testing of catalysts, a major loss to catalyst activity in the case of 30%Cu/SiO2 catalyst was due to agglomeration of Cu species, which could also be confirmed from TEM of spent catalysts presented in TEM analysis. However, there is a very minute effect observed in the case of 5%Sr-30%Cu/SiO2 catalyst, hence the almost negligible effect in activity. Furthermore, this decline in activity became clearer from 250 h for both MA conversion and selectivity of ethanol.
4. Conclusions
This study reported a series of selective alkali and alkaline earth metals (K, Ca, Sr) promoted Cu/SiO2 catalyst prepared by a modified precipitation-gel method. Furthermore, promotion with an appropriate amount of strontium (5%Sr-30%Cu/SiO2) further improved the catalytic activity, i.e., conversion and selectivity from 90.8% and 86.3% to 95.8% and 96.2%, respectively, and stability to more than 300 h for the hydrogenation of MA to ethanol. The interaction between copper ions, promoters, and support surface was significantly enhanced, which resulted in higher copper surface area, improvement in reducibility, and other physiochemical properties. Compared to all the reported xM-30%Cu/SiO2 catalysts, 5%Sr-30%Cu/SiO2 exhibited superior catalytic activity under similar reaction conditions for hydrogenation of MA to ethanol. The maximum molar ratio of Cu+/(Cu+ + Cu0) obtained by changing strontium content to 5% Sr could have led to the highest catalytic performance. In addition, several characterizations showed that promotion with 5%Sr not only restrained the agglomeration but also controlled the valence change of cupreous species during a long-term test, hence displaying promising characteristics for industrialization.
Author Contributions
Conceptualization, M.N.Y., C.L. and Z.R.; methodology, M.N.Y., Z.R.; software, M.N.Y., Z.R.; validation, E.W. and C.L.; formal analysis, M.N.Y.; investigation, M.N.Y., C.L. and Z.R.; resources, C.L., M.N.Y.; data curation, M.N.Y. and Z.R.; writing—original draft preparation, M.N.Y.; writing—review and editing, M.N.Y., Z.R., C.L., E.W.; supervision, C.L.; project administration, C.L. and J.L.; funding acquisition, C.L., E.W. and J.L. All authors have read and agreed to the published version of the manuscript.
Funding
This research received no external funding.
Data Availability Statement
Not applicable.
Acknowledgments
The authors are grateful to CAS-TWAS President’s Fellowship program for providing a research opportunity.
Conflicts of Interest
The authors declare no conflict of interest
References
- Roehr, M. The Biotechnology of Ethanol: Classical and Future Applications; Wiley-VCH Verlag GmbH: Weinheim, Germany, 2000; ISBN 9783527602346. [Google Scholar]
- Jiao, J.; Li, J.; Bai, Y. Ethanol as a Vehicle Fuel in China: A Review from the Perspectives of Raw Material Resource, Vehicle, and Infrastructure. J. Clean. Prod. 2018, 180, 832–845. [Google Scholar] [CrossRef]
- Dueso, C.; Ortiz, M.; Abad, A.; García-Labiano, F.; de Diego, L.F.; Gayán, P.; Adánez, J. Reduction and Oxidation Kinetics of Nickel-Based Oxygen-Carriers for Chemical-Looping Combustion and Chemical-Looping Reforming. Chem. Eng. J. 2012, 188, 142–154. [Google Scholar] [CrossRef] [Green Version]
- Li, X.; San, X.; Zhang, Y.; Ichii, T.; Meng, M.; Tan, Y.; Tsubaki, N. Direct Synthesis of Ethanol from Dimethyl Ether and Syngas over Combined H-Mordenite and Cu/ZnO Catalysts. ChemSusChem 2010, 3, 1192–1199. [Google Scholar] [CrossRef]
- Wang, S.; Guo, W.; Wang, H.; Zhu, L.; Yin, S.; Qiu, K. Effect of the Cu/SBA-15 Catalyst Preparation Method on Methyl Acetate Hydrogenation for Ethanol Production. N. J. Chem. 2014, 38, 2792. [Google Scholar] [CrossRef]
- Ye, C.; Guo, C.; Sun, C.; Zhang, Y. Effect of Mn Doping on the Activity and Stability of Cu–SiO2 Catalysts for the Hydrogenation of Methyl Acetate to Ethanol. RSC Adv. 2016, 6, 113796–113802. [Google Scholar] [CrossRef]
- Huang, Z.; Cui, F.; Kang, H.; Chen, J. Highly Dispersed Silica-Supported Copper Nanoparticles Prepared by Precipitation−Gel Method: A Simple but Efficient and Stable Catalyst for Glycerol Hydrogenolysis. Chem. Mater. 2008, 20, 5090–5099. [Google Scholar] [CrossRef]
- Ye, C.-L.; Guo, C.-L.; Zhang, J.-L. Highly Active and Stable CeO2–SiO2 Supported Cu Catalysts for the Hydrogenation of Methyl Acetate to Ethanol. Fuel Process. Technol. 2016, 143, 219–224. [Google Scholar] [CrossRef]
- Huang, X.; Ma, M.; Miao, S.; Zheng, Y.; Chen, M.; Shen, W. Hydrogenation of Methyl Acetate to Ethanol over a Highly Stable Cu/SiO2 Catalyst: Reaction Mechanism and Structural Evolution. Appl. Catal. A Gen. 2017, 531, 79–88. [Google Scholar] [CrossRef]
- Chen, L.-F.; Guo, P.-J.; Qiao, M.-H.; Yan, S.-R.; Li, H.-X.; Shen, W.; Xu, H.-L.; Fan, K.-N. Cu/SiO2 Catalysts Prepared by the Ammonia-Evaporation Method: Texture, Structure, and Catalytic Performance in Hydrogenation of Dimethyl Oxalate to Ethylene Glycol. J. Catal. 2008, 257, 172–180. [Google Scholar] [CrossRef]
- Yin, A.; Guo, X.; Fan, K.; Dai, W.-L. Ion-Exchange Temperature Effect on Cu/HMS Catalysts for the Hydrogenation of Dimethyl Oxalate to Ethylene Glycol. ChemCatChem 2010, 2, 206–213. [Google Scholar] [CrossRef]
- Yin, A.; Guo, X.; Dai, W.L.; Li, H.; Fan, K. Highly Active and Selective Copper-Containing HMS Catalyst in the Hydrogenation of Dimethyl Oxalate to Ethylene Glycol. Appl. Catal. A Gen. 2008, 349, 91–99. [Google Scholar] [CrossRef]
- Di, W.; Cheng, J.; Tian, S.; Li, J.; Chen, J.; Sun, Q. Synthesis and Characterization of Supported Copper Phyllosilicate Catalysts for Acetic Ester Hydrogenation to Ethanol. Appl. Catal. A Gen. 2016, 510, 244–259. [Google Scholar] [CrossRef]
- He, Z.; Lin, H.; He, P.; Yuan, Y. Effect of Boric Oxide Doping on the Stability and Activity of a Cu-SiO2 catalyst for Vapor-Phase Hydrogenation of Dimethyl Oxalate to Ethylene Glycol. J. Catal. 2011, 277, 54–63. [Google Scholar] [CrossRef]
- Zhong, K.; Wang, X. The Influence of Different Precipitants on the Copper-Based Catalysts for Hydrogenation of Ethyl Acetate to Ethanol. Int. J. Hydrogen Energy 2014, 39, 10951–10958. [Google Scholar] [CrossRef]
- Yang, D.; Sararuk, C.; Suzuki, K.; Li, Z.; Li, C. Effect of Calcination Temperature on the Catalytic Activity of VPO for Aldol Condensation of Acetic Acid and Formalin. Chem. Eng. J. 2016, 300, 160–168. [Google Scholar] [CrossRef]
- Lin, D.; Zhang, Q.; Qin, Z.; Li, Q.; Feng, X.; Song, Z.; Cai, Z.; Liu, Y.; Chen, X.; Chen, D.; et al. Reversing Titanium Oligomer Formation towards High-Efficiency and Green Synthesis of Titanium-Containing Molecular Sieves. Angew. Chem. Int. Ed. 2021, 60, 3443–3448. [Google Scholar] [CrossRef]
- Runeberg, J.; Baiker, A.; Kijenski, J. Copper Catalyzed Amination of Ethylene Glycol. Appl. Catal. 1985, 17, 309–319. [Google Scholar] [CrossRef]
- Montassier, C.; Giraud, D.; Barbier, J. Polyol Conversion by Liquid Phase Heterogeneous Catalysis over Metals. Prep. Catal. V-Sci. Bases Prep. Heterog. Catal. Proc. Fifth Int. Symp. 1988, 41, 165–170. [Google Scholar]
- Brands, D.S.; Poels, E.K.; Bliek, A. Ester Hydrogenolysis over Promoted Cu/SiO2 Catalysts. Appl. Catal. A Gen. 1999, 184, 279–289. [Google Scholar] [CrossRef]
- Wang, Y.; Liao, J.; Zhang, J.; Wang, S.; Zhao, Y.; Ma, X. Hydrogenation of Methyl Acetate to Ethanol by Cu/ZnO Catalyst Encapsulated in SBA-15. AIChE J. 2017, 63, 2839–2849. [Google Scholar] [CrossRef]
- Ren, Z.; Younis, M.N.; Zhao, H.; Li, C.; Yang, X.; Wang, E.; Wang, G. Silver Modified Cu/SiO2 Catalyst for the Hydrogenation of Methyl Acetate to Ethanol. Chin. J. Chem. Eng. 2020, 28, 1612–1622. [Google Scholar] [CrossRef]
- Yan, H.; Li, S.; Feng, X.; Lu, J.; Zheng, X.; Li, R.; Zhou, X.; Chen, X.; Liu, Y.; Chen, D.; et al. Rational Screening of Metal Catalysts for Selective Oxidation of Glycerol to Glyceric Acid from Microkinetic Analysis. AIChE J. 2023, 69, e17868. [Google Scholar] [CrossRef]
- Yan, H.; Zhao, M.; Feng, X.; Zhao, S.; Zhou, X.; Li, S.; Zha, M.; Meng, F.; Chen, X.; Liu, Y.; et al. PO43− Coordinated Robust Single-Atom Platinum Catalyst for Selective Polyol Oxidation. Angew. Chem. Int. Ed. 2022, 61, e202116059. [Google Scholar] [CrossRef]
- Wang, Y.; Shen, Y.; Zhao, Y.; Lv, J.; Wang, S.; Ma, X. Insight into the Balancing Effect of Active Cu Species for Hydrogenation of Carbon–Oxygen Bonds. ACS Catal. 2015, 5, 6200–6208. [Google Scholar] [CrossRef]
- Huang, Z.; Liu, H.; Cui, F.; Zuo, J.; Chen, J.; Xia, C. Effects of the Precipitation Agents and Rare Earth Additives on the Structure and Catalytic Performance in Glycerol Hydrogenolysis of Cu/SiO2 catalysts Prepared by Precipitation-Gel Method. Catal. Today 2014, 234, 223–232. [Google Scholar] [CrossRef]
- Qin, H.; Guo, C.; Sun, C.; Zhang, J. Influence of the Support Composition on the Hydrogenation of Methyl Acetate over Cu/MgO-SiO2 Catalysts. J. Mol. Catal. A: Chem. 2015, 409, 79–84. [Google Scholar] [CrossRef]
- Zhao, Y.; Shan, B.; Wang, Y.; Zhou, J.; Wang, S.; Ma, X. An Effective CuZn-SiO2 Bimetallic Catalyst Prepared by Hydrolysis Precipitation Method for the Hydrogenation of Methyl Acetate to Ethanol. Ind. Eng. Chem. Res. 2018, 57, 4526–4534. [Google Scholar] [CrossRef]
- Ren, Z.; Younis, M.N.; Li, C.; Li, Z.; Yang, X.; Wang, G. Highly Active Ce, Y, La-Modified Cu/SiO2 Catalysts for Hydrogenation of Methyl Acetate to Ethanol. RSC Adv. 2020, 10, 5590–5603. [Google Scholar] [CrossRef] [Green Version]
- Ren, Z.; Younis, M.N.; Wu, H.; Li, C.; Yang, X.; Wang, G. Design and Synthesis of La-Modified Copper Phyllosilicate Nanotubes for Hydrogenation of Methyl Acetate to Ethanol. Catal. Lett. 2021, 151, 3089–3102. [Google Scholar] [CrossRef]
- Zhou, J.; Guo, L.; Guo, X.; Mao, J.; Zhang, S. Selective Hydrogenolysis of Glycerol to Propanediols on Supported Cu-Containing Bimetallic Catalysts. Green Chem. 2010, 12, 1835–1843. [Google Scholar] [CrossRef]
- Yaseen, M.; Shakirullah, M.; Ahmad, I.; Rahman, A.U.; Rahman, F.U.; Usman, M.; Razzaq, R. Simultaneous Operation of Dibenzothiophene Hydrodesulfurization and Methanol Reforming Reactions over Pd Promoted Alumina Based Catalysts. J. Fuel Chem. Technol. 2012, 40, 714–720. [Google Scholar] [CrossRef]
- Muhammad, Y.; Rashid, H.U.; Subhan, S.; Rahman, A.U.; Sahibzada, M.; Tong, Z. Boosting the Hydrodesulfurization of Dibenzothiophene Efficiency of Mn Decorated (Co/Ni)-Mo/Al2O3 Catalysts at Mild Temperature and Pressure by Coupling with Phosphonium Based Ionic Liquids. Chem. Eng. J. 2019, 375, 121957. [Google Scholar] [CrossRef]
- Muhammad, Y.; Rahman, A.U.; Rashid, H.U.; Sahibzada, M.; Subhan, S.; Tong, Z. Hydrodesulfurization of Dibenzothiophene Using Pd-Promoted Co–Mo/Al2O3 and Ni–Mo/Al2O3 Catalysts Coupled with Ionic Liquids at Ambient Operating Conditions. RSC Adv. 2019, 9, 10371–10385. [Google Scholar] [CrossRef] [PubMed]
- Liu, H.; Huang, Z.; Kang, H.; Li, X.; Xia, C.; Chen, J.; Liu, H. Efficient Bimetallic NiCu-SiO2 Catalysts for Selective Hydrogenolysis of Xylitol to Ethylene Glycol and Propylene Glycol. Appl. Catal. B: Environ. 2018, 220, 251–263. [Google Scholar] [CrossRef]
- Yan, H.; Qin, H.; Feng, X.; Jin, X.; Liang, W.; Sheng, N.; Zhu, C.; Wang, H.; Yin, B.; Liu, Y.; et al. Synergistic Pt/MgO/SBA-15 Nanocatalysts for Glycerol Oxidation in Base-Free Medium: Catalyst Design and Mechanistic Study. J. Catal. 2019, 370, 434–446. [Google Scholar] [CrossRef]
- Zhu, Y.-M.; Shi, L. Zn Promoted Cu–Al Catalyst for Hydrogenation of Ethyl Acetate to Alcohol. J. Ind. Eng. Chem. 2014, 20, 2341–2347. [Google Scholar] [CrossRef]
- Zheng, X.; Lin, H.; Zheng, J.; Duan, X.; Yuan, Y. Lanthanum Oxide-Modified Cu/SiO2 as a High-Performance Catalyst for Chemoselective Hydrogenation of Dimethyl Oxalate to Ethylene Glycol. ACS Catal. 2013, 3, 2738–2749. [Google Scholar] [CrossRef]
- Ying, J.; Han, X.; Ma, L.; Lu, C.; Feng, F.; Zhang, Q.; Li, X. Effects of Basic Promoters on the Catalytic Performance of Cu/SiO2 in the Hydrogenation of Dimethyl Maleate. Catalysts 2019, 9, 704. [Google Scholar] [CrossRef] [Green Version]
- Gluhoi, A.C.; Nieuwenhuys, B.E. Structural and Chemical Promoter Effects of Alkali (Earth) and Cerium Oxides in CO Oxidation on Supported Gold. Catal. Today 2007, 122, 226–232. [Google Scholar] [CrossRef]
- Gluhoi, A.C.; Bogdanchikova, N.; Nieuwenhuys, B.E. Alkali (Earth)-Doped Au/Al2O3 Catalysts for the Total Oxidation of Propene. J. Catal. 2005, 232, 96–101. [Google Scholar] [CrossRef]
- Yang, D.; Li, J.; Wen, M.; Song, C. Enhanced Activity of Ca-Doped Cu/ZrO2 for Nitrogen Oxides Reduction with Propylene in the Presence of Excess Oxygen. Catal. Today 2008, 139, 2–7. [Google Scholar] [CrossRef]
- Pellegrini, R.; Leofanti, G.; Agostini, G.; Bertinetti, L.; Bertarione, S.; Groppo, E.; Zecchina, A.; Lamberti, C. Influence of K-Doping on a Pd/SiO2-Al2O3 Catalyst. J. Catal. 2009, 267, 40–49. [Google Scholar] [CrossRef]
- Evans, J.W.; Wainwright, M.S.; Bridgewater, A.J.; Young, D.J. On the Determination of Copper Surface Area by Reaction with Nitrous Oxide. Appl. Catal. 1983, 7, 75–83. [Google Scholar] [CrossRef]
- Zhang, B.; Zhu, Y.; Ding, G.; Zheng, H.; Li, Y. Modification of the Supported Cu/SiO2 Catalyst by Alkaline Earth Metals in the Selective Conversion of 1,4-Butanediol to γ-Butyrolactone. Appl. Catal. A Gen. 2012, 443–444, 191–201. [Google Scholar] [CrossRef]
- Wang, Z.; Wang, W.; Lu, G. Studies on the Active Species and on Dispersion of Cu in Cu/SiO2 and Cu/Zn/SiO2 for Hydrogen Production via Methanol Partial Oxidation. Int. J. Hydrogen Energy 2003, 28, 151–158. [Google Scholar] [CrossRef]
- Toupance, T.; Kermarec, M.; Lambert, J.-F.; Louis, C. Conditions of Formation of Copper Phyllosilicates in Silica-Supported Copper Catalysts Prepared by Selective Adsorption. J. Phys. Chem. B 2002, 106, 2277–2286. [Google Scholar] [CrossRef]
- To, D.T.; Lin, Y.C. Copper Phyllosilicates-Derived Catalysts in the Production of Alcohols from Hydrogenation of Carboxylates, Carboxylic Acids, Carbonates, Formyls, and CO2: A Review. Catalysts 2021, 11, 255. [Google Scholar] [CrossRef]
- Maul, J.; Brito, A.S.; de Oliveira, A.L.M.; Lima, S.J.G.; Maurera, M.A.M.A.; Keyson, D.; Souza, A.G.; Santos, I.M.G. Influence of the Synthesis Media in the Properties of CuO Obtained by Microwave-Assisted Hydrothermal Method. J. Therm. Anal. Calorim. 2011, 106, 519–523. [Google Scholar] [CrossRef]
- Lu, L.; Huang, X. Room Temperature Electrochemical Synthesis of CuO Flower-like Microspheres and Their Electrooxidative Activity towards Hydrogen Peroxide. Microchim. Acta 2011, 175, 151. [Google Scholar] [CrossRef]
- Hou, X.; Zhao, J.; Liu, J.; Han, Y.; Pei, Y.; Ren, J. Activated Carbon Aerogel Supported Copper Catalysts for the Hydrogenation of Methyl Acetate to Ethanol: Effect of KOH Activation. N. J. Chem. 2019, 43, 9430–9438. [Google Scholar] [CrossRef]
- Wilmer, H.; Genger, T.; Hinrichsen, O. The Interaction of Hydrogen with Alumina-Supported Copper Catalysts: A Temperature-Programmed Adsorption/Temperature-Programmed Desorption/Isotopic Exchange Reaction Study. J. Catal. 2003, 215, 188–198. [Google Scholar] [CrossRef]
- Scholten, J.J.F.; Pijpers, A.P.; Hustings, A.M.L. Surface Characterization of Supported and Nonsupported Hydrogenation Catalysts. Catal. Rev. 1985, 27, 151–206. [Google Scholar] [CrossRef]
- Dong, X.; Zhang, H.-B.; Lin, G.-D.; Yuan, Y.-Z.; Tsai, K.R. Highly Active CNT-Promoted Cu-ZnO-Al2O3 Catalyst for Methanol Synthesis from H2/CO/CO2. Catal. Lett. 2003, 85, 237–246. [Google Scholar] [CrossRef]
- Tu, Y.J.; Chen, Y.W. Effects of Alkali Metal Oxide Additives on Cu/SiO2 Catalyst in the Dehydrogenation of Ethanol. Ind. Eng. Chem. Res. 2001, 40, 5889–5893. [Google Scholar] [CrossRef]
- Gong, J.; Yue, H.; Zhao, Y.; Zhao, S.; Zhao, L.; Lv, J.; Wang, S.; Ma, X. Synthesis of Ethanol via Syngas on Cu/SiO2 Catalysts with Balanced Cu0–Cu+ Sites. J. Am. Chem. Soc. 2012, 134, 13922–13925. [Google Scholar] [CrossRef]
- Yin, A.; Guo, X.; Dai, W.-L.; Fan, K. The Nature of Active Copper Species in Cu-HMS Catalyst for Hydrogenation of Dimethyl Oxalate to Ethylene Glycol: New Insights on the Synergetic Effect between Cu0 and Cu+. J. Phys. Chem. C 2009, 113, 11003–11013. [Google Scholar] [CrossRef]
- Shen, J.; Rao, C.; Fu, Z.; Feng, X.; Liu, J.; Fan, X.; Peng, H.; Xu, X.; Tan, C.; Wang, X. The Influence on the Structural and Redox Property of CuO by Using Different Precursors and Precipitants for Catalytic Soot Combustion. Appl. Surf. Sci. 2018, 453, 204–213. [Google Scholar] [CrossRef]
- Wen, C.; Cui, Y.; Dai, W.L.; Xie, S.; Fan, K. Solvent Feedstock Effect: The Insights into the Deactivation Mechanism of Cu/SiO2 Catalysts for Hydrogenation of Dimethyl Oxalate to Ethylene Glycol. Chem. Commun. 2013, 49, 5195–5197. [Google Scholar] [CrossRef] [PubMed]
- Lin, J.; Zhao, X.; Cui, Y.; Zhang, H.; Liao, D. Effect of Feedstock Solvent on the Stability of Cu/SiO2 Catalyst for Vapor-Phase Hydrogenation of Dimethyl Oxalate to Ethylene Glycol. Chem. Commun. 2012, 48, 1177–1179. [Google Scholar] [CrossRef]
- Van Der Grift, C.J.G.; Wielers, A.F.H.; Jogh, B.P.J.; Van Beunum, J.; De Boer, M.; Versluijs-Helder, M.; Geus, J.W. Effect of the Reduction Treatment on the Structure and Reactivity of Silica-Supported Copper Particles. J. Catal. 1991, 131, 178–189. [Google Scholar] [CrossRef]
Figure 1.
Calcined xM-30%Cu/SiO2 catalysts. (a) N2 adsorption–desorption isotherm and (b) BJH pore size distribution curves.
Figure 1.
Calcined xM-30%Cu/SiO2 catalysts. (a) N2 adsorption–desorption isotherm and (b) BJH pore size distribution curves.

Figure 2.
XRD patterns of (a) calcined and (b) reduced Cu/SiO2 and xM-30%Cu/SiO2 catalysts.

Figure 3.
FTIR spectra of calcined Cu/SiO2 and xM-30%Cu/SiO2 catalysts.

Figure 4.
(a,c) TEM images of freshly reduced 5%Sr-30%Cu/SiO2 and 30%Cu/SiO2 catalyst, and (b,d) represent the particle size distribution, respectively; (e,g) TEM images of spent 5%Sr-30%Cu/SiO2 and 30%Cu/SiO2 catalyst; (f,h) are respective size distribution; (i) FESEM image of elemental map of reduced 5%Sr-30%Cu/SiO2 catalyst and the corresponding EDS elemental mappings of Cu and Sr.

Figure 5.
H2-TPR profiles of 30%Cu/SiO2 and xM-30%Cu/SiO2 catalysts.

Figure 6.
H2-TPD profiles of reduced Cu/SiO2 and xM-30%Cu/SiO2 catalysts.

Figure 7.
(a) Cu 2p spectra (b) Sr 3d XPS spectra of reduced 30%Cu/SiO2 and xM-30%Cu/SiO2 of as reduced catalysts.
Figure 7.
(a) Cu 2p spectra (b) Sr 3d XPS spectra of reduced 30%Cu/SiO2 and xM-30%Cu/SiO2 of as reduced catalysts.

Figure 8.
Cu LMM Auger spectra of reduced Cu/SiO2 and xM-30%Cu/SiO2 catalysts.

Figure 9.
Raman spectra of CuO, and (a) all the promoted and non-promoted catalysts (b) spent Cu/SiO2 and 5%Sr-30%Cu/SiO2 catalysts.
Figure 9.
Raman spectra of CuO, and (a) all the promoted and non-promoted catalysts (b) spent Cu/SiO2 and 5%Sr-30%Cu/SiO2 catalysts.

Figure 10.
Schematic of fixed-bed microreactor system.

Figure 11.
Effect of reaction conditions on reaction activity. (a) Effect of reaction temperature, P(H2) = 2.5 MPa, LHSV = 1 h−1, GHSV = 3000 h−1. (b) Effect of liquid hourly space velocity (LHSV), T = 250 °C, P(H2) = 2.5 MPa, GHSV = 3000 h−1. (c) Effect of pressure, T = 250 °C, H2/MA = 15, LHSV = 1 h−1.

Figure 12.
Long-term catalytic performance of 30%Cu/SiO2 and 5%Sr-30% Cu/SiO2 catalysts as a function of reaction time at, T = 250 °C, P(H2) = 2.5 MPa, LHSV = 1 h−1, GHSV = 3000 h−1.
Figure 12.
Long-term catalytic performance of 30%Cu/SiO2 and 5%Sr-30% Cu/SiO2 catalysts as a function of reaction time at, T = 250 °C, P(H2) = 2.5 MPa, LHSV = 1 h−1, GHSV = 3000 h−1.


Table 1.
Structural properties of xM-30%Cu/SiO2 catalyst.
| Catalyst | Content a | SBET b (m2/g) | BJHVp b (cm3/g) | BJHDp b (nm) | SCu0 c (m2/g) | SCu+ d(m2/g) | SCu (m2/g) | |
|---|---|---|---|---|---|---|---|---|
| Cu | M | |||||||
| 30%Cu/SiO2 | 30.2 | - | 50.0 | 0.19 | 16.8 | 33.7 | 31.2 | 64.9 |
| 5%K-30%Cu/SiO2 | 26.6 | 4.6 | 50.2 | 0.20 | 19.0 | 34.9 | 37.8 | 72.7 |
| 5%Ca-30%Cu/SiO2 | 27.1 | 4.4 | 114.8 | 0.73 | 23.9 | 35.4 | 34.2 | 69.6 |
| 1%Sr-30%Cu/SiO2 | 28.3 | 0.92 | 79.9 | 0.52 | 23.4 | 36.1 | 38.6 | 74.7 |
| 5%Sr-30%Cu/SiO2 | 26.8 | 4.5 | 119.3 | 0.76 | 26.8 | 36.2 | 44.6 | 80.8 |
| 10%Sr-30%Cu/SiO2 | 25.9 | 8.7 | 41.4 | 0.25 | 21.5 | 34.5 | 38.6 | 73.1 |
| AS-40 SiO2 | -- | -- | 129–155 | 20–24 | ||||
a Obtained by ICP-OES. b Obtained from N2 adsorption isotherm. c,d Calculated SCu by N2O titration and SCu+ by LMM XAES spectra combined with N2O titration.
Table 2.
Particle sizes of metallic Cu (111) of all promoted and non-promoted catalysts.
| Catalyst | 2θ of Cu (111) | dCu (nm) | dCu2+ (nm) |
|---|---|---|---|
| 30%Cu/SiO2 | 43.4 | 4.8 | 4.4 |
| 5%K-30% Cu/SiO2 | 43.4 | 9.5 | 4.3 |
| 5%Ca-30% Cu/SiO2 | 43.2 | 4.6 | 5.3 |
| 1%Sr-30% Cu/SiO2 | 43.1 | 3.7 | 4.0 |
| 5%Sr-30% Cu/SiO2 | 43.0 | 4.0 | 4.8 |
| 10%Sr-30% Cu/SiO2 | 43.2 | 4.9 | 6.2 |
Table 3.
Deconvolution results of XPS and Cu LMM XAES of xM-30%Cu/SiO2 catalysts.
| Catalyst | KE (eV) | AP (eV) | Cu 2p3/2 BE (eV) | XCu+ | ||
|---|---|---|---|---|---|---|
| Cu+ | Cu0 | Cu+ | Cu0 | |||
| 30%Cu/SiO2 | 913.7 | 917.5 | 1847.4 | 1851.3 | 932.3 | 0.48 |
| 5%K-30%Cu/SiO2 | 913.7 | 917.5 | 1847.1 | 1851.0 | 932.1 | 0.43 |
| 5%Ca-30%Cu/SiO2 | 913.6 | 917.5 | 1847.3 | 1851.3 | 932.0 | 0.42 |
| 1%Sr-30%Cu/SiO2 | 913.6 | 917.6 | 1847.5 | 1851.4 | 932.2 | 0.50 |
| 5%Sr-30%Cu/SiO2 | 913.7 | 917.5 | 1847.5 | 1851.3 | 932.2 | 0.60 |
| 10%Sr-30%Cu/SiO2 | 913.6 | 917.6 | 1847.5 | 1851.4 | 932.2 | 0.54 |
Table 4.
Catalytic performance for hydrogenation of MA over xM-30%Cu/SiO2 catalysts.
| Catalyst | MA Conversion/ % a | Ethanol Selectivity/ % a | Yield/ % a | STY/ g Ethanol/(g cat h) a |
|---|---|---|---|---|
| 30%Cu/SiO2 | 90.8 | 86.3 | 78.4 | 0.91 |
| 5%K-30%Cu/SiO2 | 92.2 | 91.3 | 84.2 | 0.97 |
| 5%Ca-30%Cu/SiO2 | 91.1 | 90.2 | 82.2 | 0.95 |
| 1%Sr-30%Cu/SiO2 | 91.8 | 91.2 | 83.7 | 0.97 |
| 5%Sr-30%Cu/SiO2 | 95.8 | 96.2 | 92.2 | 1.07 |
| 10%Sr-30%Cu/SiO2 | 87.7 | 88.0 | 77.3 | 0.89 |
| 5%Sr/SiO2 | 0 | 0 | 0 | 0 |
a Reaction condition: T = 250 °C, P = 2.5 MPa, GHSV = 3000 h−1, LHSV = 1 h−1.
Disclaimer/Publisher’s Note: The statements, opinions and data contained in all publications are solely those of the individual author(s) and contributor(s) and not of MDPI and/or the editor(s). MDPI and/or the editor(s) disclaim responsibility for any injury to people or property resulting from any ideas, methods, instructions or products referred to in the content. |
© 2023 by the authors. Licensee MDPI, Basel, Switzerland. This article is an open access article distributed under the terms and conditions of the Creative Commons Attribution (CC BY) license (https://creativecommons.org/licenses/by/4.0/).
Share and Cite
MDPI and ACS Style
Younis, M.N.; Ren, Z.; Li, C.; Wang, E.; Li, J. Alkali and Alkaline Earth Metals (K, Ca, Sr) Promoted Cu/SiO2 Catalyst for Hydrogenation of Methyl Acetate to Ethanol. Catalysts 2023, 13, 450. https://doi.org/10.3390/catal13020450
AMA Style
Younis MN, Ren Z, Li C, Wang E, Li J. Alkali and Alkaline Earth Metals (K, Ca, Sr) Promoted Cu/SiO2 Catalyst for Hydrogenation of Methyl Acetate to Ethanol. Catalysts. 2023; 13(2):450. https://doi.org/10.3390/catal13020450
Chicago/Turabian StyleYounis, Muhammad Naeem, Zhiheng Ren, Chunshan Li, Erqiang Wang, and Jie Li. 2023. "Alkali and Alkaline Earth Metals (K, Ca, Sr) Promoted Cu/SiO2 Catalyst for Hydrogenation of Methyl Acetate to Ethanol" Catalysts 13, no. 2: 450. https://doi.org/10.3390/catal13020450
Note that from the first issue of 2016, this journal uses article numbers instead of page numbers. See further details here.