
Kinetics of Hydrogen Evolution Reaction on Monometallic Bulk Electrodes in Various Electrolytic Solutions


1
Faculty of Physical Chemistry, University of Belgrade, Studentski trg 12-16, 11158 Belgrade, Serbia
2
Department of Chemistry, Mai Nefhi College of Science, National Higher Education and Research Institute, Asmara 12676, Eritrea
*
Author to whom correspondence should be addressed.
Catalysts 2023, 13(10), 1373; https://doi.org/10.3390/catal13101373
Submission received: 8 September 2023
/
Revised: 1 October 2023
/
Accepted: 17 October 2023
/
Published: 18 October 2023
(This article belongs to the Special Issue Electrocatalysts for the Production of Hydrogen, Oxygen and Syngas)
Abstract
:The hydrogen evolution reaction (HER) holds pivotal significance in electrochemical energy conversion. In this study, we present essential HER kinetic parameters encompassing nine metals (Ag, Au, Co, Cr, Fe, Ni, Pt, W, and Zn) evaluated within seven distinct electrolytes (0.1 mol dm−3 HClO4, 0.1 mol dm−3 HCl, 0.5 mol dm−3 NaCl, 1 mol dm−3 KH2PO4, 0.1 mol dm−3 KOH, 0.1 mol dm−3 LiOH, and 1 mol dm−3 KOH). Through careful measures to restrain oxide formation, HER activity was measured on clean electrodes, while the assessment of HER activity on oxidatively treated metals was also performed. By correlating HER exchange current densities with calculated hydrogen binding energies, we show that the shape of HER volcano curves is largely preserved in studied electrolytes, at least around their apexes. Additionally, depending on the metal–electrolyte combination, the presence of surface oxide can have both positive and negative effects on HER kinetics. Finally, we collated HER kinetic data for bulk surfaces from diverse literature sources, offering a comprehensive overview of the kinetic parameters governing hydrogen evolution across distinct electrolytic environments. These insights have practical significance, guiding the development of new catalytic materials for different water electrolysis technologies, optimizing electrolyte formulations for boosting HER, and enhancing energy efficiency and catalytic performance through catalyst–electrolyte synergies.
1. Introduction
The hydrogen evolution reaction (HER) has gained significant attention in the field of electrochemistry, particularly due to its relevance in addressing the global energy crisis. Hydrogen production methods are crucial, with a focus on cost-effectiveness, as hydrogen is being explored as a potential future fuel source. This is especially pertinent in the context of green hydrogen production through water electrolysis, where renewable energy sources are harnessed to generate high-purity hydrogen. Despite its promise, the production of green hydrogen remains costly, necessitating the development of efficient catalysts for its generation. To sum up general knowledge, different monometallic catalysts display a wide range of HER activities. Considering a series of metal catalysts in a given electrolyte, the strength of the interaction with the HER intermediate (adsorbed hydrogen atom, Hads) influences the activity. These interactions render different elementary steps in the HER mechanism as the rate-determining ones and define the rate at which the reaction will take place. This interaction also depends on the state of the surface, such as the presence of oxides, which is sometimes quite difficult to control. On the other hand, the HER activity is highly dependent on pH, as elaborated below. Finally, different cations and anions can affect the HER rate through the modification of the solvent structure at the interface and poisoning effects. To move one step closer to a better understanding of these effects, it is necessary to address HER systematically.
Volcano curves have played a crucial role in understanding trends in the electrocatalytic activity of HER. One of the pioneering volcano curves established a correlation between the exchange current densities of HER and the energy associated with hydride formation for various metals in acidic environments [1]. Another volcano curve was later formulated by Nørskov et al. [2], linking exchange current density in acidic media to theoretically calculated hydrogen binding energy. However, criticisms have been raised regarding the simplicity of this approach [3]. Furthermore, Quaino et al. challenged the concept of a universal volcano curve, proposing that removing oxide-covered metals (W, Mo, Ta, Ti, and Nb) from the original curves negates the curve’s existence. They argued that highly exothermic hydrogen adsorption does not lead to a reduction in the reaction rate [4]. In a more recent development, Sheng et al. [5] constructed volcano curves for alkaline media based on the HER exchange current density and calculated hydrogen binding energy. The concept of volcano curves implies that hydrogen binding energy (HBE) can serve as a descriptor for identifying suitable electrocatalysts for HER in both acidic and alkaline environments. Moreover, the exchange current density for HER can be tailored by modifying surface chemical properties [2,5].
Despite criticism [3,4], the volcano curve remains the paramount representation of trends in HER activity. It is extensively utilized within the scientific community to explore novel HER catalysts, identifying materials with optimal binding energies. However, the systematic investigations of the volcano curve’s presence across diverse electrolytes, especially in pH-neutral solutions and a broad pH range, are scarce. A methodical exploration of neutral solutions holds particular significance for seawater electrolysis technologies, which encounter several challenges [6]. Moreover, comprehensive scrutiny of surface oxidation in alkaline solutions is currently deficient, whereas it has been examined and discussed in the context of acidic solutions [4]. Notably, in alkaline mediums, surface oxidation is recognized for enhancing H2O dissociation at the metal–oxide phase boundary, thereby expediting the HER [7,8]. This prompts inquiries into how phase boundary engineering impacts the HER volcano curve and whether it could facilitate the shift of the peak away from platinum towards more cost-effective and accessible catalysts. In connection to these questions, our previous work [9] has demonstrated that the volcano curve concept can be used in a wide pH range, from acidic to alkaline, with Pt being at the apex of all the curves. Moreover, the branches of the HER volcano are affected by the choice of the electrolyte and the oxidation state of the electrode.
Prior research has underscored the substantial influence of electrolyte pH and composition, alongside electrode nature, on hydrogen evolution reaction (HER) kinetics [10,11]. Faid et al. [12] revealed alterations in the electrochemically active surface area (ESA) and Tafel slope for Ni-based catalysts in response to pH and KOH concentration shifts. In a comprehensive study of Pt(111) across a broad pH spectrum, a detailed kinetic investigation showed that hydrogen adsorption and evolution are notably sluggish in alkaline conditions, with pH affecting the rate-determining step [13]. The correlation between pH and the hydrogen oxidation reaction (HOR)/HER activity was explored on polycrystalline platinum [14] and carbon-supported monometallic surfaces (Pt, Ir, and Pd) [15]. A linear decline in activity with increasing pH was observed, while hydrogen binding energy (HBE) exhibited an inverse relationship. This clarifies that the enhanced oxophilicity of catalysts, such as Ir over Pt and Pd, does not translate into increased HER activity at high pHs [15]. Notably, pH was observed to impact adsorbate coverage and water orientation [16]. Computational simulations by Cheng et al. [17] linked pH-dependent hydrogen binding on Pt to alterations in water adsorption. Diverse supporting electrolyte compositions (Na2SO4 or K2SO4) demonstrated their impact on the electric double-layer structure, potential of maximum entropy, and electrode processes for polycrystalline gold electrodes [18]. Subbaraman et al. [7] illustrated a two-fold HER catalytic enhancement in the case of nano-scale Ni(OH)2-decorated Pt electrodes through Li+-induced destabilization of the HO-H bond. Au electrode HER activity was significantly elevated at a moderately alkaline pH (pH = 11) upon increased cation concentrations [19]. Huang et al. [20] reported a pH-dependent boost in Pt(111) HER activity across the pH range from 1 to 14, aligned with the structure-making properties of cations (Cs+ < Rb+ < K+ < Na+ < Li+). A similar activity order of Li+ > Na+ > K+ > Cs+ was confirmed by Taji et al. [21], with 0.1 mol dm−3 LiOH exhibiting peak performance at low overpotentials. The Volmer–Heyrovsky and Volmer–Tafel processes’ relative contributions varied with the alkali metal cation, particularly favoring Volmer–Heyrovsky for LiOH electrolytes [21]. Strongly hydrated cations (e.g., Li+) were found to enhance HER at higher overpotentials, while weakly hydrated cations (e.g., K+) only did so at lower overpotentials [22]. However, a higher pH led to the inhibition of HER due to the accumulation of species at the outer Helmholtz plane [19,22]. Considering these findings raises the question of how ion nature, concentration, and electrolyte pH collectively influence the trends in HER activity, commonly depicted in the form of volcano plots.
The current literature lacks a systematic study of HER trends over a wide series of metals and electrolytes. Using different literature sources to establish the trends is difficult, if not impossible, due to different methodologies used to measure and report activities. Thus, here, we continue our previous work on the HER activity trends on monometallic bulk electrodes [9]. We provide HER kinetic parameters for eight metals (Ag, Au, Co, Cr, Fe, Ni, Pt, and W) across seven distinct electrolytes (0.1 mol dm−3 HClO4, 0.1 mol dm−3 HCl, 0.5 mol dm−3 NaCl, 1 mol dm−3 KH2PO4, 0.1 mol dm−3 KOH solution, 0.1 mol dm−3 LiOH, and 1 mol dm−3 KOH). This study is focused on establishing the overall HER trends for bulk metallic surfaces, and in order to have a proper comparison of catalytic activities, all the measured currents are normalized to ESA determined for freshly polished electrodes. Due to precautions taken to minimize oxide formation, with selected cases involving measurements performed on oxidatively treated metals, we analyze the impact of metal oxidation on electrocatalytic HER activity. As the experiments were conducted using bulk electrodes in the rotating disk electrode setup, there were no issues associated with the structural and mechanical stability frequently observed for deposited nanocatalysts and thin films. Additionally, we collect HER kinetic data from various literature sources, providing a comprehensive overview of kinetic parameters for hydrogen evolution in different electrolytes, which can serve as a reference point for future work on developing novel HER electrocatalysts.
2. Results
In order to establish trends in catalytic activities over the series of polycrystalline metals, we have used the HER exchange current densities (j0) of the considered metals in each solution. The exchange current densities were obtained by performing Tafel analysis on (i) the j–η curves obtained on the freshly polished electrodes and (ii) the j–η curves obtained upon cycling an electrode to high anodic potentials (approx. +1.4 V vs. RHE in a given solution). Representative j–η curves for some of the electrolytes are presented in Figure 1. All the measured currents were normalized to the real surface area determined for each electrode separately. In the event that the oxide layer is not readily reducible under HER conditions, the second case relates to HER activities over oxidized surfaces. We note that the oxidation steps are not performed in every solution and for all the electrodes, but just in cases that we considered particularly important to investigate. We also emphasize that the extent of the surface coverage by the oxide layer was not determined here and remains an open question.
Exchange current densities were extracted via the extrapolation of the linear part of the Tafel plot between −1.3 mA cm−2real and –0.7 mA cm−2real to 0 V vs. RHE (η = 0), where this current density range was available from the experimental HER polarization curve (Figure 2). We note that Zn was practically impossible to reliably measure in any of the electrolytes. Thus, a detailed analysis of this metal is missing.
The HER exchange current density for each metal in each solution is, thus, used to construct volcano plots by correlating it with HBE. HBE values were taken from [9] and present a compilation of the values from different literature sources where multiple values were found. Also, for Zr and Cr, separate calculations were performed [9]. The HER volcano plots are presented in Figure 3. We see that the overall shapes of the volcano curves are preserved and that Pt remains the most active monometallic catalyst. Considering the trends in different electrolytes, in acidic media, activities measured in HClO4 are higher compared to HCl. In neutral solutions, activities reach higher values in KH2PO4 compared to NaCl. Finally, in alkaline media, the highest activities are measured in LiOH, followed by 1 mol dm−3 KOH and 0.1 mol dm−3 KOH.
3. Discussion
Volcano plots for 0.1 mol dm−3 HCl preserve their shapes, with Pt having the highest HER activity. The activities of freshly polished Fe and W are very low. After oxidative treatment, the activity of Cr decreased. In 0.1 mol dm−3 HClO4, similar conclusions hold. After the oxidative treatment, the activity W decreased significantly. In the acidic media, Pt is still the best HER catalyst in terms of agreement with the literature [1,2]. The HER activity of the freshly polished electrodes, based on the exchange current density, for almost all the metals (except Ag and Cr) is better in 0.1 mol dm−3 HClO4 than in 0.1 mol dm−3 HCl. This could be attributed to chlorine poisoning in 0.1 mol dm−3 HCl and the non-adsorbing property of ClO4− anion in 0.1 mol dm−3 HClO4. Sheng et al. [14] investigated how the HER activity of Pt(110) in 0.1 M KOH was impacted by the SO42− and ClO4− anions. ClO4− was shown to have no effect on the HBE, while the addition of SO42− slightly altered the HBE of Pt (110). On the other hand, a comparable HER/HOR performance of Pt across three electrolytes (HClO4, HNO3, and H2SO4) is reported in Ref. [23]. Moreover, a study by Lamy-Pitara et al. [24] revealed that, in contrast to the HOR, the HER current densities, which have been examined in low overpotential region, were found to be independent of the nature of the supporting electrolyte (HClO4, H2SO4, and HCl). Table 1 and Table 2 compare the obtained exchange current densities and Tafel slopes with the ones reported previously in the literature for HClO4 and HCl solutions on freshly polished electrodes.
Despite the fact that the data are dispersed in a 0.5 mol dm−3 NaCl solution, the volcano plots are still preserved in the investigated neutral solutions. In neutral media, the HER activity of almost all of the freshly polished and those electrodes that are exposed to oxidative treatment is higher in 1 mol dm−3 KH2PO4 than in 0.5 mol dm−3 NaCl. Lower HER performance in 0.5 mol dm−3 NaCl is attributed to the cation effect [22] and chloride ion poisoning. Moreover, KH2PO4 has buffer properties, stabilizing the pH at the metal/electrolyte interface. Though the pH at the solid–liquid interface differs significantly from the bulk in unbuffered or insufficiently buffered solutions, under specified mass-transport conditions, a buffer concentration of 10−2 mol dm−3 is sufficient to maintain the surface pH to the bulk value at reaction rates as high as 1 mA cm−2 [11].
The volcano curve is well preserved in alkaline media, being in good agreement with the work by Sheng et al. [5]. The HER activity of the majority of the freshly polished electrodes is higher in 1 mol dm−3 KOH than in 0.1 mol dm−3 KOH. An increase in KOH concentration (from 0.1 to 1 mol dm−3) has promoted the HER performance of the catalysts. In an attempt to investigate the effect of the nature of the electrode (polycrystalline and nanostructured), pH (12 to 14), and concentration of the electrolyte (0.01 to 2 mol dm−3 KOH), a study by Faid et al. revealed that variations in the pH and KOH concentration have affected the HER activity of the Ni-based catalysts by altering the ECSA and the Tafel slope. The HER performance was also found to be affected by the composition and morphology of the catalyst [12]. Goyal et al. [19] reported that the HER activity on Au electrodes at a moderately alkaline pH (pH = 11) was considerably boosted upon raising the cation concentration. The results led to the hypothesis that cations play a crucial role in stabilizing the transition state of the rate-determining Volmer step by interacting favorably with the dissociating water molecule (*H—OH−—cat+). However, at high pH and high cation concentration, a too-high near-surface cation concentration drives a decline in HER activity, which was ascribed to near-surface cation blocking of the surface [19]. On the other hand, the activities of Pt, Ni, and Fe are slightly higher in 0.1 mol dm−3 KOH than in 1 mol dm−3 KOH. The HER performances of almost all the metals (Au, Co, Cr, Ni, Pt, and W) for both the freshly polished and oxidatively treated electrodes are better in 0.1 mol dm−3 LiOH than those of 0.1 mol dm−3 KOH and 1 mol dm−3 KOH. The results of our study are in good agreement with the literature [7,20,21,22].
The impact of alkali metal cations on the HER mechanism at Pt microelectrodes was studied by Taji et al. [21]. The activity pattern follows Li+ > Na+ > K+ > Cs+, with 0.1 mol dm−3 LiOH having the highest activity at low overpotentials. Li+-ion-induced destabilization of the HO-H bond is believed to accelerate sluggish water dissociation [7]. The Volmer–Heyrovsky and Volmer–Tafel processes’ relative contributions to the overall reaction were shown to vary depending on the type of the alkali metal cation, with the Volmer–Heyrovsky process being more significant for LiOH electrolytes [21]. A more recent work by Huang et al. [20] has also demonstrated that the HER activity of Pt(111), in the pH range of 1 to 14, is boosted with the increasing structure-making tendencies of cations in the order of Cs+ < Rb+ < K+ < Na+ < Li+, as already mentioned. This phenomenon can be rationalized by an increase in the concentration of cations on the negatively charged Pt surface, altering the interfacial water structure and the H-bonding network [20]. Furthermore, according to research by Monteiro et al. [22] on Au and Pt electrodes, strongly hydrated cations (Li+) favor HER at higher overpotentials compared to weakly hydrated cations (K+), which only favor HER at low overpotentials. However, at high pH and hence high near-surface cation concentrations, the buildup of these species at the outer Helmholtz plane inhibits HER [22]. Here, we also provide a detailed overview of available literature data for HER kinetics in KOH (Table 3) and LiOH solutions (Table 4).
Finally, we note that the determination of exchange current densities and Tafel slopes using Tafel analysis are mutually connected and that a change in one parameter induces a change in the other one. Another problematic point is that the selection of the linear part of the Tafel plot is somewhat arbitrary and could be a source of the variation in HER kinetic parameters reported in the literature. Thus, we attempted to perform Tafel analysis in the same current density regions for all the electrodes. However, even in this case, the complete picture of the activity trends might be elusive as the full range of current densities that are of practical interest cannot be encompassed. Thus, a more detailed overview can be obtained not only by comparing exchange current densities but also by considering the overpotential needed for a selected current density (or several of them). For this reason, here, we also provide the complete list of overpotentials needed to reach the current density of −0.1 mA cm−2real, (Table 5), which roughly corresponds to the current density of −10 mA cm−2geom for high-surface-area electrodes, as explained in Ref. [9]. The provided data also summarize the present work and emphasize the possible benefits of the carefully selected combination of the catalyst, its surface treatment (oxidation), and electrolytes for boosting HER efficiency. For example, using oxidized Ni cathodes for seawater electrolysis is justified not only by the lower price but also by the lower HER overpotential compared to platinum. Finally, we note that the present study might have narrowed the existing literature gap, considering model bulk electrocatalysts, but similar studies of the case of nanosized electrocatalysts are also needed. This relates particularly to advanced complex electrocatalytic structures, where interfacing different components can significantly boost HER activity [40,41].
4. Materials and Methods
Our previous work describes all the experimental procedures in detail [9]. Here, we describe them again for the sake of completeness. Electrochemical assessments were carried out using rotating disk electrodes (RDE) made of polycrystalline metal. The RDEs had a Teflon casing with a diameter of 10 mm. The metallic disks, including Ag, Au, Co, Fe, Pt, and W, had diameters of 3 mm, while the Ni disk had a diameter of 3.2 mm. The Cr and Zn disks had diameters of 5 mm. These RDE electrodes were crafted in-house, and the metals, with the exception of Cr, which was 99.7% pure, were obtained from Goodfellow Cambridge Ltd. (Huntingdon, UK) with a purity of at least 99.95%. Prior to measurements, each disk underwent a polishing process using alumina powder to achieve a mirror-like finish, followed by a 15-s sonication stage. Subsequently, the disks were washed with the working solution and promptly transferred to the electrochemical cell. To minimize oxide formation on the metal surfaces, measurements were initiated immediately after the transfer to the cell.
Electrochemical measurements were executed using the IVIUM Vetex.One (Eindhoven, The Netherlands) within a single-compartment glass electrochemical cell equipped with three electrodes. A double-junction Saturated Calomel Electrode (SCE) was employed as the reference electrode. Although the glass material could potentially release silicates into alkaline solutions during the experiment, this phenomenon was deemed negligible due to the brief duration of each electrode’s experimentation (<10 min). A graphite rod served as the counter electrode for acidic solutions, while a 3 × 3 cm Ni foam was used for pH-neutral and alkaline solutions. The electrolyte solutions, including 0.1 mol dm−3 HClO4, 0.1 mol dm−3 HCl, 0.5 mol dm−3 NaCl, 1 mol dm−3 KH2PO4, 0.1 mol dm−3 KOH solution, 0.1 mol dm−3 LiOH, and 1 mol dm−3 KOH, were prepared using ultrapure deionized water. Sigma Aldrich chemicals were employed, and the hydroxides used were anhydrous with a minimum purity of ≥99.9% trace metal basis. All measurements were conducted at room temperature. Throughout the experimental work, potentials were referenced to the SCE, and overpotentials for the Hydrogen Evolution Reaction (HER) were computed by converting potentials to fit the Reversible Hydrogen Electrode (RHE) scale. This conversion was performed using the formula ERHE = ESCE + 0.244 V + 0.059 V pH. Using a positive feedback scheme (hardware setting), 75% of the electrolyte resistance, determined using single-point impedance measurement at 100 kHz, was compensated. HER measurements were carried out using cyclic voltammetry, with a potential sweep rate of 10 mV. The electrode potentials were initially held at −1 V, −0.6 V, and −0.24 V vs. SCE, respectively, until the current density dropped below 1 μA cm−2 for alkaline, pH-neutral, and acidic solutions, respectively. Subsequently, three cycles involving deep negative potentials were executed, followed by cyclic sweeps between 0 and +1.4 V vs. RHE at a sweep rate of 20 mV s−1. Following this step, the HER measurement was repeated following the above-specified procedure. The electrode potentials were consistently controlled throughout the measurements, and relaxation to the open circuit potential was prevented. To eliminate any potential H2 bubbles that might have formed during the measurement protocol, the electrodes were continually rotated at a rate of 1800 rpm.
Cyclic voltammetry was employed to conduct RF measurements on freshly polished electrodes, except for Fe and Pt. The measurements entailed cycling the electrodes between 0.1 and 0 V vs. RHE within a 1 mol dm−3 KOH solution. To curtail oxide content, the electrodes underwent an intensive Hydrogen Evolution Reaction (HER) at deep negative potentials prior to the measurements. To compute the Effective Surface Area (ESA), the electrode capacitance calculated from the slope of the current versus the potential scan rate line was divided by 20 μF cm−2 [42,43]. Subsequently, the measured HER currents were normalized with respect to ESA, and the ratio of the ESA to the geometric cross-sectional area of a disk was employed to calculate the RF. However, in the case of Fe, due to substantial current versus potential scan rate scattering, this method did not yield accurate RF determination. Therefore, impedance spectroscopy was utilized to compute the RF for the Fe disk. The impedance spectrum was captured across the frequency range of 0.1 Hz to 100 kHz after subjecting the disk to HER at −0.3 V vs. RHE in a 1 mol dm−3 KOH solution. By fitting the spectra, the electrode capacitance was determined, and ESA was obtained by dividing the capacitance by 20 μF cm−2, assuming a surface devoid of oxides. For Pt, RF and ESA were determined using cyclic voltammetry in a 0.1 mol dm−3 HClO4 solution. ESA was calculated by integrating the peaks corresponding to hydrogen underpotential deposition and H-desorption. The charge under these peaks was subsequently divided by 210 μC cm−2 [43]. It is important to note that alternative approaches for determining ESA, such as the one based on adsorption capacitance, have been suggested and appear suitable for some of the metals investigated in this study [44]. However, the applicability of these approaches have not been confirmed for all the catalysts examined. Therefore, capacitance measurements were utilized to ascertain ESA whenever possible or determine when conventional methods were not applicable, such as in the case of Pt. We note that the measurements of ESA were performed only for freshly polished electrodes and not for the oxidized ones. We could argue that oxidation could increase ESA and, thus, lead to enhanced activity. However, our recent work on sputtered smooth Ni films demonstrated that such changes are negligible (~1% increase in ESA) [45].
5. Conclusions
The presented work encompasses a comprehensive overview of the catalytic HER activities of nine metals in seven different electrolytes, covering the pH range from highly acidic to highly alkaline. Moreover, the effects of surface oxidation on the HER activity are carefully analyzed. The overall catalytic trends among the metals and electrolytes are studied and presented, filling the literature gaps where no systematic overview currently exists. We have found that the overall shapes of HER volcanos are preserved over the studied series of metals in the range of electrolytes that were investigated, particularly around their apexes corresponding to the binding of hydrogen to platinum. However, it is important to note that Cr, the metal with the most exothermic hydrogen binding in the series analyzed here, deviates from the strong binding branches of HER volcanos and shows surprisingly high activity. The surface oxidation can either hinder or improve HER activity. The latter effect is particularly important in the case of Ni in neutral and alkaline solutions. In NaCl solution, significantly lower HER activity was measured compared to other electrolytes. In this electrolyte, oxidized Ni significantly surpasses Pt in terms of HER activity. We believe that understanding HER activity trends and the additional filling of the literature gaps, like performing analogous systematic studies for nanosized catalysts, could be highly beneficial from a practical perspective. It can not only lead to the development of novel catalytic materials but also enable the optimization of electrolyte formulations and catalyst–electrolyte combinations for energy saving and boosts to catalytic activity.
Author Contributions
Conceptualization, I.A.P.; Formal analysis, G.K.G. and A.Z.J.; Funding acquisition, I.A.P.; Investigation, G.K.G. and A.Z.J.; Methodology, A.Z.J. and I.A.P.; Resources, I.A.P.; Supervision, I.A.P.; Validation, I.A.P.; Writing—original draft, G.K.G. and A.Z.J.; Writing—review and editing, I.A.P. All authors have read and agreed to the published version of the manuscript.
Funding
This research was funded by the Serbian Science Fund, grant RatioCAT (PROMIS program). I.A.P. and A.Z.J. also acknowledge the financial support provided by the Serbian Ministry of Science, Technological Development, and Innovations (Contract number: 451-03-47/2023-01/200146).
Data Availability Statement
Data are available from the corresponding author upon reasonable request.
Conflicts of Interest
The authors declare no conflict of interest.
References
- Trasatti, S. Work function, electronegativity, and electrochemical behaviour of metals: III. Electrolytic hydrogen evolution in acid solutions. J. Electroanal. Chem. Interfacial Electrochem. 1972, 39, 163–184. [Google Scholar] [CrossRef]
- Nørskov, J.K.; Bligaard, T.; Logadottir, A.; Kitchin, J.R.; Chen, J.G.; Pandelov, S.; Stimming, U. Trends in the Exchange Current for Hydrogen Evolution. J. Electrochem. Soc. 2005, 152, J23–J26. [Google Scholar] [CrossRef]
- Schmickler, W.; Trasatti, S. Comment on “Trends in the Exchange Current for Hydrogen Evolution”. J. Electrochem. Soc. 2006, 153, L31–L32. [Google Scholar] [CrossRef]
- Quaino, P.; Juarez, F.; Santos, E.; Schmickler, W. Volcano plots in hydrogen electrocatalysis-uses and abuses. Beilstein J. Nanotechnol. 2014, 5, 846–854. [Google Scholar] [CrossRef] [PubMed]
- Sheng, W.; Myint, M.; Chen, J.G.; Yan, Y. Correlating the hydrogen evolution reaction activity in alkaline electrolytes with the hydrogen binding energy on monometallic surfaces. Energy Environ. Sci. 2013, 6, 1509–1512. [Google Scholar] [CrossRef]
- Khan, M.A.; Al-Attas, T.; Roy, S.; Rahman, M.M.; Ghaffour, N.; Thangadurai, V.; Larter, S.; Hu, J.; Ajayan, P.M.; Kibria, G. Seawater electrolysis for hydrogen production: A solution looking for a problem? Energy Environ. Sci. 2021, 14, 4831–4839. [Google Scholar] [CrossRef]
- Danilovic, N.; Subbaraman, R.; Strmcnik, D.; Chang, K.-C.; Paulikas, A.P.; Stamenkovic, V.R.; Markovic, N.M. Enhancing the alkaline hydrogen evolution reaction activity through the bifunctionality of Ni(OH)2/metal catalysts. Angew. Chem. Int. Ed. 2012, 51, 12495–12498. [Google Scholar] [CrossRef]
- Subbaraman, R.; Tripkovic, D.; Chang, K.C.; Strmcnik, D.; Paulikas, A.P.; Hirunsit, P.; Chan, M.; Greeley, J.; Stamenkovic, V.; Markovic, N.M. Trends in activity for the water electrolyser reactions on 3d M(Ni,Co,Fe,Mn) hydr(oxy)oxide catalysts. Nat. Mater. 2012, 11, 550–557. [Google Scholar] [CrossRef]
- Gebremariam, G.K.; Jovanović, A.Z.; Dobrota, A.S.; Skorodumova, N.V.; Pašti, I.A. Hydrogen Evolution Volcano(es)—From Acidic to Neutral and Alkaline Solutions. Catalysts 2022, 12, 1541. [Google Scholar] [CrossRef]
- Dubouis, N.; Grimaud, A. The hydrogen evolution reaction: From material to interfacial descriptors. Chem. Sci. 2019, 10, 9165–9181. [Google Scholar] [CrossRef]
- Auinger, M.; Katsounaros, I.; Meier, J.C.; Klemm, S.O.; Biedermann, P.U.; Topalov, A.A.; Rohwerder, M.; Mayrhofer, K.J. Near-surface ion distribution and buffer effects during electrochemical reactions. Phys. Chem. Chem. Phys. 2011, 13, 16384–16394. [Google Scholar] [CrossRef]
- Faid, A.Y.; Foroughi, F.; Sunde, S.; Pollet, B. Unveiling hydrogen evolution dependence on KOH concentration for polycrystalline and nanostructured nickel-based catalysts. J. Appl. Electrochem. 2022, 52, 1819–1826. [Google Scholar] [CrossRef]
- Ledezma-Yanez, I.; Wallace, W.D.Z.; Sebastián-Pascual, P.; Climent, V.; Feliu, J.M.; Koper, M.T.M. Interfacial Water Reorganization as a PH-Dependent Descriptor of the Hydrogen Evolution Rate on Platinum Electrodes. Nat. Energy 2017, 2, 17031. [Google Scholar] [CrossRef]
- Sheng, W.; Zhuang, Z.; Gao, M.; Zheng, J.; Chen, J.G.; Yan, Y. Correlating hydrogen oxidation and evolution activity on platinum at different pH with measured hydrogen binding energy. Nat. Commun. 2015, 6, 5848. [Google Scholar] [CrossRef] [PubMed]
- Durst, J.; Siebel, A.; Simon, C.; Hasché, F.; Herranz, J.; Gasteiger, H.A. New insights into the electrochemical hydrogen oxidation and evolution reaction mechanism. Energy Environ. Sci. 2014, 7, 2255–2260. [Google Scholar] [CrossRef]
- Rossmeisl, J.; Chan, K.; Ahmed, R.; Tripković, V.; Björketun, M.E. PH in atomic scale simulations of electrochemical interfaces. Phys. Chem. Chem. Phys. 2013, 15, 10321–10325. [Google Scholar] [CrossRef]
- Cheng, T.; Wang, L.; Merinov, B.v.; Goddard, W.A. Explanation of Dramatic pH-Dependence of Hydrogen Binding on Noble Metal Electrode: Greatly Weakened Water Adsorption at High pH. J. Am. Chem. Soc. 2018, 140, 7787–7790. [Google Scholar] [CrossRef]
- Ding, X.; Garlyyev, B.; Watzele, S.A.; Sarpey, T.K.; Bandarenka, A.S. Spotlight on the Effect of Electrolyte Composition on the Potential of Maximum Entropy: Supporting Electrolytes Are Not Always Inert. Chem. A Eur. J. 2021, 27, 10016–10020. [Google Scholar] [CrossRef] [PubMed]
- Goyal, A.; Koper, M.T.M. The Interrelated Effect of Cations and Electrolyte pH on the Hydrogen Evolution Reaction on Gold Electrodes in Alkaline Media. Angew. Chem. Int. Ed. 2021, 60, 13452–13462. [Google Scholar] [CrossRef]
- Huang, B.; Rao, R.R.; You, S.; Myint, K.H.; Song, Y.; Wang, Y.; Ding, W.; Giordano, L.; Zhang, Y.; Wang, T.; et al. Cation- and pH-Dependent Hydrogen Evolution and Oxidation Reaction Kinetics. J. Am. Chem. Soc. 2021, 1, 1674–1687. [Google Scholar] [CrossRef]
- Taji, Y.; Zagalskaya, A.; Evazzade, I.; Watzele, S.; Song, K.-T.; Xue, S.; Schott, C.; Garlyyev, B.; Alexandrov, V.; Gubanova, E.; et al. Alkali Metal Cations Change the Hydrogen Evolution Reaction Mechanisms at Pt Electrodes in Alkaline Media. Nano Mater. Sci. 2022, in press. [CrossRef]
- Monteiro, M.C.O.; Goyal, A.; Moerland, P.; Koper, M.T.M. Understanding Cation Trends for Hydrogen Evolution on Platinum and Gold Electrodes in Alkaline Media. ACS Catal. 2021, 11, 14328–14335. [Google Scholar] [CrossRef]
- Kamat, G.A.; Zeledón, J.A.Z.; Gunasooriya, G.T.K.K.; Dull, S.M.; Perryman, J.T.; Nørskov, J.K.; Stevens, M.B.; Jaramillo, T.F. Acid anion electrolyte effects on platinum for oxygen and hydrogen electrocatalysis. Commun. Chem. 2022, 5, 20. [Google Scholar] [CrossRef]
- Lamy-Pitara, E.; El Mouahid, S.; Barbier, J. Effect of anions on catalytic and electrocatalytic hydrogenations and on the electrocatalytic oxidation and evolution of hydrogen on platinum. Electrochim. Acta 2000, 45, 4299–4308. [Google Scholar] [CrossRef]
- Tang, Z.Q.; Liao, L.W.; Zheng, Y.L.; Kang, J.; Chen, Y.X. Temperature Effect on Hydrogen Evolution Reaction at Au Electrode. Chin. J. Chem. Phys. 2012, 25, 469. [Google Scholar] [CrossRef]
- Zheng, Y.; Jiao, Y.; Vasileff, A.; Qiao, S.Z. The Hydrogen Evolution Reaction in Alkaline Solution: From Theory, Single Crystal Models, to Practical Electrocatalysts. Angew. Chem. Int. Ed. 2018, 57, 7568–7579. [Google Scholar] [CrossRef]
- Sheng, W.; Gasteiger, H.A.; Shao-Horn, Y. Hydrogen Oxidation and Evolution Reaction Kinetics on Platinum: Acid vs. Alkaline Electrolytes. J. Electrochem. Soc. 2010, 157, B1529. [Google Scholar] [CrossRef]
- Hall, D.M.; Beck, J.R.; Lvov, S.N. Electrochemical kinetics of the hydrogen reaction on platinum in concentrated HCl(aq). Electrochem. Commun. 2015, 57, 74–77. [Google Scholar] [CrossRef]
- Chanda, D.; Hnát, J.; Dobrota, A.S.; Pašti, I.A.; Paidar, M.; Bouzek, K. The effect of surface modification by reduced graphene oxide on the electrocatalytic activity of nickel towards the hydrogen evolution reaction. Phys. Chem. Chem. Phys. 2015, 17, 26864–26874. [Google Scholar] [CrossRef] [PubMed]
- Bao, F.; Kemppainen, E.; Dorbandt, I.; Bors, R.; Xi, F.; Schlatmann, R.; van de Krol, R.; Calnan, S. Understanding the Hydrogen Evolution Reaction Kinetics of Electrodeposited Nickel-Molybdenum in Acidic, Near-Neutral, and Alkaline Conditions. ChemElectroChem 2020, 8, 195–208. [Google Scholar] [CrossRef]
- Petrii, O.A.; Tsirlina, G.A. Electrocatalytic activity prediction for hydrogen electrode reaction: Intuition, art, science. Electrochim. Acta 1994, 39, 1739–1747. [Google Scholar] [CrossRef]
- Divisek, J. Determination of the kinetics of hydrogen evolution by analysis of the potential-current and potential-coverage curves. J. Electroanal. Chem. Interfacial Electrochem. 1986, 214, 615–632. [Google Scholar] [CrossRef]
- Miousse, D.; Lasia, A.; Borck, V. Hydrogen evolution reaction on Ni-Al-Mo and Ni-Al electrodes prepared by low pressure plasma spraying. J. Appl. Electrochem. 1995, 25, 592–602. [Google Scholar] [CrossRef]
- Huot, J.-Y. Hydrogen Evolution and Interface Phenomena on a Nickel Cathode in 30 w/o KOH : I. Kinetics Parameters and Electrode Impedance between 303 and 363 K. J. Electrochem. Soc. 1989, 136, 1933–1939. [Google Scholar] [CrossRef]
- Weber, D.J.; Janssen, M.; Oezaslan, M. Effect of Monovalent Cations on the HOR/HER Activity for Pt in Alkaline Environment. J. Electrochem. Soc. 2019, 166, F66–F73. [Google Scholar] [CrossRef]
- Tang, D.; Lu, J.; Zhuang, L.; Liu, P. Calculations of the exchange current density for hydrogen electrode reactions: A short review and a new equation. J. Electroanal. Chem. 2010, 644, 144–149. [Google Scholar] [CrossRef]
- Schmidt, T.J.; Ross, P.N.; Markovic, N.M. Temperature dependent surface electrochemistry on Pt single crystals in alkaline electrolytes: Part 2. The hydrogen evolution/oxidation reaction. J. Electroanal. Chem. 2002, 524–525, 252–260. [Google Scholar] [CrossRef]
- Ernst, S.; Hamann, C.H. The pH-dependence of the hydrogen exchange current density at smooth platinum in alkaline solution (KOH). J. Electroanal. Chem. Interfacial Electrochem. 1975, 60, 97–100. [Google Scholar] [CrossRef]
- Santos, D.M.F.; Sequeira, C.A.C.; Macciò, D.; Saccone, A.; Figueiredo, J.L. Platinum–rare earth electrodes for hydrogen evolution in alkaline water electrolysis. Int. J. Hydrogen Energy 2013, 38, 3137–3145. [Google Scholar] [CrossRef]
- Cheng, X.; Tong, Y. Interface Coupling of Cobalt Hydroxide/Molybdenum Disulfide Heterostructured Nanosheet Arrays for Highly Efficient Hydrazine-Assisted Hydrogen Generation. ACS Sustain. Chem. Eng. 2023, 11, 3219–3227. [Google Scholar] [CrossRef]
- Li, K.; Tong, Y.; Feng, D.; Chen, P. Electronic regulation of platinum species on metal nitrides realizes superior mass activity for hydrogen production. J. Colloid Interface Sci. 2022, 622, 410–418. [Google Scholar] [CrossRef]
- Łukaszewski, M.; Soszko, M.; Czerwiński, A. Electrochemical Methods of Real Surface Area Determination of Noble Metal Electrodes-an Overview. Int. J. Electrochem. Sci. 2016, 11, 4442–4469. [Google Scholar] [CrossRef]
- Trasatti, S.; Petrii, O.A. Real surface area measurements in electrochemistry. Pure Appl. Chem. 1991, 63, 711–734. [Google Scholar] [CrossRef]
- Watzele, S.; Hauenstein, P.; Liang, Y.; Xue, S.; Fichtner, J.; Garlyyev, B.; Scieszka, D.; Claudel, F.; Maillard, F.; Bandarenka, A.S. Determination of Electroactive Surface Area of Ni-, Co-, Fe-, and Ir-Based Oxide Electrocatalysts. ACS Catal. 2019, 9, 9222–9230. [Google Scholar] [CrossRef]
- Neumüller, D.; Rafailović, L.D.; Jovanović, A.Z.; Skorodumova, N.V.; Pašti, I.A.; Lassnig, A.; Griesser, T.; Gammer, C.; Eckert, J. Hydrogen Evolution Reaction on Ultra-Smooth Sputtered Nanocrystalline Ni Thin Films in Alkaline Media—From Intrinsic Activity to the Effects of Surface Oxidation. Nanomaterials 2023, 13, 2085. [Google Scholar] [CrossRef] [PubMed]
Figure 1.
Representative j–η curves for metal in (a) 0.1 mol dm−3 HCl, (b) 0.5 mol dm−3 NaCl, (c) 0.1 mol dm−3 KOH, and (d) 0.1 mol dm−3 LiOH. Closed symbols are for the freshly polished electrodes, while the open symbols are for the oxidized ones.
Figure 1.
Representative j–η curves for metal in (a) 0.1 mol dm−3 HCl, (b) 0.5 mol dm−3 NaCl, (c) 0.1 mol dm−3 KOH, and (d) 0.1 mol dm−3 LiOH. Closed symbols are for the freshly polished electrodes, while the open symbols are for the oxidized ones.

Figure 2.
Tafel plots for (a) 0.1 mol dm−3 HCl, (b) 0.1 mol dm−3 HClO4, (c) 0.5 mol dm−3 NaCl, (d) 1 mol dm−3 KH2PO4, (e) 0.1 mol dm−3 KOH, (f) 1 mol dm−3 KOH, and (g) 0.1 mol dm−3 LiOH. Closed symbols are for the freshly polished electrodes, while the open symbols are for the oxidized ones.
Figure 2.
Tafel plots for (a) 0.1 mol dm−3 HCl, (b) 0.1 mol dm−3 HClO4, (c) 0.5 mol dm−3 NaCl, (d) 1 mol dm−3 KH2PO4, (e) 0.1 mol dm−3 KOH, (f) 1 mol dm−3 KOH, and (g) 0.1 mol dm−3 LiOH. Closed symbols are for the freshly polished electrodes, while the open symbols are for the oxidized ones.

Figure 3.
Volcano curves for (a) 0.1 mol dm−3 HCl, (b) 0.1 mol dm−3 HClO4, (c) 0.5 mol dm−3 NaCl, (d) 1 mol dm−3 KH2PO4, (e) 0.1 mol dm−3 KOH, (f) 1 mol dm−3 KOH, and (g) 0.1 mol dm−3 LiOH. Black symbols represent the freshly polished electrodes, while red ones are for the oxidized samples.
Figure 3.
Volcano curves for (a) 0.1 mol dm−3 HCl, (b) 0.1 mol dm−3 HClO4, (c) 0.5 mol dm−3 NaCl, (d) 1 mol dm−3 KH2PO4, (e) 0.1 mol dm−3 KOH, (f) 1 mol dm−3 KOH, and (g) 0.1 mol dm−3 LiOH. Black symbols represent the freshly polished electrodes, while red ones are for the oxidized samples.


Table 1.
Comparison of the HER exchange current density values measured on freshly polished electrodes in HClO4 with the literature data (rt = room temperature, NM = not mentioned, geo = geometrical).
Table 1.
Comparison of the HER exchange current density values measured on freshly polished electrodes in HClO4 with the literature data (rt = room temperature, NM = not mentioned, geo = geometrical).
| Electrode | log(jo/mA cm−2) | Tafel Slope (mV dec−1) | Electrolyte | Temperature | Surface Area Used | References |
|---|---|---|---|---|---|---|
| Ag | −(4.11 ± 0.01) | −127 | 0.1 mol dm−3 HClO4 | rt | real | this work |
| Au | −(2.79 ± 0.02) | −263 | 0.1 mol dm−3 HClO4 | rt | real | this work |
| Au(100) | −4.3 | varies gradually from −60 to −120 mV dec−1 | 0.1 mol dm−3 HClO4 | NM | geo | [25] |
| Au(110) | −4.52 | |||||
| Au(111) | −3.6 | |||||
| Au (pc) | −3.85 | |||||
| Au | −2.6 | −118 | 0.1 mol dm−3 HClO4 | 278 K | geo | [25] |
| Au | −2.55 | −128.1 | 0.1 mol dm−3 HClO4 | 283 K | geo | [25] |
| Au | −2.12 | −133.3 | 0.1 mol dm−3 HClO4 | 293 K | geo | [25] |
| Au | −2 | −137.6 | 0.1 mol dm−3 HClO4 | 303 K | geo | [25] |
| Au | −1.72 | −146.7 | 0.1 mol dm−3 HClO4 | 313 K | geo | [25] |
| Au | −1.66 | −136 | 0.1 mol dm−3 HClO4 | 323 K | geo | [25] |
| Co | −(1.88 ± 0.01) | −227 | 0.1 mol dm−3 HClO4 | rt | real | this work |
| Cr | −(4.6 ± 0.08) | −102 | 0.1 mol dm−3 HClO4 | rt | real | this work |
| Fe | −(4.03 ± 0.02) | −144 | 0.1 mol dm−3 HClO4 | rt | real | this work |
| Ni | −(1.63 ± 0.02) | −248 | 0.1 mol dm−3 HClO4 | rt | real | this work |
| Pt | −(1.4 ± 0.04) | −53 | 0.1 mol dm−3 HClO4 | rt | real | this work |
| Pt(111) | −0.68 | −74 | 0.1 mol dm−3 HClO4 | NM | [26] | |
| Pt(111) | 0.17 | - | 0.1 mol dm−3 HClO4 | NM | [27] | |
| W | −(3.91 ± 0.02) | −85 | 0.1 mol dm−3 HClO4 | rt | real | this work |
Table 2.
Comparison of the HER exchange current density values measured on freshly polished electrodes in HCl with the literature data (rt = room temperature, NM = not mentioned, geo = geometrical).
Table 2.
Comparison of the HER exchange current density values measured on freshly polished electrodes in HCl with the literature data (rt = room temperature, NM = not mentioned, geo = geometrical).
| Electrode | log(jo/mA cm−2) | Tafel Slope (mV dec−1) | Electrolyte | Temperature | Surface Area Used | References |
|---|---|---|---|---|---|---|
| Ag | −(3.24 ± 0.03) | −156 | 0.1 mol dm−3 HCl | rt | real | this work |
| Au | −(2.95 ± 0.02) | −160 | 0.1 mol dm−3 HCl | rt | real | this work |
| Co | −(2.47 ± 0.03) | −219 | 0.1 mol dm−3 HCl | rt | real | this work |
| Cr | −(3.58 ± 0.03) | −240 | 0.1 mol dm−3 HCl | rt | real | this work |
| Fe | −(4.57 ± 0.01) | −139 | 0.1 mol dm−3 HCl | rt | real | this work |
| Ni | −(2.29 ± 0.04) | −140 | 0.1 mol dm−3 HCl | rt | real | this work |
| Pt | −(1.46 ± 0.05) | −77 | 0.1 mol dm−3 HCl | rt | real | this work |
| Pt | 0.2 | - | 1 mol dm−3 HCl | NM | geo | [28] |
| Pt | 0.079 | - | 7.72 mol dm−3 HCl | NM | geo | [28] |
| W | −(4.01 ± 0.03) | −84 | 0.1 mol dm−3 HCl | rt | real | this work |
Table 3.
Comparison of the HER exchange current density values measured on freshly polished electrodes in KOH solutions with the literature data (rt = room temperature, NM = not mentioned, geo = geometrical).
Table 3.
Comparison of the HER exchange current density values measured on freshly polished electrodes in KOH solutions with the literature data (rt = room temperature, NM = not mentioned, geo = geometrical).
| Electrode | log(jo/mA cm−2) | Tafel Slope (mV dec−1) | Electrolyte | Temperature | Surface Area Used | References |
|---|---|---|---|---|---|---|
| Ag | −(4.24 ± 0.03) | −134 | 1 mol dm−3 KOH | rt | real | this work |
| Ag | −(4.3 ± 0.15) | −139 | 0.1 mol dm−3 KOH | rt | real | this work |
| Ag | −(4.3 ± 0.3) | −(134 ± 9) | 0.1 mol dm−3 KOH | NM | geo | [5] |
| Au | −(3.25 ± 0.06) | −175 | 1 mol dm−3 KOH | rt | real | this work |
| Au | −(4.53 ± 0.01) | −134 | 0.1 mol dm−3 KOH | rt | real | this work |
| Au | −(3.2 ± 0.6) | −(168 ± 9) | 0.1 mol dm−3 KOH | NM | [5] | |
| Au | −2.85 | −167.7 | 0.1 mol dm−3 KOH | 278 K | geo | [25] |
| Au | −2.82 | −159.8 | 0.1 mol dm−3 KOH | 283 K | geo | [25] |
| Au | −2.72 | −155.4 | 0.1 mol dm−3 KOH | 293 K | geo | [25] |
| Au | −2.55 | −157.4 | 0.1 mol dm−3 KOH | 303 K | geo | [25] |
| Au | −2.26 | −167.5 | 0.1 mol dm−3 KOH | 313 K | geo | [25] |
| Au | −1.74 | −139.7 | 0.1 mol dm−3 KOH | 323 K | geo | [25] |
| Au | −1.54 | −141.4 | 0.1 mol dm−3 KOH | 333 K | geo | [25] |
| Co | −(2.07 ±0.02) | −248 | 1 mol dm−3 KOH | rt | real | this work |
| Co | −(2.49 ± 0.03) | −204 | 0.1 mol dm−3 KOH | rt | real | this work |
| Co | −(2.5 ± 0.4) | −(126 ± 6) | 0.1 mol dm−3 KOH | NM | [5] | |
| Cr | −(4.0 ±0.04) | −149 | 1 mol dm−3 KOH | rt | real | this work |
| Cr | −4.22 | −117 | 0.1 mol dm−3 KOH | rt | real | this work |
| Fe | −(3.4 ±0.08) | −172 | 1 mol dm−3 KOH | rt | real | this work |
| Fe | −(2.62 ± 0.02) | −206 | 0.1 mol dm−3 KOH | rt | real | this work |
| Fe | −(1.9 ± 0.4) | −(131 ± 12) | 0.1 mol dm−3 KOH | NM | [5] | |
| Ni | −(1.99 ± 0.05) | −174 | 1 mol dm−3 KOH | rt | real | this work |
| Ni | −(1.95 ± 0.05) | −132 | 0.1 mol dm−3 KOH | rt | real | this work |
| Ni | −(2.1 ± 0.5) | −(135 ± 32) | 0.1 mol dm−3 KOH | NM | geo | [5] |
| Ni foam | −1.17 | −144 | 1 mol dm−3 KOH | NM | geo | [29] |
| Ni | −2.60 | −121 | 1 mol dm−3 KOH | NM | geo | [30] |
| Ni metal with possible surface state of NiOx | −0.99 | −(146 ± 19) | 1 mol dm−3 KOH | geo | [31] | |
| Raney Ni (250) | 0.95 | 84 | 25% KOH | NM | geo | [32] |
| Ni metal with possible surface state of NiHx | −1.77 | 105–125 | 1.3 mol dm−3 KOH | NM | geo | [33] |
| Ni metal with possible surface state of NiHx | −1.45 | −115 | 30 (w%) KOH | NM | [34] | |
| Pt | −(2.07 ± 0.09) | −52 | 1 mol dm−3 KOH | rt | real | this work |
| Pt | −(1.93 ± 0.08) | −72 | 0.1 mol dm−3 KOH | rt | real | this work |
| Pt | −(0.2 ± 0.01) | −(113 ± 1) | 0.1 mol dm−3 KOH | NM | geo | [5] |
| Pt | −(0.24 ± 0.07) | - | 0.1 mol dm−3 KOH | NM | geo | [35] |
| Pt (poly) | −0.16 | - | 0.1 mol dm−3 KOH | NM | geo | [27] |
| Pt | −1–0.96 | - | 0.1 mol dm−3 KOH | 298 K | geo | [36] |
| Pt(111) | −2 | - | 0.1 mol dm−3 KOH | 275 K | geo | [37] |
| Pt(111) | −1.46 | - | 0.1 mol dm−3 KOH | 293 K | geo | [37] |
| Pt(111) | −1 | - | 0.1 mol dm−3 KOH | 313 K | geo | [37] |
| Pt(111) | −0.52 | - | 0.1 mol dm−3 KOH | 333 K | geo | [37] |
| Pt(110) | −0.9 | - | 0.1 mol dm−3 KOH | 275 K | geo | [37] |
| Pt(110) | −0.52 | - | 0.1 mol dm−3 KOH | 293 K | geo | [37] |
| Pt(110) | −0.25 | - | 0.1 mol dm−3 KOH | 313 K | geo | [37] |
| Pt(110) | −0.17 | - | 0.1 mol dm−3 KOH | 333 K | geo | [37] |
| Pt(110) | −1.3 | - | 0.1 mol dm−3 KOH | 275 K | geo | [37] |
| Pt | 0.02 | - | 1 mol dm−3 KOH | rt | geo | [38] |
| Pt(100) | −0.83 | −460 | 8 mol dm−3 KOH | NM | geo | [39] |
| W | −(3.81 ± 0.03) | −114 | 1 mol dm−3 KOH | rt | real | this work |
| W | −(3.97 ± 0.03) | −107 | 0.1 mol dm−3 KOH | rt | real | this work |
| W | −(4.2 ± 0.4) | −(90 ± 7) | 0.1 mol dm−3 KOH | NM | [5] |
Table 4.
Comparison of the HER exchange current density values measured on freshly polished electrodes in LiOH solutions with the literature data (rt = room temperature, NM = not mentioned, geo = geometrical).
Table 4.
Comparison of the HER exchange current density values measured on freshly polished electrodes in LiOH solutions with the literature data (rt = room temperature, NM = not mentioned, geo = geometrical).
| Electrode | log(jo/mA cm−2) | Tafel Slope (mV dec−1) | Electrolyte | Temperature | Surface Area Used | References |
|---|---|---|---|---|---|---|
| Ag | −(4.39 ± 0.01) | −180 | 0.1 mol dm−3 LiOH | rt | real | this work |
| Au | −(3.48 ± 0.01) | −169 | 0.1 mol dm−3 LiOH | rt | real | this work |
| Co | −(2.48 ± 0.01) | −189 | 0.1 mol dm−3 LiOH | rt | real | this work |
| Cr | −(3.56 ± 0.02) | −177 | 0.1 mol dm−3 LiOH | rt | real | this work |
| Fe | −(2.71 ± 0.01) | −222 | 0.1 mol dm−3 LiOH | rt | real | this work |
| Ni | −(1.92 ± 0.05) | −162 | 0.1 mol dm−3 LiOH | rt | real | this work |
| Pt | −(1.58 ± 0.1) | −81 | 0.1 mol dm−3 LiOH | rt | real | this work |
| Pt | −0.056 | - | 0.1 mol dm−3 LiOH | rt | NM | [35] |
| W | −(3.16 ± 0.03) | −120 | 0.1 mol dm−3 LiOH | rt | real | this work |
Table 5.
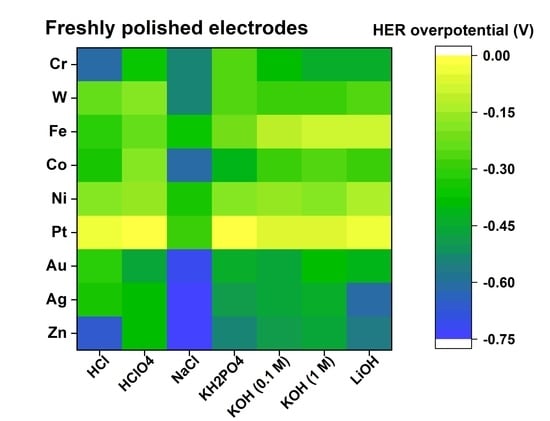
HER overpotentials (in V) needed to reach −0.1 mA cm−2real in 0.1 mol dm−3 HCl, 0.1 mol dm−3 HClO4, 0.5 mol dm−3 NaCl, 1 mol dm−3 KH2PO4, 0.1 mol dm−3 KOH, 1 mol dm−3 KOH, and 0.1 mol dm−3 LiOH, listed for the freshly polished electrodes and the oxidized ones.
Table 5.
HER overpotentials (in V) needed to reach −0.1 mA cm−2real in 0.1 mol dm−3 HCl, 0.1 mol dm−3 HClO4, 0.5 mol dm−3 NaCl, 1 mol dm−3 KH2PO4, 0.1 mol dm−3 KOH, 1 mol dm−3 KOH, and 0.1 mol dm−3 LiOH, listed for the freshly polished electrodes and the oxidized ones.
| HCl | HClO4 | NaCl | KH2PO4 | KOH (0.1 mol dm−3) | KOH (1 mol dm−3) | LiOH | |
|---|---|---|---|---|---|---|---|
| Electrode | HER overpotential for freshly polished electrodes (in V) | ||||||
| Ag | −0.35 | −0.39 | −0.73 | −0.49 | −0.46 | −0.43 | −0.61 |
| Au | −0.31 | −0.47 | −0.72 | −0.44 | −0.47 | −0.39 | −0.42 |
| Co | −0.33 | −0.20 | −0.62 | −0.42 | −0.30 | −0.26 | −0.28 |
| Cr | −0.62 | −0.37 | −0.53 | −0.27 | −0.38 | −0.45 | −0.45 |
| Fe | −0.32 | −0.25 | −0.37 | −0.22 | −0.12 | −0.10 | −0.09 |
| Ni | −0.18 | −0.16 | −0.35 | −0.18 | −0.16 | −0.18 | −0.15 |
| Pt | −0.03 | −0.02 | −0.29 | −0.01 | −0.06 | −0.06 | −0.05 |
| W | −0.24 | −0.20 | −0.55 | −0.27 | −0.30 | −0.29 | −0.26 |
| Zn | −0.67 | −0.40 | −0.73 | −0.55 | −0.48 | −0.46 | −0.57 |
| HER overpotential after oxidation of the polished electrodes (in V) | |||||||
| Ag | - | −0.42 | −0.65 | −0.36 | −0.45 | - | −0.55 |
| Au | - | −0.22 | −0.68 | −0.37 | −0.46 | - | −0.41 |
| Co | - | - | −0.50 | −0.38 | −0.30 | - | −0.27 |
| Cr | −0.61 | −0.48 | −0.74 | −0.26 | −0.58 | - | −0.42 |
| Fe | - | - | −0.48 | −0.20 | −0.16 | - | −0.13 |
| Ni | - | - | −0.24 | −0.16 | −0.13 | - | −0.11 |
| Pt | −0.01 | −0.01 | −0.29 | −0.02 | −0.06 | - | −0.07 |
| W | −0.27 | −0.22 | −0.57 | −0.28 | −0.36 | - | −0.28 |
| Zn | - | - | - | −0.54 | −0.48 | - | −0.57 |
Disclaimer/Publisher’s Note: The statements, opinions and data contained in all publications are solely those of the individual author(s) and contributor(s) and not of MDPI and/or the editor(s). MDPI and/or the editor(s) disclaim responsibility for any injury to people or property resulting from any ideas, methods, instructions or products referred to in the content. |
© 2023 by the authors. Licensee MDPI, Basel, Switzerland. This article is an open access article distributed under the terms and conditions of the Creative Commons Attribution (CC BY) license (https://creativecommons.org/licenses/by/4.0/).
Share and Cite
MDPI and ACS Style
Gebremariam, G.K.; Jovanović, A.Z.; Pašti, I.A. Kinetics of Hydrogen Evolution Reaction on Monometallic Bulk Electrodes in Various Electrolytic Solutions. Catalysts 2023, 13, 1373. https://doi.org/10.3390/catal13101373
AMA Style
Gebremariam GK, Jovanović AZ, Pašti IA. Kinetics of Hydrogen Evolution Reaction on Monometallic Bulk Electrodes in Various Electrolytic Solutions. Catalysts. 2023; 13(10):1373. https://doi.org/10.3390/catal13101373
Chicago/Turabian StyleGebremariam, Goitom K., Aleksandar Z. Jovanović, and Igor A. Pašti. 2023. "Kinetics of Hydrogen Evolution Reaction on Monometallic Bulk Electrodes in Various Electrolytic Solutions" Catalysts 13, no. 10: 1373. https://doi.org/10.3390/catal13101373
Note that from the first issue of 2016, this journal uses article numbers instead of page numbers. See further details here.