
Detection of Ciprofloxacin Based on BPN/TDNA Photoelectrode
Shanghai Key Laboratory of Materials Protection and Advanced Materials in Electric Power, College of Environmental and Chemical Engineering, Shanghai University of Electric Power, Shanghai 200090, China
*
Author to whom correspondence should be addressed.
Catalysts 2023, 13(10), 1368; https://doi.org/10.3390/catal13101368
Submission received: 11 September 2023
/
Revised: 10 October 2023
/
Accepted: 11 October 2023
/
Published: 15 October 2023
(This article belongs to the Special Issue Advances in Two-Dimensional Photocatalysts)
Abstract
:The photoelectrochemical (PEC) process has been demonstrated to exert enormous potential in the fields of analysis, and the rational design of PEC sensors are vital for practical applications. In this study, Titanium Dioxide Nanoarrays (TDNA) and black phosphorus nanosheets (BPN) were prepared, and a BPN/TDNA composite was proposed as the photoelectrochemical sensing material for the detection of ciprofloxacin (Cip). The formation and excellent optoelectronic properties of BPN/TDNA composite materials have been demonstrated through a series of characterization methods. Moreover, the measurement of PEC properties exhibited that the introduction of BPN and natural light would improve the electron migration efficiency and the separation of photogenerated electron–hole pairs, thereby displaying the synergistic effect to promote photoelectric performance. More importantly, the current density of BPN/TDNA was linearly proportional to the concentration of Cip ranging from 1.14 to 438.86 ng/mL, and the detection limit (3S/N) was 7.56 ng/mL. In addition, such a PEC sensor demonstrated long-term stability, good reproducibility, and selectivity. Finally, the real commercial sample detection was measured to confirm the possibility of practical applications. Thus, the BPN/TDNA photoelectrocatalyst provides a new method for Cip detection with high selectivity and sensitivity.
1. Introduction
Ciprofloxacin (Cip) is considered a third-generation fluoroquinolone antibiotic widely used in medicine and agriculture to combat various pathogens [1,2]. The abuse of Cip leads to an increased amount of Cip in animals, parts of which are excreted from animals [3]. This leads to excessive content of Cip in water, which seriously threatens human health and the ecological environment [4]. The excessive use of such antibiotics leads to the emergence and spread of drug-resistant bacteria and genes, which reduces their therapeutic potential for organisms and is considered a major threat to public health in the 21st century [5,6,7]. In addition, these antibiotics are released into the environment through animals and humans, which is a direct and fatal threat to all biological and aquatic systems [8]. In some lakes, due to the presence of antibiotics, sediment will exhibit relatively low microbial activity, resulting in a relatively anaerobic environment. Under these conditions, ammonia, sulfides, and other toxic byproducts will be produced. On the other hand, it will reduce the degradation rate of organic materials and increase the problem of bacterial resistance. Therefore, the quantitative analysis of Cip is essential. Some conventional methods, such as high-performance liquid chromatography (HPLC), capillary electrophoresis chromatography, mass spectrometry (MS), liquid-mass spectrometry (LS-MS), fluorescence spectrophotometry, chemiluminescence, solid phase extraction, electrochemical technique, and enzyme-linked immunosorbent assay (ELISA) show availability for determining Cip [3,4,9,10].
Nevertheless, the relatively high detection cost and complex operation process has restricted their practical applications. To this end, an effective detection method, photoelectrochemical (PEC) analysis, arose at a historic moment and has demonstrated promising prospects [11]. Due to its merits including high sensitivity, simple operation, and low background signal, PEC detection has been extensively applied in biosensing and heavy metal ion detection. Furthermore, due to the separation between the excitation light source and signal detecting device during the PEC detection process, the background signal can be minimized, thereby enhancing the detection sensitivity [10,12]. The rational design and selection of photosensitive electrode materials play a crucial role in the performance of PEC detection [13,14]. Previously reported semiconductor materials, such as metal oxides, metal sulfides, and N-doped carbon materials (such as TiO2, CdS, g-C3N4, MOF, and N-graphene quantum dots), have been widely studied [15,16,17,18,19,20]. In particular, black phosphorus is a metal-free, two-dimensional (2D), promising nanomaterial with unique electronic and optoelectronic properties, which include high electron mobility (ca. 1000 cm2/(Vs)), excellent light absorption, and high specific surface area [21,22,23,24]. In the last few years, the potential applications of black phosphorus nanosheets (BPN) have been proved in photovoltaic structures [25,26,27]. Our research team successfully fabricated BPN/TDNA composite electrodes for the detection of Cip under light illumination. This finding suggests that semiconductor hybridization can effectively enhance the electron transfer capacity and improve light utilization efficiency. Thus, seeking the reasonable design and preparation of TDNA matrix composites is significant for the corresponding PEC sensor technology.
Herein, the Titanium Dioxide Nanoarray (TDNA) was prepared and then utilized to construct BPN/TDNA composites via electrostatic self-assembly to detect Cip under natural light irradiation. The morphology, component, and crystal structure of BPN/TDNA were characterized and the superior photoelectrochemical properties (e.g., EIS, current density–time curve) were measured. The BPN/TDNA showed excellent Cip PEC detection properties with a wide concentration linear range from 1.14 to 438.86 ng/mL and a low detection limit of 7.56 ng/mL because of the synergistic effects between BPN and TDNA. Ultimately, a possible mechanism was proposed through experimental phenomena and theoretical analysis.
2. Results
2.1. Structure and Morphology of the As-Synthesized Electrodes
Here we show the morphologies and microstructures of the photocatalysts tested using SEM and TEM. From the SEM in Figure 1a,b, it is evident that the TiO2 prepared has a sheet-like structure, and these nanosheets are evenly distributed on the surface of the FTO substrate. Thereafter, NMP dispersion containing BPN is applied to cover the TDNA in a membrane form. In Figure 1b, we can observe successful contact between TDNA and BPN. The energy spectrum of Figure 1c indicates that the major constituents of BPN/TDNA include Ti (58.3 atomic%), O (41.3 atomic%), and P (0.4 atomic%).
Figure 2a shows the HR–TEM image and SAED mode of BPN/TDNA. We can clearly see that the lattice spacing of TiO2 ((101) lattice = 0.352 nm) is 0.327 nm, corresponding to the (021) surface of the BPN, which is consistent with the measured XRD results. Figure 2b displays the element mapping diagram of BPN/TDNA, showing the mapping images of Ti, O, and P elements, respectively.
The crystal structure and material composition of the synthesized electrode were analyzed through X-ray diffraction (XRD). As shown in Figure 3, the diffraction peaks were observed at 25.37°, 36.94°, 37.97°, 38.57°, 48.08°, 53.87°, 55.14°, 62.12°, 62.68°, 68.76°, 70.30°, 74.03°, 75.03°, and 76.02°, respectively. The observed peaks were consistent with the (101), (103), (004), (112), (200), (105), (211), (213), (204), (116), (220), (107), (215), and (301) diffraction peaks of anatase TiO2 in the JCPDS 21-1272 standard card. Additionally, diffraction peaks of 27.15° and 35.35° were observed, which were consistent with the (021) and (111) diffraction peaks of the BPN in the JCPDS 76-1963 standard card.
The Fourier transform infrared (FTIR) spectra of BPN, TDNA, and BPN/TDNA composite materials are shown in Figure 4. The TDNA infrared spectrum indicated an absorption peak of 3400 cm−1 to 1600 cm−1 for OH, with a wide absorption band between 500 and 700 cm−1 corresponding to the Ti-O-Ti stretching vibration mode [28]. The weak band between 3300 cm−1 and 3600 cm−1 was attributed to the stretching and bending vibration of physically adsorbed water [29]. The external red spectrum of the black phosphorus nanosheets (BPN) indicates that the absorption peak in the range of 600–800 cm−1 corresponds to the P-P bond vibration mode in black phosphorus, the absorption peak in the range of 1200–1300 cm−1 corresponds to the P-H bond vibration mode in black phosphorus, and the region of 1600–1700 cm−1 corresponds to the C=C stretching vibration of black phosphorus. This is similar to the measurement obtained by Hu et al. [30]. The characteristic peaks of BPN and TDNA were retained in the BPN/TDNA nanocomposites’ FTIR spectra, demonstrating the effective combination of the two materials.
Raman spectroscopy (Figure 5) was used to provide information about material crystallinity, phase composition, and defect concentration. The Raman spectra of the TDNA showed the typical characteristics of the composite anatase phase peak at 142 cm−1 (Eg), 195 cm−1 (Eg), 395 cm−1 (B1g), 515 cm−1 (A1g), and 638 cm−1 (Eg), consistent with the XRD results. The 142 cm−1 and 195 cm−1 peaks in the TDNA Raman spectra belonged to the Ti-Ti vibrational mode, while the 395 cm−1, 515 cm−1, and 638 cm−1 peaks were attributed to the Ti-O vibrational mode [31,32].
The Raman spectra showed three typical vibration modes of BPN, namely the out-of-plane vibration mode of Ag1 at 364 cm−1, the in-plane vibration mode of B2g at 442 cm−1, and the in-plane vibration mode of Ag2 at 470 cm−1. These results were consistent with the measurements made by Xu et al. [33]. However, due to the much weaker peak of BPN compared to TDNA, it was difficult to display in the Raman spectra of BPN/TDNA.
Figure 6 shows the XPS electron spectrum of BPN/TDNA, and we can observe the four elements C, O, Ti, and P through Figure 6a. Figure 6b corresponds to the high-resolution energy spectrum of the C 1s of the composite material. We can divide it into three peaks 284.8 eV, 286.5 eV, and 288.5 eV which are C-C bonds, C-O-C bonds, and O=C-O bonds, respectively. Figure 6c corresponds to two peaks in the high-resolution energy spectrum of O 1s at 532.0 eV and 529.9 eV, respectively, which can be attributed to the Ti-OH and Ti-O-Ti bonds [34]. For the high-resolution energy spectrum of Ti 2p (Figure 6d), the peaks of 458 eV and 464 eV are assigned to the bonding of Ti4+ with oxygen relative to the 2p3/2 and 2p1/2 orbitals, respectively [35]. The main peak of P 2p in the XPS spectrum has a complex spectral line shape, mainly due to the interaction between phosphorus atoms and adjacent phosphorus atoms forming P-P bonds. There may be phosphorus-oxygen bonds (P-O) formed by black phosphorus and oxygen (O) near 131 eV (Figure 6e). Due to this electron sharing and overlap, the peak broadening and structural ambiguity make it difficult to resolve multiple clear peaks. Through XPS measurement, we can find that the two are tightly connected, laying the foundation for subsequent detection experiments.
As shown in Figure 7, TDNA show an absorption edge at 380 nm. Compared with TDNA, the maximum absorption peak of BPN/TDNA is increased, and the absorption edge of BPN and TDNA composite materials show an increased red shift in the visible light region. We can calculate the Eg value of the photocatalyst by plotting the relationship between (αhv)1/2 and photon energy hv, as shown in Figure 6 by projecting the linear components of the curve onto (αhv)1/2 = 0, with bandgap values of 3.2 eV for TDNA and 3.1 eV for BPN/TDNA, respectively [33]. The detection results of the TDNA are consistent with the work of other groups [36,37,38]. The results indicate that a composite material composed of BPN and TDNA can not only broaden the light absorption range, but also improve the light absorption performance. With the expansion of the spectral absorption range and the improvement of absorption performance, more electron–hole pairs are generated during the photodegradation of Cip.
We have performed a comparison of the PL spectra of TDNA and BPN/TDNA at an excitation wavelength of 290 nm, as depicted in Figure 8. It was found that the separation and recombination rates of the photo-induced conductive loads in BPN/TDNA were slightly faster than those observed for TDNA. Our PL analysis indicates that the coating of BPN on TDNA can effectively improve the absorption efficiency of excited photoelectrons.
Furthermore, electrochemical impedance spectroscopy (EIS) is used to characterize the interfacial charge transfer behavior of composite electrodes. Measured in a 0.1 mol phosphate solution, where a xenon lamp is paired with an AM 1.5 G filter to simulate natural light. This measurement was conducted at an open circuit potential of 10 mV, with a low frequency of 0.01 Hz and a high frequency of 100,000 Hz. The Nyquist plot of pure TDNA/FTO and BPN/TDNA/FDO composite materials obtained is shown in Figure 9a. The radius of the semicircle in the high-frequency region and the photoelectrode interface during the charge transfer process is known to be related to resistance, with smaller radii corresponding to lower resistance [39]. After circuit simulation by EIS, the simulated circuit impedances under illumination were 10,070 Ω and 4657 Ω, respectively. The arc radius of the BPN/TDNA/FTO composite electrode is significantly smaller than that observed for TDNA/FTO, indicating a lower resistance and a more effective separation of photo-induced electron–hole pairs. At the same time, the Bode Plot was also prepared to more clearly describe the relationship between frequency, phase shift, and amplitude, as shown in Figure 9b,c. At the same frequency, the impedance of the composite material decreases, indicating stronger photoelectron transmission efficiency. Through the Bode Plot, it can also be seen that BPN/TDNA/FTO is more stable than TDNA/FTO. These results suggest that the addition of BPN can significantly improve the transfer and separation efficiency of photo-generated electron–hole pairs in BPN/TDNA/FTO electrodes, thereby enhancing photocatalytic activity in a manner consistent with Wu et al. [40] and subsequent PEC performance measurements.
To assess the electrochemical double-layer capacitors (Cdl), we used Ag/AgCl as the reference electrode for cyclic voltammetry (CV), with the scanning rate of the electrode set at 20, 50, 100, 150, and 200 mV/s in the potential range of −0.12~0.04 V (Figure 10a,b). Cdl values were calculated by measuring the non-Faradaic current (I) and the scanning rate using cyclic voltammetry (CV), wherein the difference in charging current (∆I) is plotted based on the scanning speed. The variation of I = (Ia − Ic)/2 with scanning rate was shown in the Figure, with the linear slope (k) of the curve in Figure 10c equivalent to Cdl [41]. The Cdl estimates for TDNA/FTO and BPN/TDNA/FTO photoanodes were found to be 1.44 and 1.62 μF/cm2, respectively. The BPN/TDNA/FTO photoanode exhibited a higher Cdl value than the TDNA/FTO photoanode, indicating a larger Electrochemical Active Surface Area (ECSA) that may help enhance PEC performance.
To assess the separation efficiency of electron–hole pairs induced by semiconductor materials, we measured photocurrent density using linear scanning voltammetry (LSV) (Figure 11). The results showed that the TDNA/FTO photoanode exhibited a relatively low current response under natural light irradiation [42], whereas BPN/TDNA/FTO showed a significantly increased photocurrent density upon BPN addition.
The efficiency of separating photo-induced electron–hole pairs in semiconductor materials can be demonstrated by using a current density–time curve (I-T) [43]. Typically, the efficiency of separating photo-induced electron–hole pairs increases with the rise in photocurrent density, which can enhance photocatalytic activity. To investigate the photoelectrochemical (PEC) characteristics, a series of transient photocurrent responses of TDNA/FTO and BPN/TDNA/FTO composite materials were displayed in the 0.0 V current density–time curve. As illustrated in Figure 12, it can be observed that the photoelectrode comprising BPN/TDNA/FTO exhibits a higher photocurrent density when exposed to natural light compared to those made of TDNA/FTO. The separation efficiency of photo-induced electron–hole pairs and the recombination rate of photo-generated charge carriers in BPN/TDNA/FTO composite materials are higher, leading to faster electron transport and a prolonged lifespan of photo-generated charge carriers. This may be attributed to the loading of two-dimensional black phosphorus nanosheets.
Figure 13 was used to evaluate the stability of photoelectrochemical electrodes. The composite electrodes of TDNA/FTO and BPN/TDNA/FTO were subjected to 3 h I–T curve measurements to ascertain their stability, and it was observed that the electrodes before and after modification maintained good stability.
The photoelectrochemical responses of TDNA/FTO and BPN/TDNA/FTO were measured at a frequency of 10 kHz, and a Mott–Schottky curve was obtained (Figure 14) to analyze the changes in the semiconductor bandgap and photo-generated electron transport ability after modification, which are described using the flat band potential () and charge carrier density (). The measurements were conducted in the dark with a 0.1 mol/L phosphate solution as the carrier electrolyte. The and were estimated using the relationship (4-1) [44].
where q is the elementary charge (+e for the electron), ε is the relative dielectric constant of the semiconductor (TDNA, ε = 86), is the vacuum dielectric constant, A is the exposed geometric area of the photoelectrode, K is the Boltzmann constant, T is the absolute temperature, and is the capacitance of the space charge. was obtained by intercepting the potential axis. During the potential scanning in the cathode direction, it was observed that both TDNA/FTO and BPN/TDNA/FTO had a linear region with a positive slope, indicating that they are n-type semiconductors. However, the slope of the linear region of the BPN/TDNA/FTO photoelectrode was lower than that of the TDNA/FTO photoelectrode, indicating an increase in carrier density after the addition of BPN. The increase in conductivity in the photoelectrode also promoted the mobility of photo-generated electrons.
2.2. Optimization of Experimental Conditions
To achieve optimal performance of the constructed electrode during the detection process (Figure 15), some parameters such as pH, coating amount, and the optimal ratio of the BPN and TDNA were optimized to achieve the best experimental results. Multiple tests were conducted on the composite electrode under different pH conditions of 5, 6, 7, 8, and 9, respectively. Neutral pH was observed to yield a high photocurrent density, while acidic or alkaline buffer solutions hindered the photocurrent. TDNA/FTO (1 cm × 1 cm) was coated with 5 µL, 20 µL, 50 µL, 100 µL, and 150 µL of black phosphorus nanosheets NMP dispersion, and its photocurrent density was monitored at a voltage of 0.0 V. It was observed that the photocurrent density was strongest when coated with 20 µL. A lower coating amount led to a poor photocurrent effect, while a higher coating amount hindered photoelectron transmission. By changing the coating amount of BPN, the optimal ratio of BPN and TDNA was explored. Through multiple detections of the prepared photoelectrode, it was found that when coated with 20 µL of black phosphorus nanosheets NMP dispersion, the photoelectrode displayed a good photocurrent density.
2.3. Detection and Analysis of Cip
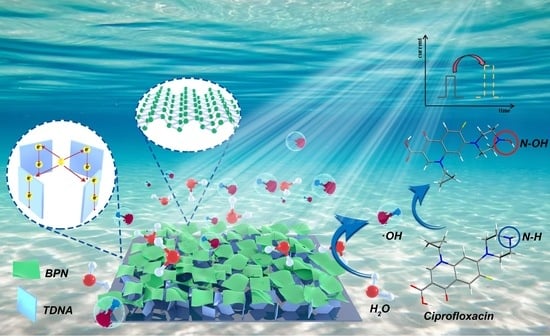
To achieve PEC electrodes with significant light response signals, we conducted photocurrent density measurements on TDNA/FTO and BPN/TDNA/FTO electrodes in a 0.1 M phosphate-buffered solution at pH 7 and 0.0 V voltage, without the presence of Cip. In Figure 16a, 2560 ng/L Cip was added to each electrode. During the photocatalytic detection process of Cip, holes can oxidize H2O molecules in the solution to hydroxyl radicals (·OH), which then oxidize Cip molecules adsorbed on the surface of BPN/TDNA electrodes [45,46]. The detection signal corresponds to the oxidation process of ciprofloxacin, where the –NH-CH2– group is oxidized by holes to the –N=CH– group [47]. This oxidation process hinders the recombination of photogenerated carriers with holes, facilitating rapid transfer and separation of photogenerated carriers, ultimately resulting in a significant enhancement of photocurrent density in the presence of Cip (Figure 17). In addition, to further confirm the presence of ·OH in the photoelectrochemical (PEC) process, electron paramagnetic resonance (EPR) technology was employed to detect the formation of ·OH by measuring the spin capture adduct of 5,5-dimethyl-1-pyrroline N-oxide (DMPO). As depicted in Figure 18, no signal of ·OH was detected under dark conditions. However, under visible light irradiation, a four-line spectrum with a relative intensity of 1:2:2:1 was observed, indicating the presence of ·OH species. These generated ·OH radicals are expected to play a crucial role in the oxidation of CFX molecules during the photoelectrochemical detection process [48]. The oxidation of Cip can be observed using TDNA/FTO and BPN/TDNA/FTO electrodes. By comparing these two electrodes under natural light irradiation, the advantages of the BPN/TDNA/FTO electrode become evident. It demonstrates that Cip can undergo photoelectrochemical oxidation effectively on BPN/TDNA/FTO under natural light irradiation. Furthermore, it highlights the excellent electrochemical performance of the BPN/TDNA/FTO electrode, enabling effective recognition and detection of the concentration of Cip with the assistance of natural light.
In addition, we also investigated the effect of different concentrations of Cip on the photocurrent density of BPN/TDNA/FTO. Cip reagents with concentrations of 0, 80, 320, 640, 1280, 2560, 5120, 10,240, 20,480, 30,720, 51,200, and 71,680 ng were added to a 70 mL phosphate solution. As the amount of Cip added increases, photocurrent density is more obvious (Figure 16b). To minimize interference, quantitative detection of Cip was performed in a phosphate solution at pH 7 and a voltage of 0.0 V. The quantitative detection results of the successfully prepared PEC electrode for Cip are shown in Figure 16c. Within the concentration range of 1.14–1024 ng/mL, a logarithmic fit of the concentration with the photocurrent density reveals two good linear relationships. The corresponding linear equations are y = 8.15 × 10⁻⁶ C/ng L−1 + 0.368 (R2 = 0.960 CCip: 1142.9–9142.9 ng L−1) and y = 6.75 × 10⁻⁷ C/ng L−1–0.467 (R2 = 0.955 CCip: 9142.9–438,857.1 ng L−1), where y represents the photocurrent density of Cip. The detection limit (S/N = 3) is 7.56 ng/mL. The true detection limit can reach 1.1ng/mL. Compared with the sensing materials reported in Table 1 and the detection techniques reported in Table 2, the proposed PEC electrode exhibits a lower detection limit and a wider Cip detection linear range.
2.4. Selectivity, Stability, and Reproducibility of BPN/TDNA Electrode for Cip
The selectivity of the PEC electrode was evaluated by comparing the PEC responses of representative interfering substances with a certain concentration of Cip, as shown in Figure 19a and Table 3. To monitor the selectivity of the electrode, the photoelectric performance of the electrode was measured in a blank phosphate-buffered solution, a ciprofloxacin (Cip) solution (2560 ng/L), and solutions containing bisphenol A (BPNA), p-benzoquinone (PBQ), Rhodamine B (RHB), 4-Hydroxybenzoic acid (PHB), and Streptomycin (SM) at concentrations 100 times higher than that of Cip. At the same time, 2560 ng/L of Moxifloxacin (MXF), Jimifloxacin (GEM), Norfloxacin (NOR), or Ofloxacin (OFX) were added to compare their photoelectric performance with the same amount of ciprofloxacin. By comparison, it can be observed that the prepared electrode exhibits the most prominent response in the ciprofloxacin solution. The photocurrent remains unchanged in the presence of other interfering substances compared to the blank solution. Therefore, the prepared PEC electrode demonstrates good selectivity.
Stability is a crucial factor in evaluating the performance of PEC sensing platforms. Figure 19b shows the repeated testing of the same PEC electrode in a Cip (2560 ng/L) phosphate solution by switching the light source. It can be observed that the modified electrode exhibits good stability. Additionally, the same electrode was tested every 1, 3, 5, 10, 15, and 20 days (Figure 19c), and the results further indicate satisfactory stability of the PEC electrode. Repeatability is also an important indicator for evaluating excellent electrodes. We prepared five identical electrodes in a Cip (2560 ng/L) solution using the same method for parallel experiments (Figure 19d), resulting in a relative standard deviation (RSD) of 2.27%. These results demonstrate the excellent repeatability of the prepared samples.
2.5. Actual Sample Testing
The feasibility of PEC electrodes for detecting the concentration of Cip in milk samples was demonstrated using conventional addition methods. Mengniu pure milk was used as the milk sample, and Table 4 presents the concentrations of analytes in several samples. The recovery rate ranged from 96.2% to 104.5%, with an RSD value below 4.7%, confirming the feasibility of this method. These research findings suggest that the developed electrode can be applied for environmental monitoring and is suitable for quantitative analysis of Cip.
3. Materials and Methods
3.1. Materials
All raw materials are analytically pure, and the solution water is ultrapure. Tetra butyl titanate (C16H36O4Ti, purity ≥ 99%), hydrochloric acid (HCl, AR), sulfuric acid (H2SO4, AR), sodium hydroxide (NaOH, purity ≥ 96%), ammonium hexafluorotitanate ((NH4)2TiF6, purity ≥ 99%), acetone (CH3COCH3, purity ≥ 99.5%), anhydrous N, N-methyl pyrrolidinone (NMP) (C₅H₉NO, purity ≥ 99.5%), black phosphorus (BP) (P, purity ≥ 99.9%), isopropanol ((CH3)2CHOH), purity ≥ 99.7%), anhydrous ethanol (CH3CH2OH, purity ≥ 99.7%), and conductive glass (FTO, 15 Ω) (30 mm × 10 mm × 2.2 mm).
3.2. Synthesis of BPN/TDNA/FTO Composites
3.2.1. Treatment of FTO
First we put FTO into deionized water for ultrasonic treatment for 20 min, then we put FTO into a mixed solution of hydrochloric acid and deionized water with a volume ratio of 1:1 for continuous ultrasonic cleaning for 15 min, then we put acetone, isopropanol, absolute ethanol, and deionized water in turn for continuous ultrasonic treatment for 20min, respectively, and finally we put it into an oven for drying at 60 °C. We took 60 mL of deionized water and 60 mL of HCl and mixed well. Then, 2.5 mL of tetra butyl titanate was slowly added with a 5 mL pipette and fully stirred, and 1 g of (NH4)2TiF6 powder was weighed and added into the mixed solution, fully stirred, and ultrasonically treated for 30 min. We placed 24 mL of the above solution into a 50 mL polytetrafluoroethylene autoclave liner. We used a multimeter to monitor and find out the conductive surface of the dried FTO. We put the conductive surface of the FTO downward and leant it against the Polytetrafluoroethylene (PTFE) at a suitable angle. The autoclave was finally tightened and placed in an oven at 170 °C for 12 h. We took out the FTO after the reaction kettle was cooled, and rinsed the impurities on the surface of FTO with deionized water. We then put the FTO with TiO2 side up in an oven at 80 °C for 6 h. It was then calcined in a muffle furnace at 550 °C for 2 h.
3.2.2. Preparation of BPN
BPN was prepared using the alkaline NMP solvent stripping method. Add 20 mg of bulk BPN to 20 mL of saturated NaOH/NMP. Under circulating water condensation conditions, use a cutting-edge ultrasound instrument to perform ultrasonic dispersion at a power output of 10 W for 4 h. Afterward, the dispersion was centrifuged at 2000 rpm for 20 min and we filtered the undissociated BPN twice to obtain the black phosphorus nanosheets NMP dispersion (0.2 mg/mL).
3.2.3. Preparation of BPN/TDNA/FTO Photoelectrode
Use a pipette gun to take 20 µL of the obtained black phosphorus nanosheets NMP dispersion (0.2 mg/mL) and coat it on the titanium dioxide nanoarray, then dry it in a 40 °C oven. Figure 20 shows the schematic diagram of BPN/TDNA/FTO photoelectrode preparation.
3.3. Apparatus
X-ray diffractometer (XRD) was recorded using Cu-Kα radiation on a Bruker D8 Advance X-ray polycrystalline diffractometer (D8-ADVANCE, Bruker, Karlsruhe, Germany). The morphology and structure of the as-prepared samples were investigated by transmission electron microscopy (TEM) (JEOL-JEM-2100F, JEOL, Tokyo, Japan) and scanning electron microscope (SEM) (JEOL-JSM-7800F, JEOL, Tokyo, Japan). The Fourier transform infrared spectra (FT-IR) of the materials were taken on a Nicolet Nexus 470 spectrometer (Thermo Fisher Scientific, Waltham, MA, USA). The UV-vis absorption spectra were recorded on a PE lambda 750 spectrophotometer (PerkinElmer, Waltham, MA, USA). Raman spectroscopy was conducted using a 632 nm laser excitation on a RAM HR 800 Raman spectrometer (HORIBA jobin Yvon, Paris, France). Photoluminescence (PL) spectroscopy was performed on the FLS 980 fluorescence spectrometer(Edinburgh Company, Livingston, UK) with an excitation wavelength of 290 nm.
3.4. Photoelectrochemical Measurements
With the help of a Bio-Logic VMP3 electrochemical workstation, all PEC performances were evaluated. We used a 300 W xenon lamp (PLS-SXE300, Beijing Bofeilai Technology Co., Ltd., Beijing, China) equipped with an AM 1.5 G filter as a simulated light source for sunlight, providing an intensity of 100 mW/cm2. In a three-electrode system, the generated photoelectrodes, platinum foil, and Ag/AgCl (saturated KCl) were used as working electrodes, counter electrodes, and reference electrodes, respectively. The reference electrode was an Ag/AgCl electrode in a Luggin capillary. For the PEC measurements in our work, a 0.1 M Phosphate buffer solution was chosen as the electrolyte. A photoanode surface with an area of 1 cm2 was immersed in an electrolyte solution, and the scanning rate of 10 mV/s was recorded using linear scanning voltammetry (LSV). The double-layer capacitance (Cdl) was measured using cyclic voltammetry (CV) at scanning rates of 20, 50, 100, 150, and 200 mV/s, with Ag/AgCl serving as the reference electrode. Measurements of the current density-time (I-T) curve were performed at a constant bias potential of 0.0 V. Electrochemical impedance spectroscopy (EIS) measurements were conducted under natural light in a 0.1 M phosphate-buffered solution at an open circuit potential with an amplitude of 10 mV and a frequency range of 100 kHz to 10 mHz. At a frequency of 10 kHz, Mott–Schottky (M–S) curves were fitted throughout a potential range of −0.8 V to 0.8 V.
4. Conclusions
Ultra-thin BPN with excellent stability and high concentration were successfully prepared using the TSC/NMP fluid extension method. Subsequently, a novel BPN/TDNA photoelectrode for Cip detection was constructed utilizing these ultra-thin BPN. In this study, a series of photochemical tests were conducted to investigate the photoelectric performance of the BPN/TDNA electrodes. The electrochemical results revealed that the incorporation of BPN significantly enhanced the photoelectric efficiency of TDNA. The presence of BPN in the BPN/TDNA electrode effectively improved the light absorption capability of the TDNA, while the two-dimensional characteristics of BPN facilitated efficient charge transfer in the TDNA. Moreover, due to the potential oxidation of Cip via photo-generated holes in the electrode, the BPN/TDNA exhibited a remarkable PEC response towards Cip. Consequently, the BPN/TDNA-based photoelectrode demonstrated a wide linear range and an impressive low detection limit of 7.56 ng/mL for Cip. Furthermore, it exhibited high recovery rates and low relative standard deviations in real sample detection, indicating its potential for future commercialization.
Author Contributions
J.Y.: Methodology, Validation, Formal analysis, Investigation, Writing—original draft. S.W. and Z.J.: Methodology, Formal analysis, Writing—supervision, review, and editing. J.W.: Resources. All authors have read and agreed to the published version of the manuscript.
Funding
The authors acknowledge that this research was supported by personal funds.
Data Availability Statement
The authors assure that the article contains the necessary data to substantiate the findings of this study.
Acknowledgments
The first author would like to thank Shanghai Electric Power University for providing funding for the master’s degree for Three-year Full-time postgraduates, especially for providing free laboratory instruments and other resources.
Conflicts of Interest
The authors declare no conflict of interest.
References
- Chen, B.; Han, J.; Wang, Y.; Sheng, C.; Liu, Y.; Zhang, G.; Yan, Y. Separation, enrichment and determination of ciprofloxacin using thermoseparating polymer aqueous two-phase system combined with high performance liquid chromatography in milk, egg, and shrimp samples. Food Chem. 2014, 148, 105–111. [Google Scholar] [CrossRef] [PubMed]
- Idowu, O.R.; Peggins, J.O. Simple, rapid determination of enrofloxacin and ciprofloxacin in bovine milk and plasma by high-performance liquid chromatography with fluorescence detection. J. Pharm. Biomed. Anal. 2004, 35, 143–153. [Google Scholar] [CrossRef]
- Bojer, C.; Schöbel, J.; Martin, T.; Ertl, M.; Schmalz, H.; Breu, J. Clinical wastewater treatment: Photochemical removal of an anionic antibiotic (ciprofloxacin) by mesostructured high aspect ratio ZnO nanotubes. Appl. Catal. B Environ. 2017, 204, 561–565. [Google Scholar] [CrossRef]
- Martin Santos, A.; Wong, A.; Araujo Almeida, A.; Fatibello-Filho, O. Simultaneous determination of paracetamol and ciprofloxacin in biological fluid samples using a glassy carbon electrode modified with graphene oxide and nickel oxide nanoparticles. Talanta 2017, 174, 610–618. [Google Scholar] [CrossRef] [PubMed]
- Li, H.; Li, B.; Zhang, Z.; Zhu, C.; Tian, Y.; Ye, J. Evolution of microbial communities during electrokinetic treatment of antibiotic-polluted soil. Ecotoxicol. Environ. Saf. 2018, 148, 842–850. [Google Scholar] [CrossRef]
- Qiao, M.; Ying, G.-G.; Singer, A.C.; Zhu, Y.-G. Review of antibiotic resistance in China and its environment. Environ. Int. 2018, 110, 160–172. [Google Scholar] [CrossRef]
- Ma, Z.; Wu, H.; Zhang, K.; Xu, X.; Wang, C.; Zhu, W.; Wu, W. Long-term low dissolved oxygen accelerates the removal of antibiotics and antibiotic resistance genes in swine wastewater treatment. Chem. Eng. J. 2018, 334, 630–637. [Google Scholar] [CrossRef]
- Alsager, O.A.; Alnajrani, M.N.; Alhazzaa, O. Decomposition of antibiotics by gamma irradiation: Kinetics, antimicrobial activity, and real application in food matrices. Chem. Eng. J. 2018, 338, 548–556. [Google Scholar] [CrossRef]
- Xu, X.; Liu, L.; Jia, Z.; Shu, Y. Determination of enrofloxacin and ciprofloxacin in foods of animal origin by capillary electrophoresis with field amplified sample stacking-sweeping technique. Food Chem. 2015, 176, 219–225. [Google Scholar] [CrossRef] [PubMed]
- Gayen, P.; Chaplin, B.P. Selective Electrochemical Detection of Ciprofloxacin with a Porous Nafion/Multiwalled Carbon Nanotube Composite Film Electrode. ACS Appl. Mater. Interfaces 2016, 8, 1615–1626. [Google Scholar] [CrossRef]
- Miao, Y.; Shao, M. Photoelectrocatalysis for high-value-added chemicals production. Chin. J. Catal. 2022, 43, 595–610. [Google Scholar] [CrossRef]
- Shi, L.; Yin, Y.; Zhang, L.-C.; Wang, S.; Sillanpää, M.; Sun, H. Design and engineering heterojunctions for the photoelectrochemical monitoring of environmental pollutants: A review. Appl. Catal. B Environ. 2019, 248, 405–422. [Google Scholar] [CrossRef]
- Li, S.; Wang, C.; Li, D.; Xing, Y.; Zhang, X.; Liu, Y. Bi4TaO8Cl/Bi heterojunction enables high-selectivity photothermal catalytic conversion of CO2-H2O flow to liquid alcohol. Chem. Eng. J. 2022, 435, 135133. [Google Scholar] [CrossRef]
- Zhou, Z.; Chen, J.; Wang, Q.; Jiang, X.; Shen, Y. Enhanced photoelectrochemical water splitting using a cobalt-sulfide-decorated BiVO4 photoanode. Chin. J. Catal. 2022, 43, 433–441. [Google Scholar] [CrossRef]
- Sun, M.; Zhu, Y.; Yan, K.; Zhang, J. Dual-mode visible light-induced aptasensing platforms for bleomycin detection based on CdS-In(2)S(3) heterojunction. Biosens. Bioelectron. 2019, 145, 111712. [Google Scholar] [CrossRef] [PubMed]
- Hu, S.; Yu, Y.; Guan, Y.; Li, Y.; Wang, B.; Zhu, M. Two-dimensional TiO2 (001) nanosheets as an effective photo-assisted recyclable sensor for the electrochemical detection of bisphenol A. Chin. Chem. Lett. 2020, 31, 2839–2842. [Google Scholar] [CrossRef]
- Wang, J.; Lu, C.; Chen, T.; Hu, L.; Du, Y.; Yao, Y.; Goh, M.C. Simply synthesized nitrogen-doped graphene quantum dot (NGQD)-modified electrode for the ultrasensitive photoelectrochemical detection of dopamine. Nanophotonics 2020, 9, 3831–3839. [Google Scholar] [CrossRef]
- Li, Z.; Zhang, H.; Zha, Q.; Zhai, C.; Li, W.; Zeng, L.; Zhu, M. Photo-electrochemical detection of dopamine in human urine and calf serum based on MIL-101 (Cr)/carbon black. Microchim. Acta 2020, 187, 526. [Google Scholar] [CrossRef] [PubMed]
- Wageh, S.; Al-Ghamdi, A.A.; Xu, Q. Core-Shell Au@NiS1+x Cocatalyst for Excellent TiO2 Photocatalytic H2 Production. Acta Phys.-Chim. Sin. 2022, 38, 1000–6818. [Google Scholar] [CrossRef]
- Xing, Y.; Wang, C.; Li, D.; Wang, R.; Liang, S.; Li, Y.; Liu, Y.; Zhang, X. Solution Plasma Processing Single-Atom Au1 on CeO2 Nanosheet for Low Temperature Photo-Enhanced Mars–van Krevelen CO Oxidation. Adv. Funct. Mater. 2022, 32, 2207694. [Google Scholar] [CrossRef]
- Gui, R.; Jin, H.; Wang, Z.; Li, J. Black phosphorus quantum dots: Synthesis, properties, functionalized modification and applications. Chem. Soc. Rev. 2018, 47, 6795–6823. [Google Scholar] [CrossRef]
- Wu, S.; Hui, K.S.; Hui, K.N. 2D Black Phosphorus: From Preparation to Applications for Electrochemical Energy Storage. Adv. Sci. 2018, 5, 1700491. [Google Scholar] [CrossRef] [PubMed]
- Khandelwal, A.; Mani, K.; Karigerasi, M.H.; Lahiri, I. Phosphorene—The two-dimensional black phosphorous: Properties, synthesis and applications (Review). Mater. Sci. Eng. B Solid-State Mater. Adv. Technol. 2017, 221, 17–34. [Google Scholar] [CrossRef]
- Chen, P.; Zhou, Y.; Dong, F. Advances in Regulation Strategies for Electronic Structure and Performance of Two-Dimensional Photocatalytic Materials. Acta Phys. Chim. Sin. 2020, 37, 2010010. [Google Scholar] [CrossRef]
- Batmunkh, M.; Shrestha, A.; Bat-Erdene, M.; Nine, M.J.; Shearer, C.J.; Gibson, C.T.; Slattery, A.D.; Tawfik, S.A.; Ford, M.J.; Dai, S.; et al. Electrocatalytic Activity of a 2D Phosphorene-Based Heteroelectrocatalyst for Photoelectrochemical Cells. Angew. Chem.-Int. 2018, 57, 2644–2647. [Google Scholar] [CrossRef]
- Tawfik, S.A.; Ali, S.; Fronzi, M.; Kianinia, M.; Tran, T.T.; Stampfl, C.; Aharonovich, I.; Toth, M.; Ford, M.J. First principles investigation of quantum emission from hBN defects. Condens. Matter 2017, 2, 13575–13582. [Google Scholar] [CrossRef] [PubMed]
- Borah, C.K.; Tyagi, P.K.; Kumar, S.; Patel, K. Few-layer p-type phosphorene sheet: An efficient transparent conducting electrode in silicon heterojunction solar cell. Comput. Mater. Sci. 2018, 151, 65–72. [Google Scholar] [CrossRef]
- Ma, J.; Tan, X.; Yu, T.; Li, X. Fabrication of g-C3N4/TiO2 hierarchical spheres with reactive {001} TiO2 crystal facets and its visible-light photocatalytic activity. Int. J. Hydrogen Energy 2016, 41, 3877–3887. [Google Scholar] [CrossRef]
- He, F.; Zhu, B.; Cheng, B.; Yu, J.; Ho, W.; Macyk, W. 2D/2D/0D TiO2/C3N4/Ti3C2 MXene composite S-scheme photocatalyst with enhanced CO2 reduction activity. Appl. Catal. B Environ. 2020, 272, 119006. [Google Scholar] [CrossRef]
- Cai, W.; Li, Z.; Liu, J.; Qiu, S.; Pan, Y.; Xu, Z.; Ma, C.; Hu, Y. Recyclable and removable functionalization based on Diels-Alder reaction of black phosphorous nanosheets and its dehydration carbonization in fire safety improvement of polymer composites. Compos. Part A Appl. Sci. Manuf. 2021, 140, 106157. [Google Scholar] [CrossRef]
- Reli, M.; Huo, P.; Šihor, M.; Ambrožová, N.; Troppová, I.; Matějová, L.; Lang, J.; Svoboda, L.; Kuśtrowski, P.; Ritz, M.; et al. Novel TiO2/C3N4 Photocatalysts for Photocatalytic Reduction of CO2 and for Photocatalytic Decomposition of N2O. J. Phys. Chem. A 2016, 120, 8564–8573. [Google Scholar] [CrossRef] [PubMed]
- Leong, K.H.; Liu, S.L.; Sim, L.C.; Saravanan, P.; Jang, M.; Ibrahim, S. Surface reconstruction of titania with g-C3N4 and Ag for promoting efficient electrons migration and enhanced visible light photocatalysis. Appl. Surf. Sci. 2015, 358, 370–376. [Google Scholar] [CrossRef]
- Xu, Y.; Wang, X.; Jin, M.; Kempa, K.; Shui, L. Water Splitting Performance Enhancement of the TiO2 Nanorod Array Electrode with Ultrathin Black Phosphorus Nanosheets. ChemElectroChem 2020, 7, 96–104. [Google Scholar] [CrossRef]
- Xue, C.; Zhang, T.; Ding, S.; Wei, J.; Yang, G. Anchoring Tailored Low-Index Faceted BiOBr Nanoplates onto TiO2 Nanorods to Enhance the Stability and Visible-Light-Driven Catalytic Activity(Article). ACS Appl. Mater. Interfaces 2017, 9, 16091–16102. [Google Scholar] [CrossRef]
- Koci, K.; Troppova, I.; Reli, M.; Matejova, L.; Edelmannova, M.; Drobna, H.; Dubnova, L.; Rokicinska, A.; Kustrowski, P.; Capek, L. Nd/TiO2 Anatase-Brookite Photocatalysts for Photocatalytic Decomposition of Methanol. Front. Chem. 2018, 6, 2296–2646. [Google Scholar] [CrossRef] [PubMed]
- Wu, Y.; Tao, L.; Zhao, J.; Yue, X.; Deng, W.; Li, Y.; Wang, C. TiO2/g-C3N4 nanosheets hybrid photocatalyst with enhanced photocatalytic activity under visible light irradiation. Res. Chem. Intermed. 2015, 42, 3609–3624. [Google Scholar] [CrossRef]
- Xu, Z.; Zhuang, C.; Zou, Z.; Wang, J.; Xu, X.; Peng, T. Enhanced photocatalytic activity by the construction of a TiO2/carbon nitride nanosheets heterostructure with high surface area via direct interfacial assembly. Nano Res. 2017, 10, 2193–2209. [Google Scholar] [CrossRef]
- Guo, Y.N.; Xu, G.F.; Guo, Y.; Tang, J. Relaxation dynamics of dysprosium(III) single molecule magnets. Dalton Trans. 2011, 40, 9953–9963. [Google Scholar] [CrossRef]
- Li, G.R.; Wang, F.; Jiang, Q.W.; Gao, X.P.; Shen, P.W. Carbon nanotubes with titanium nitride as a low-cost counter-electrode material for dye-sensitized solar cells. Angew. Chem. Int. Ed. Engl. 2010, 49, 3653–3656. [Google Scholar] [CrossRef] [PubMed]
- Wu, D.; Li, J.; Guan, J.; Liu, C.; Zhao, X.; Zhu, Z.; Ma, C.; Huo, P.; Li, C.; Yan, Y. Improved photoelectric performance via fabricated heterojunction g-C3N4/TiO2/HNTs loaded photocatalysts for photodegradation of ciprofloxacin. J. Ind. Eng. Chem. 2018, 64, 206–218. [Google Scholar] [CrossRef]
- Jiang, Z.; Jiang, D.; Yan, Z.; Liu, D.; Qian, K.; Xie, J. A new visible light active multifunctional ternary composite based on TiO2–In2O3 nanocrystals heterojunction decorated porous graphitic carbon nitride for photocatalytic treatment of hazardous pollutant and H2 evolution. Appl. Catal. B Environ. 2015, 170–171, 195–205. [Google Scholar] [CrossRef]
- Bhat, S.S.M.; Jun, S.E.; Lee, S.A.; Lee, T.H.; Jang, H.W. Influence of C3N4 Precursors on Photoelectrochemical Behavior of TiO2/C3N4 Photoanode for Solar Water Oxidation. Energies 2020, 13, 974. [Google Scholar] [CrossRef]
- Kong, M.; Li, Y.; Chen, X.; Tian, T.; Fang, P.; Zheng, F.; Zhao, X. Tuning the relative concentration ratio of bulk defects to surface defects in TiO2 nanocrystals leads to high photocatalytic efficiency. J. Am. Chem. Soc. 2011, 133, 16414–16417. [Google Scholar] [CrossRef] [PubMed]
- Ramírez-Ortega, D.; Meléndez, A.M.; Acevedo-Peña, P.; González, I.; Arroyo, R. Semiconducting properties of ZnO/TiO2 composites by electrochemical measurements and their relationship with photocatalytic activity. Electrochim. Acta 2014, 140, 541–549. [Google Scholar] [CrossRef]
- Zhang, C.; Li, Y.; Wang, C.; Zheng, X. Different inactivation behaviors and mechanisms of representative pathogens (Escherichia coli bacteria, human adenoviruses and Bacillus subtilis spores) in g-C3N4-based metal-free visible-light-enabled photocatalytic disinfection. Sci. Total Env. 2021, 755 Pt 1, 142588. [Google Scholar] [CrossRef]
- Zhang, C.; Li, Y.; Shuai, D.; Shen, Y.; Xiong, W.; Wang, L. Graphitic carbon nitride (g-C3N4)-based photocatalysts for water disinfection and microbial control: A review. Chemosphere 2019, 214, 462–479. [Google Scholar] [CrossRef]
- Kokulnathan, T.; Chen, S.M. Robust and selective electrochemical detection of antibiotic residues: The case of integrated lutetium vanadate/graphene sheets architectures. J. Hazard. Mater. 2020, 384, 121304. [Google Scholar] [CrossRef]
- He, Z.-L.; Yuan, C.; Gao, H.; Mou, Z.; Qian, S.; Zhai, C.; Lu, C. Significantly Enhanced Photoelectrocatalytic Alcohol Oxidation Performance of CdS Nanowire-Supported Pt via the “Bridge” Role of Nitrogen-Doped Graphene Quantum Dots. ACS Sustain. Chem. Eng. 2020, 8, 12331–12341. [Google Scholar] [CrossRef]
- Yan, P.; Xu, L.; Jiang, D.; Li, H.; Xia, J.; Zhang, Q.; Hua, M.; Li, H. Photoelectrochemical monitoring of ciprofloxacin based on metallic Bi self-doping BiOBr nanocomposites. Electrochim. Acta 2018, 259, 873–881. [Google Scholar] [CrossRef]
- Shan, J.; Li, R.; Yan, K.; Zhu, Y.; Zhang, J. In situ anodic stripping of Cd(II) from CdS quantum dots for electrochemical sensing of ciprofloxacin. Sens. Actuators B Chem. 2016, 237, 75–80. [Google Scholar] [CrossRef]
- Yuan, Y.; Zhang, F.; Wang, H.; Gao, L.; Wang, Z. A Sensor Based on Au Nanoparticles/Carbon Nitride/Graphene Composites for the Detection of Chloramphenicol and Ciprofloxacin. ECS J. Solid State Sci. Technol. 2018, 7, M201–M208. [Google Scholar] [CrossRef]
- You, F.; Wen, Z.; Yuan, R.; Ding, L.; Wei, J.; Qian, J.; Long, L.; Wang, K. Selective and ultrasensitive detection of ciprofloxacin in milk using a photoelectrochemical aptasensor based on Ti3C2/Bi4VO8Br/TiO2 nanocomposite. J. Electroanal. Chem. 2022, 914, 116285. [Google Scholar] [CrossRef]
- Tajik, S.; Beitollahi, H.; Zaeimbashi, R.; Sheikhshoaei, M.; Askari, M.B.; Salarizadeh, P. An electrochemical sensor based on V2O5 nanoparticles for the detection of ciprofloxacin. J. Mater. Sci. Mater. Electron. 2021, 32, 17558–17567. [Google Scholar] [CrossRef]
- Fotouhi, L.; Alahyari, M. Electrochemical behavior and analytical application of ciprofloxacin using a multi-walled nanotube composite film-glassy carbon electrode. Colloids Surf. B Biointerfaces 2010, 81, 110–114. [Google Scholar] [CrossRef]
- Ražná, K.; Hlavačková, L.; Bežo, M.; Žiarovská, J.; Habán, M.; Sluková, Z.; Pernišová, M. Application of the RAPD and miRNA markers in the genotyping of Silybum marianum (L.) Gaertn. Acta Fytotech. Et Zootech. 2015, 18, 83–89. [Google Scholar] [CrossRef]
- Ensafi, A.A.; Allafchian, A.R.; Mohammadzadeh, R. Characterization of MgFe2O4 Nanoparticles as a Novel Electrochemical Sensor: Application for the Voltammetric Determination of Ciprofloxacin. Anal. Sci. 2012, 28, 705–710. [Google Scholar] [CrossRef]
- DeWitte, B.; Dewulf, J.; Demeestere, K.; Vyvere, V.V.D.; Wispelaere, P.D.; Langenhove, H.V. Ozonation of Ciprofloxacin in Water: HRMS Identification of Reaction Products and Pathways. Environ. Sci. Technol. 2008, 42, 4889–4895. [Google Scholar] [CrossRef]
- Vílchez, J.L.; Araujo, L.; Prieto, A.; Navalón, A. Determination of ciprofloxacin and enoxacin in human serum samples by micellar liquid chromatography. Anal. Chim. Acta 2004, 516, 135–140. [Google Scholar] [CrossRef]
- Yuan, Z.; Duan, J.; Fan, S.; Kong, K. Comparison of an ELISA and a HPLC for Determination of Ciprofloxacin Residues in Pork. Food Agric. Immunol. 2010, 13, 199–204. [Google Scholar] [CrossRef]
- Rodríguez-Díaz, R.C.; Aguilar-Caballos, M.P.; Gómez-Hens, A. Simultaneous determination of ciprofloxacin and tetracycline in biological fluids based on dual-lanthanide sensitised luminescence using dry reagent chemical technology. Anal. Chim. Acta 2003, 494, 55–62. [Google Scholar] [CrossRef]
- Hu, X.; Wei, P.; Catanante, G.; Li, Z.; Marty, J.L.; Zhu, Z. Ultrasensitive ciprofloxacin assay based on the use of a fluorescently labeled aptamer and a nanocomposite prepared from carbon nanotubes and MoSe2. Microchim. Acta 2019, 186, 507. [Google Scholar] [CrossRef] [PubMed]
- Liu, B.; Huang, Y.; Zhu, X.; Hao, Y.; Ding, Y.; Wei, W.; Wang, Q.; Qu, P.; Xu, M. Smart lanthanide coordination polymer fluorescence probe for mercury(II) determination. Anal. Chim. Acta 2016, 912, 139–145. [Google Scholar] [CrossRef] [PubMed]
Figure 1.
SEM images of (a) TDNA, (b) BPN/TDNA; (c) EDS images of BPN/TDNA.

Figure 2.
(a) HRTEM images of BPN/TDNA and SAED mode of HR-TEM images; (b) Elemental mappings of BPN/TDNA.
Figure 2.
(a) HRTEM images of BPN/TDNA and SAED mode of HR-TEM images; (b) Elemental mappings of BPN/TDNA.

Figure 3.
XRD patterns of TDNA and BPN/TDNA samples.

Figure 4.
FTIR spectra of TDNA and BPN/TDNA samples.

Figure 5.
Raman spectra of BPN/TDNA and BPN/TDNA samples.

Figure 6.
XPS electron spectroscopy of BPN/TDNA; (a) Energy spectrum; (b) C 1s; (c) O 1s; (d) Ti 2p; and (e) P 2p.
Figure 6.
XPS electron spectroscopy of BPN/TDNA; (a) Energy spectrum; (b) C 1s; (c) O 1s; (d) Ti 2p; and (e) P 2p.

Figure 7.
(a) UV vis absorption spectra and (b) Tauc plots of TDNA and BPN/TDNA.

Figure 8.
PL spectra of TDNA and BPN/TDNA samples.

Figure 9.
Nyquist plots (a) and Bode plots (b,c) of TDNA/FTO and BPN/TDNA/FTO under illumination.

Figure 10.
CV curves were measured in a non-Faradaic region of −0.12−0.04 V at various scan rates for (a) TDNA, and (b) BPN/TDNA with a geometric area of 1 cm−2, respectively; (c) the charge current difference (∆I = Ia − Ic)/2 is plotted with the scanning rate of TDNA and BPN/TDNA, respectively. Ia and Ic are Anodic current and Cathodic current, respectively, and the linear slope is double-layer capacitance (Cdl).

Figure 11.
(a) LSV of different samples under short cut light irradiation; (b) LSV under dark and light irradiation.
Figure 11.
(a) LSV of different samples under short cut light irradiation; (b) LSV under dark and light irradiation.

Figure 12.
I-T at a bias potential of 0.0V (vs. RHE) of TDNA and BPN/TDNA.

Figure 13.
Stability test of TDNA and BPN/TDNA.

Figure 14.
Mott-Schottky curves of TDNA and BPN/TDNA.

Figure 15.
(a) Effect of PH on photocurrent response of BPN/TDNA; (b) Effect of coating amount on photocurrent response of BPN/TDNA.
Figure 15.
(a) Effect of PH on photocurrent response of BPN/TDNA; (b) Effect of coating amount on photocurrent response of BPN/TDNA.

Figure 16.
(a) Photocurrent response of TDNA/FTO and BPN/TDNA/FTO electrodes to 2560 ng/L Cip; (b) Photocurrent Response of BPN/TDNA/FTO electrodes Based on Different Cip Concentrations; (c) Corresponding linear curve.
Figure 16.
(a) Photocurrent response of TDNA/FTO and BPN/TDNA/FTO electrodes to 2560 ng/L Cip; (b) Photocurrent Response of BPN/TDNA/FTO electrodes Based on Different Cip Concentrations; (c) Corresponding linear curve.

Figure 17.
Schematic diagram of Ciprofloxacin detection.

Figure 18.
EPR Spectra of BPN/TDNA/FTO Composite for DMPO-·OH.

Figure 19.
(a) Photocurrent monitoring of different pollutants using BPN/TDNA/FTO electrodes; (b) Time photocurrent response of BPN/TDNA/FTO electrode; (c) 2560 ng/L Cip stability test based on BPN/TDNA/FTO electrode; (d) Photocurrent Response of Five Parallel BPN/TDNA/FTO electrodes to 2560 ng/L Cip.

Figure 20.
Schematic diagram of BPN/TDNA/FTO photoelectrode preparation.


Table 1.
Comparison of different electrode materials for Cip detection.
| Electrode | Methods | Linear Range (ng mL−1) | Detection Limit (ng mL−1) | Reference |
|---|---|---|---|---|
| BiPO4/BiOI | Photocurrent | 80–7440 | 8.3 | Zhao et al. (2019) [49] |
| CdS | Electrochemical | 33.14–3313.5 | 7.28 | Shan et al. (2016) [50] |
| g-C3N4/Ti3C2 | Amperometry | 0.133–331.34 | 0.043 | Yuan et al. (2020) [51] |
| Ti3C2/Bi4VO8Br/BPN | Photocurrent | 0.331–497.01 | 0.994 | You et al. (2022) [52] |
| V2O5/SPE | DPV | 13.254–120,939.1 | 3.313 | Tajik et al. (2021) [53] |
| MWCNT/GCE | Electrochemical | 13,253.6–331,340 | 19,880.4 | Fotouhi et al. (2010) [54] |
| DNA-based electrochemical biosensor | Electrochemical | 33.134–33,134 | 33.134 | Ražná et al. (2015) [55] |
| MgFe2O4-MWCNTs | Electrochemical | 33.134–331,340 | 3.313 | ENSAFI et al. (2012) [56] |
| BPN/TDNA | Photocurrent | 1.14–438.86 | 1.14 | This work |
Table 2.
Comparison of different detection methods for Cip detection.
| Methods | Linear Range (ng mL−1) | Detection Limit (ng mL−1) | Reference |
|---|---|---|---|
| High resolution mass spectrometry | 20–12,500 | 20 | Bavo et al. [57] |
| Micellar liquid chromatographic | 100–5000 | 24 | José et al. [58] |
| HPLC | 10–5120 | 10 | Yuan et al. [59] |
| ELISA | 0.32–5000 | 0.32 | Yuan et al. [59] |
| Luminescence | 30–2500 | 11 | Rodríguez-Díaz et al. [60] |
| Fluorescently labeled aptasensor | 0.63–800 | 0.63 | Hu et al. [61] |
| Fluorescence | 333–133,000 | 260 | Liu et al. [62] |
| Photocurrent | 1.14–438.86 | 1.14 | This work |
Table 3.
Interference of Different Disruptors on BPN/TDNA/FTO Photoelectrode.
| Disruptors | Observed Current (µA) | Interference Effect (%) | SD (n = 3) | RSD (%) (n = 3) | |||
|---|---|---|---|---|---|---|---|
| R1 | R2 | R3 | Average | ||||
| Blank | 0.397 | 0.398 | 0.395 | 0.367 | 0 | 0.002 | 0.504 |
| CIP | 0.591 | 0.594 | 0.597 | 0.594 | 100 | 0.003 | 0.505 |
| BPA | 0.447 | 0.449 | 0.448 | 0.448 | 35.683 | 0.001 | 0.223 |
| PBQ | 0.453 | 0.435 | 0.457 | 0.448 | 35.683 | 0.012 | 2.679 |
| RHB | 0.446 | 0.448 | 0.448 | 0.447 | 35.242 | 0.001 | 0.224 |
| BHA | 0.440 | 0.437 | 0.444 | 0.440 | 32.159 | 0.004 | 0.909 |
| SM | 0.473 | 0.468 | 0.463 | 0.468 | 44.493 | 0.005 | 1.068 |
| MXF | 0.499 | 0.484 | 0.476 | 0.486 | 52.423 | 0.012 | 2.469 |
| GEM | 0.516 | 0.494 | 0.485 | 0.498 | 57.709 | 0.016 | 3.213 |
| NOR | 0.550 | 0.495 | 0.486 | 0.510 | 62.996 | 0.035 | 6.863 |
| OFX | 0.492 | 0.480 | 0.472 | 0.481 | 50.220 | 0.010 | 2.079 |
Table 4.
Analysis of real samples with different concentrations of Cip.
| Samples | Add (ng mL−1) | Found (ng mL−1) | Recovery (%) | RSD (%) |
|---|---|---|---|---|
| Milk | 20 | 20.7 | 103.5 | 4.7 |
| 80 | 83.6 | 104.5 | 3.2 | |
| 150 | 144.3 | 96.2 | 4.3 | |
| 200 | 193.5 | 96.75 | 3.9 |
Disclaimer/Publisher’s Note: The statements, opinions and data contained in all publications are solely those of the individual author(s) and contributor(s) and not of MDPI and/or the editor(s). MDPI and/or the editor(s) disclaim responsibility for any injury to people or property resulting from any ideas, methods, instructions or products referred to in the content. |
© 2023 by the authors. Licensee MDPI, Basel, Switzerland. This article is an open access article distributed under the terms and conditions of the Creative Commons Attribution (CC BY) license (https://creativecommons.org/licenses/by/4.0/).
Share and Cite
MDPI and ACS Style
Yuan, J.; Wei, S.; Ji, Z.; Wang, J. Detection of Ciprofloxacin Based on BPN/TDNA Photoelectrode. Catalysts 2023, 13, 1368. https://doi.org/10.3390/catal13101368
AMA Style
Yuan J, Wei S, Ji Z, Wang J. Detection of Ciprofloxacin Based on BPN/TDNA Photoelectrode. Catalysts. 2023; 13(10):1368. https://doi.org/10.3390/catal13101368
Chicago/Turabian StyleYuan, Jiangnan, Shusheng Wei, Zhiheng Ji, and Juan Wang. 2023. "Detection of Ciprofloxacin Based on BPN/TDNA Photoelectrode" Catalysts 13, no. 10: 1368. https://doi.org/10.3390/catal13101368
Note that from the first issue of 2016, this journal uses article numbers instead of page numbers. See further details here.