Article

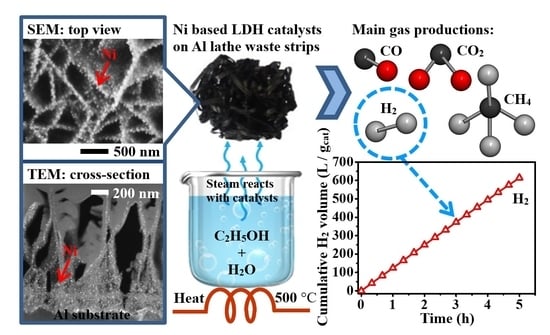
Electrodeposition of a Li-Al Layered Double Hydroxide (LDH) on a Ball-like Aluminum Lathe Waste Strips in Structured Catalytic Applications: Preparation and Characterization of Ni-Based LDH Catalysts for Hydrogen Evolution

1
Department of Materials Science and Engineering, National Chung Hsing University, 145 Xingda Rd., Taichung 40227, Taiwan
2
Innovation and Development Center of Sustainable Agriculture (IDCSA), National Chung Hsing University, 145 Xingda Rd., Taichung 40227, Taiwan
*
Author to whom correspondence should be addressed.
Catalysts 2022, 12(5), 520; https://doi.org/10.3390/catal12050520
Submission received: 10 March 2022 / Revised: 29 April 2022 / Accepted: 2 May 2022 / Published: 5 May 2022

Abstract

:
A functionally structured catalyst was explored for ethanol steam reforming (ESR) to generate H2. Aluminum lathe waste strips were employed as the structured catalytic framework. The mixed metal oxide (Li-Al-O) was formed on the surface of Al lathe waste strips through calcination of the Li-Al-CO3 layered double hydroxide (LDH), working as the support for the formation of Ni catalyst nanoparticles. NaOH and NaHCO3 titration solutions were, respectively, used for adjusting the pH of the NiCl2 aqueous solutions at 50 °C when developing the precursors of the Ni-based catalysts forming in-situ on the Li-Al-O oxide support. The Ni precursor on the Al structured framework was reduced in a H2 atmosphere at 500 °C for 3 h, changing the hydroxide precursor into Ni nanoparticles. The titration agent (NaOH or NaHCO3) effectively affected the physical and chemical characterizations of the catalyst obtained by the different titrations. The ESR reaction catalyzed by the structured catalysts at a relatively low temperature of 500 °C was studied. The catalyst using NaHCO3 titration presented good stability for generating H2 during ESR, achieving a high rate of H2 volume of about 122.9 L/(gcat·h). It also had a relatively low acidity on the surface of the Li-Al-O oxide support, leading to low activity for the dehydration of ethanol and high activity to H2 yield. The interactions of catalysts between the Ni precursors and the Li-Al-O oxide supports were discussed in the processes of the H2 reduction and the ESR reaction. Mechanisms of carbon formation during the ESR were proposed by the catalysts using NaOH and NaHCO3 titration agents.

Graphical Abstract

1. Introduction

Renewable energy is sought to replace fossil fuels, which have caused environmental pollution, such as through the emission of greenhouse gases. Hydrogen is a clean and renewable energy carrier that can be used as a feedstock in fuel cell systems [1,2] and transportation [3]. Clean techniques for producing hydrogen are being developed, including the electrolysis of water [4], the photocatalysis of water [5,6], metal hydrolysis [7], the use of biomass [8], hydrocarbon reforming [2,9,10], and others. In recent decades, ethanol steam reforming (ESR) for hydrogen production has attracted interesting investigation due to its environmental benefits. Ethanol is a renewable raw material that can be produced in the fermentation of biomass, including sugar cane, corns, and in starch-rich and lignocellulosic materials [2,11,12]. The production of hydrogen by ESR is not only environmentally friendly but also highly efficient, unlike steam reforming for producing other fuels [13,14].
The overall steam reforming reaction of ethanol is given by Equation (1) [1,2,13,14,15,16,17,18].
C2H5OH + 3H2O → 6H2 + 2CO2 (ΔH0 = + 173.5 kJ/mol)
However, several side reactions may occur during the ESR process, depending on the species of catalyst used [2,13,19]. Catalysts play a crucial role in the ESR process. In addition to increasing the reaction rate, they activate ethanol conversion and hydrogen selection [2,13,18,19]. The use of noble metal catalysts (such as Rh, Ru, Pt, Pd, and Ir) and non-noble metal catalysts (such as Ni, Co, Cu, and Fe) in the ESR process has frequently been studied [2,13,16,18,19]. Noble metal catalysts have a high cost, limiting their widespread use in industry. A Ni-based catalyst has a lower cost and is effective in breaking C-C bonds and O-H bonds, as well as in CH4 reforming [2,16,18,19,20,21]. Ni also favors the adsorption of hydrogen atoms on the catalyst surface to form molecular H2 [2]. Accordingly, a Ni-based catalyst is used herein. Catalyst support selection is closely associated with the activity and stability of the catalyst [2,14,18]. Al2O3, working as catalyst support, is widely used for a Ni-based catalyst in the ESR process, owing to its good mechanical properties and thermal stability under reaction conditions [18,21,22]. However, at the acidic sites on Al2O3, ethanol can be dehydrated to ethylene, according to Equation (2) [2,13,14,16,17,18,19,20,21]:
C2H5OH → C2H4 + H2O
Finally, the polymerization of ethylene (C2H4) forms coke, causing the gradual deactivation of the catalyst. Furthermore, ethylene can be decomposed into carbon species, as described by Equation (3) [22]:
nC2H4 → CnH2n + nH2 → nC + 2nH2
Some studies have found that basic additives or promoters, such as an alkali metal (such as Li, Na, and K) or an alkaline earth metal (such as Mg, Ca, and Sr) neutralize the acidic sites on Al2O3 [2,14,18]. Promoters favor H2O adsorption and OH mobility on the Al2O3 surface, simultaneously accelerating carbon oxidation and reducing the rate of coke formation [21]. However, promoters do not disperse easily in the Al2O3 crystal structure or on the Al2O3 surface. Calcination of hydrotalcites i.e., layered double hydroxides (LDHs), at a high temperature can yield mixed metal oxides (MMO) [23,24,25]. The metal oxides are candidates for providing the support of catalyst particles in ESR. Favorable characteristics, such as a large surface area, thermal stability, and high metal dispersion, favor the use of LDHs in the ESR process [23,24,26,27,28,29]. LDHs are large classes of layered anionic clays. They have positively charged layers with divalent or trivalent metal cations at the octahedral sites of the hydroxyl slabs. Anions and water molecules intercalate the interlayer spaces with charge compensation [30,31,32]. Under special conditions, monovalent metal cations such as Li+ occupy the vacancies in an aluminum octahedral sheet (Al(OH)3) to form a positively charged layer [30,31,32]. For instance, Li-Al LDHs have the chemical formula [LiAl2(OH)6]+A·mH2O, where A is an interlayered anion.
In this study, 500 °C-calcined Li-Al-CO3 LDH is used as a support in the ESR process. Li-Al-CO3 LDH after calcination at 500 °C may transform to Li-contained γ-Al2O3 [33,34]. Notably, Li+ ions that are well dispersed in the γ-Al2O3 structure neutralize the acidic sites on the γ-Al2O3 surface. Hence, in this study, calcining LDHs at 500 °C to form Li-Al mixed metal oxides is expected to resolve some issues, such as the difficulty of dispersing promoters in oxide supports. In conventional fixed-bed reactors, the catalyst used for ESR is commonly in the form of powder or a powder-pressed pellet. A small-scale reactor not only has limited catalytic space, but also can be blocked by a large volume of carbon deposits during ESR [35,36]. Catalyst pellets, during ESR in a long-term reaction, may have coking problems, and the difficulties of thermal, chemical, and mechanical stresses, therefore, causing their disintegration and functional failure [35]. Developing stable catalysts with low carbon deposition when used in ESR is a challenge. Recently, structured catalysts and reactors have attracted attention in the field of catalyst research owing to their rapid heat and mass transfer and lower pressure drop [36,37,38,39,40]. Classes of structured catalysts include monolithic catalysts, foam catalysts, membrane catalysts, and three-dimensional micro-fibrous entrapped catalysts (3D-MFEC) [36,37,38,39,40]. Among these, the framework of 3D-MFECs can be metallic or ceramic. A metal framework is better than a ceramic one because it has higher heat and mass transfer [39]. However, structured catalytic frameworks must be prepared precisely, and the process is complicated, resulting in a high cost. Therefore, a lower-cost and stable structured catalyst must urgently be developed. In this study, three-dimensional ball-like aluminum alloy lathe waste strips with a dense and disordered structure are used as a structured catalytic framework. Aluminum alloy lathe waste strips are not economically recycled in industry, because of the oxide, filth, and oil that adheres to their surfaces. Herein, the use of aluminum alloy lathe waste strips as a structured catalytic framework reduces not only the cost of the framework material but also the pollution of the environment by such wastes.
In this work, aqueous solutions that mainly contained Li+ and Al3+ ions were used for the formation of Li-Al-CO3 LDH thin film on Al lathe waste strips. An important discovery was that, following the electrochemical deposition, the LDH was calcined at 400 °C to increase the hydrophilicity, easily leading to the in-situ growth of Ni precursors on the calcined LDH platelets in NiCl2 aqueous solutions at 50 °C by using NaOH or NaHCO3 titration. The Ni precursors were activated in an H2 atmosphere at 500 °C for 3 h. The structured catalysts prepared using NaOH and NaHCO3 titration methods were tested in the ESR process at 500 °C. After the ESR reactions, H2 yields and the interactions of nickel loading with calcined LDH support of the catalysts on product selectivity were analyzed. In addition, catalytic stabilities, acidic and basic properties on the surface of the catalysts, and the mechanisms of carbon deposition in prepared samples were discussed in detail.

2. Results and Discussion

2.1. Electrodeposition and Calcination of Li-Al-CO3 LDH Thin Film/Characterization of Ni-Based Catalyst on Calcined LDH Support

Figure 1 plots the curve of current against electrolysis time during the deposition process. The initial current decayed rapidly, indicating the occurrence of the Li-Al-CO3 LDH deposition on the surfaces of the Al lathe waste strips. Subsequently, the current approached a plateau at about 2000 to 7200 sec, implying that the non-conducted Li-Al-CO3 LDH film had steadily grown as a function of time. The thin film that was formed using the electrochemical technique was examined using an X-ray diffractometer, as shown in Figure S1. Characteristic peaks of Li-Al-CO3 LDH (hydrotalcite) (JCPDS card no. 42-729) and the Al substrate were observed. The X-ray diffraction (XRD) pattern suggests that the electrodeposition method successfully deposits the Li-Al-CO3 LDH thin film on to the ball-like aluminum lathe waste strips. Wetting with water is an important procedure that can help the catalyst precursor to grow on the LDH platelets’ surface. Figure S2 presents the water contact angle on the surfaces of the Al substrate, Li-Al LDH film @ Al substrate (denoted as L@Al), and the L@Al samples after calcination at 100–500 °C. The calcined Li-Al LDH film @ Al substrate had a lower water contact angle than the original Al substrate and Li-Al LDH film @ Al substrate. In particular, the 400 °C-calcined Li-Al LDH film @ Al substrate had the lowest water contact angle (the highest wettability with water). Therefore, calcination at 400 °C was performed before the preparation of Ni precursor on the LDH @ Al substrate. Figure 2a presents the SEM surface morphology of the electrodeposited Li-Al LDH thin film on the Al lathe substrate. Figure 2b zooms in on part of Figure 2a. The SEM images show a typical nanoplate’s microstructure on the Al lathe substrate. Figure 2c shows the SEM image of the 400 °C-calcined Li-Al LDH thin film on Al lathe substrate. The SEM image demonstrates that calcination at 400 °C does not change the LDH surface microstructure.
Figure 3 shows the XRD patterns of Ni precursors (fresh catalysts) on the 400 °C-calcined LDH@Al substrates of the NaOH and NaHCO3 prepared samples (denoted as NaOH_T and NaHCO3_T). The two samples, NaOH and NaHCO3, yield the same diffraction peaks at 2θ of 11°, 22.2°, 34.8°, 36.5°, 46°, 61.2°, which are characteristic of α-type nickel hydroxide (Ni catalyst precursor; Ni(OH)2·xH2O; JCPDS card no. 38-715). Sample NaHCO3_T yielded weak and broad peaks of Ni(OH)2, while the sample NaOH_T yielded intensive peaks of Ni(OH)2. The results suggest that the Ni(OH)2 (Ni catalyst precursor) for sample NaHCO3_T probably had poor crystallinity with nano-size structure, while the Ni(OH)2 on NaOH_T had good crystallinity. The patterns of both samples also include diffraction peaks of the Al substrate. However, the calcined LDH phase was not observed in the patterns of either sample. In our previous study [25], calcining LDH at 300–400 °C formed an amorphous-like mixed metal oxide (MMO). Accordingly, intensive diffraction peaks of the calcined LDH phase were not present in the patterns of the NaOH_T and NaHCO3_T samples, owing to their amorphous-like structure.
As shown in Figure 4a,b for the SEM microstructures of NaOH_T (fresh catalyst) and NaOH_T + R (reduced catalyst), Figure 4a displays the SEM surface observation on NaOH_T. Figure 4b shows the SEM surface microstructure of the NaOH_T + R. A few nanoparticles are presented in the calcined LDH platelets. As shown in Figure 4c,d, Figure 4c displays the SEM surface microstructure of the NaHCO3_T, showing the cross-linked meshwork structures on platelets. Figure 4d presents the SEM surface microstructure of the sample NaHCO3_T + R after H2 reduction. Many nanoparticles are dispersed uniformly on the edges and platelets of the calcined LDH.

2.2. Use of the Structured Catalyst in Ethanol Steam Reforming (ESR) Reaction

Figure 5a plots the H2 yields as a function of time during ESR reactions. The H2 yield (YH2) can be expressed below:
YH2 = mole of H2 output/mole of ethanol input
The ESR reaction catalyzed by the NaOH_T + R or by the NaHCO3_T + R catalyst produced different H2 yields. The NaHCO3_T + R catalyst gave a stable H2 yield of about 55%, higher than that obtained using the NaOH_T + R catalyst. The H2 yield of NaOH_T + R catalyst decreased with time and rapidly dropped after 4.3 h. Figure 5b plots the cumulative volume of H2 produced per gram of the catalyst by using the NaOH_T + R or NaHCO3_T + R catalyst during the ESR reaction for 5 h. The cumulative volume of H2 produced by the NaHCO3_T + R catalyst increased linearly with time from the beginning to the end of the ESR reaction, indicating a constant rate of H2 generation. The cumulative volume of H2 was 614.5 L/gcat after 5 h of ESR. Restated, the cumulative volume of H2 per hour was about 122.9 L/(gcat·h). The cumulative volume of H2 that was obtained using NaOH_T + R catalyst was around 435.9 L/gcat, less than that produced by the NaHCO3_T + R catalyst. The cumulative volume of H2 per hour was about 87.2 L/(gcat·h). Figure 5c,d present the compositions of the gases that were produced using the NaOH_T + R and NaHCO3_T + R catalysts in ESR reactions for 5 h. The main gaseous productions were H2, CO2, CO, and CH4. As shown in Figure 5c, the H2 produced (Vol.%) by the NaOH_T + R catalyst generally fell with time, and rapidly dropped after 4.3 h. This result is consistent with the H2 yield in Figure 5a. As shown in Figure 5d, the gas productions (H2, CO2, CO, and CH4) had a stable output from the beginning to the end of the ESR reaction. Importantly, the gas production remained about 70 Vol.% of H2 until the reaction stopped. Frusteri et al., [41] reported that a doping with Li increased the stability of the Ni/MgO catalyst for ESR, mainly by reducing the sintering of the Ni catalyst particles. Herein, the NaHCO3_T + R catalyst with the LiAlO mixed metal support powerfully and stably activated ESR for H2 generation. However, with the NaOH_T + R catalyst, H2 production rapidly declined after 4.3 h; the possible reason will be discussed in the following section.
The ethanol conversions (XEtOH) and selectivity (S) of the productions after ESR reactions catalyzed by the NaOH_T + R and NaHCO3_T + R catalysts were calculated using Equations (5)–(7) and were provided in Table 1.
X EtOH   ( % ) = F ethanol ,   in F ethanol , out F ethanol , in
S H 2   ( % ) = F H 2   produced   3 × ( F ethanol , in F ethanol , out ) + ( F water , in F water , out ) × 100
S i   carbon - containing   product   ( % ) = F i   carbon - containing   product n i × ( F ethanol , in F ethanol ,   out ) × 100
where Fi, in/out is the molar flow rate of the i specie at the inlet/outlet of the reactor, respectively, and ni is the stoichiometric factor between the carbon-containing products and ethanol.
In the analyses of the selectivity of the production, the chemical reaction pathways associated with ESR can be presumed be reducible to the following individual reactions [1,2,13,14,15,16,17,18].
C2H5OH + H2O → CH4 + CO2 + 2H2
C2H5OH → CH4 + CO + H2
2C2H5OH → CH3COCH3 + CO + 3H2
2C2H5OH → (C2H5)2O + H2O
C2H5OH → CH3CHO + H2
CH3CHO → CH4 + CO
CH3CHO + H2O → 2CO + 3H2
CH4 + H2O → CO + 3H2
CO + H2O → CO2 + H2
Table 1 shows the ethanol conversions after ESR reactions, and that the NaOH_T + R catalyst had a higher conversion (~30.35%) than the NaHCO3_T + R catalyst (~21.94%). However, the H2 selectivity (~37.97 mol%) by the NaOH_T + R catalyst was lower than that of the H2 selectivity (~74.04 mol%) of the reaction catalyzed by NaHCO3_T + R. Owing to the low H2 selectivity, the application of the NaOH_T + R catalyst resulted in relatively low values of the selectivity of CO2, CO, and CH4, as shown in Table 1; they are 13.27 mol% of CO2, 11.59 mol% of CO, and 8.82 mol% of CH4, respectively. For comparison, the CO2 selectivity was high up to 30.84 mol% when the NaHCO3_T + R was employed, and this value was much higher than that of the CO2 selectivity of 13.27 mol% catalyzed by the NaOH_T + R. Fundamentally, the high selectivity to CO2 mainly represents that the ethanol steam reforming, as shown in Equation (8), and the water gas shift reaction, as shown in Equation (16) must proceed to produce CO2. That is, the ethanol steam reforming of Equation (8), and water gas shift reaction of Equation (16) were not so well catalyzed while using the sample NaOH_T + R as the catalyst. In addition, the fact that CO2 production exceeds CO production, especially when using the NaHCO3_T + R catalyst (see Table 1), suggests a strong water gas shift reaction, as shown in Equation (16). Moreover, the high acetaldehyde selectivity (~40% up) of the two samples were detected in the ESR residual solutions. It implies that the reduced catalysts in both samples had successfully activated the ethanol dehydrogenation to acetaldehyde, as seen in Equation (12). Moreover, CH4 can be easily produced in the ESR reaction process, as seen in Equations (8), (9) and (13). The methane steam reforming, as in Equation (15), was one of the main sub-reactions during ESR to consume CH4 and produce H2 (with one mole of CH4 producing three moles of H2). As shown in Table 1, the selectivity to CH4 by the NaOH_T + R catalyst was 8.82 mol%, while the selectivity to CH4 by the NaHCO3_T + R catalyst was only 5.80 mol%. Therefore, it suggests that the NaHCO3_T + R catalyst promoted the methane steam reforming, as seen in Equation (15), to consume more CH4 and to produce a larger amount of H2 than those in the case of the NaOH_T + R catalyst. Furthermore, the ethanol dehydrated to produce the non-desirable C2H4, as seen in Equation (2), and (C2H5)2O, as seen in Equation (11) was also detected in Table 1. The high C2H4 selectivity (~20.93 mol%) and (C2H5)2O selectivity (~7.40 mol%) were produced by the NaOH_T + R catalyst. When compared to the NaOH_T + R catalyst, the NaHCO3_T + R catalyst had less C2H4 selectivity (~11.01 mol%) and (C2H5)2O selectivity (~2.57 mol%). The polymerization of ethylene caused the deposition of carbon species on the catalyst’s surface, as described by Equation (3). Correspondingly, the NaOH_T + R catalyst had the higher carbon formation of 0.943 g/(gcat·h) than that catalyzed by the NaHCO3_T + R catalyst (~0.869 g/(gcat·h)). In summary of the above description, the NaHCO3_T + R catalyst, due to the relatively high selectivity to H2, the high selectivity of CO2, and the low selectivity of CH4, C2H4, and (C2H5)2O, it is explained that the NaHCO3_T + R catalyst exhibited better catalysis performance in the ESR reaction than the NaOH_T + R catalyst.

2.3. Ni-Based Catalysts on Calcined LDH Supports: Comparison between NaOH and NaHCO3 Titration in Preparation of the Catalysts

Figure 6 presents the FT-IR spectra of the samples NaOH_T and NaHCO3_T. The intense broadband at around 3425 cm−1 is consistent with the stretching vibration of hydroxyl groups that are hydrogen-boned to H2O [42,43,44,45,46,47]. A band near 1632 cm−1 is attributed to the H2O bending vibration [42,44,45,46,47]. The tiny absorption band at 2403 cm−1 is attributed to the CO2 adsorbed on the sample surface, because the prepared samples were grown in the atmosphere [44,45]. Another tiny band, at about 2125 cm−1, reflected the presence of intercalated C–O species in the precursors [47]. The narrow band at 1376 cm−1 is assigned to the asymmetric stretching vibration of CO32− [42,44,46,47]. A band around 847 cm−1 corresponded to an asymmetric stretching vibration of intercalated C–O species [44,46]. Two bands at about 612 cm−1 and 550 cm−1 are attributed to the in-plane deformations δOH, which are associated with the stretching vibration of Ni-OH [42,43,45,47]. Importantly, the FT-IR spectra revealed the vibrational bands of the OH group (~3425 cm−1) and the Ni-OH group (~612 cm−1), confirmed that the precursors of both samples were α-Ni(OH)2 [43].
Figure 7a,b present the SEM images and EDS compositional mappings of the samples NaOH_T and NaHCO3_T. Ni and O were dispersed uniformly in the maps, indicating that the deposited Ni(OH)2 were dispersed on the calcined LDH support. Figure 7c displays statistics concerning the Ni, Al, and O element contents of the samples NaOH_T and NaHCO3_T. The average Ni content in NaOH_T was more than double that in NaHCO3_T. The high Ni content in NaOH_T is also clearly evident in the FT-IR spectra (Figure 6), which exhibits a higher O-H vibration band (~3425 cm−1), H2O vibration band (1632 cm−1), and Ni-OH vibration bands (612 and 550 cm−1), than those of the sample NaHCO3_T.
The above results suggest that sample NaOH_T had twice as much Ni(OH)2·xH2O on the calcined LDH support as sample NaHCO3_T. Calcining Ni(OH)2·xH2O at 500 °C decomposed it to yield NiO [48,49]. The thermal decomposition reaction is as follows [48,49].
Ni(OH)2·xH2O(s) → Ni(OH)2(s) + xH2O(g)
Ni(OH)2(s) → NiO(s) + H2O(g)
where x is the amount of water in moles.
Equation (17) is the dehydration reaction of Ni(OH)2·xH2O, and Equation (18) is the decomposition of Ni(OH)2 to NiO. Therefore, in this study, four times as much water vapor was produced from the nickel precursor of sample NaOH_T in the reduction process with an H2 atmosphere at 500 °C than was produced from the nickel precursor of sample NaHCO3_T. However, previous studies have reported [50,51,52] that a reduction reaction experiment for NiO@Al2O3 powder was carried out under an atmosphere with H2 and water vapor, resulting in decreased amounts of the reduced Ni metallic particles. This is because, at high temperature, Al2O3 in the water vapor atmosphere easily forms aluminate, leading to the reduced nickel reacting with vicinal aluminate to form surface nickel aluminate (NiAl2O4) [50,51,52]. Zieliński claimed [52] that NiAl2O4 content depended on the concentration of water vapor in the environment. In particular, when NiO@Al2O3 powder was heated at 450 °C in a water vapor atmosphere in an H2 reduction process, nickel aluminate was produced quickly. Nonstoichiometric NiAl2O4 that decorates the corners and edges of nickel crystallites retards NiO reduction and weakens catalyst performance. Previous studies [33,34] found that calcining Li-Al LDH at 500 °C transforms the crystal mainly into γ-Al2O3. In this study, the precursor (Ni(OH)2·xH2O) on a calcined LDH (γ-Al2O3) support of the sample NaOH_T may possess an excessive concentration of water vapor (in comparison to NaHCO3_T) in the H2 reduction process, inhibiting the reduction of Ni(OH)2·xH2O to Ni particles. Hence, as shown in the SEM image of NaOH_T + R in Figure 4b, fewer Ni particles were found on the calcined LDH platelets than were found as shown in NaHCO3_T + R (Figure 4d). Figure 8 presents a TEM dark-field image of sample NaOH_T + R, and the inset presents the TEM diffraction pattern from the dark-field image in Figure 8. The diffraction pattern exhibits the characteristic Bragg reflections of NiO and Ni, suggesting that NiO and Ni crystallites were presented together on the NaOH_T + R catalyst. The NiAl2O4 may not demonstrate much infraction, leading to no evident diffraction pattern.
Figure 9 exhibits the Ni 2p3/2 XPS spectra of the reduced NaOH_T + R and NaHCO3_T + R catalysts. The binding energy of metallic Ni (Ni0) is around 852.5 eV, and the accompanying shake-up satellite peak is observed at about 861.5 eV [21,53,54]. A peak at around 855.3 eV, which is characteristic of Ni2+, is associated with NiO [53,54]. The NiO (Ni2+) peaks from both reduced catalysts were higher than that of metallic Ni (Ni0), perhaps because of the high oxygen affinity of nano-scale Ni particles [55]. Table 2 presents the surface compositions and quantitative elemental analyses of the reduced NaOH_T + R and NaHCO3_T + R catalysts, as determined by XPS. The NaHCO3_T + R catalyst had twice the Ni content (17.54 at.%) than that of NaOH_T + R catalyst (7.83 at.%). These results are consistent with the SEM images previously shown in Figure 4, and reveal that a relatively high amount of the reduced Ni particles were dispersed on NaHCO3_T + R.
Figure 10a presents the TEM cross-sectional microstructure of the NaHCO3_T + R catalyst; the image shows that Ni particles were dispersed uniformly on the platelet of the 500 °C-calcined LDH. Figure 10b shows the size distributions of the Ni particles on sample NaHCO3_T + R, as obtained from the TEM image. The mean particle size is 10.7 nm. For comparison, Figure 10c shows the size distributions of the Ni particles that were measured using the TEM image on sample NaOH_T + R. The mean particle size is 14.6 nm. Figure S3 displays the TEM images of the Ni particles of sample NaOH_T + R and NaHCO3_T + R. The above results suggest that the reduced Ni particles in sample NaHCO3_T + R were more dispersed, smaller, and more numerable than in sample NaOH_T + R. The result may explain that the NaHCO3_T + R catalyst for the ESR reaction resulted in a higher H2 yield than the ESR results for the reaction catalyzed by the NaOH_T + R catalyst (Figure 5).

2.4. Mechanism of Carbon (Coke) Formation in Ethanol Steam Reforming (ESR) Reaction

Figure 11 shows the SEM surface morphologies of the NaOH_T + R catalyst (Figure 11a) and NaHCO3_T + R catalyst (Figure 11b), respectively, after ESR for 5 h. As shown, carbon filaments (filamentous cokes) were observed in both catalysts after the ESR reaction. The inset SEM micrographs in high magnification are also presented in Figure 11a,b, clearly indicating the carbon filaments and the Ni particles that were lifted at the top of the filaments. The size of the filaments on sample NaOH_T + R (Figure 11a) is much larger than that of the filaments on sample NaHCO3_T + R (Figure 11b), As mentioned in Section 3.3, a higher Ni content on the NaHCO3_T + R catalyst revealed a higher catalytic activity than in the NaOH_T + R catalyst. It is reasonable to interpret that fine carbon fiber filaments formed on the NaHCO3_T + R catalyst (Figure 11b) due to the slower carbon growth rate. Inversely, the coarse carbon filaments formed on the NaOH_T + R catalyst due to a relatively high carbon growth rate. Figure 11c, taking the sample NaHCO3_T + R as an example, displays the EDS spectrum for analyzing the surface elemental compositions of the bright particle on the top of the woven carbon filament after the ESR for 5 h. As shown, a high-intensity peak of Ni was found. The result proves that the Ni particles were lifted from the supports of calcined LDH at the tops of the carbon filaments.
An active catalyst can also exhibit the condition of carbon deposition and carbon interaction with supports after the catalyst has worked. The mechanisms of carbon deposition on the surfaces of catalysts (NaOH_T + R and NaHCO3_T + R) and carbons interaction with Ni and calcined LDH supports during the ESR reactions are illustrated in Figure 12. The schematic models in Figure 12 (I)–(III) show this in atomic-scales, and Figure 12 (IV) shows this in nano-scale. Figure 12a (I) and 12b (I) are the schematic models of the crystal of the fresh catalysts (Ni precursors, NiOxHz) obtained, respectively, using the NaOH titration solution, as in Figure 12a (I), and the NaHCO3 titration solution, as in Figure 12b (I). As schematically shown, the fresh catalysts (NaOH_T and NaHCO3_T) were grown on the calcined LDH platelets. The precursor by NaOH titration, as in Figure 12a (I), has a much larger size than the precursor by NaHCO3 titration, as in Figure 12b (I). In Figure 3 in Section 2.1, X-ray diffraction results of the precursor of sample NaHCO3_T exhibited a much broader FWHM (full width at half maximum) (1.64°) than the FWHM (0.51°) of the strong peaks of the Ni(OH)2 by sample NaOH_T, suggesting that the titration of the NaHCO3 solution produced a much finer crystallite size of Ni(OH)2 precursor than those produced by NaOH titration, according to the fundamental concept of the Scherrer equation to estimate nano-crystallite size. More Ni(OH)2 precursors on the calcined LDH support in the NaOH_T catalyst suggest that the abundant water vapor would cause NiOxHz interaction with calcined LDH (γ-Al2O3) supports to form NiAl2O4 on the NiOxHz and NiO surface in the process of the H2 reduction. As a result, Ni particles were not fully reduced after the H2 reduction, as described in Section 2.3. Metallic Ni particles were reduced on the top of the surface of the support, and the dehydrated NiO particles, which were not reduced, were on the sub-surface near the support [56], as shown in Figure 12a (II). As compared with the NaOH_T catalyst, the fresh catalyst (NaHCO3_T) using the NaHCO3 titration method had fewer water molecules in the process of H2 reduction because of the fine crystallite size (Figure 3) of NiOxHz (Ni(OH)2) on the calcined LDH support, and the low content of the Ni element, as illustrated in Figure 7. Hence, the NaHCO3_T catalyst can fully contribute to the reduction of the metallic Ni within an H2 atmosphere, as shown in Figure 12b (II). Figure 12a (III) shows the formation of carbon on the surface of the NaOH_T + R catalyst during the ESR reaction at the initial work condition of the catalyst. The mixed nickel compounds (NiO) that favor the interaction with calcined LDH and are located in the sub-surface region near the support can form relatively large particles [56]. The schematic model displayed in Figure 12a (II) shows that the top of the layer is the Ni particles, and the second layer is the NiO particles. It is a possible that the aggregation of NiO particles blocked the path or reduced the number for the diffusion of carbons to the support. As as result, some of the carbons were formed in the sub-surface near the support, and the others were formed through the Ni particles in the layer of the surface of NiO particles, as shown in Figure 12a (III). Figure 12b (III) shows the carbon formation of the NaHCO3_T + R catalyst at the initial work condition during the ESR reaction. The carbons can easily diffuse through the smaller Ni clusters in the ESR reaction [35,57,58,59,60]. After the diffusion of the carbons, they interact with the calcined LDH support. The previous study [61,62] indicated that methane C–H bonds can be cleaved at the Lewis acid sites in γ-Al2O3. Thereafter, hydrogen is desorbed by proton-hydride recombination, and carbon remains on the surface of the support. Finally, the carbons were accumulated in the interface region between Ni clusters and the calcined LDH support, as shown in Figure 12b (III). Figure 12a,b (IV) show the schematic models of catalysts (NaOH_T + R and NaHCO3_T + R), respectively, in nano-scales at a longer period of the ESR reactions. Figure 12a (IV) presents the carbon deposition continuously and then the growths of filamentous carbon on the surface of the NaOH_T + R catalyst at a longer period of the ESR reactions. Previous studies [56,60] have indicated that NiOxHz (NiO) cluster particles are more stably bound on the γ-Al2O3 support. These cluster particles do not easily detach from the γ-Al2O3 support in the reaction process of the catalyst, owing to the low contact angle. Ultimately, the NiO and the mixed Ni cluster particles become buried by filamentous carbon, deactivating the catalyst. Figure 11a shows the SEM surface microstructure of the NaOH_T + R catalyst after the ESR reaction, and shows a few Ni particles on the tips of carbon filaments. The SEM image proves consistent with the model mechanism in Figure 12a. Figure 12b (IV) presents the carbons deposition and the growths of filamentous carbon on the surface of the NaHCO3_T + R catalyst at a longer period of the ESR reactions. This is because Ni particles have an obtuse contact angle with the calcined LDH (γ-Al2O3) support and the binding energy between them is low [56,60]. The Ni particles can easily detach from the surface of the calcined LDH support. Hence, as the carbon filaments grow from the surface of the calcined LDH support, the Ni particles rose to the tips of the carbon filaments rather than being buried or encapsulated in the filaments. The model mechanism corresponds to the SEM image in Figure 11b, in which many of the Ni particles are on the tips of the carbon filaments. Cunha et al., [63] claimed that using the filamentous carbon as a support material with the Ni catalyst in steam and dry reforming of methane can increase the stability of the Ni particle, preventing surface migration and coalescence. In this study, the formation of filamentous carbons may act as a substitute, such as the LDH support that provided Ni particles on the surface and continued to activate with ethanol steam for generating H2.
Figure 13a depicts the temperature-programmed desorption (TPD) profiles of NH3, which exhibits the information on the adsorption strength and density of acid sites on the surfaces of the NaOH_T + R and NaHCO3_T + R catalysts. The adsorption peak in the low-temperature range from 50 to 200 °C is attributed to weak Lewis acid sites [64,65,66]. The weak acidity is reported in the previous study and indicates no or low catalytic activity [64]. The adsorption peaks in the intermediate to high temperature range (200–600 °C) are assigned to moderate to strong Lewis acid sites [64,65,66]. As shown in Figure 13a, the NaOH_T + R catalyst presented a broad desorption peak at about 200–600 °C, with the maximum intensity located at 338 °C. The NaHCO3_T + R catalyst had three clear desorption peaks at about 298 °C, 386 °C, and 476 °C, respectively. The adsorption peak at 298 °C is probably attributed to the formation of NiAl2O4 species on the surface of the support (calcined LDH) [67,68]. The intensity of NH3 adsorption at 298 °C on the NaOH_T + R catalyst was 1.5 times higher than with the NaHCO3_T + R catalyst. Moreover, an asymmetric adsorption peak at about 430 °C on the NaOH_T + R catalyst may present the acid sites of NiO [69]. However, the NaHCO3_T + R catalyst does not find any adsorption peak at 430 °C. It implies that more NiAl2O4, rather than reduced NiO, formed on the surface of the NaOH_T + R catalyst. The intensity of the NH3-adsorption peak can be used to quantify the acidity on the surface of the catalyst. Therefore, the areas of TPD curve in the intermediate to high-temperature range (200–600 °C) for the NaOH_T + R and NaHCO3_T + R catalysts were, respectively, integrated. The sum of the integrated function of the NaOH_T + R catalyst had about 1.2 times higher than the NaHCO3_T + R catalyst. In other words, the acidity of the NaOH_T + R catalyst was higher than the NaHCO3_T + R catalyst. The result corresponds to the mechanism in Figure 12 and discussion in Section 2.3 that the NiAl2O4, and not reduced NiO on the NaOH_T + R catalyst, led to the increase of the density of the acid sites. In addition, Fang et al. [68] suggested that the highly dispersed Ni species can drop the acid sites because the nano Ni particles cover some acid sites on the surface of the catalyst. Hence, the NaHCO3_T + R catalyst had low acidity when compared to the NaOH_T + R catalyst. Herein, the superior NaHCO3_T + R catalyst was selected to perform the CO2-TPD experiment to understand the characterization of the Li-Al mixed oxide supported catalyst on the acidic and basic properties. Figure 13b shows the CO2-TPD profile of the NaHCO3_T + R catalyst, which shows the adsorption strength and density of base sites on the surface of the catalyst. For comparing the acidic and basic properties of the NaHCO3_T + R catalyst, the NH3-TPD curve as shown in Figure 13a was replotted in Figure 13b. For the CO2-TPD curve, the broad and weak adsorption peak in the low-temperature range from 100 to 200 °C is ascribed to low Brønsted basicity (i.e., surface OH- groups) [70,71,72]. There are two clear adsorption peaks around the intermediate to high-temperature range (200–600 °C), associated with moderate to strong Lewis basicity [70,71,72]. A peak at around 200–400 °C with the intermediate-strength Lewis basicity is attributed to the Li+-O2− and Al3+-O2− acid-base pairs [70,71,72]. Another strong peak at about 400–600 °C with strong Lewis basicity is related to the presence of low-coordinated O2− [70,71,72]. The peak areas of the NH3/CO2-TPD can be determined as the amounts of acid and base sites of different strengths [73]. Hence, the amounts of acid and base sites in Figure 13b were calculated by integrating the sums of NH3/CO2 in each desorption peak. The resulting value of the ratio of acid/base sites was 0.519. A previous study [69] described that the base strength distribution of the M-Al mixed oxide relies on the Mn+ metal cation (such as Li+) used for incorporation with Al3+ cation (Li+/Al3+). In our study, the Li+ promoter in the Al2O3 structure could effectively provide the Li+-O2− acid-base pairs. Particularly, the substitution of Al3+ by Li+ in the Al2O3 lattice could substantially increase the O2− on the surface of the catalyst [69]. It could also find that the CO2-TPD curve (Figure 13b) had a strong adsorption peak located at 400–600 °C. The result suggested that the Li+ promoter could effectively neutralize the acid sites in the Li-Al mixed oxide supported the NaHCO3_T + R catalyst, reducing the dehydration of ethanol in the ESR process. The acidic property of the catalyst favors activating the ethanol, and leads to the dehydration of ethanol, as described by Equation (2). The C2H4 gas is the main product. Figure 13c presents the volumes of the C2H4 production for the NaHCO3_T + R and NaOH_T + R catalysts during the ESR reactions, respectively. At the initial ESR reaction for 1 h, the NaHCO3_T + R catalyst had only 1 L of C2H4 production. The NaOH_T + R catalyst showed four times more C2H4 production than the NaHCO3_T + R catalyst. After the ESR reaction for 5 h, the NaHCO3_T + R catalyst showed about half of the volume of C2H4 production, as compared with the NaOH_T + R catalyst. Moreover, ethanol can also dehydrate to (C2H5)2O [74,75], as described by Equation (11). The volumes of (C2H5)2O production using the NaHCO3_T + R and NaOH_T + R catalysts during the ESR reactions are presented in Figure 13d. At the initial ESR reaction for 1 h, the NaHCO3_T + R catalyst had small volumes of (C2H5)2O (0.17 L), while the NaOH_T + R catalyst had 0.89 L of (C2H5)2O. The NaOH_T + R catalyst showed higher than five times the (C2H5)2O product when compared with the NaHCO3_T + R catalyst. After the ESR reaction for 5 h, about 0.72 L of (C2H5)2O was produced by the NaHCO3_T + R catalyst. The NaOH_T + R catalyst achieved nearly 2 L. The difference was about three times. The amounts of C2H4 and (C2H5)2O production were consistent with the NH3-TPD curves, suggesting that the lower acidity on NaHCO3_T + R catalyst had high H2 selectivity and less dehydration of ethanol to produce C2H4 and (C2H5)2O. Although the ethanol conversion of the NaOH_T + R catalyst was higher than the NaHCO3_T + R catalyst (Table 1), the high number of acid sites led to the activation of the dehydration of ethanol. As a result, the selectivity of the undesirable products, such as C2H4 and (C2H5)2O, increased, while H2 selectivity was reduced.

3. Materials and Methods

3.1. Preparation and Calcination of Li-Al LDH Thin Film

The lathe strips from a 6061 aluminum alloy (Al-1 wt.% Mg–0.6 wt.% Si) rod were collected (C. S. Aluminium Co., Kaohsiung, Taiwan). The Al lathe waste strips were kneaded into a ball-like form with a diameter of approximately 50 mm. Before electrochemical deposition of the LDH, the ball-like Al lathe waste strip ball was ultrasonically cleaned in acetone and ethyl alcohol baths to remove debris and residual oil, and then were dried in air. Reagent-grade LiOH·H2O was dissolved in deionized (DI) water at 50 °C, and highly pure Ar gas was purged through the LiOH aqueous solution (Choneye Pure Chemicals, Taipei, Taiwan). Small pieces of Al foil (~1 × 5 mm) were added to the stirred LiOH aqueous solution (0.06 M) at 50 °C for 30 min, and then the solution was filtered to obtain an electrolyte solution. The Li/Al molar ratio is 1:2. In the electrochemical deposition, the anode was a platinum-coated titanium mesh, and the cathode was the ball-like Al lathe waste strip ball. A DC voltage of 5V was applied between the platinum-coated titanium mesh and the Al lathe waste strip ball for 2 h using a Princeton Applied Research Model 273 A Potentiostat/Galvanostat. The preparation of the electrochemical experiment was described in detail in our earlier study [25]. After electrodeposition, the LDH-coated Al lathe waste strip ball was cleaned in DI water and dried in the ambient atmosphere. Subsequently, the Li-Al-CO3 LDH thin films were calcined in air at various temperatures from 100 °C to 500 °C for 1 h in order to find the optimum condition to increase the hydrophilicity of the calcined LDH surface. Water contact angles were measured on the LDH and calcined LDH thin film surfaces.

3.2. Preparation of Ni-Based Catalyst on Calcined LDH Thin Film

Reagent-grade NiCl2 (Shimakyu’s Pure Chemicals, Osaka, Japan), NaOH, and NaHCO3 (Choneye Pure Chemicals, Taipei, Taiwan) were used in the preparation of the catalysts. Ni catalysts were prepared using the following two methods: NaOH titration and NaHCO3 titration. Al lathe waste strip balls that were coated with 400 °C calcined LDH thin films were immersed in 0.15 M NiCl2 aqueous solutions at 50 °C. Then, the 1.25 M NaOH and 1.14 M NaHCO3 aqueous solutions were, respectively, titrated into two cups of 0.15 M NiCl2 aqueous solutions that both contained the Al lathe waste strip balls with the calcined LDHs. When the pH value of the 0.15 M NiCl2 aqueous solutions dropped to 6.7, the titrations of the NaOH and NaHCO3 solutions were stopped, and the Al lathe waste strip balls with the calcined LDHs were continuously immersed in the solutions for hours in order to form Ni precursors on the calcined LDH platelets’ surfaces. The Al lathe waste strip ball sample that was processed by titrating the NaOH solution was denoted as NaOH_T. The Al lathe waste strip ball sample that was processed by titrating the NaHCO3 solution was denoted as NaHCO3_T. The samples of NaOH_T and NaHCO3_T were then reduced in highly pure H2 gas (3 L/min) in a furnace at 500 °C for 3 h, and then furnace-cooled to room temperature. Upon H2 reduction, samples NaOH_T and NaHCO3_T became NaOH_T + R and NaHCO3_T + R, respectively. According to weight change measurements between an Al lathe waste strip ball that was coated with 400 °C calcined LDH thin film and the ball with a catalyst (NaOH_T + R or NaHCO3_T + R), there was about 55 mg of Ni catalyst in one Al lathe strip framework.

3.3. Tests of Catalysts in Ethanol Stream Reforming (ESR)

For each test of the ESR experiment, six pieces of ball-like Al lathe frameworks with catalysts (NaOH_T + R or NaHCO3_T + R) were packed together in a stainless steel tubular reactor for ESR (Chi Huw Heating Co., Ltd., Taiwan). The tubular reactor had a size of 60 mm in diameter and 450 mm in length. In the catalyzed ESR process, the catalysts were tested under atmospheric pressure. Water/ethanol mixture with a molar ratio of 7.5 was fed in, flowing at 10 mL/min, using a diaphragm pump (SIMDOS 02, KNF Neuberger, Switzerland) into the preheating chamber at 250 °C. Highly pure N2 gas was used as the carrier gas. The mixed solution was vaporized in this preheating chamber at 250 °C, and then the mixed steam (ethanol and water) was inputted into the catalyst reactor at 500 °C. The ESR reaction began in the catalyst reactor at 500 °C. During the ESR reaction, the exhaust gases from the catalyst reactor were cooled and dried, and the liquid productions were condensed in a cold trap. The gaseous and liquid productions were analyzed using a VARIO PLUS enhanced flue gas analyzer (MRU-VARIO PLUS, Germany) and gas chromatography-mass spectrometry (GC-MS; Agilent 7890CB, USA, and JEOL AccuTOF-GCX, Japan).

3.4. Characterization

The crystal structures of Li-Al-CO3 LDH thin film and fresh catalysts were examined using glancing angle X-ray diffraction (GAXRD; Bruker, Darmstadt, Germany), with an incidence angle of 0.5°, and a Bruker D8 Advance ECO diffractometer with Cu Kα (λ = 1.5406 Å) radiation at 40 kV and 25 mA. Fourier transform infrared (FT-IR) spectra of the fresh catalysts were obtained using a Perkin Elmer Spectrum 65 FT-IR spectrometer in the range 4000–400 cm−1, at a resolution of 4 cm−1 (Perkin Elmer, Norwalk, CT, USA). Surface microstructure images of the supports, catalysts, and catalysts after ESR were obtained by field-emission scanning electron microscopy (FE-SEM; JEOL JSM-6700F, Tokyo, Japan) in the secondary electron imaging mode, with an accelerating voltage of 3 kV and an emission current of 10 μA. Energy-dispersive X-ray spectra (EDS) were obtained using a JEOL JSM-6700F FE-SEM with an acceleration voltage of 15 kV to determine the elemental contents and their distributions of fresh catalysts and catalysts after the ESR reaction. The surface chemical compositions of reduced Ni catalysts were obtained by X-ray photoelectron spectroscopy (XPS; ULVAC-PHI 5000 VersaProbe/Scanning ESCA Microprobe, Kanagawa, Japan/USA) with monochromatic Al Kα radiation (1486.6 eV). The X-ray source operated at 15 kV (25 W). Before XPS analysis, a sputtering area of 2 × 2 mm2 was firstly pre-cleaned by sputtering at 2 kV with Ar ions for 0.3 min to remove surface-adsorbed molecules and contamination. A focused ion beam (FIB; Hitachi NX2000, Tokyo, Japan) was used to prepare a specimen for cross-sectional transmission electron microscopic (TEM) observation. The cross-sectional microstructure images and diffraction pattern of the reduced catalysts were obtained with a field-emission transmission electron microscope (FE-TEM; FEI EO Tecnai F20 G2 MAT S-TWIN Field Emission Gun, Hillsboro, OR, USA) at an accelerating voltage of 200 kV. Temperature programmed desorption (TPD) profiles of NH3 and CO2 of the reduced catalysts were obtained using a Quantachrome Autosorb iQ TPX instrument (Anton Paar, Graz, Austria). The mixed NH3/He or CO2/He gases flowed through the sample for 0.5 h at a room temperature of 25 °C. Subsequently, a steady flow of He gas was passed through the sample for 0.5 h to remove the weakly adsorbed NH3/CO2 on the surface. Finally, the sample was heated from 25–600 °C with a heating rate of 10 °C/min in an He-flowing atmosphere.

4. Conclusions

Recycled aluminum lathe waste strips were able to be a framework, used in structured catalysts for the ethanol steam reforming reaction. Li-Al-CO3 LDH (hydrotalcite) nanoplatelets were successfully electrodeposited on the surface of the Al lathe waste framework. The LDH nanoplatelets with an interplatelet space of about 400 nm could highly increase the specific surface area of the Al lathe waste strips. The LDH after calcination could raise the hydrophilicity of the surface, aiding the adsorption with the NiCl2 aqueous solution in the preparation of the catalyst. The Ni precursors were easily prepared by in situ growth in the NiCl2 aqueous solutions at 50 °C, with the NaOH and NaHCO3 titration solutions used to adjust the pH at 6.7, respectively. The Ni precursor using the NaOH or NaHCO3 titration method could form the same crystal of α-type nickel hydroxide (Ni(OH)2·xH2O). However, the amount of Ni precursor using the NaOH titration method was about two times higher than with the NaHCO3 titration method. This is because the Ni(OH)2·xH2O could dehydrate to NiO at 500 °C, simultaneously releasing the water vapor. The Ni precursor (Ni(OH)2·xH2O) on a calcined LDH (γ-Al2O3) support of the NaOH titrated sample may possess an excessive concentration of water vapor (in comparison to NaHCO3_T) in the H2 reduction process at 500 °C, inhibiting the reduction of Ni(OH)2·xH2O to Ni particles. Hence, the Ni particles were not fully reduced in the H2 reduction process. Nonstoichiometric NiAl2O4 that decorated the corners and edges of nickel crystallites retarded NiO reduction. NiO particles that were not reduced to Ni particles were likely formed in the sub-surface near the calcined LDH support. The result from the mechanism of carbon formation indicated that the mixed Ni cluster particles and NiO particles were buried by filamentous carbon during the ESR reaction. The Ni precursor of the NaHCO3 titrated sample obtained a fill reduction of metallic Ni particles due to the small amount of water vapor in the H2 reduction process. After the reduction in the H2 atmosphere at 500 °C, Ni particles could uniformly disperse on the edges and platelets of the calcined LDH support. Because the Ni particles had an obtuse contact angle (low binding energy) with the calcined LDH support, the Ni particles could easily detach from the surface of the support to rise on the tips of the carbon filaments during the ESR reaction. The formation of filamentous carbons may act as a substitute, such as the LDH support that provides Ni particles on the surface and continued to activate with ethanol steam in generating H2. The mean Ni particle size on the NaHCO3 titrated sample was 10.7 nm, which was smaller than the NaOH titrated sample (14.6 nm). Tests of catalytic activation of the NaHCO3 titrated sample in the ESR for 5 h showed a stable H2 yield of about 55 mol.%, and the rate of cumulative H2 volume achieved was about 122.9 L/(gcat·h). The main gas productions (H2, CO2, CO, and CH4) had a stable output from the beginning to the end of the ESR reaction. The dehydration of ethanol showed a low selectivity to C2H4 (11.01%) and (C2H5)2O (2.57%), and deposition of carbon species of about 0.869 (g/(gcat·h)), which was less than the NaOH titrated sample at 0.943 (g/(gcat·h)). Possibly, Li+ ions that existed in the mixed metal Li-Al-O oxide support neutralized the acid sites on the surface, decreasing Ni particle sintering. Conversely, the NiO particles with the NiAl2O4 wall on the surface of the NaOH titrated sample increased the number of acid sites. Although the ethanol conversion of the NaOH titrated sample (30.35%) was higher than the NaHCO3 titrated sample (21.94%), the high number of acid sites led to the activation of the dehydration of ethanol. The selectivity of the C2H4 (20.93%) and (C2H5)2O (7.40%) were higher than the NaHCO3 titrated sample. For the NaOH titrated sample, the H2 yield decreased with time, and the rate of the cumulative H2 volume was only about 87.2 L/(gcat·h).

Supplementary Materials

The following supporting information can be downloaded at: https://www.mdpi.com/article/10.3390/catal12050520/s1, Figure S1: XRD pattern of the Li-Al LDH thin film on Al (A6061) substrate by electrochemical deposition. Figure S2: Water contact angle on the Al substrate, Li-Al LDH thin film @ Al substrate (L@Al), and Li-Al LDH thin film @ Al substrate (L@Al) after calcination at various temperatures. Figure S3: TEM bright-field images showed the distributions of Ni particles on the calcined LDH supports for the samples: (a) NaOH_T + R and (b) NaHCO3_T + R.

Author Contributions

Conceptualization, J.-Y.U. and S.-H.H.; methodology, S.-H.H.; validation, J.-Y.U., S.-H.H., Y.-J.C. and W.-F.H.; formal analysis, S.-H.H.; investigation, S.-H.H.; resources, J.-Y.U.; data curation, S.-H.H.; writing—original draft preparation, S.-H.H.; writing—review and editing, S.-H.H.; visualization, J.-Y.U.; supervision, J.-Y.U.; project administration, S.-H.H.; funding acquisition, S.-H.H. All authors have read and agreed to the published version of the manuscript.

Funding

This study is financially supported by Ministry of Science and Technology, Taiwan (MOST 108-2221-E-005-034-MY3 and MOST 111-2923-E-194-002-MY3). The authors are grateful for their supports.

Data Availability Statement

The data that support the findings of this study are available on request from the corresponding author.

Conflicts of Interest

The authors declare no conflict to interest.

References

  1. Benito, M.; Sanz, J.L.; Isabel, R.; Padilla, R.; Arjona, R.; Daza, L. Bio-ethanol steam reforming: Insights on the mechanism for hydrogen production. J. Power Sources 2005, 151, 11–17. [Google Scholar] [CrossRef]
  2. Ni, M.; Leung, D.Y.C.; Leung, M.K.H. A review on reforming bio-ethanol for hydrogen production. Int. J. Hydrogen Energy 2007, 32, 3238–3247. [Google Scholar] [CrossRef]
  3. Chang, W.-R.; Hwang, J.-J.; Wu, W. Environmental impact and sustainability study on biofuels for transportation applications. Renew. Sustain. Energy Rev. 2017, 67, 277–288. [Google Scholar] [CrossRef]
  4. Lin, M.-Y.; Hourng, L.-W. Effects of magnetic field and pulse potential on hydrogen production via water electrolysis. Int. J. Energy Res. 2014, 38, 106–116. [Google Scholar] [CrossRef]
  5. Wang, X.; Maeda, K.; Thomas, A.; Takanabe, K.; Xin, G.; Carlsson, J.M.; Domen, K.; Antonietti, M. A metal-free polymeric photocatalyst for hydrogen production from water under visible light. Nat. Mater. 2009, 8, 76–80. [Google Scholar] [CrossRef]
  6. Sun, Y.; Jin, D.; Sun, Y.; Meng, X.; Gao, Y.; Dall’Agnese, Y.; Chen, G.; Wang, X.-F. G-C3N4/Ti3C2Tx (Mxenes) composite with oxidized surface groups for efficient photocatalytic hydrogen evolution. J. Mater. Chem. A 2018, 6, 9124–9131. [Google Scholar] [CrossRef]
  7. Lin, M.-C.; Uan, J.-Y.; Tsai, T.-C. Fabrication of AlLi and Al2Li3/Al4Li9 intermetallic compounds by molten salt electrolysis and their application for hydrogen generation from water. Int. J. Hydrogen Energy 2012, 37, 13731–13736. [Google Scholar] [CrossRef]
  8. Hosseini, S.E.; Abdul Wahid, M.; Jamil, M.M.; Azli, A.A.M.; Misbah, M.F. A review on biomass-based hydrogen production for renewable energy supply. Int. J. Energy Res. 2015, 39, 1597–1615. [Google Scholar] [CrossRef]
  9. Abd El-Hafiz, D.R.; Ebiad, M.A.; Elsalamony, R.A.; Mohamed, L.S. Highly stable nano Ce–La catalyst for hydrogen production from bio-ethanol. RSC Adv. 2015, 5, 4292–4303. [Google Scholar] [CrossRef]
  10. Chen, G.; Tao, J.; Liu, C.; Yan, B.; Li, W.; Li, X. Steam reforming of acetic acid using Ni/Al2O3 catalyst: Influence of crystalline phase of Al2O3 support. Int. J. Hydrogen Energy 2017, 42, 20729–20738. [Google Scholar] [CrossRef]
  11. Olsson, L.; Hahn-Hagerdal, B. Fermentation of lignocellulosic hydrolysates for ethanol production. Enzyme. Microb. Technol. 1996, 18, 312–331. [Google Scholar] [CrossRef]
  12. Huber, G.W.; Iborra, S.; Corma, A. Synthesis of transportation fuels from biomass:  chemistry, catalysts, and engineering. Chem. Rev. 2006, 106, 4044–4098. [Google Scholar] [CrossRef] [PubMed] [Green Version]
  13. Haryanto, A.; Fernando, S.; Murali, N.; Adhikari, S. Current status of hydrogen production techniques by steam reforming of ethanol:  A review. Energy Fuel 2005, 19, 2098–2106. [Google Scholar] [CrossRef]
  14. Phung, T.K.; Pham, T.L.M.; Nguyen, A.-N.T.; Vu, K.B.; Giang, H.N.; Nguyen, T.-A.; Huynh, T.C.; Pham, H.D. Effect of supports and promoters on the performance of Ni-based catalysts in ethanol steam reforming. Chem. Eng. Technol. 2020, 43, 672–688. [Google Scholar] [CrossRef]
  15. Comas, J.; Mariño, F.; Laborde, M.; Amadeo, N. Bio-ethanol steam reforming on Ni/Al2O3 catalyst. Chem. Eng. J. 2004, 98, 61–68. [Google Scholar] [CrossRef]
  16. Vaidya, P.D.; Rodrigues, A.E. Insight into steam reforming of ethanol to produce hydrogen for fuel cells. Chem. Eng. J. 2006, 117, 39–49. [Google Scholar] [CrossRef]
  17. Mattos, L.V.; Jacobs, G.; Davis, B.H.; Noronha, F.B. Production of hydrogen from ethanol: Review of reaction mechanism and catalyst deactivation. Chem. Rev. 2012, 112, 4094–4123. [Google Scholar] [CrossRef]
  18. Hou, T.; Zhang, S.; Chen, Y.; Wang, D.; Cai, W. Hydrogen production from ethanol reforming: Catalysts and reaction mechanism. Renew. Sustain. Energy Rev. 2015, 44, 132–148. [Google Scholar] [CrossRef]
  19. Contreras, J.L.; Salmones, J.; Colín-Luna, J.A.; Nuño, L.; Quintana, B.; Córdova, I.; Zeifert, B.; Tapia, C.; Fuentes, G.A. Catalysts for H2 production using the ethanol steam reforming (a review). Int. J. Hydrogen Energy 2014, 39, 18835–18853. [Google Scholar] [CrossRef]
  20. Zanchet, D.; Santos, J.B.O.; Damyanova, S.; Gallo, J.M.R.; Bueno, J.M.C. Toward understanding metal-catalyzed ethanol reforming. ACS Catal. 2015, 5, 3841–3863. [Google Scholar] [CrossRef]
  21. Sanchez-Sanchez, M.C.; Navarro, R.M.; Fierro, J.L.G. Ethanol steam reforming over Ni/MxOy-Al2O3 (M=Ce, La, Zr and Mg) catalysts: Influence of support on the hydrogen production. Int. J. Hydrogen Energy 2007, 32, 1462–1471. [Google Scholar] [CrossRef]
  22. Elias, K.F.M.; Lucrédio, A.F.; Assaf, E.M. Effect of CaO addition on acid properties of Ni–Ca/Al2O3 catalysts applied to ethanol steam reforming. Int. J. Hydrogen Energy 2013, 38, 4407–4417. [Google Scholar] [CrossRef]
  23. Huang, L.; Wang, J.; Gao, Y.; Qiao, Y.; Zheng, Q.; Guo, Z.; Zhao, Y.; O’Hare, D.; Wang, Q. Synthesis of LiAl2-layered double hydroxides for CO2 capture over a wide temperature range. J. Mater. Chem. A 2014, 2, 18454–18462. [Google Scholar] [CrossRef]
  24. Sikander, U.; Sufian, S.; Salam, M.A. A review of hydrotalcite based catalysts for hydrogen production systems. Int. J. Hydrogen Energy 2017, 42, 19851–19868. [Google Scholar] [CrossRef]
  25. Huang, S.-H.; Liu, S.-J.; Uan, J.-Y. Controllable luminescence of a Li–Al layered double hydroxide used as a sensor for reversible sensing of carbonate. J. Mater. Chem.C 2019, 7, 11191–11206. [Google Scholar] [CrossRef]
  26. Tichit, D.; Gérardin, C.; Durand, R.; Coq, B. Layered double hydroxides: Precursors for multifunctional catalysts. Top. Catal. 2006, 39, 89–96. [Google Scholar] [CrossRef]
  27. Feng, J.-T.; Lin, Y.-J.; Evans, D.G.; Duan, X.; Li, D.-Q. Enhanced metal dispersion and hydrodechlorination properties of a Ni/Al2O3 catalyst derived from layered double hydroxides. J. Catal. 2009, 266, 351–358. [Google Scholar] [CrossRef]
  28. Li, M.; Wang, X.; Li, S.; Wang, S.; Ma, X. Hydrogen production from ethanol steam reforming over nickel based catalyst derived from Ni/Mg/Al hydrotalcite-like compounds. Int. J. Hydrogen Energy 2010, 35, 6699–6708. [Google Scholar] [CrossRef]
  29. Vizcaíno, A.J.; Lindo, M.; Carrero, A.; Calles, J.A. Hydrogen production by steam reforming of ethanol using Ni catalysts based on ternary mixed oxides prepared by coprecipitation. Int. J. Hydrog. Energy 2012, 37, 1985–1992. [Google Scholar] [CrossRef]
  30. Serna, C.J.; Rendon, J.L.; Iglesias, J.E. Crystal-chemical study of layered [Al2Li(OH)6]+ x-· nH2O. Clays. Clay Miner. 1982, 30, 180–184. [Google Scholar] [CrossRef]
  31. Cavani, F.; Trifiro’, F.; Vaccari, A. Hydrotalcite-type anionic clays: Preparation, properties and applications. Catal. Today 1991, 11, 173–301. [Google Scholar] [CrossRef]
  32. Evans, D.G.; Slade, R.C.T. Structural aspects of layered double hydroxides. Struct. Bond. 2006, 119, 1–87. [Google Scholar]
  33. Hernandez, M.J.; Ulibarri, M.A.; Cornejo, J.; Pena, M.J.; Serna, C.J. Thermal stability of aluminium hydroxycarbonates with monovalent cations. Thermochim. Acta 1985, 94, 257–266. [Google Scholar] [CrossRef]
  34. Shumaker, J.L.; Crofcheck, C.; Tackett, S.A.; Santillan-Jimenez, E.; Crocker, M. Biodiesel production from soybean oil using calcined Li–Al layered double hydroxide catalysts. Catal. Lett. 2007, 115, 56–61. [Google Scholar] [CrossRef]
  35. Bartholomew, C.H. Mechanisms of catalyst deactivation. Appl. Catal. A Gen. 2001, 212, 17–60. [Google Scholar] [CrossRef]
  36. López, E.; Divins, N.J.; Anzola, A.; Schbib, S.; Borio, D.; Llorca, J. Ethanol steam reforming for hydrogen generation over structured catalysts. Int. J. Hydrogen Energy 2013, 38, 4418–4428. [Google Scholar] [CrossRef]
  37. Cybulski, A.; Moulijn, J.A. Structured Catalysts and Reactors; CRC Press: Boca Raton, FL, USA, 2005. [Google Scholar]
  38. Palma, V.; Ruocco, C.; Castaldo, F.; Ricca, A.; Boettge, D. Ethanol steam reforming over bimetallic coated ceramic foams: Effect of reactor configuration and catalytic support. Int. J. Hydrogen Energy 2015, 40, 12650–12662. [Google Scholar] [CrossRef]
  39. Santander, J.A.; Tonetto, G.M.; Pedernera, M.N.; López, E. Ni/CeO2–MgO catalysts supported on stainless steel plates for ethanol steam reforming. Int. J. Hydrogen Energy 2017, 42, 9482–9492. [Google Scholar] [CrossRef]
  40. Kapteijn, F.; Moulijn, J.A. Structured catalysts and reactors—Perspectives for demanding applications. Catal. Today 2020, 383, 5–14. [Google Scholar] [CrossRef]
  41. Frusteri, F.; Freni, S.; Chiodo, V.; Spadaro, L.; Di Blasi, O.; Bonura, G.; Cavallaro, S. Steam reforming of bio-ethanol on alkali-doped Ni/MgO catalysts: Hydrogen production for mc fuel cell. Appl. Catal. A Gen. 2004, 270, 1–7. [Google Scholar] [CrossRef]
  42. Oliva, P.; Leonardi, J.; Laurent, J.F.; Delmas, C.; Braconnier, J.J.; Figlarz, M.; Fievet, F.; de Guibert, A. Review of the structure and the electrochemistry of nickel hydroxides and oxy-hydroxides. J. Power Sources 1982, 8, 229–255. [Google Scholar] [CrossRef]
  43. Kamath, P.V.; Subbanna, G.N. Electroless nickel hydroxide: Synthesis and characterization. J. Appl. Electrochem. 1992, 22, 478–482. [Google Scholar] [CrossRef]
  44. Liu, X.-M.; Zhang, X.-G.; Fu, S.-Y. Preparation of urchinlike NiO nanostructures and their electrochemical capacitive behaviors. Mater. Res. Bull. 2006, 41, 620–627. [Google Scholar] [CrossRef]
  45. Duan, G.; Cai, W.; Luo, Y.; Sun, F. A hierarchically structured Ni(OH)2 monolayer hollow-sphere array and its tunable optical properties over a large region. Adv. Func. Mater. 2007, 17, 644–650. [Google Scholar] [CrossRef]
  46. Li, J.; Yan, R.; Xiao, B.; Liang, D.T.; Lee, D.H. Preparation of nano-NiO particles and evaluation of their catalytic activity in pyrolyzing biomass components. Energ. Fuel. 2008, 22, 16–23. [Google Scholar] [CrossRef]
  47. Zhu, Z.; Wei, N.; Liu, H.; He, Z. Microwave-assisted hydrothermal synthesis of Ni(OH)2 architectures and their in situ thermal convention to NiO. Adv. Powder Technol. 2011, 22, 422–426. [Google Scholar] [CrossRef]
  48. Song, Q.S.; Li, Y.Y.; Chan, S.L.I. Physical and electrochemical characteristics of nanostructured nickel hydroxide powder. J. Appl. Electrochem. 2005, 35, 157–162. [Google Scholar] [CrossRef]
  49. Shangguan, E.; Chang, Z.; Tang, H.; Yuan, X.-Z.; Wang, H. Synthesis and characterization of high-density non-spherical Ni(OH)2 cathode material for Ni–MH batteries. Int. J. Hydrogen Energy 2010, 35, 9716–9724. [Google Scholar] [CrossRef]
  50. Zieliński, J. The effect of water on the reduction of nickel/alumina catalysts. Catal. Lett. 1992, 12, 389–394. [Google Scholar] [CrossRef]
  51. Zieliński, J. Effect of alumina on the reduction of surface nickel oxide; morphology of the surfaces of the surfaces of Ni/Al2O3 catalysts. J. Mol. Catal. 1993, 83, 197–206. [Google Scholar] [CrossRef]
  52. Zieliński, J. Effect of water on the reduction of nickel-alumina catalysts catalyst characterization by temperature-programmed reduction. J. Chem. Soc. Faraday Trans. 1997, 93, 3577–3580. [Google Scholar] [CrossRef]
  53. Shalvoy, R.B.; Davis, B.H.; Reucroft, P.J. Studies of the metal–support interaction in coprecipitated nickel on alumina methanation catalysts using x-ray photoelectron spectroscopy (xps). Surf. Interface Anal. 1980, 2, 11–16. [Google Scholar] [CrossRef]
  54. Jr, L.S.; Makovsky, L.E.; Stencel, J.M.; Brown, F.R.; Hercules, D.M. Surface spectroscopic study of tungsten-alumina catalysts using x-ray photoelectron, ion scattering, and raman spectroscopies. J. Phys. Chem. 1981, 85, 3700–3707. [Google Scholar]
  55. Meng, F.; Li, X.; Li, M.; Cui, X.; Li, Z. Catalytic performance of CO methanation over La-promoted Ni/Al2O3 catalyst in a slurry-bed reactor. Chem. Eng. J. 2017, 313, 1548–1555. [Google Scholar] [CrossRef]
  56. Czekaj, I.; Loviat, F.; Raimondi, F.; Wambach, J.; Biollaz, S.; Wokaun, A. Characterization of surface processes at the Ni-based catalyst during the methanation of biomass-derived synthesis gas: X-ray photoelectron spectroscopy (XPS). Appl. Catal. A Gen. 2007, 329, 68–78. [Google Scholar] [CrossRef]
  57. Baker, R.T.K. Catalytic growth of carbon filaments. Carbon 1989, 27, 315–323. [Google Scholar] [CrossRef]
  58. Helveg, S.; Lo´ pez-Cartes, C.; Sehested, J.; Hansen, P.L.; Clausen, B.S.; Rostrup-Nielsen, J.R.; Abild-Pedersen, F.; Nørskov, J.K. Atomic-scale imaging of carbon nanofiber growth. Nature 2004, 427, 426–429. [Google Scholar] [CrossRef]
  59. Jeong, N.; Lee, J. Growth of filamentous carbon by decomposition of ethanol on nickel foam: Influence of synthesis conditions and catalytic nanoparticles on growth yield and mechanism. J. Catal. 2008, 260, 217–226. [Google Scholar] [CrossRef]
  60. Zhou, L.; Li, L.; Wei, N.; Li, J.; Takanabe, K.; Basset, J.-M. Effect of NiAl2O4 formation on Ni/Al2O3 stability during dry reforming of methane. ChemCatChem 2015, 7, 2508–2516. [Google Scholar] [CrossRef] [Green Version]
  61. Barbier, J. Deactivation of reforming catalysts by coking-a review. Appl. Catal. 1986, 23, 225–243. [Google Scholar] [CrossRef]
  62. Bitter, J.H.; Seshan, K.; Lercher, J.A. Deactivation and coke accumulation during CO2/CH4 reforming over pt catalysts. J. Catal. 1999, 183, 336–343. [Google Scholar] [CrossRef] [Green Version]
  63. Cunha, A.F.; Morales-Torres, S.; Pastrana-Martínez, L.M.; Martins, A.A.; Mata, T.M.; Caetano, N.S.; Loureiro, J.M. Syngas production by bi-reforming methane on an Ni–K-promoted catalyst using hydrotalcites and filamentous carbon as a support material. RSC Adv. 2020, 10, 21158–21173. [Google Scholar] [CrossRef]
  64. Berteau, P.; Delmon, B. Modified aluminas: Relationship between activity in 1-butanol dehydration and acidity measured by NH3 TPD. Catal. Today 1989, 5, 121–137. [Google Scholar] [CrossRef]
  65. Navarro, R.M.; Sanchez-Sanchez, M.C.; Fierro, J.L.G. Structure and activity of Pt-Ni catalysts supported on modified Al2O3 for ethanol steam reforming. J. Nanosci. Nanotechnol. 2015, 15, 6592–6603. [Google Scholar] [CrossRef]
  66. Yergaziyeva, G.Y.; Dossumov, K.; Mambetova, M.M.; Strizhak, P.Y.; Kurokawa, H.; Baizhomartov, B. Effect of Ni, La, and Ce oxides on a Cu/Al2O3 catalyst with low copper loading for ethanol non-oxidative dehydrogenation. Chem. Eng. Technol. 2021, 44, 1890–1899. [Google Scholar] [CrossRef]
  67. Zheng, S.; Liu, B.S.; Wang, W.S.; Wang, F.; Zhang, Z.F. Mesoporous and macroporous alumina-supported nickel adsorbents for adsorptive desulphurization of commercial diesel. Adsorp. Sci. Technol. 2015, 33, 337–353. [Google Scholar] [CrossRef]
  68. Fang, X.; Zhang, R.; Wang, Y.; Yang, M.; Guo, Y.; Wang, M.; Zhang, J.; Xu, J.; Xu, X.; Wang, X. Plasma assisted preparation of highly active NiAl2O4 catalysts for propane steam reforming. Int. J. Hydrogen Energy 2021, 46, 24931–24941. [Google Scholar] [CrossRef]
  69. Nivangune, N.; Kelkar, A. Selective synthesis of dimethyl carbonate via transesterification of propylene carbonate with methanol catalyzed by bifunctional Li-Al nano-composite. ChemistrySelect 2019, 4, 8574–8583. [Google Scholar] [CrossRef]
  70. Di Cosimo, J.I.; Diez, V.K.; Xu, M.; Iglesia, E.; Apesteguia, C.R. Structure and surface and catalytic properties of Mg-Al basic oxides. J. Catal. 1998, 178, 499–510. [Google Scholar] [CrossRef] [Green Version]
  71. Coleman, L.J.I.; Epling, W.; Hudgins, R.R.; Croiset, E. Ni/Mg–Al mixed oxide catalyst for the steam reforming of ethanol. Appl. Catal. A Gen. 2009, 363, 52–63. [Google Scholar] [CrossRef]
  72. Pavel, O.D.; Tichit, D.; Marcu, I.-C. Acido-basic and catalytic properties of transition-metal containing Mg–Al hydrotalcites and their corresponding mixed oxides. Appl. Clay Sci. 2012, 61, 52–58. [Google Scholar] [CrossRef]
  73. Antoniak-Jurak, K.; Kowalik, P.; Michalska, K.; Próchniak, W.; Bicki, R. Zn-Al mixed oxides decorated with potassium as catalysts for HT-WGS: Preparation and properties. Catalysts 2020, 10, 1094. [Google Scholar] [CrossRef]
  74. Marino, F.J.; Cerrella, E.G.; Duhalde, S.; Jobbagy, M.; Laborde, M.A. Hydrogen from steam reforming of ethanol. Characterization and performance of copper-nickel supported catalysts. Int. J. Hydrog. Energy 1998, 23, 1095–1101. [Google Scholar] [CrossRef]
  75. Marino, F.; Boveri, M.; Baronetti, G.; Laborde, M. Hydrogen production from steam reforming of bioethanol using Cu/Ni/K/γ-Al2O3 catalysts. Effect of Ni. Int. J. Hydrogen Energy 2001, 26, 665–668. [Google Scholar] [CrossRef]
Figure 1. Current versus time curve during the electrochemical deposition of Li-Al-CO3 LDH thin film in the Li+/Al3+ aqueous solution at a constant potential. A DC voltage of 5 V was applied in the electrochemical cell for 2 h at room temperature.
Catalysts 12 00520 g001
Figure 2. SEM surface morphologies: (a) Li-Al-CO3 LDH thin film on Al substrate (A6061 lathe waste strip) and its high-magnification image in (b); (c) Li-Al-CO3 LDH thin film calcined at 400 °C for 1 h.
Catalysts 12 00520 g002
Figure 3. XRD patterns of Ni precursors (fresh catalysts) on the 400 °C calcined LDH@Al substrates for the sample NaOH_T (bottom pattern) and NaHCO3_T (top pattern), respectively.
Catalysts 12 00520 g003
Figure 4. SEM surface morphologies: (a) NaOH_T fresh catalyst; (b) NaOH_T + R reduced catalyst; (c) NaHCO3_T fresh catalyst; (d) NaHCO3_T + R reduced catalyst.
Catalysts 12 00520 g004
Figure 5. (a) H2 yields and (b) cumulative H2 volumes of the NaOH_T + R and NaHCO3_T +R catalysts in the ESR reactions; Volume percentages of product gas composition of the NaOH_T + R catalyst (c) and NaHCO3_T + R catalyst (d) in the ESR reactions.
Catalysts 12 00520 g005
Figure 6. FT-IR spectra of Ni precursors (fresh catalysts) on the 400 °C-calcined LDH platelets of the samples NaOH_T and NaHCO3_T.
Catalysts 12 00520 g006
Figure 7. SEM surface morphologies of the sample NaOH_T and NaHCO3_T with compositional maps for Ni, Al, and O are shown in (a,b), respectively; (c) EDS analyses of the elemental compositions and contents of the samples NaOH_T and NaHCO3_T.
Catalysts 12 00520 g007
Figure 8. Dark-field image of the TEM cross-sectional microstructure of the NaOH_T + R catalyst. The inset shows the diffraction pattern of the bright particles from the TEM image.
Catalysts 12 00520 g008
Figure 9. Ni 2p3/2 XPS spectra of the reduced NaOH_T + R and NaHCO3_T + R catalysts.
Catalysts 12 00520 g009
Figure 10. (a) TEM cross-sectional microstructure of the NaHCO3_T + R catalyst; Particle size distributions of the NaHCO3_T + R catalyst (b) and NaOH_T + R catalyst (c). The particle size distributions in (b,c) were collected from the TEM images in Figure S3.
Catalysts 12 00520 g010
Figure 11. SEM surface morphologies of the catalysts after ESR reactions for 5 h: (a) NaOH_T + R catalyst; (b) NaHCO3_T + R catalyst; (c) EDS spectrum presented as the high Ni contents were detected at bright particles on the tips of filamentous carbons in the SEM images (a,b).
Catalysts 12 00520 g011
Figure 12. Schematic mechanisms illustrate the processes of carbon formation on the surfaces of the catalysts (Ni on calcined LDH) in the ESR reactions: (a) NaOH titrated catalysts and (b) NaHCO3 titrated catalysts. The preparations of the catalysts and in the ESR reactions present in (I)–(IV): (I) Fresh catalysts; (II) Reduced catalysts; (III) Initial states of catalysts in the ESR reactions; (IV) NaOH titrated catalyst shows the formation of filamentous carbons burying gradually on the Ni and NiO particles; NaHCO3 titrated catalyst shows that the Ni particles raise on the tips of the filamentous carbons. Note: The illustrations in (I)–(III) show processes in atomic scales, and (IV) shows in nanoscale.
Catalysts 12 00520 g012
Figure 13. (a) NH3-TPD profiles of the NaOH_T + R and NaHCO3_T + R catalysts; (b) NH3/CO2-TPD profiles of the NaHCO3_T + R catalyst; Gas volumes of the production of the NaOH_T + R and NaHCO3_T + R catalysts at the initial and end states in the ESR reactions: (c) C2H4; (d) (C2H5)2O.
Catalysts 12 00520 g013
Table 1. Activations of the NaOH_T + R and NaHCO3_T + R catalysts in the ESR reactions for 5 h: the averages of the ethanol conversion, selectivity of the production, and deposition weight of carbon species.
CatalystConversion (%), Selectivity (mol%) and Deposition of Carbon Species (g/(gcat·h))
XEtOHH2CO2COCH4C2H4(C2H5)2OCH3CHOCH3COCH3C
NaOH_T + R30.3537.9713.2711.598.8220.937.4040.581.140.943
NaHCO3_T + R21.9474.0430.8413.915.8011.012.5743.210.770.869
Table 2. The quantitative elements and surface compositions of the reduced NaOH_T + R and NaHCO3_T + R catalysts on the 500 °C calcined LDH thin films by XPS analysis.
ElementNaOH_T + R
(at.%)
NaHCO3_T + R
(at.%)
Ni7.8317.54
Al10.1613.73
O82.0168.74
Publisher’s Note: MDPI stays neutral with regard to jurisdictional claims in published maps and institutional affiliations.

